Extent and causes of international variations in drug usage A report for the Secretary of State for Health by Professor Sir Mike Richards CBE July 2010

Welcome message from author
This document is posted to help you gain knowledge. Please leave a comment to let me know what you think about it! Share it to your friends and learn new things together.
Transcript
Extent and causes of international variations in drug usage
A report for the Secretary of State for Health by Professor Sir Mike Richards CBEJuly 2010
Extent and causes of international variations in drug usage
A report for the Secretary of State for Health by Professor Sir Mike Richards CBEJuly 2010
A report for the Secretary of State for Health by Professor Sir Mike Richards CBE
1
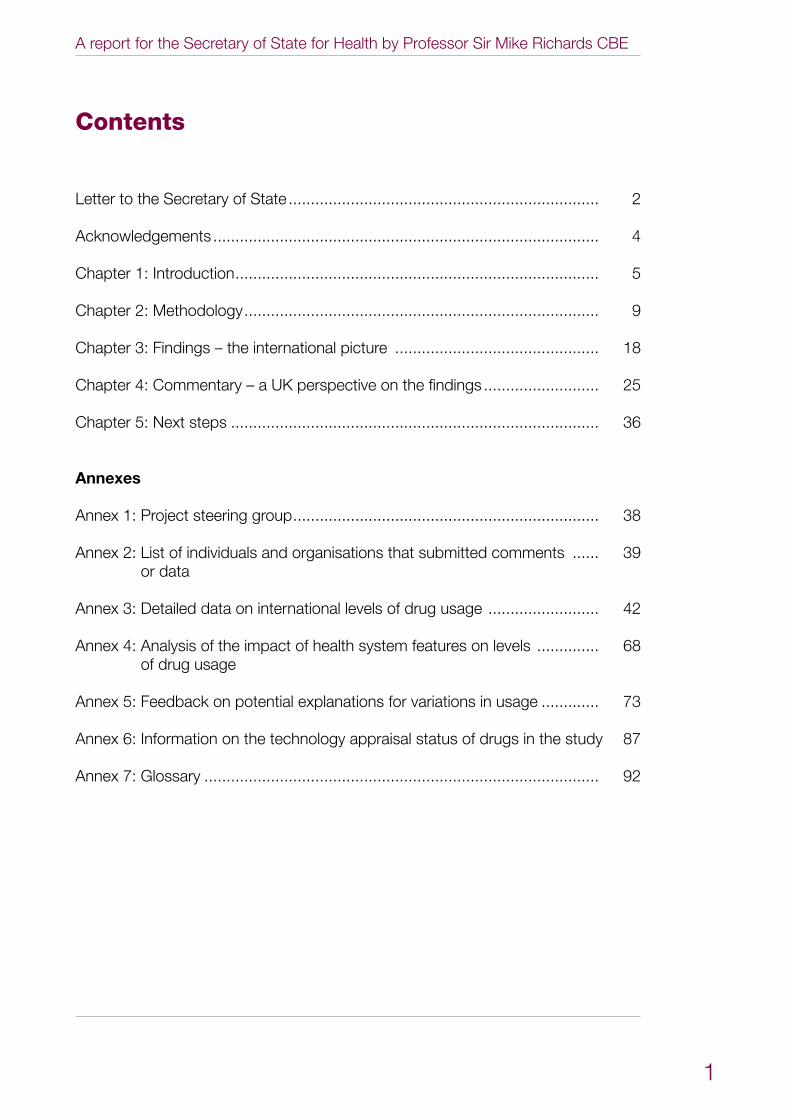
Contents
Letter to the Secretary of State ...................................................................... 2
Acknowledgements ....................................................................................... 4
Chapter 1: Introduction .................................................................................. 5
Chapter 2: Methodology ................................................................................ 9
Chapter 3: Findings – the international picture .............................................. 18
Chapter 4: Commentary – a UK perspective on the findings .......................... 25
Chapter 5: Next steps ................................................................................... 36
Annexes
Annex 1: Project steering group ..................................................................... 38
Annex 2: List of individuals and organisations that submitted comments ...... 39 or data
Annex 3: Detailed data on international levels of drug usage ......................... 42
Annex 4: Analysis of the impact of health system features on levels .............. 68 of drug usage
Annex 5: Feedback on potential explanations for variations in usage ............. 73
Annex 6: Information on the technology appraisal status of drugs in the study 87
Annex 7: Glossary ......................................................................................... 92
Extent and causes of international variations in drug usage
2
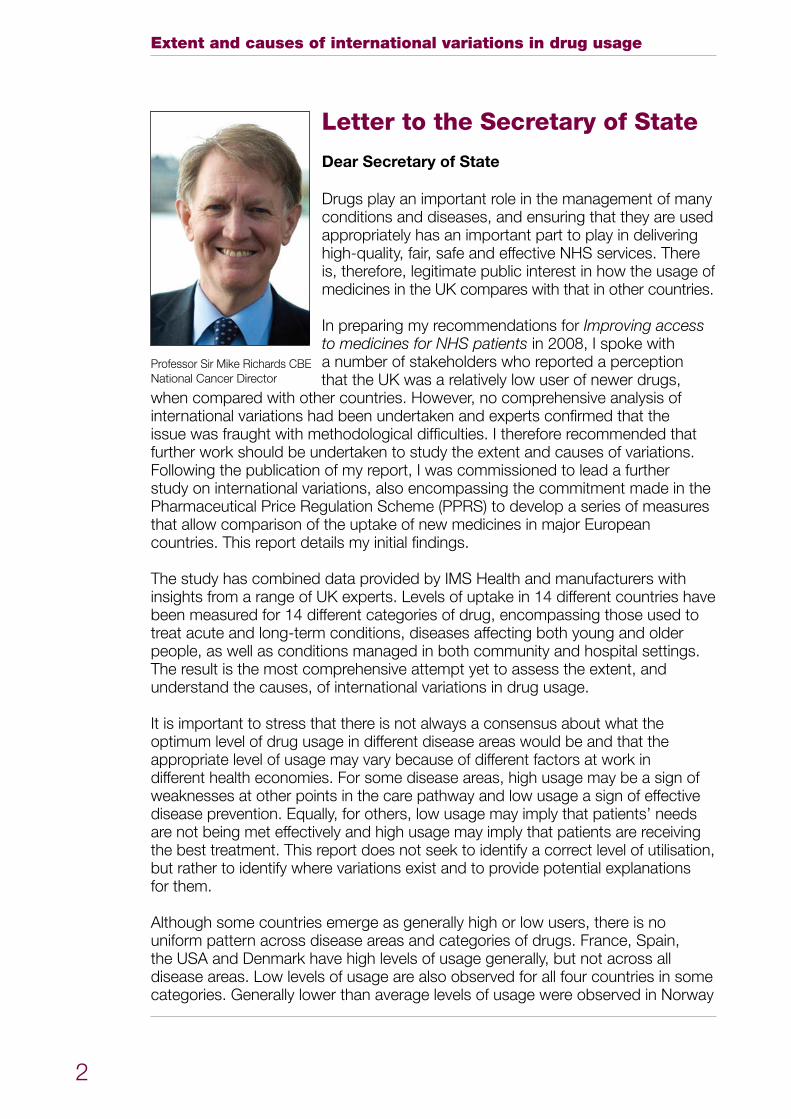
Letter to the Secretary of State
Dear Secretary of State
Drugs play an important role in the management of many conditions and diseases, and ensuring that they are used appropriately has an important part to play in delivering high-quality, fair, safe and effective NHS services. There is, therefore, legitimate public interest in how the usage of medicines in the UK compares with that in other countries.
In preparing my recommendations for Improving access to medicines for NHS patients in 2008, I spoke with a number of stakeholders who reported a perception that the UK was a relatively low user of newer drugs,
when compared with other countries. However, no comprehensive analysis of international variations had been undertaken and experts confirmed that the issue was fraught with methodological difficulties. I therefore recommended that further work should be undertaken to study the extent and causes of variations. Following the publication of my report, I was commissioned to lead a further study on international variations, also encompassing the commitment made in the Pharmaceutical Price Regulation Scheme (PPRS) to develop a series of measures that allow comparison of the uptake of new medicines in major European countries. This report details my initial findings.
The study has combined data provided by IMS Health and manufacturers with insights from a range of UK experts. Levels of uptake in 14 different countries have been measured for 14 different categories of drug, encompassing those used to treat acute and long-term conditions, diseases affecting both young and older people, as well as conditions managed in both community and hospital settings. The result is the most comprehensive attempt yet to assess the extent, and understand the causes, of international variations in drug usage.
It is important to stress that there is not always a consensus about what the optimum level of drug usage in different disease areas would be and that the appropriate level of usage may vary because of different factors at work in different health economies. For some disease areas, high usage may be a sign of weaknesses at other points in the care pathway and low usage a sign of effective disease prevention. Equally, for others, low usage may imply that patients’ needs are not being met effectively and high usage may imply that patients are receiving the best treatment. This report does not seek to identify a correct level of utilisation, but rather to identify where variations exist and to provide potential explanations for them.
Although some countries emerge as generally high or low users, there is no uniform pattern across disease areas and categories of drugs. France, Spain, the USA and Denmark have high levels of usage generally, but not across all disease areas. Low levels of usage are also observed for all four countries in some categories. Generally lower than average levels of usage were observed in Norway
Professor Sir Mike Richards CBE National Cancer Director
A report for the Secretary of State for Health by Professor Sir Mike Richards CBE
3
and Sweden. New Zealand had the lowest ranking (14th) in nine out of the 14 groupings.
From a UK perspective, it is clear that – as with most other countries – the UK’s ranking across disease areas and drug categories is not consistent. The difference in absolute uptake when compared with the all-country average is also highly variable. The UK ranked relatively highly in three disease areas or drug categories (acute myocardial infarction, respiratory distress syndrome and statins) and a relatively low rank was observed in seven categories (cancer drugs launched within the last five years, cancer drugs launched more than 10 years ago, dementia, hepatitis C, multiple sclerosis, rheumatoid arthritis and second-generation antipsychotics). For the remaining four areas, an intermediate rank was observed (cancer hormones, cancer drugs launched between six and 10 years ago, osteoporosis and wet age-related macular degeneration). When all disease areas are taken together, the UK ranks eighth out of the 14 countries. Variations also occur within categories, with the UK being a high user of some drugs and a low user of others.
Experts have identified a number of common themes which, often working in combination, appear to influence the level of usage in the UK compared with other countries. These include the impact of health technology assessment processes; the effectiveness of service planning, organisation and direction setting; and clinical culture. These are worthy of further exploration. Although the level of spending on health was suggested as a potential hypothesis for variations in usage, it does not appear to be a strong determinant. Put simply, countries that spend the most on health do not always have the highest levels of usage and low spenders can be high users of drugs.
The findings set out in this report represent a first iteration of the project, and the steering group has identified a series of next steps which it considers would provide further insight. It is suggested that these are taken forward as part of the Department of Health and industry’s commitment to implementing the PPRS agreement on development of comparative information on international drug usage. I also hope to receive further feedback from stakeholders on their thoughts on the findings and their implications.
Although this report makes no attempt to assess what the appropriate level of drug usage would be for different categories, I would encourage all those with a stake in improving services in the disease areas that have been studied to assess the findings and consider whether the levels of usage observed in the UK are appropriate. I hope that the findings will be helpful in informing the development of policy and practice, as well as assisting with the evaluation of the impact of policies to improve the quality, efficiency and effectiveness of services.
Yours sincerely
Professor Sir Mike Richards CBE MD FRCP
Extent and causes of international variations in drug usage
4
Acknowledgements
Many people and organisations have contributed to this report. Thanks are particularly due to:
John Melville, who co-chaired the steering group, and his colleagues at Roche UK;•
Peter Stephens at IMS Health, who has worked tirelessly with manufacturers •to obtain an accurate picture of drug usage in different countries;
Margaret Stanton, Gillian Baker and Simon Reeve in the Medicines, Pharmacy •and Industry group at the Department of Health;
Mike Birtwistle at Health Mandate, for assistance with drafting;•
Tom Conyers and Pall Jonsson at the National Institute for Health and Clinical •Excellence (NICE), for assistance with the structured interviews with patients and patient representative groups;
the members of the steering group;•
manufacturers who validated data supplied by IMS Health;•
all those who have commented on the findings as they have emerged; and•
my fellow national clinical directors, and their policy teams at the Department of •Health, who have supported development of the disease-specific commentaries which made an important contribution to understanding UK levels of usage.
A report for the Secretary of State for Health by Professor Sir Mike Richards CBE
5
1 Introduction
Medicines play an important role in the management of most diseases. 1.1 In recent years, there have been important changes in the drugs that are used to treat many conditions. This has helped to make many conditions more treatable, thus improving patient outcomes. However, some of the developments which have taken place have also posed significant challenges to the NHS and to health systems internationally, both in terms of funding and the way in which services are organised.
Measuring the usage of drugs can play an important role in assessing and 1.2 improving the quality, fairness and efficiency of health services. During the stakeholder engagement process for the Additional Drugs Review in 2008, stakeholders reported a perception that the usage of new drugs in England remains low compared with some other countries, although they could present little firm evidence of this. Therefore Improving access to medicines for NHS patients (November 2008) recommended that ‘the Department of Health should urgently undertake further work to investigate the extent and causes of international variations in drug usage’.
As a result, Professor Sir Mike Richards was commissioned to lead a project 1.3 to assess the extent and causes of any international variations in drug usage.
The 2009 Pharmaceutical Price Regulation Scheme (PPRS), which is a 1.4 voluntary agreement to control medicines pricing, also stated that ‘industry and the Department will work together to define a set of measures that allow comparison of the uptake of all new medicines with major EU economies and, more specifically, to provide international benchmarks and trends for the uptake of NICE-approved technologies’. It was agreed with the pharmaceutical industry that this commitment would be delivered through the project Professor Richards had been asked to lead.
This report sets out the findings of the initial phase of this project.1.5
Action to ensure appropriate and timely usage of medicines
Ensuring the appropriate use of medicines is critical to enabling the NHS 1.6 to deliver a high-quality, safe, efficient and effective service to patients, and benchmarking levels of drug usage in comparable countries can play a valuable role in informing health policy and delivery.
This study should therefore be considered in the context of wider action 1.7 in recent years to ensure appropriate usage of medicines, including:
steps to ensure that National Institute for Health and Clinical Excellence •(NICE) technology appraisal guidance is developed and made available in a timely manner;
Extent and causes of international variations in drug usage
6
• use in the NHS of comparative benchmarking information and other levers to improve prescribing efficiency;
• improving detection and treatment of specific common illnesses in primary care through mechanisms such as the Quality and Outcomes Framework of the GP contract;
• NICE’s introduction of more flexibility in the appraisal of medicines used near the end of life in small patient populations;
• specific initiatives in the 2009 PPRS agreement aimed at encouraging and rewarding innovation, assisting the uptake of cost-effective new technologies and enabling greater flexibility in the pricing of medicines;
• guidance and support for primary care trusts (PCTs) on how to make local funding decisions on access to medicines in a rational, transparent and timely manner; and
• encouraging speedy implementation of national guidance through the inclusion of rights to NICE and Joint Committee on Vaccination and Immunisation (JCVI) recommended drugs in the NHS Constitution, and the creation of a strategic health authority delivery group to assist the NHS in taking up cost-effective innovative technologies.
Existing information on variations
1.8 Some studies have assessed different elements of variations in drug usage across countries, including the following:
• The Department of Health commissioned an analysis by the London School of Hygiene and Tropical Medicine of funding mechanisms for expensive medicines, which was published alongside Improving access to medicines for NHS patients.
• An analysis was undertaken for the Ministerial Industry Strategy Group (MISG) and published in 2007 comparing uptake of selected medicines in six countries using IMS Health data.
• Data on international prescribing practices have been used to inform the development of national disease strategies, including the National Dementia Strategy and the Cancer Reform Strategy.
• Individual pharmaceutical companies and other stakeholders have produced estimates of variations, using either internal sales data or information supplied by companies such as IMS Health.
1.9 Some work has been undertaken to measure the extent of variations in the usage of medicines within the NHS in England, including:
A report for the Secretary of State for Health by Professor Sir Mike Richards CBE
7
reports published by the National Cancer Director in 2004, 2006 and 2009 •on the domestic uptake and variations in usage across cancer networks of NICE-recommended cancer drugs;
a quantitative analysis of variations in medicines uptake in England •undertaken for the MISG and published in 2007; and
Use of NICE appraised medicines in the NHS in England – Experimental •Statistics, published by the Information Centre for Health and Social Care in September 2009.
To support this project, RAND Europe was commissioned to undertake 1.10 a review of the literature on international comparisons in drug usage. The review concentrated on evidence of international variations in medicines usage and therefore only considered studies that explore cross-national variations involving at least two countries. It assessed studies in six disease areas: osteoporosis; second-generation antipsychotics; dementia; rheumatoid arthritis; cardiovascular disease/lipid-regulating drugs (statins); and hepatitis C. No systematic analyses were found for wet age-related macular degeneration (wet AMD), multiple sclerosis, respiratory distress syndrome (RDS) and respiratory syncytial virus (RSV). Published alongside this report, the literature review confirms that, although some reports have been published by academic institutions on the issue, there is nonetheless a relative paucity of studies in this area.
Moreover, although such studies have provided insight, their focus has 1.11 tended to be on either a single or a limited group of drugs, or a single country. These studies have also tended to use a single source of data which, as set out in Chapter 2, can have its limitations. Studies to date have also tended to focus on assessing the extent of variations, rather than investigating their causes.
The work outlined in this report represents the most extensive attempt yet 1.12 to assess the extent of any variations in drug usage, as well as to explain why these variations may occur. The methodology used in the study – which combines IMS Health data, expertise and knowledge of the supply chain with manufacturers’ information on sales and local circumstances – represents a new departure and provides a model for future projects. The involvement of patients, industry, academia and practising NHS clinicians to help interpret the variations has enabled a variety of perspectives and experiences to be taken into account.
However, technical challenges remain in undertaking accurate and 1.13 informative studies of international variations and further work is required to develop improved methodologies and expand the scope of comparisons. This study does not attempt to be definitive, but should be seen as a proof of concept exercise, to be built on in future iterations. Some suggested next steps are set out in Chapter 5.
Extent and causes of international variations in drug usage
8
Project approach
Ensuring the effective development and appropriate usage of innovative 1.14 medicines in the UK requires contributions from a range of stakeholders. It was felt important to build on the partnership working approach adopted by the pharmaceutical industry, government and other stakeholders for the work of the Long-Term Leadership Strategy and associated activity. Professor Sir Mike Richards therefore established a steering group to guide the project, which he co-chaired with John Melville, General Manager of Roche UK. The steering group incorporated expertise from industry, NHS clinicians and managers, academia, patients, NICE and the Department of Health. The full membership of the steering group is included in Annex 1.
The terms of reference for the steering group are to:1.15
support and oversee delivery of the recommendation in • Improving access to medicines for NHS patients on the development and analysis of information on the extent and causes of international variations in drug usage;
produce a report in the first instance, and consider and frame ongoing •work for future years; and
account for progress to the Secretary of State for Health and MISG.•
The project has been guided by a series of principles, including:1.16
making use of all potentially helpful data sources;•
studying a broad range of disease areas, classes of drug and countries, •so enabling a broad picture of any variations in the usage of medicines to be developed; and
drawing on the expertise, ideas and insights of relevant stakeholders in •terms of both validating data and explaining variations.
It is important to stress that there is not always a consensus about what 1.17 the optimum level of drug usage in different disease areas would be and that the appropriate level of usage may vary because of different factors at work in different health economies. Patient representatives consulted during this study stressed that levels of drug usage alone should not be used as a measure of the quality of services. For some disease areas, high usage may be a sign of weaknesses at other points in the care pathway and low usage a sign of effective disease prevention. Equally, for others, low usage may imply that patients’ needs are not being met effectively and high usage may imply that patients are receiving the best treatment. This report does not seek to identify a correct level of utilisation, but rather to identify where variations exist and to provide potential explanations for them.
A report for the Secretary of State for Health by Professor Sir Mike Richards CBE
9
2 Methodology
As set out in Chapter 1, there are technical challenges in measuring the 2.1 levels of drug usage in different countries and across different medical conditions. Selecting the most appropriate countries to compare, the disease areas on which to focus and the data sources to draw upon was therefore critical to enabling accurate, meaningful and relevant comparisons to be made.
Essentially, a three-stage process was adopted for the study. Firstly, 2.2 countries and disease areas/drugs were chosen for comparison and hypotheses that might explain variations were formulated. Secondly, data on drug usage in the different countries were collected, using a combination of IMS Health data and data held by individual companies. Finally, views on both the plausibility of the data and on the potential explanations for the findings were gathered from a range of stakeholders.
This chapter sets out the:2.3
reasons for basing the analysis on the UK as a whole, rather than England;•
selection criteria for including countries in the study; •
mechanism used to identify which diseases and categories of medicine •should be assessed, and explains why some disease areas were not able to be included;
approach taken to reconciling different sources of data; •
formats in which the data are presented; and•
process used to explain the causes of any variations in drug usage.•
Reasons for basing comparisons on the UK
Although this report was commissioned by the Secretary of State for Health 2.4 in England, a decision was taken to base the analysis on the UK as a whole for a number of reasons:
Comparing the UK, rather than individual home countries, with other •countries would be consistent with earlier analyses, such as the work undertaken by the Department of Health and the Association of the British Pharmaceutical Industry (ABPI) to support the MISG’s Long-Term Leadership Strategy in 2007.
Focusing on England, rather than the UK, would have significantly •increased the complexity of the project in terms of extraction, processing
Extent and causes of international variations in drug usage
10
and comparing different datasets – it would not have been possible to disaggregate the data to this level within the challenging timescales set for the project.
• The 2009 PPRS agreement is an agreement between the four health departments of the UK and the ABPI.
Selection of comparator countries
2.5 Selecting appropriate countries against which to compare drug usage was a critical element in ensuring that the project provided meaningful information. The following principles were used as the basis for selection:
• Relatively robust data on drug utilisation in both community and hospital settings should be available, so as to enable comparison.
• Countries should as far as possible be broadly comparable in terms of economic development, level of gross domestic product (GDP) and proportion of GDP spent on healthcare.
• An inclusive approach should be adopted, incorporating countries in the study rather than excluding them wherever possible. A decision was taken not to exclude perceived outliers, simply because they were assumed to have either very high or very low levels of usage.
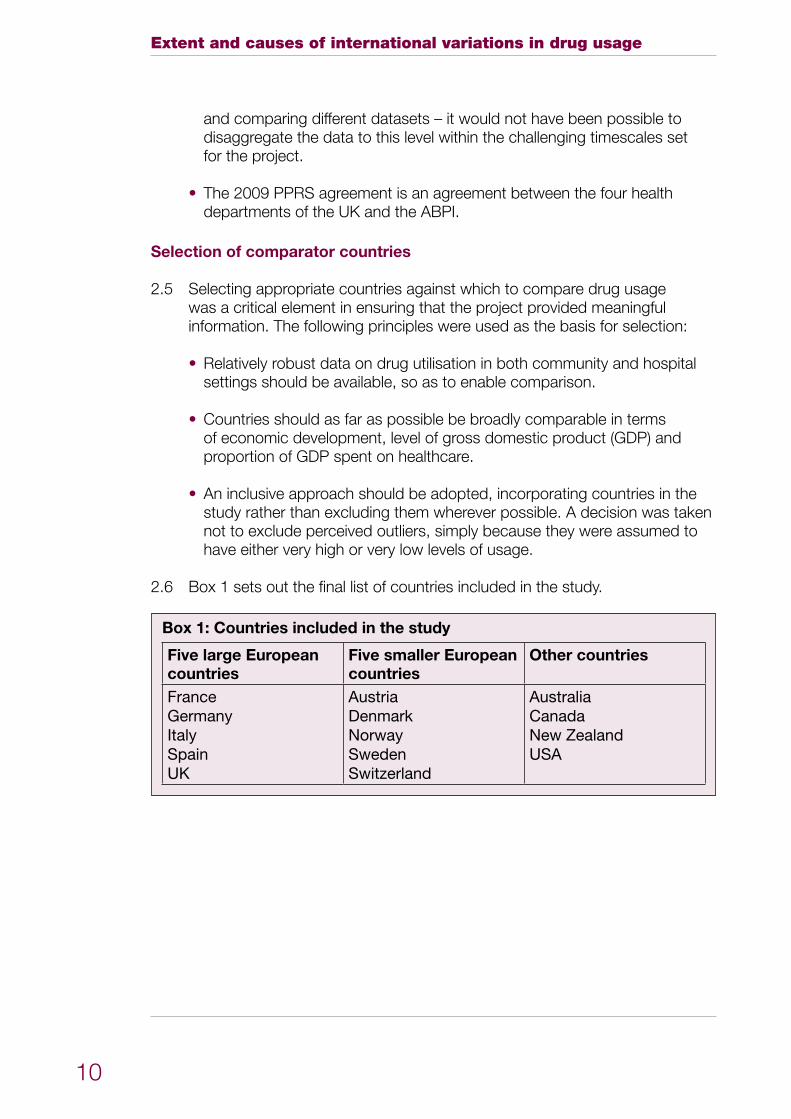
2.6 Box 1 sets out the final list of countries included in the study.
Box 1: Countries included in the study
Five large European countries
Five smaller European countries
Other countries
FranceGermanyItalySpainUK
AustriaDenmarkNorwaySwedenSwitzerland
AustraliaCanadaNew ZealandUSA
A report for the Secretary of State for Health by Professor Sir Mike Richards CBE
11
Selection of disease areas and groups of medicines
Members of the steering group were keen that the study should cover 2.7 as wide a range of conditions/drugs as possible, while recognising the complexity of the task and capacity constraints. It was therefore recommended that a range of factors should be considered in selecting the list of candidate conditions/drugs. These included conditions:
with high incidence, prevalence and/or mortality;•
causing significant long-term morbidity;•
incurring high levels of expenditure;•
for which significant developments in prevention or treatment have been •made in the last decade or so;
affecting different age groups; •
for which drugs have been assessed through health technology •assessment processes, as well as those for which drugs have not; and
which are managed predominantly in either primary or secondary care.•
A decision was taken to, wherever possible, assess usage within categories 2.8 (or classes) of drugs as well as individual medicines. This is important in mitigating the impact of particular factors which may either limit or encourage the use of a specific drug within a category, for example to account for national differences in preferred choices of drugs for different illnesses. This means that the study has not been limited to drugs recommended by NICE but also looks at drugs that were appraised and not recommended and some that have not been appraised. Annex 6 contains details of NICE guidance that is relevant to the drugs included in this study.
It was not possible to include every condition suggested by stakeholders or 2.9 considered by the steering group due to the timescales associated with the project. Areas given strong consideration but which were not incorporated in the study included diabetes, kidney disease and chronic respiratory conditions.
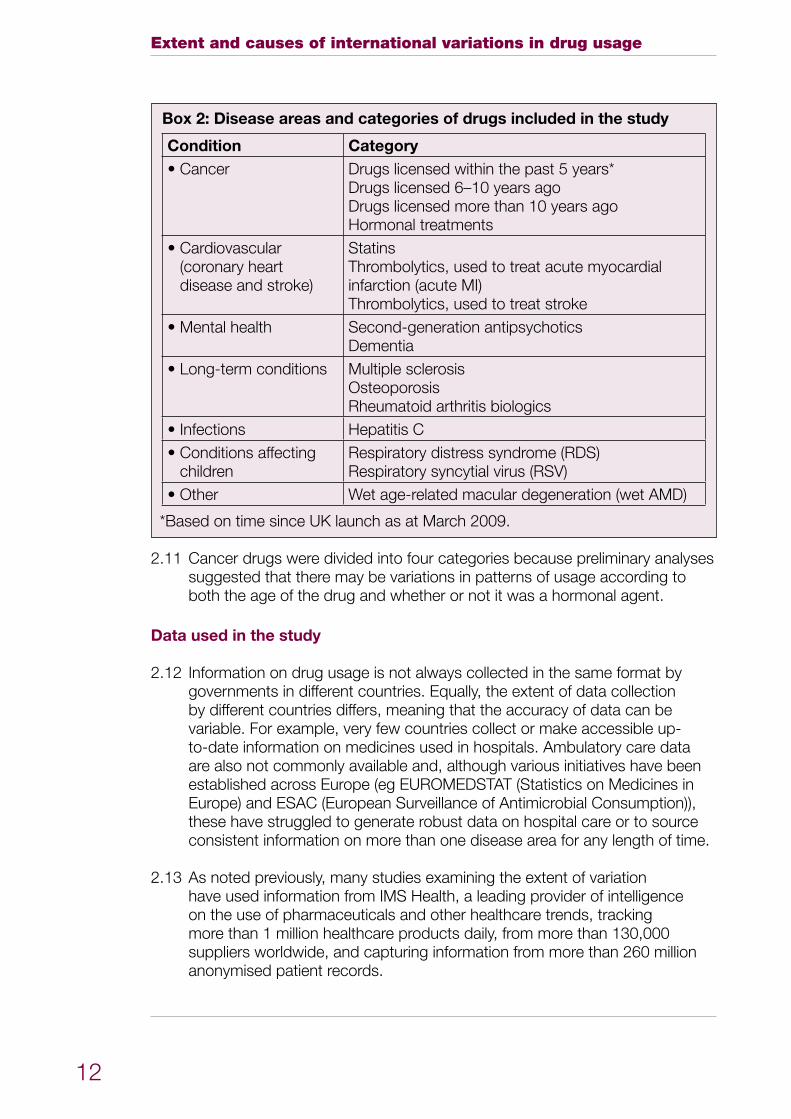
Box 2 sets out the diseases and categories of medicine which were included 2.10 in the study.
Extent and causes of international variations in drug usage
12
Box 2: Disease areas and categories of drugs included in the study
Condition Category•Cancer Drugs licensed within the past 5 years*
Drugs licensed 6–10 years agoDrugs licensed more than 10 years agoHormonal treatments
•Cardiovascular (coronary heart disease and stroke)
StatinsThrombolytics, used to treat acute myocardial infarction (acute MI)Thrombolytics, used to treat stroke
•Mentalhealth Second-generation antipsychoticsDementia
•Long-term conditions Multiple sclerosisOsteoporosisRheumatoid arthritis biologics
•Infections Hepatitis C•Conditionsaffecting
childrenRespiratory distress syndrome (RDS)Respiratory syncytial virus (RSV)
•Other Wet age-related macular degeneration (wet AMD)
*Based on time since UK launch as at March 2009.
Cancer drugs were divided into four categories because preliminary analyses 2.11 suggested that there may be variations in patterns of usage according to both the age of the drug and whether or not it was a hormonal agent.
Data used in the study
Information on drug usage is not always collected in the same format by 2.12 governments in different countries. Equally, the extent of data collection by different countries differs, meaning that the accuracy of data can be variable. For example, very few countries collect or make accessible up-to-date information on medicines used in hospitals. Ambulatory care data are also not commonly available and, although various initiatives have been established across Europe (eg EUROMEDSTAT (Statistics on Medicines in Europe) and ESAC (European Surveillance of Antimicrobial Consumption)), these have struggled to generate robust data on hospital care or to source consistent information on more than one disease area for any length of time.
As noted previously, many studies examining the extent of variation 2.13 have used information from IMS Health, a leading provider of intelligence on the use of pharmaceuticals and other healthcare trends, tracking more than 1 million healthcare products daily, from more than 130,000 suppliers worldwide, and capturing information from more than 260 million anonymised patient records.
A report for the Secretary of State for Health by Professor Sir Mike Richards CBE
13
The bedrock of this study is again the information collected by IMS Health 2.14 from within the pharmaceutical supply chain, including data from dispensing doctors, community pharmacies, hospitals and pharmaceutical wholesalers. The complexities of that supply chain mean, however, that drugs are distributed through many different channels, some of which are not audited by IMS Health. A notable example of this in the UK is where IMS Health collects only partial information on those companies that deliver drugs directly to patients at home rather than in hospital. IMS Health has therefore worked with manufacturers’ data to help it estimate the size of any errors in its audits.
Manufacturers’ data are based on the volumes of drugs shipped out from 2.15 the factories. Manufacturers are, however, often unable to determine where or how a drug is distributed once it has been sold. This is particularly true for manufacturers of products that are subject to parallel trade, the trade of a drug between European countries by an organisation other than the manufacturer. Parallel import constituted more than 90% of UK volume for one of the medicines included in this study, none of which would have been known to the manufacturer. Parallel export has, on the other hand, led to sales of a transplant product running at more than 150% of local UK demand during the study period. Manufacturer sales data can also often be affected by clinical trial sales. Products for use in clinical trials are commonly bought in one country and used in one or many others. Despite these limitations, however, for certain distribution channels, the only source of data is the manufacturer and manufacturer data remain a useful and valuable resource.
The specialist nature of many of the products included in this analysis means 2.16 that the supply chain is often complex. For these reasons, it was agreed that a combined IMS Health and manufacturer dataset would be likely to give a more accurate picture than either dataset used alone. Manufacturers were therefore requested to provide data to IMS Health for the relevant products that retained patent protection in the UK for the time period of the study (April 2008 to March 2009). About 60% of such data were provided. The data were provided by manufacturers to IMS Health on the basis that no usage data for an individual country would be revealed because of concerns over commercial confidentiality.
IMS Health attempted to reconcile the two sets of data. This process was 2.17 based on detailed knowledge of IMS Health data, as well as the supply chain, with manufacturers also being drawn upon to provide further insight into local circumstances. The final dataset comprises around 90% IMS Health data and 10% manufacturer data.
Manufacturers that provided sales data were all given an opportunity 2.18 to comment on the decisions made to reconcile the data as well as its interpretation. In addition, the data were sent to industry associations.
Extent and causes of international variations in drug usage
14
Data presentation
In order to assist with interpretation, an attempt was made to adopt a 2.19 standard methodology. Volume was used as the measure of consumption. Volume is considered the best measure, given that sales data comparisons are affected by exchange rate fluctuations and differing price levels. Volume was expressed wherever possible in terms of the number of doses. The World Health Organization defined daily dose (DDD) was used in most cases but, where this was not available, the maximum or prescribed daily dose was used. Volumes of cancer drugs were only able to be expressed in terms of milligrams given the range of doses and indications. To allow for different population sizes, volume was expressed per capita except where additional information was available on prevalence or on the number of people within the appropriate age group.
At an individual drug level, UK usage has been presented in two ways. First 2.20 the rank of the UK is shown relative to all of the countries in the study and then a series of calculations shows how close or otherwise the UK is to the average use across groups of different countries. Three groups of countries were created; these groups are:
the five largest European countries – France, Germany, Italy, Spain and the •UK – referred to as the European 5;
all European countries in the study – the European 5 as well as Austria, •Denmark, Norway, Sweden and Switzerland – referred to as the European 10; and
all countries studied. •
A similar range of indicators was created at the disease or group of drugs 2.21 level. A rank for the UK relative to all the other countries is shown, as well as how close or otherwise the UK is in terms of usage relative to the average of the three country groups described above. For non-cancer products, this calculation is based on the sum of the standardised daily doses in the UK compared with the average for the other country groups. For the cancer products, this was not possible and so the calculation is based on simply the average across all of the products. This is less satisfactory than for the non-cancer products as high-volume products count the same as low-volume products, potentially creating a distortion in the overall ranking.
A ranking of first indicates the highest level of usage in the study, whereas 2.22 a ranking of 14th indicates the lowest level of usage.
A report for the Secretary of State for Health by Professor Sir Mike Richards CBE
15
Limitations in the data and presentation
There are still limitations with this approach. These include the following:2.23
Where a drug is used to treat more than one disease, it can be difficult •to disaggregate usage. In one case, manufacturer data were supplied following comments from clinicians that allowed an estimate to be made of usage in different indications. In many cases, therefore, the usage shown for a particular country may overestimate actual usage in the particular indication being studied.
Clinical need may vary according to country and this will affect usage •calculations. Some attempts were made to adjust for different prevalence rates where such information was available – for hepatitis C, dementia, RDS and RSV. Where prevalence is not taken into account, a country may be shown as lower or higher than it actually is. For example, in the case of hepatitis C, the data unadjusted for prevalence ranked Italy the highest user within Europe but following adjustment Italy ranked lowest.
Differences in dosage may also explain some of the variations between •countries. For example, clinicians in different countries may adopt different treatment protocols which nonetheless involve the same drug. A preliminary analysis was carried out for a number of the countries by IMS Health for the dementia products, statins and second-generation antipsychotics. The differences seen did not have any explanatory power but the same may not be the case in other therapy areas.
The absence of a method for standardising usage for cancer products •means that country-level comparisons may reveal rather less than they should. Low-volume products are given equal weighting to high-volume products. In terms of service provision, if relative usage of the high-volume product is low, this may be more significant than high relative usage of the low-volume product. Equally, if relative usage of a large high-volume product is high, this may be more significant than low relative usage of a low-volume product.
Not all drugs are available in all countries, meaning that rankings are •assessed against those countries in which the drug is available, rather than every country in the study. For example, not all drugs in every category considered are available in the UK. This can create a misleading impression (a ranking of second out of 2 is very different from a ranking of second out of 13). However, at a group level, this is considered to have little impact.
Manufacturer data were not received in 40% of all possible cases and not •requested for any product that was subject to generic competition. This limits the possibility of validation and may affect the ranking of individual countries, even at a group level.
Extent and causes of international variations in drug usage
16
• In some cases, analyses showed that the ideal combination would be part of a manufacturer’s dataset together with part of the IMS Health dataset. This work was not always possible, notably for some cancer products in Germany, and the usage figures in this report may therefore be, on occasion, an underestimate.
• This analysis focuses on relative usage rather than outcomes because comparable information on health outcomes was not available. This limits the conclusions that can be drawn about the health impact of variations in drug usage.
Explaining differences in usage
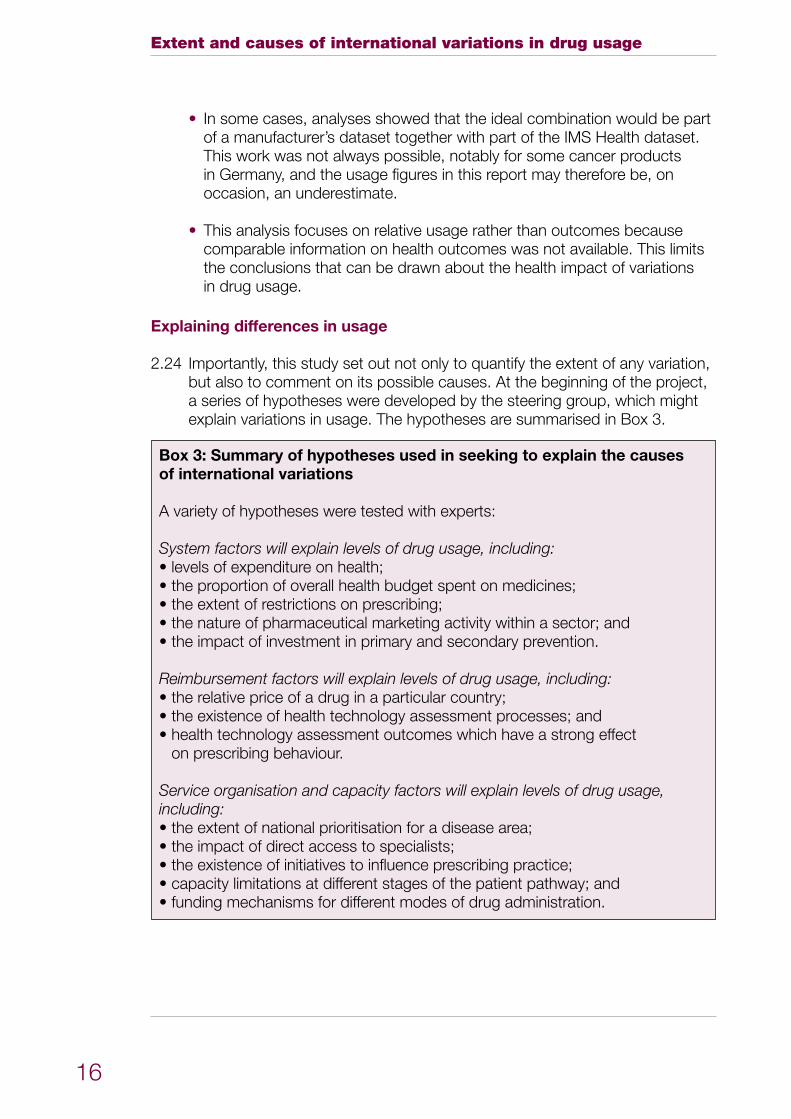
2.24 Importantly, this study set out not only to quantify the extent of any variation, but also to comment on its possible causes. At the beginning of the project, a series of hypotheses were developed by the steering group, which might explain variations in usage. The hypotheses are summarised in Box 3.
Box 3: Summary of hypotheses used in seeking to explain the causes of international variations
A variety of hypotheses were tested with experts:
System factors will explain levels of drug usage, including:•levelsofexpenditureonhealth;•theproportionofoverallhealthbudgetspentonmedicines;•theextentofrestrictionsonprescribing;•thenatureofpharmaceuticalmarketingactivitywithinasector;and•theimpactofinvestmentinprimaryandsecondaryprevention.
Reimbursement factors will explain levels of drug usage, including:•therelativepriceofadruginaparticularcountry;•theexistenceofhealthtechnologyassessmentprocesses;and•healthtechnologyassessmentoutcomeswhichhaveastrongeffect
on prescribing behaviour.
Service organisation and capacity factors will explain levels of drug usage, including: • the extent of national prioritisation for a disease area; •theimpactofdirectaccesstospecialists;•theexistenceofinitiativestoinfluenceprescribingpractice;•capacitylimitationsatdifferentstagesofthepatientpathway;and•fundingmechanismsfordifferentmodesofdrugadministration.
A report for the Secretary of State for Health by Professor Sir Mike Richards CBE
17
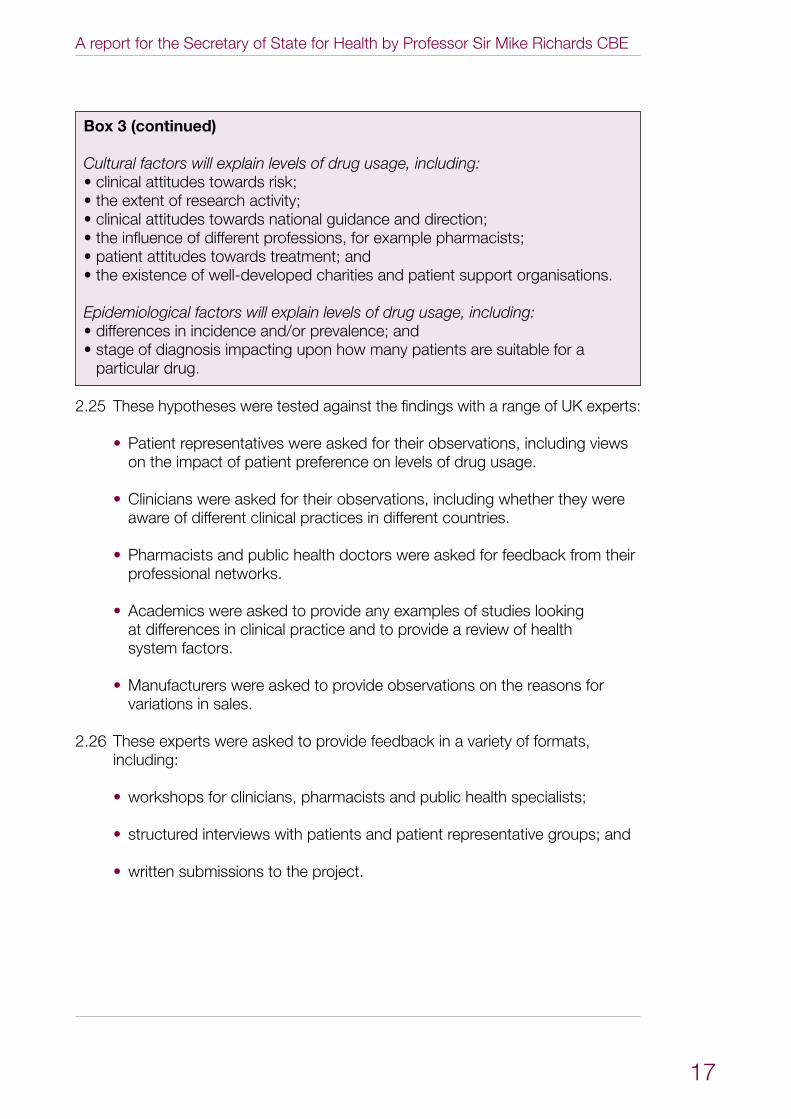
Box 3 (continued)
Cultural factors will explain levels of drug usage, including:•clinicalattitudestowardsrisk;•theextentofresearchactivity;•clinicalattitudestowardsnationalguidanceanddirection;•theinfluenceofdifferentprofessions,forexamplepharmacists;•patientattitudestowardstreatment;and•theexistenceofwell-developedcharitiesandpatientsupportorganisations.
Epidemiological factors will explain levels of drug usage, including:•differencesinincidenceand/orprevalence;and•stageofdiagnosisimpactinguponhowmanypatientsaresuitablefora
particular drug.
2.25 These hypotheses were tested against the findings with a range of UK experts:
• Patient representatives were asked for their observations, including views on the impact of patient preference on levels of drug usage.
• Clinicians were asked for their observations, including whether they were aware of different clinical practices in different countries.
• Pharmacists and public health doctors were asked for feedback from their professional networks.
• Academics were asked to provide any examples of studies looking at differences in clinical practice and to provide a review of health system factors.
• Manufacturers were asked to provide observations on the reasons for variations in sales.
2.26 These experts were asked to provide feedback in a variety of formats, including:
• workshops for clinicians, pharmacists and public health specialists;
• structured interviews with patients and patient representative groups; and
• written submissions to the project.
Extent and causes of international variations in drug usage
18
3 Findings – the international picture
3.1 Using the methodology outlined in Chapter 2, it is possible to develop a detailed picture of how the usage of medicines differs between countries. Although some countries emerge as generally high or low users, there is no uniform pattern across disease areas and categories of drugs. In considering the findings, it is also important to remember that high and low usage do not necessarily equate to good or poor performance.
3.2 This chapter summarises how usage levels compare across the countries included in the study, across disease areas and within categories of drugs; provides insights on the data from a UK perspective; and explores some of the variations that can occur within drug categories. It does not seek to explain why variations occur, which is addressed in Chapter 4.
3.3 Detailed data on each disease area and drug category are presented in Annex 3, including country rankings and UK usage as a percentage of mean volume usage for the three country groups described in Chapter 2.
International variations across disease areas
3.4 Although this study is intended to examine how medicines usage in the UK compares with that in other countries, it is also possible to assess whether some countries are in general high or low users of these drugs.
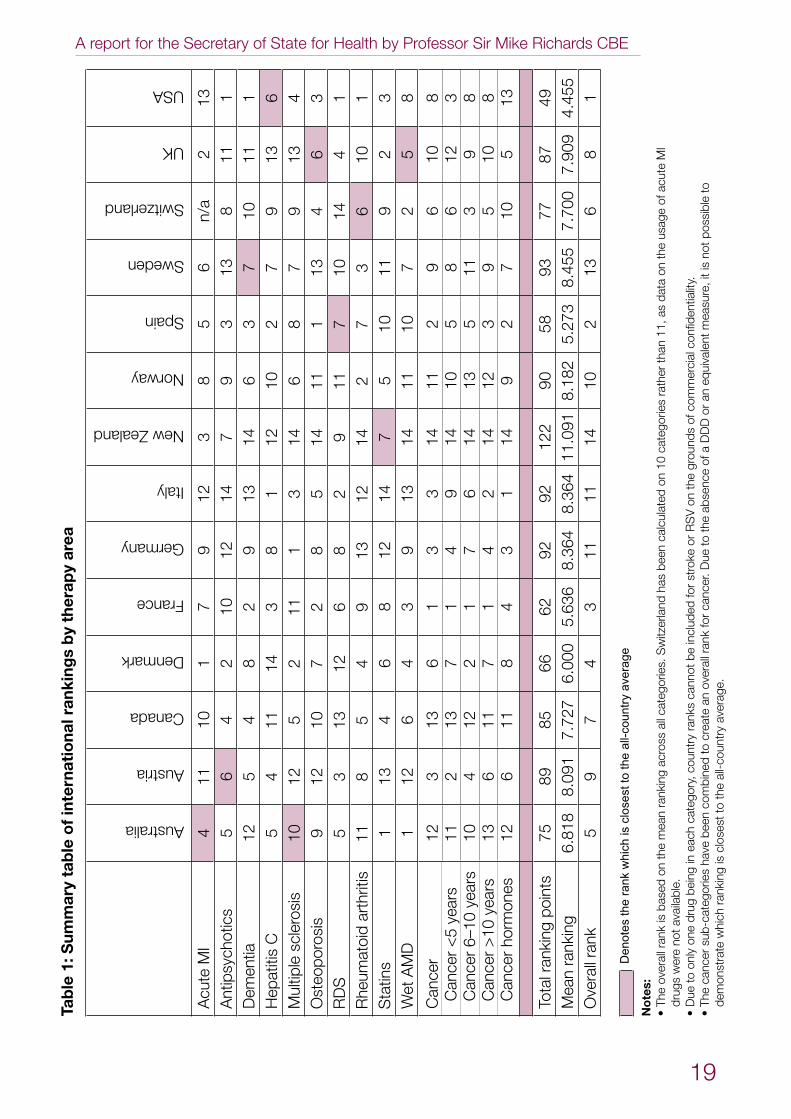
3.5 In general, the picture is very varied within any individual country, as demonstrated in Tables 1 and 2, with high usage in some disease areas, intermediate in others and low in others.
3.6 Taking into account usage in each of the disease areas or drug categories, it is possible to calculate overall usage rankings for the countries included within the study and these are also set out in Table 1. Once again, it is important to stress that a high or low ranking should not be taken to imply good or poor performance. Equally, the ranking only assesses those disease areas considered in this study and therefore cannot be used as an overall assessment of a country’s level of drug usage. For the purpose of this calculation, an overall rank for cancer has been generated, taking into account the ranking observed for each country in each of the four sub-categories.
A report for the Secretary of State for Health by Professor Sir Mike Richards CBE
19
Tab
le 1
: Sum
mar
y ta
ble
of
inte
rnat
iona
l ran
king
s b
y th
erap
y ar
ea
Australia
Austria
Canada
Denmark
France
Germany
Italy
New Zealand
Norway
Spain
Sweden
Switzerland
UK
USA
Acu
te M
I4
1110
17
912
38
56
n/a
213
Ant
ipsy
chot
ics
56
42
1012
147
93
138
111
Dem
entia
12
54
82
913
146
37
1011
1H
epat
itis
C5
411
143
81
1210
27
913
6M
ultip
le s
cler
osis
1012
52
111
314
68
79
134
Ost
eopo
rosi
s9
1210
72
85
1411
113
46
3R
DS
53
1312
68
29
117
1014
41
Rhe
umat
oid
arth
ritis
118
54
913
1214
27
36
101
Sta
tins
113
46
812
147
510
119
23
Wet
AM
D1
126
43
913
1411
107
25
8
Can
cer
Can
cer
<5
year
sC
ance
r 6–
10 y
ears
Can
cer
>10
yea
rsC
ance
r ho
rmon
es
12 11 10 13 12
3 2 4 6 6
13 13 12 11 11
6 7 2 7 8
1 1 1 1 4
3 4 7 4 3
3 9 6 2 1
14 14 14 14 14
11 10 13 12 9
2 5 5 3 2
9 8 11 9 7
6 6 3 5 10
10 12 9 10 5
8 3 8 8 13
Tota
l ran
king
poi
nts
7589
8566
6292
9212
290
5893
7787
49M
ean
rank
ing
6.81
88.
091
7.72
76.
000
5.63
68.
364
8.36
411
.091
8.18
25.
273
8.45
57.
700
7.90
94.
455
Ove
rall
rank
59
74
311
1114
102
136
81
M
Ia
cute
to
of
usag
e
poss
ible
not
th
e
on isda
ta
confi
dent
ialit
y. ite,
as
11, mea
sur
th
an
cial
rath
er
equ
ival
ent
c
ateg
orie
s anc
omm
eror
of
DD
Dou
nds
aofgr 10
on
the
calc
ulat
ed
on
RS
V ab
senc
e th
eor
oke
bee
n toD
uest
r
has .
canc
er
Sw
itzer
land
for
in
clud
edfo
r
Den
otes
the
rank
whi
ch is
clo
sest
to th
e al
l-cou
ntry
ave
rage
rank
be
cate
gorie
s. ca
nnot
over
all
an
al
l ra
nks
eate
oss
coun
try cr
to,
ran
king
acr
com
bine
d
cat
egor
y
mea
n
been
eac
h
the
in
on
bei
ng ha
ve
ba
sed
is
rank
e
not a
vaila
ble.
dru
go
nes
ub-c
ateg
orie
s
No
tes:
T
heo
vera
lldr
ugs
wer on
ly
to canc
erD
ue
The
dem
onst
rate
whi
ch r
anki
ng is
clo
sest
to th
e al
l-cou
ntry
ave
rage
.
• • •
Extent and causes of international variations in drug usage
20
Table 2: Summary of country rankings
Country Higher rank(1–4)
Intermediate rank (5–9)
Lower rank (10–14)
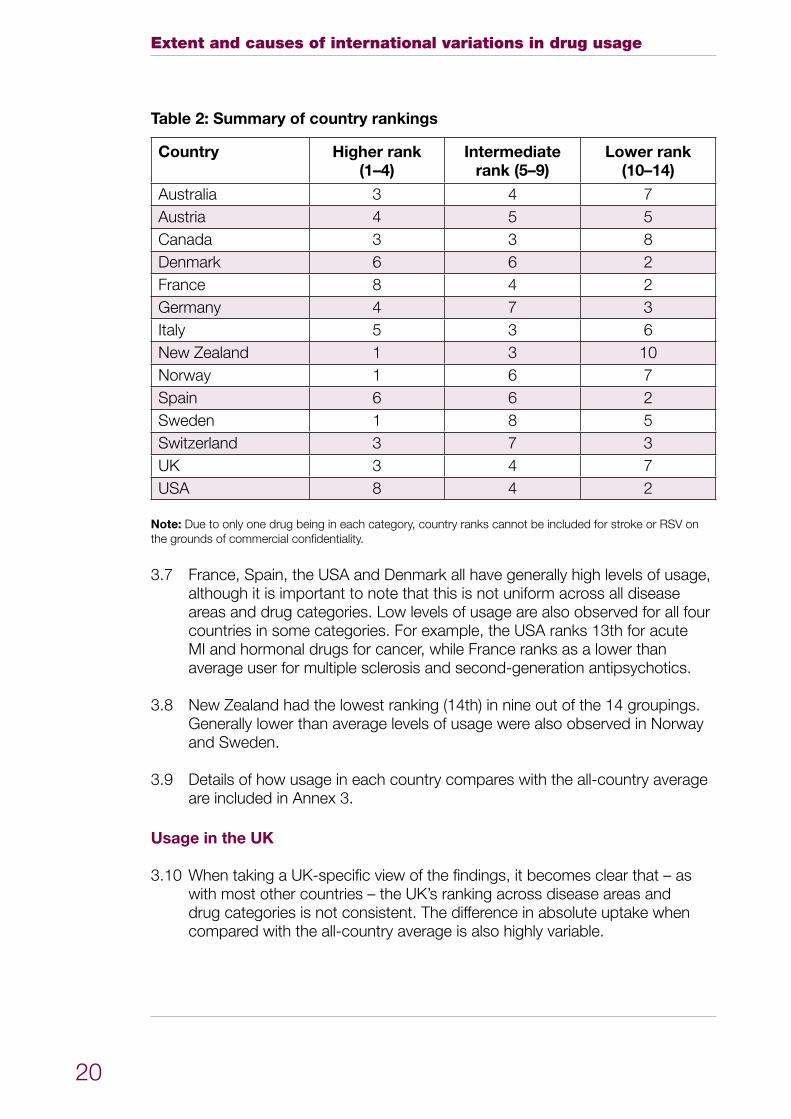
Australia 3 4 7Austria 4 5 5Canada 3 3 8Denmark 6 6 2France 8 4 2Germany 4 7 3Italy 5 3 6New Zealand 1 3 10Norway 1 6 7Spain 6 6 2Sweden 1 8 5Switzerland 3 7 3UK 3 4 7USA 8 4 2
Note: Due to only one drug being in each category, country ranks cannot be included for stroke or RSV on the grounds of commercial confidentiality.
France, Spain, the USA and Denmark all have generally high levels of usage, 3.7 although it is important to note that this is not uniform across all disease areas and drug categories. Low levels of usage are also observed for all four countries in some categories. For example, the USA ranks 13th for acute MI and hormonal drugs for cancer, while France ranks as a lower than average user for multiple sclerosis and second-generation antipsychotics.
New Zealand had the lowest ranking (14th) in nine out of the 14 groupings. 3.8 Generally lower than average levels of usage were also observed in Norway and Sweden.
Details of how usage in each country compares with the all-country average 3.9 are included in Annex 3.
Usage in the UK
When taking a UK-specific view of the findings, it becomes clear that – as 3.10 with most other countries – the UK’s ranking across disease areas and drug categories is not consistent. The difference in absolute uptake when compared with the all-country average is also highly variable.
A report for the Secretary of State for Health by Professor Sir Mike Richards CBE
21
Overall, the UK ranks eighth out of the 14 countries included in the study, 3.11 when the usage ranking observed in each disease area or drug category is taken into account. It is important to stress, however, that this finding should be treated with caution, as it includes no judgement as to whether a high or low level of usage would be considered to represent good clinical practice. It also does not ‘weight’ the significance of the rankings in individual categories.
The UK is ranked relatively high (rank 1–4) in three disease areas or drug 3.12 categories:
thrombolytics for acute MI; •
surfactant for RDS; and•
statins.•
The UK is ranked intermediately (rank 5–9) in six disease areas or drug 3.13 categories:
cancer hormones;•
cancer drugs launched between six and 10 years ago;•
osteoporosis; •
RSV prophylaxis;•
stroke; and•
wet AMD.•
The UK is ranked relatively low (rank 10–14) in seven disease areas or drug 3.14 categories:
cancer drugs launched within the last five years;•
cancer drugs launched more than 10 years ago;•
dementia;•
hepatitis C;•
multiple sclerosis;•
rheumatoid arthritis; and •
second-generation antipsychotics.•

Extent and causes of international variations in drug usage
22
For some categories it was not possible to calculate a DDD or prescribed 3.15 dose due to the complexity of dosages and indications. This means that the rankings are not weighted according to differences in the volume usage of individual drugs within a category. As a result, the impact of some high-volume drugs on the overall category ranking may be understated. This is believed to be the case for cancer drugs launched between six and 10 years ago where lower than average usage was observed for a number of drugs used in relatively large patient populations. If the overall ranking of this group was weighted according to relative volume usage, then the overall ranking may have been in the lower range rather than the intermediate one.
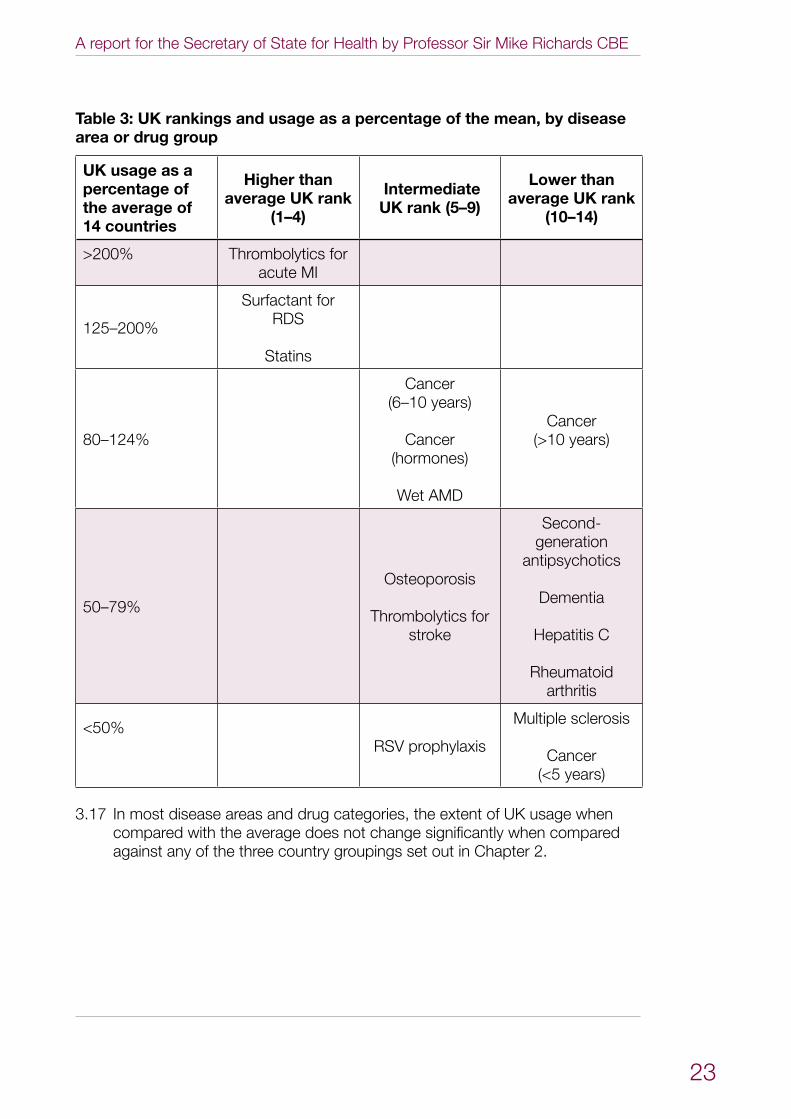
It is also instructive to examine UK usage as a percentage of the international 3.16 average, as a ranking alone will not reveal whether UK usage is significantly different from the mean. Table 3 shows how usage as a percentage of the average compares against the ranking achieved for different disease areas or drug categories. This reveals some further points of interest, including:
the UK has a high ranking and is a very high user of drugs for acute MI in •comparison with the all-country average (greater than 200%);
although the UK has an intermediate ranking for RSV drugs, usage is less •than 50% of the all-country average;
the UK has a lower rank for cancer drugs launched more than 10 years •ago, but usage levels are closer to the all-country average (80–125%); and
the UK has a low rank for multiple sclerosis and cancer drugs launched •within the last five years and usage is less than 50% of the all-country average.
A report for the Secretary of State for Health by Professor Sir Mike Richards CBE
23
Table 3: UK rankings and usage as a percentage of the mean, by disease area or drug group
UK usage as a percentage of the average of 14 countries
Higher than average UK rank
(1–4)
Intermediate UK rank (5–9)
Lower than average UK rank
(10–14)
>200% Thrombolytics for acute MI
125–200%
Surfactant for RDS
Statins
80–124%
Cancer (6–10 years)
Cancer (hormones)
Wet AMD
Cancer (>10 years)
50–79%
Osteoporosis
Thrombolytics for stroke
Second-generation
antipsychotics
Dementia
Hepatitis C
Rheumatoid arthritis
<50%RSV prophylaxis
Multiple sclerosis
Cancer (<5 years)
In most disease areas and drug categories, the extent of UK usage when 3.17 compared with the average does not change significantly when compared against any of the three country groupings set out in Chapter 2.
Extent and causes of international variations in drug usage
24
Variations within categories
Usage within categories is rarely uniform. There are a variety of factors that 3.18 help explain this:
In some categories, different drugs will perform a similar function and •therefore usage of one drug may displace usage of another (for example, this is the case for wet AMD drugs).
Sometimes drugs within the same category are used sequentially or •complementarily (for example, this is the case for some cancer or rheumatoid arthritis drugs).
Some drugs included in the same category may perform a very different •clinical function, and may indeed be used in different groups of patients (for example, this is the case for some cancer drugs, which will be used to treat different forms of cancer).
Variations within a category may also be caused by other factors, such as 3.19 the impact of national guidance or policy direction, as well as the extent to which different drugs are available in different countries.
It is therefore important that any insights drawn from studying international 3.20 variations in drug usage should take into account findings at a variety of levels, including overall levels of usage, usage for different categories of drugs and the usage levels of drugs within each category.
A report for the Secretary of State for Health by Professor Sir Mike Richards CBE
25
4 Commentary – a UK perspective on the findings
Chapter 3 has indicated that there are wide international variations in the 4.1 usage of most of the drugs which are included in the study. However, with one or two exceptions, there does not appear to be a consistent pattern between countries or for different disease areas or categories of drug.
This chapter provides commentary from a UK perspective on the potential 4.2 causes of variations in drug usage between different countries. It does not seek to explain why other countries may be high or low users of particular categories of drug, but rather sets out the reasons for the levels of UK usage observed in the data.
The commentary provided is based on feedback from subject experts, 4.3 patient representatives and other stakeholders who were engaged with during the project. A more detailed summary of the feedback is included in Annex 5.
The causes of international variations in drug usage appear to be complex, 4.4 with no single consistent cause being identified across disease areas and drug categories. However, in assessing and explaining the potential causes, a number of common themes emerge:
Differences in health spending and systems do not appear to be strong •determinants of usage.
Health technology assessment processes and outcomes can have a •significant impact on levels of usage.
Service planning, organisation and direction setting play an important role •in enabling or restricting usage.
Clinical culture and attitudes towards treatment remain important •determinants in levels of uptake.
These themes often work in combination, so, for example, the impact of a 4.5 health technology assessment can either be mitigated or amplified by issues relating to service organisation or clinical culture.
Differences in health systems
Some commentators have argued that differences in the way health systems 4.6 are funded or organised are a strong determinant of the level of drug usage. For example, a country that spends more on healthcare or a country which operates few controls on prescribing could be expected to use more drugs. This was a strong theme in the hypotheses generated as part of the project.
Extent and causes of international variations in drug usage
26
Health systems are complex and it is difficult to establish a direct causal 4.7 relationship between a particular health system feature and the level of drug usage. To help interpret observed trends and the assessment of variations, RAND Europe has provided an overview of the key health system features of the 14 countries included in the review. Some of the key features are summarised below:
The majority of the 14 countries reviewed use taxation as the main means •to fund their health systems. The USA is the only country where the health system is predominantly funded through private sources, with only about 45% financed publicly.
The majority of countries reviewed provide (almost) universal coverage, •with residence in the given country being the most common basis for entitlement to healthcare.
The USA is the only country not offering universal access to healthcare. •Entitlement to publicly funded services is dependent on certain conditions, with Medicare providing healthcare for those aged 65 years and over, Medicaid for those under a certain income threshold or the Veterans Health Administration for veterans.
There are significant variations in per capita health spending ranging in •2007 from a low of US$2,510 per capita in New Zealand to US$7,290 in the USA (average: US$3,741; average excluding USA: US$3,468).*2
Access to specialist services in the countries included in the study tends to •be regulated by referral. Most countries have assigned a ‘gatekeeping’ role to general practitioners (GPs). Germany has put in place incentives for GPs to act as gatekeepers. Patients in Australia, Denmark, France and Sweden may access specialist services directly with a co-payment. In the USA, it depends on individual health plans whether or not GPs or primary care physicians assume the role of gatekeeper.
The scope of services covered under the statutory system is fairly similar •among the countries, with all systems offering a basic basket of services. There are considerable variations in relation to services such as mental health care, rehabilitation, dental care or optometry. Prescription drugs are usually covered under the statutory system but often require a patient co-payment.
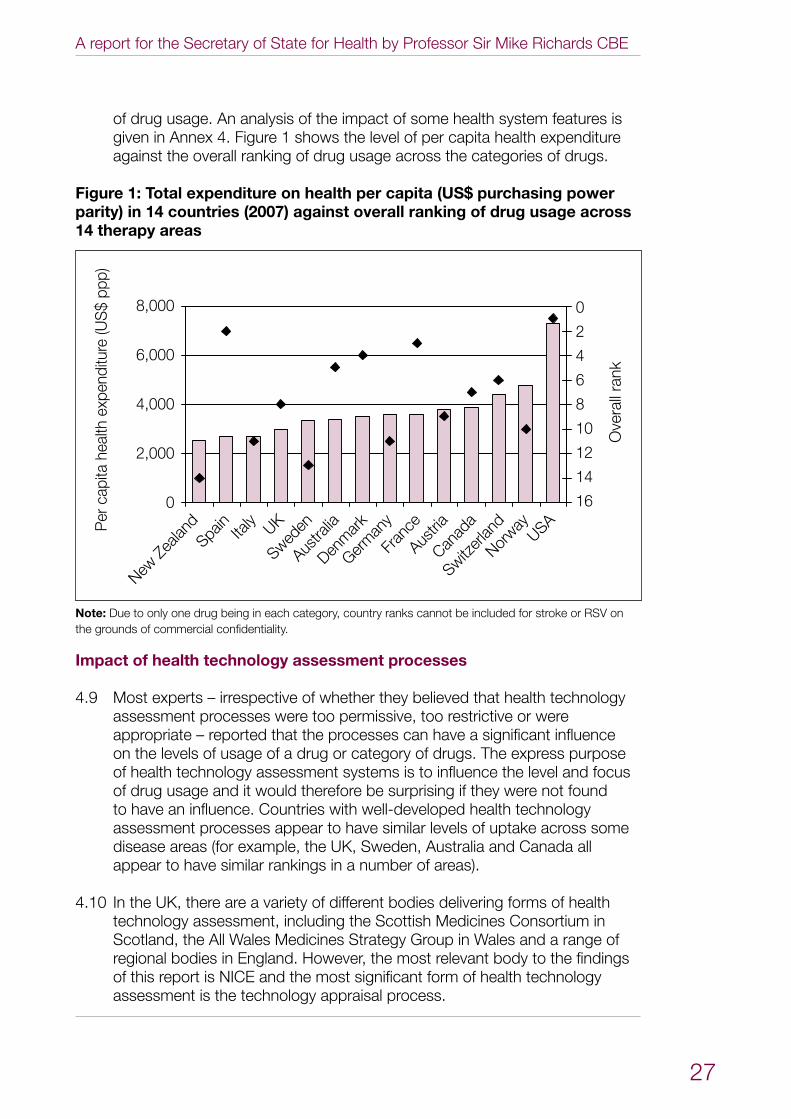
However, from the findings presented in this report, it is not clear that any 4.8 particular system characteristic such as health expenditure, sources of system funding or coverage exerts a strong determinative effect on levels
* Organisation for Economic Co-operation and Development (2009) OECD Health Data 2009. Paris: OECD.
A report for the Secretary of State for Health by Professor Sir Mike Richards CBE
27
of drug usage. An analysis of the impact of some health system features is given in Annex 4. Figure 1 shows the level of per capita health expenditure against the overall ranking of drug usage across the categories of drugs.
Figure 1: Total expenditure on health per capita (US$ purchasing power parity) in 14 countries (2007) against overall ranking of drug usage across 14 therapy areas
New Z
ealan
d
Sweden
Germ
any
Italy
Norway
AustriaUK
Canad
aSwitz
erlan
d
Austra
liaDen
mar
k
Fran
ce
Spain
USA
Ove
rall
rank
Per
cap
ita h
ealth
exp
endi
ture
(US
$ pp
p)
8,000
6,000
4,000
2,000
0
0
2
4
6
8
10
12
14
16
Note: Due to only one drug being in each category, country ranks cannot be included for stroke or RSV on the grounds of commercial confidentiality.
Impact of health technology assessment processes
Most experts – irrespective of whether they believed that health technology 4.9 assessment processes were too permissive, too restrictive or were appropriate – reported that the processes can have a significant influence on the levels of usage of a drug or category of drugs. The express purpose of health technology assessment systems is to influence the level and focus of drug usage and it would therefore be surprising if they were not found to have an influence. Countries with well-developed health technology assessment processes appear to have similar levels of uptake across some disease areas (for example, the UK, Sweden, Australia and Canada all appear to have similar rankings in a number of areas).
In the UK, there are a variety of different bodies delivering forms of health 4.10 technology assessment, including the Scottish Medicines Consortium in Scotland, the All Wales Medicines Strategy Group in Wales and a range of regional bodies in England. However, the most relevant body to the findings of this report is NICE and the most significant form of health technology assessment is the technology appraisal process.
Extent and causes of international variations in drug usage
28
Of the drugs included in the study that were available in the UK, 67 out of 4.11 111 have been the subject of a NICE technology appraisal. Some of these drugs will have been appraised on more than one occasion; for example, a drug may have been appraised in multiple indications or for different formulations. Although NICE was established in 1999, it has appraised significant drugs which received marketing authorisation prior to that date. Annex 6 contains details of NICE technology appraisal guidance that is relevant to the drugs included in this study.
Technology appraisals can deliver a variety of forms of recommendation, 4.12 each of which can have its own impact on the usage of a drug or class of drugs. For NICE technology appraisals, these tend to fall into four groups:
recommended• – the treatment is recommended for use in line with the marketing authorisation (from the Medicines and Healthcare products Regulatory Agency (MHRA) or European Medicines Agency (EMA; formerly the EMEA)) or in line with current clinical practice;
optimised• – the recommendations materially restrict access to the treatment beyond the specifications set out in the marketing authorisation (from the MHRA or EMA). In defining ‘material’, advice provided to the Appraisal Committee by clinical experts on the anticipated use of the technology in clinical practice will be used;
only in research• – the treatment is only recommended for use in the context of clinical trials; and
not recommended • – the treatment is not recommended.
It is important to note that not all of the drugs considered in this study will 4.13 have been the subject of a NICE technology appraisal. In addition, there are a number of factors relating to health technology assessment that are likely to impact on usage of a particular drug in different countries:
It is unclear whether every drug in the study which has been appraised •by NICE will also have been appraised by health technology assessment bodies in other countries where they exist.
The timing of a technology appraisal recommendation can impact upon •levels of uptake. Where a drug has been subject to a health technology assessment in one or more country, the assessment may have been carried out at different times.
NICE technology appraisal guidance focuses on clinical and cost •effectiveness. Where health technology assessment processes exist in other countries, the focus and methodology of assessment may be different to that used by NICE.
A report for the Secretary of State for Health by Professor Sir Mike Richards CBE
29
Where NICE guidance recommends a technology, a strong signal is given 4.14 to the NHS that a medicine is clinically and cost effective and should be used. An example of this is osteoporosis where clinicians have reported that the usage of medicines reflected the structured and hierarchical nature of NICE guidance for primary and secondary prevention of osteoporotic fragility fractures in postmenopausal women.*3NICE guidance recommends alendronic acid as the first-line treatment for both primary and secondary prevention and the findings reveal high use of alendronic acid in relation to all other countries (121%). Further details of the level of uptake for osteoporosis drugs are given in Table A27 of Annex 3.
However, positive guidance does not always automatically result in higher 4.15 than average use of medicines. It is notable that some categories of drug which have received a strong NICE endorsement are still used at significantly lower levels than in other countries (for example, for hepatitis C treatments or some cancer drugs). Equally, drugs that receive positive guidance may also enjoy high levels of clinical support, which will also be an important factor in encouraging higher usage.
It is clear that, when NICE recommends one drug within a category but not 4.16 another, this has a significant influence on prescribing behaviour. For wet AMD, the high UK use of ranibizumab, but not pegaptanib, is undoubtedly a reflection that NICE guidance recommended the former but not the latter. However, it is also noticeable that NICE only issued guidance in August 2008, midway through the study period, demonstrating that levels of usage of a drug which are relatively high by international standards (ranking of 5, 99% of the all-country average) can occur ahead of, or close to, the point at which NICE guidance is issued. However, the relatively high usage in the UK, when compared with other countries, may be influenced by the off-label use of bevacizumab to treat wet AMD in other countries. Further details of the level of uptake for wet AMD drugs are given in Table A46 of Annex 3.
The impact of guidance which restricts usage to a sub-group of patients or 4.17 to a defined position within the patient pathway can be seen in rheumatoid arthritis, where the UK has a ranking of 10th for the overall biologic category of drugs (73% of the all-country average). This partly reflects a different approach to treatment than exists for example in the USA (ranked first), where biologics are sometimes used as first-line agents. However, the difference in usage with the Scandinavian countries (Norway ranked second, Sweden ranked third and Denmark fourth) was considered to be a more significant comparison with the UK. In this case, clinicians and patient representatives felt that the difference in usage was a manifestation of more stringent disease activity thresholds being applied in the UK, more selective guidance on the use of some rheumatoid arthritis drugs as well as both negative and/or pending guidance on others. Further details of the level of uptake for rheumatoid arthritis drugs are given in Table A35 of Annex 3.
*Technology Appraisal (TA) 160 and TA161.
Extent and causes of international variations in drug usage
30
When NICE produces guidance recommending that a medicine should not 4.18 be routinely used in the NHS, uptake in the UK tends to be low and will mainly be restricted to patients in the private sector. This can be seen in the relatively low use of some newer cancer drugs such as sorafenib, which is used to treat advanced kidney and liver cancers (ranking of 13th, 23% of the all-country average). Negative guidance may of course be accompanied by other factors, such as limited clinical support for a drug, which will compound low levels of usage.
The timing of a technology appraisal in relation to marketing authorisation 4.19 can also impact on usage. Experts suggested that the low usage of newer cancer drugs which received a positive appraisal (at least on a selective basis) could in some cases be explained by the fact that a positive recommendation was only delivered very late in the audit period or after it had completed. This is the case for drugs such as cetuximab, erlotinib and lenalidomide. Equally, where guidance subsequently recommends selective usage within an indication, this may reduce levels of usage. Usage of sunitinib, however, was observed at 67% of the all-country average despite a positive NICE appraisal being issued only at the very end of the study period.
There was also some speculation that technology appraisals could have the 4.20 effect of limiting usage of specific drugs outside their licensed indications, as these forms of usage would not be subject to appraisal and therefore the NHS would have no comparable guidance on their suitability.
It is clear that health technology assessment processes can have a significant 4.21 impact on levels of drug usage. However, this factor alone cannot explain why levels of usage of a category of drugs may differ in the UK from other countries. For some drugs, higher than expected usage is observed ahead of a positive NICE appraisal. Equally, for others, a positive NICE appraisal may not lead to high levels of uptake being observed by international standards.
Service planning, organisation and direction setting
Many stakeholders reported that the way in which a service is organised can 4.22 have a significant impact on levels of drug usage. Effective service planning will mean that a service has:
measures in place to identify and manage disease at an appropriately early •stage, potentially resulting in higher usage for some drugs but lower usage for others which would be used to address the consequences of earlier poor management;
the necessary capacity planned and available to deliver interventions in •a timely manner; and
the drivers in place to encourage appropriate, efficient and effective •prescribing.
A report for the Secretary of State for Health by Professor Sir Mike Richards CBE
31
In areas where a disease is established as a priority, it is clear that 4.23 prescribing behaviour can be influenced by national leadership. Examples of this include in cardiovascular disease, where some medications were given a prominent role in the strategy for improving services, and cancer, where previous studies have shown a marked reduction in the variations of uptake in NICE-recommended drugs.
The high level of usage of drugs to treat acute MI was considered to be a 4.24 reflection of good clinical practice and represented the positive impact of the National Service Framework for Coronary Heart Disease, which has included strong emphasis on improving ambulance response times and ‘door-to-needle’ times. It is notable that both the USA and Italy have very low levels of usage of acute MI drugs. Investigation has revealed that this may be a result of much higher use of primary percutaneous coronary intervention (PPCI) as an alternative to thrombolytics, reflecting a difference in service organisation, clinical preference or both.
In the same way that high-quality service organisation can influence drug 4.25 usage, so challenges in organisation, planning and capacity can also impact upon levels of drug utilisation. Examples of this can be seen in hepatitis C and RDS.
Hepatitis C is a blood-borne virus which is largely restricted to injecting drug 4.26 users (present and past), recipients of blood transfusion (before September 1991) or blood products (before 1986) in the UK, and migrants to this country from countries where hepatitis C is common, although information about the prevalence of hepatitis C in this latter group is limited. Drug treatment for hepatitis C is effective, on average, in more than half of the people treated. The UK is a low user of hepatitis C treatments, receiving an overall rank of 13th, with usage just over 50% of the all-country average despite the fact that NICE has issued positive guidance on all the drugs considered in the study.
It is important to note that this figure is based on population levels and some 4.27 countries have significantly higher estimated hepatitis C prevalence rates than the UK. When usage calculations are adjusted for estimated hepatitis C prevalence rates, the UK is still a relatively low user. However, the UK’s rank may have been affected to some extent by a higher prevalence of hepatitis C virus genotype 3 compared with other countries, which requires drug therapy for six rather than 12 months. The fact that the majority of the infected population in the UK are former or current injecting drug users is also likely to affect referral and access to care.
Although there have been sustained increases in hepatitis C testing and 4.28 diagnosis in recent years in England, experts suggested that countries such as France and Australia are ahead of the UK in developing and implementing national strategies to tackle hepatitis C, including promoting higher rates of diagnosis and treatment.
Extent and causes of international variations in drug usage
32
Experts suggested that there are challenges in service organisation for 4.29 diagnosed patients, meaning that not every eligible patient is offered treatment and supported in completing it. The Department of Health has responded to the challenges which are apparent in delivering effective services for liver diseases, including viral hepatitis, through the development of a national liver strategy, which is being led by the National Clinical Director for Liver Disease.
It is important to stress that high levels of usage of a drug are not always 4.30 associated with better services or any improved outcomes. Another area where challenges in health organisation appear to affect levels of drug usage is RDS. RDS almost always occurs in newborns born before 37 weeks of gestation. The more premature the baby is, the greater the chance of developing RDS. If severe RDS is left untreated, it can result in multiple organ failure and death. However, with adequate support for ventilation, RDS can be resolved. Recovery is hastened by treatment with pulmonary surfactant.
The UK is apparently a high user of surfactant products, receiving an overall 4.31 ranking of fourth, with usage at 132% of the all-country average. While this is likely to indicate appropriate treatment in individual cases, experts reported that this usage may be a reflection of the relatively high rate of preterm birth in comparison with other European countries and low use of antenatal steroids in women at risk of premature birth. High levels of preterm births are closely associated with causes of health inequalities such as socioeconomic deprivation, teenage pregnancies and smoking rates among pregnant women. The need to address these issues in the UK is acknowledged. In order to address this, infant mortality is covered in the Department of Health’s Public Service Agreements, and the Infant Mortality National Support Team was established to help reduce infant mortality in disadvantaged populations. There also appear to be variations in clinical practice in the treatment of RDS across the countries, with the Scandinavian countries opting for non-invasive nasal continuous positive airway pressure (CPAP) which reduces the need for surfactant compared with the routine intubation of very preterm babies practised in the USA and also in the UK.
The availability of different forms of expertise can also impact upon drug 4.32 usage. For example, experts in dementia pointed to the existence of psychiatry sub-specialisation in the UK resulting in the development of alternative non-pharmacological treatment and expertise. It was suggested that there is less reliance on psychological therapies in Germany and France leading to higher drug usage. Another example of this would be stroke, where some countries’ services have developed out of neurology and acute care, whereas in the UK services have developed from rehabilitation services, with less emphasis on acute care until recently as a result.
It was also noted that some system configurations and payment 4.33 mechanisms can have an unintended impact on drug usage. For example, ‘supplier-induced demand’ was felt to be a greater issue in the USA because
A report for the Secretary of State for Health by Professor Sir Mike Richards CBE
33
of the payment structures in that country: where suppliers can charge more for delivering a particular treatment, this may provide perverse incentives to prescribe those drugs. In the case of the drugs for rheumatoid arthritis, the clinical experts consulted felt that there was a stronger incentive in the UK to use subcutaneous compounds. However, they considered that the opposite may be true in other countries where there may be financial incentives for providing intravenous drugs in day case units.
Clinical culture
4.34 UK experts reported that, regardless of other influences such as health technology assessment and service organisation, clinical perceptions of the advantages and drawbacks of drugs can also play a major role in determining levels of usage.
4.35 Clinical perceptions are largely shaped by clinical culture within the NHS and feedback suggests that there may be particular cultural factors within the UK which may influence prescribing behaviour. The factors that drive clinical culture are complex and a comprehensive investigation of them is beyond the scope of this study. However, potential explanations offered by experts include differences in medical training compared with other countries, the impact that budget control can have on clinical attitudes, the importance ascribed to ensuring the safety of treatment regimens and the nature of evidence which is deemed acceptable in informing decision making. The extent to which clinical cultures may vary according to setting is also unclear. For example, some clinicians in some hospitals may be more willing to use a drug than those in other organisations.
4.36 Some experts suggested that clinicians in the UK may be more ‘toxicity averse’ than their counterparts in some other countries, and this may result in them taking a different view of whether the benefits of a drug sufficiently outweigh the risks associated with its use in a particular patient. This can particularly affect use in patients who could be considered to be at a higher risk because of toxicity, for example older people or those with co-morbidities. The role that differing clinical attitudes can play, as well as whether these attitudes are always appropriate, merits further investigation.
4.37 For multiple sclerosis, low drug usage in the UK (ranking of 13th, 27% of the all-country average) is thought to be partly explained by a cautious and/or sceptical attitude among some neurologists regarding the benefits of treatment, including its long-term effectiveness and concerns about side effects, alongside selective guidance on use introduced as a result of health technology assessment processes.
4.38 In the area of cancer, clinicians suggested that this aversion to toxicity could explain the low usage of some drugs, such as taxanes. Usage of taxanes is not restricted by NICE but they are perceived to present a higher risk of toxicity than some other forms of treatment. Conversely, this may explain
Extent and causes of international variations in drug usage
34
the relatively high usage of hormonal treatments where overall usage is at or above the international average and the UK has the highest use of three of the 18 hormonal agents (tamoxifen, anastrozole and goserelin). Hormonal agents are administered in primary care and are generally seen to be a less toxic form of treatment for some cancer patients. Perceptions of toxicity are relative and may differ according to the different kinds of drugs used to treat different types of condition.
However, there was not a complete consensus on this issue and there was 4.39 clear acknowledgement that further work to assess the appropriateness of this practice would be helpful.
For cancer drugs licensed between six and 10 years ago, some clinical 4.40 experts had expected use of imatinib and rituximab to be higher than the levels reported (87% and 71% respectively of the all-country averages) given that both drugs receive high levels of clinical support and strong recommendations from NICE. In the case of rituximab, a potential explanation advanced is that in other countries there is greater usage of these drugs outside their licensed indication, but for forms of cancer with a similar biology to that for which they are licensed. In the case of imatinib, experts suggested that higher doses are used in other countries, particularly at the point of progression.
Further work is required to understand whether patient perceptions vary 4.41 according to country and the extent to which any differences in perception influence levels of drug usage. It appears, however, that in the UK patient views are strongly influenced by clinical perceptions and the manner in which the benefits and drawbacks of different treatment options are communicated.
Themes working in combination
In some disease areas, one of the above factors will be the predominant 4.42 explanation for variations in usage. However, in many other areas, these factors operate in combination.
Statins are a good example of where different themes have operated in 4.43 combination to produce a high level of usage. The UK received an overall rank of second, with usage at 138% of the all-country average. Experts have attributed this to the existence of positive NICE guidance – that indicated targeted statin therapy is highly cost effective – combined with the successful implementation of the National Service Framework for Coronary Heart Disease, which gave a high priority to primary and secondary prevention. The role of the Quality and Outcomes Framework of the GP contract in encouraging primary care clinicians to identify and treat patients was considered to have played a major part in this.
There is also strong clinical support for the use of statins, which are generally 4.44 well tolerated by patients, and clinicians in primary care have a great deal of experience of prescribing them.
A report for the Secretary of State for Health by Professor Sir Mike Richards CBE
35
Finally, experts suggested that the high usage of generic statins (simvastatin 4.45 ranked second, with 186% of the all-country average) can be explained by the promotion of clear comparative information on performance, such as the Better Care, Better Value indicators, to encourage the use of generic statins. However, the use of some branded statins, such as atorvastatin, is also high by international standards (ranked third, at 126% of the all-country average). Further details of the level of uptake for statins are given in Table A41 of Annex 3.
Conclusion
There is no single clear determinant of a country’s level of drug usage. There 4.46 appears, however, to be a range of factors which influence the UK’s level of drug usage, as compared with other countries. These encompass health, economic, organisational and cultural issues and will vary according to disease area. A number of areas have been identified as worthy of further investigation.
Extent and causes of international variations in drug usage
36
5 Next steps
As set out in Chapter 1, the work outlined in this report represents the 5.1 most extensive attempt yet to assess the extent of international variations in drug usage and to understand their causes. It is hoped that the findings presented in this study and future iterations will be useful to all those with a stake in improving services in the disease areas which have been studied, informing the development of policy and practice, as well as assisting with the evaluation of changes which have been introduced.
However, the report also represents the first iteration of a new approach, 5.2 encompassing a variety of sources of data and expert opinion. As such, it is intended to provoke discussion, encourage further research and be used as a starting point for future iterations. Stakeholders are encouraged to submit views to the mailbox: [email protected]
The steering group has identified a range of next steps to be undertaken 5.3 as part of the project. Issues have also been identified which may be outside the initial scope of this project but which nonetheless merit further exploration.
The suggested next steps cover a number of areas, including:5.4
improving further the methodology for measuring the extent of usage in •countries, for example through establishing an equivalent measure to DDDs for disease areas where one does not exist and by increasing the coverage of sales data provided by manufacturers to triangulate with IMS Health data;
encouraging further comment from experts in the UK and expanding the •range of stakeholders engaged with the project;
engaging with international experts to gain their perspectives on the data •and potential explanations for variations;
considering the case for broadening the dataset to include other conditions, •such as diabetes, chronic respiratory conditions and kidney disease;
deepening the study to provide retrospective longitudinal data for some •conditions where significant changes in usage are suspected of taking place (for example, statins or acute MI), as well as undertaking ‘high-resolution’ studies for certain disease areas, examining how the interplay between different drugs will affect usage (for example, whether the usage of cancer hormones impacts upon the usage of other forms of cancer drug);
mapping the health technology assessment status of drugs included in the •study in other countries so as to extend the analysis of the extent to which health technology assessment is a factor in explaining variations; and
A report for the Secretary of State for Health by Professor Sir Mike Richards CBE
37
examining in more detail the extent to which the factors set out in Chapter •4 impact upon drug usage, for example by examining differences in health technology appraisal processes and outcomes, clinical culture, and system planning and organisation.
Consideration should also be given to the alignment of the work of this 5.5 project with that of the domestic metrics working group, established as a result of the PPRS to examine the level of domestic usage of a selection of medicines which have received a positive NICE technology appraisal. Although the remit of the international variations project is wider, encompassing drugs with both positive and negative recommendations from NICE, as well as those which have never been appraised, the steering group feels that there are clear opportunities to share methodologies and insights.
The PPRS includes a commitment to continue measuring the extent of 5.6 international variations in drug usage and this will be taken forward through the continuation of this project.
Extent and causes of international variations in drug usage
38
Annex 1: Project steering group
Note: Job titles and organisation names are those that applied at the time of involvement with this study.
Steering group co-chairsProfessor Sir Mike Richards, National Cancer Director•John Melville, General Manager, Roche UK•
Steering group core members Nick Baillie, Programme Manager – Uptake and Evaluation, National Institute for •Health and Clinical Excellence (NICE)Dr Chris Deighton, Consultant Rheumatologist, Derby Hospitals NHS •Foundation TrustNatacha Deschamps-Smith, Commercial Manager – Pricing and Access, •Association of the British Pharmaceutical IndustrySimon Jose, General Manager and Senior Vice President, GlaxoSmithKline UK•Val Moore, Implementation Director, NICE•Simon Reeve/Danny Palnoch (shared seat), Medicines, Pharmacy and Industry, •Department of Health Martin Stephens, National Clinical Director – Hospital Pharmacy•Jon Sussex, Deputy Director, Office of Health Economics •Madeleine Wang, Patient Representative and Lay Member•Mark Wilkinson, National Programme Director – NHS and the Pharmaceutical •Industry, Office of the Strategic Health Authorities
Steering group advisersMonica Jones, Head of Architecture and Standards, The Information Centre for •Health and Social CareDr Ellen Nolte, Director – Health and Healthcare, RAND Europe•Peter Stephens, Vice President – European Public Health Affairs, IMS Health•
SecretariatMargaret Stanton, Gillian Baker and Paul Woods, Department of Health•
A report for the Secretary of State for Health by Professor Sir Mike Richards CBE
39
Annex 2: List of individuals and organisations that submitted comments or data
The following individuals and organisations are thanked for contributing comments and/or data.
Note: Job titles and organisation names are those that applied at the time of involvement with this study.
Clinicians, pharmacists and public health specialistsDr David Anderson, Associate Medical Director/Consultant Old Age Psychiatrist, •Mersey Care NHS TrustProfessor Louis Appleby, National Clinical Director for Mental Health/Professor •of Psychiatry, University of ManchesterMegan Burgess, Multiple Sclerosis Nurse Consultant, Greater Manchester •Neurosciences Centre, Salford Royal NHS Foundation TrustProfessor Alistair Burns, National Clinical Director for Dementia/School of •Medicine, University of ManchesterDr Chris Clough, Consultant Neurologist, King’s College Hospital NHS •Foundation TrustDr Bob Coates, Consultant in Public Health, Southampton City Primary •Care TrustProfessor Juliet Compston, Professor of Bone Medicine and Honorary •Consultant Physician, School of Clinical Medicine, University of Cambridge and Addenbrooke’s HospitalDr Chris Deighton, Consultant Rheumatologist, Derby Hospitals NHS •Foundation TrustDr Sanjeev Deshpande, Consultant Neonatologist, Royal Shrewsbury Hospital •Professor Graham Foster, Professor of Hepatology, Queen Mary’s School of •MedicineDr Stephen Green, Consultant for the Heart Team, Department of Health•Professor Ian Judson, Medical Oncologist, The Royal Marsden NHS •Foundation TrustProfessor Shôn Lewis, Professor of Adult Psychiatry and Head of the School •of Medicine, University of ManchesterProfessor Christopher McCabe, Head of the Academic Unit of Health •Economics, University of LeedsProfessor Eugene McCloskey, Professor of Adult Bone Disease, Academic Unit •of Bone Metabolism and World Health Organization Collaborating Centre for Metabolic Bone Diseases, University of SheffieldProfessor Mike McKendrick, Department of Infection and Tropical Medicine, •Royal Hallamshire Hospital, Sheffield Teaching Hospitals NHS Foundation TrustPaul McManus, Pharmacist Adviser, Yorkshire and the Humber Specialised •Commissioning GroupProfessor David Miller, Institute of Neurology, University College London •
Extent and causes of international variations in drug usage
40
Paul Mitchell, Associate Lecturer, Faculty of Education, Health and Sciences, •University of DerbyDr James Moon, The Heart Hospital, University College London Hospitals NHS •Foundation Trust Professor Adrian Newland, Lead of the Academic Haematology Unit, Institute •of Cell and Molecular Science, The London School of Medicine and DentistryProfessor John O’Brien, Professor of Old Age Psychiatry, Institute for Ageing •and Health, Newcastle UniversityDr Christopher Price, Stroke Physician, Northumbria Healthcare NHS •Foundation TrustDr Mary Ramsay, Health Protection Agency •Dr Richard Richards, Assistant Director of Public Health, NHS Derbyshire •CountyDr Tony Rudd, Consultant Physician in Stroke Medicine, St Thomas’ Hospital•Dr Sophia Steer, Consultant Rheumatologist, King’s College Hospital NHS •Foundation TrustAlison Tennant, Specialist Pharmacist in Public Health, Dudley Primary Care Trust•Professor Howard C Thomas, Professor of Medicine and Head of the •Department of Hepatology and Gastroenterology, Imperial College LondonDr Richard Thwaites, Consultant Neonatologist, Portsmouth City Teaching •Hospitals NHS TrustAdnan Tufail, Consultant Ophthalmologist, Medical Retina Service, Moorfields •Eye Hospital NHS Foundation Trust/Honorary Senior Lecturer, Institute of Ophthalmology, University College LondonTed Wozniak, Professional Adviser – Child Health, Department of Health•
Patients and patient representative groupsAlzheimer’s Society•Bliss•Breakthrough Breast Cancer•British Heart Foundation•Cancer Research UK•Roy Castle Lung Cancer Foundation•Hepatitis C Trust•Macmillan Cancer Support•Macular Disease Society•Mind•MS Society•MS Trust•Myeloma UK•NRAS (National Rheumatoid Arthritis Society) •Pulmonary Hypertension Association UK•Roger Wilson (patient expert – cancer)•
A report for the Secretary of State for Health by Professor Sir Mike Richards CBE
41
Pharmaceutical companies and pharmaceutical industry groupsAbbott Laboratories Ltd•Actavis UK Ltd•Amgen Ltd•AstraZeneca•Baxter Healthcare Ltd•Bayer•Boehringer Ingelheim Ltd•Bristol-Myers Squibb•Celgene Ltd•Chiesi Ltd•Eisai Ltd•Eli Lilly and Company Ltd•GlaxoSmithKline plc•Johnson & Johnson MSD (McNeil Healthcare (UK) Ltd)•Lundbeck Ltd•Merck Serono Ltd•Novartis Pharmaceuticals UK Ltd•Pfizer Ltd•Roche Ltd•Sanofi-aventis UK•Schering-Plough Ltd•Shire plc•Wyeth UK •
American Pharmaceutical Group (APG)•Association of the British Pharmaceutical Industry (ABPI)•European Medicines Group (EMG)•Heads of Europe, European Federation of Pharmaceutical Industries and •Associations (EFPIA)Japanese Pharmaceutical Group (JPG)•
Extent and causes of international variations in drug usage
42
Annex 3: Detailed data on international levels of drug usage
Contents
Acknowledgements ........................................................................................... 43
Notes on the tables ............................................................................................ 43
Acute myocardial infarction .............................................................................. 44
Cancer ...................................................................................................................•Drugs launched within the last five years ..................................................•Drugs launched six to 10 years ago ..........................................................•Drugs launched more than 10 years ago ..................................................•Hormonal drugs ..............................................................................................
4545474951
Dementia .............................................................................................................. 53
Hepatitis C ........................................................................................................... 55
Multiple sclerosis ................................................................................................ 56
Osteoporosis ....................................................................................................... 58
Respiratory distress syndrome ....................................................................... 59
Respiratory syncytial virus ................................................................................ 60
Rheumatoid arthritis ........................................................................................... 61
Second-generation antipsychotic drugs ....................................................... 63
Statins ................................................................................................................... 64
Stroke .................................................................................................................... 66
Wet age-related macular degeneration ........................................................ 66
A report for the Secretary of State for Health by Professor Sir Mike Richards CBE
43
Acknowledgements
The tables presented in this annex are drawn from IMS Health data and, where it was supplied, IMS Health’s analysis of manufacturers’ data.
Notes on the tables
For all non-cancer drugs, the rankings and UK usage rates as a percentage 1 of the country group averages are measured in terms of defined daily doses (DDDs), or, where these are not available, the maximum or prescribed daily dose. The drug group rankings and usage rates are consequently weighted according to absolute volume usage.
For cancer drugs, where it has not been possible to determine DDDs, the 2 rankings and UK usage rates as a percentage of the country group averages are measured in terms of drug volumes. The overall ranking for each group is a ‘rank of ranks’, ie the average rankings for each drug have themselves been ranked. This method of ranking gives equal weight to each drug in a group, irrespective of its absolute volume use.
The European 5 countries are France, Germany, Italy, Spain and the UK.3
The European 10 countries are the European 5 plus Austria, Denmark, 4 Norway, Sweden and Switzerland.
All countries (14) are the European 10 plus Australia, Canada, New Zealand 5 and the USA.
Drugs that are not used in the UK are indicated in the tables with the symbol *.6 The same symbol has been used to indicate country groups in which the drug is not used.
The designation ‘P’ or ‘C’ denotes whether the drug presentation is ‘plain’, 7 ie a single drug molecule, or ‘combination’, ie the specified drug molecule in combination with another.
The ranking of drugs that are not used in the UK is expressed in 8 parentheses. By convention, this ‘ranking’, applied equally to all countries in which the drug is not used, is equal to n+1, where n is the number of countries in which the drug is used.
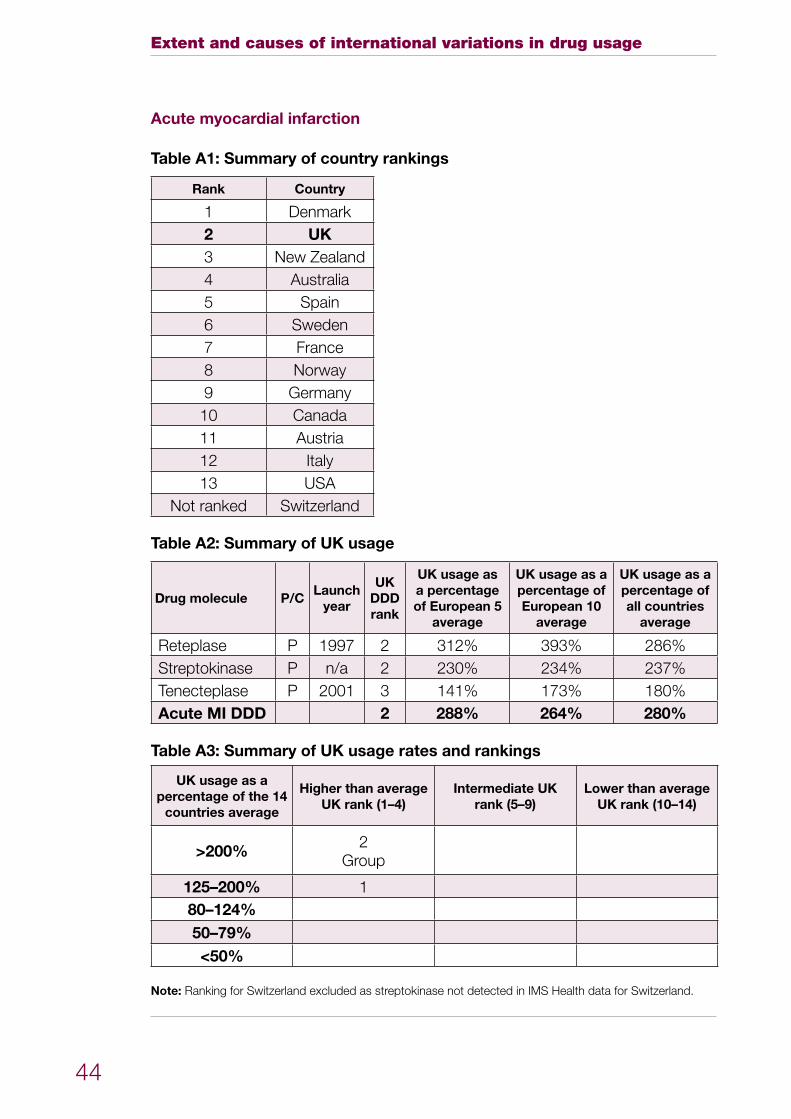
Extent and causes of international variations in drug usage
44
Acute myocardial infarction
Table A1: Summary of country rankings
Rank Country
1 Denmark2 UK3 New Zealand4 Australia5 Spain6 Sweden7 France8 Norway9 Germany10 Canada11 Austria12 Italy13 USA
Not ranked Switzerland
Table A2: Summary of UK usage
Drug molecule P/CLaunch
year
UK DDD rank
UK usage as a percentage of European 5
average
UK usage as a percentage of European 10
average
UK usage as a percentage of all countries
average
Reteplase P 1997 2 312% 393% 286%Streptokinase P n/a 2 230% 234% 237%Tenecteplase P 2001 3 141% 173% 180%Acute MI DDD 2 288% 264% 280%
Table A3: Summary of UK usage rates and rankings
UK usage as a percentage of the 14
countries average
Higher than average UK rank (1–4)
Intermediate UK rank (5–9)
Lower than average UK rank (10–14)
>200% 2Group
125–200% 180–124%50–79%<50%
Note: Ranking for Switzerland excluded as streptokinase not detected in IMS Health data for Switzerland.
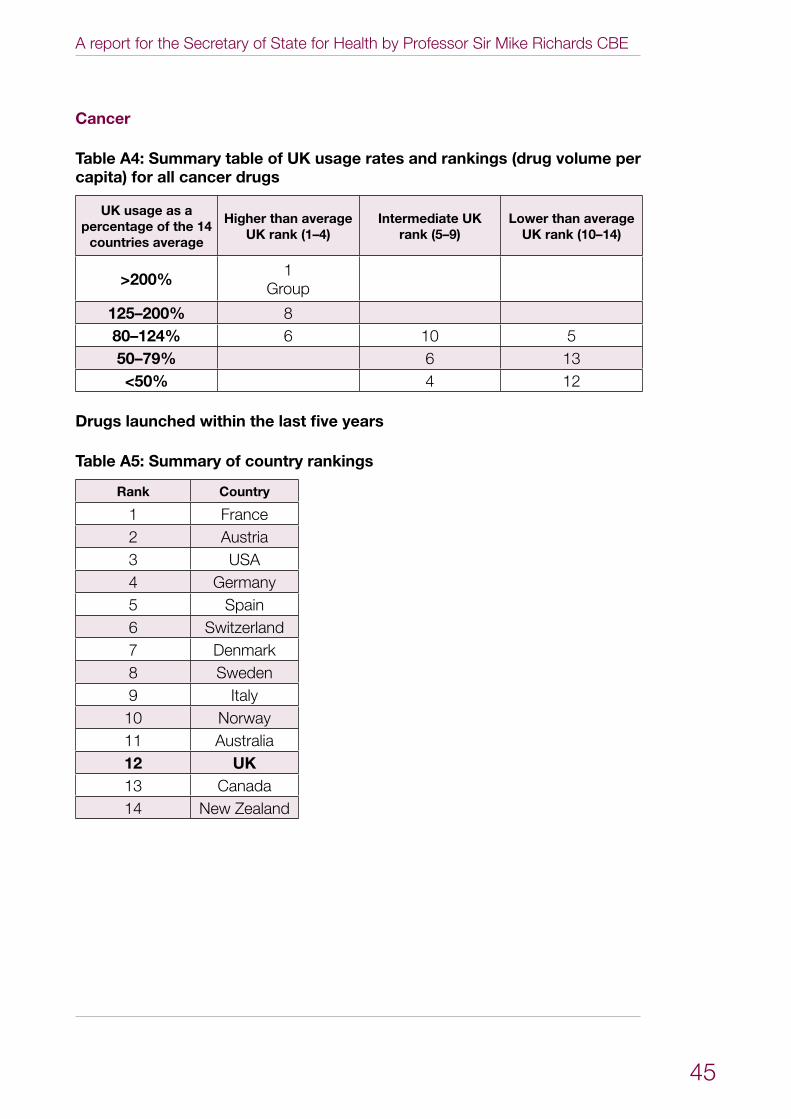
A report for the Secretary of State for Health by Professor Sir Mike Richards CBE
45
Cancer
Table A4: Summary table of UK usage rates and rankings (drug volume per capita) for all cancer drugs
UK usage as a percentage of the 14
countries average
Higher than average UK rank (1–4)
Intermediate UK rank (5–9)
Lower than average UK rank (10–14)
>200% 1Group
125–200% 880–124% 6 10 550–79% 6 13<50% 4 12
Drugs launched within the last five years
Table A5: Summary of country rankings
Rank Country
1 France2 Austria3 USA4 Germany5 Spain6 Switzerland7 Denmark8 Sweden9 Italy10 Norway11 Australia12 UK13 Canada14 New Zealand
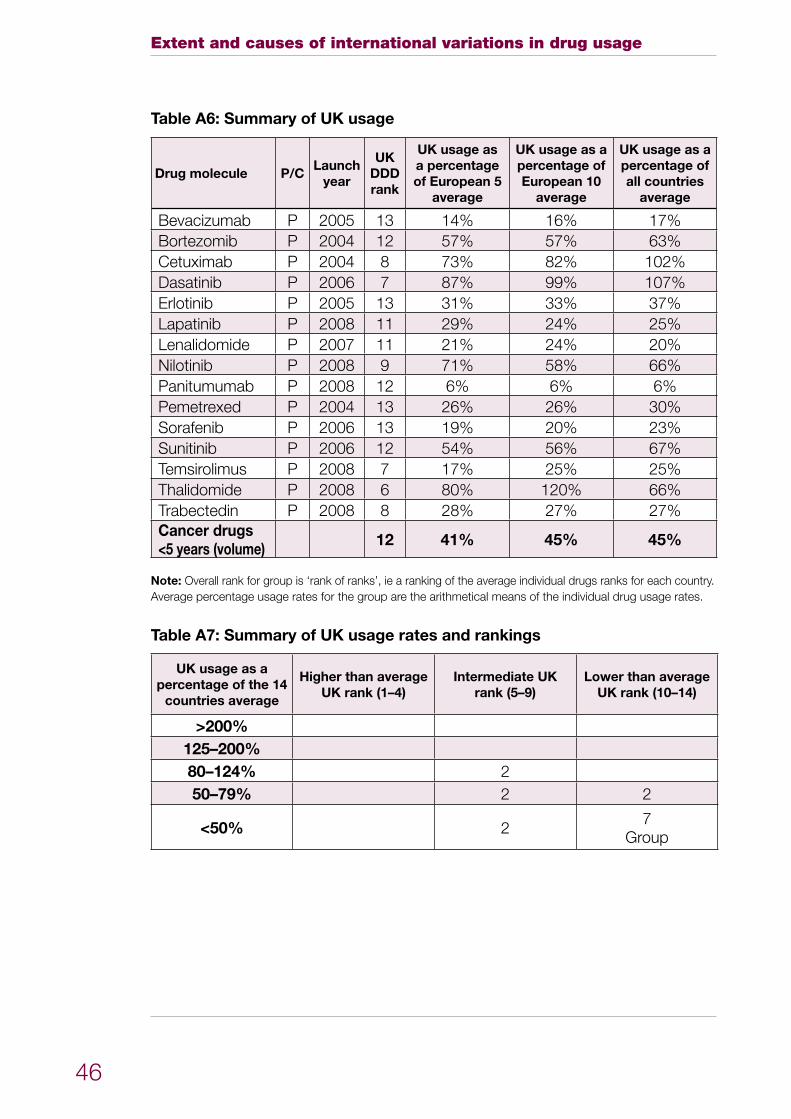
Extent and causes of international variations in drug usage
46
Table A6: Summary of UK usage
Drug molecule P/CLaunch
year
UK DDD rank
UK usage as a percentage of European 5
average
UK usage as a percentage of European 10
average
UK usage as a percentage of all countries
average
Bevacizumab P 2005 13 14% 16% 17%Bortezomib P 2004 12 57% 57% 63%Cetuximab P 2004 8 73% 82% 102%Dasatinib P 2006 7 87% 99% 107%Erlotinib P 2005 13 31% 33% 37%Lapatinib P 2008 11 29% 24% 25%Lenalidomide P 2007 11 21% 24% 20%Nilotinib P 2008 9 71% 58% 66%Panitumumab P 2008 12 6% 6% 6%Pemetrexed P 2004 13 26% 26% 30%Sorafenib P 2006 13 19% 20% 23%Sunitinib P 2006 12 54% 56% 67%Temsirolimus P 2008 7 17% 25% 25%Thalidomide P 2008 6 80% 120% 66%Trabectedin P 2008 8 28% 27% 27%Cancer drugs <5 years (volume) 12 41% 45% 45%
Note: Overall rank for group is ‘rank of ranks’, ie a ranking of the average individual drugs ranks for each country. Average percentage usage rates for the group are the arithmetical means of the individual drug usage rates.
Table A7: Summary of UK usage rates and rankings
UK usage as a percentage of the 14
countries average
Higher than average UK rank (1–4)
Intermediate UK rank (5–9)
Lower than average UK rank (10–14)
>200%125–200%80–124% 250–79% 2 2
<50% 2 7Group
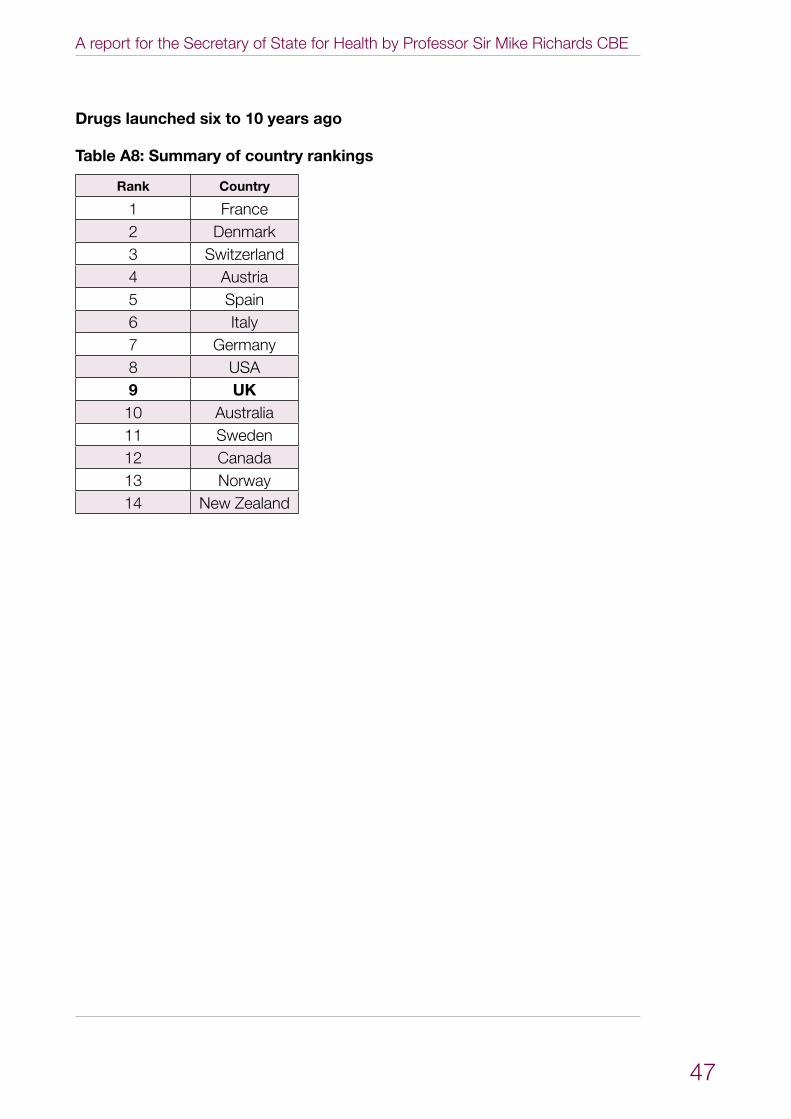
A report for the Secretary of State for Health by Professor Sir Mike Richards CBE
47
Drugs launched six to 10 years ago
Table A8: Summary of country rankings
Rank Country
1 France2 Denmark3 Switzerland4 Austria5 Spain6 Italy7 Germany8 USA9 UK10 Australia11 Sweden12 Canada13 Norway14 New Zealand
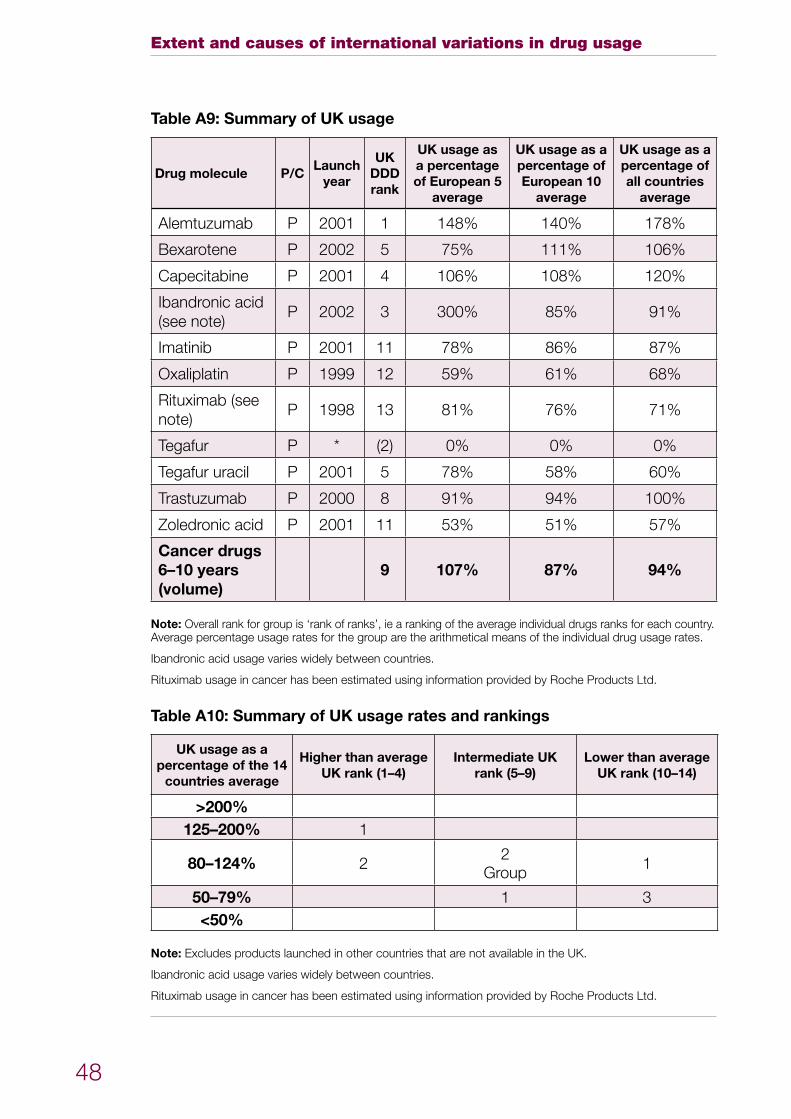
Extent and causes of international variations in drug usage
48
Table A9: Summary of UK usage
Drug molecule P/CLaunch
year
UK DDD rank
UK usage as a percentage of European 5
average
UK usage as a percentage of European 10
average
UK usage as a percentage of all countries
average
Alemtuzumab P 2001 1 148% 140% 178%
Bexarotene P 2002 5 75% 111% 106%
Capecitabine P 2001 4 106% 108% 120%
Ibandronic acid (see note)
P 2002 3 300% 85% 91%
Imatinib P 2001 11 78% 86% 87%
Oxaliplatin P 1999 12 59% 61% 68%
Rituximab (see note)
P 1998 13 81% 76% 71%
Tegafur P * (2) 0% 0% 0%
Tegafur uracil P 2001 5 78% 58% 60%
Trastuzumab P 2000 8 91% 94% 100%
Zoledronic acid P 2001 11 53% 51% 57%
Cancer drugs 6–10 years (volume)
9 107% 87% 94%
Note: Overall rank for group is ‘rank of ranks’, ie a ranking of the average individual drugs ranks for each country. Average percentage usage rates for the group are the arithmetical means of the individual drug usage rates.
Ibandronic acid usage varies widely between countries.
Rituximab usage in cancer has been estimated using information provided by Roche Products Ltd.
Table A10: Summary of UK usage rates and rankings
UK usage as a percentage of the 14
countries average
Higher than average UK rank (1–4)
Intermediate UK rank (5–9)
Lower than average UK rank (10–14)
>200%125–200% 1
80–124% 2 2Group 1
50–79% 1 3<50%
Note: Excludes products launched in other countries that are not available in the UK.
Ibandronic acid usage varies widely between countries.
Rituximab usage in cancer has been estimated using information provided by Roche Products Ltd.
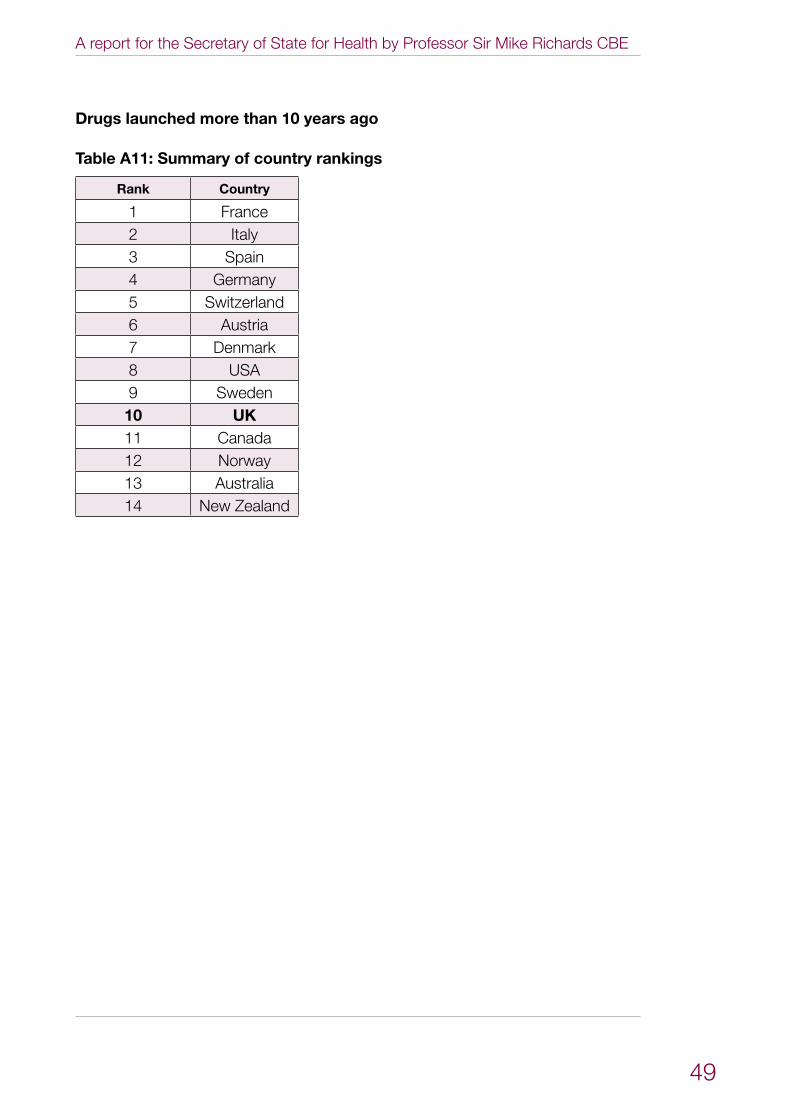
A report for the Secretary of State for Health by Professor Sir Mike Richards CBE
49
Drugs launched more than 10 years ago
Table A11: Summary of country rankings
Rank Country
1 France2 Italy3 Spain4 Germany5 Switzerland6 Austria7 Denmark8 USA9 Sweden10 UK11 Canada12 Norway13 Australia14 New Zealand
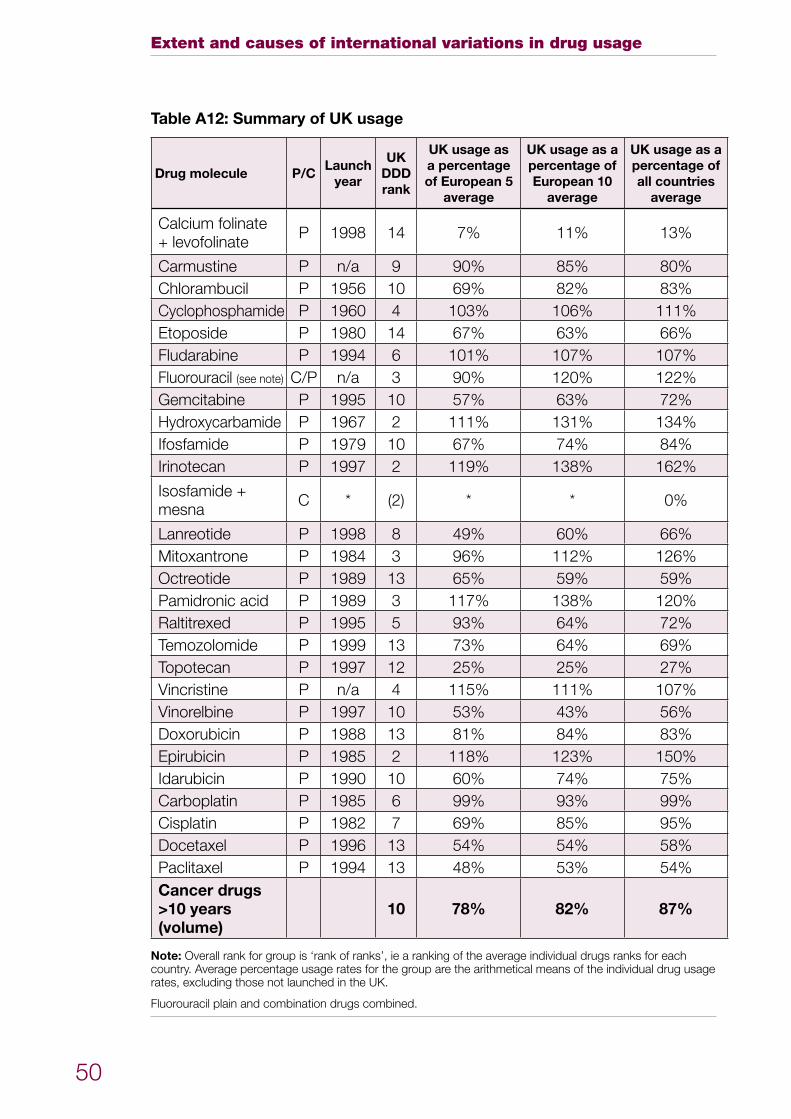
Extent and causes of international variations in drug usage
50
Table A12: Summary of UK usage
Drug molecule P/CLaunch
year
UK DDD rank
UK usage as a percentage of European 5
average
UK usage as a percentage of European 10
average
UK usage as a percentage of all countries
average
Calcium folinate + levofolinate P 1998 14 7% 11% 13%
Carmustine P n/a 9 90% 85% 80%Chlorambucil P 1956 10 69% 82% 83%Cyclophosphamide P 1960 4 103% 106% 111%Etoposide P 1980 14 67% 63% 66%Fludarabine P 1994 6 101% 107% 107%Fluorouracil (see note) C/P n/a 3 90% 120% 122%Gemcitabine P 1995 10 57% 63% 72%Hydroxycarbamide P 1967 2 111% 131% 134%Ifosfamide P 1979 10 67% 74% 84%Irinotecan P 1997 2 119% 138% 162%
Isosfamide + mesna C * (2) * * 0%
Lanreotide P 1998 8 49% 60% 66%Mitoxantrone P 1984 3 96% 112% 126%Octreotide P 1989 13 65% 59% 59%Pamidronic acid P 1989 3 117% 138% 120%Raltitrexed P 1995 5 93% 64% 72%Temozolomide P 1999 13 73% 64% 69%Topotecan P 1997 12 25% 25% 27%Vincristine P n/a 4 115% 111% 107%Vinorelbine P 1997 10 53% 43% 56%Doxorubicin P 1988 13 81% 84% 83%Epirubicin P 1985 2 118% 123% 150%Idarubicin P 1990 10 60% 74% 75%Carboplatin P 1985 6 99% 93% 99%Cisplatin P 1982 7 69% 85% 95%Docetaxel P 1996 13 54% 54% 58%Paclitaxel P 1994 13 48% 53% 54%Cancer drugs >10 years (volume)
10 78% 82% 87%
Note: Overall rank for group is ‘rank of ranks’, ie a ranking of the average individual drugs ranks for each country. Average percentage usage rates for the group are the arithmetical means of the individual drug usage rates, excluding those not launched in the UK.
Fluorouracil plain and combination drugs combined.
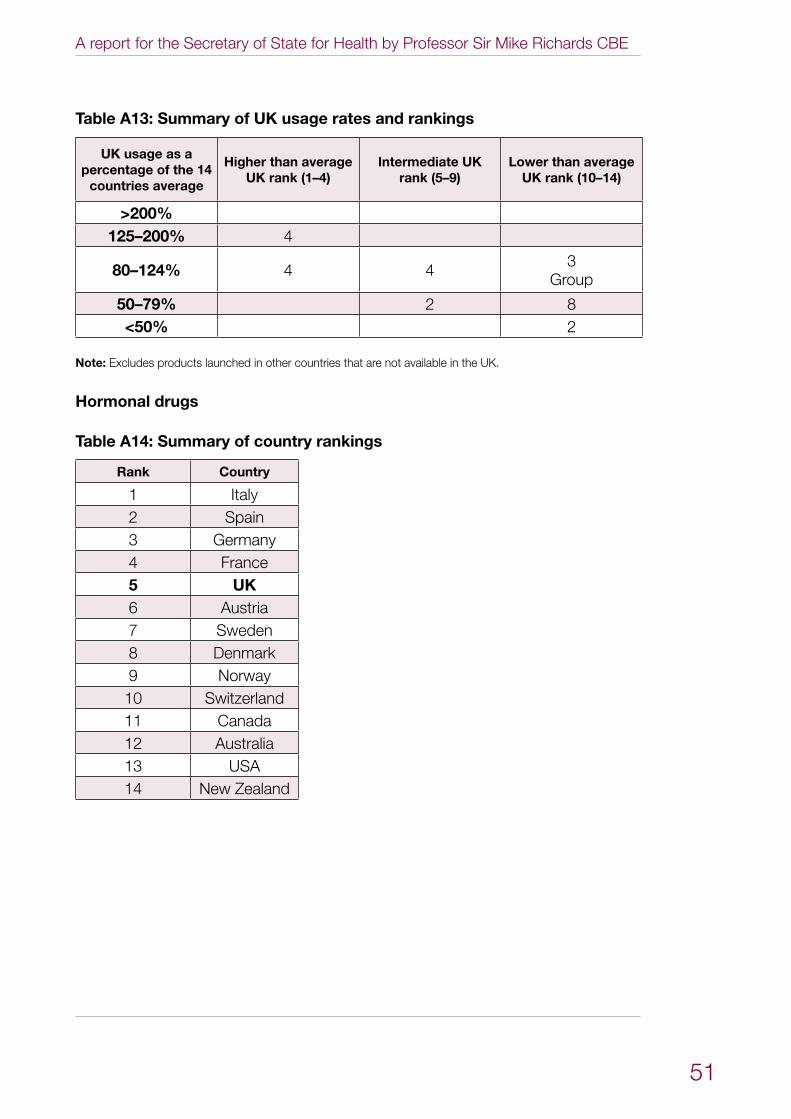
A report for the Secretary of State for Health by Professor Sir Mike Richards CBE
51
Table A13: Summary of UK usage rates and rankings
UK usage as a percentage of the 14
countries average
Higher than average UK rank (1–4)
Intermediate UK rank (5–9)
Lower than average UK rank (10–14)
>200%125–200% 4
80–124% 4 4 3 Group
50–79% 2 8<50% 2
Note: Excludes products launched in other countries that are not available in the UK.
Hormonal drugs
Table A14: Summary of country rankings
Rank Country
1 Italy2 Spain3 Germany4 France5 UK6 Austria7 Sweden8 Denmark9 Norway10 Switzerland11 Canada12 Australia13 USA14 New Zealand
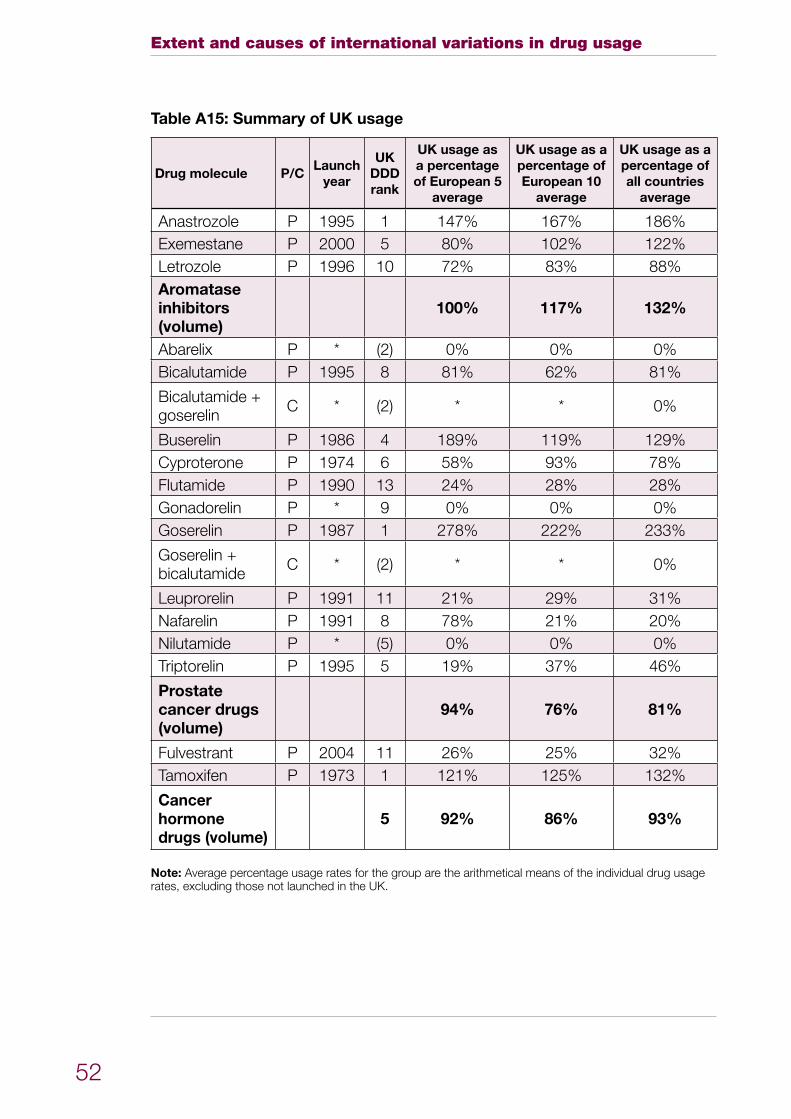
Extent and causes of international variations in drug usage
52
Table A15: Summary of UK usage
Drug molecule P/CLaunch
year
UK DDD rank
UK usage as a percentage of European 5
average
UK usage as a percentage of European 10
average
UK usage as a percentage of all countries
average
Anastrozole P 1995 1 147% 167% 186%Exemestane P 2000 5 80% 102% 122%Letrozole P 1996 10 72% 83% 88%Aromatase inhibitors (volume)
100% 117% 132%
Abarelix P * (2) 0% 0% 0%Bicalutamide P 1995 8 81% 62% 81%
Bicalutamide + goserelin C * (2) * * 0%
Buserelin P 1986 4 189% 119% 129%Cyproterone P 1974 6 58% 93% 78%Flutamide P 1990 13 24% 28% 28%Gonadorelin P * 9 0% 0% 0%Goserelin P 1987 1 278% 222% 233%
Goserelin + bicalutamide C * (2) * * 0%
Leuprorelin P 1991 11 21% 29% 31%Nafarelin P 1991 8 78% 21% 20%Nilutamide P * (5) 0% 0% 0%Triptorelin P 1995 5 19% 37% 46%
Prostate cancer drugs (volume)
94% 76% 81%
Fulvestrant P 2004 11 26% 25% 32%Tamoxifen P 1973 1 121% 125% 132%
Cancer hormone drugs (volume)
5 92% 86% 93%
Note: Average percentage usage rates for the group are the arithmetical means of the individual drug usage rates, excluding those not launched in the UK.
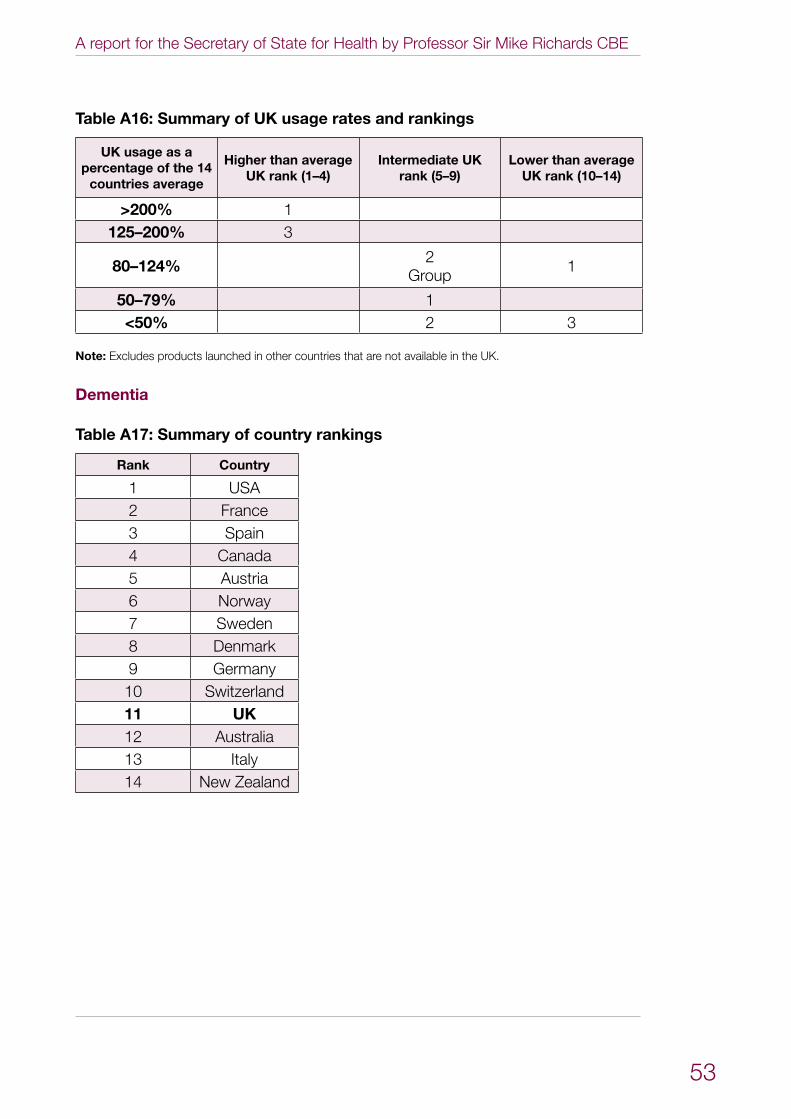
A report for the Secretary of State for Health by Professor Sir Mike Richards CBE
53
Table A16: Summary of UK usage rates and rankings
UK usage as a percentage of the 14
countries average
Higher than average UK rank (1–4)
Intermediate UK rank (5–9)
Lower than average UK rank (10–14)
>200% 1125–200% 3
80–124% 2Group 1
50–79% 1<50% 2 3
Note: Excludes products launched in other countries that are not available in the UK.
Dementia
Table A17: Summary of country rankings
Rank Country
1 USA2 France3 Spain4 Canada5 Austria6 Norway7 Sweden8 Denmark9 Germany10 Switzerland11 UK12 Australia13 Italy14 New Zealand
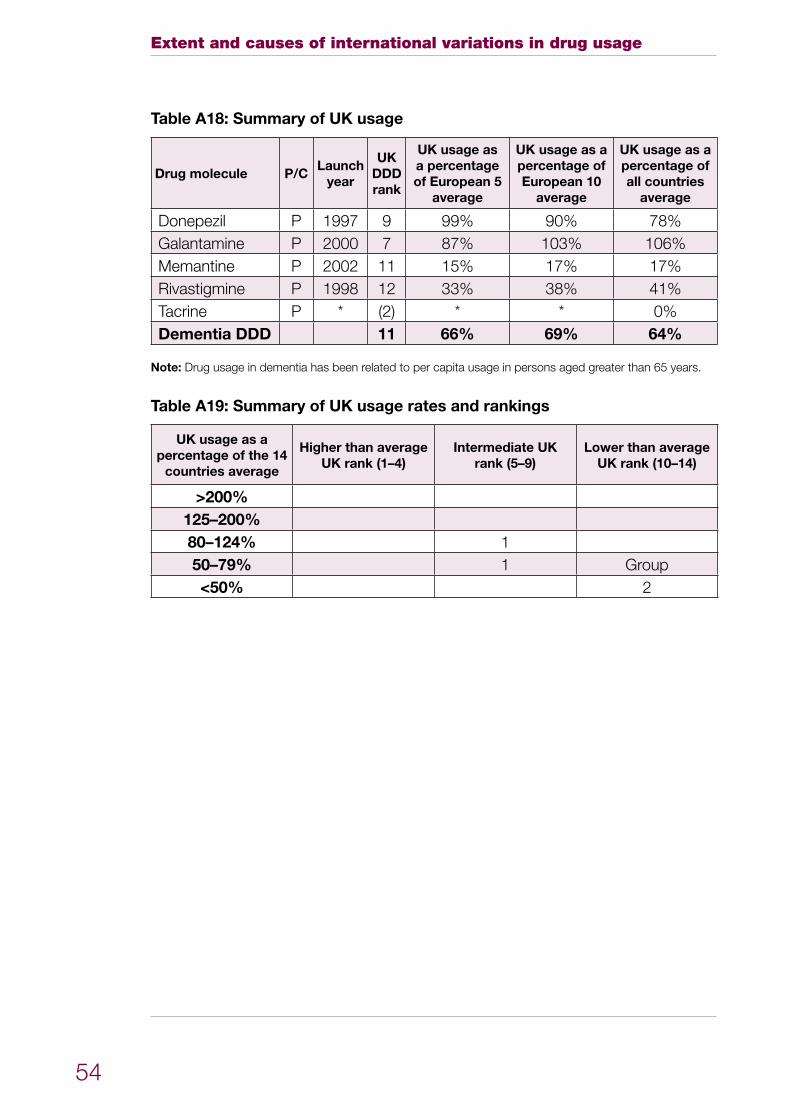
Extent and causes of international variations in drug usage
54
Table A18: Summary of UK usage
Drug molecule P/CLaunch
year
UK DDD rank
UK usage as a percentage of European 5
average
UK usage as a percentage of European 10
average
UK usage as a percentage of all countries
average
Donepezil P 1997 9 99% 90% 78%Galantamine P 2000 7 87% 103% 106%Memantine P 2002 11 15% 17% 17%Rivastigmine P 1998 12 33% 38% 41%Tacrine P * (2) * * 0%Dementia DDD 11 66% 69% 64%
Note: Drug usage in dementia has been related to per capita usage in persons aged greater than 65 years.
Table A19: Summary of UK usage rates and rankings
UK usage as a percentage of the 14
countries average
Higher than average UK rank (1–4)
Intermediate UK rank (5–9)
Lower than average UK rank (10–14)
>200%125–200%80–124% 150–79% 1 Group<50% 2
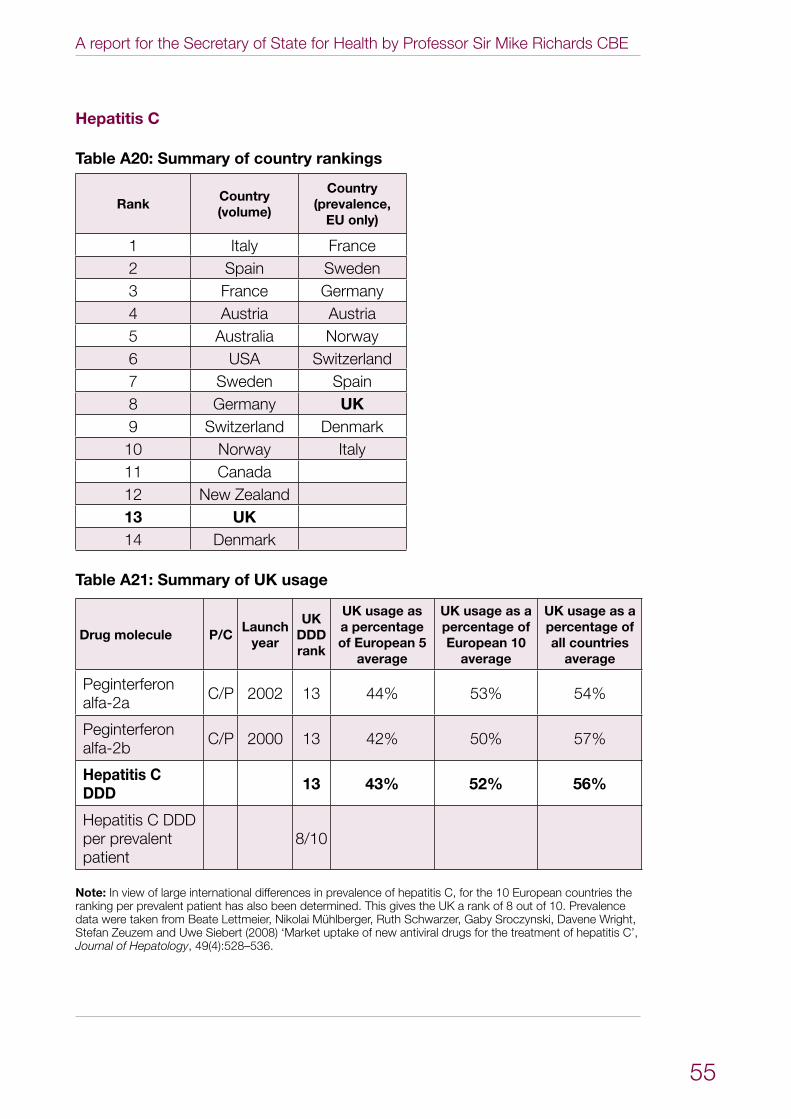
A report for the Secretary of State for Health by Professor Sir Mike Richards CBE
55
Hepatitis C
Table A20: Summary of country rankings
RankCountry (volume)
Country (prevalence,
EU only)
1 Italy France2 Spain Sweden3 France Germany4 Austria Austria5 Australia Norway6 USA Switzerland7 Sweden Spain8 Germany UK9 Switzerland Denmark10 Norway Italy11 Canada12 New Zealand13 UK14 Denmark
Table A21: Summary of UK usage
Drug molecule P/CLaunch
year
UK DDD rank
UK usage as a percentage of European 5
average
UK usage as a percentage of European 10
average
UK usage as a percentage of all countries
average
Peginterferon alfa-2a C/P 2002 13 44% 53% 54%
Peginterferon alfa-2b C/P 2000 13 42% 50% 57%
Hepatitis C DDD 13 43% 52% 56%
Hepatitis C DDD per prevalent patient
8/10
Note: In view of large international differences in prevalence of hepatitis C, for the 10 European countries the ranking per prevalent patient has also been determined. This gives the UK a rank of 8 out of 10. Prevalence data were taken from Beate Lettmeier, Nikolai Mühlberger, Ruth Schwarzer, Gaby Sroczynski, Davene Wright, Stefan Zeuzem and Uwe Siebert (2008) ‘Market uptake of new antiviral drugs for the treatment of hepatitis C’, Journal of Hepatology, 49(4):528–536.
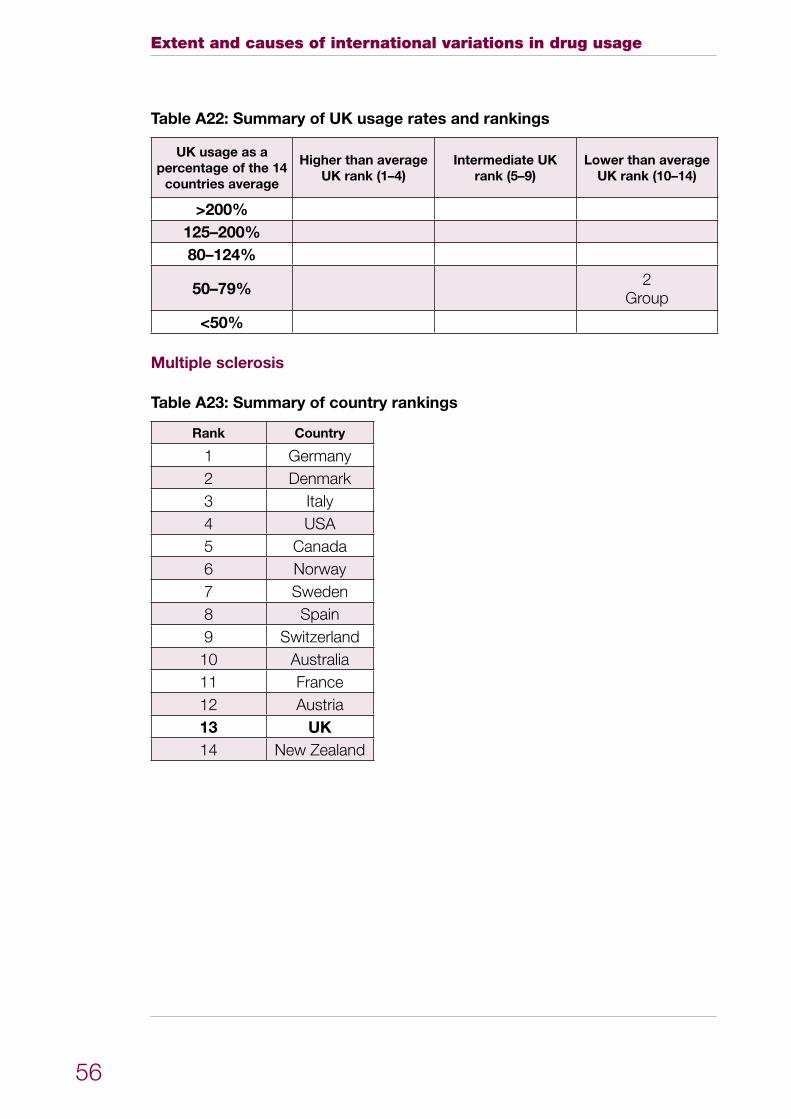
Extent and causes of international variations in drug usage
56
Table A22: Summary of UK usage rates and rankings
UK usage as a percentage of the 14
countries average
Higher than average UK rank (1–4)
Intermediate UK rank (5–9)
Lower than average UK rank (10–14)
>200%125–200%80–124%
50–79% 2Group
<50%
Multiple sclerosis
Table A23: Summary of country rankings
Rank Country
1 Germany2 Denmark3 Italy4 USA5 Canada6 Norway7 Sweden8 Spain9 Switzerland10 Australia11 France12 Austria13 UK14 New Zealand
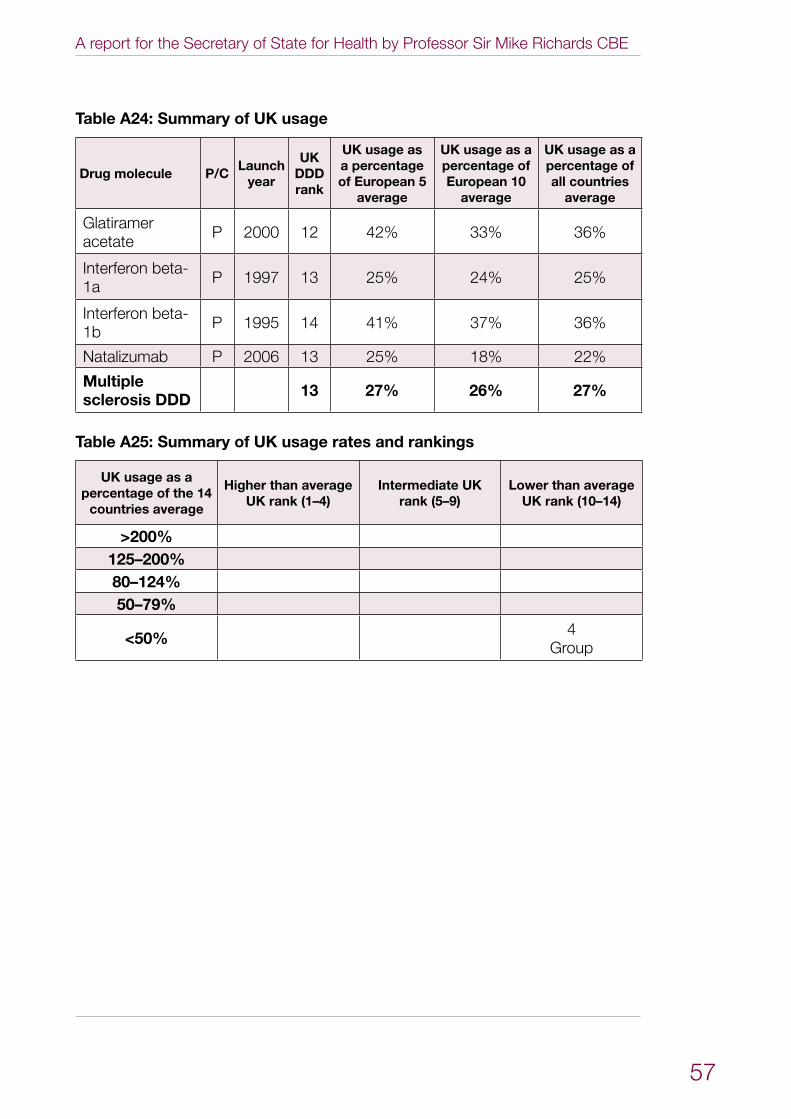
A report for the Secretary of State for Health by Professor Sir Mike Richards CBE
57
Table A24: Summary of UK usage
Drug molecule P/CLaunch
year
UK DDD rank
UK usage as a percentage of European 5
average
UK usage as a percentage of European 10
average
UK usage as a percentage of all countries
average
Glatiramer acetate P 2000 12 42% 33% 36%
Interferon beta-1a P 1997 13 25% 24% 25%
Interferon beta-1b P 1995 14 41% 37% 36%
Natalizumab P 2006 13 25% 18% 22%
Multiple sclerosis DDD 13 27% 26% 27%
Table A25: Summary of UK usage rates and rankings
UK usage as a percentage of the 14
countries average
Higher than average UK rank (1–4)
Intermediate UK rank (5–9)
Lower than average UK rank (10–14)
>200%125–200%80–124%50–79%
<50% 4Group
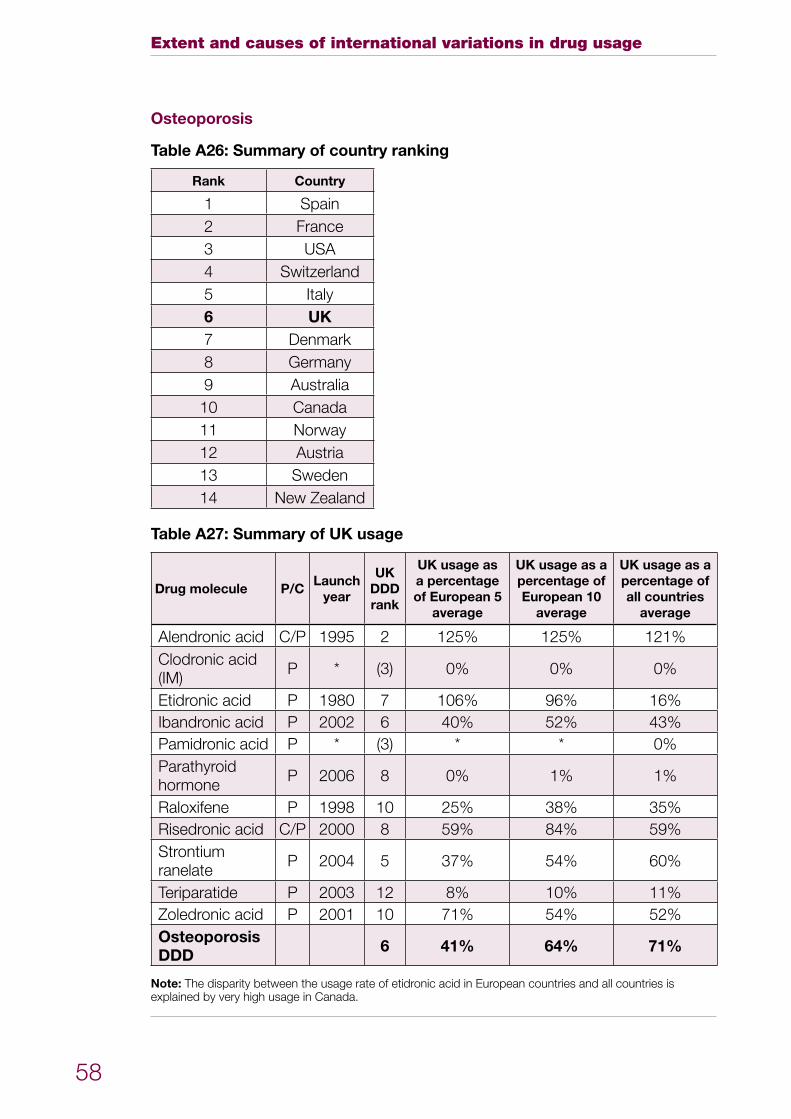
Extent and causes of international variations in drug usage
58
Osteoporosis
Table A26: Summary of country ranking
Rank Country
1 Spain2 France3 USA4 Switzerland5 Italy6 UK7 Denmark8 Germany9 Australia10 Canada11 Norway12 Austria13 Sweden14 New Zealand
Table A27: Summary of UK usage
Drug molecule P/CLaunch
year
UK DDD rank
UK usage as a percentage of European 5
average
UK usage as a percentage of European 10
average
UK usage as a percentage of all countries
average
Alendronic acid C/P 1995 2 125% 125% 121%Clodronic acid (IM) P * (3) 0% 0% 0%
Etidronic acid P 1980 7 106% 96% 16%Ibandronic acid P 2002 6 40% 52% 43%Pamidronic acid P * (3) * * 0%Parathyroid hormone P 2006 8 0% 1% 1%
Raloxifene P 1998 10 25% 38% 35%Risedronic acid C/P 2000 8 59% 84% 59%Strontium ranelate P 2004 5 37% 54% 60%
Teriparatide P 2003 12 8% 10% 11%Zoledronic acid P 2001 10 71% 54% 52%Osteoporosis DDD 6 41% 64% 71%
Note: The disparity between the usage rate of etidronic acid in European countries and all countries is explained by very high usage in Canada.
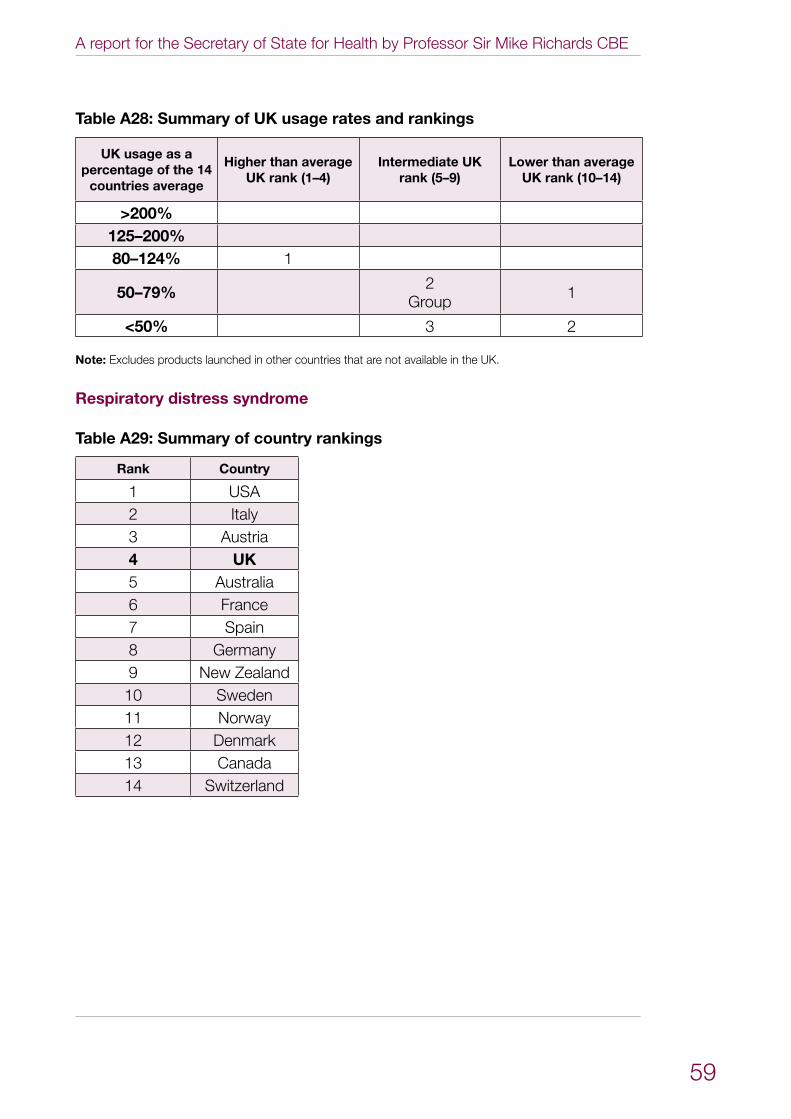
A report for the Secretary of State for Health by Professor Sir Mike Richards CBE
59
Table A28: Summary of UK usage rates and rankings
UK usage as a percentage of the 14
countries average
Higher than average UK rank (1–4)
Intermediate UK rank (5–9)
Lower than average UK rank (10–14)
>200%125–200%80–124% 1
50–79% 2Group 1
<50% 3 2
Note: Excludes products launched in other countries that are not available in the UK.
Respiratory distress syndrome
Table A29: Summary of country rankings
Rank Country
1 USA2 Italy3 Austria4 UK5 Australia6 France7 Spain8 Germany9 New Zealand10 Sweden11 Norway12 Denmark13 Canada14 Switzerland
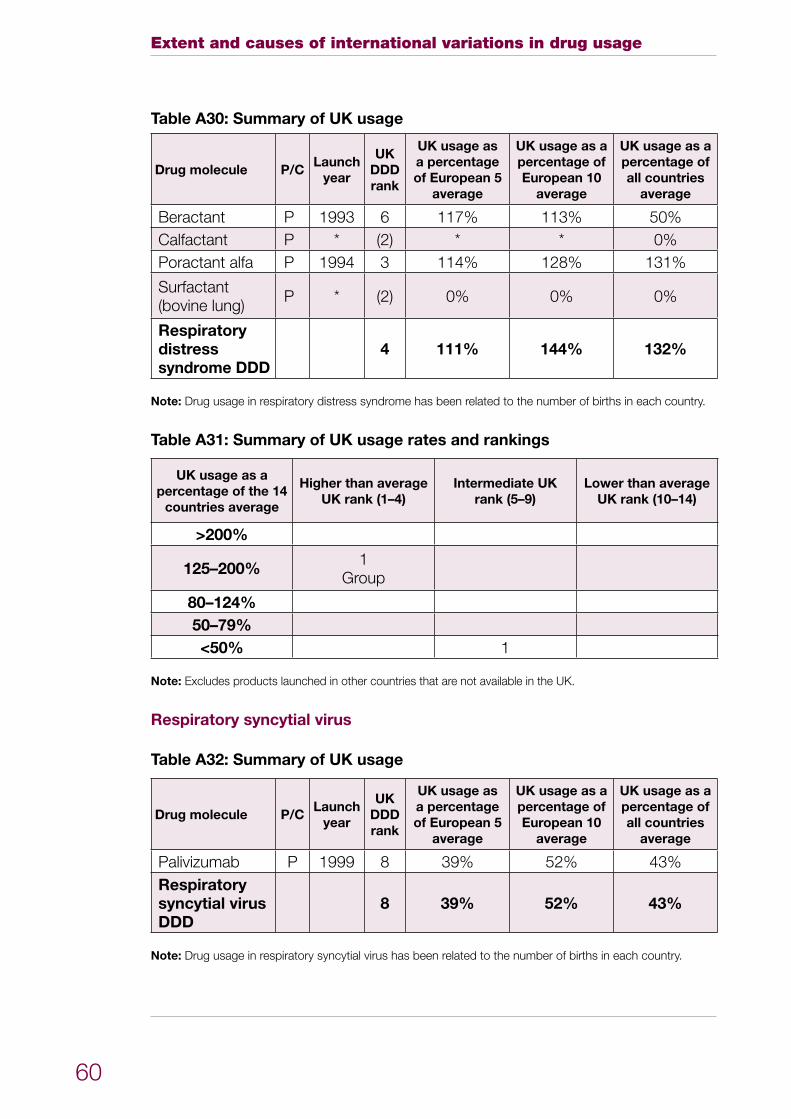
Extent and causes of international variations in drug usage
60
Table A30: Summary of UK usage
Drug molecule P/CLaunch
year
UK DDD rank
UK usage as a percentage of European 5
average
UK usage as a percentage of European 10
average
UK usage as a percentage of all countries
average
Beractant P 1993 6 117% 113% 50%Calfactant P * (2) * * 0%Poractant alfa P 1994 3 114% 128% 131%
Surfactant (bovine lung) P * (2) 0% 0% 0%
Respiratory distress syndrome DDD
4 111% 144% 132%
Note: Drug usage in respiratory distress syndrome has been related to the number of births in each country.
Table A31: Summary of UK usage rates and rankings
UK usage as a percentage of the 14
countries average
Higher than average UK rank (1–4)
Intermediate UK rank (5–9)
Lower than average UK rank (10–14)
>200%
125–200% 1Group
80–124%50–79%<50% 1
Note: Excludes products launched in other countries that are not available in the UK.
Respiratory syncytial virus
Table A32: Summary of UK usage
Drug molecule P/CLaunch
year
UK DDD rank
UK usage as a percentage of European 5
average
UK usage as a percentage of European 10
average
UK usage as a percentage of all countries
average
Palivizumab P 1999 8 39% 52% 43%Respiratory syncytial virus DDD
8 39% 52% 43%
Note: Drug usage in respiratory syncytial virus has been related to the number of births in each country.
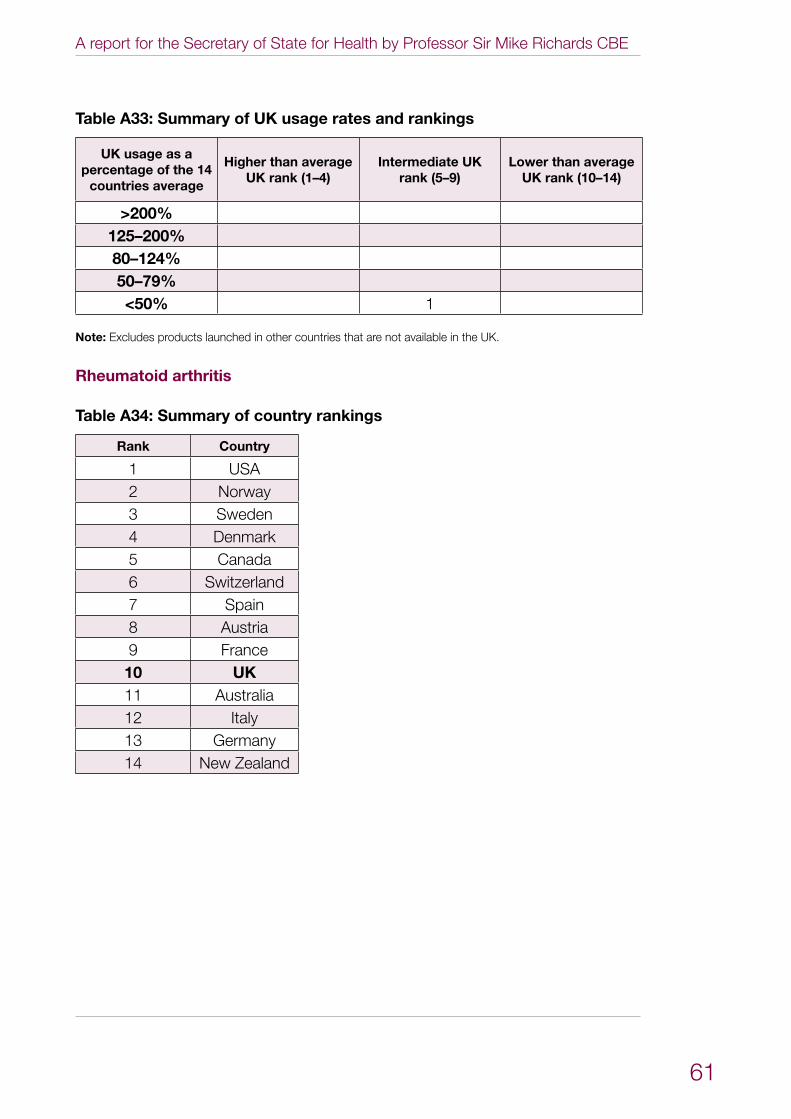
A report for the Secretary of State for Health by Professor Sir Mike Richards CBE
61
Table A33: Summary of UK usage rates and rankings
UK usage as a percentage of the 14
countries average
Higher than average UK rank (1–4)
Intermediate UK rank (5–9)
Lower than average UK rank (10–14)
>200%125–200%80–124%50–79%<50% 1
Note: Excludes products launched in other countries that are not available in the UK.
Rheumatoid arthritis
Table A34: Summary of country rankings
Rank Country
1 USA2 Norway3 Sweden4 Denmark5 Canada6 Switzerland7 Spain8 Austria9 France10 UK11 Australia12 Italy13 Germany14 New Zealand
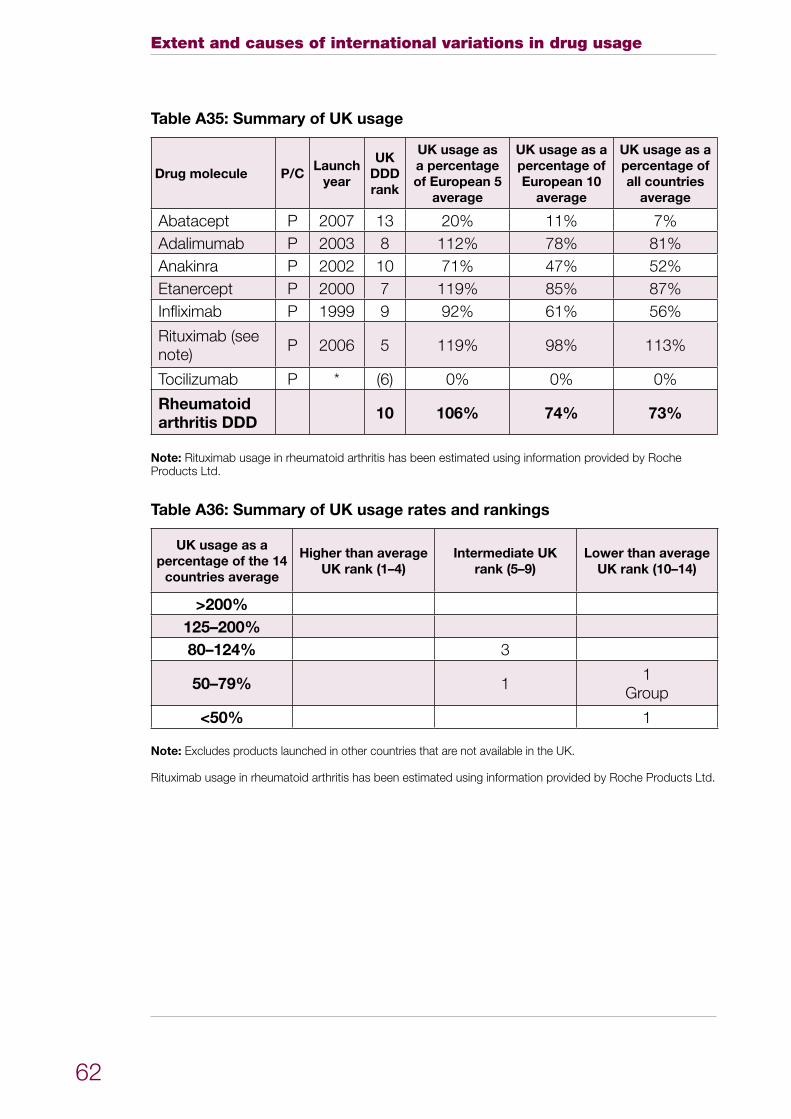
Extent and causes of international variations in drug usage
62
Table A35: Summary of UK usage
Drug molecule P/CLaunch
year
UK DDD rank
UK usage as a percentage of European 5
average
UK usage as a percentage of European 10
average
UK usage as a percentage of all countries
average
Abatacept P 2007 13 20% 11% 7%Adalimumab P 2003 8 112% 78% 81%Anakinra P 2002 10 71% 47% 52%Etanercept P 2000 7 119% 85% 87%Infliximab P 1999 9 92% 61% 56%
Rituximab (see note) P 2006 5 119% 98% 113%
Tocilizumab P * (6) 0% 0% 0%
Rheumatoid arthritis DDD 10 106% 74% 73%
Note: Rituximab usage in rheumatoid arthritis has been estimated using information provided by Roche Products Ltd.
Table A36: Summary of UK usage rates and rankings
UK usage as a percentage of the 14
countries average
Higher than average UK rank (1–4)
Intermediate UK rank (5–9)
Lower than average UK rank (10–14)
>200%125–200%80–124% 3
50–79% 1 1Group
<50% 1
Note: Excludes products launched in other countries that are not available in the UK.
Rituximab usage in rheumatoid arthritis has been estimated using information provided by Roche Products Ltd.
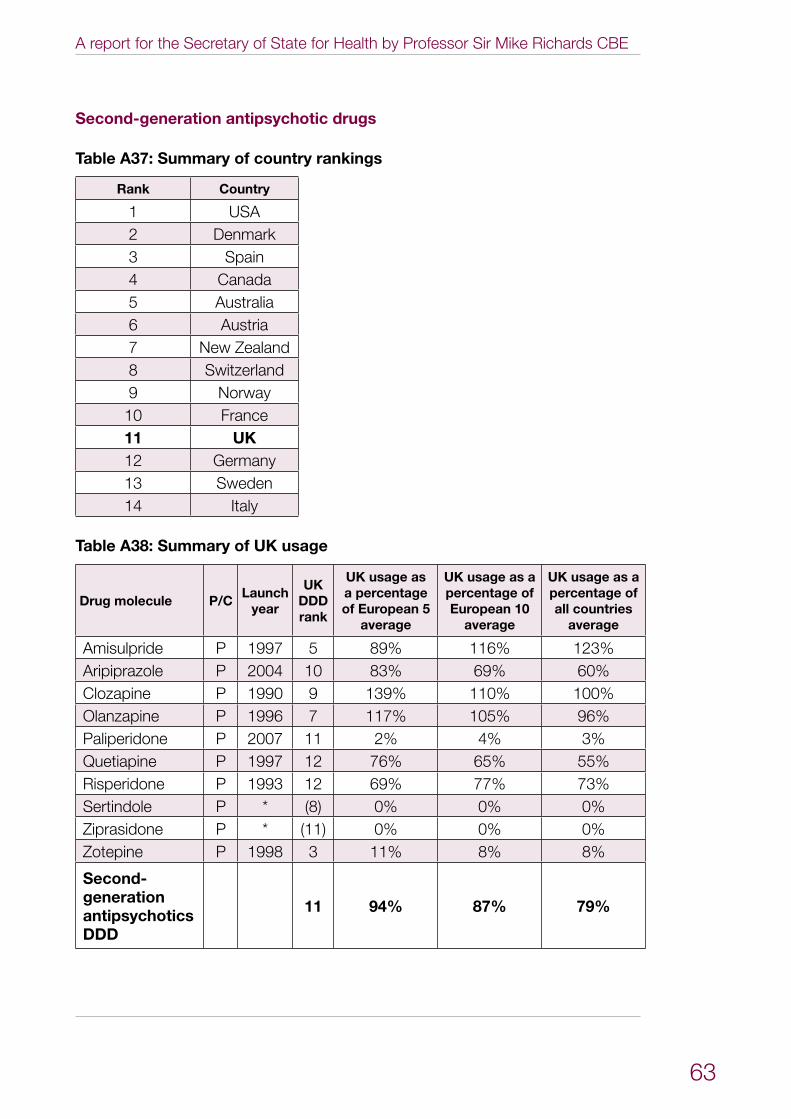
A report for the Secretary of State for Health by Professor Sir Mike Richards CBE
63
Second-generation antipsychotic drugs
Table A37: Summary of country rankings
Rank Country
1 USA2 Denmark3 Spain4 Canada5 Australia6 Austria7 New Zealand8 Switzerland9 Norway10 France11 UK12 Germany13 Sweden14 Italy
Table A38: Summary of UK usage
Drug molecule P/CLaunch
year
UK DDD rank
UK usage as a percentage of European 5
average
UK usage as a percentage of European 10
average
UK usage as a percentage of all countries
average
Amisulpride P 1997 5 89% 116% 123%Aripiprazole P 2004 10 83% 69% 60%Clozapine P 1990 9 139% 110% 100%Olanzapine P 1996 7 117% 105% 96%Paliperidone P 2007 11 2% 4% 3%Quetiapine P 1997 12 76% 65% 55%Risperidone P 1993 12 69% 77% 73%Sertindole P * (8) 0% 0% 0%Ziprasidone P * (11) 0% 0% 0%Zotepine P 1998 3 11% 8% 8%
Second-generation antipsychotics DDD
11 94% 87% 79%
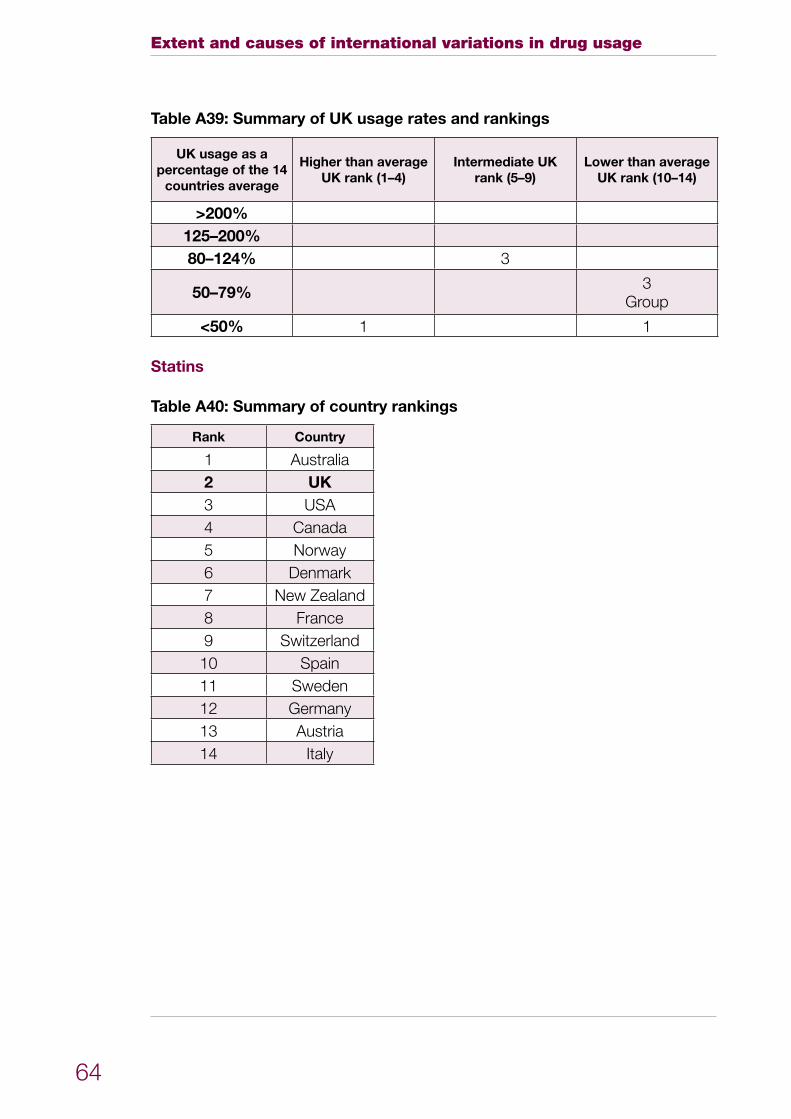
Extent and causes of international variations in drug usage
64
Table A39: Summary of UK usage rates and rankings
UK usage as a percentage of the 14
countries average
Higher than average UK rank (1–4)
Intermediate UK rank (5–9)
Lower than average UK rank (10–14)
>200%125–200%80–124% 3
50–79% 3Group
<50% 1 1
Statins
Table A40: Summary of country rankings
Rank Country
1 Australia2 UK3 USA4 Canada5 Norway6 Denmark7 New Zealand8 France9 Switzerland10 Spain11 Sweden12 Germany13 Austria14 Italy
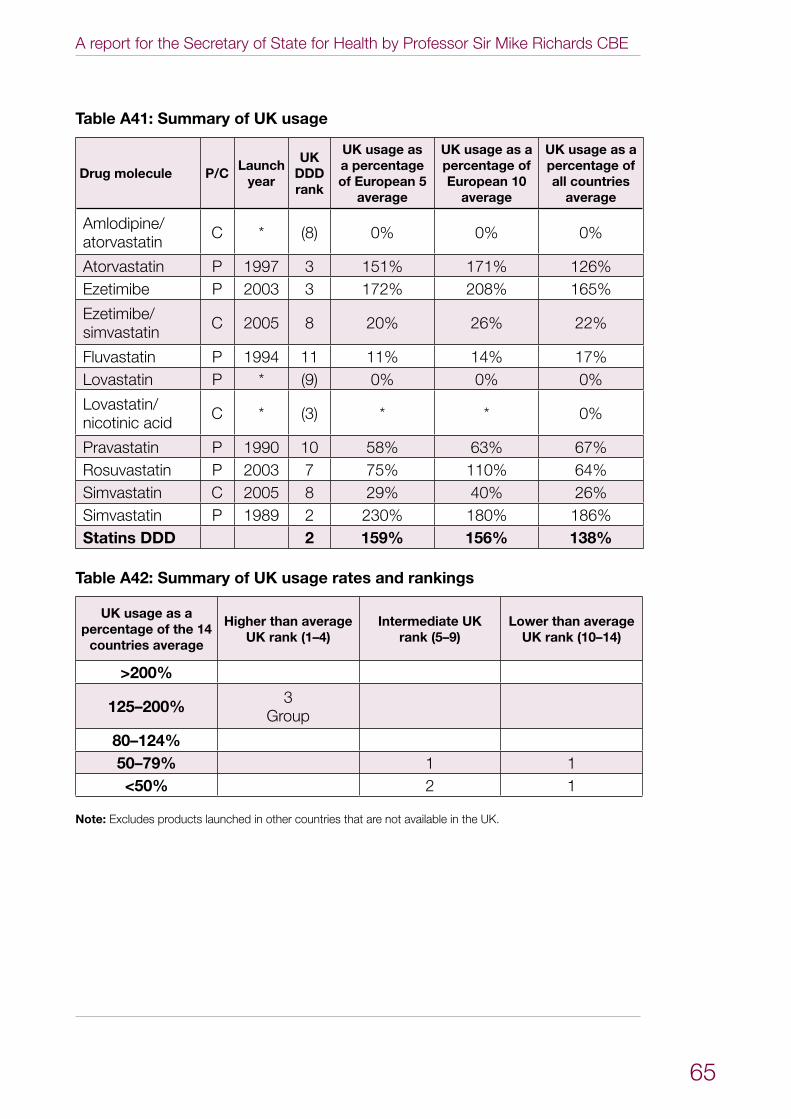
A report for the Secretary of State for Health by Professor Sir Mike Richards CBE
65
Table A41: Summary of UK usage
Drug molecule P/CLaunch
year
UK DDD rank
UK usage as a percentage of European 5
average
UK usage as a percentage of European 10
average
UK usage as a percentage of all countries
average
Amlodipine/atorvastatin C * (8) 0% 0% 0%
Atorvastatin P 1997 3 151% 171% 126%Ezetimibe P 2003 3 172% 208% 165%
Ezetimibe/simvastatin C 2005 8 20% 26% 22%
Fluvastatin P 1994 11 11% 14% 17%Lovastatin P * (9) 0% 0% 0%
Lovastatin/nicotinic acid C * (3) * * 0%
Pravastatin P 1990 10 58% 63% 67%Rosuvastatin P 2003 7 75% 110% 64%Simvastatin C 2005 8 29% 40% 26%Simvastatin P 1989 2 230% 180% 186%Statins DDD 2 159% 156% 138%
Table A42: Summary of UK usage rates and rankings
UK usage as a percentage of the 14
countries average
Higher than average UK rank (1–4)
Intermediate UK rank (5–9)
Lower than average UK rank (10–14)
>200%
125–200% 3Group
80–124%50–79% 1 1<50% 2 1
Note: Excludes products launched in other countries that are not available in the UK.
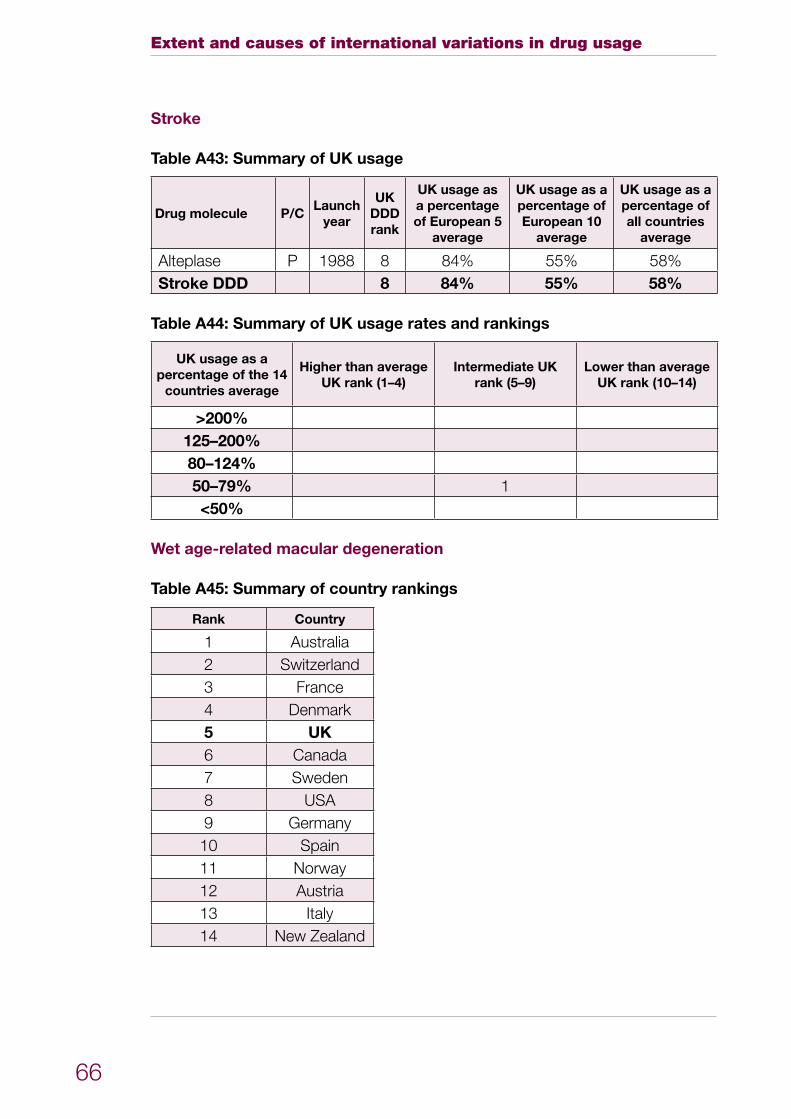
Extent and causes of international variations in drug usage
66
Stroke
Table A43: Summary of UK usage
Drug molecule P/CLaunch
year
UK DDD rank
UK usage as a percentage of European 5
average
UK usage as a percentage of European 10
average
UK usage as a percentage of all countries
average
Alteplase P 1988 8 84% 55% 58%Stroke DDD 8 84% 55% 58%
Table A44: Summary of UK usage rates and rankings
UK usage as a percentage of the 14
countries average
Higher than average UK rank (1–4)
Intermediate UK rank (5–9)
Lower than average UK rank (10–14)
>200%125–200%80–124%50–79% 1<50%
Wet age-related macular degeneration
Table A45: Summary of country rankings
Rank Country
1 Australia2 Switzerland3 France4 Denmark5 UK6 Canada7 Sweden8 USA9 Germany10 Spain11 Norway12 Austria13 Italy14 New Zealand
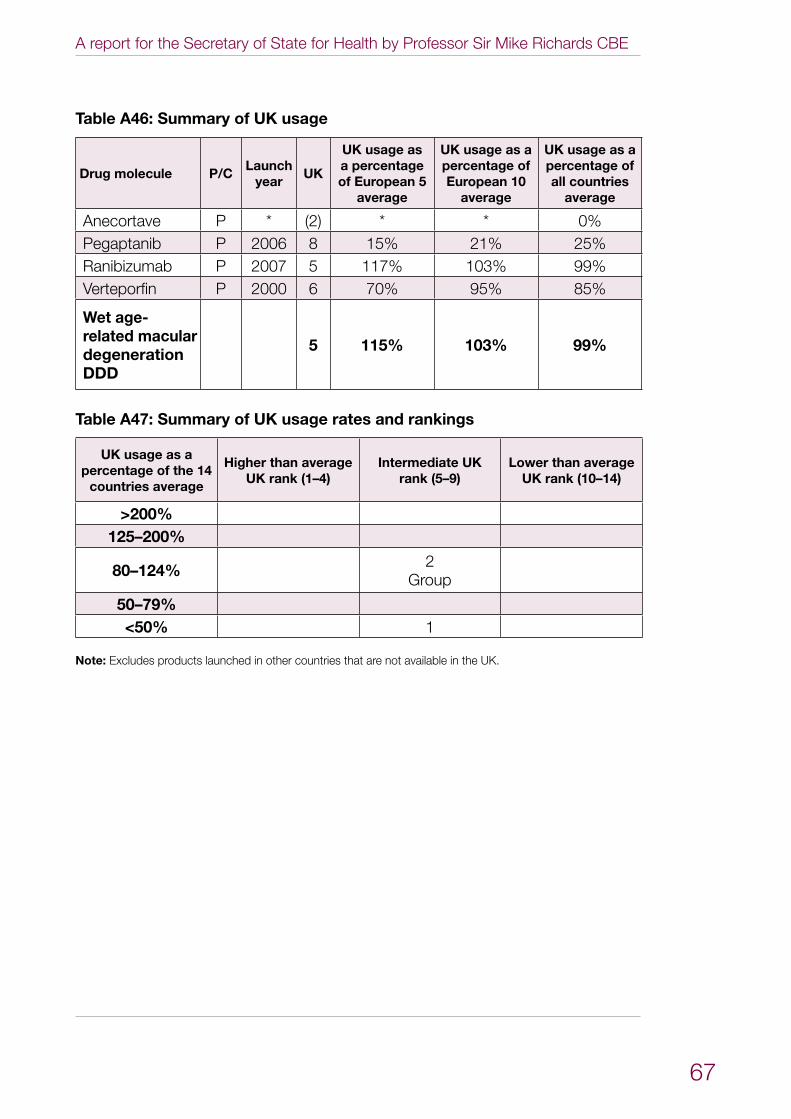
A report for the Secretary of State for Health by Professor Sir Mike Richards CBE
67
Table A46: Summary of UK usage
Drug molecule P/CLaunch
yearUK
UK usage as a percentage of European 5
average
UK usage as a percentage of European 10
average
UK usage as a percentage of all countries
average
Anecortave P * (2) * * 0%Pegaptanib P 2006 8 15% 21% 25%Ranibizumab P 2007 5 117% 103% 99%Verteporfin P 2000 6 70% 95% 85%
Wet age-related macular degeneration DDD
5 115% 103% 99%
Table A47: Summary of UK usage rates and rankings
UK usage as a percentage of the 14
countries average
Higher than average UK rank (1–4)
Intermediate UK rank (5–9)
Lower than average UK rank (10–14)
>200%125–200%
80–124% 2Group
50–79%<50% 1
Note: Excludes products launched in other countries that are not available in the UK.
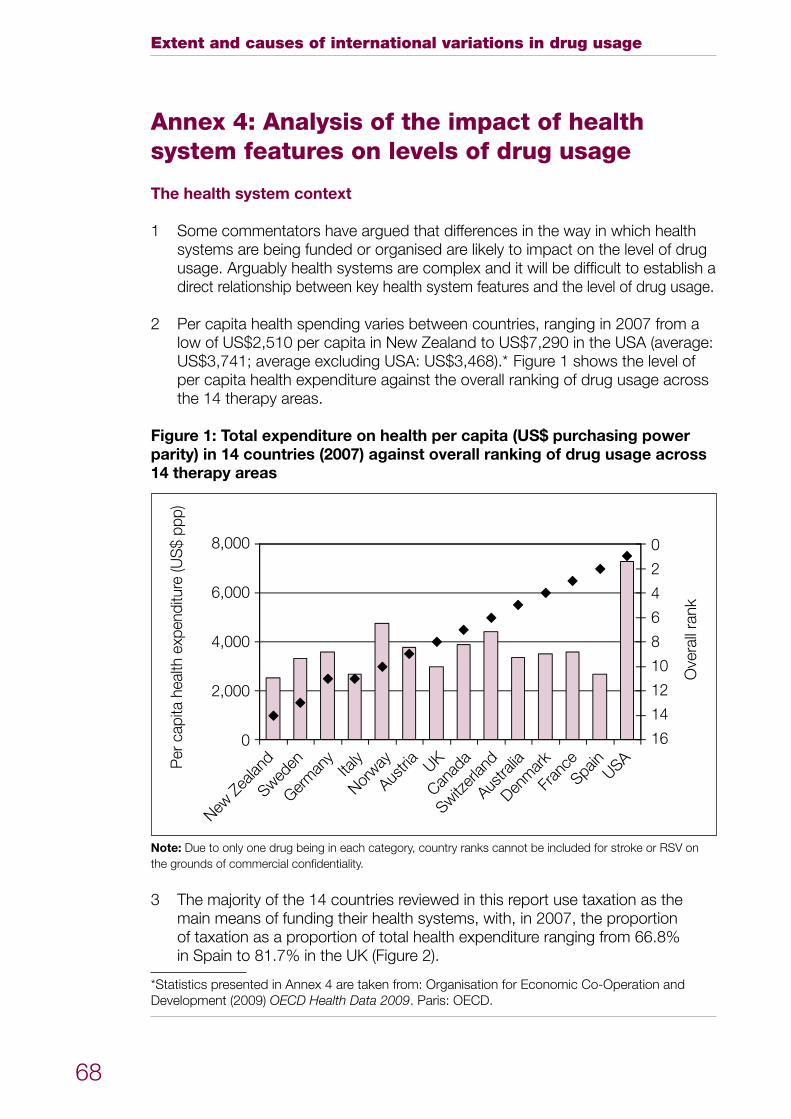
Extent and causes of international variations in drug usage
68
Annex 4: Analysis of the impact of health system features on levels of drug usage
The health system context
Some commentators have argued that differences in the way in which health 1 systems are being funded or organised are likely to impact on the level of drug usage. Arguably health systems are complex and it will be difficult to establish a direct relationship between key health system features and the level of drug usage.
Per capita health spending varies between countries, ranging in 2007 from a 2 low of US$2,510 per capita in New Zealand to US$7,290 in the USA (average: US$3,741; average excluding USA: US$3,468).* Figure 1 shows the level of per capita health expenditure against the overall ranking of drug usage across the 14 therapy areas.
Figure 1: Total expenditure on health per capita (US$ purchasing power parity) in 14 countries (2007) against overall ranking of drug usage across 14 therapy areas
New Z
ealan
dSwed
enGer
man
yIta
lyNor
wayAus
tria UKCan
ada
Switzer
land
Austra
liaDen
mar
kFr
ance
Spain
USA
Ove
rall
rank
Per
cap
ita h
ealth
exp
endi
ture
(US
$ pp
p)
8,000
6,000
4,000
2,000
0
0
2
4
6
8
10
12
14
16
Note: Due to only one drug being in each category, country ranks cannot be included for stroke or RSV on the grounds of commercial confidentiality.
The majority of the 14 countries reviewed in this report use taxation as the 3 main means of funding their health systems, with, in 2007, the proportion of taxation as a proportion of total health expenditure ranging from 66.8% in Spain to 81.7% in the UK (Figure 2).
*Statistics presented in Annex 4 are taken from: Organisation for Economic Co-Operation and Development (2009) OECD Health Data 2009. Paris: OECD.
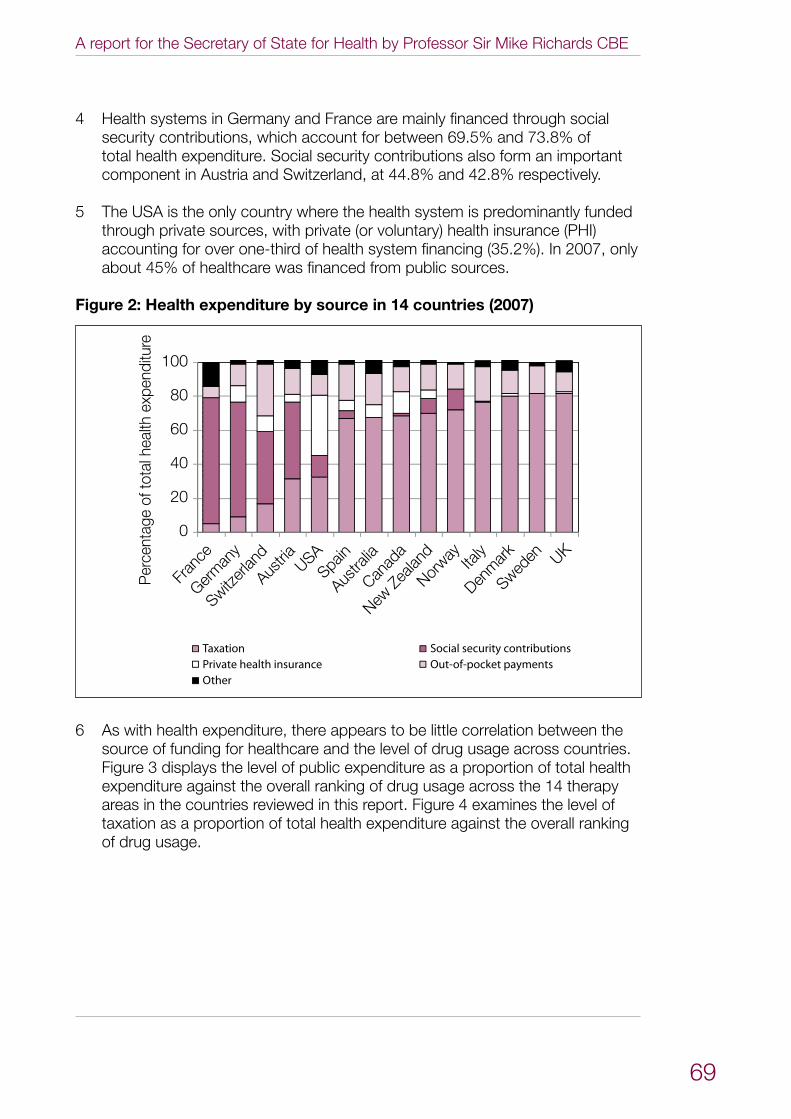
A report for the Secretary of State for Health by Professor Sir Mike Richards CBE
69
Health systems in Germany and France are mainly financed through social 4 security contributions, which account for between 69.5% and 73.8% of total health expenditure. Social security contributions also form an important component in Austria and Switzerland, at 44.8% and 42.8% respectively.
The USA is the only country where the health system is predominantly funded 5 through private sources, with private (or voluntary) health insurance (PHI) accounting for over one-third of health system financing (35.2%). In 2007, only about 45% of healthcare was financed from public sources.
Figure 2: Health expenditure by source in 14 countries (2007)
New Z
ealan
d
Sweden
Germ
any
Italy
Norway
Austria UK
Canad
a
Switzer
land
Austra
lia
Denm
ark
Fran
ce
Spain
USA
Per
cent
age
of to
tal h
ealth
exp
endi
ture
100
80
60
40
20
0
TaxationPrivate health insuranceOther
Social security contributionsOut-of-pocket payments
As with health expenditure, there appears to be little correlation between the 6 source of funding for healthcare and the level of drug usage across countries. Figure 3 displays the level of public expenditure as a proportion of total health expenditure against the overall ranking of drug usage across the 14 therapy areas in the countries reviewed in this report. Figure 4 examines the level of taxation as a proportion of total health expenditure against the overall ranking of drug usage.
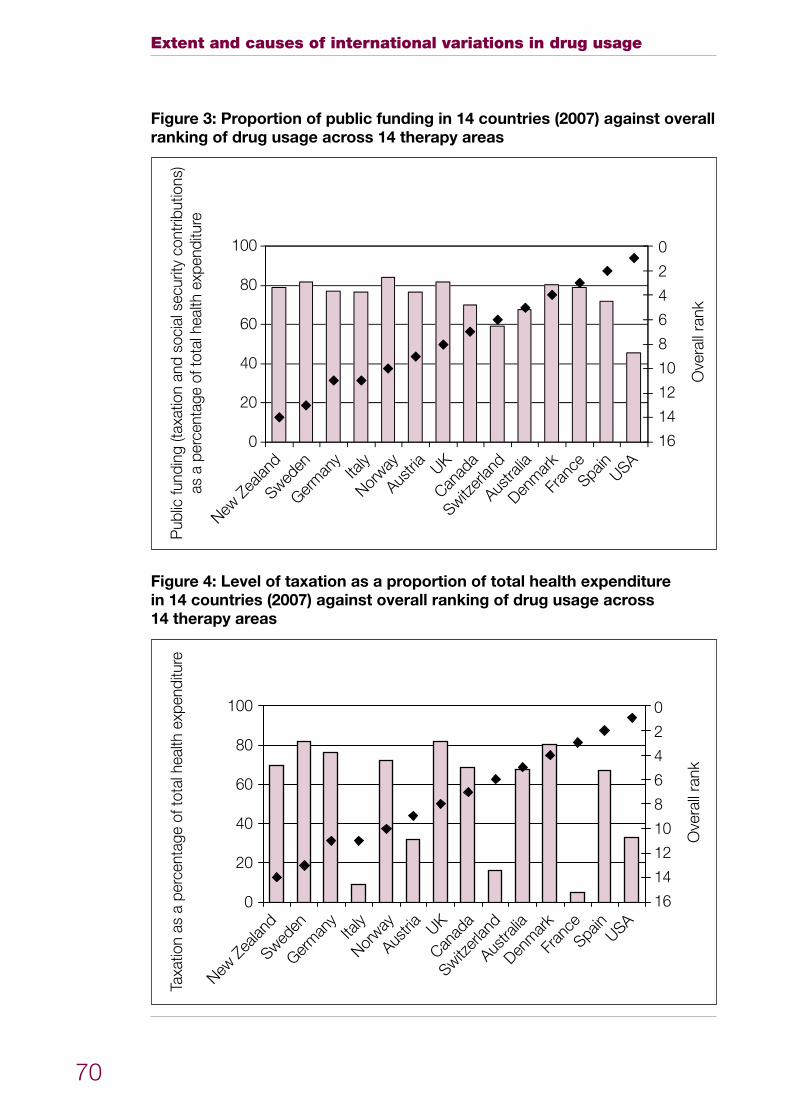
Extent and causes of international variations in drug usage
70
Figure 3: Proportion of public funding in 14 countries (2007) against overall ranking of drug usage across 14 therapy areas
New Z
ealan
dSwed
enGer
man
yIta
lyNor
wayAus
tria UKCan
ada
Switzer
land
Austra
liaDen
mar
kFr
ance
Spain
USA
Ove
rall
rank
Pub
lic fu
ndin
g (ta
xatio
n an
d so
cial
sec
urity
con
tribu
tions
)as
a p
erce
ntag
e of
tota
l hea
lth e
xpen
ditu
re
100
80
60
40
20
0
0
2
4
6
8
10
12
14
16
Figure 4: Level of taxation as a proportion of total health expenditure in 14 countries (2007) against overall ranking of drug usage across 14 therapy areas
New Z
ealan
dSwed
enGer
man
yIta
lyNor
wayAus
tria UKCan
ada
Switzer
land
Austra
liaDen
mar
kFr
ance
Spain
USA
Ove
rall
rank
Taxa
tion
as a
per
cent
age
of to
tal h
ealth
exp
endi
ture
100
80
60
40
20
0
0
2
4
6
8
10
12
14
16
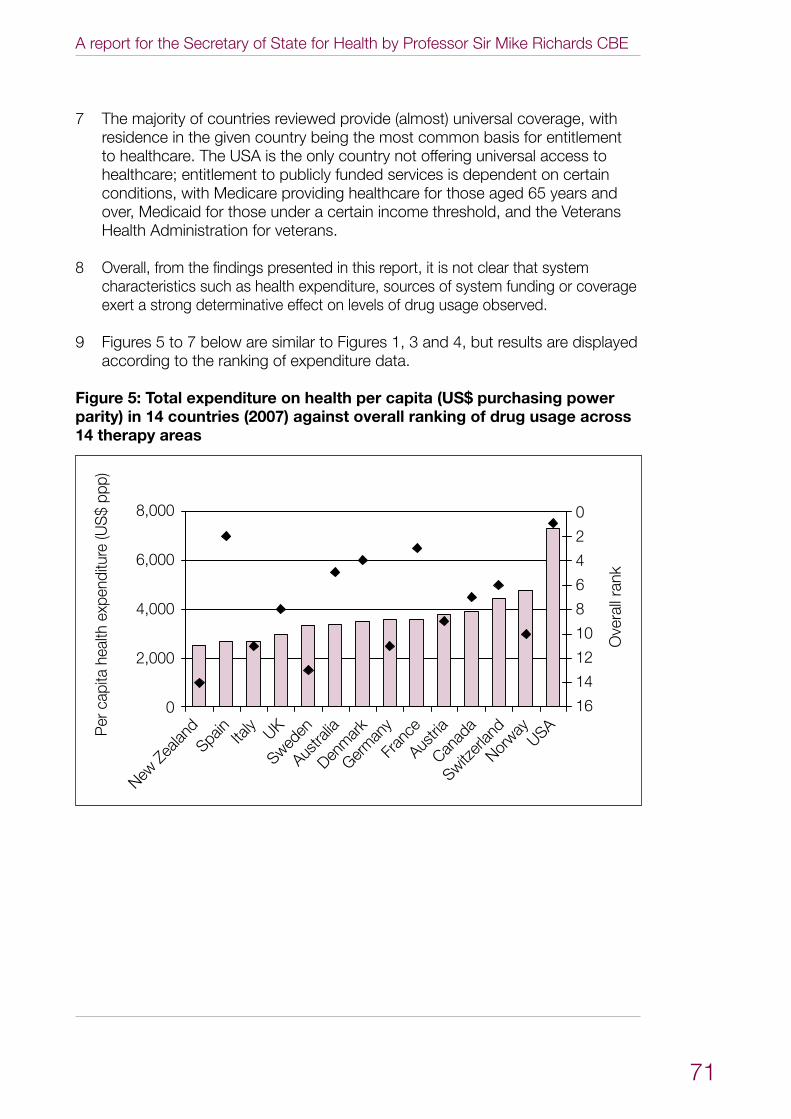
A report for the Secretary of State for Health by Professor Sir Mike Richards CBE
71
The majority of countries reviewed provide (almost) universal coverage, with 7 residence in the given country being the most common basis for entitlement to healthcare. The USA is the only country not offering universal access to healthcare; entitlement to publicly funded services is dependent on certain conditions, with Medicare providing healthcare for those aged 65 years and over, Medicaid for those under a certain income threshold, and the Veterans Health Administration for veterans.
Overall, from the findings presented in this report, it is not clear that system 8 characteristics such as health expenditure, sources of system funding or coverage exert a strong determinative effect on levels of drug usage observed.
Figures 5 to 7 below are similar to Figures 1, 3 and 4, but results are displayed 9 according to the ranking of expenditure data.
Figure 5: Total expenditure on health per capita (US$ purchasing power parity) in 14 countries (2007) against overall ranking of drug usage across 14 therapy areas
New Z
ealan
d
Sweden
Germ
any
Italy
Norway
AustriaUK
Canad
aSwitz
erlan
d
Austra
liaDen
mar
k
Fran
ce
Spain
USA
Ove
rall
rank
Per
cap
ita h
ealth
exp
endi
ture
(US
$ pp
p)
8,000
6,000
4,000
2,000
0
0
2
4
6
8
10
12
14
16
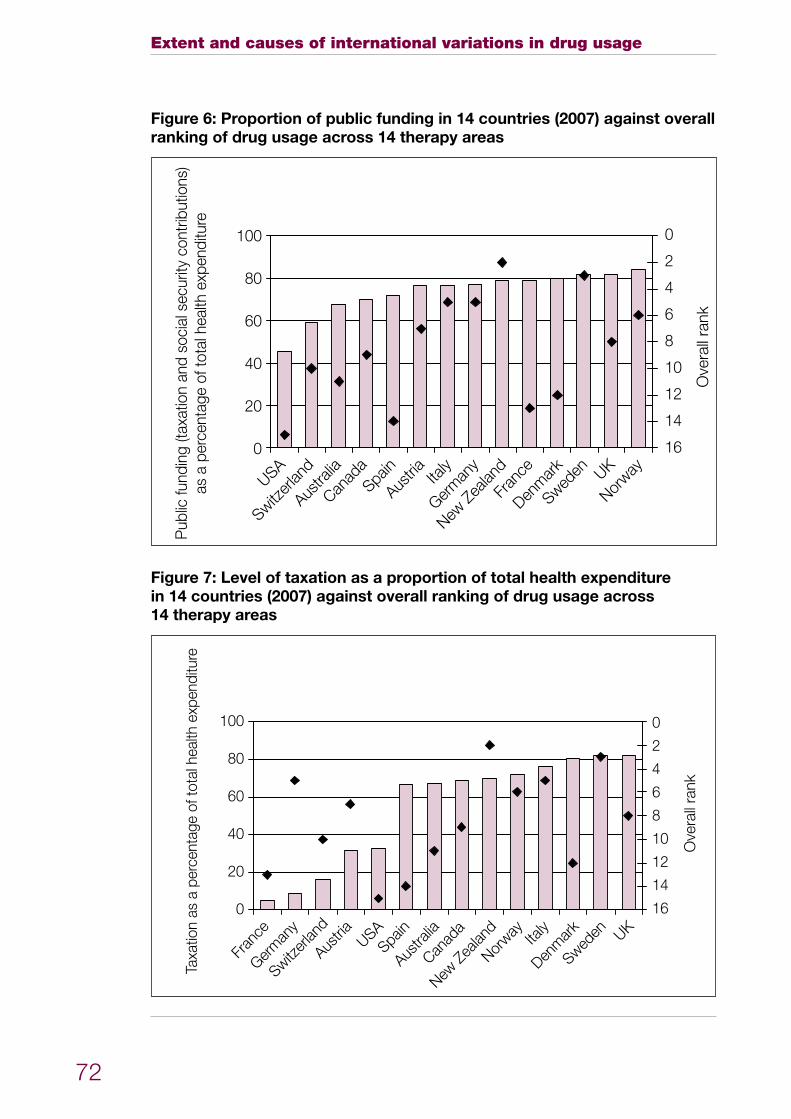
Extent and causes of international variations in drug usage
72
Figure 6: Proportion of public funding in 14 countries (2007) against overall ranking of drug usage across 14 therapy areas
New Z
ealan
d
Sweden
Germ
any
Italy
Norway
Austria UK
Canad
a
Switzer
land
Austra
lia
Denm
ark
Fran
ce
Spain
USA
Ove
rall
rank
Pub
lic fu
ndin
g (ta
xatio
n an
d so
cial
sec
urity
con
tribu
tions
)as
a p
erce
ntag
e of
tota
l hea
lth e
xpen
ditu
re
100
80
60
40
20
0
0
2
4
6
8
10
12
14
16
Figure 7: Level of taxation as a proportion of total health expenditure in 14 countries (2007) against overall ranking of drug usage across 14 therapy areas
New Z
ealan
d
Sweden
Germ
any
Italy
Norway
Austria UK
Canad
a
Switzer
land
Austra
lia
Denm
ark
Fran
ce
Spain
USA
Ove
rall
rank
Taxa
tion
as a
per
cent
age
of to
tal h
ealth
exp
endi
ture
100
80
60
40
20
0
0
2
4
6
8
10
12
14
16
A report for the Secretary of State for Health by Professor Sir Mike Richards CBE
73
Annex 5: Feedback on potential explanations for variations in usage
This annex contains feedback from stakeholders on potential explanations for the international usage of drugs reported in Annex 3. It summarises comments from a range of stakeholders in the UK including clinicians, pharmacists, public health specialists, patients, patient representatives, pharmaceutical companies and pharmaceutical industry groups. Annex 2 lists the organisations and individuals who have submitted comments.
Feedback was gathered in a variety of formats, including:
workshops for clinicians, pharmacists and public health specialists;•
structured interviews with patients and patient representative groups; and•
written submissions to the project.•
Many possible explanations for the data findings were suggested by stakeholders, some complementary and some not. This annex summarises the comments.
General comments
Summary of potential explanations provided in stakeholder feedback
The following factors were suggested as having an impact on drug usage across disease areas:
Disease/condition incidence and prevalence •Demographic variation•Timing of drug launch in different countries•Overall spend on drugs•Level of investment in services•National disease priorities and specific policies and guidelines•Nature of healthcare systems, including payment mechanisms, reimbursement •systems and prescribing incentivesDevelopment of evidence-based medicine and impact of evidence-based •research and assessments of effectivenessInvestment in services•Decision-making processes for funding drugs•Timing and outcome of health technology assessments•Clinical and patient confidence in robustness of the National Institute for Health •and Clinical Excellence (NICE) technology appraisal processVariation in clinical practice, including the impact of the practitioner’s experience, •how they are trained, and the existence of guidelinesClinical and patient attitudes towards the benefit and toxicity of individual •treatments
Extent and causes of international variations in drug usage
74
• Patient safety concerns• Patient choice and availability of patient information to enable informed choices• Perception that patient relationships with health services have changed over the
past 10 years or so, with patients now more active participants in their own care• Role of patient representative groups in supporting patients• Patient confidence in clinicians’ prescribing decisions• Cost of drugs and levels of generic prescribing• Differing levels of influence of pharmaceutical companies in different countries• Emphasis placed on health promotion/non-drug therapies• Availability of complementary and substitute technologies• Effectiveness of service planning and organisation (both for detection of
conditions and for treatment)• Balance of primary care and specialist care• Access to specialists• Availability of capacity within the health system for diagnosis, detection and
treatment• Treatment pathways, including variations in referral protocols, access to
diagnostic tests, speed of diagnosis and treatment approaches• Cultural attitudes towards the use of newer and more expensive medicines and
the influence of historical use
Acute myocardial infarction
Summary of data findings
UK rank: 2 out of 13UK usage as a percentage of European 5: 288%UK usage as a percentage of European 10: 264%UK usage as a percentage of all countries: 280%
Summary of potential explanations provided in stakeholder feedback
• International variations in the prevalence of cardiovascular disease and disease risk factors, including diet and lifestyle factors
• In the UK, impact of the smoking ban and use of statins• Changes in rates of ST elevation in myocardial infarction across the world• Impact of established guidelines and incentives, such as the National Service
Framework for Coronary Heart Disease, which has included strong emphasis on ambulance response times and ‘door-to-needle’ times
• Service organisation – in a national service, targets such as ‘door-to-needle’ times will have better penetration of good care. Indication the service is ‘joined up’
• Provision of ambulance services and ability to get people to a place where thrombolytics can be administered in time. In the UK, 25–30% of ambulance staff are paramedic trained
• International differences in clinical practice. In the USA, evidence indicates that they use ‘door-to-balloon’ times rather than ‘door-to-needle’ times, indicating a rather greater focus on primary coronary angioplasty (primary percutaneous
A report for the Secretary of State for Health by Professor Sir Mike Richards CBE
75
coronary intervention – PPCI) than thrombolytics. Audit data from the British Cardiovascular Intervention Society suggest that rates of PPCI are relatively lowGeographical variations impact on clinical care – UK clinicians suggested that •PPCI is less feasible in very rural areasClinical perceptions of effectiveness – confidence in using streptokinase in the •UK and a suggestion that tissue plasminogen activator (tPA) may be preferred to streptokinase in some countries. In Italy, streptokinase is not used at all
Cancer
Summary of data findings
Drugs launched within the last five yearsUK rank: 12 out of 14UK usage as a percentage of European 5: 41%UK usage as a percentage of European 10: 45%UK usage as a percentage of all countries: 45%
Drugs launched six to 10 years agoUK rank: 9 out of 14UK usage as a percentage of European 5: 107%UK usage as a percentage of European 10: 87%UK usage as a percentage of all countries: 94%
Drugs launched more than 10 years agoUK rank: 10 out of 14UK usage as a percentage of European 5: 78%UK usage as a percentage of European 10: 82%UK usage as a percentage of all countries: 87%
Hormonal drugsUK rank: 5 out of 14UK usage as a percentage of European 5: 92%UK usage as a percentage of European 10: 86%UK usage as a percentage of all countries: 93%
Summary of potential explanations provided in stakeholder feedback
General commentsClinicians’ and patients’ attitudes and beliefs about both the degree of benefit •and the severity of toxicity of individual compounds may vary between countries. It is possible that clinicians and patients in the UK are more toxicity-averse than their counterparts in other countries. This may explain the low usage of taxanes and relatively high usage of hormonal treatments in the UKComplexity of use in multiple indications and impact of NICE guidance on use in •different indications
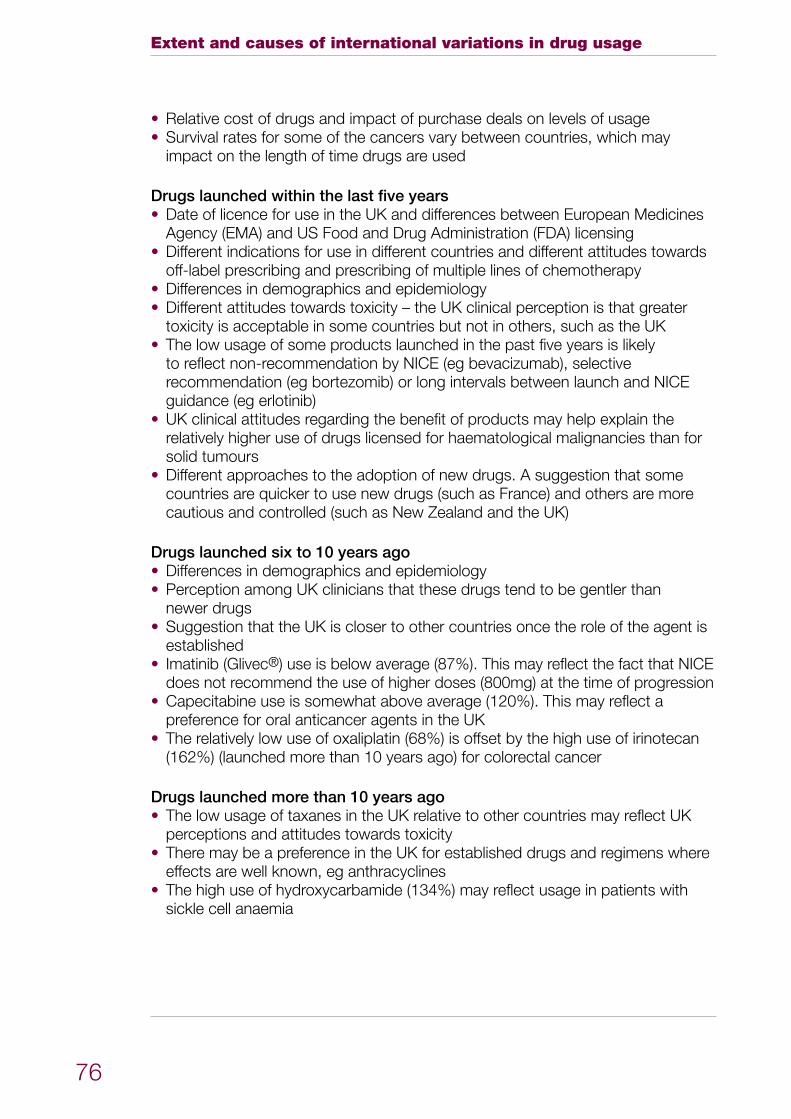
Extent and causes of international variations in drug usage
76
Relative cost of drugs and impact of purchase deals on levels of usage•Survival rates for some of the cancers vary between countries, which may •impact on the length of time drugs are used
Drugs launched within the last five yearsDate of licence for use in the UK and differences between European Medicines •Agency (EMA) and US Food and Drug Administration (FDA) licensingDifferent indications for use in different countries and different attitudes towards •off-label prescribing and prescribing of multiple lines of chemotherapyDifferences in demographics and epidemiology•Different attitudes towards toxicity – the UK clinical perception is that greater •toxicity is acceptable in some countries but not in others, such as the UKThe low usage of some products launched in the past five years is likely •to reflect non-recommendation by NICE (eg bevacizumab), selective recommendation (eg bortezomib) or long intervals between launch and NICE guidance (eg erlotinib)UK clinical attitudes regarding the benefit of products may help explain the •relatively higher use of drugs licensed for haematological malignancies than for solid tumoursDifferent approaches to the adoption of new drugs. A suggestion that some •countries are quicker to use new drugs (such as France) and others are more cautious and controlled (such as New Zealand and the UK)
Drugs launched six to 10 years agoDifferences in demographics and epidemiology•Perception among UK clinicians that these drugs tend to be gentler than •newer drugsSuggestion that the UK is closer to other countries once the role of the agent is •establishedImatinib (Glivec• ®) use is below average (87%). This may reflect the fact that NICE does not recommend the use of higher doses (800mg) at the time of progressionCapecitabine use is somewhat above average (120%). This may reflect a •preference for oral anticancer agents in the UKThe relatively low use of oxaliplatin (68%) is offset by the high use of irinotecan •(162%) (launched more than 10 years ago) for colorectal cancer
Drugs launched more than 10 years agoThe low usage of taxanes in the UK relative to other countries may reflect UK •perceptions and attitudes towards toxicityThere may be a preference in the UK for established drugs and regimens where •effects are well known, eg anthracyclines The high use of hydroxycarbamide (134%) may reflect usage in patients with •sickle cell anaemia
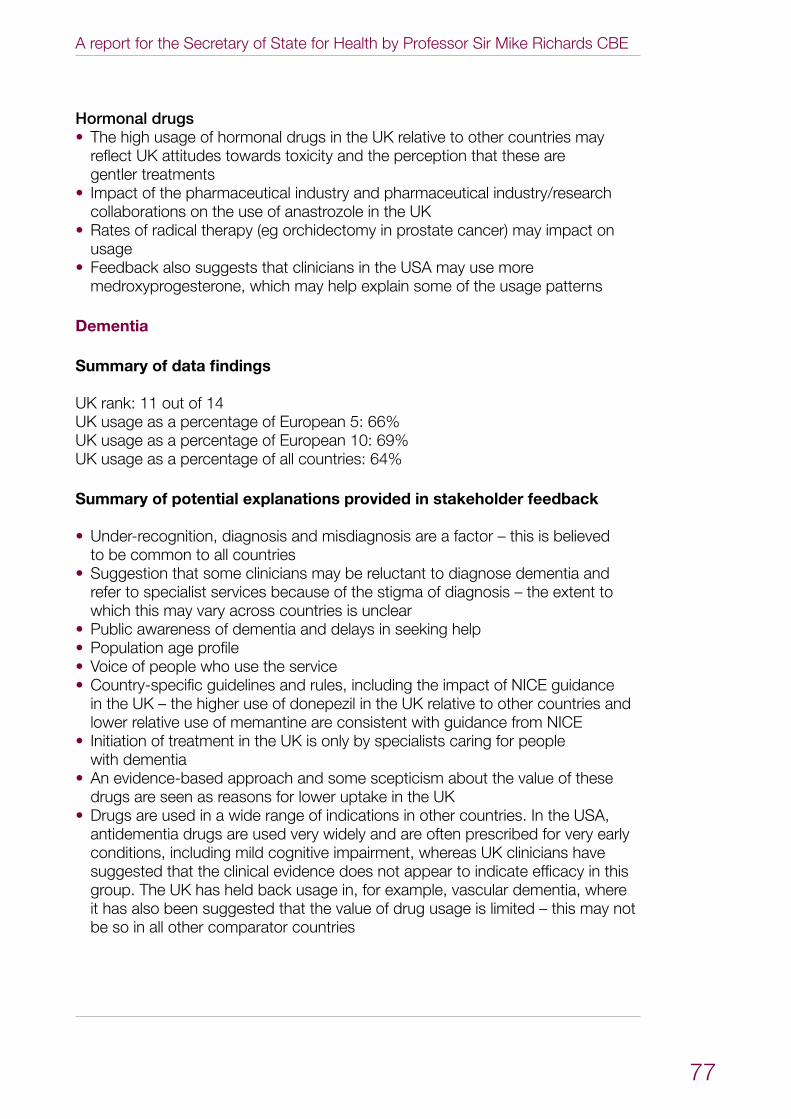
A report for the Secretary of State for Health by Professor Sir Mike Richards CBE
77
Hormonal drugsThe high usage of hormonal drugs in the UK relative to other countries may •reflect UK attitudes towards toxicity and the perception that these are gentler treatmentsImpact of the pharmaceutical industry and pharmaceutical industry/research •collaborations on the use of anastrozole in the UKRates of radical therapy (eg orchidectomy in prostate cancer) may impact on •usageFeedback also suggests that clinicians in the USA may use more •medroxyprogesterone, which may help explain some of the usage patterns
Dementia
Summary of data findings
UK rank: 11 out of 14UK usage as a percentage of European 5: 66%UK usage as a percentage of European 10: 69%UK usage as a percentage of all countries: 64%
Summary of potential explanations provided in stakeholder feedback
Under-recognition, diagnosis and misdiagnosis are a factor – this is believed •to be common to all countriesSuggestion that some clinicians may be reluctant to diagnose dementia and •refer to specialist services because of the stigma of diagnosis – the extent to which this may vary across countries is unclearPublic awareness of dementia and delays in seeking help•Population age profile•Voice of people who use the service •Country-specific guidelines and rules, including the impact of NICE guidance •in the UK – the higher use of donepezil in the UK relative to other countries and lower relative use of memantine are consistent with guidance from NICEInitiation of treatment in the UK is only by specialists caring for people •with dementiaAn evidence-based approach and some scepticism about the value of these •drugs are seen as reasons for lower uptake in the UKDrugs are used in a wide range of indications in other countries. In the USA, •antidementia drugs are used very widely and are often prescribed for very early conditions, including mild cognitive impairment, whereas UK clinicians have suggested that the clinical evidence does not appear to indicate efficacy in this group. The UK has held back usage in, for example, vascular dementia, where it has also been suggested that the value of drug usage is limited – this may not be so in all other comparator countries
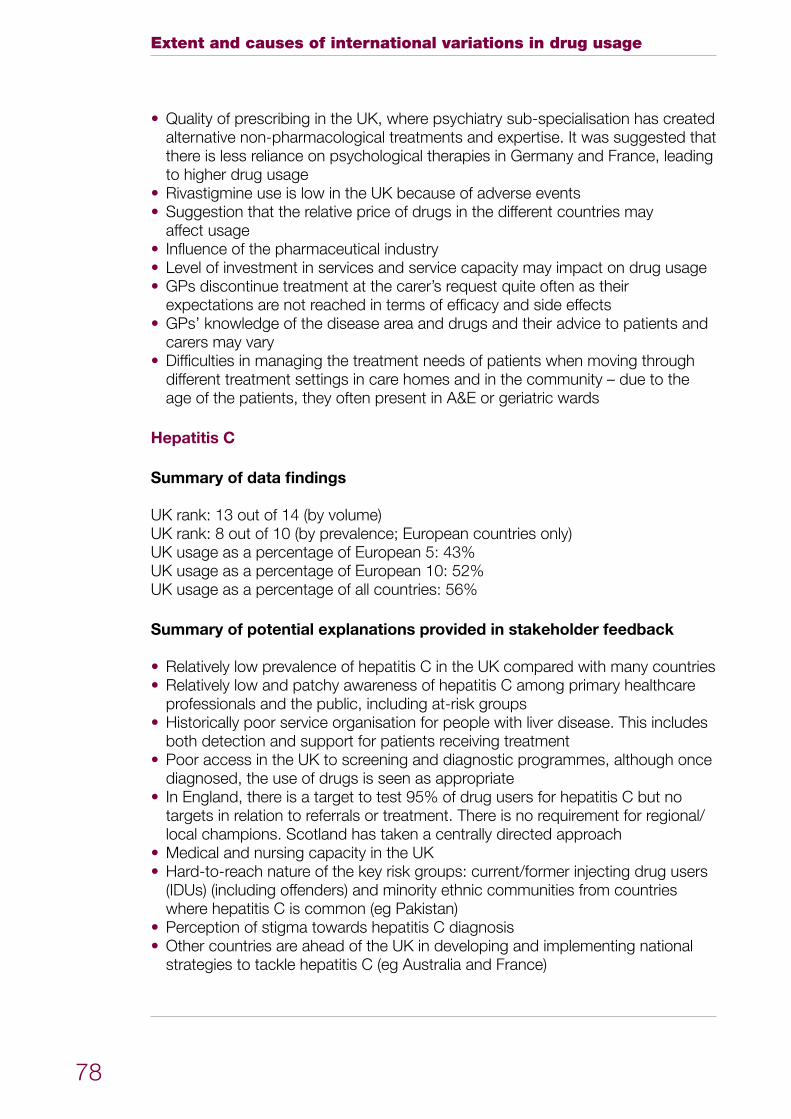
Extent and causes of international variations in drug usage
78
Quality of prescribing in the UK, where psychiatry sub-specialisation has created •alternative non-pharmacological treatments and expertise. It was suggested that there is less reliance on psychological therapies in Germany and France, leading to higher drug usageRivastigmine use is low in the UK because of adverse events•Suggestion that the relative price of drugs in the different countries may •affect usageInfluence of the pharmaceutical industry•Level of investment in services and service capacity may impact on drug usage•GPs discontinue treatment at the carer’s request quite often as their •expectations are not reached in terms of efficacy and side effects GPs’ knowledge of the disease area and drugs and their advice to patients and •carers may varyDifficulties in managing the treatment needs of patients when moving through •different treatment settings in care homes and in the community – due to the age of the patients, they often present in A&E or geriatric wards
Hepatitis C
Summary of data findings
UK rank: 13 out of 14 (by volume)UK rank: 8 out of 10 (by prevalence; European countries only)UK usage as a percentage of European 5: 43%UK usage as a percentage of European 10: 52%UK usage as a percentage of all countries: 56%
Summary of potential explanations provided in stakeholder feedback
Relatively low prevalence of hepatitis C in the UK compared with many countries •Relatively low and patchy awareness of hepatitis C among primary healthcare •professionals and the public, including at-risk groupsHistorically poor service organisation for people with liver disease. This includes •both detection and support for patients receiving treatmentPoor access in the UK to screening and diagnostic programmes, although once •diagnosed, the use of drugs is seen as appropriateIn England, there is a target to test 95% of drug users for hepatitis C but no •targets in relation to referrals or treatment. There is no requirement for regional/local champions. Scotland has taken a centrally directed approachMedical and nursing capacity in the UK•Hard-to-reach nature of the key risk groups: current/former injecting drug users •(IDUs) (including offenders) and minority ethnic communities from countries where hepatitis C is common (eg Pakistan)Perception of stigma towards hepatitis C diagnosis•Other countries are ahead of the UK in developing and implementing national •strategies to tackle hepatitis C (eg Australia and France)
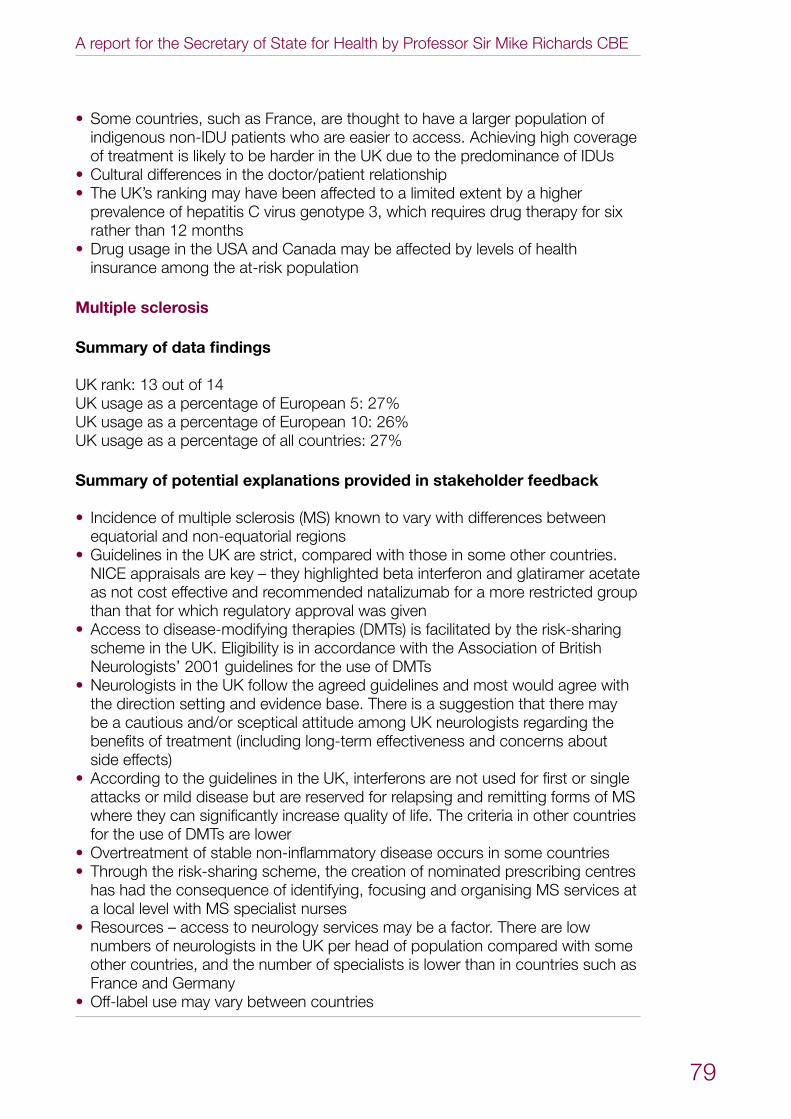
A report for the Secretary of State for Health by Professor Sir Mike Richards CBE
79
Some countries, such as France, are thought to have a larger population of •indigenous non-IDU patients who are easier to access. Achieving high coverage of treatment is likely to be harder in the UK due to the predominance of IDUsCultural differences in the doctor/patient relationship•The UK’s ranking may have been affected to a limited extent by a higher •prevalence of hepatitis C virus genotype 3, which requires drug therapy for six rather than 12 monthsDrug usage in the USA and Canada may be affected by levels of health •insurance among the at-risk population
Multiple sclerosis
Summary of data findings
UK rank: 13 out of 14 UK usage as a percentage of European 5: 27%UK usage as a percentage of European 10: 26%UK usage as a percentage of all countries: 27%
Summary of potential explanations provided in stakeholder feedback
Incidence of multiple sclerosis (MS) known to vary with differences between •equatorial and non-equatorial regionsGuidelines in the UK are strict, compared with those in some other countries. •NICE appraisals are key – they highlighted beta interferon and glatiramer acetate as not cost effective and recommended natalizumab for a more restricted group than that for which regulatory approval was given Access to disease-modifying therapies (DMTs) is facilitated by the risk-sharing •scheme in the UK. Eligibility is in accordance with the Association of British Neurologists’ 2001 guidelines for the use of DMTsNeurologists in the UK follow the agreed guidelines and most would agree with •the direction setting and evidence base. There is a suggestion that there may be a cautious and/or sceptical attitude among UK neurologists regarding the benefits of treatment (including long-term effectiveness and concerns about side effects)According to the guidelines in the UK, interferons are not used for first or single •attacks or mild disease but are reserved for relapsing and remitting forms of MS where they can significantly increase quality of life. The criteria in other countries for the use of DMTs are lowerOvertreatment of stable non-inflammatory disease occurs in some countries•Through the risk-sharing scheme, the creation of nominated prescribing centres •has had the consequence of identifying, focusing and organising MS services at a local level with MS specialist nursesResources – access to neurology services may be a factor. There are low •numbers of neurologists in the UK per head of population compared with some other countries, and the number of specialists is lower than in countries such as France and GermanyOff-label use may vary between countries•
Extent and causes of international variations in drug usage
80
Osteoporosis
Summary of data findings
UK rank: 6 out of 14 UK usage as a percentage of European 5: 41%UK usage as a percentage of European 10: 64%UK usage as a percentage of all countries: 71%
Summary of potential explanations provided in stakeholder feedback
There are differences in the prevalence of osteoporosis across countries•Age and gender demographics are important•Detection of osteoporosis is felt to be poor across the countries•Strong steer in the UK to use the most cost-effective choice of therapy, •supported by NICE guidance NICE guidance on the use of tumour necrosis factors (TNFs) is structured and •hierarchical. The impact of the guidance can be seen in the high usage of alendronic acidImpact of parallel exports on the findings, for example with Spain•Suggestion that there may be unwarranted overuse in other countries and •perhaps relative underuse in the UKOsteoporosis drugs are also licensed for Paget’s disease and many •bisphosphonates are used in oncology. However, it is not considered that this will have had a significant impact on the accuracy of the usage estimates for osteoporosis as usage for Paget’s disease is very small (approximately 1%) and IMS Health was able to disaggregate much of the oncology usageThe National Osteoporosis Society is seen as an important influencer in the UK•Access to DEXA scans (which check the ‘density’ of bones) may be an •influencerThe high use of etidronic acid may reflect historical use•
Respiratory distress syndrome
Summary of data findings
UK rank: 4 out of 14 UK usage as a percentage of European 5: 111%UK usage as a percentage of European 10: 144%UK usage as a percentage of all countries: 132%
A report for the Secretary of State for Health by Professor Sir Mike Richards CBE
81
Summary of potential explanations provided in stakeholder feedback
Variation in preterm birth rate – since surfactants are almost exclusively used for •preterm infants, variations in the rates of preterm births would help explain some of the variation in usage. The UK has a relatively high rate of preterm birth in comparison to other European countries, which may explain some of the higher per capita usage. With preterm births being more common with socioeconomic deprivation, teenage pregnancies, etc, it could be an indicator of adverse population characteristicsVariations in clinical practice – the Scandinavian countries opt for non-invasive •nasal continuous positive airway pressure (CPAP), which halves the need for surfactants compared with the routine intubation of very preterm babies practised in the USA and also in the UK. The lower usage of surfactants in the Scandinavian countries, which are at the bottom of the ranking table, would explain the UK’s higher than average surfactant usage in the comparison of all European countriesImpact of clinical evidence – convincing evidence that surfactants are effective •in improving outcomes for babies with respiratory distress syndrome. Although surfactants are expensive (largely because they are derived from animal lungs and require costly separation and purification processes), they are widely perceived by clinicians in the UK as a worthwhile investmentImpact of clinical guidelines – the Cochrane Reviews suggested the superiority •of prophylactic surfactants in very preterm babies in achieving better health outcomes. This, along with inclusion in the National Neonatal Audit Programme of a standard for achieving use of surfactants within an hour of birth, may have influenced clinical practice in the UK towards an earlier and more widespread use of surfactant therapy. However, more recent studies suggest that premature babies may be equally effectively managed with nasal CPAP, thereby reducing the usage of prophylactic surfactantsUse of antenatal steroids – antenatal steroids, used in women at risk of preterm •delivery before 34 weeks of pregnancy to enhance fetal lung maturity, reduce the need for postnatal surfactants. Results from the National Neonatal Audit Programme during the period of this study’s data collection show that such usage of steroids was achieved in only about 60% of such women in England. This may partly explain the greater usage of surfactants in the UK compared with the Scandinavian countries, where such usage is achieved in over 90% of eligible womenVariation in the usage of antenatal steroids may also explain the discordant •positions of the two North American countries, with the USA being ranked 1 and Canada 13 in the table of surfactant use. Easy access to antenatal care in Canada may result in wider usage of antenatal steroids compared with the USA, where such access may be more limited. Thus healthcare systems offering universal healthcare may reduce the need for some therapeutic interventions such as surfactants by strengthening preventative measures such as better antenatal care and use of antenatal steroids
Extent and causes of international variations in drug usage
82
Respiratory syncytial virus
Summary of data findings
UK rank: 8 UK usage as a percentage of European 5: 39%UK usage as a percentage of European 10: 52%UK usage as a percentage of all countries: 43%
Summary of potential explanations provided in stakeholder feedback
Palivizumab was assessed by the Joint Committee on Vaccination and •Immunisation (JCVI), which issued recommendations (updated in 2005) that supported restricted use. The JCVI did not explicitly consider cost effectivenessUse in many countries, such as the USA, may reflect the wider licensed •indications of palivizumabThere is some concern among clinical experts over its clinical and •cost effectivenessPalivizumab has been ‘controlled’ in many UK centres•Paediatricians in the UK may be using palivizumab selectively in babies at the •highest risk of adverse outcomes from respiratory syncytial virus infections, such as those with chronic lung disease requiring home oxygen therapy
Rheumatoid arthritis
Summary of data findings
UK rank: 10 out of 14 UK usage as a percentage of European 5: 106%UK usage as a percentage of European 10: 74%UK usage as a percentage of all countries: 73%
Summary of potential explanations provided in stakeholder feedback
Incidence/prevalence and severity of rheumatoid arthritis varies between •countries, being lower in Mediterranean countries and higher in Scandinavian countries. This may help explain the ranking of Italy (12) and the Scandinavian countriesThere is a positive incentive to use subcutaneous compounds in the NHS – •the opposite may be true in other countries. Infliximab is given intravenously in day-case units, and where health economies can charge for this there may be an incentive to increase intravenous drug useData clearly show the influence of NICE guidance. Adalimumab, etanercept and •rituximab are recommended by NICE and usage appears high in comparison to that in other countries. Abatacept and anakinra are not recommended by NICE and usage seems lower in comparison to that in other countries (particularly for abatacept). In the UK, if a patient fails on an anti-tumour necrosis factor (anti-TNF)
A report for the Secretary of State for Health by Professor Sir Mike Richards CBE
83
drug, they have access to rituximab and not to a second anti-TNF – this may explain the high usage of rituximab, although feedback also suggested that there is still widespread sequential use of anti-TNFs. Guidance in other countries is less stringent in terms of disease activity thresholds The figures may over-represent drug usage in rheumatoid arthritis, as these •medicines are not prescribed exclusively for rheumatoid arthritis (although this is a major use)Dosage and frequency of anti-TNF administration are limited in the UK, less so •in other countriesUK clinical attitudes towards the cost effectiveness of these drugs•Off-label use may be more restricted in the UK•Varying views across countries of what constitutes appropriate use. In the USA, •some patients go onto anti-TNF as a first-line disease-modifying anti-rheumatic drug (DMARD). For most clinicians in the UK, this would seem inappropriateIn New Zealand there is limited access and patients may have to pay for their •own biological therapyThe number of rheumatologists per head of population may influence use•Size of gross domestic product (GDP) may exert an influence – some data from •central/eastern Europe show that the use of biological therapy is less commonThe use of etanercept in the UK may relate to its ease of administration, strong •homecare delivery and relative cost
Second-generation antipsychotic drugs
Summary of data findings
UK rank: 11 out of 14 UK usage as a percentage of European 5: 94%UK usage as a percentage of European 10: 87%UK usage as a percentage of all countries: 79%
Summary of potential explanations provided in stakeholder feedback
Some evidence that the treated prevalence of disorder is rather higher in •countries such as the UK with well developed community-based mental health services (care in the community, assertive outreach, etc)Some of the variation will reflect the type of mental health care system. In the •USA there are wide variations in services – some of those who receive these drugs may get higher doses because of fewer alternatives; others because prescription is more demand-ledLevels of use will be influenced by the number of people with the condition who •are untreated or treated differentlyEvidence-based practice in the UK of using a single agent rather than multiple •higher dose usage is perceived as differing from usage in EuropeLong-acting injectables (LAIs or depots) are used in around 25% of patients with •schizophrenia in the UK, a higher percentage than in most countries, especially the USA. These are mainly first-generation antipsychotic preparations, although
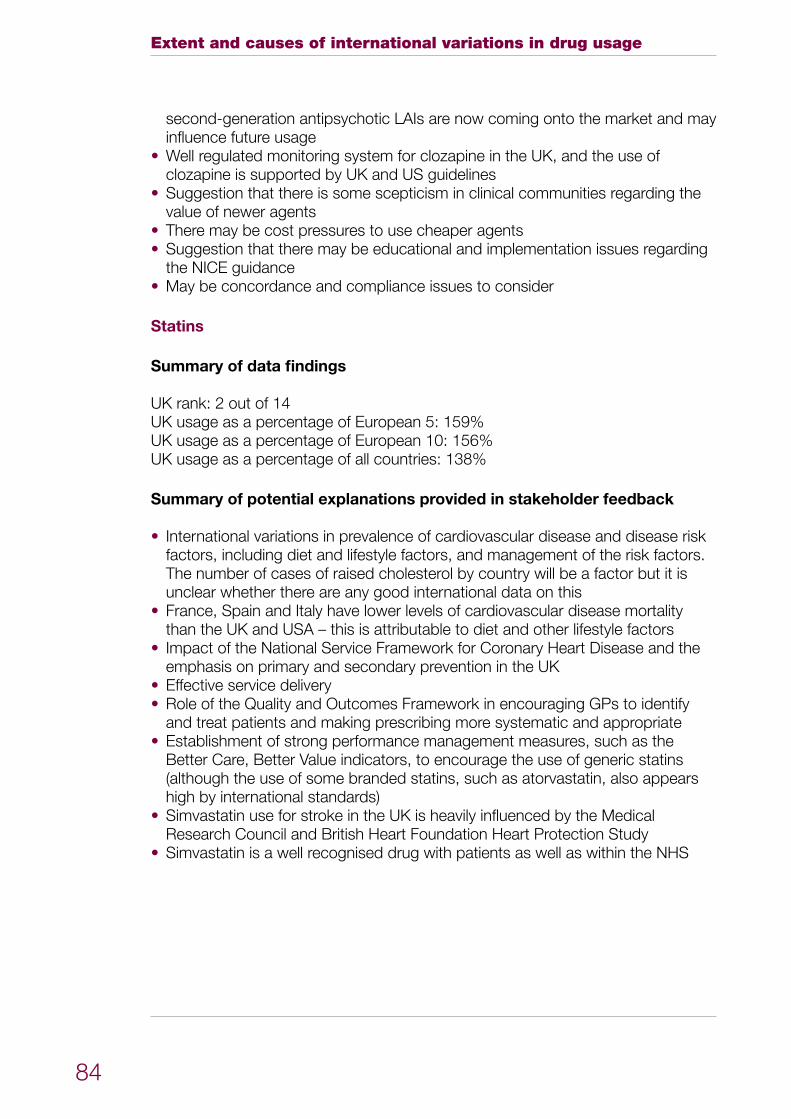
Extent and causes of international variations in drug usage
84
second-generation antipsychotic LAIs are now coming onto the market and may influence future usageWell regulated monitoring system for clozapine in the UK, and the use of •clozapine is supported by UK and US guidelinesSuggestion that there is some scepticism in clinical communities regarding the •value of newer agentsThere may be cost pressures to use cheaper agents •Suggestion that there may be educational and implementation issues regarding •the NICE guidanceMay be concordance and compliance issues to consider•
Statins
Summary of data findings
UK rank: 2 out of 14 UK usage as a percentage of European 5: 159%UK usage as a percentage of European 10: 156%UK usage as a percentage of all countries: 138%
Summary of potential explanations provided in stakeholder feedback
International variations in prevalence of cardiovascular disease and disease risk •factors, including diet and lifestyle factors, and management of the risk factors. The number of cases of raised cholesterol by country will be a factor but it is unclear whether there are any good international data on thisFrance, Spain and Italy have lower levels of cardiovascular disease mortality •than the UK and USA – this is attributable to diet and other lifestyle factorsImpact of the National Service Framework for Coronary Heart Disease and the •emphasis on primary and secondary prevention in the UKEffective service delivery•Role of the Quality and Outcomes Framework in encouraging GPs to identify •and treat patients and making prescribing more systematic and appropriateEstablishment of strong performance management measures, such as the •Better Care, Better Value indicators, to encourage the use of generic statins (although the use of some branded statins, such as atorvastatin, also appears high by international standards)Simvastatin use for stroke in the UK is heavily influenced by the Medical •Research Council and British Heart Foundation Heart Protection StudySimvastatin is a well recognised drug with patients as well as within the NHS•
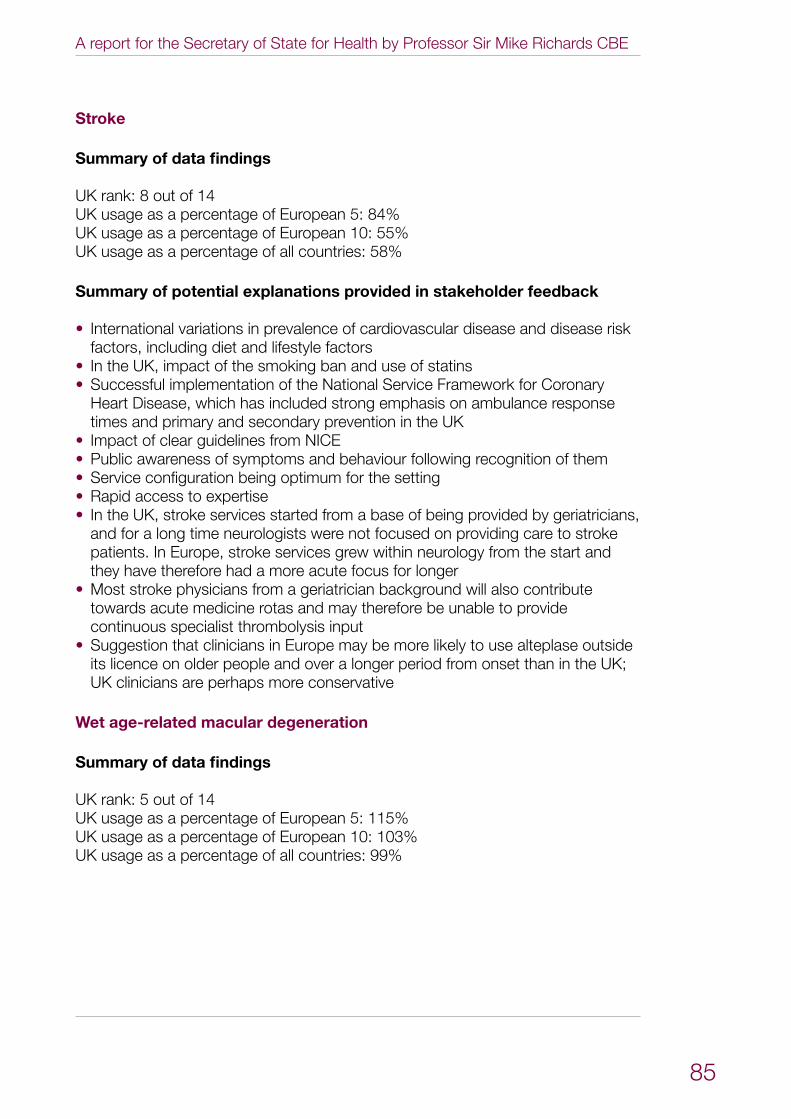
A report for the Secretary of State for Health by Professor Sir Mike Richards CBE
85
Stroke
Summary of data findings
UK rank: 8 out of 14UK usage as a percentage of European 5: 84%UK usage as a percentage of European 10: 55%UK usage as a percentage of all countries: 58%
Summary of potential explanations provided in stakeholder feedback
International variations in prevalence of cardiovascular disease and disease risk •factors, including diet and lifestyle factorsIn the UK, impact of the smoking ban and use of statins•Successful implementation of the National Service Framework for Coronary •Heart Disease, which has included strong emphasis on ambulance response times and primary and secondary prevention in the UKImpact of clear guidelines from NICE•Public awareness of symptoms and behaviour following recognition of them•Service configuration being optimum for the setting•Rapid access to expertise•In the UK, stroke services started from a base of being provided by geriatricians, •and for a long time neurologists were not focused on providing care to stroke patients. In Europe, stroke services grew within neurology from the start and they have therefore had a more acute focus for longerMost stroke physicians from a geriatrician background will also contribute •towards acute medicine rotas and may therefore be unable to provide continuous specialist thrombolysis inputSuggestion that clinicians in Europe may be more likely to use alteplase outside •its licence on older people and over a longer period from onset than in the UK; UK clinicians are perhaps more conservative
Wet age-related macular degeneration Summary of data findings
UK rank: 5 out of 14 UK usage as a percentage of European 5: 115%UK usage as a percentage of European 10: 103%UK usage as a percentage of all countries: 99%
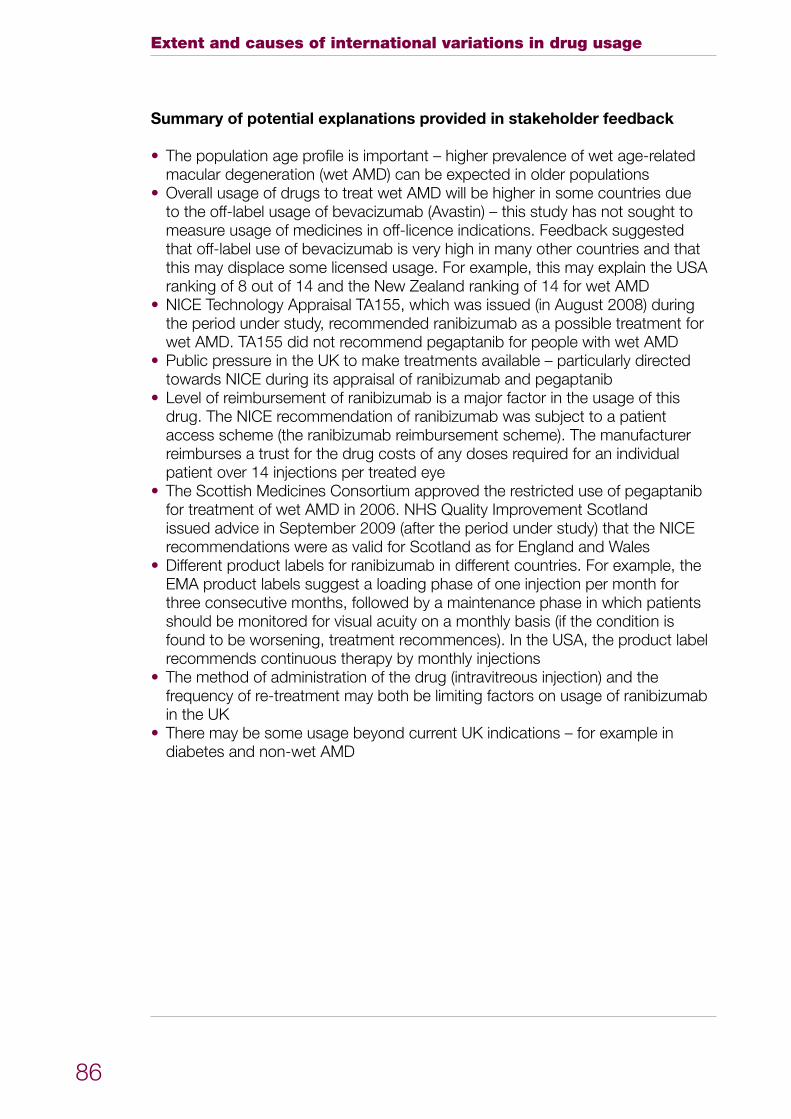
Extent and causes of international variations in drug usage
86
Summary of potential explanations provided in stakeholder feedback
The population age profile is important – higher prevalence of wet age-related •macular degeneration (wet AMD) can be expected in older populationsOverall usage of drugs to treat wet AMD will be higher in some countries due •to the off-label usage of bevacizumab (Avastin) – this study has not sought to measure usage of medicines in off-licence indications. Feedback suggested that off-label use of bevacizumab is very high in many other countries and that this may displace some licensed usage. For example, this may explain the USA ranking of 8 out of 14 and the New Zealand ranking of 14 for wet AMDNICE Technology Appraisal TA155, which was issued (in August 2008) during •the period under study, recommended ranibizumab as a possible treatment for wet AMD. TA155 did not recommend pegaptanib for people with wet AMDPublic pressure in the UK to make treatments available – particularly directed •towards NICE during its appraisal of ranibizumab and pegaptanibLevel of reimbursement of ranibizumab is a major factor in the usage of this •drug. The NICE recommendation of ranibizumab was subject to a patient access scheme (the ranibizumab reimbursement scheme). The manufacturer reimburses a trust for the drug costs of any doses required for an individual patient over 14 injections per treated eyeThe Scottish Medicines Consortium approved the restricted use of pegaptanib •for treatment of wet AMD in 2006. NHS Quality Improvement Scotland issued advice in September 2009 (after the period under study) that the NICE recommendations were as valid for Scotland as for England and WalesDifferent product labels for ranibizumab in different countries. For example, the •EMA product labels suggest a loading phase of one injection per month for three consecutive months, followed by a maintenance phase in which patients should be monitored for visual acuity on a monthly basis (if the condition is found to be worsening, treatment recommences). In the USA, the product label recommends continuous therapy by monthly injectionsThe method of administration of the drug (intravitreous injection) and the •frequency of re-treatment may both be limiting factors on usage of ranibizumab in the UKThere may be some usage beyond current UK indications – for example in •diabetes and non-wet AMD
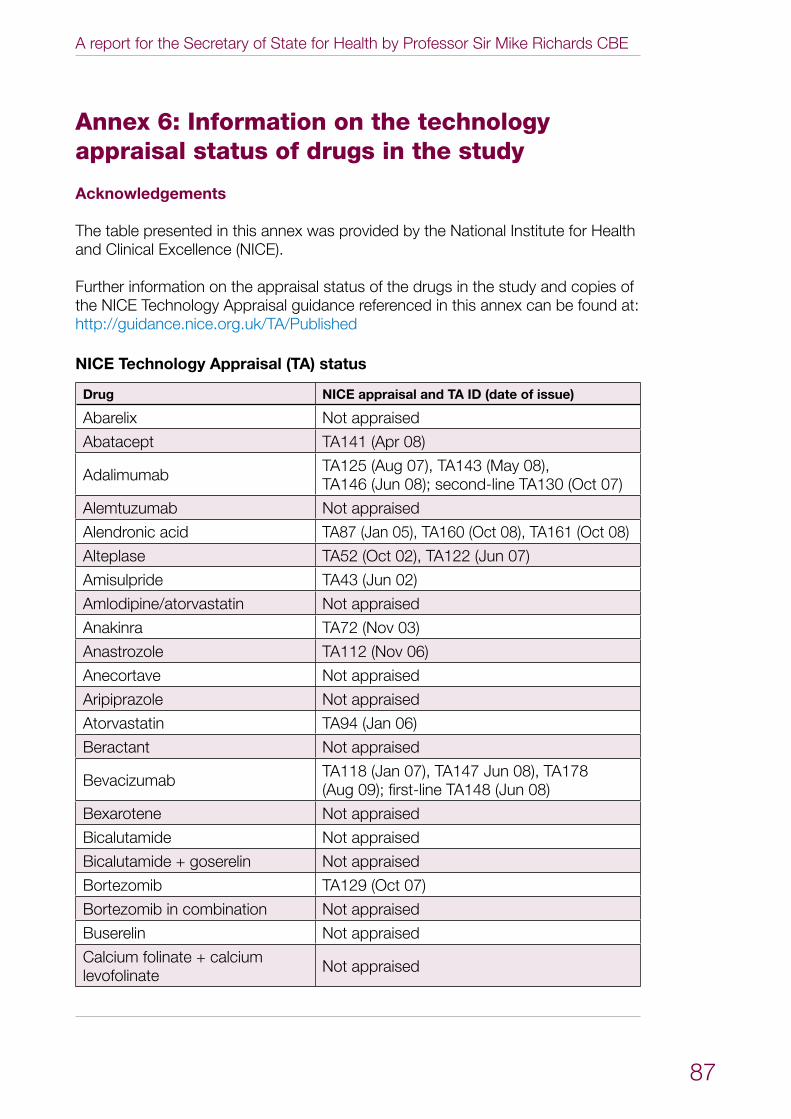
A report for the Secretary of State for Health by Professor Sir Mike Richards CBE
87
Annex 6: Information on the technology appraisal status of drugs in the study
Acknowledgements
The table presented in this annex was provided by the National Institute for Health and Clinical Excellence (NICE).
Further information on the appraisal status of the drugs in the study and copies of the NICE Technology Appraisal guidance referenced in this annex can be found at: http://guidance.nice.org.uk/TA/Published
NICE Technology Appraisal (TA) status
Drug NICE appraisal and TA ID (date of issue)
Abarelix Not appraised
Abatacept TA141 (Apr 08)
Adalimumab TA125 (Aug 07), TA143 (May 08), TA146 (Jun 08); second-line TA130 (Oct 07)
Alemtuzumab Not appraised
Alendronic acid TA87 (Jan 05), TA160 (Oct 08), TA161 (Oct 08)
Alteplase TA52 (Oct 02), TA122 (Jun 07)
Amisulpride TA43 (Jun 02)
Amlodipine/atorvastatin Not appraised
Anakinra TA72 (Nov 03)
Anastrozole TA112 (Nov 06)
Anecortave Not appraised
Aripiprazole Not appraised
Atorvastatin TA94 (Jan 06)
Beractant Not appraised
Bevacizumab TA118 (Jan 07), TA147 Jun 08), TA178 (Aug 09); first-line TA148 (Jun 08)
Bexarotene Not appraised
Bicalutamide Not appraised
Bicalutamide + goserelin Not appraised
Bortezomib TA129 (Oct 07)
Bortezomib in combination Not appraised
Buserelin Not appraised
Calcium folinate + calcium levofolinate Not appraised
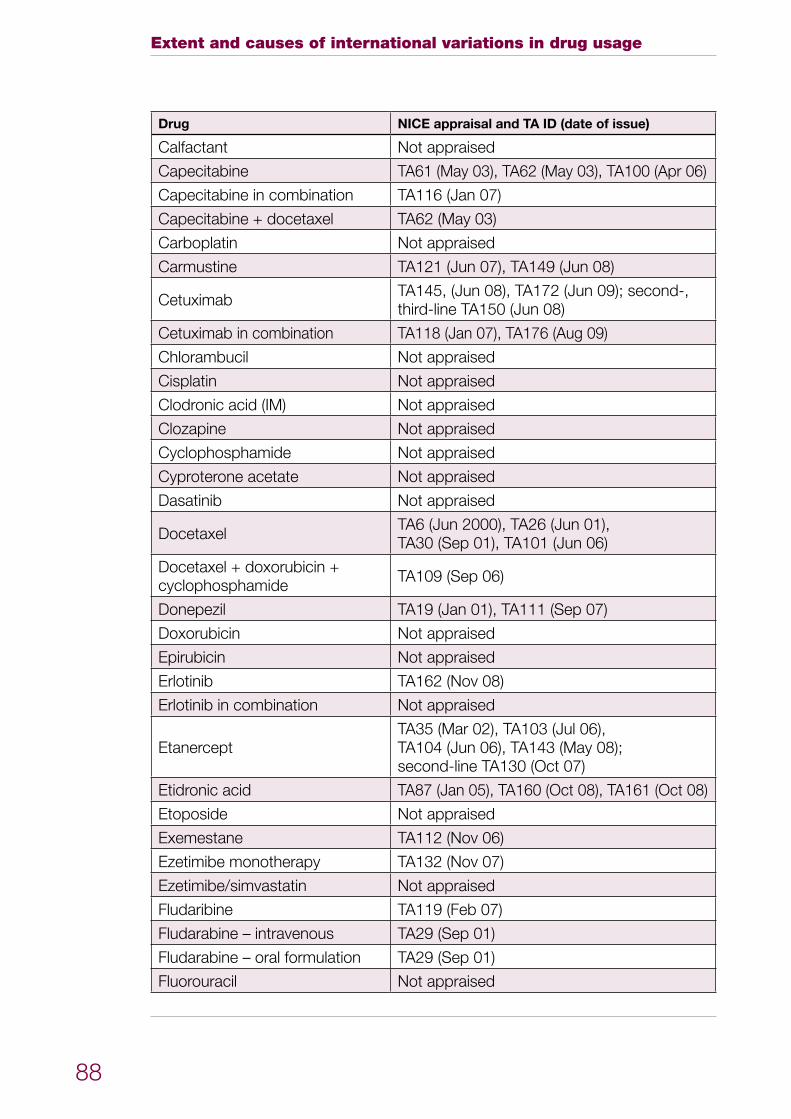
Extent and causes of international variations in drug usage
88
Drug NICE appraisal and TA ID (date of issue)
Calfactant Not appraised
Capecitabine TA61 (May 03), TA62 (May 03), TA100 (Apr 06)
Capecitabine in combination TA116 (Jan 07)
Capecitabine + docetaxel TA62 (May 03)
Carboplatin Not appraised
Carmustine TA121 (Jun 07), TA149 (Jun 08)
Cetuximab TA145, (Jun 08), TA172 (Jun 09); second-, third-line TA150 (Jun 08)
Cetuximab in combination TA118 (Jan 07), TA176 (Aug 09)
Chlorambucil Not appraised
Cisplatin Not appraised
Clodronic acid (IM) Not appraised
Clozapine Not appraised
Cyclophosphamide Not appraised
Cyproterone acetate Not appraised
Dasatinib Not appraised
Docetaxel TA6 (Jun 2000), TA26 (Jun 01), TA30 (Sep 01), TA101 (Jun 06)
Docetaxel + doxorubicin + cyclophosphamide TA109 (Sep 06)
Donepezil TA19 (Jan 01), TA111 (Sep 07)
Doxorubicin Not appraised
Epirubicin Not appraised
Erlotinib TA162 (Nov 08)
Erlotinib in combination Not appraised
EtanerceptTA35 (Mar 02), TA103 (Jul 06), TA104 (Jun 06), TA143 (May 08); second-line TA130 (Oct 07)
Etidronic acid TA87 (Jan 05), TA160 (Oct 08), TA161 (Oct 08)
Etoposide Not appraised
Exemestane TA112 (Nov 06)
Ezetimibe monotherapy TA132 (Nov 07)
Ezetimibe/simvastatin Not appraised
Fludaribine TA119 (Feb 07)
Fludarabine – intravenous TA29 (Sep 01)
Fludarabine – oral formulation TA29 (Sep 01)
Fluorouracil Not appraised
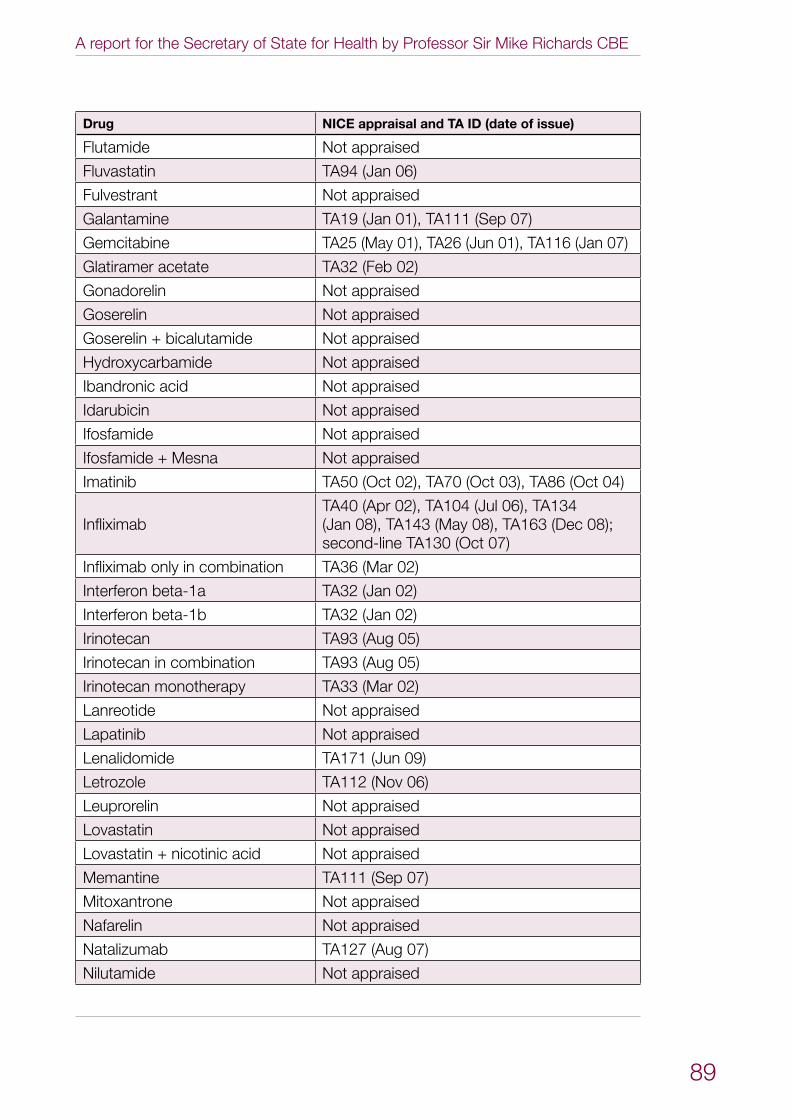
A report for the Secretary of State for Health by Professor Sir Mike Richards CBE
89
Drug NICE appraisal and TA ID (date of issue)
Flutamide Not appraised
Fluvastatin TA94 (Jan 06)
Fulvestrant Not appraised
Galantamine TA19 (Jan 01), TA111 (Sep 07)
Gemcitabine TA25 (May 01), TA26 (Jun 01), TA116 (Jan 07)
Glatiramer acetate TA32 (Feb 02)
Gonadorelin Not appraised
Goserelin Not appraised
Goserelin + bicalutamide Not appraised
Hydroxycarbamide Not appraised
Ibandronic acid Not appraised
Idarubicin Not appraised
Ifosfamide Not appraised
Ifosfamide + Mesna Not appraised
Imatinib TA50 (Oct 02), TA70 (Oct 03), TA86 (Oct 04)
InfliximabTA40 (Apr 02), TA104 (Jul 06), TA134 (Jan 08), TA143 (May 08), TA163 (Dec 08); second-line TA130 (Oct 07)
Infliximab only in combination TA36 (Mar 02)
Interferon beta-1a TA32 (Jan 02)
Interferon beta-1b TA32 (Jan 02)
Irinotecan TA93 (Aug 05)
Irinotecan in combination TA93 (Aug 05)
Irinotecan monotherapy TA33 (Mar 02)
Lanreotide Not appraised
Lapatinib Not appraised
Lenalidomide TA171 (Jun 09)
Letrozole TA112 (Nov 06)
Leuprorelin Not appraised
Lovastatin Not appraised
Lovastatin + nicotinic acid Not appraised
Memantine TA111 (Sep 07)
Mitoxantrone Not appraised
Nafarelin Not appraised
Natalizumab TA127 (Aug 07)
Nilutamide Not appraised
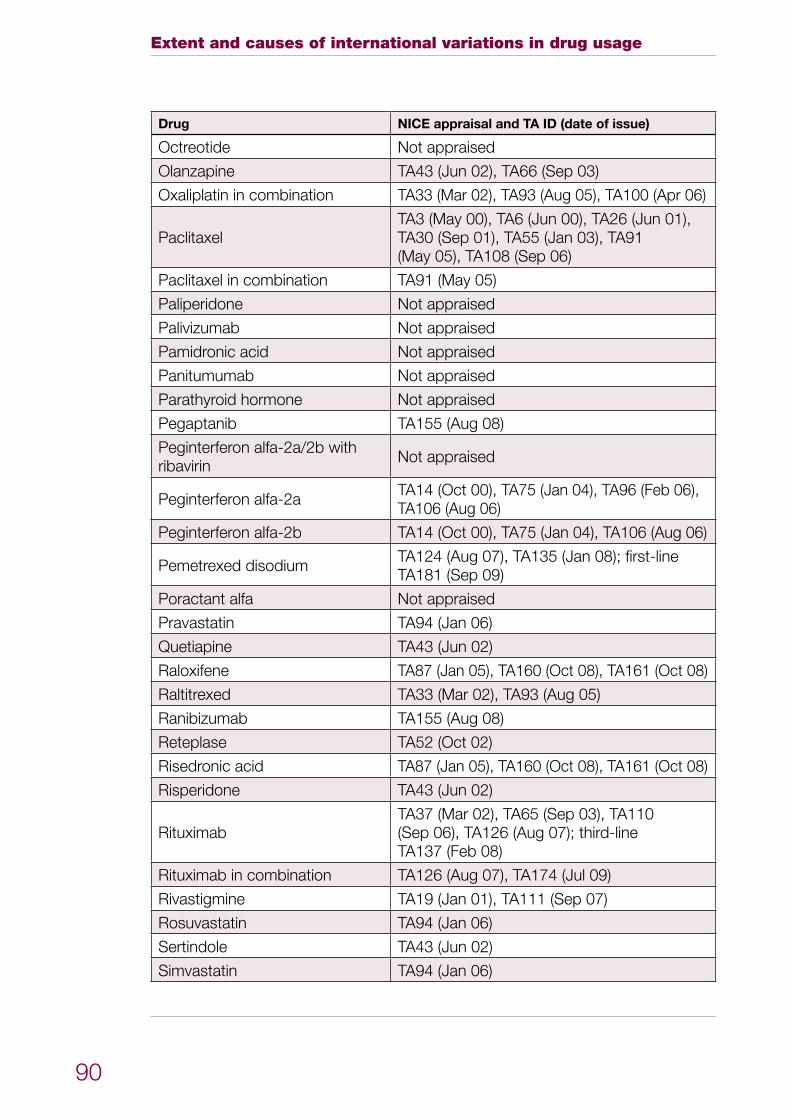
Extent and causes of international variations in drug usage
90
Drug NICE appraisal and TA ID (date of issue)
Octreotide Not appraised
Olanzapine TA43 (Jun 02), TA66 (Sep 03)
Oxaliplatin in combination TA33 (Mar 02), TA93 (Aug 05), TA100 (Apr 06)
PaclitaxelTA3 (May 00), TA6 (Jun 00), TA26 (Jun 01), TA30 (Sep 01), TA55 (Jan 03), TA91 (May 05), TA108 (Sep 06)
Paclitaxel in combination TA91 (May 05)
Paliperidone Not appraised
Palivizumab Not appraised
Pamidronic acid Not appraised
Panitumumab Not appraised
Parathyroid hormone Not appraised
Pegaptanib TA155 (Aug 08)
Peginterferon alfa-2a/2b with ribavirin Not appraised
Peginterferon alfa-2a TA14 (Oct 00), TA75 (Jan 04), TA96 (Feb 06), TA106 (Aug 06)
Peginterferon alfa-2b TA14 (Oct 00), TA75 (Jan 04), TA106 (Aug 06)
Pemetrexed disodium TA124 (Aug 07), TA135 (Jan 08); first-line TA181 (Sep 09)
Poractant alfa Not appraised
Pravastatin TA94 (Jan 06)
Quetiapine TA43 (Jun 02)
Raloxifene TA87 (Jan 05), TA160 (Oct 08), TA161 (Oct 08)
Raltitrexed TA33 (Mar 02), TA93 (Aug 05)
Ranibizumab TA155 (Aug 08)
Reteplase TA52 (Oct 02)
Risedronic acid TA87 (Jan 05), TA160 (Oct 08), TA161 (Oct 08)
Risperidone TA43 (Jun 02)
RituximabTA37 (Mar 02), TA65 (Sep 03), TA110 (Sep 06), TA126 (Aug 07); third-line TA137 (Feb 08)
Rituximab in combination TA126 (Aug 07), TA174 (Jul 09)
Rivastigmine TA19 (Jan 01), TA111 (Sep 07)
Rosuvastatin TA94 (Jan 06)
Sertindole TA43 (Jun 02)
Simvastatin TA94 (Jan 06)
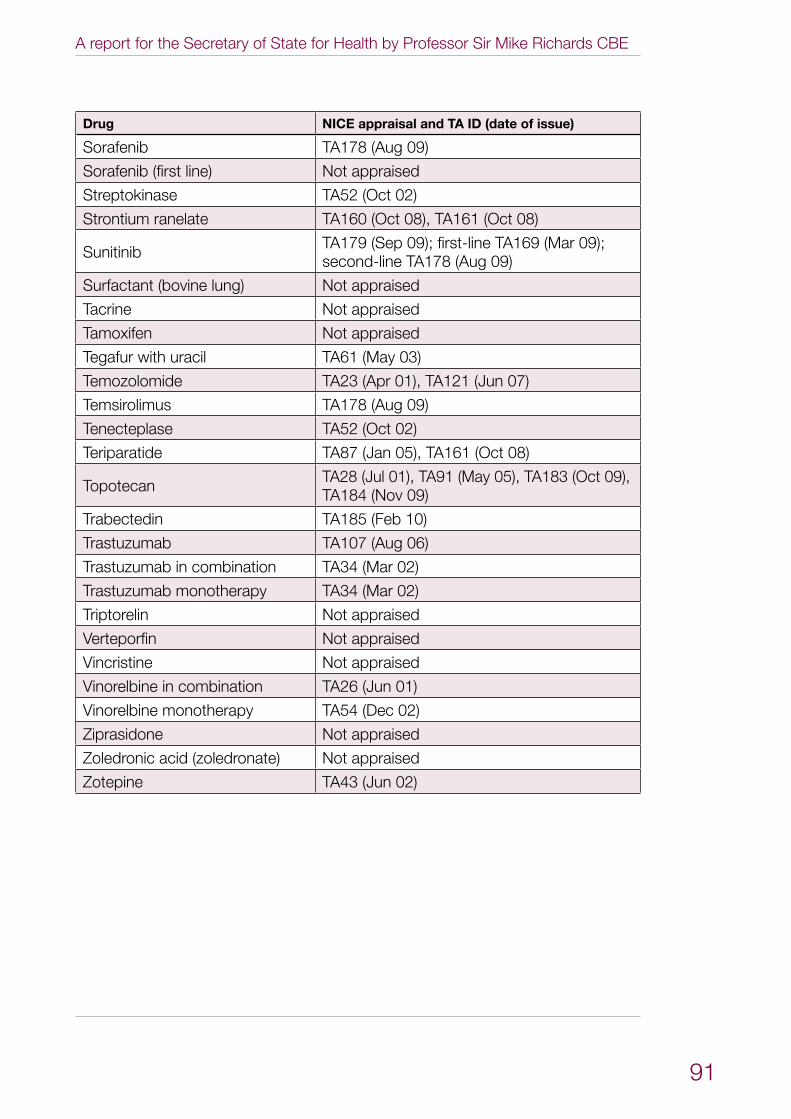
A report for the Secretary of State for Health by Professor Sir Mike Richards CBE
91
Drug NICE appraisal and TA ID (date of issue)
Sorafenib TA178 (Aug 09)
Sorafenib (first line) Not appraised
Streptokinase TA52 (Oct 02)
Strontium ranelate TA160 (Oct 08), TA161 (Oct 08)
Sunitinib TA179 (Sep 09); first-line TA169 (Mar 09);second-line TA178 (Aug 09)
Surfactant (bovine lung) Not appraised
Tacrine Not appraised
Tamoxifen Not appraised
Tegafur with uracil TA61 (May 03)
Temozolomide TA23 (Apr 01), TA121 (Jun 07)
Temsirolimus TA178 (Aug 09)
Tenecteplase TA52 (Oct 02)
Teriparatide TA87 (Jan 05), TA161 (Oct 08)
Topotecan TA28 (Jul 01), TA91 (May 05), TA183 (Oct 09), TA184 (Nov 09)
Trabectedin TA185 (Feb 10)
Trastuzumab TA107 (Aug 06)
Trastuzumab in combination TA34 (Mar 02)
Trastuzumab monotherapy TA34 (Mar 02)
Triptorelin Not appraised
Verteporfin Not appraised
Vincristine Not appraised
Vinorelbine in combination TA26 (Jun 01)
Vinorelbine monotherapy TA54 (Dec 02)
Ziprasidone Not appraised
Zoledronic acid (zoledronate) Not appraised
Zotepine TA43 (Jun 02)
Extent and causes of international variations in drug usage
92
Annex 7: Glossary
Acute myocardial infarction (AMI) – AMI or a heart attack is the death of some heart muscle (myocardium) following a sudden reduction in or cessation of blood flow down a coronary artery due to narrowing or blockage, and confirmed by the presence of elevated cardiac enzymes on a blood sample.
Association of the British Pharmaceutical Industry (ABPI) – The trade association for more than 90 companies in the UK producing prescription medicines for human use. Its member companies research, develop, manufacture and supply more than 80% of the medicines prescribed through the NHS. (Source: ABPI)
Cancer – A term that is used to refer to a number of conditions where the body’s cells begin to grow and reproduce in an uncontrollable way. This rapid growth of cancerous cells is known as a malignant tumour. These cells can then invade and destroy healthy tissue, including organs. Cancer sometimes begins in one part of the body before spreading to other parts. This process is known as metastatis.
Defined daily dose (DDD) – A DDD is the assumed average maintenance dose per day for a drug used for its main indication in adults. A DDD is generated by the World Health Organization (WHO). (Source: WHO)
Dementia – The term dementia is used to describe a syndrome which may be caused by a number of illnesses in which there is a progressive decline in multiple areas of function, including decline in memory, reasoning, communication skills and the ability to carry out daily activities. Alongside this decline, individuals may develop behavioural and psychological symptoms such as depression, psychosis, aggression and wandering, which cause problems in themselves, and complicate care. They can occur at any stage of the illness.
Generic medicine – A copy of a medicine no longer protected by patent, labelled with an approved name or brand name (‘branded generics’). It contains the same active ingredient as an originator’s existing, licensed medicine, although it may be of a different strength and/or presentation. (Source: MHRA)
Health Technology Assessment (HTA) – An HTA is a multidisciplinary process that summarises information about the medical, social, economic and ethical issues related to the use of a health technology in a systematic, transparent, unbiased, robust manner. Its aim is to inform the formulation of safe, effective health policies that are patient focused and seek to achieve best value. Despite its policy goals, HTA must always be firmly rooted in research and the scientific method. (Source: www.eunethta.net/Public/HTA)
Hepatitis C – A blood-borne virus that is spread mainly by contact with the blood of someone who is infected. It can cause long-term infection, leading to inflammation (swelling) and fibrosis (scarring) of the liver tissue, and sometimes serious liver damage.
A report for the Secretary of State for Health by Professor Sir Mike Richards CBE
93
IMS Health – IMS Health provides pharmaceutical and healthcare market intelligence, relied on by virtually all of the world’s largest pharmaceutical companies – along with government agencies, policy makers, researchers and financial analysts around the globe. IMS Health tracks more than 1 million healthcare products daily, from more than 130,000 suppliers worldwide, and captures information from more than 260 million anonymised patient records. These data, integrated with leading analytical expertise, play a central role in supporting high-quality, cost-effective healthcare. (Source: IMS Health)
Indication – An indication is a symptom or particular circumstance that indicates the advisability or necessity of a specific medical treatment or procedure.
Intravenous – Within a vein or veins.
Licence – A very broad term applied to a variety of authorisations granted by regulatory bodies. A medicinal product licence is more correctly described as a marketing authorisation. (Source: MHRA)
Multiple sclerosis (MS) (also called disseminated sclerosis or encephalomyelitis disseminata) – A chronic auto-immune neurological disease characterised by damage to the myelin coating of nerve cells in the brain, spinal cord and the central nervous system. For some people, MS is characterised by periods of relapse and remission while for others it has a progressive pattern. (Source: Department for Work and Pensions)
National Institute for Health and Clinical Excellence (NICE) – NICE is an independent organisation responsible for providing national guidance on promoting good health and preventing and treating ill health. (Source: NICE)
Osteoporosis – A progressive, systemic skeletal disorder characterised by low bone mass and microarchitectural deterioration of bone tissue, with a consequent increase in bone fragility and susceptibility to fracture. (Source: NICE)
Patent – A patent protects new inventions and covers how things work, what they do, how they do it, what they are made of and how they are made. It gives the owner the right to prevent others from making, using, importing or selling the invention without permission. (Source: www.ipo.gov.uk/types/patent/p-about/p-whatis.htm)
Percutaneous coronary intervention (PCI) – PCI encompasses a variety of procedures used to treat patients with diseased coronary arteries caused by a build-up of cholesterol, inflammatory material and scar tissue in the walls of arteries (referred to as plaque or atheroma) which can reduce blood flow. When plaque becomes ‘unstable’ and initiates blood clot formation within a coronary artery, the artery can become abruptly occluded, causing a heart attack (myocardial infarction – see above). Typically, PCI is performed by threading a slender balloon-tipped tube – a catheter – from an artery in the groin or wrist to a trouble spot in an artery of the heart (this is referred to as percutaneous
Extent and causes of international variations in drug usage
94
transluminal coronary angioplasty – also known as PTCA, coronary artery balloon dilatation or balloon angioplasty).
Primary PCI (PPCI) or primary angioplasty – PPCI refers to PCI being the first treatment to restore coronary blood supply in cases of heart attack.
RAND Europe – RAND Europe is an independent not-for-profit research organisation whose mission is to improve policy and decision making through research and analysis. RAND Europe’s clients include European governments, institutions, non-governmental organisations and firms with a need for rigorous, independent, multidisciplinary analysis. (Source: RAND Europe)
Respiratory distress syndrome (RDS) – RDS of the newborn occurs mainly in premature babies. It is due to a lack in the immature infant’s lungs of the chemicals (surfactants) that enable the lungs to work effectively and absorb adequate amounts of oxygen. The affected infant will develop difficulty breathing and will need support, which may include intensive care if he or she becomes seriously ill.
Respiratory syncytial virus (RSV) – A virus which causes coughs and colds but in infants can cause bronchiolitis, an inflammation in the small airways in the lung which causes difficulty breathing. Infants born prematurely who have had severe and prolonged breathing problems after birth may be severely affected by RSV infection.
Rheumatoid arthritis (RA) – A chronic and progressive disabling disease characterised by inflammation, predominantly of the synovial tissue lining of multiple joints, characteristically affecting small joints of the hands and feet symmetrically, though any joint may be affected. The inflammation causes pain and stiffness of joints and their progressive destruction, as well as other symptoms such as fatigue. (Source: an amalgamation of definitions from NICE guidance)
Second-generation antipsychotics (also known as atypical antipsychotics) – A group of antipsychotic drugs used to treat psychiatric conditions.
Statins – Cholesterol-lowering medicines. They may be used to treat primary hypercholesterolaemia, a high level of cholesterol in the blood, usually due to lifestyle factors such as a diet high in fat or not doing enough exercise; and familial hypercholesterolaemia, a high level of cholesterol in the blood due to a hereditary gene which means the liver makes lots of cholesterol.
Stroke – The damaging or killing of brains cells as a result of the blood and oxygen supply to part of the brain being cut off. Types of stroke include ischaemic stroke caused by blood clots to the brain, and haemorrhagic stroke caused by bleeding into/of the brain.
A report for the Secretary of State for Health by Professor Sir Mike Richards CBE
95
Subcutaneous – Subcutaneous implies just under the skin. With a subcutaneous injection, a needle is inserted just under the skin. A drug (for example insulin) can then be delivered into the subcutaneous tissues. After the injection, the drug moves into small blood vessels and the bloodstream. (Source: www.medterms.com/script/main/art.asp?articlekey=8265)
Thrombolysis – The use of drugs to break up a blood clot.
Age-related macular degeneration (AMD) – Macular degeneration is a painless eye condition that leads to the gradual loss of central vision (the ability to see what is directly in front). There are two types of macular degeneration: dry macular degeneration (also called non-neovascular) affects the eyes gradually, and wet macular degeneration (also called neovascular) can develop very quickly, and is more serious than dry macular degeneration.
World Health Organization (WHO) – WHO is the directing and coordinating authority for health within the United Nations system. It is responsible for providing leadership on global health matters, shaping the health research agenda, setting norms and standards, articulating evidence-based policy options, providing technical support to countries and monitoring and assessing health trends. (Source: WHO)

© Crown copyrightProduced by COI
401229 1p July 10
Related Documents