Expression Profiling of the Wheat Pathogen Zymoseptoria tritici Reveals Genomic Patterns of Transcription and Host-Specific Regulatory Programs The Harvard community has made this article openly available. Please share how this access benefits you. Your story matters Citation Kellner, Ronny, Amitava Bhattacharyya, Stephan Poppe, Tiffany Y. Hsu, Rachel B. Brem, and Eva H. Stukenbrock. 2014. “Expression Profiling of the Wheat Pathogen Zymoseptoria tritici Reveals Genomic Patterns of Transcription and Host-Specific Regulatory Programs.” Genome Biology and Evolution 6 (6): 1353-1365. doi:10.1093/gbe/evu101. http://dx.doi.org/10.1093/gbe/evu101. Published Version doi:10.1093/gbe/evu101 Citable link http://nrs.harvard.edu/urn-3:HUL.InstRepos:12717444 Terms of Use This article was downloaded from Harvard University’s DASH repository, and is made available under the terms and conditions applicable to Other Posted Material, as set forth at http:// nrs.harvard.edu/urn-3:HUL.InstRepos:dash.current.terms-of- use#LAA

Welcome message from author
This document is posted to help you gain knowledge. Please leave a comment to let me know what you think about it! Share it to your friends and learn new things together.
Transcript

Expression Profiling of the WheatPathogen Zymoseptoria tritici RevealsGenomic Patterns of Transcription and
Host-Specific Regulatory ProgramsThe Harvard community has made this
article openly available. Please share howthis access benefits you. Your story matters
Citation Kellner, Ronny, Amitava Bhattacharyya, Stephan Poppe, Tiffany Y.Hsu, Rachel B. Brem, and Eva H. Stukenbrock. 2014. “ExpressionProfiling of the Wheat Pathogen Zymoseptoria tritici RevealsGenomic Patterns of Transcription and Host-Specific RegulatoryPrograms.” Genome Biology and Evolution 6 (6): 1353-1365.doi:10.1093/gbe/evu101. http://dx.doi.org/10.1093/gbe/evu101.
Published Version doi:10.1093/gbe/evu101
Citable link http://nrs.harvard.edu/urn-3:HUL.InstRepos:12717444
Terms of Use This article was downloaded from Harvard University’s DASHrepository, and is made available under the terms and conditionsapplicable to Other Posted Material, as set forth at http://nrs.harvard.edu/urn-3:HUL.InstRepos:dash.current.terms-of-use#LAA
Expression Profiling of the Wheat Pathogen Zymoseptoria
tritici Reveals Genomic Patterns of Transcription and
Host-Specific Regulatory Programs
Ronny Kellner1,*, Amitava Bhattacharyya1, Stephan Poppe1, Tiffany Y. Hsu2,3, Rachel B. Brem2,4, andEva H. Stukenbrock1
1Max Planck Institute for Terrestrial Microbiology, Max Planck Research Group, Fungal Biodiversity, Marburg, Germany2Department of Molecular and Cell Biology, University of California, Berkeley3Present address: Graduate Program in Biological and Biomedical Sciences, Harvard Medical School, Boston, MA4Present address: Buck Institute for Research on Aging, Novato, CA
*Corresponding author: E-mail: [email protected].
Accepted: May 8, 2014
Data deposition: This project has been deposited at NCBI Gene Expression Omnibus Series under the accession number GSE54874.
Abstract
Host specialization by pathogens requires a repertoire of virulence factors as well as fine-tuned regulation of gene expression. The
fungal wheat pathogen Zymoseptoria tritici (synonym Mycosphaerella graminicola) is a powerful model system for the discovery of
genetic elements that underlie virulence and host specialization. We transcriptionally profiled the early stages of Z. tritici infection of a
compatible host (wheat) and a noncompatible host (Brachypodium distachyon). The results revealed infection regulatory programs
common to both hosts and genes with striking wheat-specific expression, with many of the latter showing sequence signatures of
positive selection along the Z. tritici lineage. Genes specifically regulated during infection of wheat populated two large clusters of
coregulated genes that may represent candidate pathogenicity islands. On evolutionarily labile, repeat-rich accessory chromosomes
(ACs), we identified hundreds of highly expressed genes with signatures of evolutionary constraint and putative biological function.
Phylogenetic analyses suggested that gene duplication events on these ACs were rare and largely preceded the diversification of
Zymoseptoria species. Together, our data highlight the likely relevance for fungal growth and virulence of hundreds of Z. tritici genes,
deepening the annotation and functional inference of the genes of this model pathogen.
Key words: RNA-seq, supernumerary chromosomes, gene duplication, plant pathogenic fungi, host adaptation,
Mycosphaerella graminicola.
Introduction
Many parasites have evolved strict specificities to particular
hosts. Specialization is mediated by an ability to suppress
host defenses and by adaptation to host substrates, within-
host proliferation, dispersal, or reproduction. How pathogens
acquire such attributes and achieve specialization is one of the
central questions of modern ecological genetics. In plant path-
ogens, a handful of landmark studies have mapped genes that
drive host specificity (Hacquard et al. 2013), some of which
are characterized by positioning in distinct, rapidly evolving
regions of the genome (Ma et al. 2010; Rouxel et al. 2011;
De Jonge et al. 2012). For the majority of pathogen–host
interactions, however, the genomic and molecular basis of
specialization remains unknown.
The wheat pathogen Zymoseptoria tritici (synonym
Mycosphaerella graminicola) is a powerful model system for
the study of the evolution of host specificity. The genome of
one isolate has been fully sequenced from telomere to telo-
mere revealing 13 core chromosomes (CCs) and a set of eight
repeat-rich accessory chromosomes (ACs; Goodwin et al.
2011). ACs resemble B-chromosomes of plants, and, in
comparison to the core genome, they appear to evolve
under less selective constraint (Stukenbrock et al. 2011) and
undergo more frequent intrachromosomal recombination,
GBE
� The Author(s) 2014. Published by Oxford University Press on behalf of the Society for Molecular Biology and Evolution.
This is an Open Access article distributed under the terms of the Creative Commons Attribution Non-Commercial License (http://creativecommons.org/licenses/by-nc/3.0/), which permits
non-commercial re-use, distribution, and reproduction in any medium, provided the original work is properly cited. For commercial re-use, please contact [email protected]
Genome Biol. Evol. 6(6):1353–1365. doi:10.1093/gbe/evu101 Advance Access publication May 14, 2014 1353
translocations, and nondisjunctions during meiosis (Covert
1998; Wittenberg et al. 2009; Ma et al. 2010; Raffaele and
Kamoun 2012; Croll et al. 2013). Compared with other fungal
species with ACs, Z. tritici has an unusual high number of
these small chromosomes. As many as eight ACs have been
documented in one isolate (Goodwin et al. 2011), yet the
functional relevance of these chromosomes in Z. tritici remains
poorly understood.
Zymoseptoria tritici is globally distributed, has a hemibio-
trophic lifestyle, and is specialized to domesticated bread
wheat, Triticum aestivum, and durum wheat, T. durum
(Brokenshire 1975; Eyal et al. 1985; Banke and McDonald
2005). This pathogen uses no special structures such as ap-
pressoria or haustoria for penetration of host tissues (Kema et
al. 1996). Instead, Z. tritici enters its host through stomatal
openings and establishes an intercellular hyphal network
that resembles endophytic rather than intimate biotrophic
growth (Kema et al. 1996; Brunner et al. 2013). After a
long latent period, the fungus switches to necrotrophic
growth. Genome and transcriptome sequencing, and com-
parative analysis with other Dothideomycete genomes, have
provided insight into the gene content of Z. tritici but have not
revealed how the pathogen can proliferate in tissue of suscep-
tible wheat lines without inducing resistance responses
(Goodwin et al. 2011; Ohm et al. 2012; Yang et al. 2013).
When infecting other grass hosts such as Brachypodium dis-
tachyon or Agropyron repens, Z. tritici also penetrates the leaf
surface through stomata but infection is stopped in the sub-
stomatal cavity (Haueisen J and Stukenbrock E unpublished
data). This suggests an early recognition and interaction be-
tween host and pathogen at which Z. tritici can manipulate
host defenses in susceptible wheat lines.
In this work, we set out to identify candidate determinants
of host specificity in Z. tritici using transcriptional profiles of
early-stage infections of two grasses: wheat, the compatible
host, and B. distachyon, a noncompatible host. We developed
a novel pipeline for analysis of RNA-seq from Z. tritici collected
in planta. With the data, we characterized distinct regulatory
programs activated during infection of wheat, and the evolu-
tionary and functional signatures of genes with host-specific
expression patterns. To gain insight into the functional rele-
vance of AC-encoded genes in Z. tritici, we furthermore
explored both genome and transcriptome data with respect
to differences between essential CCs and ACs.
Materials and Methods
Strains and Growth Conditions
All experiments used Z. tritici isolate IPO323 (Kema and van
Silfhout 1997). Cultures were inoculated onto solid YMS agar
(4 g yeast extract, 4 g malt extract, 4 g sucrose, 20 g bacto
agar, 1 l H2O) at 18 �C. For transcriptional profiling of axenic
culture, yeast-like cells were isolated from these plates after
72 h. For transcriptional profiling of plant infections, 15-day-
old wheat seedlings of the cultivar Obelisk and the B. distach-
yon accession Bd21 were inoculated as follows. A distinct area
of the second leaf (10–15 cm) was marked, and a spore solu-
tion of 1�107 yeast cells/ml containing 0.1% Tween 20 was
brushed onto these areas. After an initial incubation for 48 h
at 100% humidity and 22 �C, inoculated plants were incu-
bated with a 16 h light period at 75% humidity and 22 �C
for 4 days.
RNA-Seq
To extract total RNA from fungal axenic culture or freeze-dried
leaf tissue infected with Z. tritici, 100 mg of sample was
crushed in liquid nitrogen, and total RNA was extracted
using the TRIZOL reagent (Invitrogen) following the manufac-
turer’s protocol. RNA samples were purified twice with Dynal
oligo(dT) magnetic beads (Invitrogen), following the manufac-
turer’s instructions. Illumina RNA-seq libraries for axenic cul-
ture replicates were prepared from an input of 10mg total
purified polyA RNA according to Palma-Guerrero et al.
(2013). Axenic culture libraries were sequenced on an
Illumina Genome Analyzer II in the Functional Genomics
Laboratory at the University of California, Berkeley, applying
standard Illumina operating procedures. RNA-seq libraries for
plant infection replicates were prepared from an input of 4mg
total purified polyA RNA according to recommendations of
the supplier (TruSeq RNA sample preparation v2 guide,
Illumina). Libraries were quantified by fluorometry, immobi-
lized, and processed onto a flow cell with a cBot (Illumina)
followed by sequencing-by-synthesis with TruSeq v3 chemistry
on a HiSeq2000 at the Max Planck Genome Center, Cologne.
RNA-seq data for all samples has been deposited in National
Center for Biotechnology Information’s (NCBI) Gene
Expression Omnibus (Edgar et al. 2002) and are accessible
through GEO Series accession number GSE54874
(http://www.ncbi.nlm.nih.gov/geo/query/acc.cgi?acc¼GSE54
874, last accessed May 23, 2014).
RNA-seq Read Filtering and Mapping
Single-end RNA-seq reads were filtered for quality and for
homology to the genomes of T. aestivum (Brenchley et al.
2012) and B. distachyon (accession Bd21, International
Brachypodium Initiative 2010). The workflow for analyses of
the RNA-seq data is given in supplementary figure S2,
Supplementary Material online. Briefly, RNA-seq reads were
analyzed and filtered using the grooming, trimming, filtering,
and masking tools from the Galaxy server (www.galaxypro
ject.org, last accessed May 23, 2014). Trimming parameters
for each data set were specified after quality control using the
NGS QC toolkit (Patel and Jain 2012, supplementary table S1,
Supplementary Material online). Fungal RNA-seq reads from
infected plants were trimmed 12 bp from the left end and
15 bp from the right end, resulting in a final read length of
Kellner et al. GBE
1354 Genome Biol. Evol. 6(6):1353–1365. doi:10.1093/gbe/evu101 Advance Access publication May 14, 2014
80 bp (supplementary table S1, Supplementary Material
online). Reads from axenic culture were only trimmed from
the left end, resulting in a final read length of 38 bp. Reads
with an overall quality score below 20 and reads having less
than 25% of nucleotides with a quality score above 20 were
discarded. For the remaining reads, nucleotides with quality
scores below 20 were masked with Ns.
To account for incorrect mapping of plant reads with high
similarity to fungal sequences, reads from infected plant tissue
were mapped to both the plant genomes and the genome of
Z. tritici IPO323. All plant reads were removed from further
downstream analyses. To this end, reads with 100% identity
to the plant genomes and a maximum of 25% N positions
were filtered out in fastq_screen v0.4.1 (www.bioinformatics.
babraham.ac.uk/projects/fastq_screen, last accessed May 23,
2014) applying a sensitive local Bowtie2 alignment (supple-
mentary fig. S1, Supplementary Material online).
Mapping of single end RNA-seq reads to the genome of the
Z. tritici isolate IPO323 (Goodwin et al. 2011) was carried out
with tophat v2.0.9 (Kim et al. 2013). Mapping was disabled for
novel splice discovery and used the JGI transcript annotation of
IPO323 as reference (Goodwin et al. 2011; http://genome.jgi.
doe.gov/Mycgr3/Mycgr3.home.html, last accessed May 23,
2014). The maximum number of read mismatches and read
gap length were set to 2. Multiple mappings of single reads
was set to 10 (default: 20) to decrease the bias for genes with
more multimapping reads. In total, 2.3% and 3.8% of fungal
reads of infected T. aestivum and B. distachyon, and 5.7%
reads of axenic culture were mapped to multiple positions
in the genome of IPO323 (supplementary table S1,
Supplementary Material online). Relative abundances for pre-
dicted transcripts of IPO323 were estimated in Cufflinks v2.1.1
(Trapnell et al. 2012). Total read counts per transcript were
estimated in htseq-count (http://www-huber.embl.de/users/
anders/HTSeq/doc/count.html, last accessed May 23, 2014)
applying the intersection-strict mode.
Coding and protein sequences of candidate genes were
surveyed for orthology and homologous domains using
NCBI BLAST (Altschul et al. 1990, 1997) and SMART
(Schultz et al. 1998; Letunic et al. 2009) searches.
Transcriptional Profiling
For detection of expressed genes, we set a minimal reads per
kilobase per million reads (RPKM) threshold of >2 according
to a comparison with the coverage of putative noncoding loci
as follows. We first defined a representative set of noncoding
loci by masking the genome for 1) transcripts, 2) 500 bp up-
stream and downstream flanking regions of each transcript,
and 3) transposable elements. Transposable element predic-
tions relied on modified parameters of Goodwin et al. (2011)
(Grandaubert J and Stukenbrock E unpublished data). The
remaining loci were filtered for sequences �300 bp length,
resulting in a set of 5,394 noncoding loci of 300–11,833 bp
length, covering 7.81 Mb of the genome. The median RPKM
values for such noncoding loci in libraries from axenic culture,
4 dpi on T. aestivum, and 4 dpi on B. distachyon were 1.1, 2.3,
and 2.1, respectively. The distribution of RPKM values of these
nontranscribed loci clearly differed from the RPKM distribution
of transcripts (supplementary fig. S10, Supplementary
Material online).
For sliding window analyses of transcription, a gtf file with
respective window sizes for the genome of IPO323 was cre-
ated and applied for read mapping. Genome-wide transcrip-
tion was visualized with Circos (Krzywinski et al. 2009).
RNA-seq sample relations were evaluated based on multidi-
mensional scaling using the plotMDS package of DESeq
(Anders and Huber 2010) in R (www.R-project.org, last
accessed May 23, 2014). Significantly differentially transcribed
genes were identified using the bioconductor packages DESeq
(Anders and Huber 2010) and EdgeR (McCarthy et al. 2012) in
R (www.R-project.org, last accessed May 23, 2014) applying
the Trimmed Mean Method for total tag count normalization
in EdgeR and a false discovery rate P value of 0.01. Inference
of secreted gene products was based on the identification of
secretion signals by Morais do Amaral et al. (2012).
Differential expression patterns in RNA-seq analyses were ver-
ified and confirmed by qRT-polymerase chain reaction (PCR)
for six genes of Z. tritici, namely Mg32609, Mg41093,
Mg42222, Mg49575, Mg70993, and Mg107320 (supple-
mentary fig. S9, Supplementary Material online) using meth-
ods as follows. cDNAs from RNA-seq samples were used in a
qRT-PCR experiment using the iQ SYBR Green Supermix Kit
(Bio-Rad, Munich, Germany) with gene-specific primers and
an annealing temperature of 59 �C. The housekeeping gene
glyceraldehyde-3-phosphate dehydrogenase (gapdh,
Mg99044) was used as a constitutively expressed control
gene. The PCR was conducted on a CFX96 Real-Time PCR
Detection System (Bio-Rad).
To identify clusters of genes enriched for upregulation
during plant infection, we carried out a sliding window ana-
lysis as follows. We binned the fungal genome into 10-gene
bins with a step size of 5 genes, and for each window, we
tabulated the number of genes called significant in the com-
parison between expression levels during infection of each
plant host and those in axenic culture, for which the former
were of larger magnitude. For each bin, we then evaluated
the likelihood of observing this count of upregulated genes
under a Poisson null (www.R-project.org, last accessed May
23, 2014) applying the ppois function. An analogous calcula-
tion was carried out for genes downregulated during
infection.
Identification of Gene Families and Phylogenetics
To define gene families in IPO323, sequence data sets of tran-
scripts and proteins from the Z. tritici reference genome ver-
sion 2.0 from the Joint Genome Institute (http://genome.jgi.
Host-Specific Transcription Profile GBE
Genome Biol. Evol. 6(6):1353–1365. doi:10.1093/gbe/evu101 Advance Access publication May 14, 2014 1355

doe.gov/Mycgr3/Mycgr3.home.html, last accessed May 23,
2014) were formatted for BLAST using formatdb (NCBI).
A preliminary set of paralog pairs was identified as those
genes whose homology achieved e<0.1 in an all-by-all
BLAST of amino acid sequences (Altschul et al. 1997). This
preliminary set was then filtered in two ways: Either applying
the criteria from (Gu et al. 2002, filter scheme 1), or within the
program SiliX (Miele et al. 2011), filtering for sequence identity
�35%, alignment length �30 amino acids, and overlaps
�30% (filter scheme 2). Genome-wide visualization of para-
logs was done with Circos (Krzywinski et al. 2009). Gene fam-
ilies were grouped from paralog pairs using SiliX (Miele et al.
2011), allowing for grouping of sequences that did not over-
lap with all sequences of the gene family.
To screen for homologs in other Z. tritici isolates and
Zymoseptoria species, each transcript from the Z. tritici
IPO323 reference genome was subjected to BLAST against
the 12 Zymoseptoria genomes reported in Stukenbrock et
al. (2011). Homology was considered for sequences with
alignment lengths >150 bp and sequence identities>60%
(with respect to the alignment length).
Ratios of Ka/Ks (nonsynonymous to synonymous substi-
tutions) between species and Pn/Ps (nonsynonymous to
synonymous polymorphisms) within species were assessed
in Stukenbrock et al. (2010). The method of Nei and
Gojobori was used to compute synonymous and nonsynon-
ymous rates of substitutions and polymorphisms (Nei and
Kumar 2000).
Gene ontology categories of IPO323 transcripts were taken
from Goodwin et al. (2011) and analyzed for enrichments
with the clusterProfiler package (Yu et al. 2012) in R (www.
R-project.org, last accessed May 23, 2014).
For the phylogenetic trees in figure 7 and supplementary
figure S8, Supplementary Material online, amino acid se-
quences were aligned using Clustal Omega applying de-
fault settings (Sievers et al. 2011). Leading and trailing
gaps as well as inner gaps of the alignment were removed
with gblocks (Dereeper et al. 2008). To account for larger
genetic distances among the aligned sequences down to
40% sequence identity at the amino acid level, we applied
in gblocks smaller final blocks, gap positions within final
blocks, and less strict flanking positions (Castresana 2000).
Maximum likelihood (ML) analyses (Felsenstein 1981) were
performed with RAxML 7.0.4 (Stamatakis et al. 2005).
RAxML 7.0.4 conducted 1000 bootstrap replicates using
a rapid bootstrap algorithm (Stamatakis et al. 2008) apply-
ing the PROTGAMMAWAG approximation. In the subse-
quent ML search for the best scoring ML tree starting
from each fifth bootstrap tree, the more accurate
PROTCAT approximation was applied. Bootstrap support
values were mapped on the most likely tree that was
visualized and edited in FigTree v1.4 (http://tree.bio.ed.ac.
uk/software/figtree/, last accessed May 23, 2014). Filter
settings of gblocks had negligible effects on inferred tree
topologies (data not shown).
Results
A Survey of Expressed Genes in Z. tritici
To survey the expression patterns of Z. tritici during infection
of plant hosts, we inoculated three biological replicates of the
susceptible wheat host T. aestivum Obelisk with the Z. tritici
strain IPO323 and generated analogous infected cultures of
the nonsusceptible grass species B. distachyon (accession
Bd21). We transcriptionally profiled each sample by RNA-seq
after 4 days postinfection (dpi), along with axenic Z. tritici
culture controls (supplementary table S1, Supplementary
Material online). We developed a read-mapping pipeline to
distinguish fungal and host transcripts in the in planta samples
(supplementary fig. S1, Supplementary Material online); our
final data sets comprised 45.1–50.2 million mapped reads
from samples of Z. tritici axenic culture and 4.2–5.3 million
Z. tritici reads from samples of infected plant tissue (supple-
mentary table S1, Supplementary Material online). Of the
10,952 predicted Z. tritici genes (http://genome.jgi.doe.gov/
Mycgr3/Mycgr3.home.html, last accessed May 23, 2014),
8,053 were expressed at >2 read per million in any of the
three growth conditions (supplementary table S2,
Supplementary Material online), and we considered this set
of genes to represent the core active transcriptional program
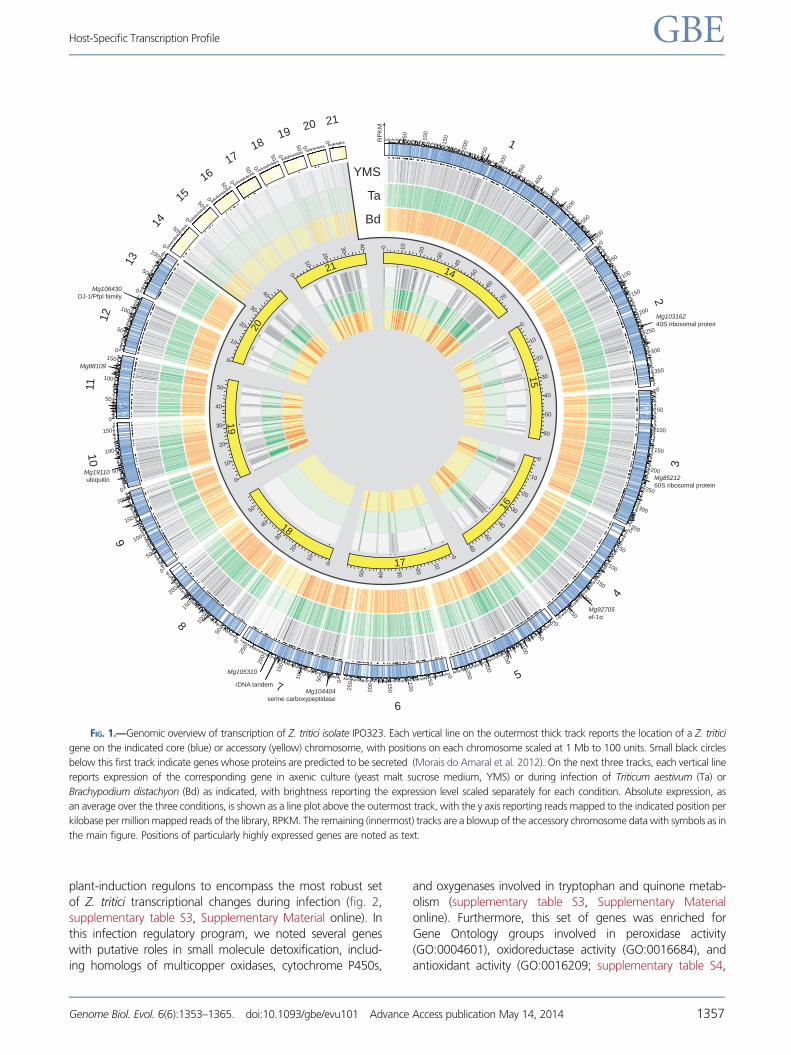
of Z. tritici in our experiments. Expressed genes were uniformly
distributed across the genome except for a region of the CC 7
likely subject to transcriptional silencing (fig. 1). A small pop-
ulation of ribosomal DNA fragments cloned in our RNA-seq
libraries mapped to a region of chromosome 7 likely to func-
tion as the rDNA cluster of Z. tritici (fig. 1, supplementary fig.
S2, Supplementary Material online). Chromosome 18, an AC,
was distinguished by a complete absence of expression signal
(fig. 1), and multiplex PCR analyses confirmed that chromo-
some 18 has been lost in the Z. tritici strain IPO323 (supple-
mentary fig. S3, Supplementary Material online).
Previous analyses indicated that the Z. tritici transcriptome
is extensively reprogrammed during infection (Yang et al.
2013). Consistent with this picture, our in planta genome-
wide transcriptional profiles of Z. tritici were more similar to
one another than to profiles from axenic culture (supple-
mentary fig. S4, Supplementary Material online). Likewise,
our data agreed well with published sources, with complete
overlap between the top quartile of expressed genes during
infection of wheat at 4 dpi in our data set and that reported
by Yang et al. (2013). To further analyze infection regulatory
programs in detail in our data set, we first identified genes
differentially expressed between the axenic condition and
cultures on each plant host in turn, and we also tabulated
genes significantly differentially expressed between hosts
(fig. 2). We took the intersection of the former two
Kellner et al. GBE
1356 Genome Biol. Evol. 6(6):1353–1365. doi:10.1093/gbe/evu101 Advance Access publication May 14, 2014
plant-induction regulons to encompass the most robust set
of Z. tritici transcriptional changes during infection (fig. 2,
supplementary table S3, Supplementary Material online). In
this infection regulatory program, we noted several genes
with putative roles in small molecule detoxification, includ-
ing homologs of multicopper oxidases, cytochrome P450s,
and oxygenases involved in tryptophan and quinone metab-
olism (supplementary table S3, Supplementary Material
online). Furthermore, this set of genes was enriched for
Gene Ontology groups involved in peroxidase activity
(GO:0004601), oxidoreductase activity (GO:0016684), and
antioxidant activity (GO:0016209; supplementary table S4,
FIG. 1.—Genomic overview of transcription of Z. tritici isolate IPO323. Each vertical line on the outermost thick track reports the location of a Z. tritici
gene on the indicated core (blue) or accessory (yellow) chromosome, with positions on each chromosome scaled at 1 Mb to 100 units. Small black circles
below this first track indicate genes whose proteins are predicted to be secreted (Morais do Amaral et al. 2012). On the next three tracks, each vertical line
reports expression of the corresponding gene in axenic culture (yeast malt sucrose medium, YMS) or during infection of Triticum aestivum (Ta) or
Brachypodium distachyon (Bd) as indicated, with brightness reporting the expression level scaled separately for each condition. Absolute expression, as
an average over the three conditions, is shown as a line plot above the outermost track, with the y axis reporting reads mapped to the indicated position per
kilobase per million mapped reads of the library, RPKM. The remaining (innermost) tracks are a blowup of the accessory chromosome data with symbols as in
the main figure. Positions of particularly highly expressed genes are noted as text.
Host-Specific Transcription Profile GBE
Genome Biol. Evol. 6(6):1353–1365. doi:10.1093/gbe/evu101 Advance Access publication May 14, 2014 1357

Supplementary Material online), as well as an excess of
genes encoding proteins with putative secretion signals
(13.7% with secretion signals compared with 8.9%
genome wide; supplementary table S3, Supplementary
Material online), suggestive of a role in host interactions
for many genes differentially regulated during infection.
In many fungal pathogens, infection-related genes cluster
into “pathogenicity islands” that can sweep rapidly through
populations (Kamper et al. 2006; Fedorova et al. 2008;
Stergiopoulus and de Wit, 2009; Rouxel et al. 2011).
We hypothesized that Z. tritici genes regulated during infection
could likewise be distributed nonrandomly in the genome. To
test this, we investigated the genomic positions of genes acti-
vated or repressed during infection. The results revealed a clus-
ter of genes on Z. tritici chromosome 2 upregulated during
infection, including several small molecule detoxification fac-
tors (fig. 3A); strikingly, nine of the ten genes of this locus were
regulated in a host-specific manner, with 1.6-fold to 4-fold
higher expression during infection of the preferred host, T.
aestivum, relative to infection of B. distachyon (fig. 3B).
Another locus, on Z. tritici chromosome 9, harbored a cluster
of genes repressed during infection (supplementary fig. S5,
Supplementary Material online). We reasoned that, if these
clusters were of particular importance in the evolutionary his-
tory of Z. tritici, they could have assembled by genomic rear-
rangements during the divergence of this species from others
in the clade. Consistent with this notion, both clusters were
absent or rearranged in other Zymoseptoria genomes (fig. 3C
and supplementary fig. S5, Supplementary Material online).
Thus, these results provide a first compelling line of evidence
for these gene clusters as putative pathogenicity islands in Z.
tritici.
Genomic Features of Z. tritici Genes DifferentiallyExpressed between Hosts
We next carried out a broader-scale analysis of the genes in-
duced in Z. tritici during infection of one plant host and not the
other, which we considered as prime candidates for a poten-
tial role in host specialization in this fungus. qRT-PCR valida-
tion of six genes confirmed the RNA-seq-based prediction of
differential gene expression between the two plant species
(supplementary fig. S9, Supplementary Material online).
Given the wheat-specific induction of small molecule metab-
olism genes clustering on chromosome 2 (fig. 3), we hypoth-
esized that Z. tritici infection of wheat could involve a broader
program of upregulation of such genes. As an unbiased test
of this notion, we evaluated the patterns of host-specific ex-
pression among genes of the Eukaryotic Orthologs Group
(KOG) annotated in Secondary metabolites, biosynthesis,
transport, and catabolism (genome.jgi.doe.gov/Tutorial/tuto-
rial/kog.html). The results bore out our prediction, with a sig-
nificant signal for upregulation of the genes of this group
during infection of T. aestivum relative to that of B. distachyon
(fig. 4). Interestingly, genes encoding proteins with putative
secretion signals were also enriched for those upregulated
during infection of wheat and genes with plant-specific ex-
pression patterns (fig. 4), further attesting to the plausible role
of these genes in host invasion.
We next reasoned that, if Z. tritici genes induced during
infection of wheat were of evolutionary relevance as this
fungus specialized to the wheat host niche, genes subject to
host-specific regulation would exhibit sequence signatures of
natural selection in Z. tritici. To test this, we used our previously
characterized set of 373 genes with evidence for positive se-
lection during the divergence of Z. tritici, from within- and
between-species comparisons of Z. tritici with its sister species
Z. pseudotritici and Z. ardabiliae, which have different host
preferences (Stukenbrock et al. 2010). As predicted, genes
with signatures of positive selection in Z. tritici were signifi-
cantly more highly expressed during infection of the preferred
host, T. aestivum, than during infection of B. distachyon
(fig. 4). Taken together, our data attest to the unique inferred
functions, sequence signatures of positive selection, and
A
B
FIG. 2.—Zymoseptoria tritici genes differentially expressed between
axenic culture and growth in planta. (A) Each box reports results of a
comparison between expression profiles from the indicated two cultures:
axenic growth in yeast malt sucrose medium (YMS), infection of T.
aestivum (Ta), and infection of B. distachyon (Bd). In a given box, the
value before the slash reports the number of genes on core chromosomes
differentially expressed at a false discovery rate of 0.01 or less between the
indicated conditions, and the value after the slash reports the analogous
quantity from accessory chromosomes. Small text next to a given circle
reports the number of genes differentially expressed between the indi-
cated condition and both of the other two, on core chromosomes (before
the slash) and accessory chromosomes (after the slash). Red text at center
reports the total numbers of genes differentially expressed in any compar-
ison, on core chromosomes (before the slash) and accessory chromosomes
(after the slash). (B) Distribution of differentially transcribed genes (black
solid lines) along ACs. Boxes depict single chromosomes with regions con-
taining transcripts drawn in yellow. Scaling: 50¼0.5Mb.
Kellner et al. GBE
1358 Genome Biol. Evol. 6(6):1353–1365. doi:10.1093/gbe/evu101 Advance Access publication May 14, 2014

genomic clustering of Z. tritici genes with wheat-specific ex-
pression patterns, all lending support to a model in which
these genes have contributed to host specialization of the
pathogen.
Expression and Evolutionary History of Genes onZ. tritici ACs
We next sought to investigate the regulation and function of
genes on ACs of Z. tritici. On average, the 654 AC-encoded
genes were expressed at 13-fold lower levels than those on
CCs (fig. 1), but 174 AC-encoded genes were expressed at>2
read per million in at least one sample of our data set (sup-
plementary table S2, Supplementary Material online). We thus
reasoned that highly expressed AC-encoded genes, though
relatively few in number, could carry out important biological
roles and be subject to evolutionary constraint. Analyses of
conservation bore out this notion: Relative to the rest of the
genes on ACs, expressed genes were 2.1-fold enriched for
the presence of orthologs in other Zymoseptoria strains and
species (supplementary fig. S6, Supplementary Material
online), and 1.4-fold enriched for signatures of selective
constraint on amino acid sequence (fig. 5). We also noted
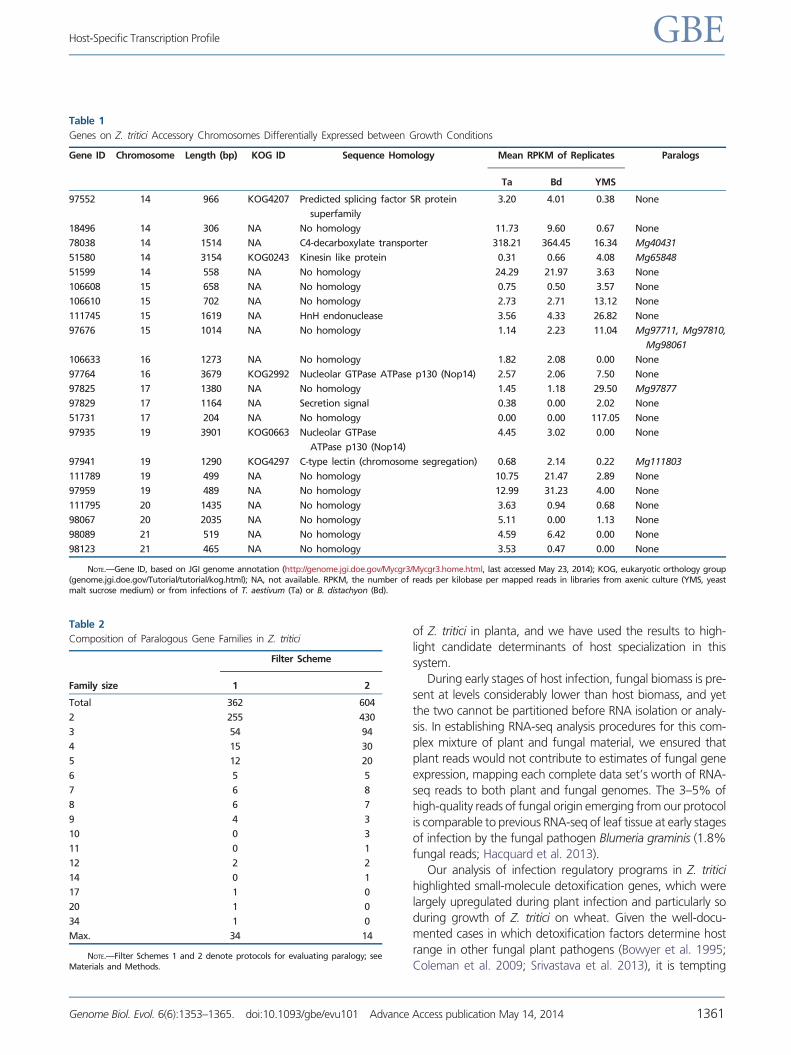
22 AC-encoded genes whose expression was significantly
regulated during infection of both wheat and Brachypodium
(fig. 2 and table 1). Thus, genes encoded on the Z. tritici ACs
exhibit signatures of activity, host-specific regulation, and
selective constraint, reflecting a likely functional role in many
cases.
We expected that, if a given gene on an AC carried out
biological roles essential to Z. tritici biology, it would often be a
unique representative of its functional class as opposed to a
member of a large gene family. To test this, we catalogued the
complete set of gene families in the Z. tritici genome using two
homology-detection schemes, described in Materials and
Methods, which define a given family on the basis of the
length and proportion of genes showing high sequence
identity. These strategies defined 362 and 604 gene families
in the Z. tritici genome, respectively, comprising 1,020 and
1,610 genes in total (table 2, supplementary table S5,
Supplementary Material online). These annotations provided
no evidence for a model of rampant gene duplication on ACs
in Z. tritici. Instead, only a few dozen members of gene
A C
B
FIG. 3.—Plant-induced upregulation of a gene cluster on chromosome 2. (A) Each bar denotes the number of Z. tritici genes significantly upregulated
during infection of both wheat and Brachypodium (y) in sliding windows of 10 genes along the genome (x). The red circle indicates a window containing five
upregulated genes, a degree of clustering unlikely under a genomic null (Poisson p¼3.9e�07). (B) Each row reports characteristics of one gene in the cluster
of upregulated genes on Z. tritici chromosome 2 in (A). RPKM, reads mapped to the indicated gene per kilobase per million mapped reads in the library, in
axenic culture (yeast malt sucrose medium, YMS) or during infection of T. aestivum (Ta) or B. distachyon (Bd). Secreted, inference that the encoded protein
is secreted according to Morais do Amaral et al. (2012). (C) Presence–absence variation in the coregulated cluster genes in Z. tritici and other Zymoseptoria
species. Boxes depict cluster genes (orange) and cluster-flanking genes (gray). Lines connect genes of the same genome contig sequence. Orthologous genes
are vertically aligned.
Host-Specific Transcription Profile GBE
Genome Biol. Evol. 6(6):1353–1365. doi:10.1093/gbe/evu101 Advance Access publication May 14, 2014 1359

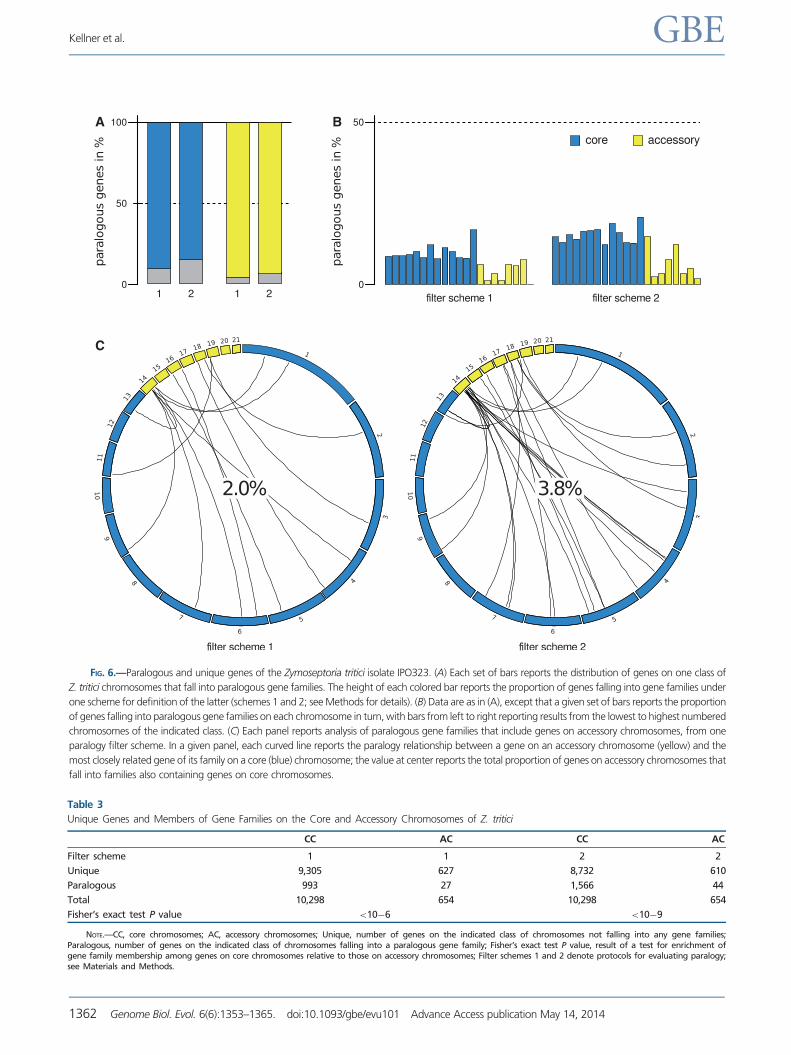
families were encoded on ACs (27 and 44 genes, representing
4.1% and 6.7% of all AC genes, respectively; fig. 6A and
table 3). Likewise, genes on CCs were more likely to be mem-
bers of gene families than were genes on ACs (fig. 6B and
table 3). The gene families that did include AC-encoded genes
were often not uniquely comprised of such loci: Among AC-
encoded gene family members, half were paralogous to CC
genes (48.1–56.8%; fig. 6C). Expression patterns of unique
genes and members of gene families were indistinguishable
between AC-encoded and CC genes (supplementary fig. S7,
Supplementary Material online). Figure 7 and supplementary
figure S8, Supplementary Material online, show representative
gene families in which each member in turn formed a mono-
phyletic clade with homologs in other species, including the
AC-encoded genes of the family, arguing against recent du-
plication on the ACs in Z. tritici. We conclude that relatively
few AC genes have close paralogs in the Z. tritici genome, a
signature of the potential function of many such genes that
echoes our observations of expression and evolutionary
constraint at these loci.
Discussion
For fungal plant pathogens, although the repertoire of viru-
lence genes present in the genome is the fundamental basis of
infectivity (Giraud et al. 2010), quantitative tuning of gene
expression is also essential for establishment of infectious
hyphae (Skibbe et al. 2010, Hacquard et al. 2013). As such,
expression profiling serves as a powerful strategy to identify
genes that underlie virulence and host specialization. In this
work, we have developed methods for expression profiling
FIG. 4.—Patterns of functional and evolutionary relevance among Z.
tritici genes expressed differently during infection of distinct plant hosts.
Each column reports the distribution of expression fold-changes between
infection of T. aestivum (Ta) and B. distachyon (Bd) for one group of genes.
In a given distribution, the median is denoted as a thick horizontal bar,
25% quartiles are shown as a box, thin horizontal bars denote 1.5 times
the interquartile range, and values outside the latter range are shown as
points. Expressed, the set of all genes expressed at greater than 2 reads per
kilobase per million mapped reads in the library in axenic culture or during
either infection. Secreted, all genes encoding proteins predicted to be
secreted by Morais do Amaral et al. 2012. High Ka/Ks, genes with rates
of protein evolution between Z. tritici and other Zymoseptoria species
reflecting positive selection, from Stukenbrock et al. 2011. Plant-specific,
genes called significantly differentially expressed between axenic growth
and the two plant infection conditions in FIgure 2B. The last column
reports analysis of the eukaryotic orthologous group category Secondary
metabolites, biosynthesis, transport, and catabolism (genome.jgi.doe.gov/
Tutorial/tutorial/kog.html). At bottom, each horizontal line reports results
from a comparison of significant differential expression between the indi-
cated gene sets: **< 0.01; ***< 0.001.
FIG. 5.—Expressed Z. tritici genes are enriched for sequence signatures
of purifying selection. Each column reports the distribution of rates of
protein evolution between Z. tritici and other Zymoseptoria species, from
Stukenbrock et al. 2011, in one set of genes. In a given distribution, the
median is denoted as a thick horizontal bar, 25% quartiles are shown as a
box, thin horizontal bars denote 1.5 times the interquartile range, and
values outside the latter range are shown as points. Expressed, the set
of all genes expressed at greater than 2 reads per kilobase per million
mapped reads in a library from axenic culture or during infection of
wheat or B. distachyon.
Kellner et al. GBE
1360 Genome Biol. Evol. 6(6):1353–1365. doi:10.1093/gbe/evu101 Advance Access publication May 14, 2014
of Z. tritici in planta, and we have used the results to high-
light candidate determinants of host specialization in this
system.
During early stages of host infection, fungal biomass is pre-
sent at levels considerably lower than host biomass, and yet
the two cannot be partitioned before RNA isolation or analy-
sis. In establishing RNA-seq analysis procedures for this com-
plex mixture of plant and fungal material, we ensured that
plant reads would not contribute to estimates of fungal gene
expression, mapping each complete data set’s worth of RNA-
seq reads to both plant and fungal genomes. The 3–5% of
high-quality reads of fungal origin emerging from our protocol
is comparable to previous RNA-seq of leaf tissue at early stages
of infection by the fungal pathogen Blumeria graminis (1.8%
fungal reads; Hacquard et al. 2013).
Our analysis of infection regulatory programs in Z. tritici
highlighted small-molecule detoxification genes, which were
largely upregulated during plant infection and particularly so
during growth of Z. tritici on wheat. Given the well-docu-
mented cases in which detoxification factors determine host
range in other fungal plant pathogens (Bowyer et al. 1995;
Coleman et al. 2009; Srivastava et al. 2013), it is tempting
Table 1
Genes on Z. tritici Accessory Chromosomes Differentially Expressed between Growth Conditions
Gene ID Chromosome Length (bp) KOG ID Sequence Homology Mean RPKM of Replicates Paralogs
Ta Bd YMS
97552 14 966 KOG4207 Predicted splicing factor SR protein
superfamily
3.20 4.01 0.38 None
18496 14 306 NA No homology 11.73 9.60 0.67 None
78038 14 1514 NA C4-decarboxylate transporter 318.21 364.45 16.34 Mg40431
51580 14 3154 KOG0243 Kinesin like protein 0.31 0.66 4.08 Mg65848
51599 14 558 NA No homology 24.29 21.97 3.63 None
106608 15 658 NA No homology 0.75 0.50 3.57 None
106610 15 702 NA No homology 2.73 2.71 13.12 None
111745 15 1619 NA HnH endonuclease 3.56 4.33 26.82 None
97676 15 1014 NA No homology 1.14 2.23 11.04 Mg97711, Mg97810,
Mg98061
106633 16 1273 NA No homology 1.82 2.08 0.00 None
97764 16 3679 KOG2992 Nucleolar GTPase ATPase p130 (Nop14) 2.57 2.06 7.50 None
97825 17 1380 NA No homology 1.45 1.18 29.50 Mg97877
97829 17 1164 NA Secretion signal 0.38 0.00 2.02 None
51731 17 204 NA No homology 0.00 0.00 117.05 None
97935 19 3901 KOG0663 Nucleolar GTPase
ATPase p130 (Nop14)
4.45 3.02 0.00 None
97941 19 1290 KOG4297 C-type lectin (chromosome segregation) 0.68 2.14 0.22 Mg111803
111789 19 499 NA No homology 10.75 21.47 2.89 None
97959 19 489 NA No homology 12.99 31.23 4.00 None
111795 20 1435 NA No homology 3.63 0.94 0.68 None
98067 20 2035 NA No homology 5.11 0.00 1.13 None
98089 21 519 NA No homology 4.59 6.42 0.00 None
98123 21 465 NA No homology 3.53 0.47 0.00 None
NOTE.—Gene ID, based on JGI genome annotation (http://genome.jgi.doe.gov/Mycgr3/Mycgr3.home.html, last accessed May 23, 2014); KOG, eukaryotic orthology group(genome.jgi.doe.gov/Tutorial/tutorial/kog.html); NA, not available. RPKM, the number of reads per kilobase per mapped reads in libraries from axenic culture (YMS, yeastmalt sucrose medium) or from infections of T. aestivum (Ta) or B. distachyon (Bd).
Table 2
Composition of Paralogous Gene Families in Z. tritici
Filter Scheme
Family size 1 2
Total 362 604
2 255 430
3 54 94
4 15 30
5 12 20
6 5 5
7 6 8
8 6 7
9 4 3
10 0 3
11 0 1
12 2 2
14 0 1
17 1 0
20 1 0
34 1 0
Max. 34 14
NOTE.—Filter Schemes 1 and 2 denote protocols for evaluating paralogy; seeMaterials and Methods.
Host-Specific Transcription Profile GBE
Genome Biol. Evol. 6(6):1353–1365. doi:10.1093/gbe/evu101 Advance Access publication May 14, 2014 1361
A
C
B
FIG. 6.—Paralogous and unique genes of the Zymoseptoria tritici isolate IPO323. (A) Each set of bars reports the distribution of genes on one class of
Z. tritici chromosomes that fall into paralogous gene families. The height of each colored bar reports the proportion of genes falling into gene families under
one scheme for definition of the latter (schemes 1 and 2; see Methods for details). (B) Data are as in (A), except that a given set of bars reports the proportion
of genes falling into paralogous gene families on each chromosome in turn, with bars from left to right reporting results from the lowest to highest numbered
chromosomes of the indicated class. (C) Each panel reports analysis of paralogous gene families that include genes on accessory chromosomes, from one
paralogy filter scheme. In a given panel, each curved line reports the paralogy relationship between a gene on an accessory chromosome (yellow) and the
most closely related gene of its family on a core (blue) chromosome; the value at center reports the total proportion of genes on accessory chromosomes that
fall into families also containing genes on core chromosomes.
Table 3
Unique Genes and Members of Gene Families on the Core and Accessory Chromosomes of Z. tritici
CC AC CC AC
Filter scheme 1 1 2 2
Unique 9,305 627 8,732 610
Paralogous 993 27 1,566 44
Total 10,298 654 10,298 654
Fisher’s exact test P value <10�6 <10�9
NOTE.—CC, core chromosomes; AC, accessory chromosomes; Unique, number of genes on the indicated class of chromosomes not falling into any gene families;Paralogous, number of genes on the indicated class of chromosomes falling into a paralogous gene family; Fisher’s exact test P value, result of a test for enrichment ofgene family membership among genes on core chromosomes relative to those on accessory chromosomes; Filter schemes 1 and 2 denote protocols for evaluating paralogy;see Materials and Methods.
Kellner et al. GBE
1362 Genome Biol. Evol. 6(6):1353–1365. doi:10.1093/gbe/evu101 Advance Access publication May 14, 2014

to speculate that such genes participate in the response of
Z. tritici to reactive oxygen species produced by the host as
a defense mechanism. On a genomic scale, the coincidence
between signatures of positive selection and host-specific
expression that we noted in Z. tritici strongly supports a
role for regulatory programs in the evolution of virulence
of this fungus. Qualitatively, the modest number of genes at
which we detected significant differential expression be-
tween hosts (40 genes; fig. 2) dovetails with a previous
report of only a few dozen genes with host-specific expres-
sion in Bl. graminis (Hacquard et al. 2013). The emerging
picture is one in which expression regulation may determine
a small but critical set of genes in each of these pathogen
species.
In focused analyses of genes on Z. tritici ACs, we ob-
served no evidence for elevated rates of paralogy with
other elements of the Z. tritici genome, dovetailing with
the high proportions of unique genes on ACs in Fusarium
oxysporum (Ma et al. 2010) and Haematonectria haemato-
cocca (Coleman et al. 2009). Most of the gene composition
of ACs in these species thus is unlikely to originate from the
core genome. Likewise, our identification of >150
expressed genes on Z. tritici ACs, often tightly conserved
within and between species, also reflect the importance of
many AC genes for the fitness of the organism. Our data
leave open the question of the relevance of ACs for infec-
tivity in particular. Determinants of host specificity and viru-
lence have been identified on ACs of other fungal plant
pathogens, including the AC-encoded enzymes for detoxifi-
cation of a plant phytoalexin in Nectria haematococca (Miao
et al. 1991; Coleman et al. 2011) and the virulence-associ-
ated host-specific effector genes on lineage-specific chromo-
somes of Fusarium oxysporum (Ma et al. 2010). Though we
detected no host-specific gene expression of AC genes at
the very early stages of infection, 25 AC-encoded genes
were upregulated during infection of wheat at 13 dpi
(Yang et al. 2013). As such, future studies of expressed
AC genes will continue to shed light on the biological role
of these highly dynamic genomic elements.
In summary, we have constructed a pipeline for whole--
transcriptome analyses of plant tissue at early stages of patho-
gen infection, which identified Z. tritici genes with expression-
based and sequence signatures of a role in fungal growth and
infectivity. Our findings will serve as a rich source of testable
FIG. 7.—Positions on core and accessory chromosomes of members of a gene family have been maintained during the evolution of Dothideomycete
fungi. Shown is an unrooted maximum likelihood phylogeny of an amino acid alignment of the representative gene family J_FAM234 (see supplementary
table S5, Supplementary Material online). Bootstrap support values above 50 are given next to branches. Branch lengths correspond to substitutions per site.
Host-Specific Transcription Profile GBE
Genome Biol. Evol. 6(6):1353–1365. doi:10.1093/gbe/evu101 Advance Access publication May 14, 2014 1363

candidate virulence determinants in Z. tritici and underscore
the power of expression profiling as a complement to
genome-scale analyses in the search for the genetic basis of
host–pathogen interactions.
Supplementary Material
Supplementary tables S1–S5 and figures S1–S10 are available
at Genome Biology and Evolution online (http://www.gbe.
oxfordjournals.org/).
Acknowledgments
Julien Y. Dutheil and the Fungal Biodiversity Group are ac-
knowledged for their overall support. Plant seeds were
kindly provided by Gert Kema. Franziska Scheidemantel is
acknowledged for performing qRT-PCRs. This work was sup-
ported by intramural funds of the Max Planck Society to E.H.S.
Literature CitedAltschul SF, Gish W, Miller W, Myers EW, Lipman DJ. 1990. Basic local
alignment search tool. J Mol Biol. 215:403–410.
Altschul SF, et al. 1997. Gapped BLAST and PSI-BLAST: a new generation
of protein database search programs. Nucleic Acids Res. 25:
3389–3402.
Anders S, Huber W. 2010. Differential expression analysis for sequence
count data. Genome Biol. 11:R106.
Banke S, McDonald B. 2005. Migration patterns among global populations
of the pathogenic fungus Mycosphaerella graminicola. Mol Ecol. 14:
1881–1896.
Bowyer P, Clarke BR, Lunness P, Daniels MJ, Osbourn AE. 1995. Host
range of a plant pathogenic fungus determined by a saponin detox-
ifying enzyme. Science 267:371–374.
Brenchley R, et al. 2012. Analysis of the bread wheat genome using
whole-genome shotgun sequencing. Nature 491:705–710.
Brokenshire T. 1975. The role of graminaceous species in the epidemiology
of Septoria tritici on wheat. Plant Pathol. 24:33–38.
Brunner PC, Torriani SFF, Croll D, Stukenbrock EH, McDonald BA. 2013.
Coevolution and life cycle specialization of plant cell wall
degrading enzymes in a hemibiotrophic pathogen. Mol Biol Evol. 30:
1337–1347.
Castresana J. 2000. Selection of conserved blocks from multiple align-
ments for their use in phylogenetic analysis. Mol Biol Evol. 17:
540–552.
Coleman JJ, White GJ, Rodriguez-Carres M, VanEtten HD. 2011. An ABC
transporter and a cytochrome P450 of Nectria haematococca MPVI
are virulence factors on pea and are the major tolerance
mechanisms to the phytoalexin pisatin. Mol Plant Microbe Interact.
24(3):368–376.
Coleman JJ, et al. 2009. The genome of Nectria haematococca: contribu-
tion of supernumerary chromosomes to gene expansion. PLoS Genet.
5:e1000618.
Covert SF. 1998. Supernumerary chromosomes in filamentous fungi. Curr
Genet. 33:311–319.
Croll D, Zala M, McDonald BA. 2013. Breakage-fusion-bridge
cycles and large insertions contribute to the rapid evolution of
accessory chromosomes in a fungal pathogen. PLoS Genet. 9:
e1003567.
De Jonge R, et al. 2012. Tomato immune receptor Ve1 recognizes
effector of multiple fungal pathogens uncovered by
genome and RNA sequencing. Proc Natl Acad Sci U S A. 109(13):
5110–5115.
Dereeper A, et al. 2008. Phylogeny.fr: robust phylogenetic analysis for the
non-specialist. Nucleic Acids Res. 36:W465–W469.
Edgar R, Domrachev M, Lash AE. 2002. Gene expression omnibus: NCBI
gene expression and hybridization array repository. Nucleic Acids Res.
30(1):207–210.
Eyal Z, Scharen A, Huffman M, Prescott J. 1985. Global insights into vir-
ulence and frequencies of Mycosphaerella graminicola. Ecol Epidemiol.
75:1456–1462.
Fedorova ND, et al. 2008. Genomic islands in the pathogenic filamentous
fungus Aspergillus fumigatus. PLoS Genet. 4(4):e1000046.
Felsenstein J.. 1981. Evolutionary trees from DNA sequences: a maximum
likelihood approach. J Mol Evol. 17:368–376.
Giraud T, Gladieux P, Gavrilets S. 2010. Linking the emergence of fungal
plant diseases with ecological speciation. Trends Ecol Evol. 25(7):
387–395.
Goodwin SB, et al. 2011. Finished genome of the fungal wheat
pathogen Mycosphaerella graminicola reveals dispensome structure,
chromosome plasticity, and stealth pathogenesis. PLoS Genet. 7:
e1002070.
Gu Z, Cavalcanti A, Chen F-C, Bouman P, Li W-H. 2002. Extent of gene
duplication in the genomes of Drosophila, nematode, and yeast. Mol
Biol Evol. 19:256–262.
Hacquard S, et al. 2013. Mosaic genome structure of the barley powdery
mildew pathogen and conservation of transcriptional programs in di-
vergent hosts. Proc Natl Acad Sci U S A. 110:E2219–E2228.
International Brachypodium Initiative. 2010. Genome sequencing and
analysis of the model grass Brachypodium distachyon. Nature 463:
763–768.
Kamper J, et al. 2006. Insights from the genome of the biotrophic plant
pathogen Ustilago maydis. Nature 444:97–101.
Kema G, Yu D, Rijkenberg F, Shaw M, Baayen R. 1996. Histology of the
pathogenesis of Mycosphaerella graminicola in wheat.
Phytopathology 86:777–786.
Kema GH, van Silfhout CH. 1997. Genetic variation for virulence and
resistance in the wheat-Mycosphaerella graminicola pathosystem III.
Comparative seedling and adult plant experiments. Phytopathology
87:266–272.
Kim D, et al. 2013. TopHat2: accurate alignment of transcriptomes in the
presence of insertions, deletions and gene fusions. Genome Biol. 14:
R36.
Krzywinski M, et al. 2009. Circos: an information aesthetic for comparative
genomics. Genome Res. 19:1639–1645.
Letunic I, Doerks T, Bork P. 2009. SMART 6: recent updates and new
developments. Nucleic Acids Res. 37:D229–D232.
Ma L-J, et al. 2010. Comparative genomics reveals mobile pathogenicity
chromosomes in Fusarium. Nature 464:367–373.
McCarthy DJ, Chen Y, Smyth GK. 2012. Differential expression analysis of
multifactor RNA-seq experiments with respect to biological variation.
Nucleic Acids Res. 40:4288–4297.
Miao V, Covert S, VanEtten H. 1991. A fungal gene for antibiotic
resistance on a dispensable (“B”) chromosome. Science 254:
1773–1776.
Miele V, Penel S, Duret L. 2011. Ultra-fast sequence clustering from sim-
ilarity networks with SiLiX. BMC Bioinformatics 12:116.
Morais do Amaral A, Antoniw J, Rudd JJ, Hammond-Kosack KE. 2012.
Defining the predicted protein secretome of the fungal wheat leaf
pathogen Mycosphaerella graminicola. PLoS One 7:e49904.
Nei M, Kumar S. 2000. Molecular evolution and phylogenetics. Oxford:
Oxford University Press.
Ohm RA, et al. 2012. Diverse lifestyles and strategies of plant pathogenesis
encoded in the genomes of eighteen dothideomycetes fungi. PLoS
Pathog. 8:e1003037.
Kellner et al. GBE
1364 Genome Biol. Evol. 6(6):1353–1365. doi:10.1093/gbe/evu101 Advance Access publication May 14, 2014

Palma-Guerrero J, et al. 2013. Genome wide association identifies
novel Loci involved in fungal communication. PLoS Genet. 9:
e1003669.
Patel RK, Jain M. 2012. NGS QC Toolkit: a toolkit for quality control of next
generation sequencing data. PLoS One 7:e30619.
Raffaele S, Kamoun S. 2012. Genome evolution in filamentous
plant pathogens: why bigger can be better. Nat Rev Microbiol. 10:
417–430.
Rouxel T, et al. 2011. Effector diversification within compartments of the
Leptosphaeria maculans genome affected by repeat-induced point
mutations. Nat Commun. 2:202.
Schultz J, Milpetz F, Bork P, Ponting CP. 1998. SMART, a simple modular
architecture research tool: identification of signaling domains. Proc
Natl Acad Sci U S A. 95:5857–5864.
Sievers F, et al. 2011. Fast, scalable generation of high-quality protein
multiple sequence alignments using Clustal Omega. Mol Syst Biol. 7:
539.
Skibbe DS, Doehlemann G, Fernandes J, Walbot V. 2010. Maize tumors
caused by Ustilago maydis require organ-specific genes in host and
pathogen. Science 328:89–92.
Srivastava A, Cho IK, Cho Y. 2013. The Bdtf1 gene in Alternaria
brassicicola is important in detoxifying brassinin and maintaining
virulence on Brassica species. Mol Plant Microbe Interact. 26(12):
1429–1440.
Stamatakis A, Hoover P, Rougemont J. 2008. A rapid bootstrap algorithm
for the RAxML web servers. Syst Biol. 57:758–771.
Stamatakis A, Ludwig T, Meier H. 2005. RAxML-III: a fast program for
maximum likelihood-based inference of large phylogenetic trees.
Bioinformatics 21:456–463.
Stergiopoulus I, de Wit P. 2009. Fungal effector proteins. Annu Rev
Phytopathol. 47:233–263.
Stukenbrock EH, et al. 2010. Whole-genome and chromosome evolu-
tion associated with host adaptation and speciation of the wheat
pathogen Mycosphaerella graminicola. PLoS Genet. 6:e1001189.
Stukenbrock EH, et al. 2011. The making of a new pathogen: insights
from comparative population genomics of the domesticated wheat
pathogen Mycosphaerella graminicola and its wild sister species.
Genome Res. 21:2157–2166.
Trapnell C, et al. 2012. Differential gene and transcript expression analysis
of RNA-seq experiments with TopHat and Cufflinks. Nat Protoc. 7:
562–578.
Wittenberg AHJ, et al. 2009. Meiosis drives extraordinary genome plastic-
ity in the haploid fungal plant pathogen Mycosphaerella graminicola.
PLoS One 4:e5863.
Yang F, Li W, Jørgensen HJL. 2013. Transcriptional reprogramming of
wheat and the hemibiotrophic pathogen Septoria tritici during two
phases of the compatible interaction. PLoS One :e81606.
Yu G, Wang LG, Han Y, He QY. 2012. clusterProfiler: an R package for
comparing biological themes among gene clusters. OMICS 16(5):
284–287.
Associate editor: Mar Alba
Host-Specific Transcription Profile GBE
Genome Biol. Evol. 6(6):1353–1365. doi:10.1093/gbe/evu101 Advance Access publication May 14, 2014 1365
Related Documents