Available online at www.sciencedirect.com Behavioural Brain Research 188 (2008) 154–167 Research report Expression of c-Fos and CRF in the brains of rats differing in the strength of a fear response Malgorzata Lehner a , Ewa Taracha a , Anna Sk ´ orzewska a , Danuta Turzy´ nska a , Alicja Sobolewska a , Piotr Maciejak a,b , Janusz Szyndler b , Adam Hamed b , Andrzej Bidzi´ nski a , Aleksandra Wislowska-Stanek b , Adam Pla´ znik a,b,∗ a Department of Neurochemistry, Institute of Psychiatry and Neurology, 9 Sobieskiego Street, 02-957 Warsaw, Poland b Department of Experimental and Clinical Pharmacology, Medical University, 26/28 Krakowskie Przedmie´ scie Street, 00-927 Warsaw, Poland Received 7 August 2007; received in revised form 24 October 2007; accepted 26 October 2007 Available online 4 November 2007 Abstract The aim of the study was to examine the neurochemical background of differences in the individual responses to conditioned aversive stimuli, using the strength of a rat conditioned freezing response (the contextual fear test), as a discriminating variable. It was shown that low responders (LR), i.e. rats with duration of a freezing response one standard error, or more, below the mean value, had a higher activity of the M2 cortical area, and the median raphe nucleus (c-Fox expression), in comparison to the high responders (HR), i.e. rats with the duration of a freezing response one standard error, or more, above the mean value. These animals had also stronger 5-HT- and CRF-related immunostaining in the M2 area, and increased concentration of GABA in the basolateral nucleus of amygdala (in vivo microdialysis). The LR group vocalized more during test session in the aversive band, and had higher serum levels of corticosterone, examined 10 min after test session. It was shown that different natural patterns of responding to conditioned aversive stimuli are associated with different involvement of brain structures and with dissimilar neurochemical mechanisms. © 2007 Elsevier B.V. All rights reserved. Keywords: Conditioned fear; Individual responses; Cortex; Amygdala; c-Fos; CRF; GABA, Microdialysis; Rats 1. Introduction The individual differences in responses to affective stimuli have important clinical implications, as they are responsible for predisposition to affective disorders like depression and anxiety (e.g. post-traumatic stress disorder) [12,15,22]. It is postulated that disturbances in the function of cortical and limbic sero- toninergic and GABA innervation, are directly related to the pathomechanism of affective disorders [18,37]. Neuroimaging human studies showed a relationship between the activity of the cerebral cortex and amygdala, and individually determined expression of different emotional states [12,14,15]. Pre-clinical studies using animal models of anxiety-related behavior (selec- ∗ Corresponding author at: Department of Neurochemistry, Institute of Psy- chiatry and Neurology, 9 Sobieskiego Street, 02-957 Warsaw, Poland. Tel.: +48 22 4582771; fax: +48 22 4582741/48 22 64253375. E-mail address: [email protected] (A. Pla´ znik). tive breeding and genetic manipulations) revealed that different local neuronal activation and changes in neurotransmitters’ and hormones’ responsiveness might underlie the display of differ- ent behavioral outcomes (cf. Ref. [84]). These studies underline the role of brain limbic structures, the HPA axis, serotonin and GABA systems in the organization of different response strategies to aversive stimuli [21,34,71]. Identifying biological mechanisms, through which genes lead to individual differences in emotional behavior, is principal to our understanding how such differences confer risk for mental disorders. For exam- ple, a major finding has been the discovery of genetic variation in an important molecule within the 5-HT system, the 5-HT transporter, and its influence on emotional traits (cf. Ref. [23]). The aim of the study was to further explore the anatomi- cal and neurochemical background of individual differences in responses to conditioned aversive stimuli. In our previous stud- ies we have shown that the reactivity of some brain structures (e.g. lateral habenula) may be responsible for individual differ- ences in rat sensitivity to pain [38]. More recently it has been 0166-4328/$ – see front matter © 2007 Elsevier B.V. All rights reserved. doi:10.1016/j.bbr.2007.10.033

Welcome message from author
This document is posted to help you gain knowledge. Please leave a comment to let me know what you think about it! Share it to your friends and learn new things together.
Transcript
A
u(aoiiom©
K
1
hp(ttphtes
cT
0d
Available online at www.sciencedirect.com
Behavioural Brain Research 188 (2008) 154–167
Research report
Expression of c-Fos and CRF in the brains of rats differing inthe strength of a fear response
Małgorzata Lehner a, Ewa Taracha a, Anna Skorzewska a, Danuta Turzynska a,Alicja Sobolewska a, Piotr Maciejak a,b, Janusz Szyndler b, Adam Hamed b,Andrzej Bidzinski a, Aleksandra Wisłowska-Stanek b, Adam Płaznik a,b,∗
a Department of Neurochemistry, Institute of Psychiatry and Neurology, 9 Sobieskiego Street, 02-957 Warsaw, Polandb Department of Experimental and Clinical Pharmacology, Medical University, 26/28 Krakowskie Przedmiescie Street, 00-927 Warsaw, Poland
Received 7 August 2007; received in revised form 24 October 2007; accepted 26 October 2007Available online 4 November 2007
bstract
The aim of the study was to examine the neurochemical background of differences in the individual responses to conditioned aversive stimuli,sing the strength of a rat conditioned freezing response (the contextual fear test), as a discriminating variable. It was shown that low respondersLR), i.e. rats with duration of a freezing response one standard error, or more, below the mean value, had a higher activity of the M2 cortical area,nd the median raphe nucleus (c-Fox expression), in comparison to the high responders (HR), i.e. rats with the duration of a freezing responsene standard error, or more, above the mean value. These animals had also stronger 5-HT- and CRF-related immunostaining in the M2 area, andncreased concentration of GABA in the basolateral nucleus of amygdala (in vivo microdialysis). The LR group vocalized more during test session
n the aversive band, and had higher serum levels of corticosterone, examined 10 min after test session. It was shown that different natural patternsf responding to conditioned aversive stimuli are associated with different involvement of brain structures and with dissimilar neurochemicalechanisms.2007 Elsevier B.V. All rights reserved.RF;
tlhetasmis
eywords: Conditioned fear; Individual responses; Cortex; Amygdala; c-Fos; C
. Introduction
The individual differences in responses to affective stimuliave important clinical implications, as they are responsible forredisposition to affective disorders like depression and anxietye.g. post-traumatic stress disorder) [12,15,22]. It is postulatedhat disturbances in the function of cortical and limbic sero-oninergic and GABA innervation, are directly related to theathomechanism of affective disorders [18,37]. Neuroimaginguman studies showed a relationship between the activity of
he cerebral cortex and amygdala, and individually determinedxpression of different emotional states [12,14,15]. Pre-clinicaltudies using animal models of anxiety-related behavior (selec-∗ Corresponding author at: Department of Neurochemistry, Institute of Psy-hiatry and Neurology, 9 Sobieskiego Street, 02-957 Warsaw, Poland.el.: +48 22 4582771; fax: +48 22 4582741/48 22 64253375.
E-mail address: [email protected] (A. Płaznik).
pit
cri(e
166-4328/$ – see front matter © 2007 Elsevier B.V. All rights reserved.oi:10.1016/j.bbr.2007.10.033
GABA, Microdialysis; Rats
ive breeding and genetic manipulations) revealed that differentocal neuronal activation and changes in neurotransmitters’ andormones’ responsiveness might underlie the display of differ-nt behavioral outcomes (cf. Ref. [84]). These studies underlinehe role of brain limbic structures, the HPA axis, serotoninnd GABA systems in the organization of different responsetrategies to aversive stimuli [21,34,71]. Identifying biologicalechanisms, through which genes lead to individual differences
n emotional behavior, is principal to our understanding howuch differences confer risk for mental disorders. For exam-le, a major finding has been the discovery of genetic variationn an important molecule within the 5-HT system, the 5-HTransporter, and its influence on emotional traits (cf. Ref. [23]).
The aim of the study was to further explore the anatomi-al and neurochemical background of individual differences in
esponses to conditioned aversive stimuli. In our previous stud-es we have shown that the reactivity of some brain structurese.g. lateral habenula) may be responsible for individual differ-nces in rat sensitivity to pain [38]. More recently it has been
rain
feapmlirssabaaaaiaedvbas
pcdtfn3omomdroebcwbaieimcdatnttd
as
2
2
(samwETP
2
s(iretrmt±fttrs
fv(Tae21vmsbehavior [38]. On the 3rd day, the freezing response of rats was examined fora 10 min-long period, in the testing box without any further stimulation. Theconditioned response, i.e. the freezing response, was recorded and analyzed bythe fear-conditioning system. The freezing behavior was measured by a photobeam system (10 Hz detection rate) controlled by the fear-conditioning system.
Table 1Treatment scheme for behavioral, immunocytochemical studies (c-Fos, sero-tonin, CRF) and plasma corticosterone concentration
Days Procedure
1–11 Adaptation to the housing conditions12 Contextual fear-conditioning test (S group): habituation to the
experimental box13 Training session (4 × 0.7 mA) (C group exposed to the box
M. Lehner et al. / Behavioural B
ound by us that different sensitivity to pain determined differ-nt patterns of emotional behavior, probably reflecting differentctivation thresholds of brain structures controlling anxiety, e.g.refrontal and secondary motor cortex [39]. For example, theore passive strategy of coping with an aversive event (i.e.
onger duration of a freezing response in the conditioned freez-ng test) of animals with lower pain threshold (more sensitiveats), was related to increased activity of amygdalar nuclei andome areas of the hippocampus (c-Fos protein expression), andtronger 5-HT immunostaining in the basolateral nucleus of themygdala, in comparison to animals less sensitive to pain. Theehavior of the latter group of animals (less freezing responsend stronger aversive ultrasonic vocalization) was related to thectivation of the prefrontal cortex (PFCX), increased activity ofdrenal glands (enhanced serum corticosterone concentration),nd stronger serotonin immunostaining in the PFCX, in compar-son with more sensitive rats. These findings were interpreteds indicating that both strategies of coping with an aversivevent (increased freezing vs. vocalization) are under control ofifferent central mechanisms, and suggest that animals moreulnerable to pain might have innate deficits in the activity ofrain systems controlling the hypothalamic–pituitary–adrenalxis that would normally allow them to cope with this stressfulituation [7,31,36,39].
The goal of the present paper was to further explore thehenomenon of differences in animal responses to aversiveonditioned stimuli, using rat conditioned fear response as aiscriminating variable. The duration of a fearful response tohe aversively conditioned context (a freezing response studiedor 10 min, 24 h after aversive conditioning) was a discrimi-ating factor, dividing the whole populations of animals intocategories: HR, high responders, i.e. rats with the duration
f a freezing response one standard error, or more, above theean value, LR, low responders, i.e. animals with the duration
f a freezing response one standard error, or more, below theean value, and MR, intermediate responders, i.e. rats with the
uration of a freezing response equal to the mean ± S.E.M. Theationale for this study was the assumption that the intensityf a conditioned fear response, and the selection of a differ-nt strategy to cope with a fearful stimulation, recruits differentrain structures and neurochemical mechanisms engaged in pro-essing of emotional input to the central nervous system. Thus,e have aimed at studying the localization and neurochemicalackground of individual differences in the rat response to theversively conditioned context, which was used as a discrim-nating variable. We have analyzed in the brain structures thexpression of c-Fos, a marker of neuronal activation, CRF-likemmunoreactivity, an important mediator of anxiogenic and hor-
onal effects of stress, 5-HT-like immunoreactivity and localoncentration of 5-HT and GABA in the basolateral amyg-ala (in vivo microdialysis), as both neurotransmitter systemsre considered to participate in processing of emotional inputo the brain [21,72,75]. The knowledge of the anatomical and
eurochemical background of differences in individual reac-ions to fearful stimuli may help to improve the diagnosis andreatment of anxiety disorders (e.g. post-traumatic stress disor-er). The conditioned freezing response can be considered an1
Research 188 (2008) 154–167 155
nimal model of human pathological responses to unavoidabletress.
. Method
.1. Animals
The experiment was performed in a cohort of 75 male Wistar rats. The rats180–200 g of body weight), bought from a licensed breeder, were housed intandard laboratory conditions under a 12-h light:12-h dark cycle (lights ont 7 am), in a constant temperature (21 ± 20 ◦C) and 70% humidity. The ani-als were kept in the translucent polycarbonate cages (43 cm × 27 cm × 19 cm)ith standard bedding. The experiments were performed in accordance with theuropean Communities Council Directive of 24 November 1986 (86/609 EEC).he Local Committee for Animal Care and Use at Warsaw Medical University,oland, approved all experimental procedures using animal subjects.
.2. Contextual fear-conditioning test and ultrasonic vocalization
After 10 days of adaptation to the housing conditions, the animals wereubjected to the conditioned fear test (S group, n = 45), while the control groupC, n = 15) was placed in the conditioning box only. Next, S animals were dividednto three experimental groups according to the following criterion: LR, lowesponders, i.e. animals with the duration of a freezing response one standardrror, or more, below 205 s (n = 15); MR, intermediate responders, i.e. rats withhe duration of a freezing response between 205 and 236 s (n = 15) and HR, highesponders, i.e. rats with the duration of a freezing response one standard error, orore, above 236 s (n = 12). This criterion was established according to the mean
ime of a freezing response in fear-conditioned animals (group S, mean 220.6 s,15.54 s, S.E.M.). The criterion for LR group was <205 s, i.e. 220 s − 15.54,
or MR group 205–236 s, for HR group >236 s, i.e. 220 s + 15.54. The data fromhree animals were eliminated from the study because of technical problems. Inhis way the animals were divided into three not overlapping populations, withespect to their response to the fearful stimuli of the conditioned fear test. Thecheme of experimental protocol is shown in Table 1.
The fear-conditioning experiment was performed using a computerizedear-conditioning system (TSE, Bad Homburg Germany), as described pre-iously [40]. Fear conditioning was performed in the experimental cage36 cm × 21 cm × 20 cm, w/l/h) under constant white noise condition (65 dB).he experiment was performed during 3 consecutive days. On the first day, thenimals were placed separately for 2 min in a training box, for adaptation to thexperimental conditions. The following day, during a 10 min long session, aftermin of habituation, the animal received three footshocks (stimulus: 0.7 mA,s, repeated every 60 s). The shock intensity was selected according to our pre-ious experiment with this animal model of a conditioned fear response, and theoderate shock intensity effective enough to evoke a fear response, was used. A
timulus too strong could cause the ‘ceiling response’, for example a panic-like
only)4 Contextual fear test, exposure to the box, decapitation 10 min
later for plasma corticosterone analysis, decapitation for c-Fos,serotonin and CRF immunocytochemistry, 1.5 h later
1 rain Research 188 (2008) 154–167
Pyf5spahmmsfv
mlidatasli
2
mtad[PcB(atwociw
2
tdwca
bb0dTeMatwi0N
Table 2Treatment scheme for microdialysis study (LR and HR group)
Days Procedure
1–11 Adaptation to the housing conditions12 Probes implantation13 Contextual fear-conditioning test training session, 10 min14 50 min: Stabilization of perfusion (rats in home cage)
20 min: Point ‘0’ (rats in home cage)20 min: Sample 1 basal perfusion before placement of rats inaversive context (rats in home cage)20 min: Sample 2 contextual fear-conditioning test session,15 min, and the rats remained in the box for additional 5 min tocomplete the collection of a dialysate, i.e. 20 �l sample (rats intest cage)20 min: Sample 3, after the test (rats in home cage)20 min: Sample 4, after the test (rats in home cage)20 min: Sample 5, after the test (rats in home cage)20 min: Sample 6, after the test (rats in home cage)
s((oncop(
2
2cally with mobile phase delivered at 0.7 ml/min using a Shimadzu Clas VPLC 10AD pump. Electrochemical detector with a flow-through cell (Intro-Antec Leyden), linked to Shimadzu Class VP Integrator SCL-10 Avp, wasused. A high-density glassy carbon-working electrode (Antec) was operated at
56 M. Lehner et al. / Behavioural B
hoto beams were spaced 1.3 and 2.5 cm in the direction of the x-axis and the-axis, respectively. The absolute duration of inactivity was calculated by theear-conditioning system, defined as no interruption of any photo beam overs long periods, and then summarized for the whole 10 min long experimental
ession (total time of freezing). The fear-conditioning system has been validatedreviously in our laboratory [40,76]. The method of automated measurement offreezing reaction has been used in our and other laboratories for years, and itas been validated pharmacologically using many clinically effective and experi-ental anxiolytic and anxiogenic agents [40,67,76]. Accordingly, computerizedethod based on latency between photo beam interruption measures is a reliable
coring criterion in rodents, and computer measures obtained during contextualear-conditioning tests showed high correlation with hand-scored freezing, “r”alues ranged from 0.87 to 0.94 [78,82].
Ultrasonic vocalizations were recorded simultaneously by an ultrasonicicrophone built in the Mini-3 bat detector (Ultra Sound Advice, London, Eng-
and), attached to the ceiling of the chamber, and processed by an Ultravoxnterface (Noldus Information Technology) to an IBM compatible PC. The batetector was set at 22 kHz (the range 17–27 kHz, with minimum duration ofn individual acoustic signal accepted by the Ultravox apparatus as a vocaliza-ion event—300 ms). The vocalization calls around 22 ± 5 kHz, were selecteds these frequency calls are considered to be selectively induced by aversivetimulation [4,6,29]. The duration of ultrasonic vocalization (s) during 10 minong session was recorded (total time of vocalization, i.e. cumulated time ofndividual calls in 10 min) [39].
.3. Corticosterone assay
The plasma levels of corticosterone were also studied in conditioned ani-als (n = 28) on the 3rd day of contextual fear-conditioning test, 10 min after
esting (Table 1). After testing the rats were transported to the home cage,nd 10 min later their blood samples were collected in a different room afterecapitation. 500 �l samples of blood were collected into heparinised tubes43]. The samples were immediately centrifuged (2600 × g at 4 ◦C for 15 min).lasma was immediately extracted and stored at −70 ◦C, until analysis. Plasmaorticosterone levels were analyzed by radioimmunoassay [3H] RIA kit, MPiomedicals Inc. The assay was performed in duplicate. Plasma was diluted
1:500) with steroid diluent and assayed according to kit instructions. Prior tossay, all samples were incubated at 98 ◦C for 10 min, to denature the corticos-erone binding proteins in plasma. The corticosterone antibody cross-reactivityith other naturally occurring adrenal steroids was <0.08%, except for des-xycorticosterone (6.10%), progesterone (0.29%) and cortisol (0.19%). Theoncentration range for this assay was 0.025–1 ng/0.5 ml with a six point cal-bration curve 0.025, 0.05, 0.1, 0.25, 0.5, 1 ng/0.5 ml. Intra-assay variabilityas 5%.
.4. Microdialysis
In a separate experiment another group of animals (n = 15) was subjected tohe microdialysis experiment. These animals, 1 day after implantation of micro-ialysis probes were trained in the conditioned fear test, then dialysate samplesere collected in HR and LR animals, selected according to the described above
riterion. Microdialysis and behavioral test (fear conditioning) were performedt the same time in the group of LR and HR animals (Table 2).
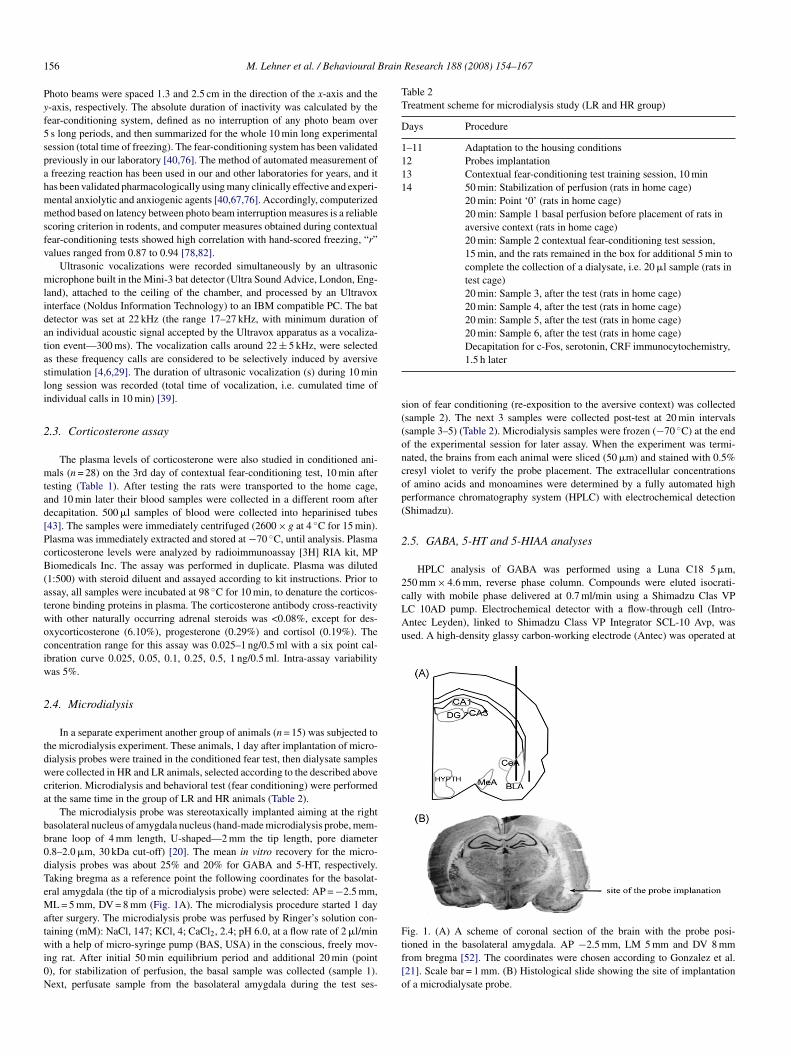
The microdialysis probe was stereotaxically implanted aiming at the rightasolateral nucleus of amygdala nucleus (hand-made microdialysis probe, mem-rane loop of 4 mm length, U-shaped—2 mm the tip length, pore diameter.8–2.0 �m, 30 kDa cut-off) [20]. The mean in vitro recovery for the micro-ialysis probes was about 25% and 20% for GABA and 5-HT, respectively.aking bregma as a reference point the following coordinates for the basolat-ral amygdala (the tip of a microdialysis probe) were selected: AP = −2.5 mm,L = 5 mm, DV = 8 mm (Fig. 1A). The microdialysis procedure started 1 day
fter surgery. The microdialysis probe was perfused by Ringer’s solution con-
aining (mM): NaCl, 147; KCl, 4; CaCl2, 2.4; pH 6.0, at a flow rate of 2 �l/minith a help of micro-syringe pump (BAS, USA) in the conscious, freely mov-ng rat. After initial 50 min equilibrium period and additional 20 min (point), for stabilization of perfusion, the basal sample was collected (sample 1).ext, perfusate sample from the basolateral amygdala during the test ses-
Ftf[o
Decapitation for c-Fos, serotonin, CRF immunocytochemistry,1.5 h later
ion of fear conditioning (re-exposition to the aversive context) was collectedsample 2). The next 3 samples were collected post-test at 20 min intervalssample 3–5) (Table 2). Microdialysis samples were frozen (−70 ◦C) at the endf the experimental session for later assay. When the experiment was termi-ated, the brains from each animal were sliced (50 �m) and stained with 0.5%resyl violet to verify the probe placement. The extracellular concentrationsf amino acids and monoamines were determined by a fully automated higherformance chromatography system (HPLC) with electrochemical detectionShimadzu).
.5. GABA, 5-HT and 5-HIAA analyses
HPLC analysis of GABA was performed using a Luna C18 5 �m,50 mm × 4.6 mm, reverse phase column. Compounds were eluted isocrati-
ig. 1. (A) A scheme of coronal section of the brain with the probe posi-ioned in the basolateral amygdala. AP −2.5 mm, LM 5 mm and DV 8 mmrom bregma [52]. The coordinates were chosen according to Gonzalez et al.21]. Scale bar = 1 mm. (B) Histological slide showing the site of implantationf a microdialysate probe.
rain
+uatEaSdaWoo(dwb(ct�
iKVL+vlw371rmTn
2
taspasc7Pa(brftfbFsTwsptn
B4
FPthb
M. Lehner et al. / Behavioural B
0.85 V. Rheodyne injection valve with a 20 �l sample loops was used to man-ally inject the samples. Preparation of the mobile phase and the derivatisinggents were based on the method of Rowley et al. [62] with some modifica-ions. The mobile phase consisted of 45 mM disodium phosphate and 0.15 mMDTA with 24% methanol (v/v) water adjusted to pH 3.9 with 0.2 M citriccid. It was then filtered through 0.45 �m filters and degassed for 15 min.tock solution (0.01 M) of amino acids standards were prepared in doubleeionised water and kept at 4 ◦C for 5 days. To prevent adhesion to glass,mino acids (especially GABA) standards were prepared in polyethylene vials.orking solutions were prepared daily by dilutions of the stock solution. To
btain agents for derivatisation; OPA (22 mg, Fluka) was dissolved in 0.5 mlf 1 M Na2SO3, 0.5 ml of methanol, and 0.9 ml of sodium tetraborate buffer0.1 M) adjusted to the pH 10.4 with 5 M sodium hydroxide. The reaction oferivatisation was performed at room temperature. Derivatising agent (20 �l)as reacted with 1 ml of amino acid standard for 15 min in polyethylene vialefore injection onto the column. For reaction with microdialysis samples20 �l), the volume of derivatising agent was reduced to 0.4 �l to eliminateontamination of chromatogram by excessive reagent, which is electroac-ive. The concentration of aminoacids and their metabolites was calculated asM.
Determination of 5-HT and its metabolite was performed using a mod-fied high pressure liquid chromatography (HPLC) method reported byaneda et al. [33]. The HPLC system consisted of Shimadzu LC-10APP pump electrochemical detector with flow-though cell (Decade—Anteceyden). A high-density glassy carbon-working electrode was operated at840 mV. The sample was injected manually to Rheodyne 7725 injectionalve with a 20 �l sample loop. Separation of monoamines and their metabo-ites was obtained on the Phenomenex Luna C18 3 �m 150 mm × 3 mmith Phenomenex KJO-4282 precolumn. The column temperature was2 ◦C. The mobile phase consisted of 4.1 mM Na2HPO4, 0.027 mM EDTA,.95 mM citric acid, 0.175 M NaCl, 0.34 mM octane sulphonic acid and
4% methanol. It was filtrated through 0.45 �m filtres (Millipore). The flowate was 0.4 ml/min. The mobile phase was degassed with helium. Chro-atogram registration and analysis was done using ChromaX 2000 software.he concentration of monoamines and their metabolites was calculated asg/ml.oti[p
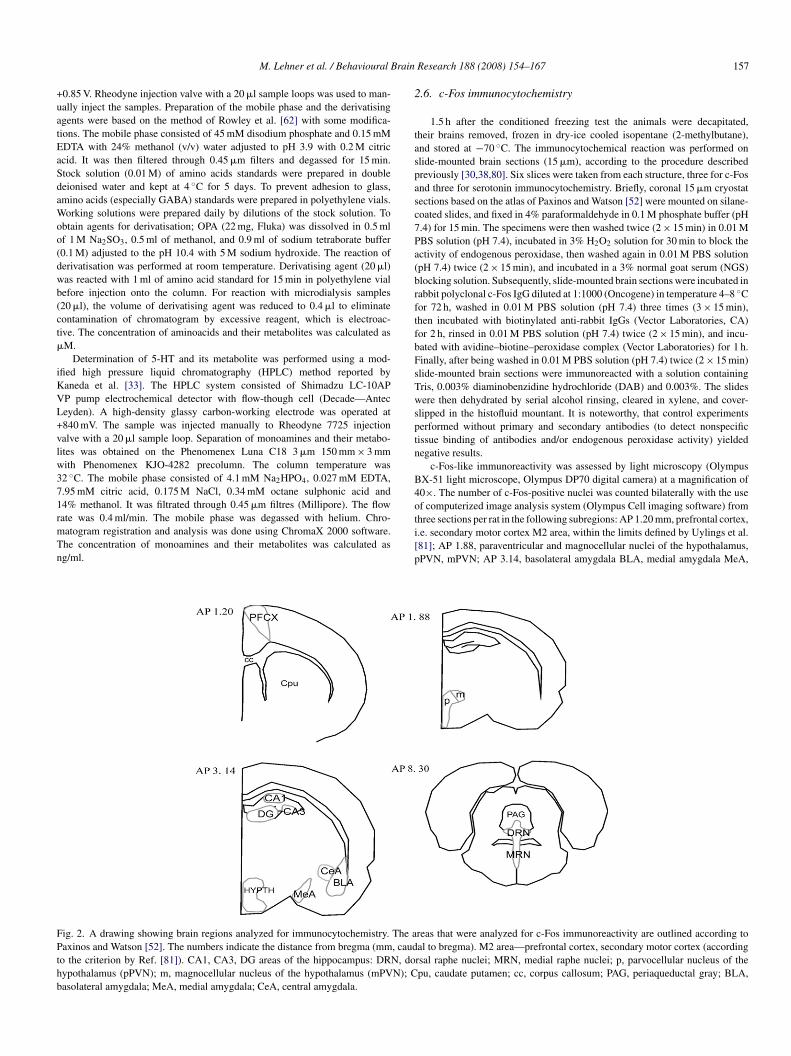
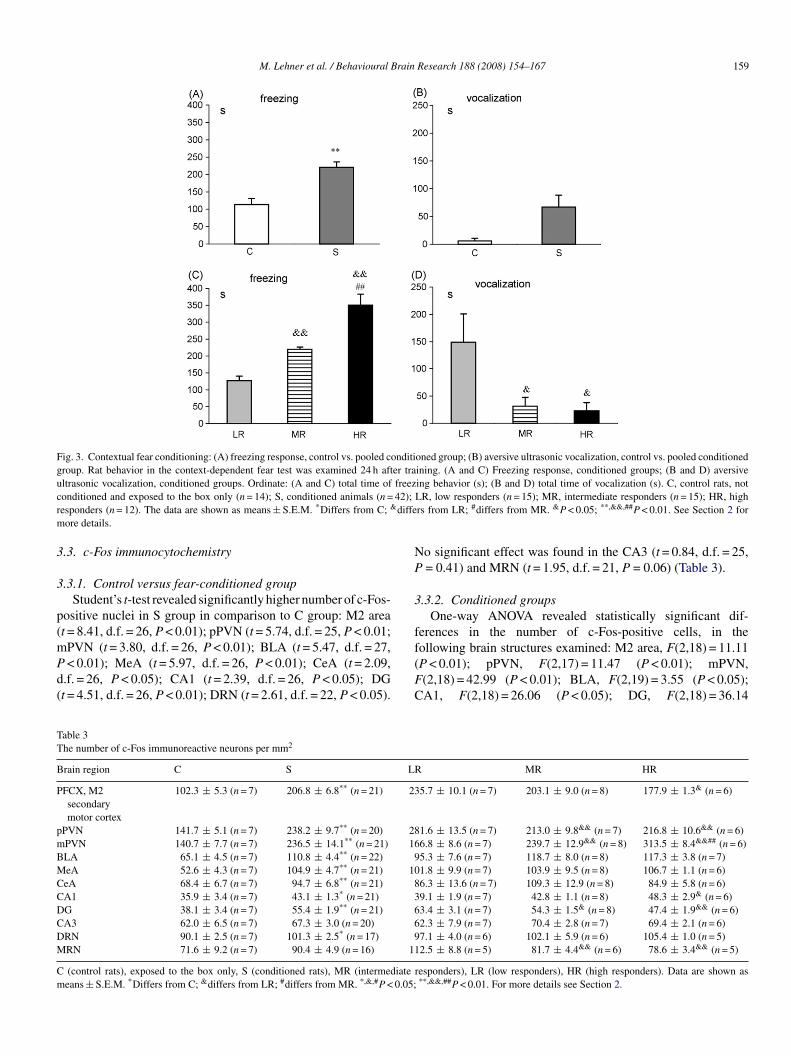
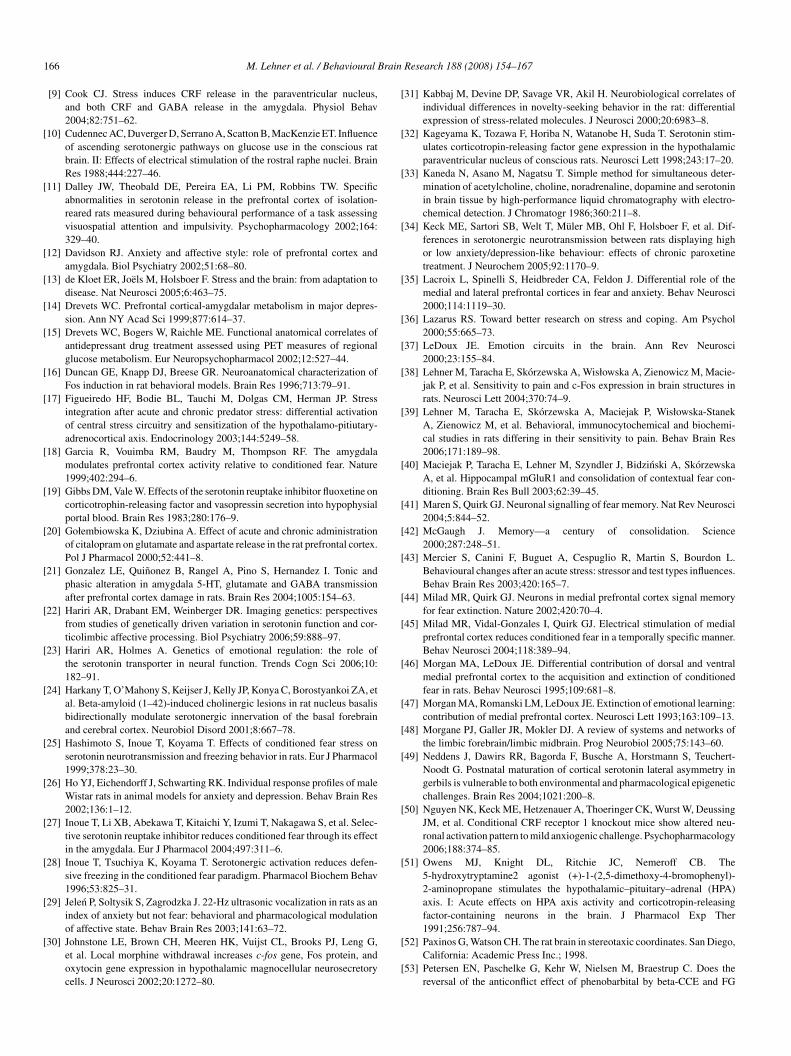
ig. 2. A drawing showing brain regions analyzed for immunocytochemistry. The aaxinos and Watson [52]. The numbers indicate the distance from bregma (mm, caud
o the criterion by Ref. [81]). CA1, CA3, DG areas of the hippocampus: DRN, doypothalamus (pPVN); m, magnocellular nucleus of the hypothalamus (mPVN); Casolateral amygdala; MeA, medial amygdala; CeA, central amygdala.
Research 188 (2008) 154–167 157
.6. c-Fos immunocytochemistry
1.5 h after the conditioned freezing test the animals were decapitated,heir brains removed, frozen in dry-ice cooled isopentane (2-methylbutane),nd stored at −70 ◦C. The immunocytochemical reaction was performed onlide-mounted brain sections (15 �m), according to the procedure describedreviously [30,38,80]. Six slices were taken from each structure, three for c-Fosnd three for serotonin immunocytochemistry. Briefly, coronal 15 �m cryostatections based on the atlas of Paxinos and Watson [52] were mounted on silane-oated slides, and fixed in 4% paraformaldehyde in 0.1 M phosphate buffer (pH.4) for 15 min. The specimens were then washed twice (2 × 15 min) in 0.01 MBS solution (pH 7.4), incubated in 3% H2O2 solution for 30 min to block thectivity of endogenous peroxidase, then washed again in 0.01 M PBS solutionpH 7.4) twice (2 × 15 min), and incubated in a 3% normal goat serum (NGS)locking solution. Subsequently, slide-mounted brain sections were incubated inabbit polyclonal c-Fos IgG diluted at 1:1000 (Oncogene) in temperature 4–8 ◦Cor 72 h, washed in 0.01 M PBS solution (pH 7.4) three times (3 × 15 min),hen incubated with biotinylated anti-rabbit IgGs (Vector Laboratories, CA)or 2 h, rinsed in 0.01 M PBS solution (pH 7.4) twice (2 × 15 min), and incu-ated with avidine–biotine–peroxidase complex (Vector Laboratories) for 1 h.inally, after being washed in 0.01 M PBS solution (pH 7.4) twice (2 × 15 min)lide-mounted brain sections were immunoreacted with a solution containingris, 0.003% diaminobenzidine hydrochloride (DAB) and 0.003%. The slidesere then dehydrated by serial alcohol rinsing, cleared in xylene, and cover-
lipped in the histofluid mountant. It is noteworthy, that control experimentserformed without primary and secondary antibodies (to detect nonspecificissue binding of antibodies and/or endogenous peroxidase activity) yieldedegative results.
c-Fos-like immunoreactivity was assessed by light microscopy (OlympusX-51 light microscope, Olympus DP70 digital camera) at a magnification of0×. The number of c-Fos-positive nuclei was counted bilaterally with the use
f computerized image analysis system (Olympus Cell imaging software) fromhree sections per rat in the following subregions: AP 1.20 mm, prefrontal cortex,.e. secondary motor cortex M2 area, within the limits defined by Uylings et al.81]; AP 1.88, paraventricular and magnocellular nuclei of the hypothalamus,PVN, mPVN; AP 3.14, basolateral amygdala BLA, medial amygdala MeA,reas that were analyzed for c-Fos immunoreactivity are outlined according toal to bregma). M2 area—prefrontal cortex, secondary motor cortex (accordingrsal raphe nuclei; MRN, medial raphe nuclei; p, parvocellular nucleus of thepu, caudate putamen; cc, corpus callosum; PAG, periaqueductal gray; BLA,
1 rain
cd
2
sTbsfsi7spftrabbdbm
BoiirmpACr
2
scapwidasdPa(cPihr
lwaatca3
Cn
2
istwwIadF
bccA
3
3v
3
(drv
3
taFcMiiiD
3
3
td
3
experimental groups in plasma concentration of corticosterone
58 M. Lehner et al. / Behavioural B
entral amygdala CeA, CA1, CA3, DG areas of the hippocampus; AP 8.30,orsal and median raphe nucleus (DRN, MRN, respectively) (Fig. 2).
.7. Serotonin immunochemistry
The immunocytochemical reaction was performed on slide-mounted brainections, according to the method described by Amat et al. [2], Staub et al. [70],ajudin and Druse [77]. Briefly, coronal 15 �m cryostat sections (see above)ased on the atlas of Paxinos and Watson [52] were mounted on silane-coatedlides, and fixed in 4% paraformaldehyde in 0.1 M phosphate buffer (pH 7.4)or 15 min. The specimens were then washed twice (2 × 15 min) in 0.01 M PBSolution (pH 7.4), incubated in 3% H2O2 solution for 30 min to block the activ-ty of endogenous peroxidase, then washed again in 0.01 M PBS solution (pH.4) twice (2 × 15 min), and incubated in a 10% normal goat serum blockingolution. Subsequently, slide-mounted brain sections were incubated in rabbitolyclonal serotonin antiserum diluted at 1:3000 (Sigma) in temperature 4–8 ◦Cor 24 h, washed in 0.01 M PBS solution (pH 7.4) three times (3 × 15 min),hen incubated with biotinylated anti-rabbit IgGs (Vector Laboratories) for 1 h,insed in 0.01 M PBS solution (pH 7.4) twice (2 × 15 min), and incubated withvidine–biotine–peroxidase complex (Vector Laboratories) for 2 h. Finally, aftereing washed in 0.01 M PBS solution (pH 7.4) twice (2 × 15 min) slide-mountedrain sections were immunoreacted with a solution containing Tris, 0.03%iaminobenzidine hydrochloride and 0.003%. The slides were then dehydratedy serial alcohol rinsing, cleared in xylene, and coverslipped in the histofluidountant.
Serotonin immunoreactivity was assessed by light microscopy (OlympusX-51 light microscope, Olympus DP 70 digital camera) at a magnificationf 100× within the plane of the section [77]. The number of serotonin-positivemmunoreactive complexes was counted bilaterally with the use of computerizedmage analysis system (Olympus Cell imaging software) from three sections perat in the following brain areas: AP 1.20 mm, prefrontal cortex, i.e. secondaryotor cortex M2 area, within the limits defined by Uylings et al. [81]; AP 1.88,
araventricular and magnocellular nuclei of the hypothalamus, pPVN, mPVN;P 3.14, basolateral amygdala BLA, medial amygdala MeA, central amygdalaeA, CA1, CA3, DG areas of the hippocampus; AP 8.30, dorsal and median
aphe nucleus (DRN, MRN, respectively) (Fig. 2).
.8. CRF immunochemistry
The immunocytochemical reaction was performed on slide-mounted brainections, according to the method described by Piekut and Phipps [54]. Briefly,oronal 15 �m cryostat sections (see above) based on the atlas of Paxinosnd Watson [52] were mounted on silane-coated slides, and fixed in 4%araformaldehyde in 0.1 M phosphate buffer (pH 7.4) for 15 min. The specimensere then washed twice (2 × 15 min) in 0.01 M PBS solution (pH 7.4), incubated
n 3% H2O2 solution for 30 min to block the activity of endogenous peroxi-ase, then washed again in 0.01 M PBS solution (pH 7.4) twice (2 × 15 min),nd incubated in a 10% normal goat serum blocking solution. Subsequently,lide-mounted brain sections were incubated in rabbit polyclonal CRF antiserumiluted at 1:1000 (Santa Cruz) in temperature 4–8 ◦C for 24 h, washed in 0.01 MBS solution (pH 7.4) three times (3 × 15 min), then incubated with biotinylatednti-rabbit IgGs (Vector Laboratories) for 1 h, rinsed in 0.01 M PBS solutionpH 7.4) twice (2 × 15 min), and incubated with avidine–biotine–peroxidaseomplex (Vector Laboratories) for 2 h. Finally, after being washed in 0.01 MBS solution (pH 7.4) twice (2 × 15 min) slide-mounted brain sections were
mmunoreacted with a solution containing Tris, 0.03% diaminobenzidineydrochloride and 0.003%. The slides were then dehydrated by serial alcoholinsing, cleared in xylene, and coverslipped in the histofluid mountant.
CRF immunoreactivity was assessed by light microscopy (Olympus BX-51ight microscope, Olympus DP70 digital camera) at a magnification of 100×ithin the plane of the section [54]. The number of CRF-positive immunore-
ctive complexes was counted bilaterally with the use of computerized image
nalysis system (Olympus Cell imaging software) from three sections per rat inhe following brain areas: AP 1.20 mm, prefrontal cortex, i.e. secondary motorortex M2 area, within the limits defined by Uylings et al. [81]; AP 1.88, par-ventricular and magnocellular nuclei of the hypothalamus, pPVN, mPVN; AP.14, basolateral amygdala BLA, medial amygdala MeA, central amygdala CeA,(Fl(
Research 188 (2008) 154–167
A1, CA3, DG areas of the hippocampus; AP 8.30, dorsal and median rapheucleus (DRN, MRN, respectively) (Fig. 2).
.9. Statistical analysis
The data are shown as means ± S.E.M. The behavioral, biochemical andmmunocytochemical data were analyzed in the following way: the control (non-hocked rats) group results were compared with the data obtained after poolinghe results of the three experimental groups (LR, MR and HR, shocked rats),ith the help of Student’s t-test. Next, the results of LR, MR and HR groupsere analyzed with one-way ANOVA followed by a post hoc Bonferroni test.
n this way statistical analysis was performed in a homogenous population ofnimals, and the information on the effects of an experimental procedure (a con-itioned fear test) was also checked (naive controls vs. conditioned animals).or the correlation analysis a Pearson’s coefficient was calculated.
Microdialysis data recorded during and after testing session were evaluatedy two-way ANOVA with repeated measures, and the total effect (the sum ofoncentrations in �M of GABA, and in ng/ml of 5-HT and 5-HIAA in dialysatesollected after the test session, i.e. sample 3–5), were checked by Student’s t-test.
probability value of P < 0.05 was considered significant in this study.
. Results
.1. Contextual fear conditioning and ultrasonicocalization
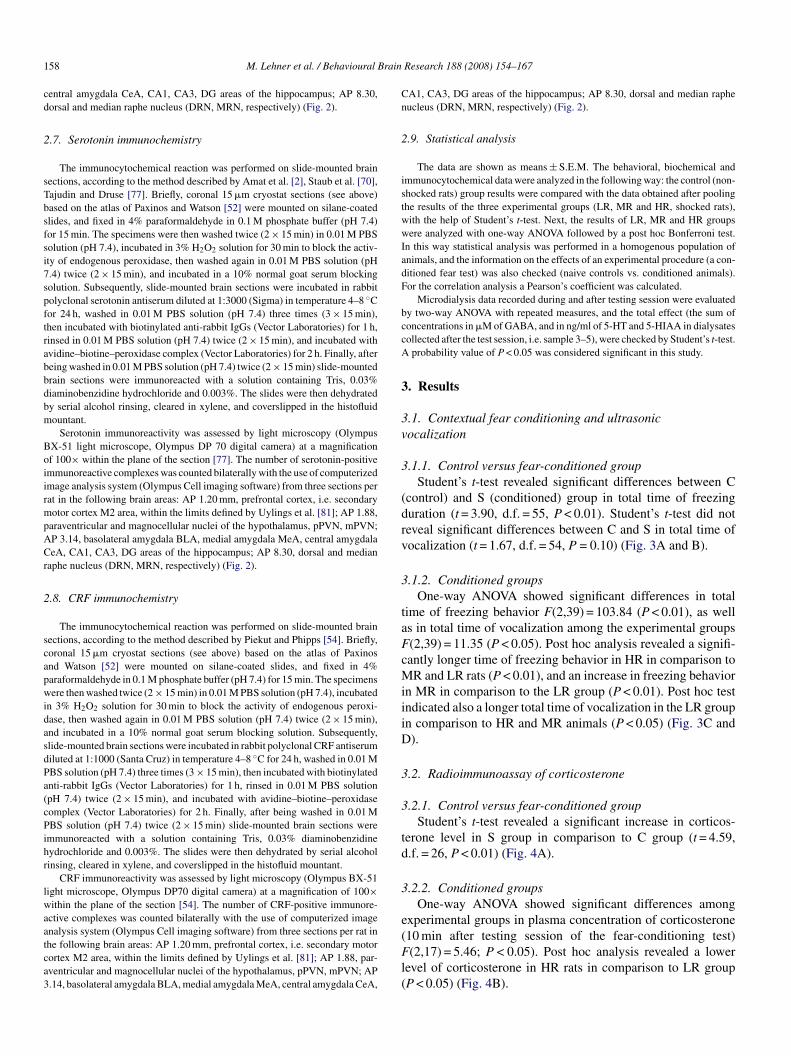
.1.1. Control versus fear-conditioned groupStudent’s t-test revealed significant differences between C
control) and S (conditioned) group in total time of freezinguration (t = 3.90, d.f. = 55, P < 0.01). Student’s t-test did noteveal significant differences between C and S in total time ofocalization (t = 1.67, d.f. = 54, P = 0.10) (Fig. 3A and B).
.1.2. Conditioned groupsOne-way ANOVA showed significant differences in total
ime of freezing behavior F(2,39) = 103.84 (P < 0.01), as wells in total time of vocalization among the experimental groups(2,39) = 11.35 (P < 0.05). Post hoc analysis revealed a signifi-antly longer time of freezing behavior in HR in comparison toR and LR rats (P < 0.01), and an increase in freezing behavior
n MR in comparison to the LR group (P < 0.01). Post hoc testndicated also a longer total time of vocalization in the LR groupn comparison to HR and MR animals (P < 0.05) (Fig. 3C and).
.2. Radioimmunoassay of corticosterone
.2.1. Control versus fear-conditioned groupStudent’s t-test revealed a significant increase in corticos-
erone level in S group in comparison to C group (t = 4.59,.f. = 26, P < 0.01) (Fig. 4A).
.2.2. Conditioned groupsOne-way ANOVA showed significant differences among
10 min after testing session of the fear-conditioning test)(2,17) = 5.46; P < 0.05). Post hoc analysis revealed a lower
evel of corticosterone in HR rats in comparison to LR groupP < 0.05) (Fig. 4B).
M. Lehner et al. / Behavioural Brain Research 188 (2008) 154–167 159
Fig. 3. Contextual fear conditioning: (A) freezing response, control vs. pooled conditioned group; (B) aversive ultrasonic vocalization, control vs. pooled conditionedgroup. Rat behavior in the context-dependent fear test was examined 24 h after training. (A and C) Freezing response, conditioned groups; (B and D) aversiveultrasonic vocalization, conditioned groups. Ordinate: (A and C) total time of freezing behavior (s); (B and D) total time of vocalization (s). C, control rats, notc 42);r diffem
3
3
p(mPd(
NP
3
f
TT
B
P
pmBMCCDCDM
Cm
onditioned and exposed to the box only (n = 14); S, conditioned animals (n =esponders (n = 12). The data are shown as means ± S.E.M. *Differs from C; &
ore details.
.3. c-Fos immunocytochemistry
.3.1. Control versus fear-conditioned groupStudent’s t-test revealed significantly higher number of c-Fos-
ositive nuclei in S group in comparison to C group: M2 areat = 8.41, d.f. = 26, P < 0.01); pPVN (t = 5.74, d.f. = 25, P < 0.01;
PVN (t = 3.80, d.f. = 26, P < 0.01); BLA (t = 5.47, d.f. = 27,< 0.01); MeA (t = 5.97, d.f. = 26, P < 0.01); CeA (t = 2.09,.f. = 26, P < 0.05); CA1 (t = 2.39, d.f. = 26, P < 0.05); DGt = 4.51, d.f. = 26, P < 0.01); DRN (t = 2.61, d.f. = 22, P < 0.05).
f(FC
able 3he number of c-Fos immunoreactive neurons per mm2
rain region C S LR
FCX, M2secondarymotor cortex
102.3 ± 5.3 (n = 7) 206.8 ± 6.8** (n = 21) 23
PVN 141.7 ± 5.1 (n = 7) 238.2 ± 9.7** (n = 20) 28PVN 140.7 ± 7.7 (n = 7) 236.5 ± 14.1** (n = 21) 16LA 65.1 ± 4.5 (n = 7) 110.8 ± 4.4** (n = 22) 9eA 52.6 ± 4.3 (n = 7) 104.9 ± 4.7** (n = 21) 10eA 68.4 ± 6.7 (n = 7) 94.7 ± 6.8** (n = 21) 8A1 35.9 ± 3.4 (n = 7) 43.1 ± 1.3* (n = 21) 3G 38.1 ± 3.4 (n = 7) 55.4 ± 1.9** (n = 21) 6A3 62.0 ± 6.5 (n = 7) 67.3 ± 3.0 (n = 20) 6RN 90.1 ± 2.5 (n = 7) 101.3 ± 2.5* (n = 17) 9RN 71.6 ± 9.2 (n = 7) 90.4 ± 4.9 (n = 16) 11
(control rats), exposed to the box only, S (conditioned rats), MR (intermediate reans ± S.E.M. *Differs from C; &differs from LR; #differs from MR. *,&,#P < 0.05;
LR, low responders (n = 15); MR, intermediate responders (n = 15); HR, highrs from LR; #differs from MR. &P < 0.05; **,&&,##P < 0.01. See Section 2 for
o significant effect was found in the CA3 (t = 0.84, d.f. = 25,= 0.41) and MRN (t = 1.95, d.f. = 21, P = 0.06) (Table 3).
.3.2. Conditioned groupsOne-way ANOVA revealed statistically significant dif-
erences in the number of c-Fos-positive cells, in the
ollowing brain structures examined: M2 area, F(2,18) = 11.11P < 0.01); pPVN, F(2,17) = 11.47 (P < 0.01); mPVN,(2,18) = 42.99 (P < 0.01); BLA, F(2,19) = 3.55 (P < 0.05);A1, F(2,18) = 26.06 (P < 0.05); DG, F(2,18) = 36.14MR HR
5.7 ± 10.1 (n = 7) 203.1 ± 9.0 (n = 8) 177.9 ± 1.3& (n = 6)
1.6 ± 13.5 (n = 7) 213.0 ± 9.8&& (n = 7) 216.8 ± 10.6&& (n = 6)6.8 ± 8.6 (n = 7) 239.7 ± 12.9&& (n = 8) 313.5 ± 8.4&&## (n = 6)5.3 ± 7.6 (n = 7) 118.7 ± 8.0 (n = 8) 117.3 ± 3.8 (n = 7)1.8 ± 9.9 (n = 7) 103.9 ± 9.5 (n = 8) 106.7 ± 1.1 (n = 6)6.3 ± 13.6 (n = 7) 109.3 ± 12.9 (n = 8) 84.9 ± 5.8 (n = 6)9.1 ± 1.9 (n = 7) 42.8 ± 1.1 (n = 8) 48.3 ± 2.9& (n = 6)3.4 ± 3.1 (n = 7) 54.3 ± 1.5& (n = 8) 47.4 ± 1.9&& (n = 6)2.3 ± 7.9 (n = 7) 70.4 ± 2.8 (n = 7) 69.4 ± 2.1 (n = 6)7.1 ± 4.0 (n = 6) 102.1 ± 5.9 (n = 6) 105.4 ± 1.0 (n = 5)2.5 ± 8.8 (n = 5) 81.7 ± 4.4&& (n = 6) 78.6 ± 3.4&& (n = 5)
esponders), LR (low responders), HR (high responders). Data are shown as**,&&,##P < 0.01. For more details see Section 2.
160 M. Lehner et al. / Behavioural Brain
Fig. 4. Plasma corticosterone concentration (ng/ml) measured 10 min after test-ing session of the fear-conditioning test. (A) Control vs. pooled conditionedgroup. (B) Plasma corticosterone concentration in fear-conditioned groups. Thedata are shown as means ± S.E.M. C, Control rats, not conditioned and exposedtd*
S
(eFF(
w(wtL(riIiaf
3
3
i
Md(DP(DP
3
dl(Fi(F(F
i(i(H<
3
3
ad(CPdna
3
esp(FFD(M
o the box only (n = 8); S, pooled conditioned rats (n = 20); LR, low respon-ers (n = 7); MR, intermediate responders (n = 6); HR, high responders (n = 7).Differs from C; &differs from LR. &P < 0.05; **P < 0.01. For more details seeection 2.
P < 0.01); MRN, F(2,13) = 9.89 (P < 0.01). No significantffect was found in the MeA, F(2,18) = 0.07 (P = 0.92); CeA,(2,18) = 1.49 (P = 0.25); CA3 area of the hippocampus,(2,17) = 0.74 (P = 0.48), and DRN, F(2,14) = 0.87 (P = 0.43)
Table 3).In M2 area of the prefrontal cortex, the expression of c-Fos
as most potent in LR rats in comparison to HR group (P < 0.05)Fig. 5). In pPVN, a stronger increase in c-Fos-positive nucleias found in LR vs. MR and HR group (P < 0.01). In mPVN,
he expression of c-Fos was higher in HR, in comparison toR and MR animals (P < 0.01), and in MR group vs. LR rats
P < 0.01). In the CA1, c-Fos expression was increased in HRats in comparison to LR group (P < 0.05). In the DG c-Fos wasncreased in LR group vs. HR (P < 0.01), and. MR rats (P < 0.05).n the median raphe nucleus of LR animals, the enhanced c-Fosmmunoreactivity was found in comparison to MR (P < 0.01),nd HR rats (P < 0.01). Post hoc analysis did not revealed dif-erences in c-Fos labeling in the basolateral amygdala.
.4. Serotonin immunocytochemistry
.4.1. Control versus fear-conditioned groupStudent’s t-test revealed significantly higher serotonin
mmunocytochemistry in S group in comparison to C group:
igaM
Research 188 (2008) 154–167
2 area (t = 6.41, d.f. = 25, P < 0.01); pPVN (t = 2.77,.f. = 20, P < 0.05); mPVN (t = 4.14, d.f. = 21, P < 0.01); MeAt = 2.62, d.f. = 22, P < 0.05); CeA (t = 2.30, d.f. = 19, P = 0.05);RN (t = 12.33, d.f. = 19, P < 0.01); MRN (t = 5.73, d.f. = 21,< 0.01). No significant differences were found in BLA
t = 1.94, d.f. = 22, P = 0.06); CA1 (t = 0.50, d.f. = 22, P = 0.61);G (t = 0.38, d.f. = 21, P = 0.71) and CA3 (t = −1.99, d.f. = 22,= 0.06) (Table 4).
.4.2. Conditioned groupsOne-way ANOVA revealed statistically significant
ifferences in the serotonin immunoreactivity in the fol-owing brain structures examined: M2 area, F(2,17) = 6.11P < 0.01); pPVN, F(2,12) = 59.20 (P < 0.01) and BLA,(2,14) = 13.31 (P < 0.01). No significant effect was found
n mPVN, F(2,13) = 2.97 (P = 0.09); CeA, F(2,12) = 2.44P = 0.12); MeA, F(2,14) = 0.19 (P = 0.82); CA1 area,(2,14) = 0.41 (P = 0.95); DG, F(2,13) = 3.37 (P = 0.13); CA3
2,14) = 0.88 (P = 0.44); DRN, F(2,11) = 0.05 (P = 0.95); MRN,(2,13) = 1.37 (P = 0.29) (Table 4).
In M2 area of the prefrontal cortex, serotonin immunoreactiv-ty was higher in LR group in comparison to MR and HR animalsP < 0.05) (Fig. 5). In pPVN, there was an increase in serotoninmmunoreactivity in MR and HR groups compared to LR groupP < 0.01). In BLA serotonin immunoreactivity was elevated inR and MR groups in comparison to LR group (P < 0.01 and0.05, respectively).
.5. CRF immunocytochemistry
.5.1. Control versus fear-conditioned groupStudent’s t-test revealed significantly higher CRF immunore-
ctivity in S group in comparison to C group: pPVN (t = 8.48,.f. = 22, P < 0.01); BLA (t = 2.60, d.f. = 22, P < 0.05); MeAt = 2.91, d.f. = 23, P < 0.01); CeA (t = 11.26, d.f. = 24, P < 0.01);A1 (t = 6.08, d.f. = 23, P < 0.01); DG (t = 8.02, d.f. = 23,< 0.01); CA3 (t = 3.79, d.f. = 23, P < 0.01); DRN (t = 10.60,
.f. = 23, P < 0.01); MRN (t = 6.86, d.f. = 21, P < 0.01). No sig-ificant effect was found in M2 area (t = 0.46, d.f. = 20, P < 0.64)nd mPVN (t = −1.22, d.f. = 20, P < 0.24) (Table 5).
.5.2. Conditioned groupsOne-way ANOVA revealed statistically significant differ-
nces in the CRF immunostaining in the following braintructures examined: M2 area, F(2,12) = 10.34 (P < 0.01);PVN, F(2,14) = 8.79 (P < 0.01) and BLA, F(2,14) = 13.11P < 0.01). No significant effect was found in the mPVN,(2,14) = 0.31 (P = 0.74); MeA, F(2,15) = 1.70 (P = 0.22); CeA,(2,16) = 1.77 (P = 0.20); CA1 area F(2,15) = 0.89 (P = 0.43);G, F(2,15) = 0.13 (P = 0.88); CA3 area of the hippocampus
2,15) = 0.69 (P = 0.52); DRN, F(2,15) = 0.24 (P = 0.79), andRN, F(2,14) = 1.28 (P = 0.31) (Table 5).In M2 area of the prefrontal cortex, the most potent CRF
mmunostaining was found in LR rats (P < 0.01 vs. MR and HRroup) (Fig. 5). In pPVN there was elevated CRF immunore-ctivity in HR group in comparison to LR (P < 0.01), and inR animals in comparison to LR group (P < 0.05). In BLA an

M. Lehner et al. / Behavioural Brain Research 188 (2008) 154–167 161
F serota s seroc nified
it
3
itp
cn5
TS
B
P
pmBMCCDCDM
Cm
ig. 5. Photomicrographs showing representative expression of c-Fos, CRF andnucleus showing immunoreactivity for c-Fos protein, the dotted arrow indicateomplex. Slices were photographed with lens magnification 10×, and then mag
ncrease in CRF immunostaining was found in HR in comparisono LR (P < 0.01), and MR rats (P < 0.01).
.6. Correlation analysis results
Positive correlations were found between total time of vocal-zation and c-Fos in M2 area, and 5-HT in M2 area, betweenotal time of freezing and 5-HT in BLA and pPVN, c-Fos inPVN and c-Fos in MRN, 5-HT in pPVN and 5-HT in BLA,
3
f
able 4erotonin-like immunoreactivity per mm2
rain region C S
FCX, M2 secondarymotor cortex
30.1 ± 0.5 (n = 7) 46.8 ± 1.5** (n = 20)
PVN 122.6 ± 8.9 (n = 7) 168.0 ± 10.3* (n = 15)PVN 131.4 ± 11.2 (n = 7) 180.1 ± 6.1** (n = 16)LA 95.4 ± 12.8 (n = 7) 117.3 ± 5.0 (n = 17)eA 137.1 ± 14.8 (n = 7) 179.4 ± 8.9* (n = 17)eA 54.2 ± 3.0 (n = 6) 68.7 ± 3.8* (n = 15)A1 72.7 ± 4.8 (n = 7) 75.4 ± 2.8 (n = 17)G 75.2 ± 7.0 (n = 7) 77.7 ± 3.0 (n = 16)A3 113.0 ± 10.1 (n = 7) 93.0 ± 4.9 (n = 17)RN 75.5 ± 4.6 (n = 7) 251.9 ± 9.7** (n = 14)RN 67.7 ± 10.3 (n = 7) 154.5 ± 8.9** (n = 16)
(control rats), exposed to the box only, S (conditioned rats), MR (intermediate reans ± S.E.M. *Differs from C; &differs from LR; #differs from MR. *,&,#P < 0.05;
onin immunostaining in the M2 in LR, HR and C rats. The dark arrow indicatestonin immunoreactive complex, the light arrow indicates CRF immunoreactivedigitally. Bar indicates 90 �m. For more details see Section 2.
-Fos in M2 area and CRF in M2 area. On the other hand, aegative correlation was found between CRF in M2 area and-HT in pPVN (Table 6).
.7. Microdialysis
ANOVA with repeated measures showed significant dif-erences between LR and HR groups in GABA levels:
LR MR HR
53.1 ± 2.9 (n = 6) 43.3 ± 1.9& (n = 8) 44.9 ± 1.2& (n = 6)
116.2 ± 5.9 (n = 5) 191.6 ± 7.6&& (n = 5) 196.2 ± 3.0&& (n = 5)160.6 ± 14.0 (n = 5) 189.0 ± 9.7 (n = 5) 188.8 ± 2.6 (n = 6)96.3 ± 3.2 (n = 6) 121.8 ± 5.9& (n = 5) 134.4 ± 6.7&& (n = 6)
180.8 ± 23.6 (n = 6) 173.6 ± 3.6 (n = 7) 187.5 ± 10.1 (n = 4)58.0 ± 1.2 (n = 5) 75.0 ± 2.0 (n = 4) 73.3 ± 8.2 (n = 6)74.3 ± 5.2 (n = 5) 76.4 ± 5.4 (n = 7) 75.2 ± 4.1 (n = 5)75.4 ± 4.3 (n = 5) 73.4 ± 4.2 (n = 7) 87.9 ± 6.3 (n = 4)86.1 ± 7.0 (n = 6) 100.7 ± 8.1 (n = 7) 90.1 ± 11.6 (n = 4)
249.2 ± 22.5 (n = 6) 257.0 ± 10.6 (n = 4) 250.7 ± 6.1 (n = 4)160.2 ± 18.6 (n = 6) 156.9 ± 15.5 (n = 5) 134.5 ± 4.3 (n = 5)
esponders), LR (low responders), HR (high responders). Data are shown as**,&&,##P < 0.01. For more details see Section 2.
162 M. Lehner et al. / Behavioural Brain Research 188 (2008) 154–167
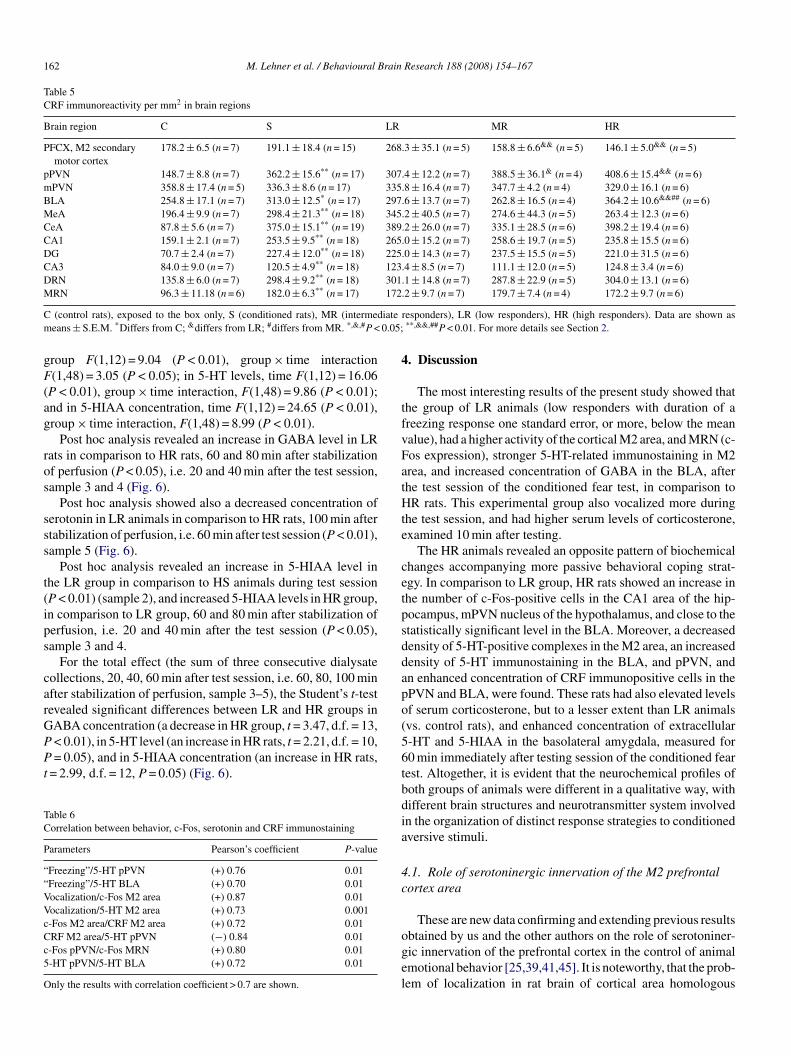
Table 5CRF immunoreactivity per mm2 in brain regions
Brain region C S LR MR HR
PFCX, M2 secondarymotor cortex
178.2 ± 6.5 (n = 7) 191.1 ± 18.4 (n = 15) 268.3 ± 35.1 (n = 5) 158.8 ± 6.6&& (n = 5) 146.1 ± 5.0&& (n = 5)
pPVN 148.7 ± 8.8 (n = 7) 362.2 ± 15.6** (n = 17) 307.4 ± 12.2 (n = 7) 388.5 ± 36.1& (n = 4) 408.6 ± 15.4&& (n = 6)mPVN 358.8 ± 17.4 (n = 5) 336.3 ± 8.6 (n = 17) 335.8 ± 16.4 (n = 7) 347.7 ± 4.2 (n = 4) 329.0 ± 16.1 (n = 6)BLA 254.8 ± 17.1 (n = 7) 313.0 ± 12.5* (n = 17) 297.6 ± 13.7 (n = 7) 262.8 ± 16.5 (n = 4) 364.2 ± 10.6&&## (n = 6)MeA 196.4 ± 9.9 (n = 7) 298.4 ± 21.3** (n = 18) 345.2 ± 40.5 (n = 7) 274.6 ± 44.3 (n = 5) 263.4 ± 12.3 (n = 6)CeA 87.8 ± 5.6 (n = 7) 375.0 ± 15.1** (n = 19) 389.2 ± 26.0 (n = 7) 335.1 ± 28.5 (n = 6) 398.2 ± 19.4 (n = 6)CA1 159.1 ± 2.1 (n = 7) 253.5 ± 9.5** (n = 18) 265.0 ± 15.2 (n = 7) 258.6 ± 19.7 (n = 5) 235.8 ± 15.5 (n = 6)DG 70.7 ± 2.4 (n = 7) 227.4 ± 12.0** (n = 18) 225.0 ± 14.3 (n = 7) 237.5 ± 15.5 (n = 5) 221.0 ± 31.5 (n = 6)CA3 84.0 ± 9.0 (n = 7) 120.5 ± 4.9** (n = 18) 123.4 ± 8.5 (n = 7) 111.1 ± 12.0 (n = 5) 124.8 ± 3.4 (n = 6)DRN 135.8 ± 6.0 (n = 7) 298.4 ± 9.2** (n = 18) 301.1 ± 14.8 (n = 7) 287.8 ± 22.9 (n = 5) 304.0 ± 13.1 (n = 6)M ** 172
C iatem 0.05;
gF(ag
ros
sss
t(ips
carGPPt
TC
P
““VVcCc5
O
4
tfvFatHte
cetpsddapo(
RN 96.3 ± 11.18 (n = 6) 182.0 ± 6.3 (n = 17)
(control rats), exposed to the box only, S (conditioned rats), MR (intermedeans ± S.E.M. *Differs from C; &differs from LR; #differs from MR. *,&,#P <
roup F(1,12) = 9.04 (P < 0.01), group × time interaction(1,48) = 3.05 (P < 0.05); in 5-HT levels, time F(1,12) = 16.06
P < 0.01), group × time interaction, F(1,48) = 9.86 (P < 0.01);nd in 5-HIAA concentration, time F(1,12) = 24.65 (P < 0.01),roup × time interaction, F(1,48) = 8.99 (P < 0.01).
Post hoc analysis revealed an increase in GABA level in LRats in comparison to HR rats, 60 and 80 min after stabilizationf perfusion (P < 0.05), i.e. 20 and 40 min after the test session,ample 3 and 4 (Fig. 6).
Post hoc analysis showed also a decreased concentration oferotonin in LR animals in comparison to HR rats, 100 min aftertabilization of perfusion, i.e. 60 min after test session (P < 0.01),ample 5 (Fig. 6).
Post hoc analysis revealed an increase in 5-HIAA level inhe LR group in comparison to HS animals during test sessionP < 0.01) (sample 2), and increased 5-HIAA levels in HR group,n comparison to LR group, 60 and 80 min after stabilization oferfusion, i.e. 20 and 40 min after the test session (P < 0.05),ample 3 and 4.
For the total effect (the sum of three consecutive dialysateollections, 20, 40, 60 min after test session, i.e. 60, 80, 100 minfter stabilization of perfusion, sample 3–5), the Student’s t-testevealed significant differences between LR and HR groups inABA concentration (a decrease in HR group, t = 3.47, d.f. = 13,
< 0.01), in 5-HT level (an increase in HR rats, t = 2.21, d.f. = 10,= 0.05), and in 5-HIAA concentration (an increase in HR rats,= 2.99, d.f. = 12, P = 0.05) (Fig. 6).
able 6orrelation between behavior, c-Fos, serotonin and CRF immunostaining
arameters Pearson’s coefficient P-value
Freezing”/5-HT pPVN (+) 0.76 0.01Freezing”/5-HT BLA (+) 0.70 0.01ocalization/c-Fos M2 area (+) 0.87 0.01ocalization/5-HT M2 area (+) 0.73 0.001-Fos M2 area/CRF M2 area (+) 0.72 0.01RF M2 area/5-HT pPVN (−) 0.84 0.01-Fos pPVN/c-Fos MRN (+) 0.80 0.01-HT pPVN/5-HT BLA (+) 0.72 0.01
nly the results with correlation coefficient > 0.7 are shown.
56tbdia
4c
ogel
.2 ± 9.7 (n = 7) 179.7 ± 7.4 (n = 4) 172.2 ± 9.7 (n = 6)
responders), LR (low responders), HR (high responders). Data are shown as**,&&,##P < 0.01. For more details see Section 2.
. Discussion
The most interesting results of the present study showed thathe group of LR animals (low responders with duration of areezing response one standard error, or more, below the meanalue), had a higher activity of the cortical M2 area, and MRN (c-os expression), stronger 5-HT-related immunostaining in M2rea, and increased concentration of GABA in the BLA, afterhe test session of the conditioned fear test, in comparison toR rats. This experimental group also vocalized more during
he test session, and had higher serum levels of corticosterone,xamined 10 min after testing.
The HR animals revealed an opposite pattern of biochemicalhanges accompanying more passive behavioral coping strat-gy. In comparison to LR group, HR rats showed an increase inhe number of c-Fos-positive cells in the CA1 area of the hip-ocampus, mPVN nucleus of the hypothalamus, and close to thetatistically significant level in the BLA. Moreover, a decreasedensity of 5-HT-positive complexes in the M2 area, an increasedensity of 5-HT immunostaining in the BLA, and pPVN, andn enhanced concentration of CRF immunopositive cells in thePVN and BLA, were found. These rats had also elevated levelsf serum corticosterone, but to a lesser extent than LR animalsvs. control rats), and enhanced concentration of extracellular-HT and 5-HIAA in the basolateral amygdala, measured for0 min immediately after testing session of the conditioned fearest. Altogether, it is evident that the neurochemical profiles ofoth groups of animals were different in a qualitative way, withifferent brain structures and neurotransmitter system involvedn the organization of distinct response strategies to conditionedversive stimuli.
.1. Role of serotoninergic innervation of the M2 prefrontalortex area
These are new data confirming and extending previous results
btained by us and the other authors on the role of serotoniner-ic innervation of the prefrontal cortex in the control of animalmotional behavior [25,39,41,45]. It is noteworthy, that the prob-em of localization in rat brain of cortical area homologous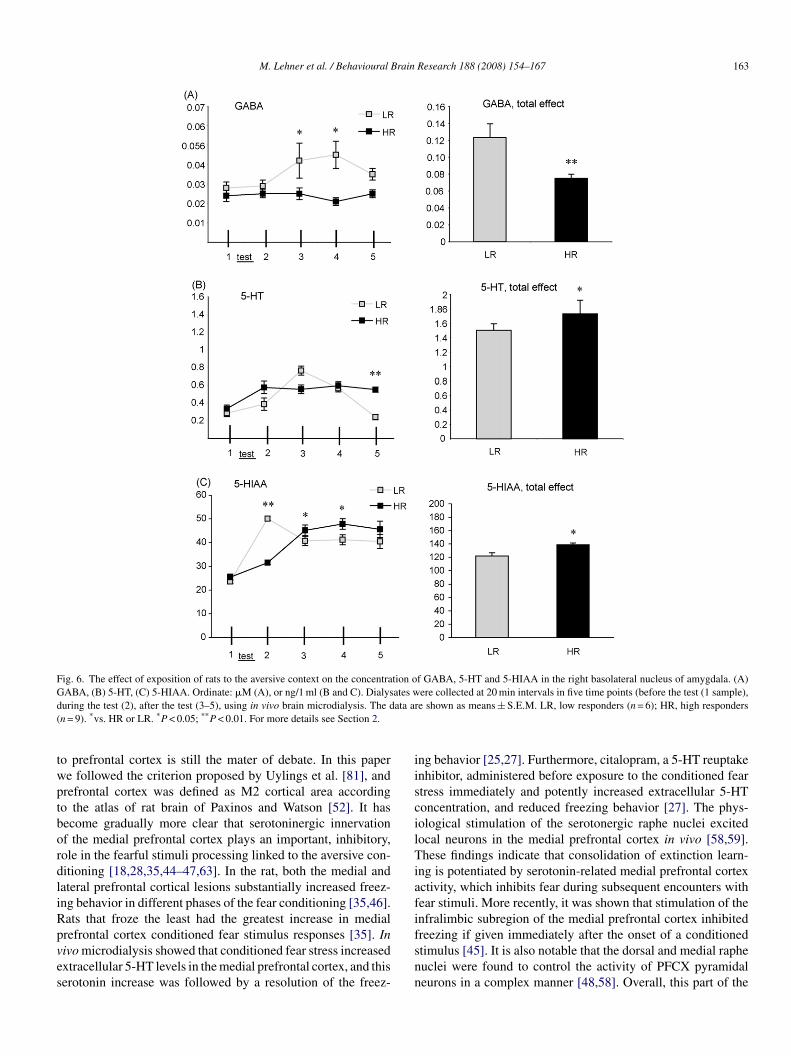
M. Lehner et al. / Behavioural Brain Research 188 (2008) 154–167 163
Fig. 6. The effect of exposition of rats to the aversive context on the concentration of GABA, 5-HT and 5-HIAA in the right basolateral nucleus of amygdala. (A)G ates wd ata ar(
twptbordliRpves
iiscilTiafi
ABA, (B) 5-HT, (C) 5-HIAA. Ordinate: �M (A), or ng/1 ml (B and C). Dialysuring the test (2), after the test (3–5), using in vivo brain microdialysis. The dn = 9). *vs. HR or LR. *P < 0.05; **P < 0.01. For more details see Section 2.
o prefrontal cortex is still the mater of debate. In this papere followed the criterion proposed by Uylings et al. [81], andrefrontal cortex was defined as M2 cortical area accordingo the atlas of rat brain of Paxinos and Watson [52]. It hasecome gradually more clear that serotoninergic innervationf the medial prefrontal cortex plays an important, inhibitory,ole in the fearful stimuli processing linked to the aversive con-itioning [18,28,35,44–47,63]. In the rat, both the medial andateral prefrontal cortical lesions substantially increased freez-ng behavior in different phases of the fear conditioning [35,46].ats that froze the least had the greatest increase in medial
refrontal cortex conditioned fear stimulus responses [35]. Inivo microdialysis showed that conditioned fear stress increasedxtracellular 5-HT levels in the medial prefrontal cortex, and thiserotonin increase was followed by a resolution of the freez-fsnn
ere collected at 20 min intervals in five time points (before the test (1 sample),e shown as means ± S.E.M. LR, low responders (n = 6); HR, high responders
ng behavior [25,27]. Furthermore, citalopram, a 5-HT reuptakenhibitor, administered before exposure to the conditioned feartress immediately and potently increased extracellular 5-HToncentration, and reduced freezing behavior [27]. The phys-ological stimulation of the serotonergic raphe nuclei excitedocal neurons in the medial prefrontal cortex in vivo [58,59].hese findings indicate that consolidation of extinction learn-
ng is potentiated by serotonin-related medial prefrontal cortexctivity, which inhibits fear during subsequent encounters withear stimuli. More recently, it was shown that stimulation of thenfralimbic subregion of the medial prefrontal cortex inhibited
reezing if given immediately after the onset of a conditionedtimulus [45]. It is also notable that the dorsal and medial rapheuclei were found to control the activity of PFCX pyramidaleurons in a complex manner [48,58]. Overall, this part of the
1 rain
sieioptnBc
4
gtGieour(stsoiMcta
4
im[uaa[apiiabtTlLncPt
epeFsi
tioatita
4
ciipenifrmihporBAfLeieLcTdHbsstrtr
64 M. Lehner et al. / Behavioural B
tudy adds new arguments to a number of literature data on thenhibitory role of cortical serotonin innervation in processing ofmotional input to the brain [1,5,10,11,24,49,55–57]. Accord-ngly, recent findings demonstrated a specific phenotypic profilef fear- and stress-related deficits in 5-HTT KO mice, accom-anied by morphological abnormalities in two key neural loci:he apical dendritic branches of the infralimbic cortex pyramidaleurons were significantly increased, and pyramidal neurons inLA had significantly greater spine density in 5-HTT KO miceompared with WT mice [85].
.2. CRF and serotonin interaction in prefrontal cortex
We have shown that in comparison to the HR group, the LRroup had stronger c-Fos, 5-HT- and CRF-related immunoreac-ivity in the cortical M2 area, and enhanced extracellular level ofABA in the BLA, measured during and immediately after test-
ng session, respectively. On the one hand, these data point to thenhancement of M2 area activity, as CRF is a potent stimulantf neuronal activity. Accordingly, the recently published resultsnderline the role of limbic CRF-R1 in modulating anxiety-elated behavior and suggest that reduced neuronal activationc-Fos immunochemistry) in the limbic and hypothalamic keytructures of the anxiety circuitry may mediate or contributeo the anxiolytic-like phenotype observed in mice with region-pecific deletion of forebrain CRF-R1 [50]. It is noteworthy thatur study showed significantly higher expression of all analyzedmmunocytochemical substrates: c-Fos, CRF and 5-HT, in the
2 area of LR animals. This appears interesting and significantoincidence, as serotonin, serotonin receptor agonists and reup-ake inhibitors have also been found to regulate the synthesisnd release of CRF [19,32,51,74].
.3. Role of the basolateral amygdala
On the other hand, the present data indicate an increasen inhibitory GABA-related processes in the BLA of LR ani-
als, a limbic structure known to process emotional stimuli72,73,79,83]. Local injections of midazolam, a positive mod-lator of the GABA-A receptor complex, to the basolateralnd lateral nuclei of amygdala in rats, were found to producen anxiolytic-like effect measured in a water lick paradigm53]. Conversely, confrontation of freely behaving mice withpreviously conditioned fear stimulus was accompanied by a
rolonged (up to 3 h) reduction of extracellular GABA levelsn the amygdala, indicative of a reduced GABA release and/orncreased GABA uptake from the extracellular space [72]. Theuthors conclude that changes in GABAergic transmission maye involved in retrieval and expression of conditioned fear andhe modulation of emotional state through the amygdala [3,83].his finding is similar to the reported in the present study long-
asting differences in amygdalar GABA concentration betweenR and HR rats (i.e. higher GABA levels in LR rats). It is also
oteworthy that the rat freezing behavior correlated in a signifi-ant way with 5-HT-like immunostaining in the BLA (r = 0.70,< 0.01), indicative of a role of this local monoamine innerva-ion in the mediation of a fear response (the HR rats had a higher
coie
Research 188 (2008) 154–167
xpression of 5-HT-like immunoreactivity in the BLA, in com-arison to LR animals). Interestingly, our study showed higherxpression of all analyzed immunocytochemical substrates: c-os, CRF and 5-HT in the BLA of HR animals. This is anothertriking coincidence, underlying the role of this limbic nucleusn the process of shaping emotional reactions in the HR animals.
The analysis of correlations indicates relationships betweenhe vocalization response and the expression of c-Fos and 5-HTn the M2 cortical area; the freezing response and the expressionf 5-HT in the PVN and BLA, as well as the expressions of c-Fosnd CRF in the M2 area. These data allow for conclusion thathe serotonin originating from the MRN plays an important rolen the regulation of the activity of cortical neurons controllinghe aversive behavior, concurrently with the hypothalamus andmygdala.
.4. Corticosterone concentration in LR and HR rats
In the LR rats, the plasma concentration of a stress hormone,orticosterone, measured immediately after the contextual freez-ng test, was increased in comparison to HR rats. This findings difficult to interpret, as CRF-like immunoreactivity in thePVN of the hypothalamus was not enhanced (it is of note, how-ver, that c-Fos expression was increased in this hypothalamicucleus). It is also remarkable that similar changes in rat behav-or and stress hormone serum concentration were previouslyound in LR animals, pre-selected on a basis of an individualesponse to pain (i.e. the pain threshold) [39]. In these ani-als the highest increase of c-Fos-positive cells was observed
n the M2 area, in the hypothalamus, and dentate gyrus of theippocampus. In the median raphe nucleus, the density of c-Fos-ositive staining was significantly enhanced in the LR groupnly (the present study). In comparison to the HR group, LRats had a lower number of 5-HT-like positive complexes in theLA, and an enhanced 5-HT immunostaining in the M2 area.most potent increase in plasma corticosterone concentration,
ollowing conditioned aversive stimuli, was also observed inR rats. It is striking that in LR rats (the previous and presentxperiment), c-Fos protein expression was selectively increasedn the DG area of the hippocampus. This finding may help toxplain the mechanism of hyperactivity of the stress axis in theR group, given the assumed role of the hippocampus in theontrol of hypothalamic CRF synthesis and release [9,60,61,66].aken together, it is conceivable that the affective component ofifferent aversive stimuli may engage similar brain structures.owever, we have also observed that there was no correlationetween the freezing response and the pain threshold in ratsubjected to fear conditioning with individually matched aver-ive stimulation (i.e. a painful stimulus was chosen accordingo the following formula: an electric footshock evoking flinchesponse (in mA), by 30%). The factor analysis revealed alsohat flinch response thresholds (in mA), and time of freezingeactions were not grouped by the same factor. These data indi-
ate that the conditioned fear reaction does not depend directlyn pain sensitivity (data submitted for publication). Moreover,f the pain threshold was a sole variable controlling behavior ofxperimental animals, why would low sensitivity rats with dura-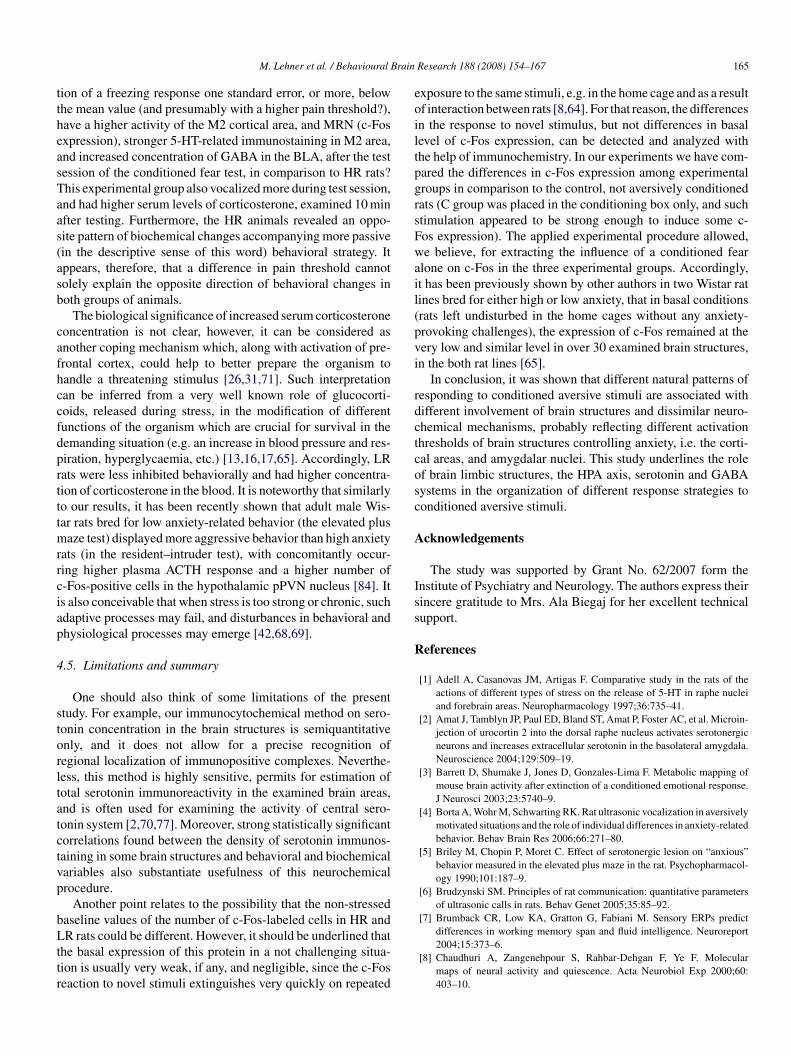
rain
ttheasTaas(asb
cafhccfdprtttmrrciap
4
storltatctvp
bLttr
eoiltpgrsFwail(pvi
rdctcosc
A
Iss
R
M. Lehner et al. / Behavioural B
ion of a freezing response one standard error, or more, belowhe mean value (and presumably with a higher pain threshold?),ave a higher activity of the M2 cortical area, and MRN (c-Fosxpression), stronger 5-HT-related immunostaining in M2 area,nd increased concentration of GABA in the BLA, after the testession of the conditioned fear test, in comparison to HR rats?his experimental group also vocalized more during test session,nd had higher serum levels of corticosterone, examined 10 minfter testing. Furthermore, the HR animals revealed an oppo-ite pattern of biochemical changes accompanying more passivein the descriptive sense of this word) behavioral strategy. Itppears, therefore, that a difference in pain threshold cannotolely explain the opposite direction of behavioral changes inoth groups of animals.
The biological significance of increased serum corticosteroneoncentration is not clear, however, it can be considered asnother coping mechanism which, along with activation of pre-rontal cortex, could help to better prepare the organism toandle a threatening stimulus [26,31,71]. Such interpretationan be inferred from a very well known role of glucocorti-oids, released during stress, in the modification of differentunctions of the organism which are crucial for survival in theemanding situation (e.g. an increase in blood pressure and res-iration, hyperglycaemia, etc.) [13,16,17,65]. Accordingly, LRats were less inhibited behaviorally and had higher concentra-ion of corticosterone in the blood. It is noteworthy that similarlyo our results, it has been recently shown that adult male Wis-ar rats bred for low anxiety-related behavior (the elevated plus
aze test) displayed more aggressive behavior than high anxietyats (in the resident–intruder test), with concomitantly occur-ing higher plasma ACTH response and a higher number of-Fos-positive cells in the hypothalamic pPVN nucleus [84]. Its also conceivable that when stress is too strong or chronic, suchdaptive processes may fail, and disturbances in behavioral andhysiological processes may emerge [42,68,69].
.5. Limitations and summary
One should also think of some limitations of the presenttudy. For example, our immunocytochemical method on sero-onin concentration in the brain structures is semiquantitativenly, and it does not allow for a precise recognition ofegional localization of immunopositive complexes. Neverthe-ess, this method is highly sensitive, permits for estimation ofotal serotonin immunoreactivity in the examined brain areas,nd is often used for examining the activity of central sero-onin system [2,70,77]. Moreover, strong statistically significantorrelations found between the density of serotonin immunos-aining in some brain structures and behavioral and biochemicalariables also substantiate usefulness of this neurochemicalrocedure.
Another point relates to the possibility that the non-stressedaseline values of the number of c-Fos-labeled cells in HR and
R rats could be different. However, it should be underlined thathe basal expression of this protein in a not challenging situa-ion is usually very weak, if any, and negligible, since the c-Foseaction to novel stimuli extinguishes very quickly on repeated
Research 188 (2008) 154–167 165
xposure to the same stimuli, e.g. in the home cage and as a resultf interaction between rats [8,64]. For that reason, the differencesn the response to novel stimulus, but not differences in basalevel of c-Fos expression, can be detected and analyzed withhe help of immunochemistry. In our experiments we have com-ared the differences in c-Fos expression among experimentalroups in comparison to the control, not aversively conditionedats (C group was placed in the conditioning box only, and suchtimulation appeared to be strong enough to induce some c-os expression). The applied experimental procedure allowed,e believe, for extracting the influence of a conditioned fear
lone on c-Fos in the three experimental groups. Accordingly,t has been previously shown by other authors in two Wistar ratines bred for either high or low anxiety, that in basal conditionsrats left undisturbed in the home cages without any anxiety-rovoking challenges), the expression of c-Fos remained at theery low and similar level in over 30 examined brain structures,n the both rat lines [65].
In conclusion, it was shown that different natural patterns ofesponding to conditioned aversive stimuli are associated withifferent involvement of brain structures and dissimilar neuro-hemical mechanisms, probably reflecting different activationhresholds of brain structures controlling anxiety, i.e. the corti-al areas, and amygdalar nuclei. This study underlines the rolef brain limbic structures, the HPA axis, serotonin and GABAystems in the organization of different response strategies toonditioned aversive stimuli.
cknowledgements
The study was supported by Grant No. 62/2007 form thenstitute of Psychiatry and Neurology. The authors express theirincere gratitude to Mrs. Ala Biegaj for her excellent technicalupport.
eferences
[1] Adell A, Casanovas JM, Artigas F. Comparative study in the rats of theactions of different types of stress on the release of 5-HT in raphe nucleiand forebrain areas. Neuropharmacology 1997;36:735–41.
[2] Amat J, Tamblyn JP, Paul ED, Bland ST, Amat P, Foster AC, et al. Microin-jection of urocortin 2 into the dorsal raphe nucleus activates serotonergicneurons and increases extracellular serotonin in the basolateral amygdala.Neuroscience 2004;129:509–19.
[3] Barrett D, Shumake J, Jones D, Gonzales-Lima F. Metabolic mapping ofmouse brain activity after extinction of a conditioned emotional response.J Neurosci 2003;23:5740–9.
[4] Borta A, Wohr M, Schwarting RK. Rat ultrasonic vocalization in aversivelymotivated situations and the role of individual differences in anxiety-relatedbehavior. Behav Brain Res 2006;66:271–80.
[5] Briley M, Chopin P, Moret C. Effect of serotonergic lesion on “anxious”behavior measured in the elevated plus maze in the rat. Psychopharmacol-ogy 1990;101:187–9.
[6] Brudzynski SM. Principles of rat communication: quantitative parametersof ultrasonic calls in rats. Behav Genet 2005;35:85–92.
[7] Brumback CR, Low KA, Gratton G, Fabiani M. Sensory ERPs predict
differences in working memory span and fluid intelligence. Neuroreport2004;15:373–6.[8] Chaudhuri A, Zangenehpour S, Rahbar-Dehgan F, Ye F. Molecularmaps of neural activity and quiescence. Acta Neurobiol Exp 2000;60:403–10.
1 rain
[
[
[
[
[
[
[
[
[
[
[
[
[
[
[
[
[
[
[
[
[
[
[
[
[
[
[
[
[
[
[
[
[
[
[
[
[
[
[
[
[
[
66 M. Lehner et al. / Behavioural B
[9] Cook CJ. Stress induces CRF release in the paraventricular nucleus,and both CRF and GABA release in the amygdala. Physiol Behav2004;82:751–62.
10] Cudennec AC, Duverger D, Serrano A, Scatton B, MacKenzie ET. Influenceof ascending serotonergic pathways on glucose use in the conscious ratbrain. II: Effects of electrical stimulation of the rostral raphe nuclei. BrainRes 1988;444:227–46.
11] Dalley JW, Theobald DE, Pereira EA, Li PM, Robbins TW. Specificabnormalities in serotonin release in the prefrontal cortex of isolation-reared rats measured during behavioural performance of a task assessingvisuospatial attention and impulsivity. Psychopharmacology 2002;164:329–40.
12] Davidson RJ. Anxiety and affective style: role of prefrontal cortex andamygdala. Biol Psychiatry 2002;51:68–80.
13] de Kloet ER, Joels M, Holsboer F. Stress and the brain: from adaptation todisease. Nat Neurosci 2005;6:463–75.
14] Drevets WC. Prefrontal cortical-amygdalar metabolism in major depres-sion. Ann NY Acad Sci 1999;877:614–37.
15] Drevets WC, Bogers W, Raichle ME. Functional anatomical correlates ofantidepressant drug treatment assessed using PET measures of regionalglucose metabolism. Eur Neuropsychopharmacol 2002;12:527–44.
16] Duncan GE, Knapp DJ, Breese GR. Neuroanatomical characterization ofFos induction in rat behavioral models. Brain Res 1996;713:79–91.
17] Figueiredo HF, Bodie BL, Tauchi M, Dolgas CM, Herman JP. Stressintegration after acute and chronic predator stress: differential activationof central stress circuitry and sensitization of the hypothalamo-pitiutary-adrenocortical axis. Endocrinology 2003;144:5249–58.
18] Garcia R, Vouimba RM, Baudry M, Thompson RF. The amygdalamodulates prefrontal cortex activity relative to conditioned fear. Nature1999;402:294–6.
19] Gibbs DM, Vale W. Effects of the serotonin reuptake inhibitor fluoxetine oncorticotrophin-releasing factor and vasopressin secretion into hypophysialportal blood. Brain Res 1983;280:176–9.
20] Gołembiowska K, Dziubina A. Effect of acute and chronic administrationof citalopram on glutamate and aspartate release in the rat prefrontal cortex.Pol J Pharmacol 2000;52:441–8.
21] Gonzalez LE, Quinonez B, Rangel A, Pino S, Hernandez I. Tonic andphasic alteration in amygdala 5-HT, glutamate and GABA transmissionafter prefrontal cortex damage in rats. Brain Res 2004;1005:154–63.
22] Hariri AR, Drabant EM, Weinberger DR. Imaging genetics: perspectivesfrom studies of genetically driven variation in serotonin function and cor-ticolimbic affective processing. Biol Psychiatry 2006;59:888–97.
23] Hariri AR, Holmes A. Genetics of emotional regulation: the role ofthe serotonin transporter in neural function. Trends Cogn Sci 2006;10:182–91.
24] Harkany T, O’Mahony S, Keijser J, Kelly JP, Konya C, Borostyankoi ZA, etal. Beta-amyloid (1–42)-induced cholinergic lesions in rat nucleus basalisbidirectionally modulate serotonergic innervation of the basal forebrainand cerebral cortex. Neurobiol Disord 2001;8:667–78.
25] Hashimoto S, Inoue T, Koyama T. Effects of conditioned fear stress onserotonin neurotransmission and freezing behavior in rats. Eur J Pharmacol1999;378:23–30.
26] Ho YJ, Eichendorff J, Schwarting RK. Individual response profiles of maleWistar rats in animal models for anxiety and depression. Behav Brain Res2002;136:1–12.
27] Inoue T, Li XB, Abekawa T, Kitaichi Y, Izumi T, Nakagawa S, et al. Selec-tive serotonin reuptake inhibitor reduces conditioned fear through its effectin the amygdala. Eur J Pharmacol 2004;497:311–6.
28] Inoue T, Tsuchiya K, Koyama T. Serotonergic activation reduces defen-sive freezing in the conditioned fear paradigm. Pharmacol Biochem Behav1996;53:825–31.
29] Jelen P, Soltysik S, Zagrodzka J. 22-Hz ultrasonic vocalization in rats as anindex of anxiety but not fear: behavioral and pharmacological modulation
of affective state. Behav Brain Res 2003;141:63–72.30] Johnstone LE, Brown CH, Meeren HK, Vuijst CL, Brooks PJ, Leng G,et al. Local morphine withdrawal increases c-fos gene, Fos protein, andoxytocin gene expression in hypothalamic magnocellular neurosecretorycells. J Neurosci 2002;20:1272–80.
[
[
Research 188 (2008) 154–167
31] Kabbaj M, Devine DP, Savage VR, Akil H. Neurobiological correlates ofindividual differences in novelty-seeking behavior in the rat: differentialexpression of stress-related molecules. J Neurosci 2000;20:6983–8.
32] Kageyama K, Tozawa F, Horiba N, Watanobe H, Suda T. Serotonin stim-ulates corticotropin-releasing factor gene expression in the hypothalamicparaventricular nucleus of conscious rats. Neurosci Lett 1998;243:17–20.
33] Kaneda N, Asano M, Nagatsu T. Simple method for simultaneous deter-mination of acetylcholine, choline, noradrenaline, dopamine and serotoninin brain tissue by high-performance liquid chromatography with electro-chemical detection. J Chromatogr 1986;360:211–8.
34] Keck ME, Sartori SB, Welt T, Muler MB, Ohl F, Holsboer F, et al. Dif-ferences in serotonergic neurotransmission between rats displaying highor low anxiety/depression-like behaviour: effects of chronic paroxetinetreatment. J Neurochem 2005;92:1170–9.
35] Lacroix L, Spinelli S, Heidbreder CA, Feldon J. Differential role of themedial and lateral prefrontal cortices in fear and anxiety. Behav Neurosci2000;114:1119–30.
36] Lazarus RS. Toward better research on stress and coping. Am Psychol2000;55:665–73.
37] LeDoux JE. Emotion circuits in the brain. Ann Rev Neurosci2000;23:155–84.
38] Lehner M, Taracha E, Skorzewska A, Wisłowska A, Zienowicz M, Macie-jak P, et al. Sensitivity to pain and c-Fos expression in brain structures inrats. Neurosci Lett 2004;370:74–9.
39] Lehner M, Taracha E, Skorzewska A, Maciejak P, Wisłowska-StanekA, Zienowicz M, et al. Behavioral, immunocytochemical and biochemi-cal studies in rats differing in their sensitivity to pain. Behav Brain Res2006;171:189–98.
40] Maciejak P, Taracha E, Lehner M, Szyndler J, Bidzinski A, SkorzewskaA, et al. Hippocampal mGluR1 and consolidation of contextual fear con-ditioning. Brain Res Bull 2003;62:39–45.
41] Maren S, Quirk GJ. Neuronal signalling of fear memory. Nat Rev Neurosci2004;5:844–52.
42] McGaugh J. Memory—a century of consolidation. Science2000;287:248–51.
43] Mercier S, Canini F, Buguet A, Cespuglio R, Martin S, Bourdon L.Behavioural changes after an acute stress: stressor and test types influences.Behav Brain Res 2003;420:165–7.
44] Milad MR, Quirk GJ. Neurons in medial prefrontal cortex signal memoryfor fear extinction. Nature 2002;420:70–4.
45] Milad MR, Vidal-Gonzales I, Quirk GJ. Electrical stimulation of medialprefrontal cortex reduces conditioned fear in a temporally specific manner.Behav Neurosci 2004;118:389–94.
46] Morgan MA, LeDoux JE. Differential contribution of dorsal and ventralmedial prefrontal cortex to the acquisition and extinction of conditionedfear in rats. Behav Neurosci 1995;109:681–8.
47] Morgan MA, Romanski LM, LeDoux JE. Extinction of emotional learning:contribution of medial prefrontal cortex. Neurosci Lett 1993;163:109–13.
48] Morgane PJ, Galler JR, Mokler DJ. A review of systems and networks ofthe limbic forebrain/limbic midbrain. Prog Neurobiol 2005;75:143–60.
49] Neddens J, Dawirs RR, Bagorda F, Busche A, Horstmann S, Teuchert-Noodt G. Postnatal maturation of cortical serotonin lateral asymmetry ingerbils is vulnerable to both environmental and pharmacological epigeneticchallenges. Brain Res 2004;1021:200–8.
50] Nguyen NK, Keck ME, Hetzenauer A, Thoeringer CK, Wurst W, DeussingJM, et al. Conditional CRF receptor 1 knockout mice show altered neu-ronal activation pattern to mild anxiogenic challenge. Psychopharmacology2006;188:374–85.
51] Owens MJ, Knight DL, Ritchie JC, Nemeroff CB. The5-hydroxytryptamine2 agonist (+)-1-(2,5-dimethoxy-4-bromophenyl)-2-aminopropane stimulates the hypothalamic–pituitary–adrenal (HPA)axis. I: Acute effects on HPA axis activity and corticotropin-releasingfactor-containing neurons in the brain. J Pharmacol Exp Ther
1991;256:787–94.52] Paxinos G, Watson CH. The rat brain in stereotaxic coordinates. San Diego,California: Academic Press Inc.; 1998.
53] Petersen EN, Paschelke G, Kehr W, Nielsen M, Braestrup C. Does thereversal of the anticonflict effect of phenobarbital by beta-CCE and FG
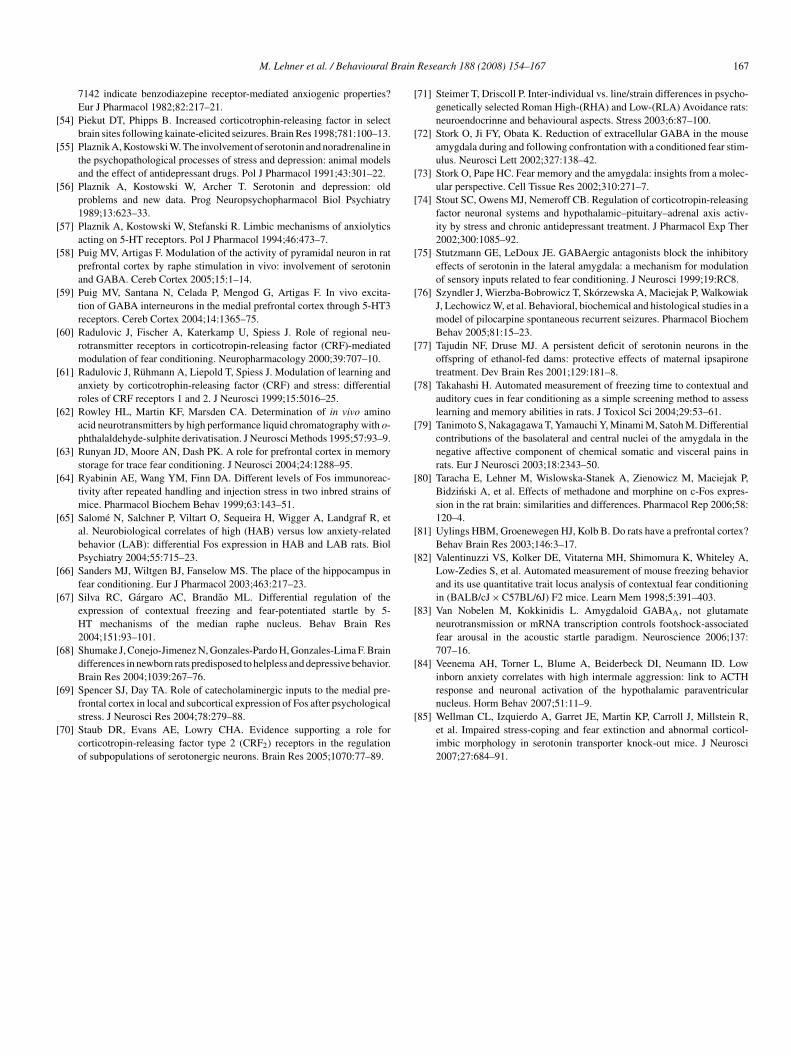
rain
[
[
[
[
[
[
[
[
[
[
[
[
[
[
[
[
[
[
[
[
[
[
[
[
[
[
[
[
[
[
[
M. Lehner et al. / Behavioural B
7142 indicate benzodiazepine receptor-mediated anxiogenic properties?Eur J Pharmacol 1982;82:217–21.
54] Piekut DT, Phipps B. Increased corticotrophin-releasing factor in selectbrain sites following kainate-elicited seizures. Brain Res 1998;781:100–13.
55] Plaznik A, Kostowski W. The involvement of serotonin and noradrenaline inthe psychopathological processes of stress and depression: animal modelsand the effect of antidepressant drugs. Pol J Pharmacol 1991;43:301–22.
56] Plaznik A, Kostowski W, Archer T. Serotonin and depression: oldproblems and new data. Prog Neuropsychopharmacol Biol Psychiatry1989;13:623–33.
57] Plaznik A, Kostowski W, Stefanski R. Limbic mechanisms of anxiolyticsacting on 5-HT receptors. Pol J Pharmacol 1994;46:473–7.
58] Puig MV, Artigas F. Modulation of the activity of pyramidal neuron in ratprefrontal cortex by raphe stimulation in vivo: involvement of serotoninand GABA. Cereb Cortex 2005;15:1–14.
59] Puig MV, Santana N, Celada P, Mengod G, Artigas F. In vivo excita-tion of GABA interneurons in the medial prefrontal cortex through 5-HT3receptors. Cereb Cortex 2004;14:1365–75.
60] Radulovic J, Fischer A, Katerkamp U, Spiess J. Role of regional neu-rotransmitter receptors in corticotropin-releasing factor (CRF)-mediatedmodulation of fear conditioning. Neuropharmacology 2000;39:707–10.
61] Radulovic J, Ruhmann A, Liepold T, Spiess J. Modulation of learning andanxiety by corticotrophin-releasing factor (CRF) and stress: differentialroles of CRF receptors 1 and 2. J Neurosci 1999;15:5016–25.
62] Rowley HL, Martin KF, Marsden CA. Determination of in vivo aminoacid neurotransmitters by high performance liquid chromatography with o-phthalaldehyde-sulphite derivatisation. J Neurosci Methods 1995;57:93–9.
63] Runyan JD, Moore AN, Dash PK. A role for prefrontal cortex in memorystorage for trace fear conditioning. J Neurosci 2004;24:1288–95.
64] Ryabinin AE, Wang YM, Finn DA. Different levels of Fos immunoreac-tivity after repeated handling and injection stress in two inbred strains ofmice. Pharmacol Biochem Behav 1999;63:143–51.
65] Salome N, Salchner P, Viltart O, Sequeira H, Wigger A, Landgraf R, etal. Neurobiological correlates of high (HAB) versus low anxiety-relatedbehavior (LAB): differential Fos expression in HAB and LAB rats. BiolPsychiatry 2004;55:715–23.
66] Sanders MJ, Wiltgen BJ, Fanselow MS. The place of the hippocampus infear conditioning. Eur J Pharmacol 2003;463:217–23.
67] Silva RC, Gargaro AC, Brandao ML. Differential regulation of theexpression of contextual freezing and fear-potentiated startle by 5-HT mechanisms of the median raphe nucleus. Behav Brain Res2004;151:93–101.
68] Shumake J, Conejo-Jimenez N, Gonzales-Pardo H, Gonzales-Lima F. Braindifferences in newborn rats predisposed to helpless and depressive behavior.Brain Res 2004;1039:267–76.
69] Spencer SJ, Day TA. Role of catecholaminergic inputs to the medial pre-
frontal cortex in local and subcortical expression of Fos after psychologicalstress. J Neurosci Res 2004;78:279–88.70] Staub DR, Evans AE, Lowry CHA. Evidence supporting a role forcorticotropin-releasing factor type 2 (CRF2) receptors in the regulationof subpopulations of serotonergic neurons. Brain Res 2005;1070:77–89.
[
Research 188 (2008) 154–167 167
71] Steimer T, Driscoll P. Inter-individual vs. line/strain differences in psycho-genetically selected Roman High-(RHA) and Low-(RLA) Avoidance rats:neuroendocrinne and behavioural aspects. Stress 2003;6:87–100.
72] Stork O, Ji FY, Obata K. Reduction of extracellular GABA in the mouseamygdala during and following confrontation with a conditioned fear stim-ulus. Neurosci Lett 2002;327:138–42.
73] Stork O, Pape HC. Fear memory and the amygdala: insights from a molec-ular perspective. Cell Tissue Res 2002;310:271–7.
74] Stout SC, Owens MJ, Nemeroff CB. Regulation of corticotropin-releasingfactor neuronal systems and hypothalamic–pituitary–adrenal axis activ-ity by stress and chronic antidepressant treatment. J Pharmacol Exp Ther2002;300:1085–92.
75] Stutzmann GE, LeDoux JE. GABAergic antagonists block the inhibitoryeffects of serotonin in the lateral amygdala: a mechanism for modulationof sensory inputs related to fear conditioning. J Neurosci 1999;19:RC8.
76] Szyndler J, Wierzba-Bobrowicz T, Skorzewska A, Maciejak P, WalkowiakJ, Lechowicz W, et al. Behavioral, biochemical and histological studies in amodel of pilocarpine spontaneous recurrent seizures. Pharmacol BiochemBehav 2005;81:15–23.
77] Tajudin NF, Druse MJ. A persistent deficit of serotonin neurons in theoffspring of ethanol-fed dams: protective effects of maternal ipsapironetreatment. Dev Brain Res 2001;129:181–8.
78] Takahashi H. Automated measurement of freezing time to contextual andauditory cues in fear conditioning as a simple screening method to assesslearning and memory abilities in rats. J Toxicol Sci 2004;29:53–61.
79] Tanimoto S, Nakagagawa T, Yamauchi Y, Minami M, Satoh M. Differentialcontributions of the basolateral and central nuclei of the amygdala in thenegative affective component of chemical somatic and visceral pains inrats. Eur J Neurosci 2003;18:2343–50.
80] Taracha E, Lehner M, Wislowska-Stanek A, Zienowicz M, Maciejak P,Bidzinski A, et al. Effects of methadone and morphine on c-Fos expres-sion in the rat brain: similarities and differences. Pharmacol Rep 2006;58:120–4.
81] Uylings HBM, Groenewegen HJ, Kolb B. Do rats have a prefrontal cortex?Behav Brain Res 2003;146:3–17.
82] Valentinuzzi VS, Kolker DE, Vitaterna MH, Shimomura K, Whiteley A,Low-Zedies S, et al. Automated measurement of mouse freezing behaviorand its use quantitative trait locus analysis of contextual fear conditioningin (BALB/cJ × C57BL/6J) F2 mice. Learn Mem 1998;5:391–403.
83] Van Nobelen M, Kokkinidis L. Amygdaloid GABAA, not glutamateneurotransmission or mRNA transcription controls footshock-associatedfear arousal in the acoustic startle paradigm. Neuroscience 2006;137:707–16.
84] Veenema AH, Torner L, Blume A, Beiderbeck DI, Neumann ID. Lowinborn anxiety correlates with high intermale aggression: link to ACTHresponse and neuronal activation of the hypothalamic paraventricular
nucleus. Horm Behav 2007;51:11–9.85] Wellman CL, Izquierdo A, Garret JE, Martin KP, Carroll J, Millstein R,et al. Impaired stress-coping and fear extinction and abnormal corticol-imbic morphology in serotonin transporter knock-out mice. J Neurosci2007;27:684–91.
Related Documents