Molecular Biology of the Cell Vol. 20, 4751– 4765, November 15, 2009 Expression and Activity of Phosphodiesterase Isoforms during Epithelial Mesenchymal Transition: The Role of Phosphodiesterase 4 Ewa Kolosionek,* Rajkumar Savai, † Hossein Ardeschir Ghofrani,* Norbert Weissmann,* Andreas Guenther,* Friedrich Grimminger,* † Werner Seeger,* ‡ Gamal Andre Banat, † Ralph Theo Schermuly,* ‡ and Soni Savai Pullamsetti* ‡ † Department of Hematology and Oncology, *University of Giessen Lung Centre, Giessen, Germany; and ‡ Max-Planck-Institute for Heart and Lung Research, Bad Nauheim, Germany Submitted January 7, 2009; Revised August 10, 2009; Accepted September 10, 2009 Monitoring Editor: Keith E. Mostov Epithelial–mesenchymal transition (EMT) has emerged as a critical event in the pathogenesis of organ fibrosis and cancer and is typically induced by the multifunctional cytokine transforming growth factor (TGF)-1. The present study was undertaken to evaluate the potential role of phosphodiesterases (PDEs) in TGF-1-induced EMT in the human alveolar epithelial type II cell line A549. Stimulation of A549 with TGF-1 induced EMT by morphological alterations and by expression changes of the epithelial phenotype markers E-cadherin, cytokeratin-18, zona occludens-1, and the mesenchy- mal phenotype markers, collagen I, fibronectin, and -smooth muscle actin. Interestingly, TGF-1 stimulation caused twofold increase in total cAMP-PDE activity, contributed mostly by PDE4. Furthermore, mRNA and protein expression demonstrated up-regulation of PDE4A and PDE4D isoforms in TGF-1-stimulated cells. Most importantly, treatment of TGF-1 stimulated epithelial cells with the PDE4-selective inhibitor rolipram or PDE4 small interfering RNA potently inhibited EMT changes in a Smad-independent manner by decreasing reactive oxygen species, p38, and extracellular signal-regulated kinase phosphorylation. In contrast, the ectopic overexpression of PDE4A and/or PDE4D resulted in a significant loss of epithelial marker E-cadherin but did not result in changes of mesenchymal markers. In addition, Rho kinase signaling activated by TGF-1 during EMT demonstrated to be a positive regulator of PDE4. Collectively, the findings presented herein suggest that TGF-1 mediated up-regulation of PDE4 promotes EMT in alveolar epithelial cells. Thus, targeting PDE4 isoforms may be a novel approach to attenuate EMT-associated lung diseases such as pulmonary fibrosis and lung cancer. INTRODUCTION Epithelial–mesenchymal transition (EMT), in which fully differentiated epithelial cells undergo transition to a mesen- chymal phenotype giving rise to fibroblasts and myofibro- blasts, is increasingly recognized as important not only in development but also in wound healing, fibrosis, and the invasion and metastasis of tumor cells (Greenburg and Hay, 1982; Thiery, 2002; Nawshad et al., 2005). The phenotypic conversion involves loss of epithelial polarity, loss of epi- thelial markers, cytoskeletal reorganization, and transition to a spindle-shaped morphology concomitant with acquisi- tion of mesenchymal markers and an invasive phenotype (Kalluri and Neilson, 2003; Zavadil and Bottinger, 2005). EMT, depending on the precise physiological context, can be induced either by environmental stresses/factors such as hypoxia (Higgins et al., 2007) and reactive oxygen species (ROS) (Rhyu et al., 2005) or by extracellular mediators, in- cluding TGF-1, fibroblast growth factor-2, epidermal growth factor, connective tissue growth factor, insulin- like growth factor-2, interleukin-1, hepatocyte growth factor, and Wnt ligands (Moustakas and Heldin, 2007; Willis and Borok, 2007). Among these, TGF-1, a multifunctional cyto- kine, has been shown to mediate EMT in vitro in several different cell lines, including alveolar epithelial cells (Miettinen et al., 1994; Kasai et al., 2005; Willis et al., 2005). Recently, in vivo evidence for TGF-1–mediated EMT has been reported, confirming the master regulation role of TGF-1 (Kim et al., 2006; Rees et al., 2006). Moreover, ROS have been shown to mediate TGF-1–induced cellular responses in various cells, including EMT (Jiang et al., 2003; Brown et al., 2007), and it has been demonstrated that antioxidants effectively inhib- ited TGF-1–induced EMT primarily through activation of mitogen-activated protein kinase (MAPK) and subsequently through extracellular signal-regulated kinase-directed acti- vation of Smad in proximal tubular epithelial cells (Rhyu et al., 2005). Cyclic nucleotide phosphodiesterases (PDEs) comprise a family of related proteins, which can be subdivided into 11 families (PDE1-PDE11) based on their amino acid sequences; sensitivity to different activators and inhibitors; and their This article was published online ahead of print in MBC in Press (http://www.molbiolcell.org/cgi/doi/10.1091/mbc.E09 – 01– 0019) on September 16, 2009. Address correspondence to: Ralph Theo Schermuly (ralph.schermuly@ mpi-bn.mpg.de). Abbreviations used: Epithelial-to-Mesenchymal Transition (EMT); Transforming Growth Factor-1 (TGF-1); Phosphodiesterases (PDE); Reactive Oxygen Species (ROS). © 2009 by The American Society for Cell Biology 4751

Welcome message from author
This document is posted to help you gain knowledge. Please leave a comment to let me know what you think about it! Share it to your friends and learn new things together.
Transcript

Molecular Biology of the CellVol. 20, 4751–4765, November 15, 2009
Expression and Activity of Phosphodiesterase Isoformsduring Epithelial Mesenchymal Transition: The Role ofPhosphodiesterase 4Ewa Kolosionek,* Rajkumar Savai,† Hossein Ardeschir Ghofrani,*Norbert Weissmann,* Andreas Guenther,* Friedrich Grimminger,*†
Werner Seeger,*‡ Gamal Andre Banat,† Ralph Theo Schermuly,*‡
and Soni Savai Pullamsetti*‡
†Department of Hematology and Oncology, *University of Giessen Lung Centre, Giessen, Germany;and ‡Max-Planck-Institute for Heart and Lung Research, Bad Nauheim, Germany
Submitted January 7, 2009; Revised August 10, 2009; Accepted September 10, 2009Monitoring Editor: Keith E. Mostov
Epithelial–mesenchymal transition (EMT) has emerged as a critical event in the pathogenesis of organ fibrosis and cancerand is typically induced by the multifunctional cytokine transforming growth factor (TGF)-�1. The present study wasundertaken to evaluate the potential role of phosphodiesterases (PDEs) in TGF-�1-induced EMT in the human alveolarepithelial type II cell line A549. Stimulation of A549 with TGF-�1 induced EMT by morphological alterations and byexpression changes of the epithelial phenotype markers E-cadherin, cytokeratin-18, zona occludens-1, and the mesenchy-mal phenotype markers, collagen I, fibronectin, and �-smooth muscle actin. Interestingly, TGF-�1 stimulation causedtwofold increase in total cAMP-PDE activity, contributed mostly by PDE4. Furthermore, mRNA and protein expressiondemonstrated up-regulation of PDE4A and PDE4D isoforms in TGF-�1-stimulated cells. Most importantly, treatment ofTGF-�1 stimulated epithelial cells with the PDE4-selective inhibitor rolipram or PDE4 small interfering RNA potentlyinhibited EMT changes in a Smad-independent manner by decreasing reactive oxygen species, p38, and extracellularsignal-regulated kinase phosphorylation. In contrast, the ectopic overexpression of PDE4A and/or PDE4D resulted in asignificant loss of epithelial marker E-cadherin but did not result in changes of mesenchymal markers. In addition, Rhokinase signaling activated by TGF-�1 during EMT demonstrated to be a positive regulator of PDE4. Collectively, thefindings presented herein suggest that TGF-�1 mediated up-regulation of PDE4 promotes EMT in alveolar epithelial cells.Thus, targeting PDE4 isoforms may be a novel approach to attenuate EMT-associated lung diseases such as pulmonaryfibrosis and lung cancer.
INTRODUCTION
Epithelial–mesenchymal transition (EMT), in which fullydifferentiated epithelial cells undergo transition to a mesen-chymal phenotype giving rise to fibroblasts and myofibro-blasts, is increasingly recognized as important not only indevelopment but also in wound healing, fibrosis, and theinvasion and metastasis of tumor cells (Greenburg and Hay,1982; Thiery, 2002; Nawshad et al., 2005). The phenotypicconversion involves loss of epithelial polarity, loss of epi-thelial markers, cytoskeletal reorganization, and transitionto a spindle-shaped morphology concomitant with acquisi-tion of mesenchymal markers and an invasive phenotype(Kalluri and Neilson, 2003; Zavadil and Bottinger, 2005).
EMT, depending on the precise physiological context, canbe induced either by environmental stresses/factors such as
hypoxia (Higgins et al., 2007) and reactive oxygen species(ROS) (Rhyu et al., 2005) or by extracellular mediators, in-cluding TGF-�1, fibroblast growth factor-2, epidermalgrowth factor, connective tissue growth factor, insulin- likegrowth factor-2, interleukin-1, hepatocyte growth factor,and Wnt ligands (Moustakas and Heldin, 2007; Willis andBorok, 2007). Among these, TGF-�1, a multifunctional cyto-kine, has been shown to mediate EMT in vitro in severaldifferent cell lines, including alveolar epithelial cells (Miettinenet al., 1994; Kasai et al., 2005; Willis et al., 2005). Recently, invivo evidence for TGF-�1–mediated EMT has been reported,confirming the master regulation role of TGF-�1 (Kim et al.,2006; Rees et al., 2006). Moreover, ROS have been shown tomediate TGF-�1–induced cellular responses in various cells,including EMT (Jiang et al., 2003; Brown et al., 2007), and ithas been demonstrated that antioxidants effectively inhib-ited TGF-�1–induced EMT primarily through activation ofmitogen-activated protein kinase (MAPK) and subsequentlythrough extracellular signal-regulated kinase-directed acti-vation of Smad in proximal tubular epithelial cells (Rhyu etal., 2005).
Cyclic nucleotide phosphodiesterases (PDEs) comprise afamily of related proteins, which can be subdivided into 11families (PDE1-PDE11) based on their amino acid sequences;sensitivity to different activators and inhibitors; and their
This article was published online ahead of print in MBC in Press(http://www.molbiolcell.org/cgi/doi/10.1091/mbc.E09–01–0019)on September 16, 2009.
Address correspondence to: Ralph Theo Schermuly ([email protected]).
Abbreviations used: Epithelial-to-Mesenchymal Transition (EMT);Transforming Growth Factor-�1 (TGF-�1); Phosphodiesterases(PDE); Reactive Oxygen Species (ROS).
© 2009 by The American Society for Cell Biology 4751

ability to preferentially hydrolyze either cAMP, cGMP, orboth. cAMP and cGMP are ubiquitous second messengers;consequently, PDEs propagate many signaling pathways,including proliferation, migration, and differentiation (Contiand Beavo, 2007).
Similarly, we postulated that PDE induction could play arole in regulating EMT. This hypothesis is based on earlierresults that showed changes in cyclic nucleotides and PDEscan affect various differentiation processes. For example,remodeling of PDE isoforms was shown to influence mono-cyte-to-macrophage differentiation, myogenic differentia-tion, and fibroblast-to-myofibroblast conversion (Naro et al.,1999; Bender et al., 2005; Dunkern et al., 2007). Likewise,EMT in cultured Madin-Darby canine kidney cells werepotentially inhibited by treatments that increase eithercAMP or cGMP, such as PGD2 and PGE2 (Zhang et al., 2006)and nitric oxide in alveolar epithelial cells (Vyas-Read et al.,2007). Furthermore, epithelial and mesenchymal phenotypemarker genes that are altered during EMT by TGF-�1 can beinfluenced by increased cAMP or cGMP levels (Santibanez etal., 2003; Liu et al., 2006). Finally, the attenuation of PDE hasbeen shown to influence pathological processes by means ofspecific inhibitors that have demonstrated preclinical andclinical efficacy in the treatment of different lung diseases(Ghofrani et al., 2002; Huang and Mancini, 2006; Schermulyet al., 2007). In addition, the PDE4 inhibitor rolipram wasshown to inhibit TGF-�1–stimulated ROS generation in mes-angial cells for the induction of monocyte chemoattractantprotein-1 expression (Cheng et al., 2005). However, untilnow the direct involvement of PDE family members andtherapeutic value of PDE-specific inhibitors in the process ofEMT has not been reported.
To address this question, we 1) ascertained the expressionpattern of PDE isoforms upon TGF-�1–induced EMT ofA549 cells via real-time reverse transcription-polymerasechain reaction (RT-PCR), PDE activity assays, and immuno-detection experiments; 2) investigated whether altered PDEexpression has a functional effect on cAMP accumulationand differentiation of A549 cells by using PDE isoform-specific inhibitors, PDE-specific small interfering RNAs(siRNAs), and PDE overexpression; and 3) elucidated thesignaling pathways in the PDE-mediated regulation of EMT.
MATERIALS AND METHODS
MaterialsThe A549 cell line was obtained from American Type Culture Collection(Manassas, VA). DMEM/F-12, Opti-MEM, fetal bovine serum (FBS), strepto-mycin/penicillin, vitamins, and nonessentials amino acids were obtainedfrom Invitrogen (Karlsruhe, Germany). TGF-�1 was obtained from R&DSystems (Minneapolis, MN). Rolipram and desmin antibody were obtainedfrom Sigma-Aldrich (Munich, Germany). 3-Isobutyl-1-methylxanthine(IBMX) and cycloheximide were obtained from Calbiochem (Darmstadt, Ger-many). Lipofectamine, dihydroethidium (DHE), and Alexa 488-conjugatedantibody were obtained from Invitrogen. Rho kinase (ROCK) inhibitorY-27632 was obtained from Merck (Darmstadt, Germany). Im Prom reversetranscriptase and Taq polymerase PCR kit were obtained from Promega(Mannheim, Germany). Radioimmunoprecipitation assay (RIPA) buffer,Smad4, ERK1/2, phosphorylated (p)-ERK1/2, and TGF-� receptor II antibod-ies were obtained from Santa Cruz Biotechnology (Heidelberg, Germany).Glyceraldehyde-3-phosphate dehydrogenase (GAPDH) antibody was ob-tained from Novus (Littleton, CO). E-Cadherin antibody was obtained fromUpstate Biotechnology (Schwalbachs, Germany). Cytokeratin antibody wasobtained from Dako Deutschland (Hamburg, Germany). RhoA, PDE4A, andPDE4D antibodies were obtained from Abcam (Cambridge, United King-dom). Smad2/3, p-Smad2, p-Smad3, p38, p-p38, and ROCK antibodies wasobtained from Cell Signaling (Beverly, MA). siRNA for PDE4A was obtainedfrom Eurogentec (Seraing, Belgium). siRNA for PDE4D and RhoA wereobtained from Ambion (Darmstadt, Germany). Enhanced chemiluminescence(ECL) detection kit was obtained from GE Healthcare (Piscataway, NJ).
Cell Line and Culture ConditionsA549 cells were grown on 10-cm2 dishes in DMEM/F-12 supplemented with10% fetal calf serum (FCS), 5% streptomycin/penicillin, 5% vitamins, and 5%nonessentials amino acids. Cells were cultured from the time of plating inmedium alone, and medium 0.1% FCS supplemented with TGF-�1 (2 ng/ml)for 24 h. For experiments with Rolipram, cells were pretreated with differentconcentrations of rolipram (100 nM or 1 �M) for 12 h followed by TGF-�1 (2ng/ml) stimulation for 24 h. For experiments with Y-27632, cells were pre-treated with Y-27632 (10 �M) for 12 h followed by TGF-�1 (2 ng/ml) stimu-lation for 24 h. For experiments with cycloheximide (CHX), cells were pre-treated with CHX (5 �M) for 3 h followed by TGF-�1 (2 ng/ml) stimulationfor 24 h. The dosages of TGF-�1, rolipram, Y-27632, and CHX were chosen onthe basis of previous studies.
RNA Isolation and Real-Time RT-PCRTotal RNA was extracted from the cells with TRIzol Reagent (Invitrogen)following the manufacturer’s protocols. The yield of extracted RNA wasdetermined with Nano Drop (PeqLab, Erlangen, Germany). Two microgramsof total RNA was reverse-transcribed (RT) into cDNA using a Promega kitwith oligo(dT)18 primers according to the supplier’s instructions. Real-timePCR (Stratagene QPCR using Invitrogen Mastermix SYBR kit) was performedusing 1 �g of cDNA and 0.05 M forward/reverse primers; two primer setswere designed for each PDE isoform as described previously (Murray et al.,2007) as well as for epithelial and mesenchymal phenotype markers andRhoA (Table 1). Cycle conditions were 95°C for 10 min (1 cycle), 95°C for 30 s,58°C for 30 s, and 72°C for 30 s (40 cycles). By using the MxPro QPCR software(Stratagene, Waldbronn, Germany), a dissociation curve was generated for eachgene to ensure a single-product amplification, and the threshold cycle (Ct values)for each gene was determined. The comparative 2���Ct method was used toanalysis mRNA -fold changes between control and treatment (TGF-�1 alone ordifferent treatments followed by TGF-�1 stimulation), which calculated as ratio �2�(�Ct control � �Ct treatment), where Ct is the cycle threshold and �Ct (Cttarget � Ct reference) is the Ct value normalized to reference gene Porphobi-linogen deaminase (PBGD) obtained for the same cDNA samples.
PDE Activity AssayPDE activity assay was performed with a modification of the two-stepmethod by Thompson and Appleman (1971). Cells were lysed in RIPA buffercontaining dimethyl sulfoxide (DMSO), protease inhibitor cocktail, and phe-nylmethylsulfonyl fluoride (PMSF). Cells were subjected to a low-speed cen-trifugation (13,000 � g for 10 min), and aliquots of the resulting supernatantwere assayed for PDE activity by using cAMP (1 �M) spiked with [3H]cAMPas a substrate. All assays were carried out at 37°C for 15 min and then terminatedby boiling for 3 min. Crotalus atrox venom was added to prevent resynthesis ofcAMP, and the products of cAMP were separated from unhydrolyzed substrateon chromatography columns filled with Sephadex-Q25 beads (GE Healthcare).Total PDE activity in cell lysates was determined and is expressed as picomolesof cAMP hydrolyzed per minute per milligram of lysate protein. PDE activitieswere determined using IBMX for nonspecific PDE inhibition except for PDE9 (5mM) and with specific inhibitor rolipram for PDE4 (1 �M).
ImmunoblottingCells were lysed in RIPA buffer containing DMSO, protease inhibitors, andPMSF. To detect proteins, lysates were subjected to SDS-polyacrylamide gelelectrophoresis, electrophoretically transferred to nitrocellulose membrane,blocked for 1 h in 5% nonfat milk, and probed with the appropriate primaryantibody overnight at 4°C at the following dilutions: GAPDH (1:5000),E-cadherin (1:1000), cytokeratin-18 (1:1000), desmin (1:500), fibronectin (1:1000), PDE4A (1:1000), PDE4D (1:1000), Smad4 (1:500), Smad2/3 (1:500),p-Smad2 (1:500), p-Smad3 (1:500), TGF-� receptor II (1:1000), ROCK1 (1:1000),RhoA (1:1000), ERK (1:1000), p-ERK (1:1000), p38 (1:1000), and p-p38 (1:1000).Subsequently, the membranes were washed with wash buffer and incubatedwith the respective horseradish peroxidase-conjugated polyclonal secondaryantibodies for 1 h at room temperature (RT). Antibody complexes werevisualized by enhanced chemiluminescence using an ECL kit.
ImmunofluorescenceStimulated and nonstimulated A549 cells were grown on chamber slides.Slides were fixed with cold acetone-methanol (1:1) for 10 min at RT. Afterrinsing in phosphate-buffered saline (PBS) and blocking in 5% bovine serumalbumin for 1 h in RT, cells were incubated overnight at 4°C with PBScontaining PDE4A (1:100), PDE4D (1:100), E-cadherin (1:200), cytokeratin-18(1:200), �-smooth muscle actin (�-SMA; 1:100), and fibronectin (1:100). Indi-rect immunofluorescence was conducted by incubation with Alexa 488-con-jugated goat anti-rabbit immunoglobulin (Ig)G antibodies or Alexa 488-con-jugated goat anti-mouse IgG antibodies. At the end of the procedure,fluorescence images were captured using the same exposure times and con-ditions with the fluorescence microscope (Leica Microsystems, Wetzlar, Ger-many). Fluorescein isothiocyanate (FITC) (filter I3, no. 513808) fluorescenceimages were captured for 690 ms, and 4,6-diamidino-2-phenylindole (DAPI)images for (filter A, no. 513804) 1.45 ms with a digital camera (DC 300 FX; Leica
E. Kolosionek et al.
Molecular Biology of the Cell4752

Microsystems) attached to the microscope. Using Qwin V3 software (Leica Mi-crosystems), FITC and DAPI images were merged and fluorescent intensitylevels were quantified as described previously (Savai et al., 2005, 2007).
ROS DetectionSuperoxide release from A549 was measured using the superoxide-sensitivedye DHE. In brief, the cells were grown on chamber slides and cultured inmedium alone, 0.1% FBS medium supplemented with TGF-�1 (2 ng/ml),TGF-�1 (2 ng/ml) and rolipram (1 �M), TGF-�1 (2 ng/ml) and PDE4A,and/or PDE4D-specific siRNA (100 nM), TGF-�1 (2 ng/ml) and Smad3inhibitor SIS3 (10 and 30 �M) or H2O2 (10 mM) for 24 h. H2O2 treatmentserved as the positive control. Subsequently, the cells were incubated withDHE (5 �M) for 30 min. The cells were washed with PBS, fixed in acetone andmethanol (1:1) for 10 min, and stained with the nuclear stain DAPI. Cells werevisualized under fluorescent microscopy (excitation, 514 nm; emission, 560nm). In total, 10 images were captured from each group and in each image thetotal fluorescence-integrated density was analyzed from all groups, respec-tively, in a blinded manner using ImageJ software (National Institutes ofHealth, Bethesda, MD).
RNA InterferencesiRNA oligonucleotides specific for PDE4 and RhoA (si1-PDE4A 5�-CCUGCAU-CAUGUACAUGAUtt-3�, si2-PDE4A 5�-GAGUACAUUUCCACAACAUtt-3�,si3-PDE4A 5�-CAGCGACUAUGACAUGUCAtt-3�, sense PDE4D-5�-GAGUCG-GUCUGGAAAUCACtt-3�; antisense PDE4D-5�-UUGAUUUCCAGACCGACU-Cat-3�), RhoA (sense RhoA-5�-CACAGUUGUUUGAGAACUAUtt-3�, antisenseRhoA-5�-AUAGUUCUCAAACACUGUGgg-3�), and scramble siRNA (si-con-trol) (dTdT 3� overhang). Transient transfection of siRNA was performed withLipofectamine according to the manufacturer’s protocols. A549 cells were sub-cultured to 70% confluence in DMEM/F-12 medium supplemented with 10%FBS. Transfection of 100 nM siRNA was performed in Opti-MEM for 6 h,followed by culturing in DMEM/F-12 supplemented with 10% FBS up to 24 h(RNA isolation) or 48 h (protein isolation).
PDE4 OverexpressionAll cloning was performed using the Gateway cloning system (Invitrogen, Carls-bad, CA). Human PDE4A and PDE4D were subcloned into the pDEST26 expres-sion vector. Transient transfection of PDE4A and PDE4D vector constructs wasperformed with Lipofectamine (Invitrogen) according to the manufacturer’s pro-tocols. A549 cells were subcultured to 70% confluence in DMEM/F-12 supple-mented with 10% FBS. Transfection of 2 �g of constructs was performed inOpti-MEM for 6 h, followed by culturing in DMEM/F-12 supplemented with10% FBS up to 24 h (RNA isolation) or 48 h (protein isolation).
Statistical AnalysisData are expressed as the mean � SEM. Statistical comparisons between twopopulations were performed using paired and unpaired Student’s t testswhere appropriate or by one-way analysis of variance in combination with aStudent–Newman–Keuls post hoc test, which was used to compare differ-ences between multiple groups, with a probability value of p � 0.05 consid-ered to be significant.
RESULTS
Effects of TGF-�1 on Cell Morphology and the Expressionof Phenotype Markers in A549 CellsAs shown in Figure 1A, A549 cells in the absence of TGF-�1exhibited a cubic, epithelioid shape and cluster formation,the typical features of epithelial cells. On TGF-�1 stimula-tion for 24 h, phase contrast microscopy revealed that thecells underwent a morphological change, from cobblestone-like cell morphology to an elongated and spindle-like mor-phology, and reduced their cell–cell contact.
Furthermore, the mRNA expression of epithelial pheno-type markers E-cadherin, cytokeratin-18, and zona occlu-dens-1 was significantly altered in TGF-�1–stimulated cellscompared with control cells. TGF-�1 stimulation signifi-cantly decreased E-cadherin expression in a concentration-dependent manner. Concentrations as low as 1 ng/mlTGF-�1 induced significant down-regulation of E-cadherin,cytokeratin-18, and zona occludens-1 expression (Figure 1B).Furthermore, immunoblotting confirmed decreased proteinexpression of both E-cadherin and cytokeratin-18 in TGF-�1–stimulated cells (Figure 1, C and D).
In parallel with the marked decrease in the epithelial phe-notype markers, TGF-�1 significantly induced mRNA expres-sion of the mesenchymal markers collagen I, fibronectin, and�-SMA in a concentration-dependent manner (Figure 1E).However, the extent of �-SMA expression at low concentra-tions of TGF-�1 was not as profound as fibronectin and colla-
Table 1. Forward and reverse primer sequences for epithelial and mesenchymal markers and for each PDE isoform investigated usingreal-time PCR
Gene NM no. Forward primer Reverse primer
E-Cadherin NM_004360 TGCCCAGAAAATGAAAAAGG GTGTATGTGGCAATGCGTTCCytokeratin-18 NM_002276 CAAAGCCTGAGTCCTGTCCT GAGATCCGGGAACCAGAGZona Occludens-1 NM_003257 CTTTAGGCTCCTGGATTTGG AGGAACACTGCTTGTTGCACCollagen I NM_000088 TGTTCAGCTTTGTGGACCTC GCAAGGCGCGATATAGAGTAFibronectin NM_002026 AGCCTCGAAGAGCAAGAGG CAAAACTTCAGCCCCAACTT� SMA NM_001613 GAGAAGAGTTACGAGTTGCCTGA TGTTAGCATAGAGGTCCTTCCTGPDE1A NM_001003683 AGGTCACTTCCAGCAAATTA CCACATAGGAAGAAGTTTCGPDE1B NM_000924 GCTTTGATGTCTTTTCCTTG ATTCTGACTTGGTCTGGATGPDE1C NM_005020 AGATATTAGCCATCCAGCAA CAACGGAGATGACAGAATPDE2A NM_002599 CCTTCAACAAGCTAGAAGGA CGGATCTCATAGCTCTCATCPDE3A NM_000921 CAACACTGTGTGTGTGTGTG CAAGTGGTGCATAGCAGTAAPDE3B NM_000922 GATGAAGAAGCAAATCTTGG TTCTCCACCTGCAGTTTATTPDE4A NM_006202 GCTGAAGACCTCATCGTAAC ATTCTGTTTGTCCAGGAATGPDE4B NM_002600 ATTCTGTTTGTCCAGGAATG ATGCTGGTGTAGAAAGGAGAPDE4C NM_000923 AGAGTGGTACCAGAGCAAGA TGGGAGCCACCTATAACTAAPDE4D NM_006203 CACCAAATGACCTTACCTGT AGCTCCACTGTTACCTTTCAPDE5A NM_001083 GAAAAGGACTTTGCTGCTTA TGATTTTGTTTGCATCATGTPDE7A NM_002603 GCAATATGAATTTGGCTTTC GGAAAGAGCTGCAGTCTAAAPDE7B NM_018945 TCTTCAATACCCATGGACTC ATCCTGTGTCATTTCCTTTGPDE8A NM_002605 ACCAATGTAATGGATTCTGC TGAGTTACAAGCCCTGAGTTPDE8B NM_003719 AGAACAGGAGGAAAGAGTCC CGTTTCCTGACAGTCTTCTCPDE9A NM_002606 TGTCCACGACAACTACAGAA GTGGCCAAGATTAATGTGATPDE10A NM_006661 AGCAGGTACCAAGATACGAA TGATTCCAGTCCAGTACCTCPDE11A NM_016953 ATGCAGATCAACGACTTTTT CCGATAGTTTTTCCTCACTG
Role of PDEs in EMT
Vol. 20, November 15, 2009 4753

gen I. Similarly, immunoblotting demonstrated increased im-munoreactivity of fibronectin and desmin in TGF-�1–treatedcells compared with control cells (Figure 1, F and G).
PDE Expression and Activity during TGF-�1–induced EMTReal-time RT-PCR demonstrated an increase in mRNA ex-pression of three PDE isoforms in TGF-�1–stimulated cells
compared with control: PDE4A, PDE4D, and PDE8A, withPDE4D showing the most prominent increase in mRNA. Incontrast, PDE1A, PDE3A, and PDE7B expressions were de-creased by TGF-�1 stimulation (Figure 2, A and B). More-over, time course of PDE4 induction revealed that PDE4Aas well as PDE4D level was increased by TGF-�1 as earlyas 6 h after stimulation (Figure 2C), whereas immunoblot-
Figure 1. Effect of TGF-�1 stimulation on cell morphology and epithelial phenotype marker expression. (A) A549 cells were stimulated withTGF-�1 (2 ng/ml) for 24 h. Cell morphology was examined using phase contrast microscopy. (B) mRNA expression as analyzed by real-timeRT-PCR of the epithelial phenotype markers E-cadherin, zona occludens-1, and cytokeratin-18 in TGF-�1 (1 and 2 ng/ml)-stimulated (24 h)and control cells. (C) Protein expression as analyzed by immunoblotting. (D) Subsequent densitometric quantification of epithelial phenotypemarkers (E-cadherin and cytokeratin-18) in TGF-�1 (1 and 2 ng/ml)-stimulated (24 h) and control cells are indicated. (E) mRNA expression asanalyzed by real-time RT-PCR of mesenchymal phenotype markers, collagen I, fibronectin, and �-SMA in TGF-�1 (1 and 2 ng/ml)-stimulated (24h) and control cells. (F) Protein expression as analyzed by immunoblotting. (G) Subsequent densitometric quantification of mesenchymal phenotypemarkers (fibronectin and desmin) in TGF-�1 (1 and 2 ng/ml)-stimulated (24 h) and control cells. All values are given as the mean � SEM (n � 4)and are normalized to PBGD (B and E) or GAPDH (D and G). *p � 0.05, **p � 0.01, and ***p � 0.001 versus control.
E. Kolosionek et al.
Molecular Biology of the Cell4754

ting demonstrated up-regulation of both PDE4A isoforms(PDE4A1 74 kDa and PDE4Ax 100 kDa) and PDE4D iso-forms (PDE4D3 95 kDa, PDE4D4 105 kDa, and PDE4D5119 kDa) after 24-h stimulation (Figure 2, E and F). Fur-thermore, immunofluorescence displayed PDE4A- andPDE4D-like immunoreactivity in the cytoplasm. PDE4Awas variably found to be diffusely present in the mem-brane of the A549 cells (Figure 2D).
Interestingly, total cAMP-PDE activity was increased two-fold in TGF-�1–stimulated cells compared with control (Fig-ure 2G). Using cAMP-PDE inhibitors (30 �M 8-MM-IBMXand PDE4, 1 �M rolipram), we calculated the relative con-
tribution to the total cAMP PDE activity and found PDE4 tobe the major contributor to cAMP-PDE activity. Further-more, to determine whether TGF-�1 regulates posttransla-tionally PDE4 enzymatic activity, TGF-�1–stimulated A549cells at different time points were treated with CHX fol-lowed by assessment of cAMP-PDE activity. As indicated inFigure 2G, after protein synthesis inhibition by CHX treat-ment, the endogenous cAMP-PDE activity as well as PDE4activity levels in both TGF-�1–stimulated and nonstimu-lated cells remained unaltered, indicating that TGF-�1 hasno influence on posttranslationally PDE4 enzymatic activity(Figure 2G).
Figure 2. Expression, localization and activityof multiple PDE isoforms during TGF-�1–in-duced EMT. (A and B) mRNA expression ofmultiple PDE isoforms were analyzed by real-time RT-PCR in TGF-�1 (1 and 2 ng/ml)-stim-ulated (24 h) and control cells. (C) mRNA ex-pression of PDE4 isoforms (PDE4A andPDE4D) were analyzed by real-time RT-PCR inTGF-�1–stimulated (6, 12, and 24 h) and con-trol cells. (D) Localization of PDE4 isoforms(PDE4A and PDE4D) in TGF-�1 (2 ng/ml)–stimulated (24 h) and control cells, as analyzedby immunofluorescence. (E) Protein expressionas analyzed by immunoblotting. (F) Subse-quent densitometric quantification of PDE4 iso-forms (PDE4A and PDE4D) in TGF-�1 (1 and 2ng/ml)–stimulated (6, 12, and 24 h) and controlcells. (G) cAMP-PDE activity of A549 cellstreated with TGF-�1 (2 ng/ml) (6, 12, and 24 h)and after using CHX as analyzed by PDE ac-tivity assay using cAMP-PDE inhibitors [30 �M8-MM-IBMX, and PDE4, 1 �M rolipram]. Therelative contribution of each isoform to the to-tal cAMP PDE activity was calculated. All val-ues are given as the mean � SEM (n � 4) andare normalized to PBGD (A–C) or GAPDH (F).*p � 0.05, **p � 0.01, and ***p � 0.001 versuscontrol.
Role of PDEs in EMT
Vol. 20, November 15, 2009 4755
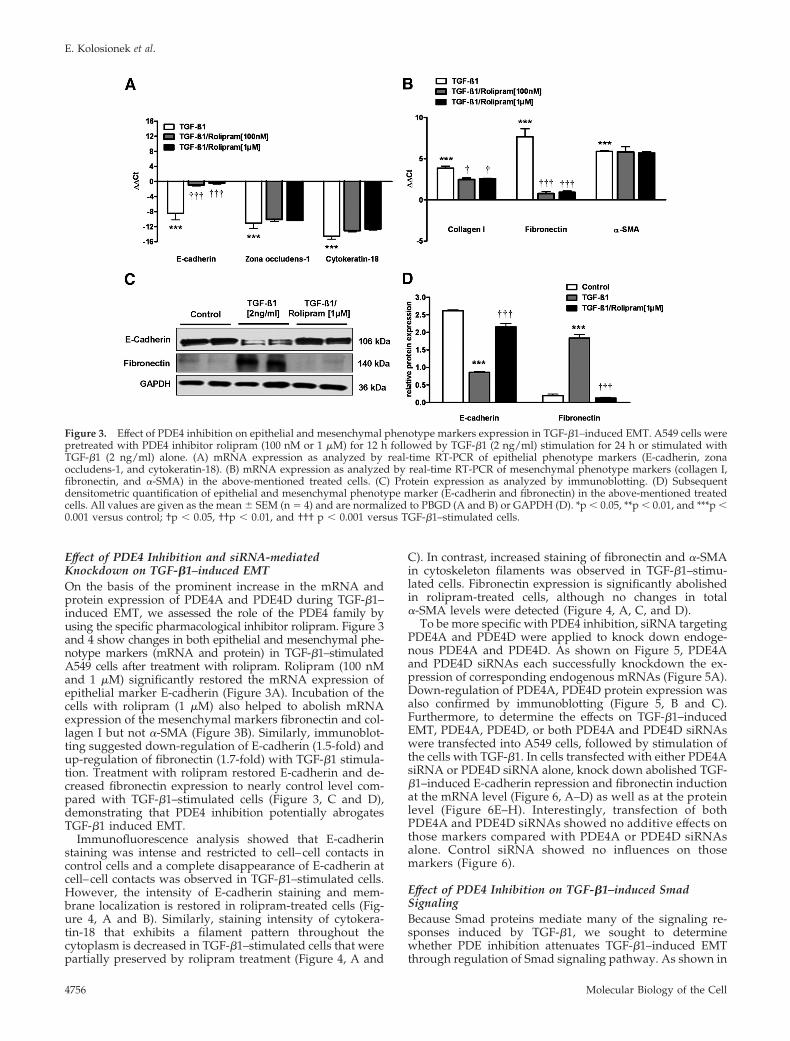
Effect of PDE4 Inhibition and siRNA-mediatedKnockdown on TGF-�1–induced EMTOn the basis of the prominent increase in the mRNA andprotein expression of PDE4A and PDE4D during TGF-�1–induced EMT, we assessed the role of the PDE4 family byusing the specific pharmacological inhibitor rolipram. Figure 3and 4 show changes in both epithelial and mesenchymal phe-notype markers (mRNA and protein) in TGF-�1–stimulatedA549 cells after treatment with rolipram. Rolipram (100 nMand 1 �M) significantly restored the mRNA expression ofepithelial marker E-cadherin (Figure 3A). Incubation of thecells with rolipram (1 �M) also helped to abolish mRNAexpression of the mesenchymal markers fibronectin and col-lagen I but not �-SMA (Figure 3B). Similarly, immunoblot-ting suggested down-regulation of E-cadherin (1.5-fold) andup-regulation of fibronectin (1.7-fold) with TGF-�1 stimula-tion. Treatment with rolipram restored E-cadherin and de-creased fibronectin expression to nearly control level com-pared with TGF-�1–stimulated cells (Figure 3, C and D),demonstrating that PDE4 inhibition potentially abrogatesTGF-�1 induced EMT.
Immunofluorescence analysis showed that E-cadherinstaining was intense and restricted to cell–cell contacts incontrol cells and a complete disappearance of E-cadherin atcell–cell contacts was observed in TGF-�1–stimulated cells.However, the intensity of E-cadherin staining and mem-brane localization is restored in rolipram-treated cells (Fig-ure 4, A and B). Similarly, staining intensity of cytokera-tin-18 that exhibits a filament pattern throughout thecytoplasm is decreased in TGF-�1–stimulated cells that werepartially preserved by rolipram treatment (Figure 4, A and
C). In contrast, increased staining of fibronectin and �-SMAin cytoskeleton filaments was observed in TGF-�1–stimu-lated cells. Fibronectin expression is significantly abolishedin rolipram-treated cells, although no changes in total�-SMA levels were detected (Figure 4, A, C, and D).
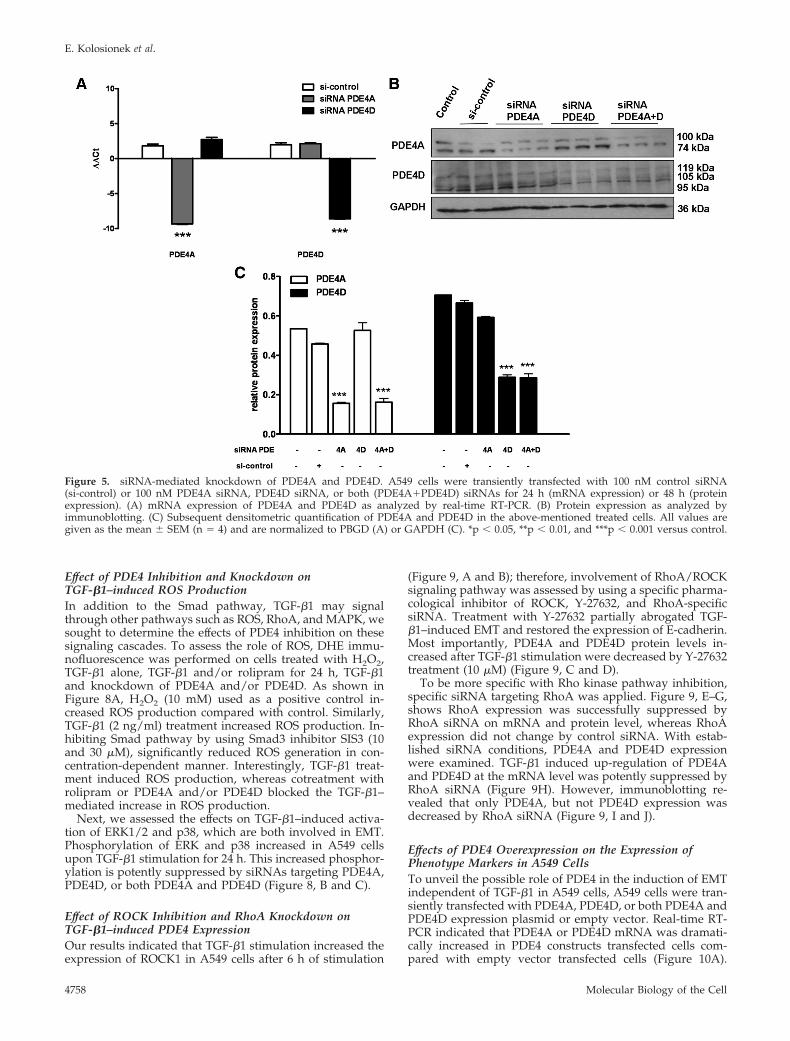
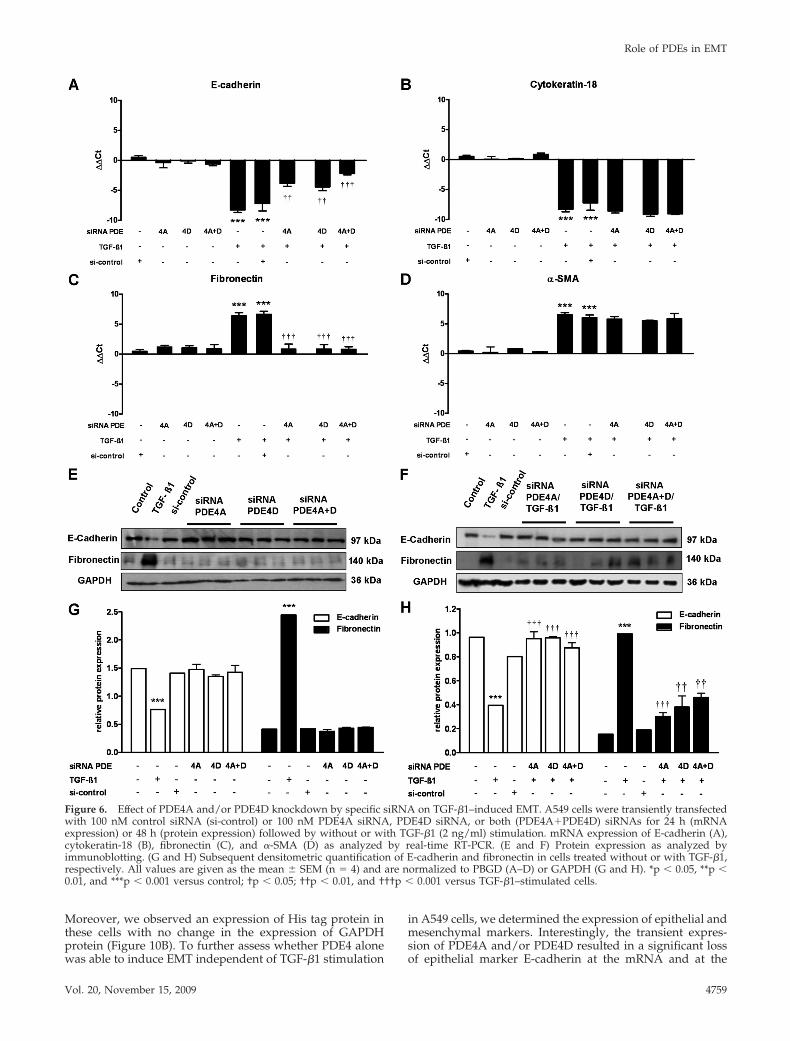
To be more specific with PDE4 inhibition, siRNA targetingPDE4A and PDE4D were applied to knock down endoge-nous PDE4A and PDE4D. As shown on Figure 5, PDE4Aand PDE4D siRNAs each successfully knockdown the ex-pression of corresponding endogenous mRNAs (Figure 5A).Down-regulation of PDE4A, PDE4D protein expression wasalso confirmed by immunoblotting (Figure 5, B and C).Furthermore, to determine the effects on TGF-�1–inducedEMT, PDE4A, PDE4D, or both PDE4A and PDE4D siRNAswere transfected into A549 cells, followed by stimulation ofthe cells with TGF-�1. In cells transfected with either PDE4AsiRNA or PDE4D siRNA alone, knock down abolished TGF-�1–induced E-cadherin repression and fibronectin inductionat the mRNA level (Figure 6, A–D) as well as at the proteinlevel (Figure 6E–H). Interestingly, transfection of bothPDE4A and PDE4D siRNAs showed no additive effects onthose markers compared with PDE4A or PDE4D siRNAsalone. Control siRNA showed no influences on thosemarkers (Figure 6).
Effect of PDE4 Inhibition on TGF-�1–induced SmadSignalingBecause Smad proteins mediate many of the signaling re-sponses induced by TGF-�1, we sought to determinewhether PDE inhibition attenuates TGF-�1–induced EMTthrough regulation of Smad signaling pathway. As shown in
Figure 3. Effect of PDE4 inhibition on epithelial and mesenchymal phenotype markers expression in TGF-�1–induced EMT. A549 cells werepretreated with PDE4 inhibitor rolipram (100 nM or 1 �M) for 12 h followed by TGF-�1 (2 ng/ml) stimulation for 24 h or stimulated withTGF-�1 (2 ng/ml) alone. (A) mRNA expression as analyzed by real-time RT-PCR of epithelial phenotype markers (E-cadherin, zonaoccludens-1, and cytokeratin-18). (B) mRNA expression as analyzed by real-time RT-PCR of mesenchymal phenotype markers (collagen I,fibronectin, and �-SMA) in the above-mentioned treated cells. (C) Protein expression as analyzed by immunoblotting. (D) Subsequentdensitometric quantification of epithelial and mesenchymal phenotype marker (E-cadherin and fibronectin) in the above-mentioned treatedcells. All values are given as the mean � SEM (n � 4) and are normalized to PBGD (A and B) or GAPDH (D). *p � 0.05, **p � 0.01, and ***p �0.001 versus control; †p � 0.05, ††p � 0.01, and ††† p � 0.001 versus TGF-�1–stimulated cells.
E. Kolosionek et al.
Molecular Biology of the Cell4756
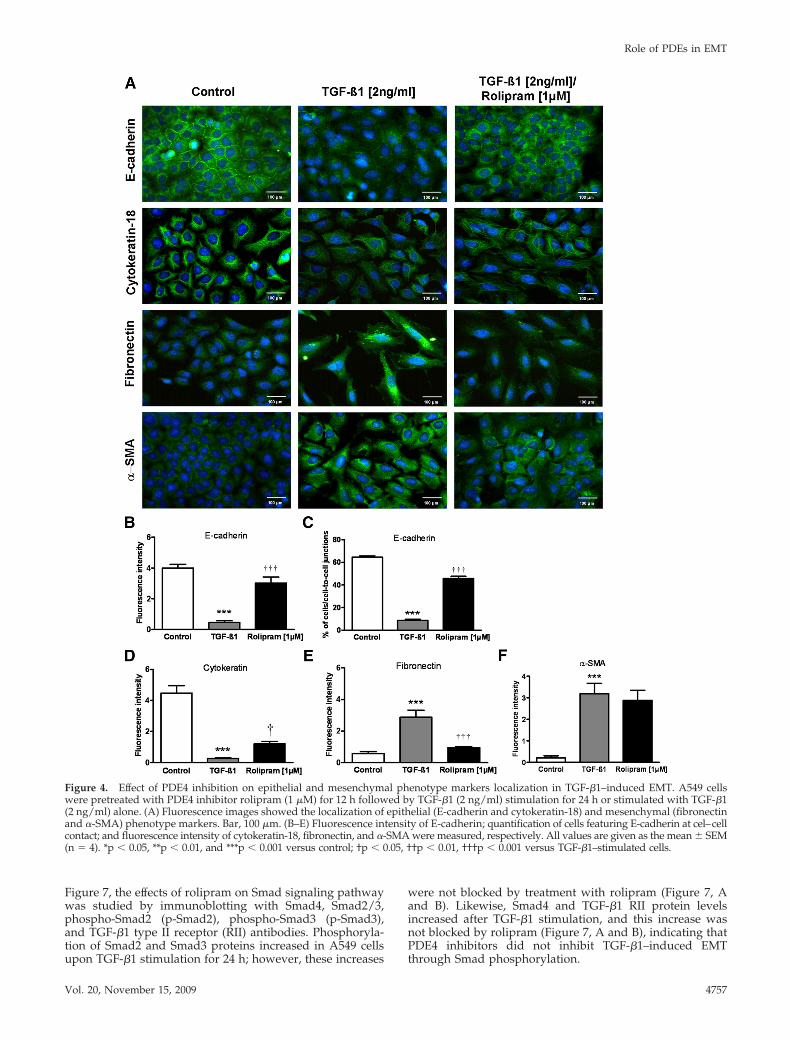
Figure 7, the effects of rolipram on Smad signaling pathwaywas studied by immunoblotting with Smad4, Smad2/3,phospho-Smad2 (p-Smad2), phospho-Smad3 (p-Smad3),and TGF-�1 type II receptor (RII) antibodies. Phosphoryla-tion of Smad2 and Smad3 proteins increased in A549 cellsupon TGF-�1 stimulation for 24 h; however, these increases
were not blocked by treatment with rolipram (Figure 7, Aand B). Likewise, Smad4 and TGF-�1 RII protein levelsincreased after TGF-�1 stimulation, and this increase wasnot blocked by rolipram (Figure 7, A and B), indicating thatPDE4 inhibitors did not inhibit TGF-�1–induced EMTthrough Smad phosphorylation.
Figure 4. Effect of PDE4 inhibition on epithelial and mesenchymal phenotype markers localization in TGF-�1–induced EMT. A549 cellswere pretreated with PDE4 inhibitor rolipram (1 �M) for 12 h followed by TGF-�1 (2 ng/ml) stimulation for 24 h or stimulated with TGF-�1(2 ng/ml) alone. (A) Fluorescence images showed the localization of epithelial (E-cadherin and cytokeratin-18) and mesenchymal (fibronectinand �-SMA) phenotype markers. Bar, 100 �m. (B–E) Fluorescence intensity of E-cadherin; quantification of cells featuring E-cadherin at cel–cellcontact; and fluorescence intensity of cytokeratin-18, fibronectin, and �-SMA were measured, respectively. All values are given as the mean � SEM(n � 4). *p � 0.05, **p � 0.01, and ***p � 0.001 versus control; †p � 0.05, ††p � 0.01, †††p � 0.001 versus TGF-�1–stimulated cells.
Role of PDEs in EMT
Vol. 20, November 15, 2009 4757
Effect of PDE4 Inhibition and Knockdown onTGF-�1–induced ROS ProductionIn addition to the Smad pathway, TGF-�1 may signalthrough other pathways such as ROS, RhoA, and MAPK, wesought to determine the effects of PDE4 inhibition on thesesignaling cascades. To assess the role of ROS, DHE immu-nofluorescence was performed on cells treated with H2O2,TGF-�1 alone, TGF-�1 and/or rolipram for 24 h, TGF-�1and knockdown of PDE4A and/or PDE4D. As shown inFigure 8A, H2O2 (10 mM) used as a positive control in-creased ROS production compared with control. Similarly,TGF-�1 (2 ng/ml) treatment increased ROS production. In-hibiting Smad pathway by using Smad3 inhibitor SIS3 (10and 30 �M), significantly reduced ROS generation in con-centration-dependent manner. Interestingly, TGF-�1 treat-ment induced ROS production, whereas cotreatment withrolipram or PDE4A and/or PDE4D blocked the TGF-�1–mediated increase in ROS production.
Next, we assessed the effects on TGF-�1–induced activa-tion of ERK1/2 and p38, which are both involved in EMT.Phosphorylation of ERK and p38 increased in A549 cellsupon TGF-�1 stimulation for 24 h. This increased phosphor-ylation is potently suppressed by siRNAs targeting PDE4A,PDE4D, or both PDE4A and PDE4D (Figure 8, B and C).
Effect of ROCK Inhibition and RhoA Knockdown onTGF-�1–induced PDE4 ExpressionOur results indicated that TGF-�1 stimulation increased theexpression of ROCK1 in A549 cells after 6 h of stimulation
(Figure 9, A and B); therefore, involvement of RhoA/ROCKsignaling pathway was assessed by using a specific pharma-cological inhibitor of ROCK, Y-27632, and RhoA-specificsiRNA. Treatment with Y-27632 partially abrogated TGF-�1–induced EMT and restored the expression of E-cadherin.Most importantly, PDE4A and PDE4D protein levels in-creased after TGF-�1 stimulation were decreased by Y-27632treatment (10 �M) (Figure 9, C and D).
To be more specific with Rho kinase pathway inhibition,specific siRNA targeting RhoA was applied. Figure 9, E–G,shows RhoA expression was successfully suppressed byRhoA siRNA on mRNA and protein level, whereas RhoAexpression did not change by control siRNA. With estab-lished siRNA conditions, PDE4A and PDE4D expressionwere examined. TGF-�1 induced up-regulation of PDE4Aand PDE4D at the mRNA level was potently suppressed byRhoA siRNA (Figure 9H). However, immunoblotting re-vealed that only PDE4A, but not PDE4D expression wasdecreased by RhoA siRNA (Figure 9, I and J).
Effects of PDE4 Overexpression on the Expression ofPhenotype Markers in A549 CellsTo unveil the possible role of PDE4 in the induction of EMTindependent of TGF-�1 in A549 cells, A549 cells were tran-siently transfected with PDE4A, PDE4D, or both PDE4A andPDE4D expression plasmid or empty vector. Real-time RT-PCR indicated that PDE4A or PDE4D mRNA was dramati-cally increased in PDE4 constructs transfected cells com-pared with empty vector transfected cells (Figure 10A).
Figure 5. siRNA-mediated knockdown of PDE4A and PDE4D. A549 cells were transiently transfected with 100 nM control siRNA(si-control) or 100 nM PDE4A siRNA, PDE4D siRNA, or both (PDE4A�PDE4D) siRNAs for 24 h (mRNA expression) or 48 h (proteinexpression). (A) mRNA expression of PDE4A and PDE4D as analyzed by real-time RT-PCR. (B) Protein expression as analyzed byimmunoblotting. (C) Subsequent densitometric quantification of PDE4A and PDE4D in the above-mentioned treated cells. All values aregiven as the mean � SEM (n � 4) and are normalized to PBGD (A) or GAPDH (C). *p � 0.05, **p � 0.01, and ***p � 0.001 versus control.
E. Kolosionek et al.
Molecular Biology of the Cell4758
Moreover, we observed an expression of His tag protein inthese cells with no change in the expression of GAPDHprotein (Figure 10B). To further assess whether PDE4 alonewas able to induce EMT independent of TGF-�1 stimulation
in A549 cells, we determined the expression of epithelial andmesenchymal markers. Interestingly, the transient expres-sion of PDE4A and/or PDE4D resulted in a significant lossof epithelial marker E-cadherin at the mRNA and at the
Figure 6. Effect of PDE4A and/or PDE4D knockdown by specific siRNA on TGF-�1–induced EMT. A549 cells were transiently transfectedwith 100 nM control siRNA (si-control) or 100 nM PDE4A siRNA, PDE4D siRNA, or both (PDE4A�PDE4D) siRNAs for 24 h (mRNAexpression) or 48 h (protein expression) followed by without or with TGF-�1 (2 ng/ml) stimulation. mRNA expression of E-cadherin (A),cytokeratin-18 (B), fibronectin (C), and �-SMA (D) as analyzed by real-time RT-PCR. (E and F) Protein expression as analyzed byimmunoblotting. (G and H) Subsequent densitometric quantification of E-cadherin and fibronectin in cells treated without or with TGF-�1,respectively. All values are given as the mean � SEM (n � 4) and are normalized to PBGD (A–D) or GAPDH (G and H). *p � 0.05, **p �0.01, and ***p � 0.001 versus control; †p � 0.05; ††p � 0.01, and †††p � 0.001 versus TGF-�1–stimulated cells.
Role of PDEs in EMT
Vol. 20, November 15, 2009 4759

protein level (PDE10C, G, and H). However, it did not resultin spontaneous mesenchymal marker induction (PDE10E–H).This indicates that PDE4 is important for the loss of epithelialphenotype but not sufficient for the induction of EMT in thesecells.
DISCUSSION
This study has six salient findings. First, phosphodiesterasesisoforms are significantly altered in TGF-�1–induced EMT.Second, cAMP-PDE activity and cAMP-PDEs PDE4A andPDE4D are significantly increased in TGF-�1–induced EMT.Third, inhibition of PDE4 by rolipram or PDE4 siRNA at-tenuated the genes associated with EMT. Fourth, PDE4 in-hibition mediates EMT progression in a Smad-independentmanner by inhibiting ROS production and p38 and ERKactivation. Fifth, overexpression of PDE4A and/or PDE4D isimportant for the loss of epithelial phenotype but not suffi-cient for the induction of EMT in these cells. Sixth, inhibitionof ROCK by Y-27632 or Rho siRNA suggests that Rho kinasesignaling activated by TGF-�1 during EMT is a positiveregulator of PDE4. This study supports a central role forPDE4 in the mechanism of EMT, and to our knowledge it isthe first report demonstrating attenuation of epithelial mes-enchymal transition by PDE4 inhibition.
The epithelial mesenchymal transition has emerged as acritical event not only in development but also in woundhealing, fibrosis, and the invasion and metastasis of tumorcells (Greenburg and Hay, 1982; Thiery, 2002; Nawshad etal., 2005). Moreover, it has been recently established thatEMT is critically involved in organ fibrosis, including thelung. It is increasingly being recognized that, after epithelialinjury, epithelial cells can give rise to fibroblasts and therebycontribute to the pathogenesis of pulmonary fibrosis byundergoing EMT (Willis et al., 2005; Kim et al., 2006). Simi-larly, EMT involvement in lung cancer has been recentlyreported to promote the migratory and invasive abilities oflung cancer cells, attributes essential for tumor metastasis(Keshamouni et al., 2006).
We used TGF-�1 to induce EMT in A549 cells, becauseTGF-�1 has been shown to be a major regulator of EMT andA549 cells are among the best-characterized alveolar epithe-lial cells and have been used in several studies to investigatevarious aspects of EMT (Kasai et al., 2005; Illman et al., 2006;Keshamouni et al., 2006). Exposure of A549 cells to TGF-�1for 24 h induced a complete conversion of the epithelial cells
to myofibroblasts, as evidenced by the acquisition of a spin-dle-like morphology, the loss of epithelial marker genes(E-cadherin, zona occludens-1, and cytokeratin-18) and thegain of mesenchymal marker genes (fibronectin, desmin,and �-smooth muscle actin). The time frame required forthis transition was similar to previous reports (Kasai et al.,2005). Exploring the involvement of PDEs in this establishedEMT model, we found the most striking twofold increase intotal cAMP-PDE activity. Furthermore, real-time RT-PCR,immunoblotting, and immunofluorescence indicated thatchanges in the relative expression of PDE isoforms is accom-panied TGF-�1–induced EMT, with an increased contribu-tion of PDE4A and PDE4D, and a decreased role of PDE1and PDE3 relative to control A549 cells. mRNA expressionof PDE4A and PDE4D was increased by TGF-�1 as early as6 h after stimulation (Figure 2C) and protein expression after24 h. Interestingly, experiments with CHX indicate thatTGF-�1 has no influence on posttranslationally PDE4 enzy-matic activity. However, decreased expression of PDE1 andPDE3 isoforms can be markers of phenotypic switch. Areduction in PDE3/PDE4 activity as well as marked reduc-tions in PDE3A mRNA and protein levels was observedduring vascular smooth muscle cell phenotypic switch(Dunkerley et al., 2002). Similarly, inhibition of cytoplasmicPDE1A inhibited contractile phenotype in vascular smoothmuscle cells (Nagel et al., 2006). Although not studied indetail in epithelial transition processes, we presume thatdown-regulation of PDE1 and PDE3 may have a functionalrelevance in these processes.
Most importantly, the PDE4 inhibitor rolipram exhibited aremarkable inhibitory effect on TGF-�1–induced EMT. Thisinhibition was complete, as evidenced by a restoration ofepithelial morphology and E-cadherin expression and acomplete abolishment of fibronectin stimulation. Interest-ingly, these effects were observed with a PDE4 inhibitor atvery low concentrations (0.1–1 �M). These observationsstrongly suggest that potent inhibition of TGF-�1 inducedthe EMT by the PDE4 inhibitors. In agreement, specificinhibition of PDE4 isoforms by transfections with eitherPDE4A siRNA or PDE4D siRNA alone abolished TGF-�1–stimulated E-cadherin repression and fibronectin induction.However, combined together both siRNA showed no addi-tive effects on these markers compared with individualsiRNA. In general agreement with this observation, Zhang etal. (2006) demonstrated that the cAMP-elevating agents8-bromo-cAMP and forskolin exhibit an inhibitory effect on
Figure 7. Effect of PDE4 inhibition on TGF-�1–induced Smad signaling. A549 cells were pretreated with PDE4 inhibitor rolipram (100 nMor 1 �M) for 12 h followed by TGF-�1 (2 ng/ml) stimulation for 24 h or stimulated with TGF-�1 (2 ng/ml) alone. (A) Protein expression asanalyzed by immunoblotting. (B) Subsequent densitometric quantification of phospho-Smad2 (p-Smad2), phospho-Smad3 (p-Smad3) toSmad2/3, Smad4 and TGF-�1 RII in the above-mentioned treated cells. All values are given as the mean � SEM (n � 4) and are normalizedto GAPDH. *p � 0.05, **p � 0.01, and ***p � 0.001 versus control.
E. Kolosionek et al.
Molecular Biology of the Cell4760

EMT in kidney epithelial cells. In contrast, the ectopic over-expression of PDE4A and/or PDE4D resulted in a signifi-cant loss of epithelial marker E-cadherin but did not result inchanges of mesenchymal markers, indicating that PDE4 isimportant for the loss of epithelial phenotype but not suffi-cient enough for the induction of EMT in these cells.
TGF-�1 is known to exert its effects by binding to theTGF-� type II receptor (T�RII) and subsequently recruitingthe T�RI. Smad2/3 and Smad4 are known intracellular me-diators of TGF-�1. Once phosphorylated by the activatedTGF-�1 receptor, Smad2 and/or Smad3 complex withSmad4 and translocate to the nucleus where they regulateTGF-�1 target genes (Nakao et al., 1997; Massague, 2000;Zavadil and Bottinger, 2005). In contrast, TGF-�1 can alsoregulate its target genes via non–Smad-dependent pathwaysthat include the RhoA, Ras, MAPK, phosphatidylinositol3-kinase, Notch, and Wnt signaling pathways (Bakin et al.,2000; Bhowmick et al., 2001; Moustakas and Heldin, 2005).
The intracellular signaling pathways involved in PDE4 in-hibition attenuated TGF-�1–mediated alveolar EMT; wefound that TGF-�1 induces Smad2 and Smad3 phosphory-lation in A549 cells, as has been shown by several othergroups (Kasai et al., 2005). Interestingly, these phosphoryla-tion events are not altered by PDE4 inhibition, suggestingthat PDE4 inhibitors may use alternative Smad-independentpathways to regulate EMT marker genes.
Furthermore, considering the established role of PDE4 ininflammation and ROS generation (Jacob et al., 2002, 2004;Foucaud et al., 2007), we postulated ROS signaling to be acandidate mediator of the above-mentioned PDE4 inhibitoryeffects on EMT. Consistent with our hypothesis, we foundthat TGF-�1 induced a threefold increase in dichlorofluores-cein-sensitive cellular ROS, confirming the report by Rhyu etal. (2005) in tubular epithelial cells (Rhyu et al., 2005). To oursurprise, 1 �M PDE4 inhibitor PDE4 siRNA or Smad3 in-hibitor completely blocked TGF-�1–induced ROS produc-
Figure 8. Effect of PDE4 knockdown and in-hibition on ROS production, ERK, and p38phosphorylation. A549 cells were treated withTGF-�1 (2 ng/ml) alone; pretreated with PDE4inhibitor rolipram (1 �M) for 12 h followed byTGF-�1 (2 ng/ml) stimulation for 24 h; and tran-siently transfected with 100 nM PDE4A siRNA,PDE4D siRNA, or both (PDE4A�PDE4D) siR-NAs for 48 h followed by TGF-�1 (2 ng/ml)stimulation for 24 h or treated with H2O2 (10mM) for 12 h. (A) ROS production was mea-sured by DHE fluorescence in 10 randomlyselected images from each group. H2O2 servedas a positive control. *p � 0.05, **p � 0.01, and***p � 0.001 versus control; †p � 0.05,††p � 0.01, and †††p � 0.001 versus TGF-�1–stimulated cells. (B) Protein expression ofp-ERK, ERK, p-p38, and p38 as analyzed byimmunoblotting. (C) Subsequent densitometricquantification of p-ERK to ERK and p-p38 top38. All values are given as the mean � SEM(n � 4) and are normalized to total ERK, p38abundance. *p � 0.05, **p � 0.01, and ***p �0.001 versus control; †p � 0.05, ††p � 0.01, and†††p � 0.001 versus TGF-�1–stimulated cells.
Role of PDEs in EMT
Vol. 20, November 15, 2009 4761
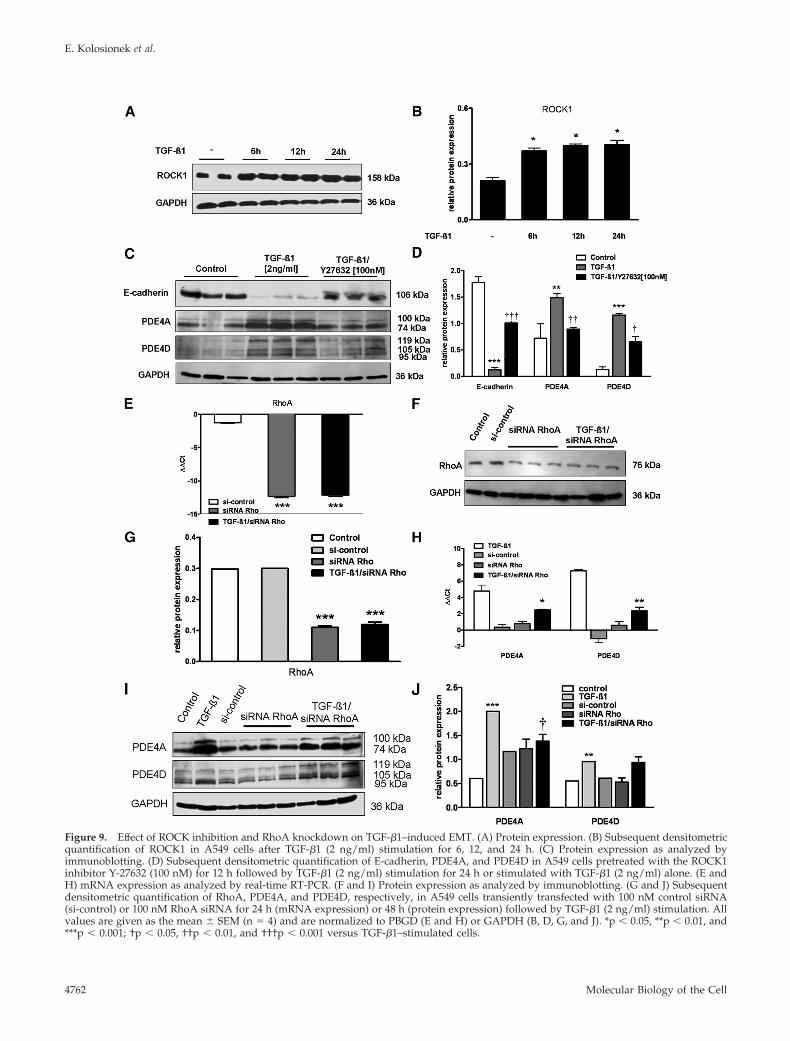
Figure 9. Effect of ROCK inhibition and RhoA knockdown on TGF-�1–induced EMT. (A) Protein expression. (B) Subsequent densitometricquantification of ROCK1 in A549 cells after TGF-�1 (2 ng/ml) stimulation for 6, 12, and 24 h. (C) Protein expression as analyzed byimmunoblotting. (D) Subsequent densitometric quantification of E-cadherin, PDE4A, and PDE4D in A549 cells pretreated with the ROCK1inhibitor Y-27632 (100 nM) for 12 h followed by TGF-�1 (2 ng/ml) stimulation for 24 h or stimulated with TGF-�1 (2 ng/ml) alone. (E andH) mRNA expression as analyzed by real-time RT-PCR. (F and I) Protein expression as analyzed by immunoblotting. (G and J) Subsequentdensitometric quantification of RhoA, PDE4A, and PDE4D, respectively, in A549 cells transiently transfected with 100 nM control siRNA(si-control) or 100 nM RhoA siRNA for 24 h (mRNA expression) or 48 h (protein expression) followed by TGF-�1 (2 ng/ml) stimulation. Allvalues are given as the mean � SEM (n � 4) and are normalized to PBGD (E and H) or GAPDH (B, D, G, and J). *p � 0.05, **p � 0.01, and***p � 0.001; †p � 0.05, ††p � 0.01, and †††p � 0.001 versus TGF-�1–stimulated cells.
E. Kolosionek et al.
Molecular Biology of the Cell4762

tion, thus establishing ROS as a target of PDE4 and Smad3during EMT. This study also suggests that ROS may bedownstream of Smad signaling. On the contrary, Rhyu et al.(2005) demonstrated that ROS are required for Smad phos-
phorylation downstream from TGF-�1. This apparent dis-crepancy in both studies can be due to several reasons:different concentration of TGF-� (2 vs. 10 ng/ml), differentmode of action of the inhibitors: rolipram may inhibit ROS
Figure 10. Effects of PDE4 overexpression in inducing epithelial mesenchymal transition. A549 cells were treated with TGF-�1 (2 ng/ml)for 24 h or transiently transfected with 2 �g empty vector (EV), PDE4A clone, PDE4D clone, or both (PDE4A�PDE4D). Lipofectamine (LF)was used as a transfection reagent. (A) mRNA expression of PDE4A and PDE4D as analyzed by real-time RT-PCR. (B) Protein expressionof His tag as analyzed by immunoblotting in transfected cells. mRNA expression of E-cadherin (C), cytokeratin-18 (D), fibronectin (E), and�-SMA (F) as analyzed by real-time RT-PCR. (G) Protein expression as analyzed by immunoblotting. (H) Subsequent densitometricquantification of E-cadherin and fibronectin in above-mentioned transfected cells. *p � 0.05, **p � 0.01, and ***p � 0.001; †p � 0.05, ††p �0.01, and †††p � 0.001 versus EV-transfected cells.
Role of PDEs in EMT
Vol. 20, November 15, 2009 4763
generation in a Smad-independent manner via regulatingother signaling pathways such as ERK-1/2 and p38 (Chenget al., 2005) compared with antioxidants. In agreement withthese observations, our data also suggest that rolipram in-hibits phosphorylation of both p38 and ERK. Furthermore,studies from Black et al. (2007) suggest that Smad3 (�/�)hepatocytes treated with TGF-�1 displayed ROS generationcompared with Smad3 (�/�) hepatocytes, suggesting across regulation of both Smad and ROS signaling.
Because recent studies have implicated the small GTPaseRho and its downstream effector Rho kinase (ROCK) inTGF-�1–induced remodeling of cell contacts in mammaryepithelial cells, and as necessary components for the acqui-sition of stress fibers and a fibroblastic morphology inNMuMG and primary mouse keratinocytes (Bhowmick etal., 2001), we examined the possibility that PDE4 may influ-ence EMT via Rho signaling. We found that TGF-�1–in-duced E-cadherin down-regulation is potently suppressedby the Rho kinase inhibitor Y-27632. Interestingly, to oursurprise, Y-27632 as well as RhoA siRNA also decreasedPDE4A and PDE4D expression, and subsequently PDE4 ac-tivity. Hence, to our knowledge, this is the first report sug-gesting a Rho/ROCK kinase signaling-dependent positiveregulation of PDE4 or PDE4 induction.
In conclusion, the current study provides new evidencefor a biochemical and physiologically important role forPDE isoforms in the epithelial mesenchymal transition inalveolar epithelial cells. Based on its high level of expressionand activity, PDE4 seems to be a particularly useful markerof the phenotypic switch mediated by TGF-�1. The use ofspecific inhibitors targeted to cAMP hydrolyzing PDEswhose expression is increased during TGF-�1–induced EMThas the potential to provide a means to regulate the magni-tude and duration of cAMP levels and response, and therebyto attenuate EMT. PDE4-selective inhibitors seem to be par-ticularly attractive as novel therapeutics to attenuate EMT-associated lung diseases, such as pulmonary fibrosis andlung cancer.
ACKNOWLEDGMENTS
Ewa Kolosionek received a predoctoral fellowship from Nycomed (Konstanz,Germany). This work was supported by the “Deutsche Forschungsgemein-schaft” KFO 118, projects TP 3 and TP 7; the European Commission under theSixth Frame work Programme (LSHM-CT-2005-018725, PULMOTENSION); andthe STARTUP AWARD from Justus-Liebig University (Giessen, Germany).
REFERENCES
Bakin, A. V., Tomlinson, A. K., Bhowmick, N. A., Moses, H. L., and Arteaga,C. L. (2000). Phosphatidylinositol 3-kinase function is required for transform-ing growth factor beta-mediated epithelial to mesenchymal transition and cellmigration. J. Biol. Chem. 275, 36803–36810.
Bender, A. T., Ostenson, C. L., Wang, E. H., and Beavo, J. A. (2005). Selectiveup-regulation of PDE1B2 upon monocyte-to-macrophage differentiation.Proc. Natl. Acad. Sci. USA 102, 497–502.
Bhowmick, N. A., Ghiassi, M., Bakin, A., Aakre, M., Lundquist, C. A., Engel,M. E., Arteaga, C. L., and Moses, H. L. (2001). Transforming growth factor-beta1 mediates epithelial to mesenchymal transdifferentiation through aRhoA-dependent mechanism. Mol. Biol. Cell 12, 27–36.
Black, D., Lyman, S., Qian, T., Lemasters, J. J., Rippe, R. A., Nitta, T., Kim, J. S.,and Behrns, K. E. (2007). Transforming growth factor beta mediates hepato-cyte apoptosis through Smad3 generation of reactive oxygen species. Bio-chimie 89, 1464–1473.
Brown, K. A., Pietenpol, J. A., and Moses, H. L. (2007). A tale of two proteins:differential roles and regulation of Smad2 and Smad3 in TGF-beta signaling.J. Cell. Biochem. 101, 9–33.
Cheng, J., Diaz Encarnacion, M. M., Warner, G. M., Gray, C. E., Nath, K. A.,and Grande, J. P. (2005). TGF-beta1 stimulates monocyte chemoattractant
protein-1 expression in mesangial cells through a phosphodiesterase isoen-zyme 4-dependent process. Am. J. Physiol. Cell Physiol. 289, C959–C970.
Conti, M., and Beavo, J. (2007). Biochemistry and physiology of cyclic nucle-otide phosphodiesterases: essential components in cyclic nucleotide signaling.Annu. Rev. Biochem. 76, 481–511.
Dunkerley, H. A., Tilley, D. G., Palmer, D., Liu, H., Jimmo, S. L., and Maurice,D. H. (2002). Reduced phosphodiesterase 3 activity and phosphodiesterase 3Alevel in synthetic vascular smooth muscle cells: implications for use of phos-phodiesterase 3 inhibitors in cardiovascular tissues. Mol. Pharmacol. 61,1033–1040.
Dunkern, T. R., Feurstein, D., Rossi, G. A., Sabatini, F., and Hatzelmann, A.(2007). Inhibition of TGF-beta induced lung fibroblast to myofibroblast con-version by phosphodiesterase inhibiting drugs and activators of soluble gua-nylyl cyclase. Eur. J. Pharmacol. 572, 12–22.
Foucaud, L., Wilson, M. R., Brown, D. M., and Stone, V. (2007). Measurementof reactive species production by nanoparticles prepared in biologically rel-evant media. Toxicol. Lett. 174, 1–9.
Ghofrani, H. A., Wiedemann, R., Rose, F., Schermuly, R. T., Olschewski, H.,Weissmann, N., Gunther, A., Walmrath, D., Seeger, W., and Grimminger, F.(2002). Sildenafil for treatment of lung fibrosis and pulmonary hypertension:a randomised controlled trial. Lancet 360, 895–900.
Greenburg, G., and Hay, E. D. (1982). Epithelia suspended in collagen gels canlose polarity and express characteristics of migrating mesenchymal cells.J. Cell Biol. 95, 333–339.
Higgins, D. F., et al. (2007). Hypoxia promotes fibrogenesis in vivo via HIF-1stimulation of epithelial-to-mesenchymal transition. J. Clin. Invest. 117, 3810–3820.
Huang, Z., and Mancini, J. A. (2006). Phosphodiesterase 4 inhibitors for thetreatment of asthma and COPD. Curr. Med. Chem. 13, 3253–3262.
Illman, S. A., Lehti, K., Keski-Oja, J., and Lohi, J. (2006). Epilysin (MMP-28)induces TGF-beta mediated epithelial to mesenchymal transition in lungcarcinoma cells. J. Cell Sci. 119, 3856–3865.
Jacob, C., Martin-Chouly, C., and Lagente, V. (2002). Type 4 phosphodiester-ase-dependent pathways: role in inflammatory processes. Therapie 57, 163–168.
Jacob, C., Szilagyi, C., Allen, J. M., Bertrand, C., and Lagente, V. (2004). Roleof PDE4 in superoxide anion generation through p44/42MAPK regulation: acAMP and a PKA-independent mechanism. Br. J. Pharmacol. 143, 257–268.
Jiang, Z., Seo, J. Y., Ha, H., Lee, E. A., Kim, Y. S., Han, D. C., Uh, S. T., Park,C. S., and Lee, H. B. (2003). Reactive oxygen species mediate TGF-beta1-induced plasminogen activator inhibitor-1 upregulation in mesangial cells.Biochem. Biophys. Res. Commun. 309, 961–966.
Kalluri, R., and Neilson, E. G. (2003). Epithelial-mesenchymal transition andits implications for fibrosis. J. Clin. Invest. 112, 1776–1784.
Kasai, H., Allen, J. T., Mason, R. M., Kamimura, T., and Zhang, Z. (2005).TGF-beta1 induces human alveolar epithelial to mesenchymal cell transition(EMT). Respir. Res. 6, 56.
Keshamouni, V. G., et al. (2006). Differential protein expression profiling byiTRAQ-2DLC-MS/MS of lung cancer cells undergoing epithelial-mesenchy-mal transition reveals a migratory/invasive phenotype. J. Proteome Res. 5,1143–1154.
Kim, K. K., Kugler, M. C., Wolters, P. J., Robillard, L., Galvez, M. G., Brumwell,A. N., Sheppard, D., and Chapman, H. A. (2006). Alveolar epithelial cellmesenchymal transition develops in vivo during pulmonary fibrosis and isregulated by the extracellular matrix. Proc. Natl. Acad. Sci. USA 103,13180 –13185.
Liu, X., Sun, S. Q., Hassid, A., and Ostrom, R. S. (2006). cAMP inhibitstransforming growth factor-beta-stimulated collagen synthesis via inhibitionof extracellular signal-regulated kinase 1/2 and Smad signaling in cardiacfibroblasts. Mol. Pharmacol. 70, 1992–2003.
Massague, J. (2000). How cells read TGF-beta signals. Nat. Rev. Mol. Cell Biol.1, 169–178.
Miettinen, P. J., Ebner, R., Lopez, A. R., and Derynck, R. (1994). TGF-betainduced transdifferentiation of mammary epithelial cells to mesenchymalcells: involvement of type I receptors. J. Cell Biol. 127, 2021–2036.
Moustakas, A., and Heldin, C. H. (2005). Non-Smad TGF-beta signals. J. CellSci. 118, 3573–3584.
Moustakas, A., and Heldin, C. H. (2007). Signaling networks guiding epithe-lial-mesenchymal transitions during embryogenesis and cancer progression.Cancer Sci. 98, 1512–1520.
Murray, F., Patel, H. H., Suda, R. Y., Zhang, S., Thistlethwaite, P. A., Yuan,J. X., and Insel, P. A. (2007). Expression and activity of cAMP phosphodies-
E. Kolosionek et al.
Molecular Biology of the Cell4764
terase isoforms in pulmonary artery smooth muscle cells from patients withpulmonary hypertension: role for PDE1. Am. J. Physiol Lung Cell Mol.Physiol. 292, L294–L303.
Nagel, D. J., et al. (2006). Role of nuclear Ca2�/calmodulin-stimulated phos-phodiesterase 1A in vascular smooth muscle cell growth and survival. Circ.Res. 98, 777–784.
Nakao, A., et al. (1997). TGF-beta receptor-mediated signalling throughSmad2, Smad3 and Smad4. EMBO J. 16, 5353–5362.
Naro, F., Sette, C., Vicini, E., De, A. V., Grange, M., Conti, M., Lagarde, M.,Molinaro, M., Adamo, S., and Nemoz, G. (1999). Involvement of type 4cAMP-phosphodiesterase in the myogenic differentiation of L6 cells. Mol.Biol. Cell 10, 4355–4367.
Nawshad, A., Lagamba, D., Polad, A., and Hay, E. D. (2005). Transforminggrowth factor-beta signaling during epithelial-mesenchymal transformation:implications for embryogenesis and tumor metastasis. Cells Tissues. Organs179, 11–23.
Rees, J. R., Onwuegbusi, B. A., Save, V. E., Alderson, D., and Fitzgerald, R. C.(2006). In vivo and in vitro evidence for transforming growth factor-beta1-mediated epithelial to mesenchymal transition in esophageal adenocarci-noma. Cancer Res. 66, 9583–9590.
Rhyu, D. Y., Yang, Y., Ha, H., Lee, G. T., Song, J. S., Uh, S. T., and Lee, H. B.(2005). Role of reactive oxygen species in TGF-beta1-induced mitogen-acti-vated protein kinase activation and epithelial-mesenchymal transition in re-nal tubular epithelial cells. J. Am. Soc. Nephrol. 16, 667–675.
Santibanez, J. F., Olivares, D., Guerrero, J., and Martinez, J. (2003). Cyclic AMPinhibits TGFbeta1-induced cell-scattering and invasiveness in murine-trans-formed keratinocytes. Int. J. Cancer 107, 715–720.
Savai, R., Schermuly, R. T., Pullamsetti, S. S., Schneider, M., Greschus, S.,Ghofrani, H. A., Traupe, H., Grimminger, F., and Banat, G. A. (2007). A
combination hybrid-based vaccination/adoptive cellular therapy to preventtumor growth by involvement of T cells. Cancer Res. 67, 5443–5453.
Savai, R., Schermuly, R. T., Voswinckel, R., Renigunta, A., Reichmann, B., Eul,B., Grimminger, F., Seeger, W., Rose, F., and Hanze, J. (2005). HIF-1alphaattenuates tumor growth in spite of augmented vascularization in an A549adenocarcinoma mouse model. Int. J. Oncol. 27, 393–400.
Schermuly, R. T., et al. (2007). Phosphodiesterase 1 upregulation in pulmonaryarterial hypertension: target for reverse-remodeling therapy. Circulation 115,2331–2339.
Thiery, J. P. (2002). Epithelial-mesenchymal transitions in tumour progres-sion. Nat. Rev. Cancer 2, 442–454.
Thompson, W. J., and Appleman, M. M. (1971). Multiple cyclic nucleotidephosphodiesterase activities from rat brain. Biochemistry 10, 311–316.
Vyas-Read, S., Shaul, P. W., Yuhanna, I. S., and Willis, B. C. (2007). Nitricoxide attenuates epithelial-mesenchymal transition in alveolar epithelial cells.Am. J. Physiol Lung Cell Mol. Physiol 293, L212–L221.
Willis, B. C., and Borok, Z. (2007). TGF-beta-induced EMT: mechanisms andimplications for fibrotic lung disease. Am. J. Physiol Lung Cell Mol. Physiol.293, L525–L534.
Willis, B. C., Liebler, J. M., Luby-Phelps, K., Nicholson, A. G., Crandall, E. D.,du Bois, R. M., and Borok, Z. (2005). Induction of epithelial-mesenchymaltransition in alveolar epithelial cells by transforming growth factor-beta 1,potential role in idiopathic pulmonary fibrosis. Am. J. Pathol. 166, 1321–1332.
Zavadil, J., and Bottinger, E. P. (2005). TGF-beta and epithelial-to-mesenchy-mal transitions. Oncogene 24, 5764–5774.
Zhang, A., Dong, Z., and Yang, T. (2006). Prostaglandin D2 inhibits TGF-beta1-induced epithelial-to-mesenchymal transition in MDCK cells. Am. J.Physiol Renal Physiol 291, F1332–F1342.
Role of PDEs in EMT
Vol. 20, November 15, 2009 4765
Related Documents