Report 2014/02 Exposures to radiofrequency fields from WiFi in New Zealand schools

Welcome message from author
This document is posted to help you gain knowledge. Please leave a comment to let me know what you think about it! Share it to your friends and learn new things together.
Transcript

Report 2014/02
Exposures to
radiofrequency fields from
WiFi in New Zealand schools

Exposures to RF fields from WiFi in NZ schools EMF Services report 2014/02
This report was prepared for:
Ministry of Health
P O Box 5013
Wellington
Report prepared by: Martin Gledhill
Finalised: 24 February 2014
About EMF Services and the author of this report
EMF Services is a division of Monitoring and Advisory Services NZ Ltd (MAASNZ), and
provides professional measurement and advisory services related to possible health
effects of electromagnetic fields (EMFs), such as the extremely low frequency (ELF)
electric and magnetic fields found around any wiring, appliances or infrastructure
carrying mains electricity, and the radiofrequency (RF) fields produced by radio
transmitters and some industrial equipment.
Martin Gledhill has an MA degree in Natural Sciences (Physics) from Cambridge University
and an MSc in Medical Physics from the University of Otago. He is a member of the
Australasian Radiation Protection Society and of the Bioelectromagnetics Society. Before
forming MAASNZ he was head of the non-ionising radiation section at the National
Radiation Laboratory of the New Zealand Ministry of Health. In this position he provided
advice to central and local government, the public and industry on the health effects of
EMFs, and carried out measurement and assessment services in this area. This work
included providing policy advice to the Ministries of Health and the Environment,
preparation of public information material, presenting expert evidence at local authority
and Environment Court hearings, and assessing exposures to EMFs by both measurements
and calculations.
EMF Services
P O Box 25006
Christchurch
New Zealand
www.emfservices.co.nz
+64 27 545 4217
Exposures to RF fields from WiFi in NZ schools EMF Services report 2014/02
Page 1 of 24
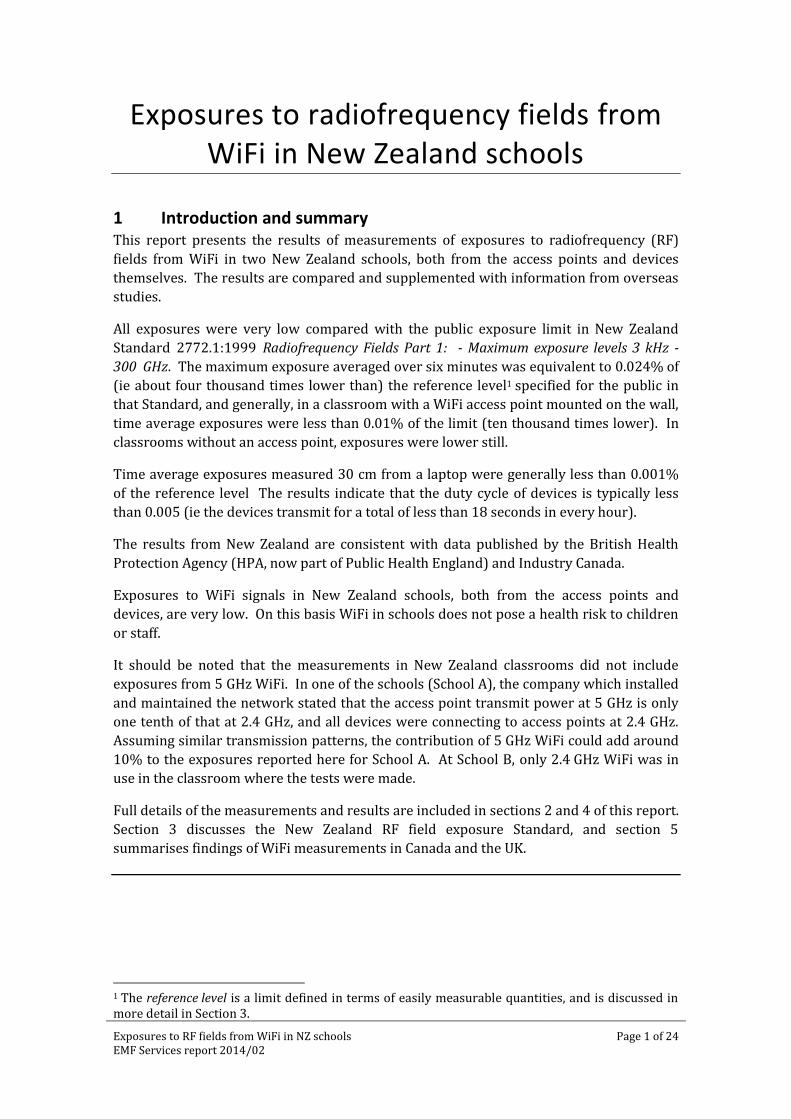
Exposures to radiofrequency fields from WiFi in New Zealand schools
1 Introduction and summary This report presents the results of measurements of exposures to radiofrequency (RF)
fields from WiFi in two New Zealand schools, both from the access points and devices
themselves. The results are compared and supplemented with information from overseas
studies.
All exposures were very low compared with the public exposure limit in New Zealand
Standard 2772.1:1999 Radiofrequency Fields Part 1: - Maximum exposure levels 3 kHz -
300 GHz. The maximum exposure averaged over six minutes was equivalent to 0.024% of
(ie about four thousand times lower than) the reference level1 specified for the public in
that Standard, and generally, in a classroom with a WiFi access point mounted on the wall,
time average exposures were less than 0.01% of the limit (ten thousand times lower). In
classrooms without an access point, exposures were lower still.
Time average exposures measured 30 cm from a laptop were generally less than 0.001%
of the reference level The results indicate that the duty cycle of devices is typically less
than 0.005 (ie the devices transmit for a total of less than 18 seconds in every hour).
The results from New Zealand are consistent with data published by the British Health
Protection Agency (HPA, now part of Public Health England) and Industry Canada.
Exposures to WiFi signals in New Zealand schools, both from the access points and
devices, are very low. On this basis WiFi in schools does not pose a health risk to children
or staff.
It should be noted that the measurements in New Zealand classrooms did not include
exposures from 5 GHz WiFi. In one of the schools (School A), the company which installed
and maintained the network stated that the access point transmit power at 5 GHz is only
one tenth of that at 2.4 GHz, and all devices were connecting to access points at 2.4 GHz.
Assuming similar transmission patterns, the contribution of 5 GHz WiFi could add around
10% to the exposures reported here for School A. At School B, only 2.4 GHz WiFi was in
use in the classroom where the tests were made.
Full details of the measurements and results are included in sections 2 and 4 of this report.
Section 3 discusses the New Zealand RF field exposure Standard, and section 5
summarises findings of WiFi measurements in Canada and the UK.
1 The reference level is a limit defined in terms of easily measurable quantities, and is discussed in more detail in Section 3.
Exposures to RF fields from WiFi in NZ schools EMF Services report 2014/02
Page 2 of 24
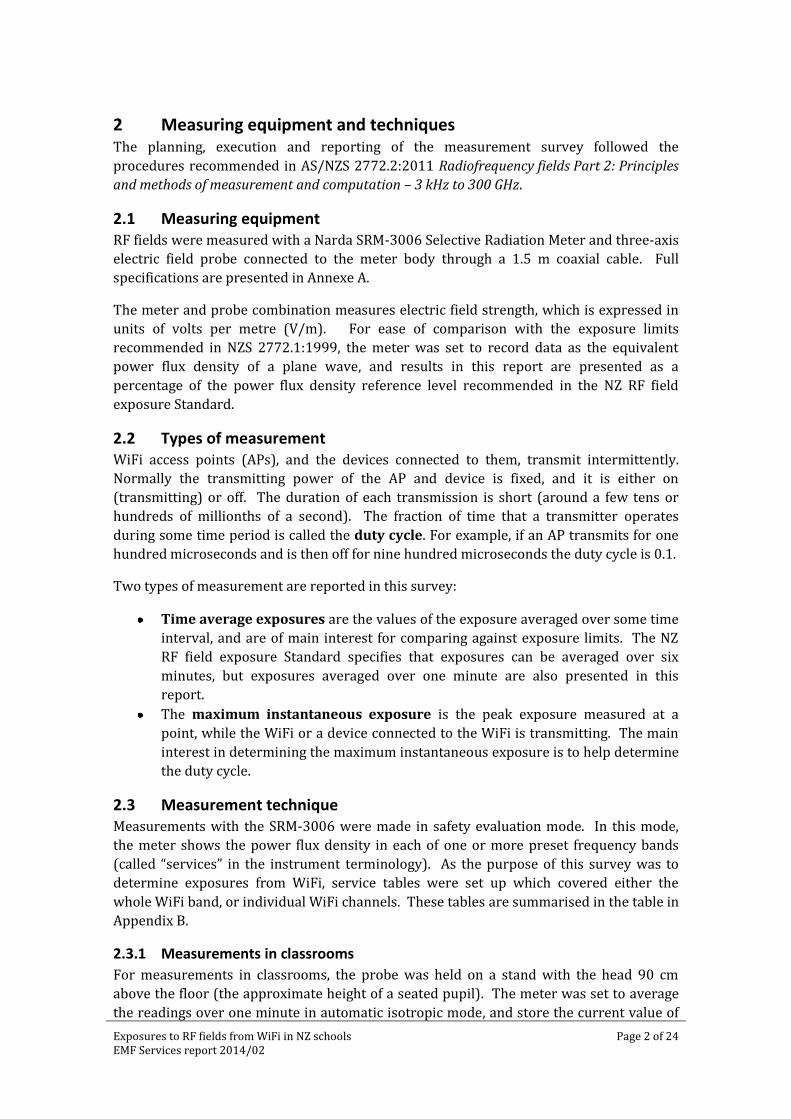
2 Measuring equipment and techniques The planning, execution and reporting of the measurement survey followed the
procedures recommended in AS/NZS 2772.2:2011 Radiofrequency fields Part 2: Principles
and methods of measurement and computation – 3 kHz to 300 GHz.
2.1 Measuring equipment RF fields were measured with a Narda SRM-3006 Selective Radiation Meter and three-axis
electric field probe connected to the meter body through a 1.5 m coaxial cable. Full
specifications are presented in Annexe A.
The meter and probe combination measures electric field strength, which is expressed in
units of volts per metre (V/m). For ease of comparison with the exposure limits
recommended in NZS 2772.1:1999, the meter was set to record data as the equivalent
power flux density of a plane wave, and results in this report are presented as a
percentage of the power flux density reference level recommended in the NZ RF field
exposure Standard.
2.2 Types of measurement WiFi access points (APs), and the devices connected to them, transmit intermittently.
Normally the transmitting power of the AP and device is fixed, and it is either on
(transmitting) or off. The duration of each transmission is short (around a few tens or
hundreds of millionths of a second). The fraction of time that a transmitter operates
during some time period is called the duty cycle. For example, if an AP transmits for one
hundred microseconds and is then off for nine hundred microseconds the duty cycle is 0.1.
Two types of measurement are reported in this survey:
Time average exposures are the values of the exposure averaged over some time
interval, and are of main interest for comparing against exposure limits. The NZ
RF field exposure Standard specifies that exposures can be averaged over six
minutes, but exposures averaged over one minute are also presented in this
report.
The maximum instantaneous exposure is the peak exposure measured at a
point, while the WiFi or a device connected to the WiFi is transmitting. The main
interest in determining the maximum instantaneous exposure is to help determine
the duty cycle.
2.3 Measurement technique Measurements with the SRM-3006 were made in safety evaluation mode. In this mode,
the meter shows the power flux density in each of one or more preset frequency bands
(called “services” in the instrument terminology). As the purpose of this survey was to
determine exposures from WiFi, service tables were set up which covered either the
whole WiFi band, or individual WiFi channels. These tables are summarised in the table in
Appendix B.
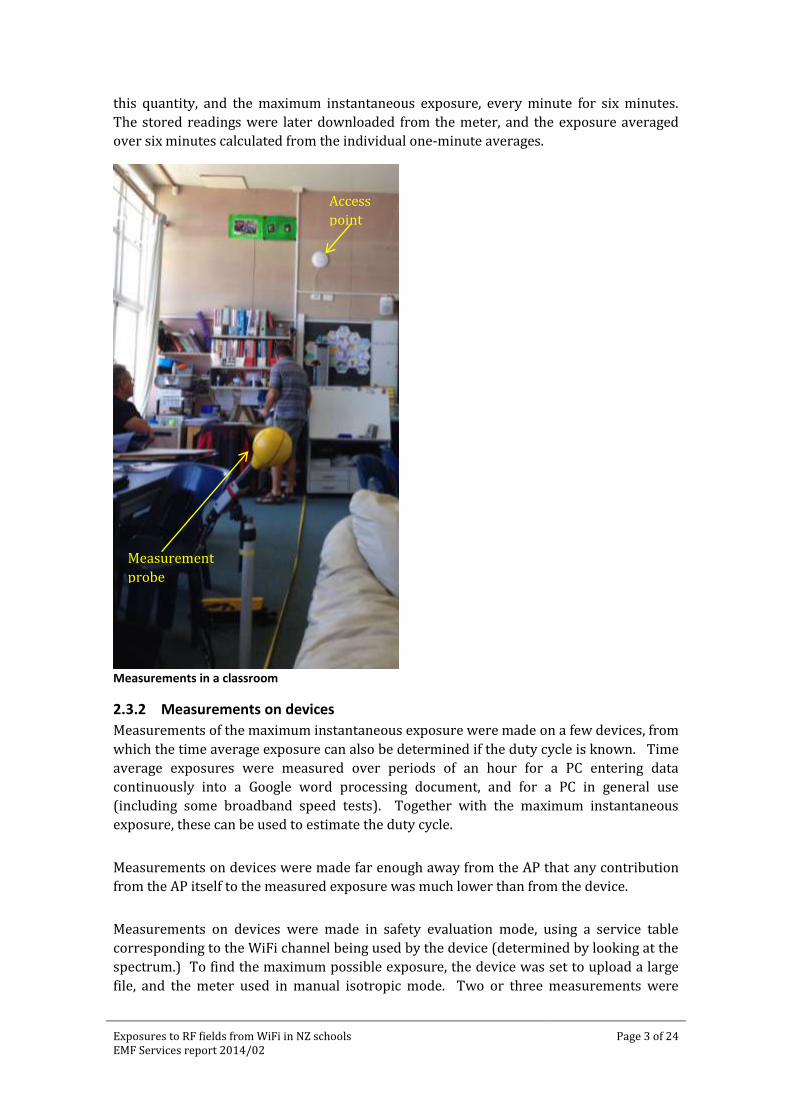
2.3.1 Measurements in classrooms
For measurements in classrooms, the probe was held on a stand with the head 90 cm
above the floor (the approximate height of a seated pupil). The meter was set to average
the readings over one minute in automatic isotropic mode, and store the current value of
Exposures to RF fields from WiFi in NZ schools EMF Services report 2014/02
Page 3 of 24
this quantity, and the maximum instantaneous exposure, every minute for six minutes.
The stored readings were later downloaded from the meter, and the exposure averaged
over six minutes calculated from the individual one-minute averages.
Measurements in a classroom
2.3.2 Measurements on devices
Measurements of the maximum instantaneous exposure were made on a few devices, from
which the time average exposure can also be determined if the duty cycle is known. Time
average exposures were measured over periods of an hour for a PC entering data
continuously into a Google word processing document, and for a PC in general use
(including some broadband speed tests). Together with the maximum instantaneous
exposure, these can be used to estimate the duty cycle.
Measurements on devices were made far enough away from the AP that any contribution
from the AP itself to the measured exposure was much lower than from the device.
Measurements on devices were made in safety evaluation mode, using a service table
corresponding to the WiFi channel being used by the device (determined by looking at the
spectrum.) To find the maximum possible exposure, the device was set to upload a large
file, and the meter used in manual isotropic mode. Two or three measurements were
Access
point
Measurement
probe

Exposures to RF fields from WiFi in NZ schools EMF Services report 2014/02
Page 4 of 24
made on each measurement axis to ensure that the maximum possible value was read, and
the readings from all three measurement axes combined to give the total.
Measurements in front of an ASUS laptop
It should be noted that only a single measurement was made in each setup, opposite the
centre of the device display, and that this may not be the highest that might be attained at
the measurement distance. It is possible that higher and lower values could be found if the
probe were swept across the face of the device at a fixed distance from it. Carrying out a
more detailed evaluation like this was beyond the scope of this survey. On the other hand,
laptop antennas (of which there may be more than one) are often at the top of the screen,
and do not have particularly strong directional characteristics2 in front of the screen (see,
for example, data presented by the UK Health Protection Agency in 200113) so there are
not likely to be large differences.
In order to gauge the duty cycle of transmissions from the devices, and hence determine
the time average exposure, further measurements were made near some devices in the
same manner described in section 2.2.1, but over longer periods of time. These
measurements show the time average exposure, and the duty cycle can be estimated by
dividing the time average exposure by the maximum instantaneous exposure.
2 In other words, they do not transmit much more strongly in some directions than others 3 Peyman et al. Assessment of exposure to electromagnetic fields from wireless computer networks (Wi-Fi) in schools: results of laboratory measurements. Health Physics 100 (6), 594-612 (2011)
Exposures to RF fields from WiFi in NZ schools EMF Services report 2014/02
Page 5 of 24
3 Exposure Standards The New Zealand Ministry of Health recommends using NZS 2772.1:1999 Radiofrequency
Fields Part 1: Maximum exposure levels – 3 kHz to 300 GHz to manage exposure to RF fields.
This Standard is based closely on Guidelines published by the International Commission
on Non-Ionising Radiation Protection (ICNIRP). ICNIRP is an independent scientific body
recognised by the World Health Organisation for its expertise in this area. Their exposure
Guidelines, which are based on a careful review of the health effects research, were first
published in 19984, and reaffirmed in 20095 following a review of more recent research in
this area6.
NZS 2772.1 sets limits for exposure to the RF fields produced by all types of transmitters,
and covers both public and occupational exposures. Occupational limits should normally
be applied only to people who are expected to work on RF sources (eg radio technicians
and engineers, riggers, RF welder operators etc), who have received training about
potential hazards and precautions which should be taken to avoid them. Their exposures
to occupational levels would normally be limited to the working day and over their
working lifetime. Occupational exposure limits are set at levels 10 times lower than the
threshold at which adverse health effects might occur. Public limits are intended to
protect all members of the population, of all ages, who may be exposed 24 hours per day,
seven days per week, and incorporate a safety factor of 50.
The Standard sets fundamental limits, called basic restrictions, on the amount of RF
power absorbed in the body from a radio signal. This is quantified as the specific
absorption rate (SAR), measured in watts/kg. For the public, the Standard sets a limit of
0.08 W/kg on the average power absorbed over the whole body. The localised SAR in
different parts of the body will, of course, vary above and below the average, and the
Standard also specifies that in the head and trunk the maximum localised SAR should not
exceed 2 W/kg over any 10 grams of tissue.
In practice, SAR is very difficult to measure and not practical for environmental
measurements. For that reason, the Standard also specifies secondary limits, called
reference levels in terms of the more readily measured (or calculated) electric and
magnetic field strengths of the radio signal, and the plane wave equivalent power flux
density. The reference levels are set so as to ensure that if exposures comply with them,
they will also comply with the basic restrictions on SAR. In many situations they can
effectively be regarded as the NZS 2772.1 “exposure limits”, although this term is not used
as such in the Standard.
If exposures exceed the reference levels, this does not necessarily mean that the basic
restriction has also been exceeded. However, a more comprehensive analysis is required
before compliance can be verified.
For a given strength of radio signal, the SAR depends on the frequency of the signal. For
that reason, the reference levels vary with frequency. At the frequencies used by WiFi, the
reference level for the public is 1,000 microwatts per square centimetre ( W/cm2).
4 http://www.icnirp.de/documents/emfgdl.pdf 5 http://www.icnirp.de/documents/StatementEMF.pdf 6 http://www.icnirp.de/documents/RFReview.pdf
Exposures to RF fields from WiFi in NZ schools EMF Services report 2014/02
Page 6 of 24
The limits prescribed in the Standard are average values over six minutes. If the signal
varies widely over short distances, spatial averaging, at the four corners and centre of a
square whose sides are 25 - 30 cm long (depending on the frequency), is also permitted.
As well as compliance with the numerical limits, Clause 10(d) of NZS 2772.1 requires:
"Minimizing, as appropriate, RF exposure which is unnecessary or incidental to
achievement of service objectives or process requirements, provided that this can
be readily achieved at modest expense.”
An explanatory note to this clause comments:
“Notwithstanding that ICNIRP considers that the basic restrictions and reference
levels in this Standard provide adequate protection, it is recognized that
community concerns over RF exposure may be able to be addressed by further
minimization of exposure in accordance with the requirements of Clause 10(d).”)
Effectively, this means that when installing radio transmitters simple steps should be
taken to minimise exposures if this can be achieved at low or no cost, and without
compromising the performance of the system. In the context of school WiFi installations,
possible options to minimise exposures include:
If the power of an AP is adjustable, it should be set to the lowest value which still
achieves the required coverage
When positioning APs, place them high up or even in corridors or cloakrooms (if
this provides the necessary coverage).
Often, such measures are best taken when a system is initially installed, as making
changes later on may not be simple or low cost.
For the devices themselves, exposures can be minimised by using them on a desk or table
rather than on the lap (as this increases the distance between the transmitting antenna
and the body). WiFi technology by its very nature also acts to minimise exposures from
devices as the length of time they transmit must be kept as low as possible in order to
allow other devices to share the same WiFi channel.

Exposures to RF fields from WiFi in NZ schools EMF Services report 2014/02
Page 7 of 24
4 Measurement results Measurements were made in two schools, referred to as School A and School B. Results
are graphed in the following sections (4.1 for school A, 4.2 for school B) and the following
quantities are presented in the graphs:
Quantity Relevance
Exposure averaged over
six minutes
This is the most relevant quantity for comparing against the
reference level in the NZ exposure Standard.
Maximum
instantaneous exposure
The maximum instantaneous exposure measured over the six
minute recording interval. (This could be due either to the AP,
or to a nearby device.) If devices are mostly inactive, the ratio
of the six-minute average exposure to the maximum
instantaneous exposure gives an estimate of the AP duty cycle.
If measurements are made in front of a device, and the AP is
some distance away, the ratio of the six-minute average
exposure to the maximum instantaneous exposure gives an
estimate of the device duty cycle.
The measurement locations (identified by words, letters and/or numbers) are shown
along the bottom of the graphs, and a table below each graph describes the position of
each measurement location.
At each measurement location, the green diamond shows the exposure averaged over six
minutes (the averaging time specified in the Standard), and the red circle shows the
maximum instantaneous exposure.
Hence in the first graph in section 4.1.1, which shows exposures in Room 1 of school A, at
the point labelled 2 (2 metres back from the wall of the classroom on which the access
point is mounted) the exposure averaged over six minutes was 0.024% of the reference
level. The maximum instantaneous exposure at this point was 0.22% of the reference
level.
In order to display the wide range of values encountered, exposures are displayed on a
logarithmic (compressed) scale.

Exposures to RF fields from WiFi in NZ schools EMF Services report 2014/02
Page 8 of 24
4.1 School A Measurements were made in the following areas:
Area Description Measurements made
Room 1* Classroom with an AP mounted about
two metres above floor level at one
end of the room
Measurement at one metre intervals
from the front to the rear of the
classroom, in line with the AP, and
towards the sides of the room. Some
measurements made with many
active devices, some with few or
none.
Room 2 Classroom with no AP, about 30 m
from the closest AP
Single measurement in one corner of
the classroom
Room 3 Classroom with an AP mounted about
two metres above floor level at one
end of the room
Single measurement about 2.5 m
back from the wall on which the AP is
mounted
Room 4 Classroom next to Room 1, Room 1
AP at the far end of the classroom
from the wall dividing Rooms 1 and 4
Single measurement about 2 m back
from the wall dividing Rooms 1 and 4
Reception At school entrance/reception, about
12 m from closest AP (which is in a
separate room)
Single measurement in the centre of
the reception area.
*Note: room numbers do not correspond to the actual classroom numbers used in the
school.
4.1.1 Room 1 – general
The sketch plan of the classroom below shows where measurements were made.
Sketch plan of Room 1. Dashed line shows line along which measurements were made as a function of distance. Point labelled C shows where measurements were made near operating laptops.

Exposures to RF fields from WiFi in NZ schools EMF Services report 2014/02
Page 9 of 24
Exposures measured in Room 1
Location Description
2 2 metres back from the wall on which the AP is mounted – pupils all busy
typing
3 3 metres back from the wall on which the AP is mounted – little activity
4 4 metres back from the wall on which the AP is mounted – little activity
5 5 metres back from the wall on which the AP is mounted – little activity
6 6 metres back from the wall on which the AP is mounted – little activity
7 7 metres back from the wall on which the AP is mounted – little activity
A Half way along classroom – between desks (see sketch plan) – little activity
B Half way along classroom – between desks (see sketch plan) – little activity
4.1.2 Room 1 – near active laptops
The measurement probe was placed in the position marked C in the sketch plan, about as
far away from two active laptops as the bodies of the pupils using them. A measurement
was made while the children were busy typing, and also while the laptops were still there
but the pupils had gone for lunch.
0.0001
0.0010
0.0100
0.1000
1.0000
2 3 4 5 6 7 A B
Exp
osu
re (
% o
f p
ub
lic r
efe
ren
ce le
vel)
Measurement location
Maximum instantaneous exposure
Average exposure over six minutes

Exposures to RF fields from WiFi in NZ schools EMF Services report 2014/02
Page 10 of 24
Exposures by desk with laptops in Room 1
Location Description
C - typing By desk with laptops – pupils typing
C – no typing By desk with laptops – pupils not typing
0.001
0.010
0.100
1.000
C - typing C - no typing
Exp
osu
re (
% o
f p
ub
lic r
efe
ren
ce le
vel)
Measurement location
Maximum instantaneous exposure
Average exposure over six minutes
Exposures to RF fields from WiFi in NZ schools EMF Services report 2014/02
Page 11 of 24
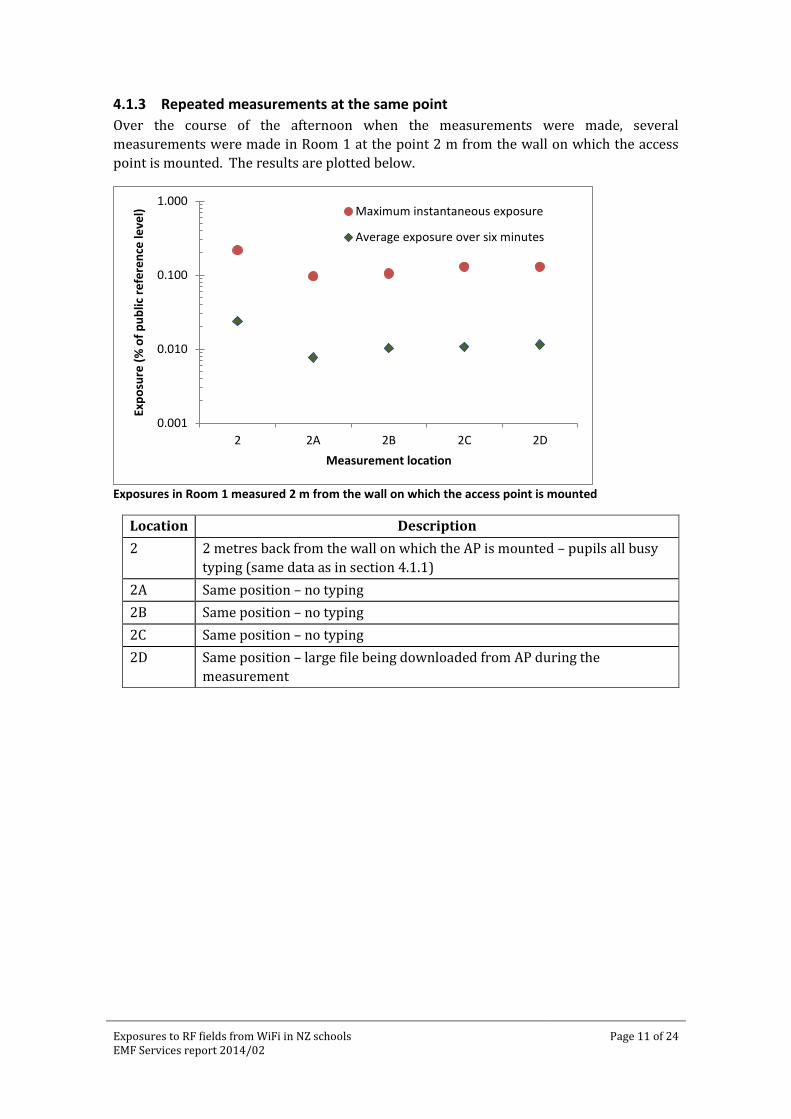
4.1.3 Repeated measurements at the same point
Over the course of the afternoon when the measurements were made, several
measurements were made in Room 1 at the point 2 m from the wall on which the access
point is mounted. The results are plotted below.
Exposures in Room 1 measured 2 m from the wall on which the access point is mounted
Location Description
2 2 metres back from the wall on which the AP is mounted – pupils all busy
typing (same data as in section 4.1.1)
2A Same position – no typing
2B Same position – no typing
2C Same position – no typing
2D Same position – large file being downloaded from AP during the
measurement
0.001
0.010
0.100
1.000
2 2A 2B 2C 2D
Exp
osu
re (
% o
f p
ub
lic r
efe
ren
ce le
vel)
Measurement location
Maximum instantaneous exposure
Average exposure over six minutes
Exposures to RF fields from WiFi in NZ schools EMF Services report 2014/02
Page 12 of 24
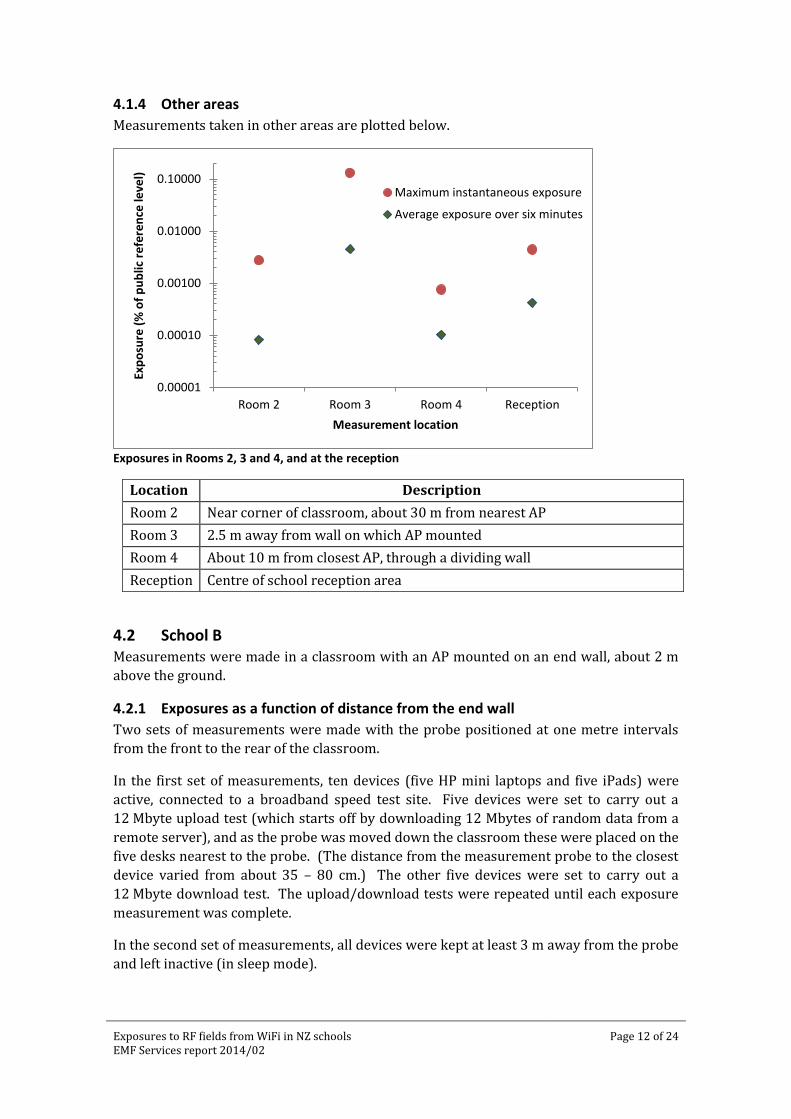
4.1.4 Other areas
Measurements taken in other areas are plotted below.
Exposures in Rooms 2, 3 and 4, and at the reception
Location Description
Room 2 Near corner of classroom, about 30 m from nearest AP
Room 3 2.5 m away from wall on which AP mounted
Room 4 About 10 m from closest AP, through a dividing wall
Reception Centre of school reception area
4.2 School B Measurements were made in a classroom with an AP mounted on an end wall, about 2 m
above the ground.
4.2.1 Exposures as a function of distance from the end wall
Two sets of measurements were made with the probe positioned at one metre intervals
from the front to the rear of the classroom.
In the first set of measurements, ten devices (five HP mini laptops and five iPads) were
active, connected to a broadband speed test site. Five devices were set to carry out a
12 Mbyte upload test (which starts off by downloading 12 Mbytes of random data from a
remote server), and as the probe was moved down the classroom these were placed on the
five desks nearest to the probe. (The distance from the measurement probe to the closest
device varied from about 35 – 80 cm.) The other five devices were set to carry out a
12 Mbyte download test. The upload/download tests were repeated until each exposure
measurement was complete.
In the second set of measurements, all devices were kept at least 3 m away from the probe
and left inactive (in sleep mode).
0.00001
0.00010
0.00100
0.01000
0.10000
Room 2 Room 3 Room 4 Reception
Exp
osu
re (
% o
f p
ub
lic r
efe
ren
ce le
vel)
Measurement location
Maximum instantaneous exposure
Average exposure over six minutes

Exposures to RF fields from WiFi in NZ schools EMF Services report 2014/02
Page 13 of 24
Results are plotted in the graph below. Solid green diamonds show the six minute average
exposure with the devices active, and open green diamonds show the six minute average
exposure with the devices inactive. Solid and open red circles show the maximum
instantaneous exposures for the two test conditions.
Exposures in School B classroom, as a function of distance from the end wall with the AP
4.2.2 Exposures near active laptops
Six devices were placed on a desk
approximately five metres back from the end
wall, and the measurement probe positioned
about 30 cm away from the screen of the
closest laptop (as shown on the photo).
Exposure measurements were made:
With the devices on the desk but
inactive
With all devices repeatedly carrying
out a 12 Mbyte upload speed test
With all devices removed and placed,
inactive, at least three metres away.
Results are plotted below.
0.0001
0.0010
0.0100
0.1000
1.0000
1 2 3 4 5 6 7
Exp
osu
re (
% o
f p
ub
lic r
efe
ren
ce le
vel)
Distance from end wall (m)
Maximum instantaneousexposure - devices active
Maximum instantaneousexposure - devices inactive
Average exposure over sixminutes - devices active
Average exposure over sixminutes - devices inactive

Exposures to RF fields from WiFi in NZ schools EMF Services report 2014/02
Page 14 of 24
Exposures by desks with six devices
4.2.3 Exposures in an adjacent classroom
In an adjacent classroom, separated from the classroom with the AP by a cloakroom, the
six minute average and instantaneous maximum exposures one metre from the end wall
closest to the AP (and about 13 metres away from it) were 0.000054% and 0.0014%
respectively of the reference level.
4.3 Measurements near laptops and other devices This section presents the results of measurements of exposures from laptops and other
devices connecting to WiFi.
Section 4.3.1 shows the maximum instantaneous exposures measured near individual
devices, and section 4.3.2 shows the time averaged exposures measured while the devices
were in use.
4.3.1 Maximum instantaneous exposures
The maximum instantaneous exposure measured near different laptops and other devices
is shown in the table below.
Device Measurement position Maximum instantaneous
exposure (% of limit)
HP laptop 30 cm from centre of screen 0.05 – 0.08
MacBook Approx. 40 cm from centre of screen 0.19
Asus laptop 30 cm from centre of screen 0.052
iPad 30 cm above centre of screen 0.16
iPad 25 cm from edge where antenna situated 0.16
HP Mini 30 cm from centre of screen 0.47
4.3.2 Exposures from devices in use
The plot below shows exposures measured 30 cm from the screen of an HP laptop (device
at the top of the table in section 4.3.1 above) during normal use.
0.001
0.010
0.100
1.000
Inactive on desk Uploading Devices removed
Exp
osu
re (
% o
f p
ub
lic r
efe
ren
ce le
vel)
Measurement condition
Maximum instantaneous exposure
Average exposure over six minutes

Exposures to RF fields from WiFi in NZ schools EMF Services report 2014/02
Page 15 of 24
Exposures from HP laptop in normal use
The green curve shows the exposure during use, averaged over one minute, and the value
of this curve should be read off against the scale on the left. The blue curve shows the
approximate duty cycle of the WiFi transmitter in the laptop (right hand scale).
For a few minutes after starting to record the data, and about 35 minutes into the test, a
25 MByte upload speed tests was run to get the WiFi uplink from the laptop as busy as
possible. The graph shows that during this time the laptop WiFi transmitter had a duty
cycle of about 0.04 (ie the transmitter was busy for about 4% of the time). The rest of the
time, the duty cycle was about 0.001.
The plot below shows exposures measured from an HP laptop while editing a Google Docs
word processing document. A key was held down continuously for the first 45 minutes of
the data recording, so as to simulate the fastest possible typing speed. After that, the word
processing document was left open, but not edited.
Exposures from HP laptop while editing Google word processing document as fast as possible
0.0001
0.0010
0.0100
0.1000
0.00001
0.00010
0.00100
0.01000
0 10 20 30 40 50 60
Du
ty cycle
Exp
osu
re (
% o
f p
ub
lic r
efe
ren
ce le
vel)
Time (minutes)
Average exposure over six minutes
Duty cycle
0.0001
0.0010
0.0100
0.1000
0.00001
0.00010
0.00100
0.01000
0 10 20 30 40 50 60
Du
ty cycleEx
po
sure
(%
of
pu
blic
re
fere
nce
leve
l)
Time (minutes)
Average exposure over six minutes
Duty cycle

Exposures to RF fields from WiFi in NZ schools EMF Services report 2014/02
Page 16 of 24
The traces have the same meanings as in the previous example. Most of the time the
exposure was between 0.0001 and 0.0002% of the public reference level, and the duty
cycle around 0.003. The reason for the increase in exposure and duty cycle after about 8
minutes, and whether this was related to the Google Docs or some other process running
in the background is unknown. (Another test on the same laptop did not show such an
increase.) During this time, the exposure increased to about 0.0006% of the reference
level, and the duty cycle to 0.01. The exposure with the Word processing document open
but not being edited was 0.00003% of the reference level.

Exposures to RF fields from WiFi in NZ schools EMF Services report 2014/02
Page 17 of 24
5 Overseas data There are two sets of overseas data which provide comparative and/or complementary
information.
5.1 Canadian measurements in a “simulated classroom setting” In 2012 Industry Canada published the results of measurements of WiFi exposures in
what they described as a “simulated classroom setting”7. A meeting room as set up with a
5 GHz WiFi AP at one end and a 2.45 GHz AP at the other, and 24 laptops uploading and
downloading data.
The 5 GHz AP was mounted by the ceiling and put into a test mode to transmit
continuously at a power of 0.25 W. The AP antenna had a gain of 5.6. The 2.45 GHz AP
was placed about 1.1 m above the floor. This AP was in normal operating mode, with a
power of 0.25 W when transmitting. The gain of its antenna was 9.
A photograph of the setup, looking towards the 5 GHz AP, is shown below.
Measurements were made at 12 positions around the room. Maximum and time averaged
exposures at 2.4 GHz (which would include the contributions from the AP and the laptops)
AP when all the laptops were downloading a large file are shown in the sketch plan below.
For these measurements, the probe was 1.25 m above the floor.
7 Available at: http://www.ic.gc.ca/eic/site/smt-gst.nsf/eng/sf10383.html
Exposures to RF fields from WiFi in NZ schools EMF Services report 2014/02
Page 18 of 24
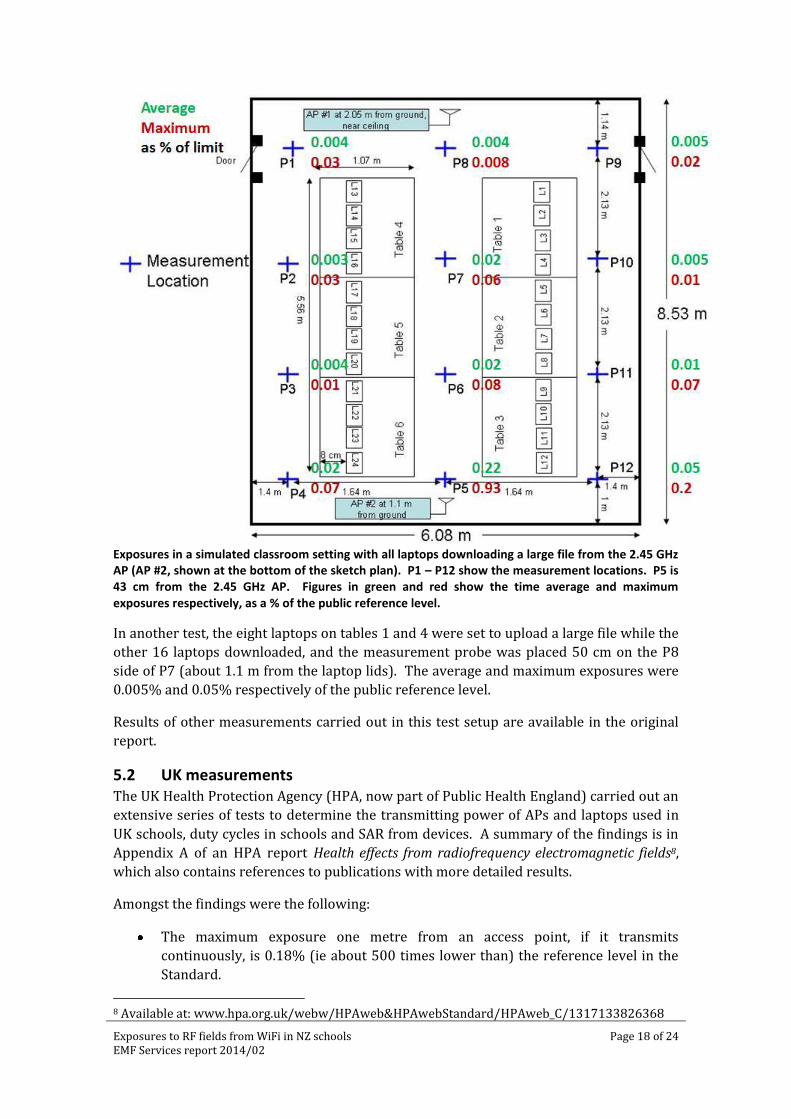
Exposures in a simulated classroom setting with all laptops downloading a large file from the 2.45 GHz AP (AP #2, shown at the bottom of the sketch plan). P1 – P12 show the measurement locations. P5 is 43 cm from the 2.45 GHz AP. Figures in green and red show the time average and maximum exposures respectively, as a % of the public reference level.
In another test, the eight laptops on tables 1 and 4 were set to upload a large file while the
other 16 laptops downloaded, and the measurement probe was placed 50 cm on the P8
side of P7 (about 1.1 m from the laptop lids). The average and maximum exposures were
0.005% and 0.05% respectively of the public reference level.
Results of other measurements carried out in this test setup are available in the original
report.
5.2 UK measurements The UK Health Protection Agency (HPA, now part of Public Health England) carried out an
extensive series of tests to determine the transmitting power of APs and laptops used in
UK schools, duty cycles in schools and SAR from devices. A summary of the findings is in
Appendix A of an HPA report Health effects from radiofrequency electromagnetic fields8,
which also contains references to publications with more detailed results.
Amongst the findings were the following:
The maximum exposure one metre from an access point, if it transmits
continuously, is 0.18% (ie about 500 times lower than) the reference level in the
Standard.
8 Available at: www.hpa.org.uk/webw/HPAweb&HPAwebStandard/HPAweb_C/1317133826368

Exposures to RF fields from WiFi in NZ schools EMF Services report 2014/02
Page 19 of 24
The duty cycle of access points in a sample of classrooms varied between 0.01 and
0.117 (ie they transmitted for between 36 seconds and about 7 minutes per hour)
Duty cycles of devices being used in classrooms varied between 0.0002 – 0.0091
with a mean of 0.0008 (ie they transmitted for a total of between 0.7 and 33
seconds per hour, with a mean of 3 seconds).
The transmit power of devices (all laptops) at 2.45 GHz varied between 5 and
17 milliwatts, with a mean of 11 mW.
The transmit power of APs at 2.45 GHz varied between 3 and 28 milliwatts, with a
mean of 11 mW
Taking into account the measured duty factors, the maximum localised SAR in the
torso of a 10-year old child attributable to devices would be 80 W/kg (0.004% of
the limit on localised SAR)

Exposures to RF fields from WiFi in NZ schools EMF Services report 2014/02
Page 20 of 24
6 Discussion
6.1 Exposures in classrooms The measurements in New Zealand classrooms showed the following features:
Exposures are all well below the limits recommended for the public. The maximum
exposure averaged over six minutes was equivalent to 0.024% of (ie about four
thousand times lower than) the public reference level9. Generally, exposures were less
than 0.01% of (ten thousand times lower than) the public reference level.
In one of the classrooms tested, exposures varied quite markedly from the front to the
back (from 0.024% to 0.0010% of the reference level), while in the other there was a
lot less variation.
Exposures in classrooms with no access point were much lower. This can be explained
by the decrease in the WiFi signal strength with distance from the AP, and attenuation
by the classroom walls.
It should be borne in mind that these were field measurements, and not all conditions
which might affect exposures could be controlled as they might be in a laboratory setting.
Hence some variation in results should be expected if the same exercise were repeated
because, for example, the exposure can vary over distances of a few centimetres, and it is
very difficult to reposition a measurement probe with centimetre accuracy. In addition,
radio waves at these frequencies can be reflected off many surfaces, including the body, so
variations at a point will also occur as people move around the classroom, especially near
the measurement probe.
6.2 Exposures from devices Measurements on a device in normal use, and while editing an online word processing
(Google Docs) document, showed that it had very low duty cycles, and that time average
exposures were much lower than from APs. Maximum time average exposures near
devices can be estimated by multiplying the maximum instantaneous exposure by one of
the duty cycles shown in section 4.3.2, or from the UK data discussed in section 5.2. The
combined effect of exposures from the AP and from a device (or several nearby devices)
can be estimated by adding up the exposure from the AP and the exposure from the
device(s). (Note that the exposure from a device decrease in proportion to the inverse
square of the distance, so exposures 1 m from a device are a quarter of the exposure 50 cm
from it.)
It should be noted that these measurements were made several tens of centimetres away
from a device. If a device is used in contact with the body (for example an iPad on the lap),
the exposure can be estimated by obtaining the SAR of the device from equipment
manuals, and multiplying by the expected duty cycle of the device. The exposure as a
percentage of the limit in NZS 2772.1 can be found by dividing this value by 2 and
converting to a percentage.
6.3 Particular features of the measurements
In School A, there was little change in the six minute average exposures between when
the laptops were in use and not being used (section 4.1.2). In School B, the data in
9 Although not presented in section 4, the maximum exposure averaged over any one minute interval was 0.031% of the reference level.
Exposures to RF fields from WiFi in NZ schools EMF Services report 2014/02
Page 21 of 24
sections 4.2.1 and 4.2.2 shows that the six minute average exposures were generally
around 3 times higher when the devices were active, compared with when they were
inactive or removed. A possible explanation for this is that in School A, the nature of
the laptop activity (editing a Google Docs document) made little difference to the
average exposure, whereas the more intense data transfers during a speed test do
result in a noticeable change. This explanation is supported by the low duty cycle
noted in section 4.3.2 while editing a Google Docs document.
The results presented in section 4.2.1 for the School B classroom show that at most
distances the maximum instantaneous exposure was higher with the devices active
than inactive. Possible explanations for this are:
o The instantaneous exposure measured with the devices active reflects a
genuinely higher exposure, due to the proximity of the active devices, and
shows the exposure due to the nearest device.
o When the devices were inactive the maximum instantaneous exposure is
underestimated due to the sampling nature of the measurements.
o A combination of both explanations.
More detailed data would be needed to better understand this. However, the
possibility that the higher instantaneous exposures are due to exposures from the
laptops adding to the AP exposures can almost certainly be discounted, because WiFi
protocols are designed to minimise the possibility that the AP and a device, or two
devices, would both transmit at the same time.
6.4 Exposures in terms of SAR As discussed in Section 3, SAR is very difficult to measure, and in most situations the
strength of the radio signal is measured instead, and compared to “secondary” reference
levels (reference levels) derived from the fundamental limits on SAR. SAR measurements
are mostly used when assessing exposures from devices which are held very close to the
body (within a few cm), such as mobile phones.
However, data from a recent publication10 allow SAR to be estimated from plane wave
equivalent power flux density measurements such as those made in this survey. This
shows that the maximum six-minute average exposure of 0.024% of the limit is equivalent
to a maximum localised SAR value of 0.00048 W/kg, which is about four thousand times
lower than the limit of 2 W/kg for localised SAR.
6.5 Effect of 5 GHz WiFi The measurement equipment used in this survey does not measure WiFi signals in the
5 GHz frequency band. In School B, a PC-based WiFi detection program indicated that the
AP in the classroom was not operating at 5 GHz. While the APs in School A operated at
both 2.4 and 5 GHz, staff from the company which maintains the network said that all
devices were connecting at 2.4 GHz, and the transmitting power of the AP at 5 GHz was
one tenth of that at 2.4 GHz.
Therefore, assuming that the propagation patterns for the 5 GHz WiFi are similar to those
at 2.4 GHz, WiFi from the access points at 5 GHz might add about 10% to the exposure
values recorded at School A.
10 Bakker et al. Assessment of induced SAR in children exposed to electromagnetic plane waves between 10 MHz and 5.6 GHz. Phys Med Biol 55 (2010), 3115 – 3130.
Exposures to RF fields from WiFi in NZ schools EMF Services report 2014/02
Page 22 of 24
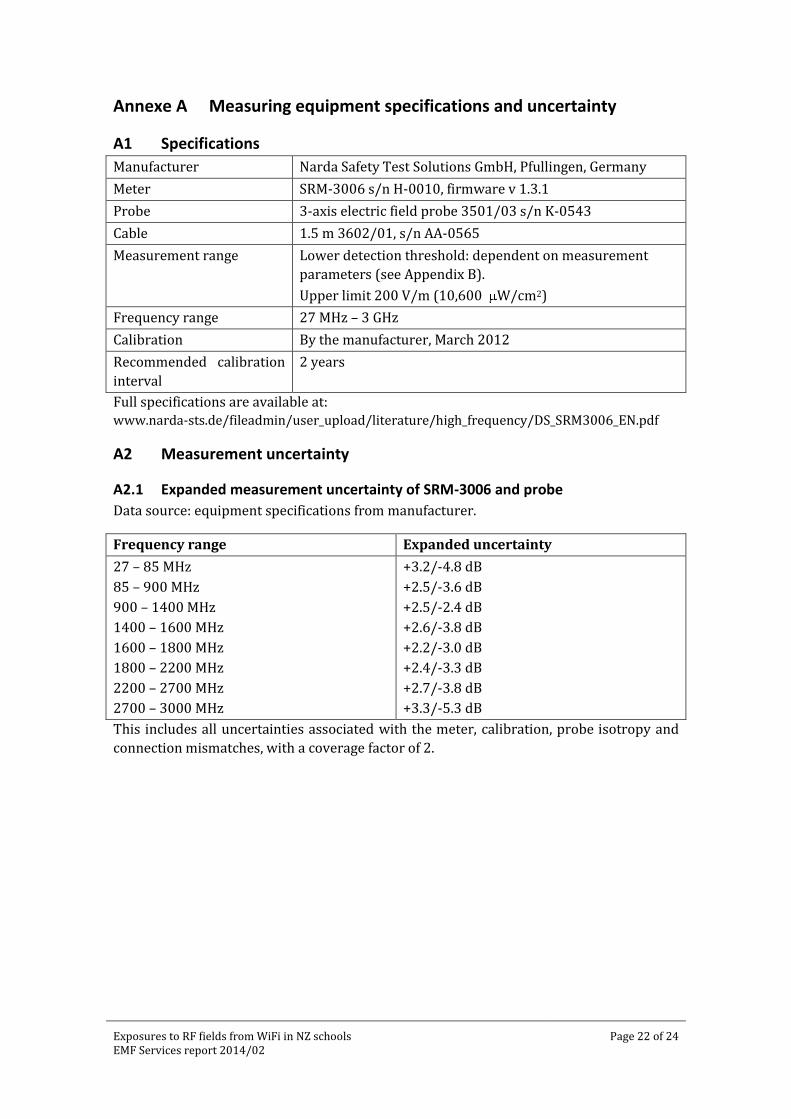
Annexe A Measuring equipment specifications and uncertainty
A1 Specifications
Manufacturer Narda Safety Test Solutions GmbH, Pfullingen, Germany
Meter SRM-3006 s/n H-0010, firmware v 1.3.1
Probe 3-axis electric field probe 3501/03 s/n K-0543
Cable 1.5 m 3602/01, s/n AA-0565
Measurement range Lower detection threshold: dependent on measurement
parameters (see Appendix B).
Upper limit 200 V/m (10,600 W/cm2)
Frequency range 27 MHz – 3 GHz
Calibration By the manufacturer, March 2012
Recommended calibration
interval
2 years
Full specifications are available at: www.narda-sts.de/fileadmin/user_upload/literature/high_frequency/DS_SRM3006_EN.pdf
A2 Measurement uncertainty
A2.1 Expanded measurement uncertainty of SRM-3006 and probe
Data source: equipment specifications from manufacturer.
Frequency range Expanded uncertainty
27 – 85 MHz
85 – 900 MHz
900 – 1400 MHz
1400 – 1600 MHz
1600 – 1800 MHz
1800 – 2200 MHz
2200 – 2700 MHz
2700 – 3000 MHz
+3.2/-4.8 dB
+2.5/-3.6 dB
+2.5/-2.4 dB
+2.6/-3.8 dB
+2.2/-3.0 dB
+2.4/-3.3 dB
+2.7/-3.8 dB
+3.3/-5.3 dB
This includes all uncertainties associated with the meter, calibration, probe isotropy and
connection mismatches, with a coverage factor of 2.

Exposures to RF fields from WiFi in NZ schools EMF Services report 2014/02
Page 23 of 24
A2.2 Expanded measurement uncertainty for this survey
Parameter Uncertainty data source Standard uncertainty u
(dB)
Meter + probe over whole
frequency range of interest
Data sheet (as above) +1.6/-2.4
Position of probe in high
field gradients
NZS 2772.2 recommends
assuming a standard
uncertainty of 0.36 dB
0.36
Sampling uncertainty The SRM measures on a
sampling basis. Simple
simulation of variations in
time-averaged exposures
shows that there would be a
standard deviation of 5% in
six minute averages.
0.21
RF propagation/
environmental clutter
Assume triangular
distribution, 1.5 dB semi-
span
0.61
Combined standard uncertainty +1.76/-2.51
Coverage factor 2
Expanded uncertainty +3.5/-5.0
No allowance has been made for the following potential sources of uncertainty:
Potential source Comment
Signal reflection off
operator
Reflections can produce increases and decreases in measured PFD
over distances of 100 – 250 mm. Operator stood in positions so as to
minimise potential magnitude of reflections, and the probe was
moved around slowly in the area of interest to try and find the
region with the highest reading.
Signal reflections
off movable objects
Some allowance made for the effects of “environmental clutter (eg
people moving around, moving furniture) following example in
NZS 2772.2.
No allowance has been made for the possible overestimation of time average exposures
where the signal is very low.

Exposures to RF fields from WiFi in NZ schools EMF Services report 2014/02
Page 24 of 24
Annexe B SRM-3006 preset frequency band, and settings
B1 Measurements in classrooms
Service table
(preset frequency
band)
Explanation Lower
frequency
(MHz)
Upper
frequency
(MHz)
Detection
threshold*
(nW/cm2)
WiFi All 2.4 GHz WiFi
band
2400 2483 0.71
* For a measurement range of 4 W/cm2
Settings
Measurement range: Mostly 4 W/cm2.
Result type: One minute average, six minute average taken as the
average of six consecutive values recorded every minute
Resolution bandwidth: 500 kHz
B2 Measurements on devices
Service table
(preset frequency
band)
Explanation Lower
frequency
(MHz)
Upper
frequency
(MHz)
Detection
threshold*
(nW/cm2)
WiFi Ch 11 (or
other channel as
appropriate)†
WiFi channel 11 2451 2473 0.047
* For a measurement range of 4 W/cm2
† Other channels and frequency ranges used as appropriate
Settings
Measurement range: Mostly 1 W/cm2.
Result type: One minute average, six minute average taken as the
average of six consecutive values recorded every minute
Resolution bandwidth: 500 kHz
Related Documents