Page 1 of 19 THIS REPORT CONTAINS ASSESSMENTS OF COMMODITY AND TRADE ISSUES MADE BY USDA STAFF AND NOT NECESSARILY STATEMENTS OF OFFICIAL U.S. GOVERNMENT POLICY Date: GAIN Report Number: Approved By: Prepared By: Report Highlights: Hong Kong is Asia’s culinary capital and 4 th largest export market for U.S. consumer-oriented agricultural products. With a dynamic food culture, sophisticated buyers and a world-class logistical infrastructure, Hong Kong is a natural destination to promote high-quality, innovative U.S. food and beverage products. Post: Hong Kong Chris Li, Annie Lai, Caroline Yuen M. Melinda Meador Exporter Guide 2016 Exporter Guide Hong Kong HK1624 12/29/2016 Required Report - public distribution

Welcome message from author
This document is posted to help you gain knowledge. Please leave a comment to let me know what you think about it! Share it to your friends and learn new things together.
Transcript
Page 1 of 19
THIS REPORT CONTAINS ASSESSMENTS OF COMMODITY AND TRADE ISSUES MADE BY
USDA STAFF AND NOT NECESSARILY STATEMENTS OF OFFICIAL U.S. GOVERNMENT
POLICY
Date:
GAIN Report Number:
Approved By:
Prepared By:
Report Highlights:
Hong Kong is Asia’s culinary capital and 4th
largest export market for U.S. consumer-oriented
agricultural products. With a dynamic food culture, sophisticated buyers and a world-class logistical
infrastructure, Hong Kong is a natural destination to promote high-quality, innovative U.S. food and
beverage products.
Post:
Hong Kong
Chris Li, Annie Lai,
Caroline Yuen
M. Melinda Meador
Exporter Guide 2016
Exporter Guide
Hong Kong
HK1624
12/29/2016
Required Report - public distribution
Page 2 of 19
SECTION I. MARKET OVERVIEW
U.S. Food and Beverage Exports to Hong Kong
Total U.S. agricultural exports to Hong Kong reached US$3.8 billion in 2015, making Hong Kong the
4th
largest market, by value, for U.S. consumer-oriented products with exports of US$3.3 billion. U.S.
food-related products are valued as high-quality, safe choices in Hong Kong where imports meet 95%
of local food requirements due to nominal domestic production. Demand is increasing rapidly for
“healthy,” high-quality foods which are market segments where the United States is especially strong.
Top prospects for U.S. food exports to Hong Kong include: beef, pork and poultry meats, fresh fruits,
tree nuts, aquatic products, processed foods and wine.
With the exception of four types of dutiable commodities, namely liquors, tobacco, hydrocarbon oil and
methyl alcohol, food and beverage products are imported to Hong Kong without excise duties.
Hong Kong is a major trading hub where buyers make purchasing decisions for a vast range of
consumer-oriented products that are transshipped to China and other parts of Asia. Most trans-
shipments to Macau are purchased, consolidated, and shipped via Hong Kong.
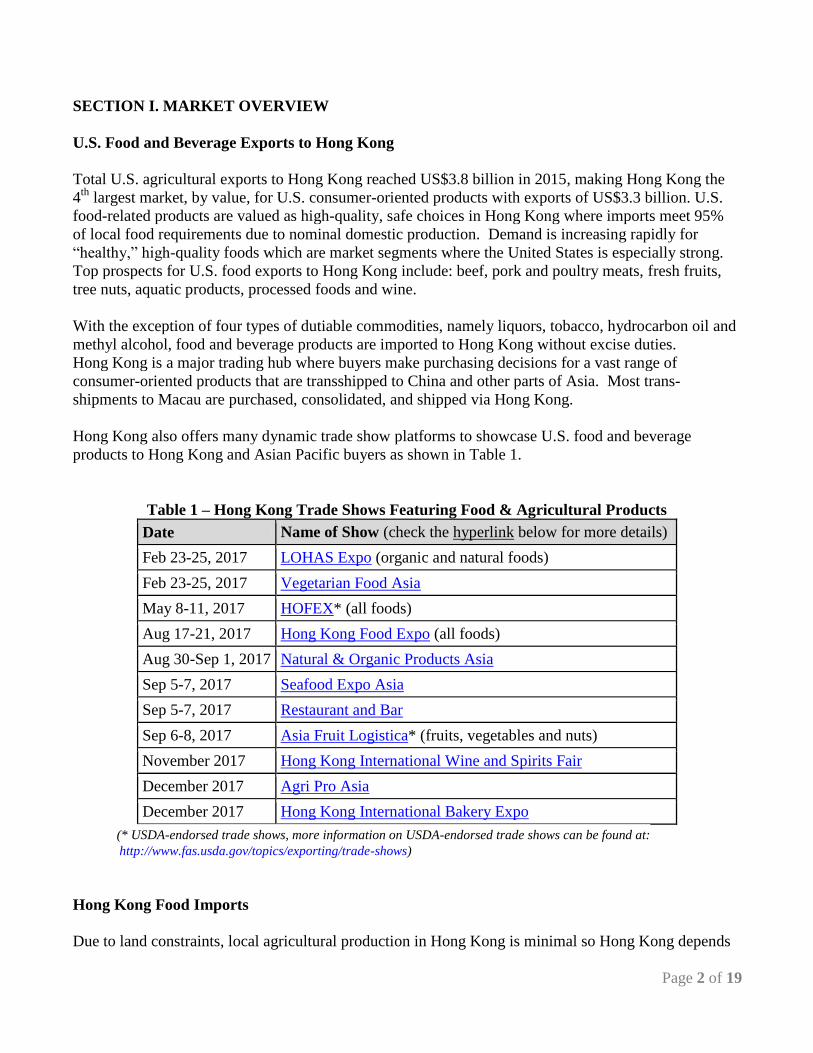
Hong Kong also offers many dynamic trade show platforms to showcase U.S. food and beverage
products to Hong Kong and Asian Pacific buyers as shown in Table 1.
Table 1 – Hong Kong Trade Shows Featuring Food & Agricultural Products
Date Name of Show (check the hyperlink below for more details)
Feb 23-25, 2017 LOHAS Expo (organic and natural foods)
Feb 23-25, 2017 Vegetarian Food Asia
May 8-11, 2017 HOFEX* (all foods)
Aug 17-21, 2017 Hong Kong Food Expo (all foods)
Aug 30-Sep 1, 2017 Natural & Organic Products Asia
Sep 5-7, 2017 Seafood Expo Asia
Sep 5-7, 2017 Restaurant and Bar
Sep 6-8, 2017 Asia Fruit Logistica* (fruits, vegetables and nuts)
November 2017 Hong Kong International Wine and Spirits Fair
December 2017 Agri Pro Asia
December 2017 Hong Kong International Bakery Expo
(* USDA-endorsed trade shows, more information on USDA-endorsed trade shows can be found at:
http://www.fas.usda.gov/topics/exporting/trade-shows)
Hong Kong Food Imports
Due to land constraints, local agricultural production in Hong Kong is minimal so Hong Kong depends
Page 3 of 19
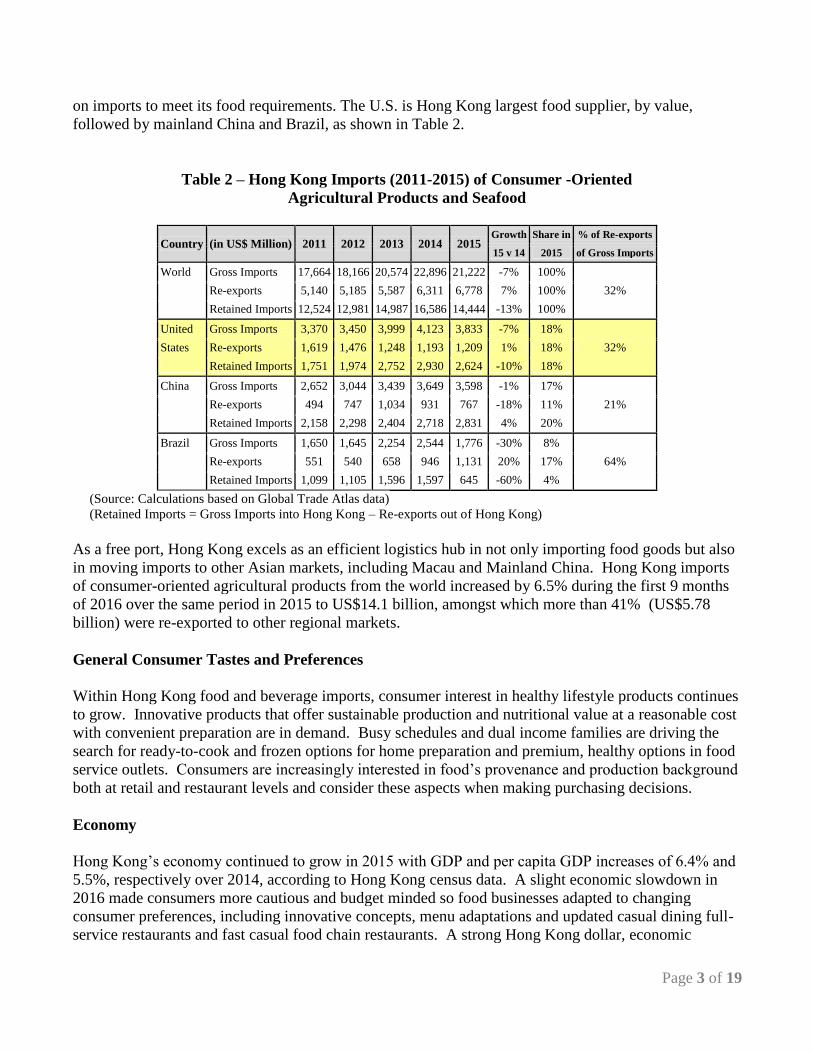
on imports to meet its food requirements. The U.S. is Hong Kong largest food supplier, by value,
followed by mainland China and Brazil, as shown in Table 2.
Table 2 – Hong Kong Imports (2011-2015) of Consumer -Oriented
Agricultural Products and Seafood
Country (in US$ Million) 2011 2012 2013 2014 2015 Growth Share in % of Re-exports
15 v 14 2015 of Gross Imports
World Gross Imports 17,664 18,166 20,574 22,896 21,222 -7% 100%
Re-exports 5,140 5,185 5,587 6,311 6,778 7% 100% 32%
Retained Imports 12,524 12,981 14,987 16,586 14,444 -13% 100%
United Gross Imports 3,370 3,450 3,999 4,123 3,833 -7% 18%
States Re-exports 1,619 1,476 1,248 1,193 1,209 1% 18% 32%
Retained Imports 1,751 1,974 2,752 2,930 2,624 -10% 18%
China Gross Imports 2,652 3,044 3,439 3,649 3,598 -1% 17%
Re-exports 494 747 1,034 931 767 -18% 11% 21%
Retained Imports 2,158 2,298 2,404 2,718 2,831 4% 20%
Brazil Gross Imports 1,650 1,645 2,254 2,544 1,776 -30% 8%
Re-exports 551 540 658 946 1,131 20% 17% 64%
Retained Imports 1,099 1,105 1,596 1,597 645 -60% 4%
(Source: Calculations based on Global Trade Atlas data)
(Retained Imports = Gross Imports into Hong Kong – Re-exports out of Hong Kong)
As a free port, Hong Kong excels as an efficient logistics hub in not only importing food goods but also
in moving imports to other Asian markets, including Macau and Mainland China. Hong Kong imports
of consumer-oriented agricultural products from the world increased by 6.5% during the first 9 months
of 2016 over the same period in 2015 to US$14.1 billion, amongst which more than 41% (US$5.78
billion) were re-exported to other regional markets.
General Consumer Tastes and Preferences
Within Hong Kong food and beverage imports, consumer interest in healthy lifestyle products continues
to grow. Innovative products that offer sustainable production and nutritional value at a reasonable cost
with convenient preparation are in demand. Busy schedules and dual income families are driving the
search for ready-to-cook and frozen options for home preparation and premium, healthy options in food
service outlets. Consumers are increasingly interested in food’s provenance and production background
both at retail and restaurant levels and consider these aspects when making purchasing decisions.
Economy
Hong Kong’s economy continued to grow in 2015 with GDP and per capita GDP increases of 6.4% and
5.5%, respectively over 2014, according to Hong Kong census data. A slight economic slowdown in
2016 made consumers more cautious and budget minded so food businesses adapted to changing
consumer preferences, including innovative concepts, menu adaptations and updated casual dining full-
service restaurants and fast casual food chain restaurants. A strong Hong Kong dollar, economic
Page 4 of 19
uncertainty and higher menu prices could stifle expected growth in 2017.
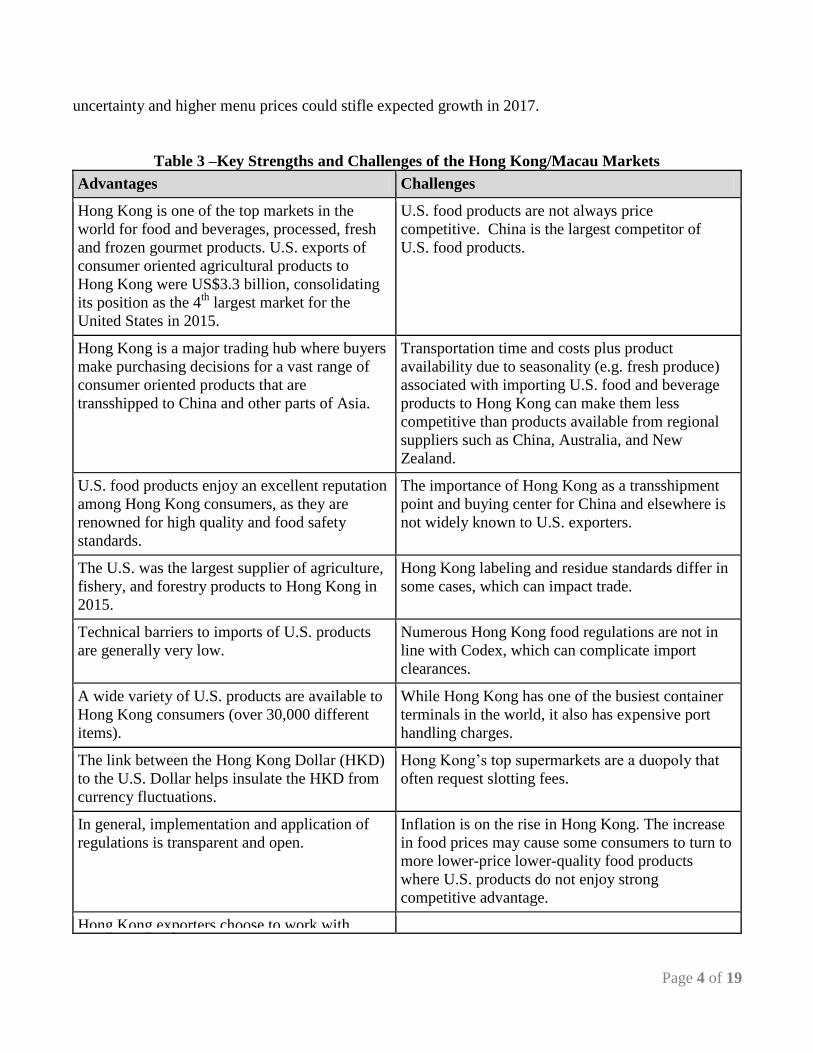
Table 3 –Key Strengths and Challenges of the Hong Kong/Macau Markets
Advantages Challenges
Hong Kong is one of the top markets in the
world for food and beverages, processed, fresh
and frozen gourmet products. U.S. exports of
consumer oriented agricultural products to
Hong Kong were US$3.3 billion, consolidating
its position as the 4th
largest market for the
United States in 2015.
U.S. food products are not always price
competitive. China is the largest competitor of
U.S. food products.
Hong Kong is a major trading hub where buyers
make purchasing decisions for a vast range of
consumer oriented products that are
transshipped to China and other parts of Asia.
Transportation time and costs plus product
availability due to seasonality (e.g. fresh produce)
associated with importing U.S. food and beverage
products to Hong Kong can make them less
competitive than products available from regional
suppliers such as China, Australia, and New
Zealand.
U.S. food products enjoy an excellent reputation
among Hong Kong consumers, as they are
renowned for high quality and food safety
standards.
The importance of Hong Kong as a transshipment
point and buying center for China and elsewhere is
not widely known to U.S. exporters.
The U.S. was the largest supplier of agriculture,
fishery, and forestry products to Hong Kong in
2015.
Hong Kong labeling and residue standards differ in
some cases, which can impact trade.
Technical barriers to imports of U.S. products
are generally very low.
Numerous Hong Kong food regulations are not in
line with Codex, which can complicate import
clearances.
A wide variety of U.S. products are available to
Hong Kong consumers (over 30,000 different
items).
While Hong Kong has one of the busiest container
terminals in the world, it also has expensive port
handling charges.
The link between the Hong Kong Dollar (HKD)
to the U.S. Dollar helps insulate the HKD from
currency fluctuations.
Hong Kong’s top supermarkets are a duopoly that
often request slotting fees.
In general, implementation and application of
regulations is transparent and open.
Inflation is on the rise in Hong Kong. The increase
in food prices may cause some consumers to turn to
more lower-price lower-quality food products
where U.S. products do not enjoy strong
competitive advantage.
Hong Kong exporters choose to work with
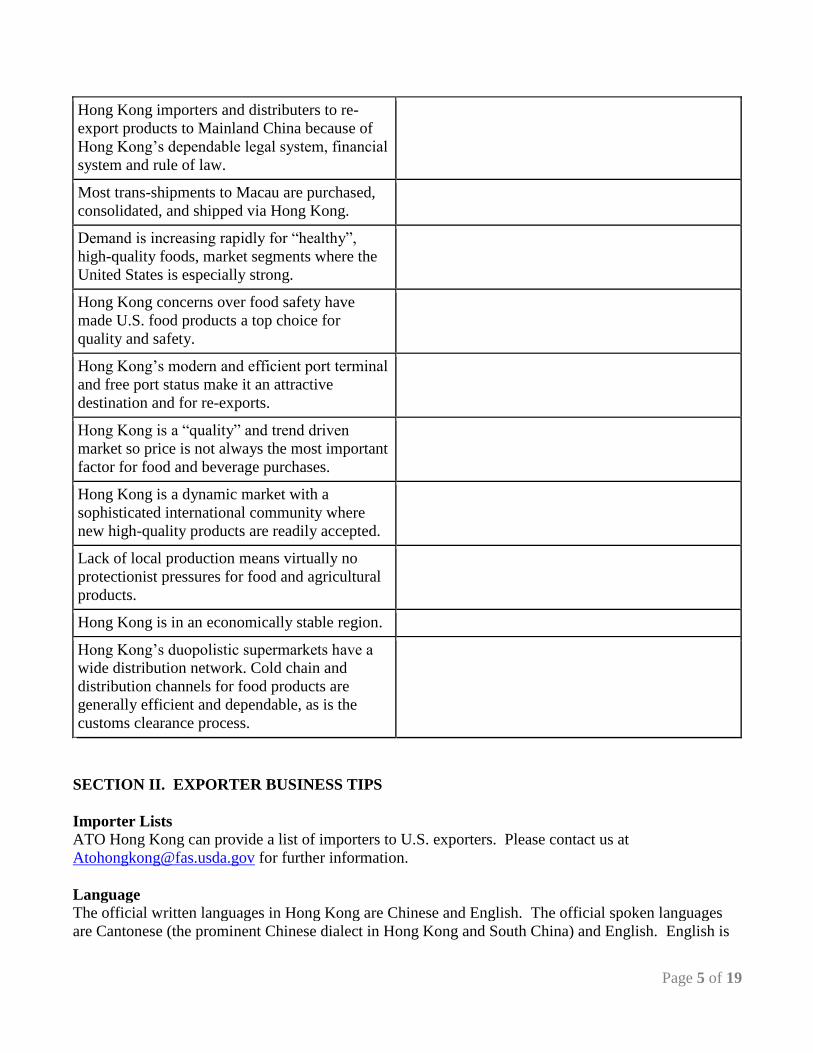
Page 5 of 19
Hong Kong importers and distributers to re-
export products to Mainland China because of
Hong Kong’s dependable legal system, financial
system and rule of law.
Most trans-shipments to Macau are purchased,
consolidated, and shipped via Hong Kong.
Demand is increasing rapidly for “healthy”,
high-quality foods, market segments where the
United States is especially strong.
Hong Kong concerns over food safety have
made U.S. food products a top choice for
quality and safety.
Hong Kong’s modern and efficient port terminal
and free port status make it an attractive
destination and for re-exports.
Hong Kong is a “quality” and trend driven
market so price is not always the most important
factor for food and beverage purchases.
Hong Kong is a dynamic market with a
sophisticated international community where
new high-quality products are readily accepted.
Lack of local production means virtually no
protectionist pressures for food and agricultural
products.
Hong Kong is in an economically stable region.
Hong Kong’s duopolistic supermarkets have a
wide distribution network. Cold chain and
distribution channels for food products are
generally efficient and dependable, as is the
customs clearance process.
SECTION II. EXPORTER BUSINESS TIPS
Importer Lists ATO Hong Kong can provide a list of importers to U.S. exporters. Please contact us at
[email protected] for further information.
Language The official written languages in Hong Kong are Chinese and English. The official spoken languages
are Cantonese (the prominent Chinese dialect in Hong Kong and South China) and English. English is
Page 6 of 19
commonly used in business transactions.
Travel Visa Hong Kong is a Special Administrative Region of Mainland China with a distinct customs and
immigration border separate from China. U.S. passport holders do not need a visa to enter Hong Kong
but do need a visa to enter Mainland China.
Legal System Under the principle of “one country, two systems,” Hong Kong’s legal system, which is different from
that of Mainland China, is based on the common law, supplemented by written laws and an independent
judiciary.
Payment Hong Kong importers accept letters of credit but after a trading relationship is established they may seek
to obtain payment by open account to reduce transaction costs.
Import Regulations
Duties With the exception of four types of dutiable commodities, namely liquors, tobacco, hydrocarbon oil and
methyl alcohol, food and beverage products are imported to Hong Kong without excise duties.
Certificates & Permits Technical requirements for imports vary significantly according to the product. Products that require
import permits/health certificates include egg, meat, aquatic, milk and frozen confections. Local
importers are required to apply for import permits. U.S. exporters should supply their agents/importers
with any necessary documentation, such as health certificates, issued by the U.S. government.
Labeling All prepackaged food products offered for sale in Hong Kong must comply with Hong Kong’s labeling
regulations including requirements for allergens and nutrients. Should a U.S. label fail to meet Hong
Kong labeling requirements, stick-on food labels at import are allowed and can be arranged by Hong
Kong importers with the permission of the manufacturer.
The marking or labeling of prepackaged food can be in either English or Chinese language or in both
languages. If both languages are used in the marking and labeling of prepackaged food, the name of the
food, ingredient lists and nutrition information must be provided in both languages.
Labeling for Biotech Food The Hong Kong Government does not have specific regulations regarding the labeling of biotech
ingredients in food products. Nevertheless, the Government continues to promote voluntary labeling of
any biotech ingredient of 5 percent or more under guidelines issued in 2006 that are advisory in nature
and have no legal effect. Negative labeling is not recommended.
Organic Certification While the Hong Kong Organic Center provides organic certification for local production, Hong Kong
Page 7 of 19
does not have a law regulating organic food products. U.S. organic products may be sold in Hong Kong
with the USDA organic logo without further certification
SECTION III. MARKET SECTOR STRUCTURE AND TRENDS
Among the three major market sectors of Hong Kong: the retail and HRI (hotel, restaurant and
institutional) sectors present the best opportunity for U.S. exporters. The food processing sector in
Hong Kong is relatively small and presents minimal opportunity for market development.
Food Retail
Traditional Markets
Traditional street (wet) markets are popular for daily shopping for fresh grocery products in Hong
Kong. Some, but not all, stalls in wet markets have freezers and chilling equipment to maintain food
quality. U.S. food exporters usually need to work with local importers/agents to place products in
traditional markets.
Modern Outlets
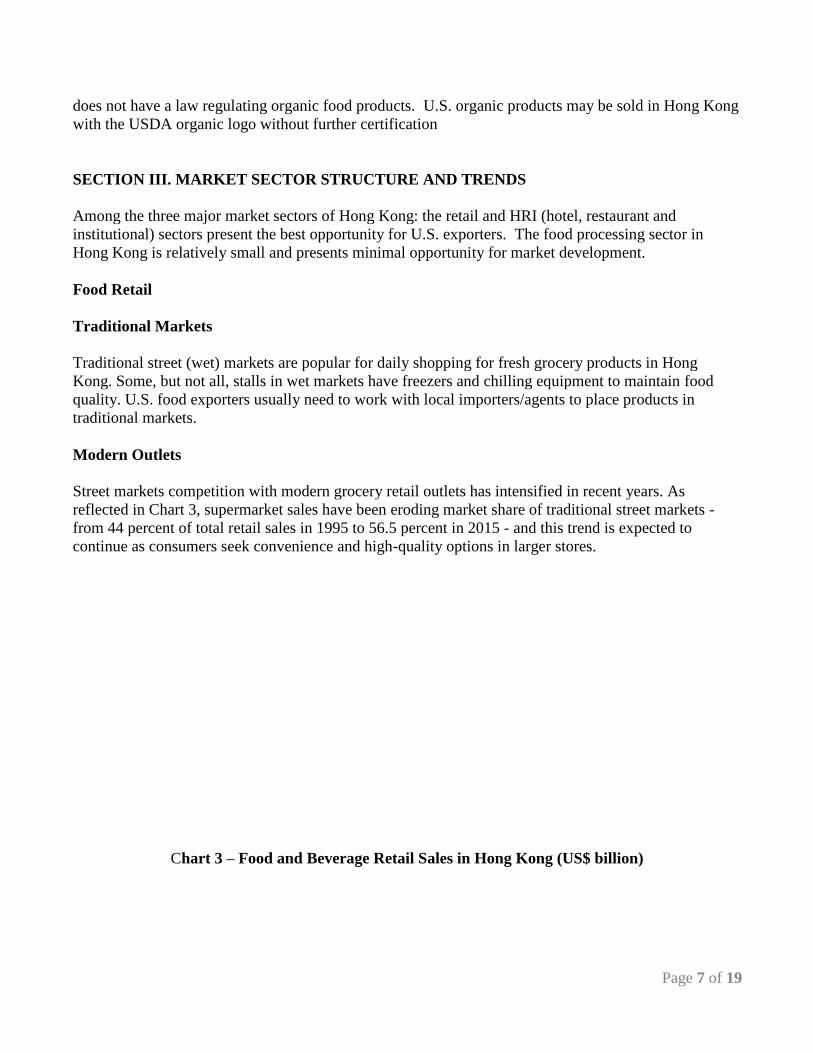
Street markets competition with modern grocery retail outlets has intensified in recent years. As
reflected in Chart 3, supermarket sales have been eroding market share of traditional street markets -
from 44 percent of total retail sales in 1995 to 56.5 percent in 2015 - and this trend is expected to
continue as consumers seek convenience and high-quality options in larger stores.
Chart 3 – Food and Beverage Retail Sales in Hong Kong (US$ billion)
Page 8 of 19
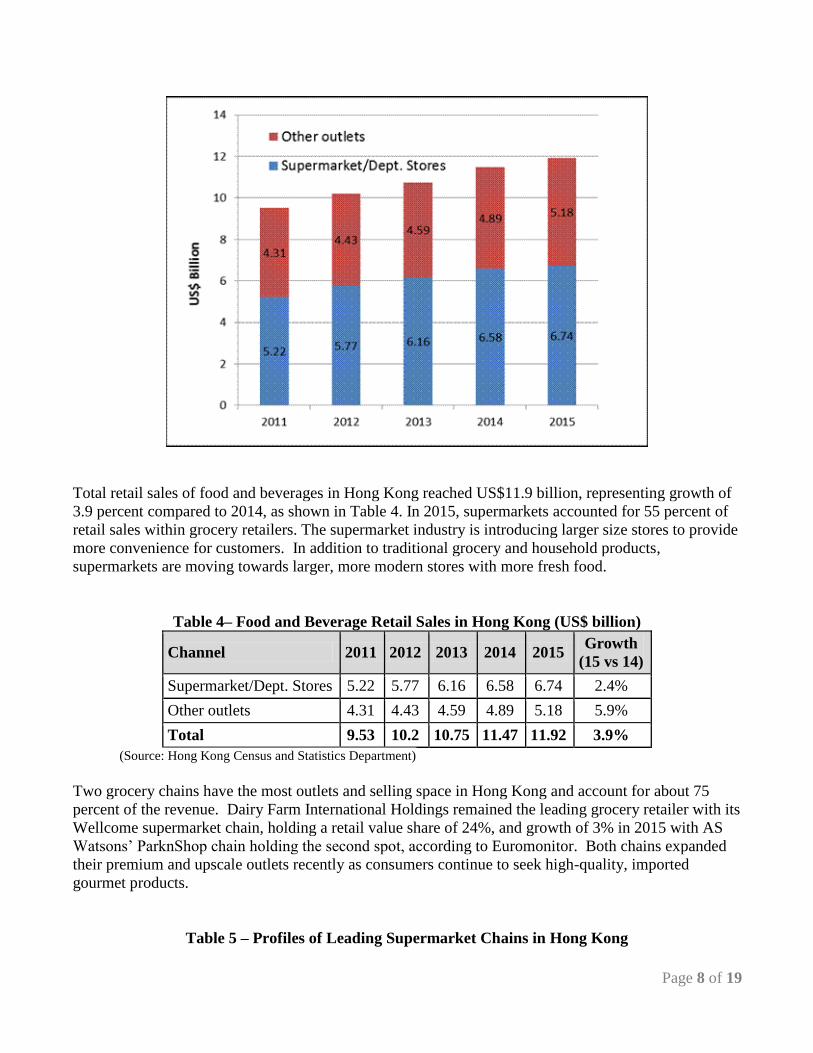
Total retail sales of food and beverages in Hong Kong reached US$11.9 billion, representing growth of
3.9 percent compared to 2014, as shown in Table 4. In 2015, supermarkets accounted for 55 percent of
retail sales within grocery retailers. The supermarket industry is introducing larger size stores to provide
more convenience for customers. In addition to traditional grocery and household products,
supermarkets are moving towards larger, more modern stores with more fresh food.
Table 4– Food and Beverage Retail Sales in Hong Kong (US$ billion)
Channel 2011 2012 2013 2014 2015 Growth
(15 vs 14)
Supermarket/Dept. Stores 5.22 5.77 6.16 6.58 6.74 2.4%
Other outlets 4.31 4.43 4.59 4.89 5.18 5.9%
Total 9.53 10.2 10.75 11.47 11.92 3.9%
(Source: Hong Kong Census and Statistics Department)
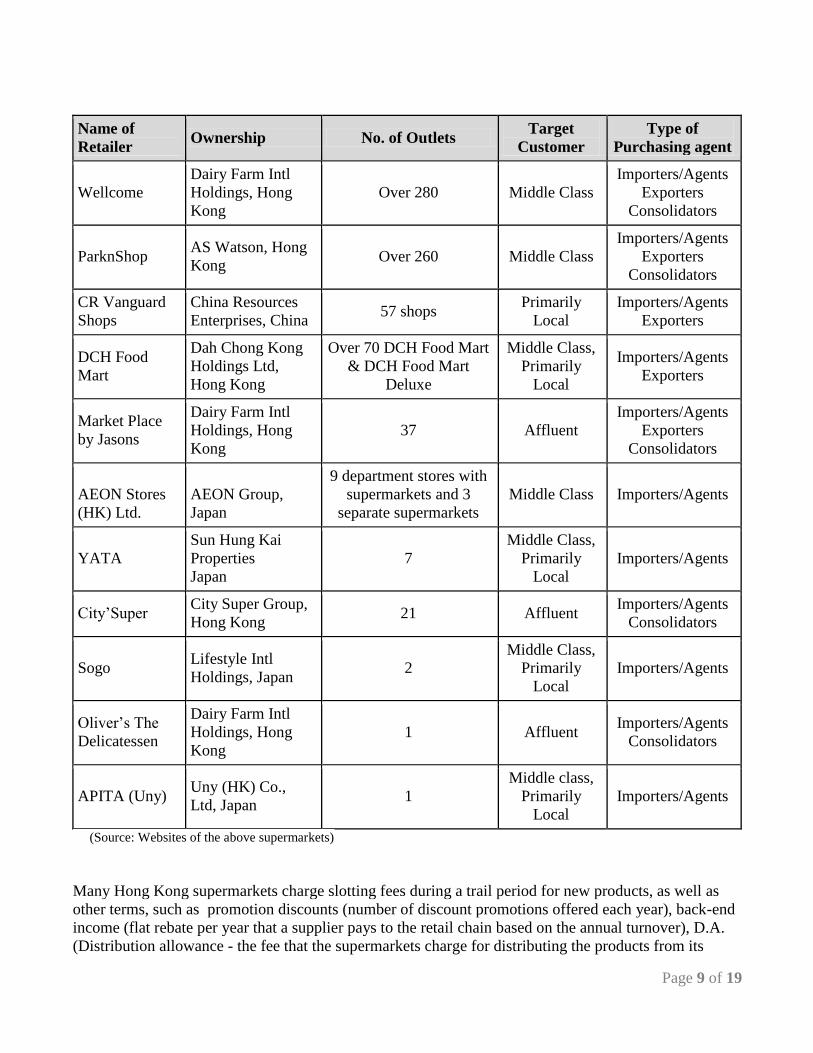
Two grocery chains have the most outlets and selling space in Hong Kong and account for about 75
percent of the revenue. Dairy Farm International Holdings remained the leading grocery retailer with its
Wellcome supermarket chain, holding a retail value share of 24%, and growth of 3% in 2015 with AS
Watsons’ ParknShop chain holding the second spot, according to Euromonitor. Both chains expanded
their premium and upscale outlets recently as consumers continue to seek high-quality, imported
gourmet products.
Table 5 – Profiles of Leading Supermarket Chains in Hong Kong
Page 9 of 19
Name of
Retailer Ownership No. of Outlets
Target
Customer
Type of
Purchasing agent
Wellcome
Dairy Farm Intl
Holdings, Hong
Kong
Over 280 Middle Class
Importers/Agents
Exporters
Consolidators
ParknShop AS Watson, Hong
Kong Over 260 Middle Class
Importers/Agents
Exporters
Consolidators
CR Vanguard
Shops
China Resources
Enterprises, China 57 shops
Primarily
Local
Importers/Agents
Exporters
DCH Food
Mart
Dah Chong Kong
Holdings Ltd,
Hong Kong
Over 70 DCH Food Mart
& DCH Food Mart
Deluxe
Middle Class,
Primarily
Local
Importers/Agents
Exporters
Market Place
by Jasons
Dairy Farm Intl
Holdings, Hong
Kong
37 Affluent
Importers/Agents
Exporters
Consolidators
AEON Stores
(HK) Ltd.
AEON Group,
Japan
9 department stores with
supermarkets and 3
separate supermarkets
Middle Class Importers/Agents
YATA
Sun Hung Kai
Properties
Japan
7
Middle Class,
Primarily
Local
Importers/Agents
City’Super City Super Group,
Hong Kong 21 Affluent
Importers/Agents
Consolidators
Sogo Lifestyle Intl
Holdings, Japan 2
Middle Class,
Primarily
Local
Importers/Agents
Oliver’s The
Delicatessen
Dairy Farm Intl
Holdings, Hong
Kong
1 Affluent Importers/Agents
Consolidators
APITA (Uny) Uny (HK) Co.,
Ltd, Japan 1
Middle class,
Primarily
Local
Importers/Agents
(Source: Websites of the above supermarkets)
Many Hong Kong supermarkets charge slotting fees during a trail period for new products, as well as
other terms, such as promotion discounts (number of discount promotions offered each year), back-end
income (flat rebate per year that a supplier pays to the retail chain based on the annual turnover), D.A.
(Distribution allowance - the fee that the supermarkets charge for distributing the products from its
Page 10 of 19
warehouse to its many branch stores), and incentive rebates (a percentage of turnover rebated to the
supermarkets when sales exceed an agreed amount. For general reference, about 15% of the annual
turnover is rebated to the major supermarkets and 8% to smaller ones).
Supermarkets may import direct from the U.S. supplier or may use consolidators, depending on the
product and minimum order quantity, to source new products from the U.S. Most major supermarkets
like ParknShop and Wellcome offer online grocery shopping platforms that are increasingly appealing
to busy Hong Kong shoppers with discounts and delivery services.
To enter the grocery retail market sector, several approaches are possible:
Establishing a representative office in Hong Kong: A good method to build trade relationships
but rents and operating expenses can be costly.
Working with U.S. Consolidators: Method to supply less than minimum order quantities to
importers and retail markets.
Developing a relationship with a Hong Kong Agent: Well-established companies have extensive
distribution networks not limited to one or two supermarkets.
Exporting Direct to Supermarkets: Branded products that sell direct to supermarkets may be
required to provide exclusive sales rights for the products in Hong Kong. In this case, expensive
slotting fees may be waived. For non-branded and large turnover products such as fruit, meat,
and vegetables, supermarkets tend to buy direct from overseas exporters for cost savings.
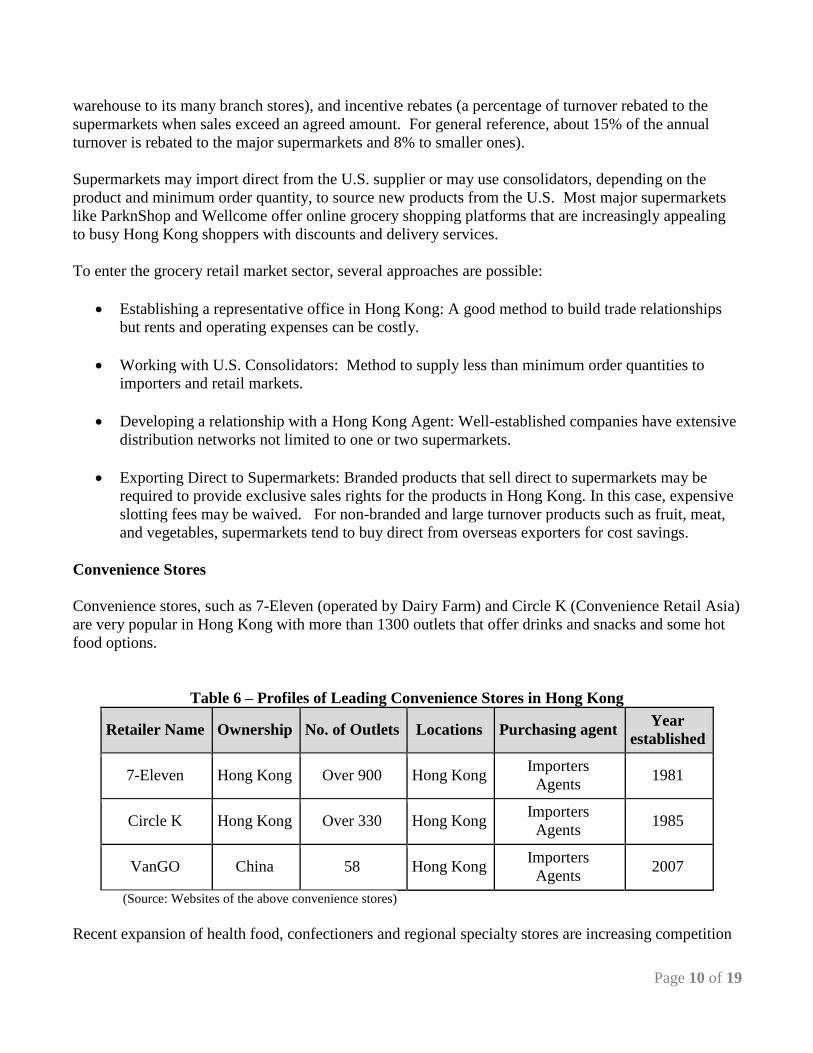
Convenience Stores
Convenience stores, such as 7-Eleven (operated by Dairy Farm) and Circle K (Convenience Retail Asia)
are very popular in Hong Kong with more than 1300 outlets that offer drinks and snacks and some hot
food options.
Table 6 – Profiles of Leading Convenience Stores in Hong Kong
Retailer Name Ownership No. of Outlets Locations Purchasing agent Year
established
7-Eleven Hong Kong Over 900 Hong Kong Importers
Agents 1981
Circle K Hong Kong Over 330 Hong Kong Importers
Agents 1985
VanGO China 58 Hong Kong Importers
Agents 2007
(Source: Websites of the above convenience stores)
Recent expansion of health food, confectioners and regional specialty stores are increasing competition
Page 11 of 19
for traditional convenience stores. For example, “759 Store” started in 2010 with small stores selling
pre-packaged products, particularly snacks. The chain has now expanded to over 260 outlets including
some larger-sized stores selling more food items including frozen foods, baby foods and other groceries.
To place products in convenience stores, U.S. exporters would usually need to work through such a
local distributor since this is the most common supply source for convenience stores.
Hotel, Restaurant and Institutional (HRI)
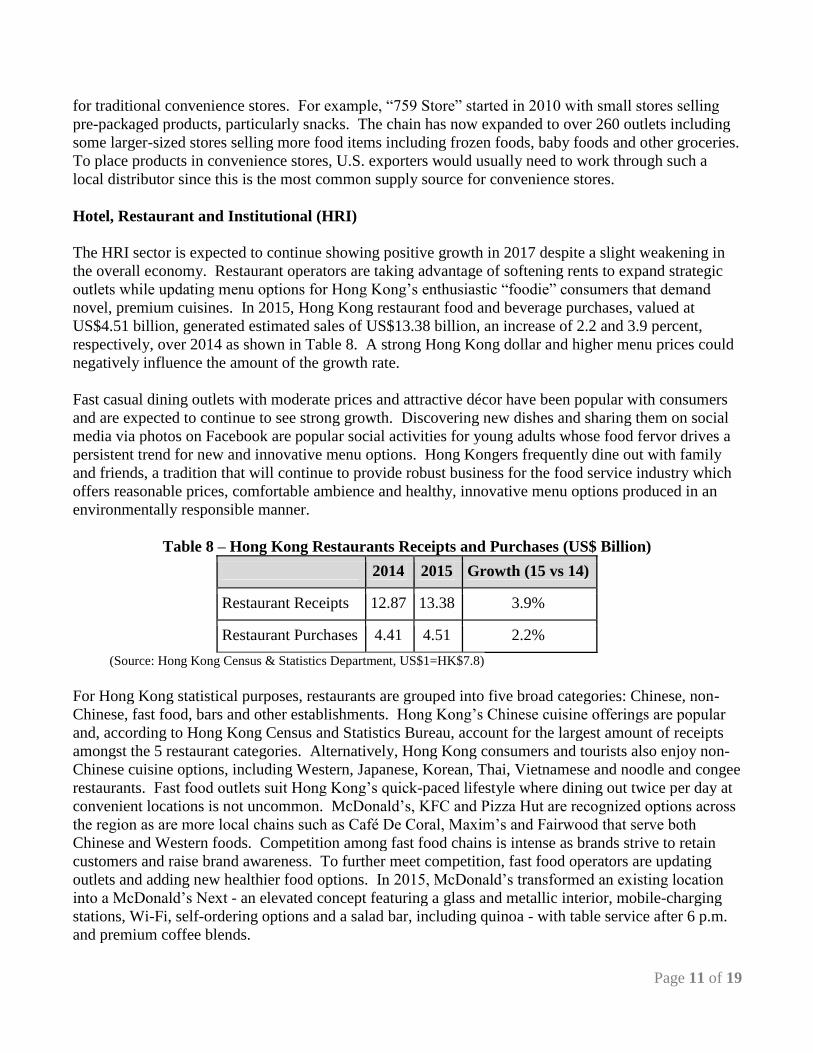
The HRI sector is expected to continue showing positive growth in 2017 despite a slight weakening in
the overall economy. Restaurant operators are taking advantage of softening rents to expand strategic
outlets while updating menu options for Hong Kong’s enthusiastic “foodie” consumers that demand
novel, premium cuisines. In 2015, Hong Kong restaurant food and beverage purchases, valued at
US$4.51 billion, generated estimated sales of US$13.38 billion, an increase of 2.2 and 3.9 percent,
respectively, over 2014 as shown in Table 8. A strong Hong Kong dollar and higher menu prices could
negatively influence the amount of the growth rate.
Fast casual dining outlets with moderate prices and attractive décor have been popular with consumers
and are expected to continue to see strong growth. Discovering new dishes and sharing them on social
media via photos on Facebook are popular social activities for young adults whose food fervor drives a
persistent trend for new and innovative menu options. Hong Kongers frequently dine out with family
and friends, a tradition that will continue to provide robust business for the food service industry which
offers reasonable prices, comfortable ambience and healthy, innovative menu options produced in an
environmentally responsible manner.
Table 8 – Hong Kong Restaurants Receipts and Purchases (US$ Billion)
2014 2015 Growth (15 vs 14)
Restaurant Receipts 12.87 13.38 3.9%
Restaurant Purchases 4.41 4.51 2.2%
(Source: Hong Kong Census & Statistics Department, US$1=HK$7.8)
For Hong Kong statistical purposes, restaurants are grouped into five broad categories: Chinese, non-
Chinese, fast food, bars and other establishments. Hong Kong’s Chinese cuisine offerings are popular
and, according to Hong Kong Census and Statistics Bureau, account for the largest amount of receipts
amongst the 5 restaurant categories. Alternatively, Hong Kong consumers and tourists also enjoy non-
Chinese cuisine options, including Western, Japanese, Korean, Thai, Vietnamese and noodle and congee
restaurants. Fast food outlets suit Hong Kong’s quick-paced lifestyle where dining out twice per day at
convenient locations is not uncommon. McDonald’s, KFC and Pizza Hut are recognized options across
the region as are more local chains such as Café De Coral, Maxim’s and Fairwood that serve both
Chinese and Western foods. Competition among fast food chains is intense as brands strive to retain
customers and raise brand awareness. To further meet competition, fast food operators are updating
outlets and adding new healthier food options. In 2015, McDonald’s transformed an existing location
into a McDonald’s Next - an elevated concept featuring a glass and metallic interior, mobile-charging
stations, Wi-Fi, self-ordering options and a salad bar, including quinoa - with table service after 6 p.m.
and premium coffee blends.
Page 12 of 19
Hong Kong’s vibrant nightlife is renowned and is served by more than 1,000 bars, pubs and other eating
and drinking establishments across Hong Kong. Although tea holds a traditional preference in Asia, the
Asian coffee market has grown an average 4% per annum since 2000, according to statistics provided
by the organizer of the largest food trade show in Hong Kong (“HOFEX”) and Hong Kong consumers
continue to drive an increase in food service coffee demand.
Institutional Catering
Hong Kong is located less than five flying hours from half of the world’s population so its airport is
very busy. Connected to over 190 destinations, the Hong Kong airport handled 68.5 million passengers
in 2015 and its catering facilities provided over 15,000 meals each day for plane passengers. Given the
competition among airlines, airlines have an increasingly high standard for the meals provided to their
clients. Some partner with five-star hotels or famous restauranteurs to design menus for business class
and first class passengers.
In addition, Hong Kong has raised its profile as a cruise hub with the development of the Kai Tak
Cruise Terminal – the former site of the city’s urban airport in Kowloon - that can accommodate the
largest ships in the cruise industry. The increasing number of calls of luxury cruises to Hong Kong
bodes well for the demand for fine dining needs both on cruises and the city. To provide products to the
institutional market in Hong Kong, U.S. exporters would commonly work with local importers to
explore potential business opportunities and distribution networks.
Trends in Promotional/Marketing Strategies and Tactics
Identify key players for the products - ATO Hong Kong can provide lists of importers,
distributors, commodity cooperators and regional business groups.
Test marketing may be required prior to establishing a presence in the market.
Communicate product benefits to end-users - although distributors maintain relationships with
their customers, end users assert influence over the buying decisions, it is important to directly
educate all stakeholders as to the features and benefits of your products.
Participate in or visit trade shows – Hong Kong has an excellent reputation for hosting
international trade shows. In cooperation with cooperators and regional groups, the shows will
demonstrate the versatility and safety of U.S. food products.
Stage menu promotions with major restaurant chains - Menu promotion dollars will be
maximized if spent on promotion events held with the major restaurant chains. With the
restaurant chains’ announced intention to have an image overhaul, this provides for an
opportunity to introduce new U.S. foods.
Invite restaurant owners/chefs to seminars and/or to the U.S. - ATO Hong Kong/ cooperators
organize seminars and trade missions to the U.S. with an intention to introduce U.S. products,
meet U.S. exporters, and share with them food service operations in the U.S.
Page 13 of 19
Food Processing
The food processing industry in Hong Kong is small compared to food retail and HRI sectors. The total
output of the local food processing industry is estimated below US$1 billion. Major local production
includes instant noodles, macaroni, spaghetti, biscuits, pastries and cakes for both domestic
consumption and export. Other significant sectors include canning, preserving and processing of
seafood (such as fish, shrimp, prawns, and crustaceans); manufacture of dairy products (fresh milk,
yogurt and ice cream); seasoning and spirits.
Based on the trade agreement between Hong Kong and China (called Closer Economic Partnership
Arrangement, or CEPA in short), all foods and beverages made in Hong Kong, subject to the CEPA's
rules of origin, can enjoy duty-free access to the Chinese mainland. Non-Hong Kong made processed
food and beverages products remain subject to rates according to China’s tariff schedule.
The CEPA zero tariff product list includes aqua–marine products, food and beverages, (certain dairy
products such as yogurt and cheese, certain prepared meats, certain sugar confectioneries and cocoa
preparations; certain preserved meats and seafood, bread, biscuits and cakes; preserved vegetables and
fruits, fruit juices; sauces, water, etc.) and leather and fur products.
Processed food and beverages items must comply with Hong Kong rules of origin in order to be
imported to China tariff free. The rule of origin of individual products is basically determined by the
manufacturing or processing operation. For example, milk and cream products are considered as “made
in Hong Kong” only when the manufacturing processes of mixing, freezing sterilization and cooling are
conducted in Hong Kong. The origin criteria for nuts is that the baking, seasoning, and/coating must
take place in Hong Kong. In the case of ginseng, the principal manufacturing processes of cutting and
grinding must be conducted in Hong Kong. More information on CEPA can be found at:
http://www.tid.gov.hk/english/cepa/ .
Food ingredients are sourced both through direct import by food processors and through consolidators.
Hong Kong traders and end-users tend to stay with suppliers with whom they have a relationship.
While exporters would do well exploring all channels, patience and understanding are required to
establish a relationship of trust sometimes before trading can commence.
SECTION IV. BEST CONSUMER ORIENTED PRODUCT PROSPECTS
Notes :
95% of Hong Kong food supplies are imported. Since Hong Kong’s domestic production is
nominal the market size in the following table is equal to retained imports without taking into
account local production. U.S. exports to Hong Kong are also based on imports minus exports.
Page 14 of 19
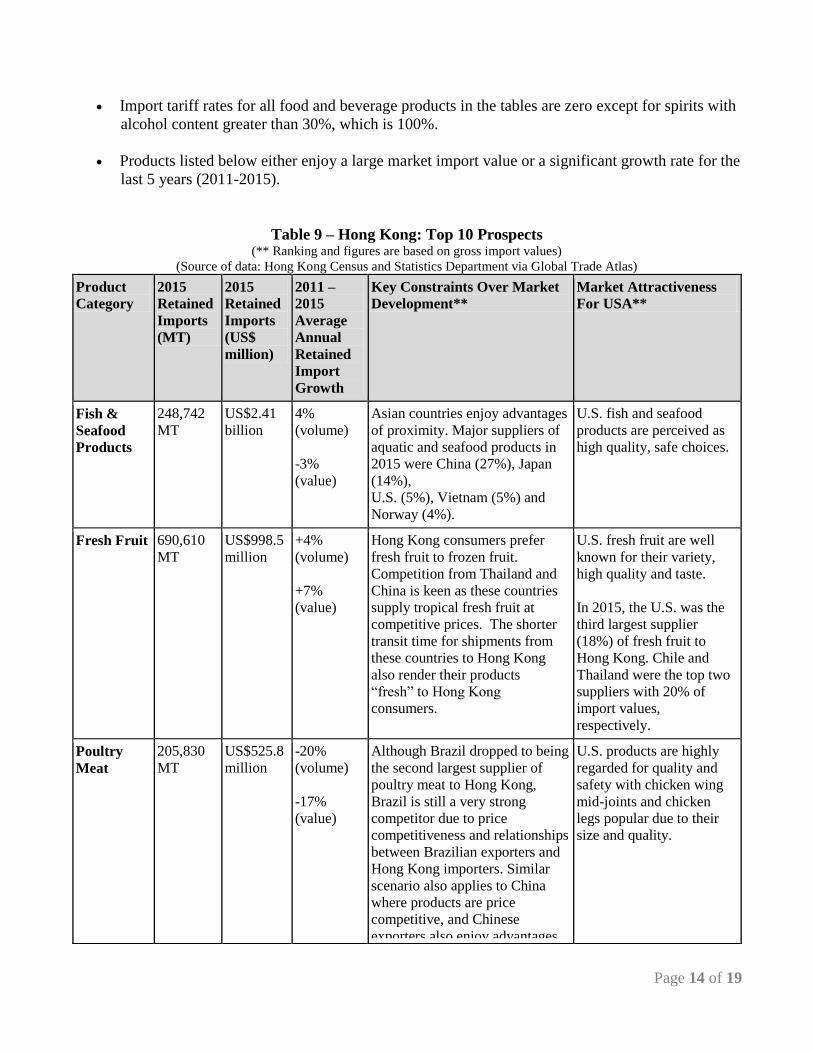
Import tariff rates for all food and beverage products in the tables are zero except for spirits with
alcohol content greater than 30%, which is 100%.
Products listed below either enjoy a large market import value or a significant growth rate for the
last 5 years (2011-2015).
Table 9 – Hong Kong: Top 10 Prospects (** Ranking and figures are based on gross import values)
(Source of data: Hong Kong Census and Statistics Department via Global Trade Atlas)
Product
Category
2015
Retained
Imports
(MT)
2015
Retained
Imports
(US$
million)
2011 –
2015
Average
Annual
Retained
Import
Growth
Key Constraints Over Market
Development**
Market Attractiveness
For USA**
Fish &
Seafood
Products
248,742
MT
US$2.41
billion
4%
(volume)
-3%
(value)
Asian countries enjoy advantages
of proximity. Major suppliers of
aquatic and seafood products in
2015 were China (27%), Japan
(14%),
U.S. (5%), Vietnam (5%) and
Norway (4%).
U.S. fish and seafood
products are perceived as
high quality, safe choices.
Fresh Fruit 690,610
MT
US$998.5
million
+4%
(volume)
+7%
(value)
Hong Kong consumers prefer
fresh fruit to frozen fruit.
Competition from Thailand and
China is keen as these countries
supply tropical fresh fruit at
competitive prices. The shorter
transit time for shipments from
these countries to Hong Kong
also render their products
“fresh” to Hong Kong
consumers.
U.S. fresh fruit are well
known for their variety,
high quality and taste.
In 2015, the U.S. was the
third largest supplier
(18%) of fresh fruit to
Hong Kong. Chile and
Thailand were the top two
suppliers with 20% of
import values,
respectively.
Poultry
Meat
205,830
MT
US$525.8
million
-20%
(volume)
-17%
(value)
Although Brazil dropped to being
the second largest supplier of
poultry meat to Hong Kong,
Brazil is still a very strong
competitor due to price
competitiveness and relationships
between Brazilian exporters and
Hong Kong importers. Similar
scenario also applies to China
where products are price
competitive, and Chinese
exporters also enjoy advantages
U.S. products are highly
regarded for quality and
safety with chicken wing
mid-joints and chicken
legs popular due to their
size and quality.
Page 15 of 19
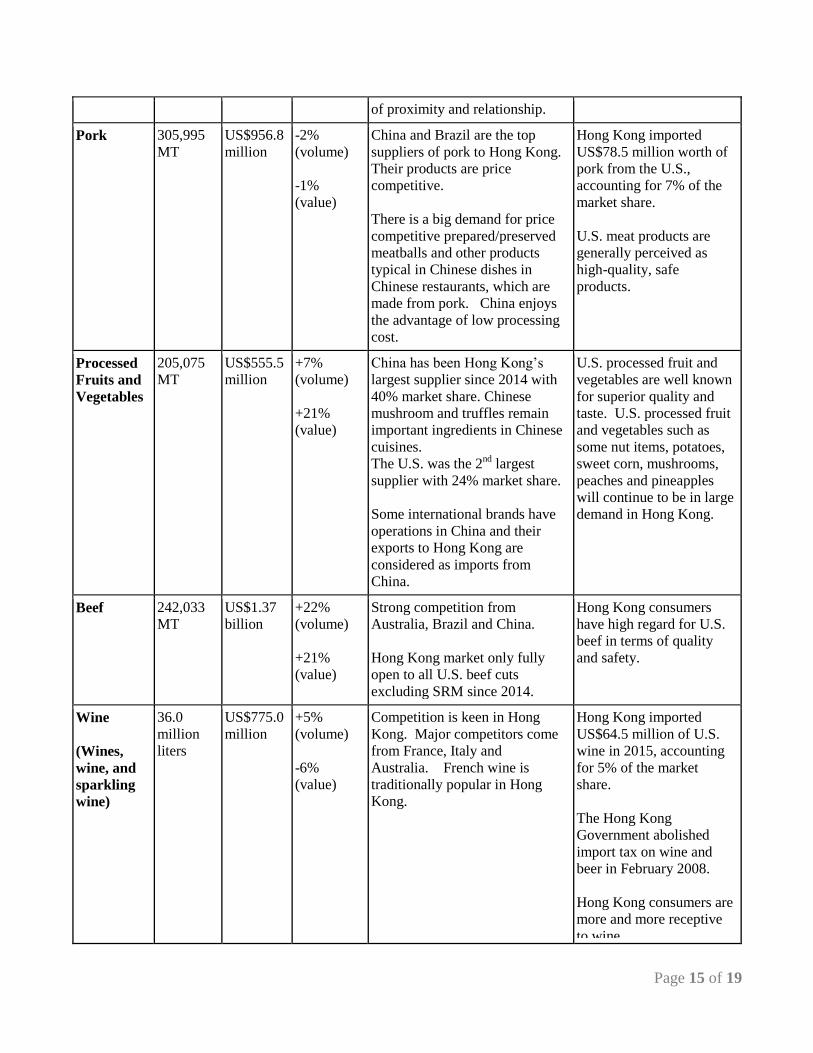
of proximity and relationship.
Pork 305,995
MT
US$956.8
million
-2%
(volume)
-1%
(value)
China and Brazil are the top
suppliers of pork to Hong Kong.
Their products are price
competitive.
There is a big demand for price
competitive prepared/preserved
meatballs and other products
typical in Chinese dishes in
Chinese restaurants, which are
made from pork. China enjoys
the advantage of low processing
cost.
Hong Kong imported
US$78.5 million worth of
pork from the U.S.,
accounting for 7% of the
market share.
U.S. meat products are
generally perceived as
high-quality, safe
products.
Processed
Fruits and
Vegetables
205,075
MT
US$555.5
million
+7%
(volume)
+21%
(value)
China has been Hong Kong’s
largest supplier since 2014 with
40% market share. Chinese
mushroom and truffles remain
important ingredients in Chinese
cuisines.
The U.S. was the 2nd
largest
supplier with 24% market share.
Some international brands have
operations in China and their
exports to Hong Kong are
considered as imports from
China.
U.S. processed fruit and
vegetables are well known
for superior quality and
taste. U.S. processed fruit
and vegetables such as
some nut items, potatoes,
sweet corn, mushrooms,
peaches and pineapples
will continue to be in large
demand in Hong Kong.
Beef 242,033
MT
US$1.37
billion
+22%
(volume)
+21%
(value)
Strong competition from
Australia, Brazil and China.
Hong Kong market only fully
open to all U.S. beef cuts
excluding SRM since 2014.
Hong Kong consumers
have high regard for U.S.
beef in terms of quality
and safety.
Wine
(Wines,
wine, and
sparkling
wine)
36.0
million
liters
US$775.0
million
+5%
(volume)
-6%
(value)
Competition is keen in Hong
Kong. Major competitors come
from France, Italy and
Australia. French wine is
traditionally popular in Hong
Kong.
Hong Kong imported
US$64.5 million of U.S.
wine in 2015, accounting
for 5% of the market
share.
The Hong Kong
Government abolished
import tax on wine and
beer in February 2008.
Hong Kong consumers are
more and more receptive
to wine.
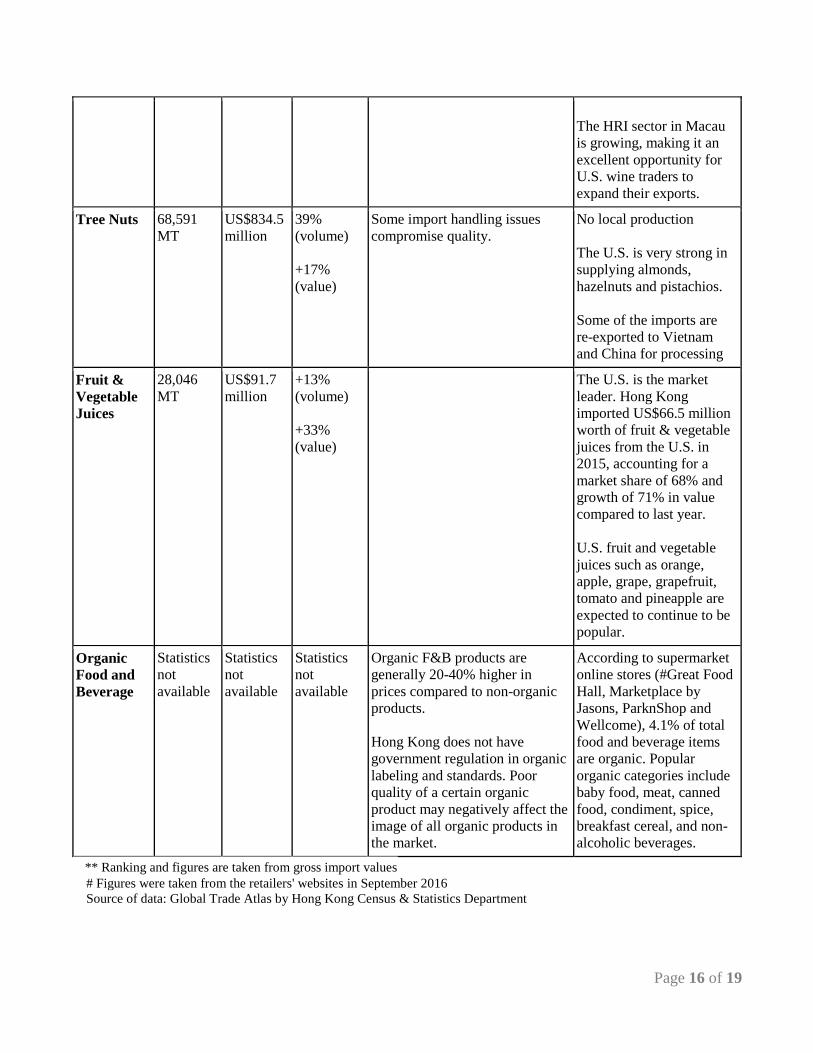
Page 16 of 19
The HRI sector in Macau
is growing, making it an
excellent opportunity for
U.S. wine traders to
expand their exports.
Tree Nuts 68,591
MT
US$834.5
million
39%
(volume)
+17%
(value)
Some import handling issues
compromise quality.
No local production
The U.S. is very strong in
supplying almonds,
hazelnuts and pistachios.
Some of the imports are
re-exported to Vietnam
and China for processing
Fruit &
Vegetable
Juices
28,046
MT
US$91.7
million
+13%
(volume)
+33%
(value)
The U.S. is the market
leader. Hong Kong
imported US$66.5 million
worth of fruit & vegetable
juices from the U.S. in
2015, accounting for a
market share of 68% and
growth of 71% in value
compared to last year.
U.S. fruit and vegetable
juices such as orange,
apple, grape, grapefruit,
tomato and pineapple are
expected to continue to be
popular.
Organic
Food and
Beverage
Statistics
not
available
Statistics
not
available
Statistics
not
available
Organic F&B products are
generally 20-40% higher in
prices compared to non-organic
products.
Hong Kong does not have
government regulation in organic
labeling and standards. Poor
quality of a certain organic
product may negatively affect the
image of all organic products in
the market.
According to supermarket
online stores (#Great Food
Hall, Marketplace by
Jasons, ParknShop and
Wellcome), 4.1% of total
food and beverage items
are organic. Popular
organic categories include
baby food, meat, canned
food, condiment, spice,
breakfast cereal, and non-
alcoholic beverages.
** Ranking and figures are taken from gross import values
# Figures were taken from the retailers' websites in September 2016
Source of data: Global Trade Atlas by Hong Kong Census & Statistics Department
Page 17 of 19
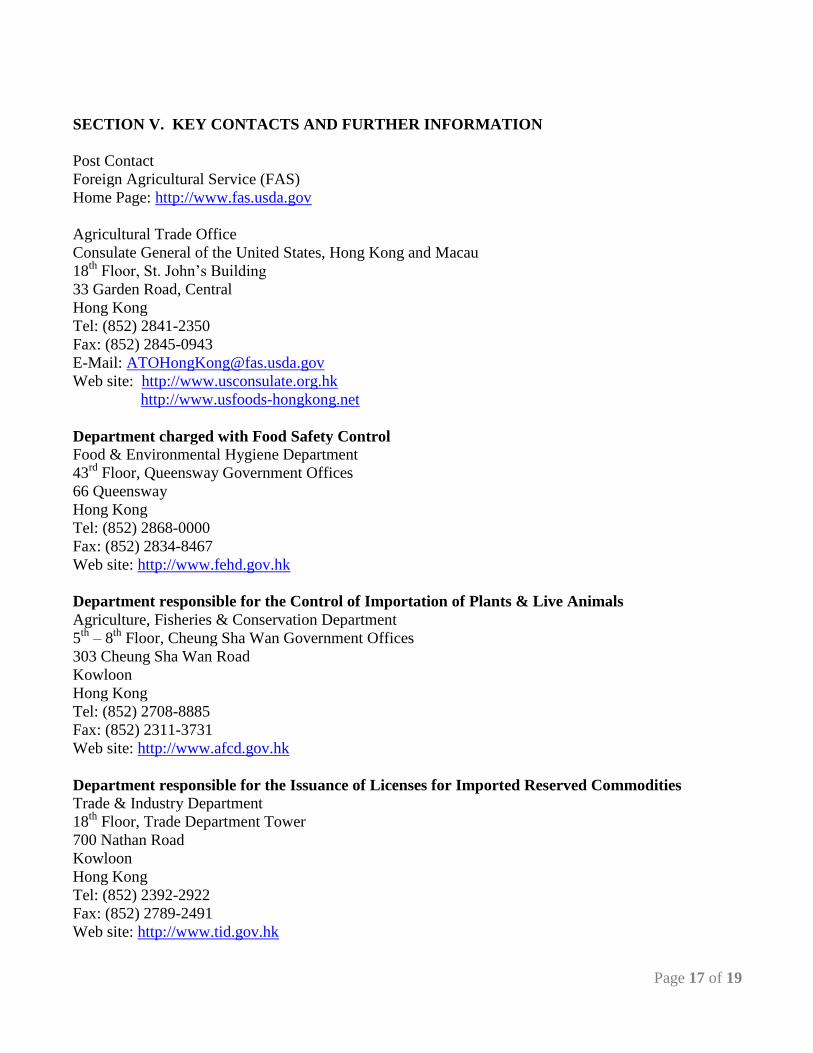
SECTION V. KEY CONTACTS AND FURTHER INFORMATION
Post Contact
Foreign Agricultural Service (FAS)
Home Page: http://www.fas.usda.gov
Agricultural Trade Office
Consulate General of the United States, Hong Kong and Macau
18th
Floor, St. John’s Building
33 Garden Road, Central
Hong Kong
Tel: (852) 2841-2350
Fax: (852) 2845-0943
E-Mail: [email protected]
Web site: http://www.usconsulate.org.hk
http://www.usfoods-hongkong.net
Department charged with Food Safety Control Food & Environmental Hygiene Department
43rd
Floor, Queensway Government Offices
66 Queensway
Hong Kong
Tel: (852) 2868-0000
Fax: (852) 2834-8467
Web site: http://www.fehd.gov.hk
Department responsible for the Control of Importation of Plants & Live Animals
Agriculture, Fisheries & Conservation Department
5th
– 8th
Floor, Cheung Sha Wan Government Offices
303 Cheung Sha Wan Road
Kowloon
Hong Kong
Tel: (852) 2708-8885
Fax: (852) 2311-3731
Web site: http://www.afcd.gov.hk
Department responsible for the Issuance of Licenses for Imported Reserved Commodities Trade & Industry Department
18th
Floor, Trade Department Tower
700 Nathan Road
Kowloon
Hong Kong
Tel: (852) 2392-2922
Fax: (852) 2789-2491
Web site: http://www.tid.gov.hk
Page 18 of 19
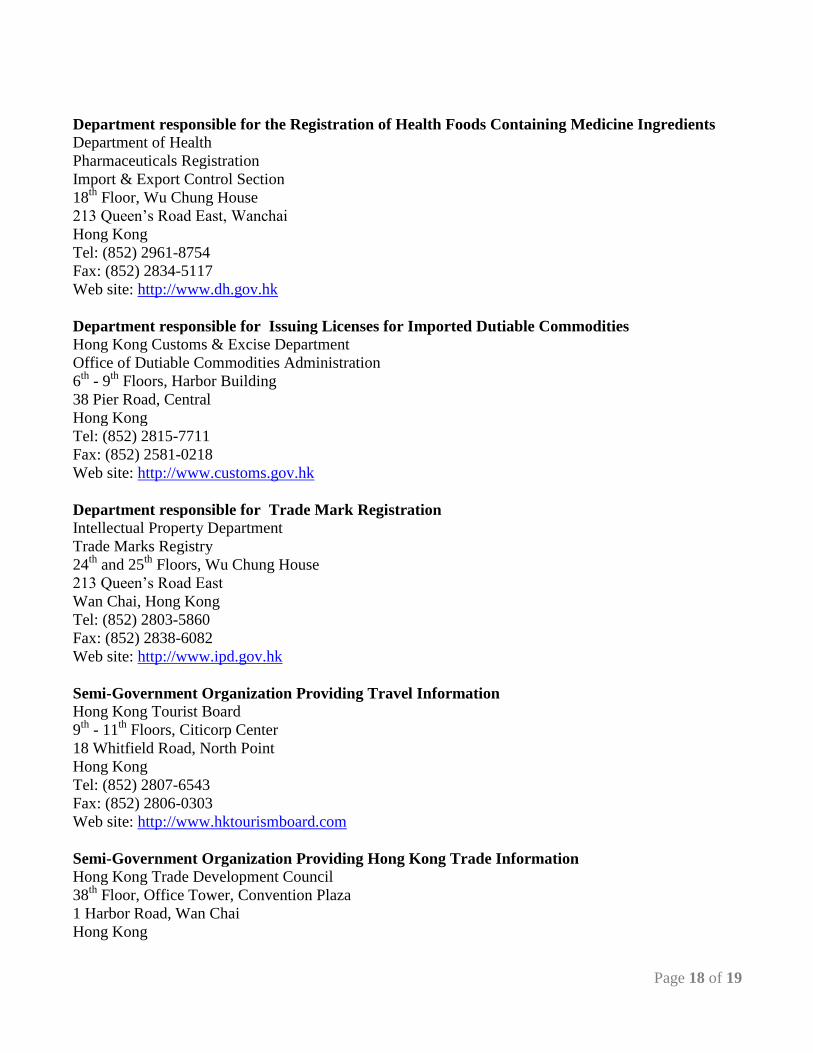
Department responsible for the Registration of Health Foods Containing Medicine Ingredients Department of Health
Pharmaceuticals Registration
Import & Export Control Section
18th
Floor, Wu Chung House
213 Queen’s Road East, Wanchai
Hong Kong
Tel: (852) 2961-8754
Fax: (852) 2834-5117
Web site: http://www.dh.gov.hk
Department responsible for Issuing Licenses for Imported Dutiable Commodities Hong Kong Customs & Excise Department
Office of Dutiable Commodities Administration
6th
- 9th
Floors, Harbor Building
38 Pier Road, Central
Hong Kong
Tel: (852) 2815-7711
Fax: (852) 2581-0218
Web site: http://www.customs.gov.hk
Department responsible for Trade Mark Registration Intellectual Property Department
Trade Marks Registry
24th
and 25th
Floors, Wu Chung House
213 Queen’s Road East
Wan Chai, Hong Kong
Tel: (852) 2803-5860
Fax: (852) 2838-6082
Web site: http://www.ipd.gov.hk
Semi-Government Organization Providing Travel Information Hong Kong Tourist Board
9th
- 11th
Floors, Citicorp Center
18 Whitfield Road, North Point
Hong Kong
Tel: (852) 2807-6543
Fax: (852) 2806-0303
Web site: http://www.hktourismboard.com
Semi-Government Organization Providing Hong Kong Trade Information Hong Kong Trade Development Council
38th
Floor, Office Tower, Convention Plaza
1 Harbor Road, Wan Chai
Hong Kong
Page 19 of 19
Tel: (852) 2584-4188
Fax: (852) 2824-0249
Web site: http://www.tdctrade.com
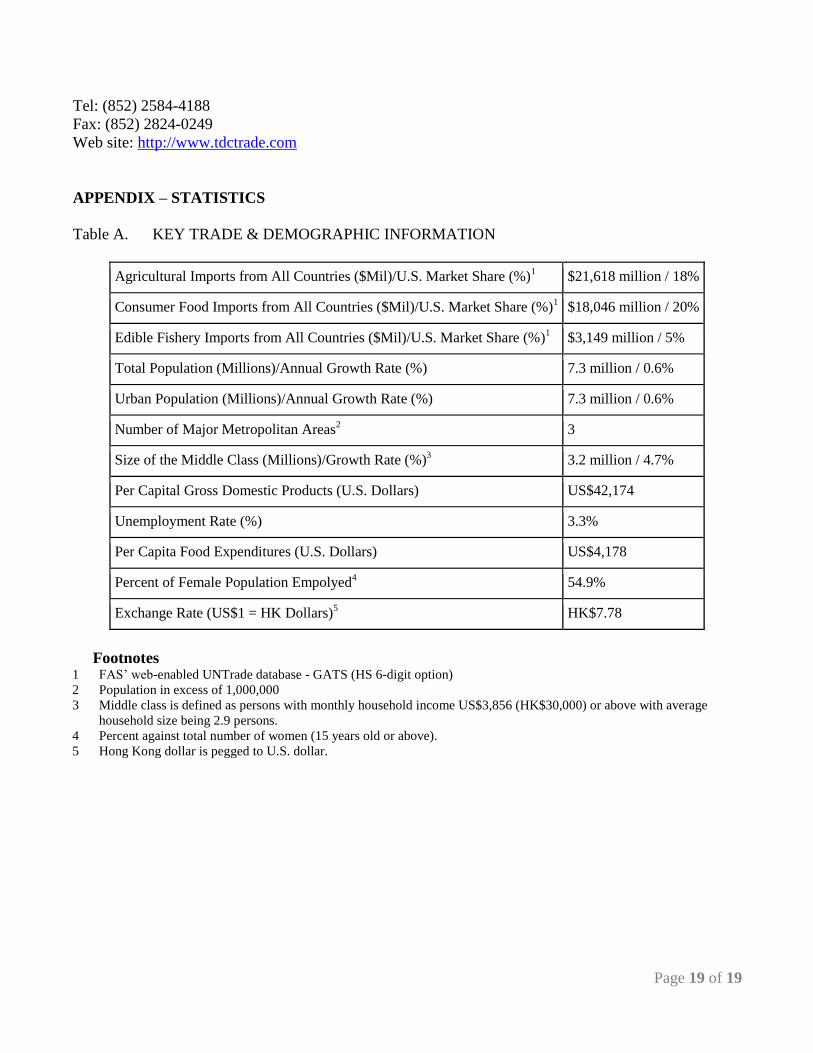
APPENDIX – STATISTICS
Table A. KEY TRADE & DEMOGRAPHIC INFORMATION
Agricultural Imports from All Countries ($Mil)/U.S. Market Share (%)1 $21,618 million / 18%
Consumer Food Imports from All Countries ($Mil)/U.S. Market Share (%)1 $18,046 million / 20%
Edible Fishery Imports from All Countries ($Mil)/U.S. Market Share (%)1 $3,149 million / 5%
Total Population (Millions)/Annual Growth Rate (%) 7.3 million / 0.6%
Urban Population (Millions)/Annual Growth Rate (%) 7.3 million / 0.6%
Number of Major Metropolitan Areas2 3
Size of the Middle Class (Millions)/Growth Rate (%)3 3.2 million / 4.7%
Per Capital Gross Domestic Products (U.S. Dollars) US$42,174
Unemployment Rate (%) 3.3%
Per Capita Food Expenditures (U.S. Dollars) US$4,178
Percent of Female Population Empolyed4 54.9%
Exchange Rate (US$1 = HK Dollars)5 HK$7.78
Footnotes 1 FAS’ web-enabled UNTrade database - GATS (HS 6-digit option)
2 Population in excess of 1,000,000
3 Middle class is defined as persons with monthly household income US$3,856 (HK$30,000) or above with average
household size being 2.9 persons.
4 Percent against total number of women (15 years old or above).
5 Hong Kong dollar is pegged to U.S. dollar.
Related Documents