EXPLORING THE USE OF SMARTPHONE, WIRELESS SENSORS, AND 3D-PRINTING FOR LOW-COST MEDICAL TECHNOLOGY—DIAGNOSIS, TREATMENT, AND REHABILITATION By Rui Li (Under the Direction of Zion Tsz Ho Tse) ABSTRACT This dissertation studies the design principles of low-cost scalable medical devices for diagnosis, treatment, and rehabilitation via smartphone, wireless sensors, and 3D-printing technologies. Image-guided therapy (IGT) combines medical imaging and robotic devices for diagnostic and therapeutic procedures in an accurate and minimally invasive manner. Compared to conventional open surgery, potential benefits of the IGT include targeted diagnosis and treatment, minimally invasiveness, shorter hospitalization, lower surgical risks, and, therefore, faster recovery times for the patients. To enhance dexterity and visualization during the procedures, technologists have developed robotic systems as a way to provide targeting precision. However, robotic surgeries could be limited by its prolonged workflow, extended training requirements, and the high capital and maintenance costs. In comparison, small assistive devices have advantages over the cost, usability, and adaptation to the clinical environment. The aim of this dissertation is to explore the use of smartphone applications, wireless sensors, and 3D-printing to develop low-cost scalable medical devices for diagnosis, treatment,

Welcome message from author
This document is posted to help you gain knowledge. Please leave a comment to let me know what you think about it! Share it to your friends and learn new things together.
Transcript
EXPLORING THE USE OF SMARTPHONE, WIRELESS SENSORS, AND 3D-PRINTING
FOR LOW-COST MEDICAL TECHNOLOGY—DIAGNOSIS, TREATMENT, AND
REHABILITATION
By
Rui Li
(Under the Direction of Zion Tsz Ho Tse)
ABSTRACT
This dissertation studies the design principles of low-cost scalable medical devices for
diagnosis, treatment, and rehabilitation via smartphone, wireless sensors, and 3D-printing
technologies.
Image-guided therapy (IGT) combines medical imaging and robotic devices for
diagnostic and therapeutic procedures in an accurate and minimally invasive manner. Compared
to conventional open surgery, potential benefits of the IGT include targeted diagnosis and
treatment, minimally invasiveness, shorter hospitalization, lower surgical risks, and, therefore,
faster recovery times for the patients. To enhance dexterity and visualization during the
procedures, technologists have developed robotic systems as a way to provide targeting
precision. However, robotic surgeries could be limited by its prolonged workflow, extended
training requirements, and the high capital and maintenance costs. In comparison, small assistive
devices have advantages over the cost, usability, and adaptation to the clinical environment.
The aim of this dissertation is to explore the use of smartphone applications, wireless
sensors, and 3D-printing to develop low-cost scalable medical devices for diagnosis, treatment,

and rehabilitation. The research outcome would balance the technology scalability, clinical
usability, and technical novelty that optimize the cost, accuracy, and user experience.
In this study, five medical devices were designed in different versions as case studies of
low-cost scalable medical technologies that spanned in a wide range of clinical applications and
shared the design principles: 1) 3D-printing reduces fabrication cost for medical devices and
provides a customized solution for individual patients; 2) smartphone applications provide real-
time tracking and visualization information of the medical instruments; 3) wireless sensors and
the supported setup allow synchronous, remote data acquisition, transfer, and analysis.
Anthropomorphic organ phantoms, animal cadaver, live animal, and human studies were
conducted to evaluate and validate the performance of the developed devices. The design
presents only a small fraction of the costs of their robotic counterparts while delivering
comparable accuracy, efficacy, and a streamlined workflow. This dissertation presents
knowledge in the field of medical devices by offering low-cost scalable solutions for designs
used for diagnosis, treatment, and rehabilitation.
INDEX WORDS: Image-guided Therapy, Percutaneous, 3D-printing, Micro-Electromechanical
System (MEMS), Smartphone Application, Inertial Measurement Unit (IMU), Rehabilitation

EXPLORING THE USE OF SMARTPHONE, WIRELESS SENSORS, AND 3D-PRINTING
FOR LOW-COST MEDICAL TECHNOLOGY—DIAGNOSIS, TREATMENT, AND
REHABILITATION
by
RUI LI
M.E., Imperial College, London, 2009
A Dissertation Submitted to the Graduate Faculty of The University of Georgia in Partial
Fulfillment of the Requirements for the Degree
DOCTOR OF PHILOSOPHY
ATHENS, GEORGIA
2020

© 2020
Rui Li
All Rights Reserved

EXPLORING THE USE OF SMARTPHONE, WIRELESS SENSORS, AND 3D-PRINTING
FOR LOW-COST MEDICAL TECHNOLOGY—DIAGNOSIS, TREATMENT, AND
REHABILITATION
by
RUI LI
Major Professor: Zion Tsz Ho Tse
Committee: Leidong Mao
Javad Mohammadpour Velni
Kent Ronald Nilsson
Electronic Version Approved:
Ron Walcott
Interim Dean of the Graduate School
The University of Georgia
August 2020

iv
ACKNOWLEDGMENTS
I would like to express my deepest gratitude to my supervisor and lifelong mentor, Dr. Zion
Tsz Ho Tse, for his invaluable guidance on my research and future career path. From day one in
the lab, I have been offered many great research opportunities to explore the unknown in the field
of image-guided therapy. I could not make this far without his immense support on supervising
my daily research activities and developing my lifelong research skills. His supervision has driven
me to become a capable academic researcher. It is whole-heartedly to say that learning in the
Medical Robotics Laboratory is a forever important milestone in my career development.
I would like to give my special regards to my Ph.D. committee members, Dr. Leidong Mao,
Dr. Kent Ronald Nilsson, and Dr. Javad Mohammadpour Velni. Their invaluable advice has not
only significantly improved the quality of my research work but also greatly broaden the
knowledge base of my dissertation.
I would like to sincere appreciation to the collaborators Dr. Sheng Xu and Dr. Bradford
Wood in the National Institute of Health, Dr. Hongliang Ren, at the National University of
Singapore, and Dr. WenZhan Song and Dr. Christopher Modlesky at the University of Georgia.
Their expert knowledge has dramatically broadened my perspective on clinical medicine, medical
devices, wireless communication, and physical rehabilitation.
I also would like to thank all the administrative staff in the College of Engineering for their
invaluable support in this journey, especially Ms. Margaret Sapp. I also really appreciated the
collaborative work from my lab colleagues Zhuo Zhao, Brian Boland, Kevin Wu, Julian Moore,

iiv
and Austin Taylor. In particular, I am grateful for Sierra Hovet for giving me writing comments
for my research work.
Last but not least, I wish to express my gratitude to my beloved wife, Xia Wang, and my
parents on both sides: Shuping Liu, Enjie Li, Bin Wang, and Qiulong Zhang, my two brothers: Zhi
Li, and Zilong Zhang, and Uncle Dong. I want to thank my two angels William Li and Anna Li,
for giving me so much happy momentum and allow me optimistically and persistently to tackle
challenging problems. The name list for appreciation is non-exhaustive. Their spritual support has
helped me going through this epic journey.

iiiv
TABLE OF CONTENTS
Page
ACKNOWLEDGEMENTS .......................................................................................................... IV
LIST OF TABLES .................................................................................................................... VIIV
LIST OF FIGURES ................................................................................................................... IXV
CHAPTER
1 INTRODUCTION .........................................................................................................1
Objective of the Study .............................................................................................1
Novelty of the Study ................................................................................................1
Impact of the Study ..................................................................................................2
Outline of the Dissertation .......................................................................................2
2 LITERATURE REVIEW ..............................................................................................5
Introduction ..............................................................................................................5
Precision Surgical Planning .....................................................................................7
Precision Surgical Tracking .....................................................................................9
Precision Diagnosis ................................................................................................14
Precision Surgical Treatment .................................................................................15
Precision Physical Rehabilitation ..........................................................................23
3 LANDSCAPE OF PRECISION MEDICINE IN CLINICAL APPLICATIONS
................................................................................................................................32
Abstract ..................................................................................................................33

ivv
Introduction ............................................................................................................33
Materials and Methods ...........................................................................................36
Results ....................................................................................................................44
Discussion ..............................................................................................................47
Summary ................................................................................................................52
4 A WEARABLE SMART DIAGNOSTIC DEVICE FOR HEATSTROKE
PREVENTION ............................................................................................................53
Abstract ..................................................................................................................54
Introduction ............................................................................................................54
Materials and Methods ...........................................................................................56
Results ....................................................................................................................63
Discussion ..............................................................................................................67
Summary ................................................................................................................70
5 A LOW-COST, MRI-VISIBLE, AND 3D-PRINTED FLEXIBLE TEMPLATE FOR
PRECISION TUMOR TARGETING..........................................................................71
Abstract ..................................................................................................................72
Introduction ............................................................................................................72
Materials and Methods ...........................................................................................76
Results ....................................................................................................................83
Discussion ..............................................................................................................87
Summary ................................................................................................................92
6 A LOW-COST PATIENT-MOUNTED NEEDLE LOCALIZER FOR IN-PLANE RF
THERMAL ABLATION .............................................................................................93

vv
Abstract ..................................................................................................................94
Introduction ............................................................................................................94
Materials and Methods ...........................................................................................98
Results ..................................................................................................................102
Discussion ............................................................................................................107
Summary ..............................................................................................................109
7 A LOW-COST, SMARTPHONE-BASED, AND MEMS IMU-ENABLED
HANDHELD TRACKER FOR CT-GUIDED INTERVENTION............................110
Abstract ................................................................................................................111
Introduction ..........................................................................................................112
Materials and Methods .........................................................................................113
Results ..................................................................................................................121
Discussion ............................................................................................................126
Summary ..............................................................................................................129
8 A HUMAN STUDY OF LOW-COST, SMARTPHONE-BASED AND MEMS IMU-
ENABLED BODY TRACKER .................................................................................130
Abstract ................................................................................................................131
Introduction ..........................................................................................................131
Materials and Methods .........................................................................................136
Results ..................................................................................................................147
Discussion ............................................................................................................150
Summary ..............................................................................................................152
9 CONCLUSION AND FUTURE WORK ..................................................................154

viv
Conclusion ...........................................................................................................154
Future Work .........................................................................................................158
REFERENCES ............................................................................................................................164
APPENDICES .............................................................................................................................205
Journal Publications .........................................................................................................205
Conference Publications ..................................................................................................206

viiv
LIST OF TABLES
Table 1-1: Five smartphone-based and 3D-printed devices presented in this dissertation ............ 3
Table 2-1: Clinical workflow for an image-guided procedure ..................................................... 10
Table 2-2: Commercially available navigation system in interventions ...................................... 10
Table 2-3: The working principle and performance metrics of selected devices. ........................ 19
Table 2-4: Commercially available surgical robotic system for interventions ............................ 20
Table 2-5: Current commercially available or under-developed IMU systems ........................... 25
Table 2-6: Current commercially available or developing robotic-assisted rehabilitation systems
....................................................................................................................................................... 27
Table 2-7: Current commercially available or developing VR rehabilitation systems ................ 30
Table 3-1: Shows some commercially available optical tracking systems (OTS) ....................... 34
Table 3-2: The tool tracking parameters used in this study ......................................................... 37
Table 3-3: Shows the Symbols used for equations in Table 3-4 (The coordinate system is shown
in Figure 3(d)). ............................................................................................................................. 39
Table 3-4: The results summary of the three tests in this study, ABS means absolute values .... 46
Table 4-1: Calibration process of obtaining a color map ............................................................. 59
Table 4-2: Conditions of simulation............................................................................................. 63
Table 5-1: Existing assistive needle guidance systems ................................................................ 74
Table 5-2: Commercially available needle guidance systems ..................................................... 75
Table 5-3: Design criteria and descriptions of an ideal needle template ..................................... 77
Table 6-1: The comparison between other devices and the presented device in this study ......... 96

viiiv
Table 6-2: Design specifications for the presented device ........................................................... 98
Table 6-3: Definition of Symbols used in the image analysis.................................................... 103
Table 7-1: Specifications of hardware elements shown in Figure 7-1. ..................................... 115
Table 7-2: Definitions of symbols .............................................................................................. 119
Table 7-3: Statistical analysis between two insertion methods .................................................. 125
Table 8-1: Comparison of functionality between our system and existing ones ....................... 135
Table 8-2: Head-to-head comparison between the IMU and NDI optical tracking system ....... 137
Table 8-3: Variable definitions for kinematic equations ............................................................ 141
Table 8-4: Motion analysis using NDI optical tracking system ................................................. 143
Table 8-5: Motion analysis using IMU tracking system ............................................................ 144

ixv
LIST OF FIGURES
Figure 2-1: Three commonly used imaging modalities in Image-guided therapy, (a) shows the
CT scanner—Philips CT 6000 iCT[35], (b) shows the Ultrasound system—GE Voluson S10[36],
(c) shows the MRI scanner—Simens Avanto, which has a closed bore size of approximately 60
cm[37]. ............................................................................................................................................ 8
Figure 2-2: Some of the currently available navigation systems, (a) shows Shwartz et al.’s
research work[60], (b) shows Fichtinger et al.’s research work[65], (c) shows Mauri et al.’s
research work[62], and (d) shows Dixon et al.’s research work[63]. ........................................... 14
Figure 2-3: Show some commercially available devices. (a) LeVeen needle electrodes by Boston
scientific [112], (b) StarBurst XL & semi-flex RFA device by Angiodynamics [113], (c)
Valleylab Cool-tip RF ablation system by Covidien [114], (d) Visualase MRI-guided ablation
system by Medtronic [115]. .......................................................................................................... 19
Figure 2-4: Shows (a) Micro Hand S system, which was developed by Tianjin University,
China, has a three-arm operation cart [124], (b) Revo-i robotic system, which was developed by
Mere company, South Korea, has a four-arm operation cart [80], (c) da Vinci robotic system,
which was developed by Intuitive Surgical, has a four-arm operation cart, a surgeon console, and
vision cart [123]. ........................................................................................................................... 23
Figure 2-5: Different types of IMU motion tracking systems. (a) Xsens system [145], (b) Muller
et al.’s self-calibrating elbow angle device [146], (c) Chang et al.’s developed finger device
[144], and (d) Bakhshi et al.’s body joint angle measurement system [147]................................ 26

xv
Figure 2-6: Shows the systems of (a) Rewalk developed by Argo Medical Technologies Ltd
[159], (b) ALEX developed by University of Delaware [161], (c) HAL developed by Cybernic s
[160], (d) I-Pam developed by University of Leeds [157]............................................................ 28
Figure 2-7: Different types of VR rehabilitation systems, (a) Crosbie et al.’s experimental set up
[176], (b) Gokeler et al.’s experimental setup [177], and (c) Slobounov et al.’s experimental
setup [174]. ................................................................................................................................... 31
Figure 3-1: Overall test design for assessing the accuracy of the OTS. ...................................... 36
Figure 3-2: Shows the experimental and tool setup, (a) displays the working principle of NDI
OTS, UR 10, and relevant hardware, (b) shows the tracking volume of the NDI OTS, (c) shows
how the tool was held by the UR10, (d) shows the needle positioning and the needle used was
17G and has a length of 200 mm, (e) shows the tool dimensions. ............................................... 38
Figure 3-3: Experimental setup for testing: (a) the marker orientation, (b) the marker occlusion,
(c) the environmental reflection, and (d) shows the global coordinate system of the NDI OTS.
The optical tracking system was mounted on the wooden board in a fixed position to the needle
tool within the tracking distance of 2400 mm. A vacuum base vise was used to hold the marker
coverage tool.r............................................................................................................................... 41
Figure 3-4: Tracking errors generated when the tool was oriented in the (a) yaw direction, and
(b) pitch direction. ......................................................................................................................... 45
Figure 3-5: (a) Tracking errors generated when increasing the marker occlusion from 10% to
40%. At 40%, the tool tracking was lost, (b) tracking error generated when rotating the stainless-
steel panel...................................................................................................................................... 46
xiv
Figure 3-6: NDI software interface showed phantom points (in black color) appeared during the
experiment when reflections had a significant influence on the tracking quality. The coordinate
system was previously defined in Figure 3-3 (d). ........................................................................ 47
Figure 4-1: (a) The working principle of the device, (b) Chemical transformation of Leuco
dyes[245, 246]............................................................................................................................... 56
Figure 4-2: Proposed workflow of the application ...................................................................... 59
Figure 4-3: Temperature sensor development and operating demonstration: (a) the resin used to
create the temperature sensor, (b) bracelet-shaped sensor model, (c) 3D-printed sensor, (d)
demonstration of sensor changing color with skin temperature, (e) and using the smartphone to
take a picture (f) to measure the temperature and alert. ................................................................ 60
Figure 4-4: (a) The thickness of the device, (b) Color transition of one thermochromic sample
under the heating temperature of 38 ºC. The purple color means the temperature of the circular
block reached 30 °C. The white color means the temperature of the circular block reached 38 °C.
This was a quantitative test that can measure both the rate and the extension of the color change.
....................................................................................................................................................... 62
Figure 4-5: Open-air test setup and simulation layout. As for the simulation, the dimensions of
the block and the heat source were identical to the real thermochromic block and heat source in
the open-air test. The separation distance C between the blocks was proportional to the distance
A in the open-air test. The separation distance D between the block to the center of heat source
was proportional to the distance B in the open-air test. ................................................................ 63
Figure 4-6: (a) Shows the time taken for a thin block made from thermochromic material to
change from dark purple to completely white. The linear relationship indicates that there is a
positive correlation between the time taken for the color change to occur and the thickness of the

xiiv
object, (b) Shows the time taken for the complete color change, which includes two states, the
color transition period (t = 0-80 s) and steady-state (after t = 80 s). ............................................ 64
Figure 4-7: (a) Comparison between the temperature readings from our device and conventional
laser thermometer, which has an accuracy of ±0.1°C. The average error of these two devices is
0.06°C. Each data point is the average value of twenty repetitions of trials. (b) The Bland-Altman
plot is used to evaluate the accuracy of the device. ...................................................................... 65
Figure 4-8: the experimental and simulation result for heat transfer between the thermochromic
circular blocks and round heat source underneath. (a) shows the color image from the
experiment, which shows the color changes from purple to white as the heat transfer happens
between the heat source and thermochromic blocks, (b) is the processed grayscale image using
Matlab 2017b® (Natick, MA) with the color bar on the side indicating the temperature
distribution ranging from 25 °C to 40 °C. (c) is the simulation result using Energy
2D®(Concord, MA), the dotted red line is the isotherm line of 30 °C. As time elapses, the
isotherm line expands outwardly, which matches consistently with both the color appearance and
temperature analysis in (a) and (b)................................................................................................ 66
Figure 5-1: The presented template-guided system for minimally invasive interventional
procedure....................................................................................................................................... 76
Figure 5-2: (a) shows the design of the template, (b) shows the 3D print result from the
formlabs®, (c) shows the template flexibility test, the template was able to bend and make full
contact with the arch. (d) shows the cap design for sealing the contrast agent, (d) shows the final
assembly result of the template, (f) shows the MR image (T1-weighted). ................................... 78
Figure 5-3: Detailed design information on optimization ............................................................ 79

xiiiv
Figure 5-4: Two different types of test blocks were CAD designed, and 3D printed for
optimizing both the Gd concentration and container size. (a) shows the circular containers with a
constant diameter of 4mm but the concentration of Gd-water solution increases from 0.9mg/ml to
42.6mg/ml and pure water as a control reference is placed at the bottom right corner, (b) shows a
series of containers with gradual decreasing size, optimal Gd concentration is applied to all the
containers in this case. .................................................................................................................. 80
Figure 5-5: (a) shows the registration user interface, the blue dots are manually identified
markers, the yellow circles are where the software thinks the MRI contrast should be located, the
red dot is the projection of the target on the template, (b) shows the virtual needle generated by
the software goes through the interval between fiducial markers. ................................................ 81
Figure 5-6: (a) shows a template placed inside the CT scanner, (b) shows the typical CT image,
(c) how the distance is measured and analyzed, LR is the left-right distance error, SP is the
superior-posterior distance error. .................................................................................................. 82
Figure 5-7: The clinical workflow of template application ......................................................... 82
Figure 5-8: (a) shows MRI images of different concentrations of Gd solutions, (b) shows the
signal intensity versus the Gd concentrations ............................................................................... 84
Figure 5-9: (a) shows MRI images of different test container diameter, (b) shows the signal
intensity versus the test container diameter .................................................................................. 85
Figure 5-10: shows the 9 out of 13 insertions on the prostate phantom are displayed and
analyzed. (a)—(c) is on Tumor A, (d)— (f) is on Tumor B, and (g)—(I) is on Tumor C. .......... 86
Figure 5-11: Shows a comparison of absolute values of SP, LR, and TD errors for 13 insertions.
....................................................................................................................................................... 87
Figure 5-12: Shows the Bland-Altmann plot for SP and LR respectively. ................................. 87
xivv
Figure 6-1: shows the description of the procedure, there are three main steps involved: at first,
the presented device measures the needle angle and displays the angular data on the smartphone.
The angular information assists the physician to decide the skin entry angle for ablation biopsy.
The device could continuously provide real-time angular information during needle
advancement. After one ablation is done, the device could be used repeatably for multiple
ablations. ....................................................................................................................................... 97
Figure 6-2: shows (a) CAD design, (b) Needle release and Remote Center of Motion (RCM)
mechanism, (c) final device assembly using biocompatible material, and (d) Bluetooth
communication with the mobile platform, which shows the real-time needle angle. ................... 99
Figure 6-3: presented clinical workflow, which has six steps. Step 1, Step 2-4, and Step 5-6 are
the planning step, the target acquiring steps, and the treatment steps, respectively. .................. 101
Figure 6-4: shows the results of the benchtop test. The number of trials is listed underneath,
along with the absolute errors in each trial. ................................................................................ 102
Figure 6-5: One example of needle insertion from the stage of planning to completion, (a) shows
pre-inserted CT visible targets (0.5mm-BB beads), (b) shows pre-planned insertion pathway, (c)
shows the final scan of the actual pathway. ................................................................................ 103
Figure 6-6: shows all the CT images of insertions for 6 targets. On each row, the first image
presents the overall needle pathway. The second image displays the needle and tumor location.
Besides the images, there are four parameters, PDS (planned insertion distance from skin entry
point), ADS (actual insertion distance from skin entry point), TTD (needle tip-to-target distance
error), and AE (needle angular error). The red line is the planned insertion with a circle end
indicating the tumor position. The yellow line is the actual insertion with a square end indicating
the actual needle position. ........................................................................................................... 105

xvv
Figure 6-7: Results of six insertions for the in-vivo study, (a) shows the comparison between the
actual and planned insertion distance, (b) shows the TTD errors, (c) shows the comparison
between the actual and planned insertion angle, (d) shows the AE errors. The mean accuracy,
measured as the minimum needle path to the target, was 5.2 mm. The average tip to target
distance was 7.4 mm. The average puncture time was 25.5 s. Only one of the punctures required
an intermediary CT scan, and none of the insertions required any needle drawback or
repositioning. .............................................................................................................................. 106
Figure 7-1: Overview of the system design architecture and tracker design, (c) showing its use
(1) and the needle channel (2). The description of each part in (3) is shown in Table 7-1. ....... 114
Figure 7-2: 3D printed station for calibration of the tracker reading. ........................................ 117
Figure 7-3: Comparison between conventional and tracker-assisted CT-guided clinical
workflow. (a) shows the conventional procedure. More intermittent CT scans (steps 3–5, as
shown in the orange arrows) are likely required in this workflow, lengthening the procedure.
Treatments that require multiple needle insertions for multiple targets repeat steps 3–7 (green
arrows). (b) Tracker-assistance shows the alternative method for step 4, in which online
monitoring of needle position provides instant feedback, potentially reducing the number of
confirmatory CT scans for positioning and improving the efficiency of CT in guiding needle
placement. ................................................................................................................................... 118
Figure 7-4: Interpretation of the CT image. The yellow line shows the planned pathway, and the
red line shows the actual insertion pathway. The blue lines indicate each parameter. ............... 119
Figure 7-5: Comparison of the angular measurement (a) using the phantom, (b) In-axial plane
angle measured by CT compared to (c) the smartphone application’s reading. In (c), the
smartphone displays: (1) X, Y, Z as angles of rotation about the roll, pitch and yaw, (2) Time

xviv
function enables the creation of a needle time log/event, (3) Acceleration of the angular
movement, (4) Velocity of the angular movement, (5) Output function logs out the file and data
can be transferable to a computer. The schematic diagram of beeping vs. angle deviation is
shown in (d), and needle alignment and insertion are shown in (e). .......................................... 120
Figure 7-6: Statistical analysis between the measured angle and actual angle. (a) shows the data
analysis on the benchtop test, (b) shows the data analysis on the abdominal phantom study. ... 122
Figure 7-7: (I) shows three examples of needle insertions performed in the phantom: (a), (b), and
(c) show relative positions of needles with respect to the target; (d), (e), and (f) are the
quantitative analysis of needle trajectories. (II) and (III) shows the results from the tracker-
assisted and cognitive guided freehand needle insertion, respectively. The yellow lines show the
planned needle trajectory, and the red lines show the actual insertion pathway. The yellow
squares show the position of the target, and the red circles show the position of the needle tip. On
the right-hand side of each image, the six parameters are displayed: PD, AD, RE, AE, TTE, and
ARE............................................................................................................................................. 124
Figure 7-8: In (a), (1) shows the comparison between the PD and AD; (2) shows the comparison
between the AE and RE; (3–4) show the trends of TTE and ARE. (b) shows the comparison of
ARE and TTE between the tracker-assisted and freehand procedures. ...................................... 126
Figure 8-1: (a) shows the overview of the tracking system with reflective markers, and (b)
suggested mounting locations on the hip, knees, and ankles of end-users. The IMU modules were
placed on the outer surface of the hip, knees, and ankles. .......................................................... 138
Figure 8-2: (a) shows the interior structure of the IMU sensor, which has a gyroscope, an
accelerometer, a microprocessor, a battery, a Bluetooth module, and a switch. All the
components were placed in a 3D-printed case, (b) shows the coordinate system of the IMU
xviiv
sensor, (c) shows the experimental set up for human trials. The blue lines on the floor are the
measuring distance, and the IMU sensor was mounted on human participants using flexible
bands. The NDI equipment was set on the table at a detectable distance to the participants. The
control console was placed nearby for data recording. ............................................................... 139
Figure 8-3: Smartphone interface .............................................................................................. 139
Figure 8-4: (a) shows NDI lower-limb kinematic analysis and NDI segmented kinematics
analysis for each NDI marker on the (b) hip, (c) knee, and (d) ankle. Each segment was defined
based on the joint region between the waist and the thigh, the thigh and the leg, the leg and the
foot, respectively. ........................................................................................................................ 142
Figure 8-5: (a) shows NDI lower-limb kinematic analysis and NDI segmented kinematics
analysis for each NDI marker on the (b) hip, (c) knee, and (d) ankle. ....................................... 144
Figure 8-6: Shows the analysis of (a) scatter plot and (b) Bland-Altman plot. ......................... 147
Figure 8-7: Gait comparison between the NDI optical tracking and our tracking system for one
participant ................................................................................................................................... 148
Figure 8-8: The walking, jogging, and fencing lunging results for 10 participants. The solid line
is the IMU data, and the dashed line is the NDI data. Taking one graph of the hip movement of
subject 1 as an example, µ= 4.40, σ= 4.70, cc= 0.81 means the mean of differences is 4.40⁰, the
average standard deviation is 4.70⁰, and the cross-correlation is 0.81. The two lines were
artificially separated from each other by adding an offset of 40⁰ for better presentation. .......... 149
Figure 8-9: shows cross-correlation, standard deviation, and average difference for walking,
jogging, and fencing lunging for 10 participants. ....................................................................... 150
Figure 9-1: Illustration of the proposed template ....................................................................... 160
Figure 9-2: Shows a developed prototype using the MPD concept ........................................... 161

xviiiv
Figure 9-3: Shows a future trend for fencing analytics: (a) conventional coaching technique for
fencing, (b) common fencing injuries-knee problem, (c) new training practice using sensors and
smartphone application ............................................................................................................... 163

1
1. CHAPTER 1
INTRODUCTION
Objective of the Study
This dissertation studies the design principles of low-cost scalable medical devices for
diagnosis, treatment, and rehabilitation via smartphone, wireless sensors, and 3D printing
technologies.
Novelty of the Study
The novelty of this work lies in developing low-cost, fast-deployable, and scalable
medical devices in the challenging CT and MRI environments. The design presents only a small
fraction of the costs of their robotic counterparts. The previous efforts have been put into
developing state-of-art medical devices or robotic systems for precision medicine, but the high-
cost limits their use in environments such as small clinics or homes. The presented devices
demand significantly less training and can be easily fit into the current clinical workflow. One of
the devices developed—the angular localizer—significantly shortens the time for surgical
planning and treatment. In addition, the medical devices are scalable, which means the design is
customizable to different clinical requirements and production needs. One example is the flexible
template can cut into smaller size for young patients. Last but not least, the developed devices
have comparable accuracy and efficacy to those systems which are commercially available.

2
Impact of the Study
Image-guided therapy (IGT) is to use state-of-art technologies such as wireless sensors
for disease diagnosis and treatment in a fast, accurate, and minimally invasive manner. It is
hypothesized that using appropriate design principles and precision technologies, the low-cost
image-guided medical devices could achieve comparable accuracy to the existing commercial
robotic systems.
In the phantom studies, the distance errors of all the presented devices were generally
within the range of 1.0—2.0 mm and angular errors were within the range of 1.0—2.0°. In the
animal studies, one of the device—the patient-mounted localizer—showed a mean tip-to-target
distance errors of 5.2 mm. In comparison, the tip-to-target distance errors of the robotic systems were 2.0
— 5.0 mm. The cost of fabricating this medical device was significantly lower than the robotic systems.
Outline of the Dissertation
In the first part of this dissertation, a literature review presents the current development of
precision medicine in different areas: diagnosis, surgical tracking, and treatment as well as physical
rehabilitation. The second part of the dissertation describes a list of medical devices being
developed for image-guided therapy and rehabilitation (Table 1-1). First, the limitations of the
current system were thoroughly investigated. Second, a smartphone-based and wearable medical
device was fabricated via 3D printing technology, aiming to provide an accurate diagnosis for
heatstroke. Then, three low-cost, fast-deployable, and disposable medical devices were fabricated
for needle biopsy and ablation. Then, a motion tracking system was developed to track the human
joint movement accurately. A group of volunteers was recruited to carry out three different
3
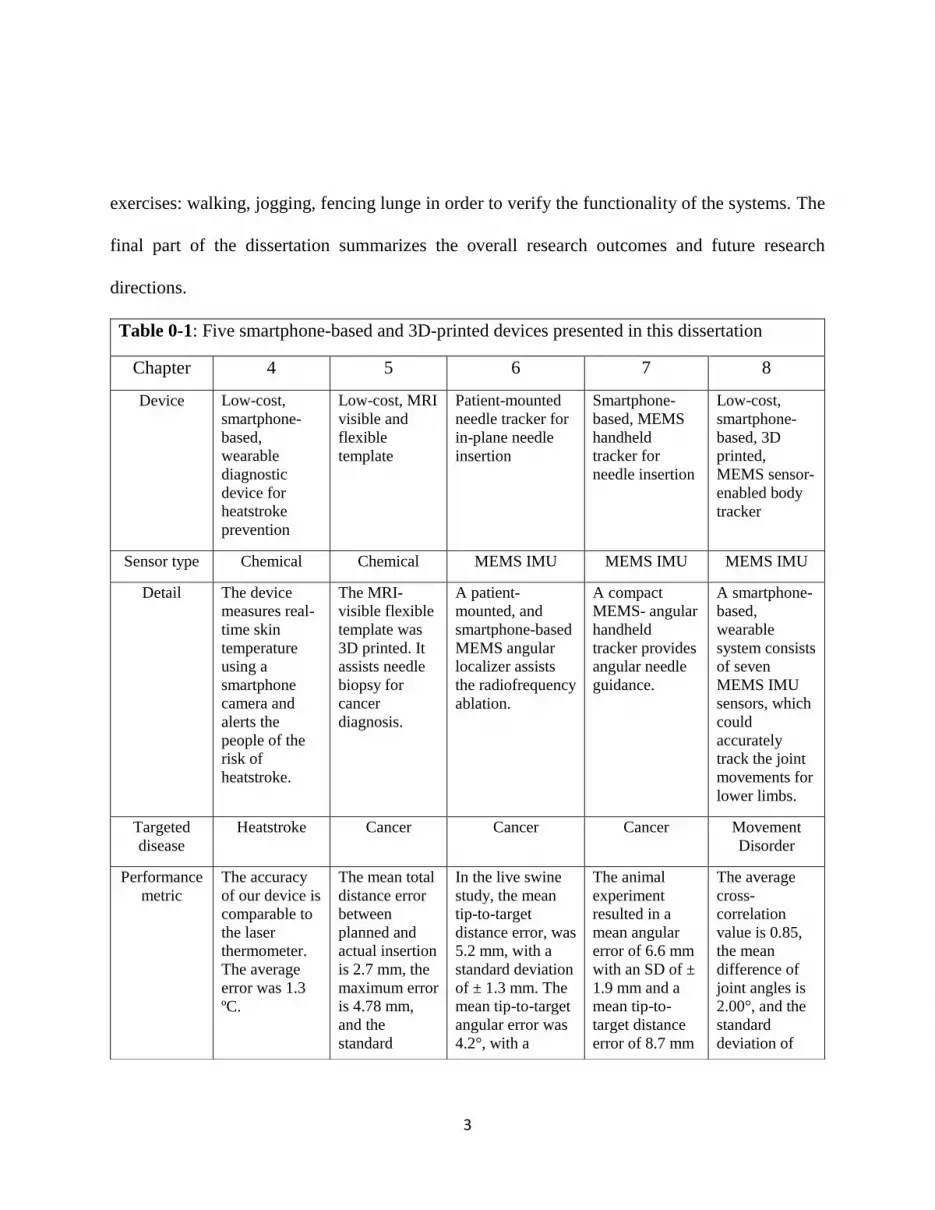
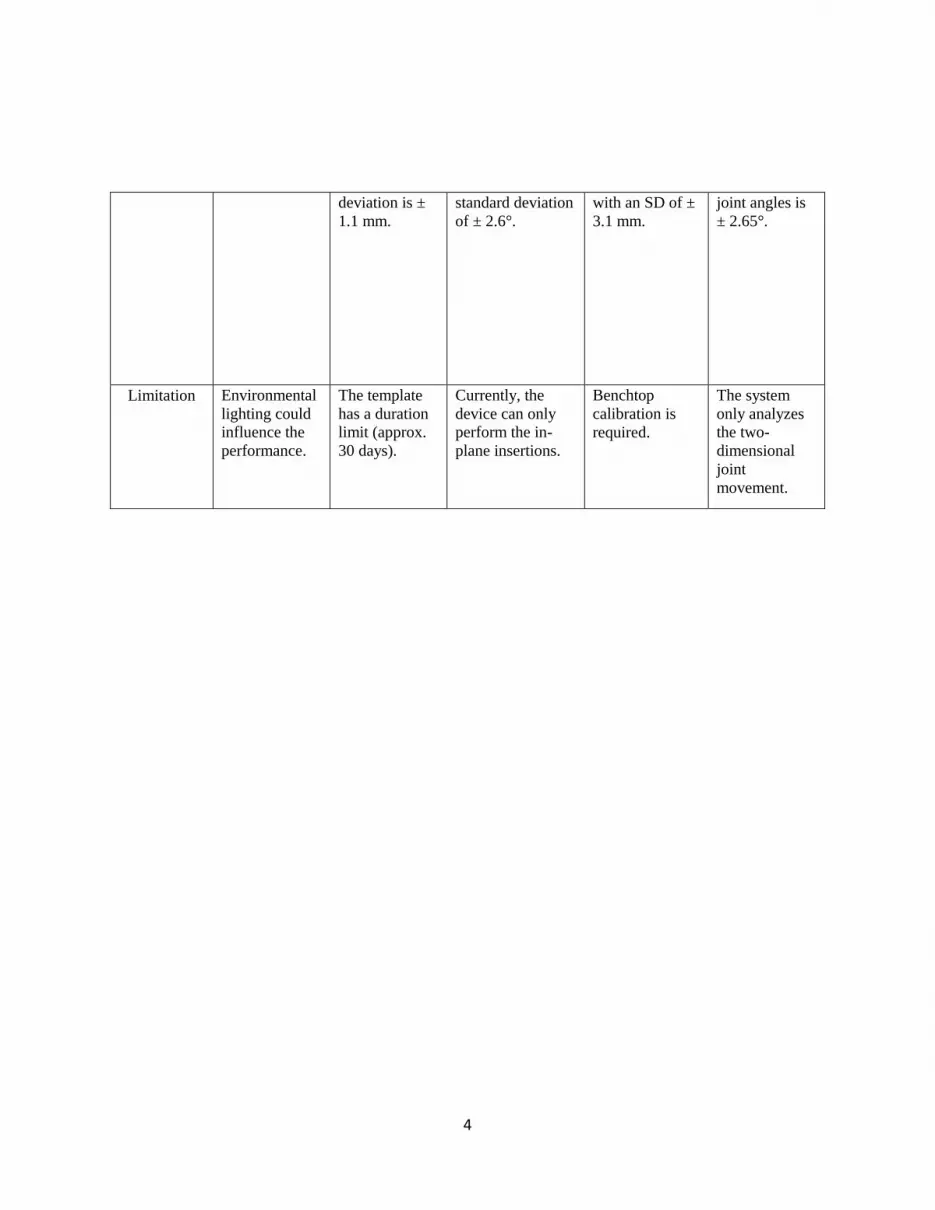
exercises: walking, jogging, fencing lunge in order to verify the functionality of the systems. The
final part of the dissertation summarizes the overall research outcomes and future research
directions.
Table 0-1: Five smartphone-based and 3D-printed devices presented in this dissertation
Chapter 4 5 6 7 8
Device Low-cost,
smartphone-
based,
wearable
diagnostic
device for
heatstroke
prevention
Low-cost, MRI
visible and
flexible
template
Patient-mounted
needle tracker for
in-plane needle
insertion
Smartphone-
based, MEMS
handheld
tracker for
needle insertion
Low-cost,
smartphone-
based, 3D
printed,
MEMS sensor-
enabled body
tracker
Sensor type Chemical Chemical MEMS IMU MEMS IMU MEMS IMU
Detail The device
measures real-
time skin
temperature
using a
smartphone
camera and
alerts the
people of the
risk of
heatstroke.
The MRI-
visible flexible
template was
3D printed. It
assists needle
biopsy for
cancer
diagnosis.
A patient-
mounted, and
smartphone-based
MEMS angular
localizer assists
the radiofrequency
ablation.
A compact
MEMS- angular
handheld
tracker provides
angular needle
guidance.
A smartphone-
based,
wearable
system consists
of seven
MEMS IMU
sensors, which
could
accurately
track the joint
movements for
lower limbs.
Targeted
disease
Heatstroke Cancer Cancer Cancer Movement
Disorder
Performance
metric
The accuracy
of our device is
comparable to
the laser
thermometer.
The average
error was 1.3
ºC.
The mean total
distance error
between
planned and
actual insertion
is 2.7 mm, the
maximum error
is 4.78 mm,
and the
standard
In the live swine
study, the mean
tip-to-target
distance error, was
5.2 mm, with a
standard deviation
of ± 1.3 mm. The
mean tip-to-target
angular error was
4.2°, with a
The animal
experiment
resulted in a
mean angular
error of 6.6 mm
with an SD of ±
1.9 mm and a
mean tip-to-
target distance
error of 8.7 mm
The average
cross-
correlation
value is 0.85,
the mean
difference of
joint angles is
2.00°, and the
standard
deviation of
4
deviation is ±
1.1 mm.
standard deviation
of ± 2.6°.
with an SD of ±
3.1 mm.
joint angles is
± 2.65°.
Limitation Environmental
lighting could
influence the
performance.
The template
has a duration
limit (approx.
30 days).
Currently, the
device can only
perform the in-
plane insertions.
Benchtop
calibration is
required.
The system
only analyzes
the two-
dimensional
joint
movement.
5
2. CHAPTER 2
LITERATURE REVIEW
2.1 Introduction
Precision medical technology is referring to use state-of-art technologies such as CT or
MRI imaging to provide precise surgical planning, diagnosis, and treatment. For example, the
minimally invasive surgery (MIS), which includes laparoscopic or robotic surgery, only requires
small incisions for surgical operation [1, 2]. Compared to open surgery, the MIS has better surgical
outcomes in treating small, early-stage malignancies, such as fewer surgical site infections, less
pain, and shorter hospital stays [3, 4]. Image-guided therapy (IGT) is the use of any form of
medical imaging to help with planning, performing and evaluating surgical procedures and
therapeutic interventions. It further improves the efficacy and reduces the surgical risk of MIS [5].
J.H. Clayton used the bromide print of an x-ray to remove an industrial sewing needle from
a worker’s hand, which was widely regarded as the first IGT [6]. Since then, the physicians rely
primarily on the different imaging modalities such as ultrasound, computer tomography, and
magnetic resonance imaging to acquire visual data for target guidance. However, in a clinical
setting, IGT creates multiple challenges to the physician, such as the disturbing hand-eye
coordination [7, 8] and impaired depth perception [9]. To overcome these challenges, navigational
technologies such as optical tracking [10, 11], IMU tracking [12], and electromagnetic tracking
[12, 13] are served as important informational supports to the physicians. This not only enhances
the spatial perception during the surgery but also allows better decision making in the stages of
6
pre-surgical and intermittent planning. It is widely recognized that the use of navigational
technologies greatly reduces surgical risk and time[14-16].
On the other hand, precision medical technology could also be applied to assisting post-
operative rehabilitation and treating neurodegenerative diseases. For example, movement
disorders could significantly reduce the patient’s quality of life by affecting their performance of
basic activities of daily living (ADL). Physical therapy is regarded as one of the most effective
approaches to assist the patient in restoring the movement functionalities [17]. Conventional
rehabilitation training programs typically involve intense repetition of coordination exercises and
require physical therapists to observe and assess the training outcome. A popular trend is to use
real-time motion tracking modalities such as optical tracking for more quantitative assessment of
patients’ physical activities [18].
This literature review provides detailed information about the current practice of precision
medical technology in four major areas: surgical planning, tracking, diagnosis, treatment, and
physical rehabilitation.
2.2 Precision Surgical Planning
Surgical planning is the pre-operative method of defining surgical steps by pre-visualizing
the surgical operating site [19]. In recent years, a fast advancement of image modalities enabled
physicians to tackle the challenge of accurate surgical planning. Nowadays, Ultrasound (US)
imaging [20-22], magnetic resonance imaging (MRI) [23, 24], computed tomography (CT)
scanning [25, 26], cone-beam CT [27], and X-ray imaging [28] are commonly used image
modalities for preoperative surgical planning.
2.2.1 Computed Tomography
Computed Tomography (CT) uses computer-processed combinations of X-ray
measurements taken from different angles to produce tomographic images on the areas of
7
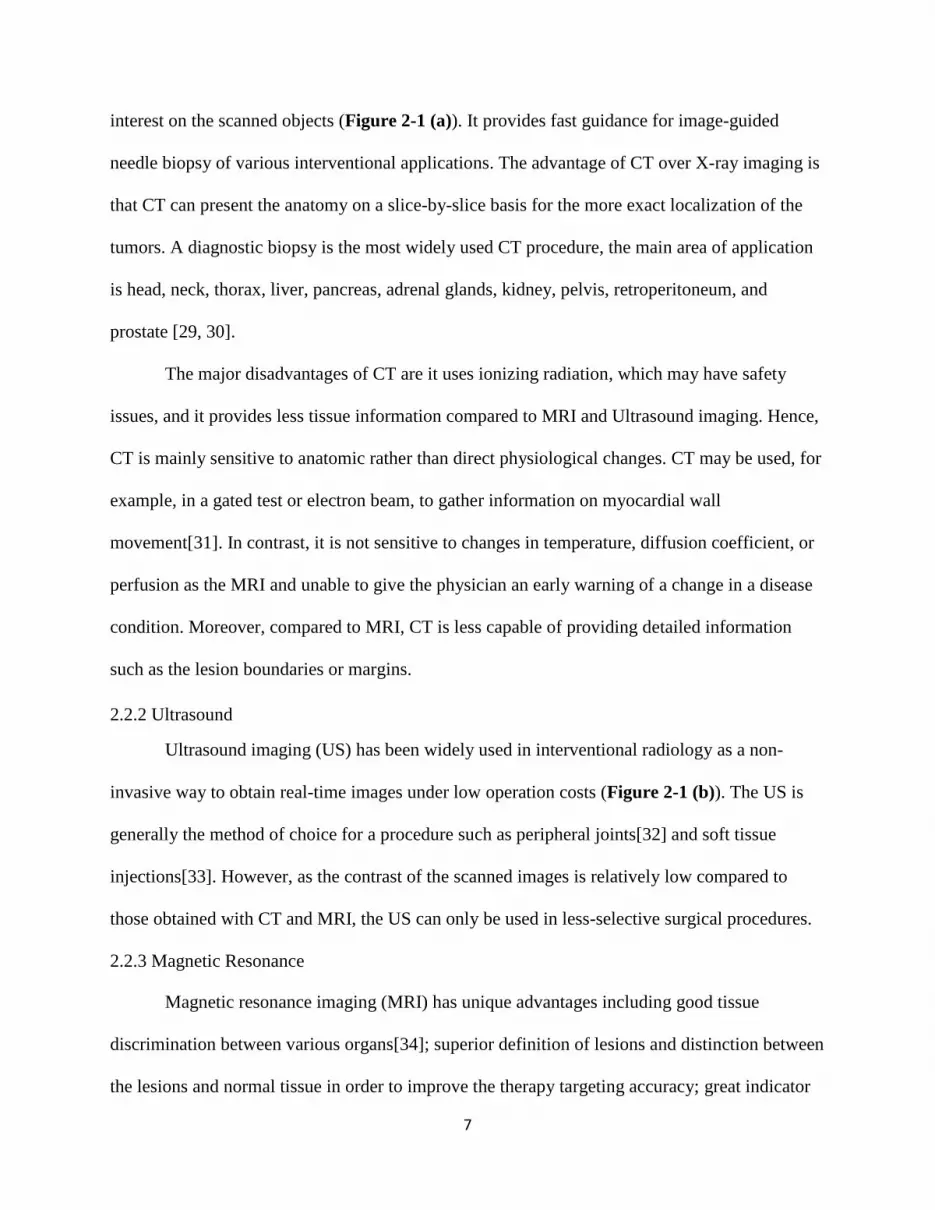
interest on the scanned objects (Figure 2-1 (a)). It provides fast guidance for image-guided
needle biopsy of various interventional applications. The advantage of CT over X-ray imaging is
that CT can present the anatomy on a slice-by-slice basis for the more exact localization of the
tumors. A diagnostic biopsy is the most widely used CT procedure, the main area of application
is head, neck, thorax, liver, pancreas, adrenal glands, kidney, pelvis, retroperitoneum, and
prostate [29, 30].
The major disadvantages of CT are it uses ionizing radiation, which may have safety
issues, and it provides less tissue information compared to MRI and Ultrasound imaging. Hence,
CT is mainly sensitive to anatomic rather than direct physiological changes. CT may be used, for
example, in a gated test or electron beam, to gather information on myocardial wall
movement[31]. In contrast, it is not sensitive to changes in temperature, diffusion coefficient, or
perfusion as the MRI and unable to give the physician an early warning of a change in a disease
condition. Moreover, compared to MRI, CT is less capable of providing detailed information
such as the lesion boundaries or margins.
2.2.2 Ultrasound
Ultrasound imaging (US) has been widely used in interventional radiology as a non-
invasive way to obtain real-time images under low operation costs (Figure 2-1 (b)). The US is
generally the method of choice for a procedure such as peripheral joints[32] and soft tissue
injections[33]. However, as the contrast of the scanned images is relatively low compared to
those obtained with CT and MRI, the US can only be used in less-selective surgical procedures.
2.2.3 Magnetic Resonance
Magnetic resonance imaging (MRI) has unique advantages including good tissue
discrimination between various organs[34]; superior definition of lesions and distinction between
the lesions and normal tissue in order to improve the therapy targeting accuracy; great indicator

8
for providing accurate trajectory definition with submillimeter spatial resolution; good selection
of image acquisition protocols such as echo-planar imaging (EPI), fast spin-echo imaging, and
gradient-echo imaging, enabling real-time visualization and characterization of physiological
changes. Due to the above merits, MRI is the gold standard imaging acquisition tool for
percutaneous surgical procedures (Figure 2-1 (c)). However, the working principle of MRI poses
great challenges in designing medical devices to work in the MR environment. If the medical
device has an electronic component, it will induce an electromagnetic field inside the scanner,
which results in a reduced signal-to-noise ratio (SNR) of the images. Moreover, the limited
workspace inside the scanner bore (approximately 60 cm) means the device has to be designed as
compact as possible, considering the patient's body has occupied at least half of the space.
(a) CT scanner (b) Ultrasound (c) MRI scanner
Figure 2-1: Three commonly used imaging modalities in Image-guided therapy, (a) shows the
CT scanner—Philips CT 6000 iCT[35], (b) shows the Ultrasound system—GE Voluson
S10[36], (c) shows the MRI scanner—Simens Avanto, which has a closed bore size of
approximately 60 cm[37].
2.2.4 Image Registration
The image-to-image registration is a process to integrate the pre-operative image data with
the intra-operative image data of the patient [38]. It plays an important role in the image navigation
procedure as it links the scanned images with the body of the patient on a shared coordinate system
[39], especially the images from different modalities such as MRI or ultrasound. Xu et al. have

9
successfully developed an MRI-TRUS fusion system for targeted prostate biopsy. The accuracy
of the systemin phantom studies was shown to be 2.4 ± 1.2 mm [40].
In general, there are two different methods to facilitate image registration: frame or
frameless registration [41]. In frame registration, such as the N-localizer developed by Brown et
al., each CT-visible fiducial marker is placed in a predefined position, and image registration is
completed via the known geometry of the fiducial markers [42]. Another method is to use
radiopaque markers for frameless registration, or frameless stereotaxis. The radiopaque markers
include pellets, crosshairs, and grids [43]. The Radiopaque markers have been shown to provide
information that helps find the tumor location and offer ease of use.[44-49] Different types of CT-
visible templates have been reported in past studies. Specifically designed skin-mounted marker-
based templates, such as the Fast Find grid, assist in determining the skin entry point.[50, 51]
Marker patterns, including but not limited to pre-manufactured patterns on dots, grids, and lines,
may provide enhanced capabilities in surgical navigation. Possibilities include designs that can
guide the needle’s skin entry angle and subsequent insertion, which conventional markers cannot
offer.
2.3 Precision Surgical Tracking
Imaging modalities can provide pre-operative anatomical and physiological information
for surgical planning, but the challenges remain as the physicians would need more information
on the surgical planning stage to decide the location of the skin-entry points, the angle, and depth
of insertion. The physician would also need real-time positional and orientational information of
the interventional devices. Therefore, surgical tracking devices, also known as the localizer,
become an essential component of the surgical procedure to increase the accuracy of the
minimally invasive surgery, and, more importantly, patient safety.

10
The continuous advancement of tracking devices has led to the new development of
image-guided systems. These devices were deployed to track the relative positions of
instruments to the patient’s anatomy. Early devices were mostly based on mechanical tracking.
In some of the earliest cases, Klopotek developed a mechanical tracking system for laser
surgery[52]. Later, the optical tracking systems were then quickly adopted because of their high
accuracy and large field of view[53]. Apart from that, electromagnetic trackers have been
available on the market for over two decades[54]. A typical clinical workflow of the image-
guided and tracking-aided procedure is shown in Table 2-1.
Table 2-1: Clinical workflow for an image-guided procedure
Steps Details
1 Preoperative images are acquired (typically tomographic images).
2 The surgical instruments are tracked using a localizer.
3 The patient's anatomy is registered to the preoperative image.
4
The position of the surgical instruments is displayed on this image relative to the
patient anatomy.
5 The physician uses this virtual display to manipulate the instruments to accomplish
the procedure.
6 A confirming image is obtained upon procedure completion.
Until now, there are many tracking devices have been commercialized, such as Polaris
optical tracking system (NDI, Waterloo, ON, Canada) and from the NOCTN150 system (Philips,
Amsterdam, Netherlands). Research on the feasibility of using these products in interventions has
been conducted (Table 2-2).
Table 2-2: Commercially available navigation system in interventions
Company name System type System name Performance metrics References NDI medical Electromagne
tic tracking
system (EM
tracking)
Aurora system Positional accuracy: RMS:
1.20 mm, 95% Confidence
Interval: 1.80 mm
Orientational accuracy: RMS:
0.5°, 95% Confidence Interval:
0.7°
[55]

11
Meanwhile, there are many preclinical and clinical studies relating to electromagnetic
tracking. Shwartz et al. published the first preclinical study on electromagnetic bronchoscopy
(ENB)[60]. Peripheral lung lesions were created in four swine models by insertion of a metal tube
NDI medical Optical
tracking
system
Polaris Vega Positional accuracy: RMS:
0.12 mm (pyramid), RMS: 0.15
mm (extended pyramid)
95% Confidence Interval: 0.20
mm (pyramid), 0.30 (extended
pyramid)
[56]
Philips Image fusion
and needle
navigation
NOCTN150 The accomplished Euclidean
distances were 4.42 ± 1.33 mm,
4.26 ± 1.32 mm, and
4.46 ± 1.56 mm at a slice
thickness of 1, 3, and 5 mm,
respectively. The mean lateral
positional errors were
3.84 ± 1.59 mm, 3.84 ± 1.43 mm,
and 3.81 ± 1.71 mm, respectively
[57]
Medtronic Electromagne
tic
Navigation
Stealth Station
AxiEM
The Euclidean distances were
3.86 ± 2.28 mm, 3.74 ± 2.1 mm,
and 4.81 ± 2.07 mm at a slice
thickness of 1, 3, and 5 mm,
respectively. The mean lateral
positional errors were
3.29 ± 1.52 mm, 3.16 ± 1.52 mm,
and 3.93 ± 1.68 mm,
respectively.
[57]
Amedo Laser
navigation
system
LNS Target point accuracy of 5.0 ±
1.2 mm, entrance point
accuracy of 2.0 ± 1.5 mm,
needle angulation accuracy of
1.5 ± 0.3°, intervention time of
12.08 ± 3.07 minutes, and used
5.7 ± 1.6 CT-images for the
first experience with patients.
[58]
CAScination An optical
stereotactic
navigation
system
CAS-One IR Performance data could be
evaluated for 17 patients with
25 lesions (mean [± SD] lesion
diameter, 14.9 ± 5.9 mm; mean
lesion location depth, 87.5 ±
27.3 mm). The antennae were
placed with a mean lateral error
of 4.0 ± 2.5 mm, a depth error
of 3.4 ± 3.2 mm, and a total
error of 5.8 ± 3.2 mm in
relation to the intended target.
[59]
12
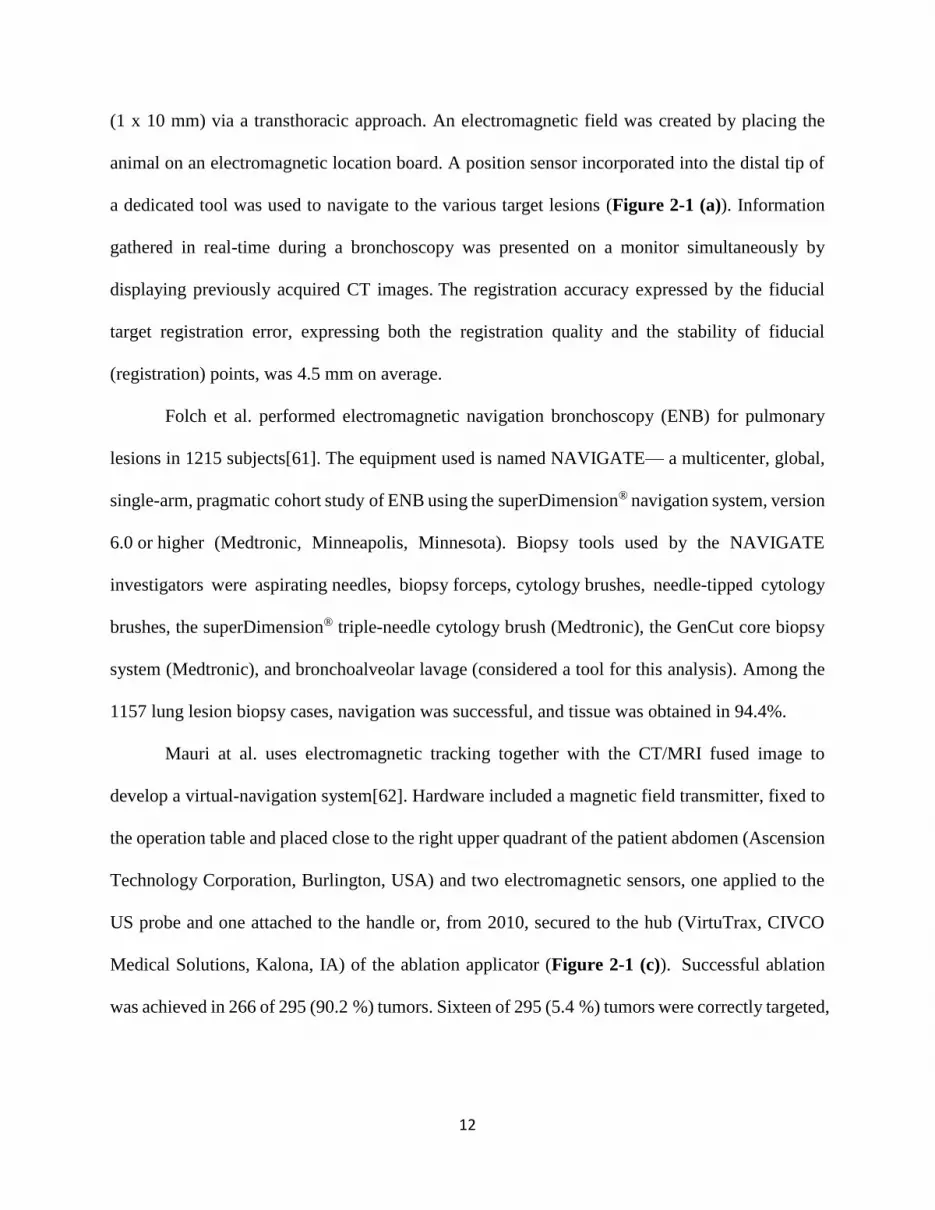
(1 x 10 mm) via a transthoracic approach. An electromagnetic field was created by placing the
animal on an electromagnetic location board. A position sensor incorporated into the distal tip of
a dedicated tool was used to navigate to the various target lesions (Figure 2-1 (a)). Information
gathered in real-time during a bronchoscopy was presented on a monitor simultaneously by
displaying previously acquired CT images. The registration accuracy expressed by the fiducial
target registration error, expressing both the registration quality and the stability of fiducial
(registration) points, was 4.5 mm on average.
Folch et al. performed electromagnetic navigation bronchoscopy (ENB) for pulmonary
lesions in 1215 subjects[61]. The equipment used is named NAVIGATE— a multicenter, global,
single-arm, pragmatic cohort study of ENB using the superDimension® navigation system, version
6.0 or higher (Medtronic, Minneapolis, Minnesota). Biopsy tools used by the NAVIGATE
investigators were aspirating needles, biopsy forceps, cytology brushes, needle-tipped cytology
brushes, the superDimension® triple-needle cytology brush (Medtronic), the GenCut core biopsy
system (Medtronic), and bronchoalveolar lavage (considered a tool for this analysis). Among the
1157 lung lesion biopsy cases, navigation was successful, and tissue was obtained in 94.4%.
Mauri at al. uses electromagnetic tracking together with the CT/MRI fused image to
develop a virtual-navigation system[62]. Hardware included a magnetic field transmitter, fixed to
the operation table and placed close to the right upper quadrant of the patient abdomen (Ascension
Technology Corporation, Burlington, USA) and two electromagnetic sensors, one applied to the
US probe and one attached to the handle or, from 2010, secured to the hub (VirtuTrax, CIVCO
Medical Solutions, Kalona, IA) of the ablation applicator (Figure 2-1 (c)). Successful ablation
was achieved in 266 of 295 (90.2 %) tumors. Sixteen of 295 (5.4 %) tumors were correctly targeted,

13
but the necrosis volume size was insufficiently large to cover the whole tumor volume and the
ablative margin, resulting in incomplete ablation.
Dixon et al. developed a localized intraoperative virtual endoscopy in a preclinical setting
before deployment in the operating room[63]. Optical IGS reflective markers were attached to the
head, the 0° endoscope (Hopkins II telescope and IMAGE1 camera; Karl Storz, Tuttlingen,
Germany), and the drill (M4 hand‐piece; Medtronic, Jacksonville, FL). Registration of the head to
the imaging data was then undertaken with an optical tracking system (Polaris; NDI, Waterloo,
Ontario, Canada). Skull base procedures were performed on 14 cadaver specimens by seven
fellowship‐trained skull base surgeons. All seven participants completed the two clivus ablation
exercises. Fiducial registration errors were consistent with current clinical practice (between 1 mm
and 1.8 mm for all cases).
Some researchers have developed novel navigation based on a smartphone. Xu et al.
develop an iOS-based iPhone (Apple) app, OncoGuide (National Institutes of Health), with Xcode
(version 8.3.3, Apple) using Objective-C (Apple)[64]. The accuracy and efficacy of smartphone-
guided needle angle selection were evaluated using commercial phantoms. The accuracy was 0.4°
± 0.3° across ten trials.
Figure 2-1 shows the devices being used in preclinical or clinical studies.
14
Figure 2-2: Some of the currently available navigation systems, (a) shows Shwartz et al.’s
research work[60], (b) shows Fichtinger et al.’s research work[65], (c) shows Mauri et al.’s
research work[62], and (d) shows Dixon et al.’s research work[63].
2.4 Precision Diagnosis
Precision diagnosis is a procedure that can detect and check the disease condition of the
patients using either external physiological signals or internal biological samples.
2.4.1 Diagnosis Based on External Physiological Signals
As for the external physiological signals, the skin temperature, the pulse rate as well as
breath rate can all be used as essential references for detecting anomaly on human bodies.
Bovenzi proposed a finger skin temperature measurement for the evaluation of peripheral
vascular reactivity[66]. There are factors that could potentially influence the diagnostic
significance, such as room temperature, season, and food intake [67].
2.4.2 Diagnosis Based on Internal Tissue Samples
As for the internal biological samples, a needle biopsy was commonly used to extract
tumor samples in a minimally invasive way to determine the stage of cancers. For example, the
needle biopsy is a frequently used method to acquire tissue samples for histological analysis.

15
There are approximately 1 million prostate biopsy procedures conducted in the US each year [68,
69] for the diagnosis of prostate cancer. One popular approach is to use prostate biopsy, for
which Transrectal Ultrasound (TRUS) or Magnetic Resonance Imaging (MRI) serves as the
imaging tool [70-72]. MRI, especially multi-parametric MRI, is currently the most promising
imaging modality for detecting prostate cancer with great accuracy [73, 74]. An early
investigation by D’Amico A.V. et al. performed a transperineal MRI-guided prostate biopsy in
an open configuration 0.5 Tesla MRI scanner [75]. Nowadays, high-precision robotic systems
have been applied to overcome the problem of limited patient access inside the bore of the MRI
scanner. Fichtinger et al. designed one of the first manually powered platforms for prostate
interventions in a closed MR system. The system was reported to have a size of a carry-on
suitcase, and have a 7-DoF, passive mounting arm with a motorized end effector. In the phantom
study, the average distance error between the needle tip and the target was 2 mm [76].
Alternatively, some studies have been focusing on assistive medical devices. Tokuda et al.
developed a rigid acrylic template for a transperineal needle biopsy. The distance errors (root-
mean-square) between the needle and the planned targets were 4.9 mm [77].
2.5 Precision Surgical Treatment
Minimally Invasive or percutaneous Surgery (MIS) has been regarding as an important
milestone in modern surgery. It is a surgical procedure that involves small cut openings,
miniaturized instruments, and anatomic imaging guidance. Bozzini developed the first endoscope
for minimally invasive surgery in 1806 [78]. Since then, thanks to the constantly evolutionary
advancement, the surgical instruments used in MIS has transformed from simple and bulky devices
to sophisticated and automated instruments. During the past decade, the MIS has significantly
influenced many surgical specialties, such as thoracic surgery[79], gastrointestinal tract[80],

16
cardiac surgery[81], oral and maxillofacial surgery[82], and nephrectomy[83]. It is foreseeable
that major surgical procedures will be leaning towards a minimally invasive approach[84, 85].
However, as to the physicians, MIS were both new opportunities and challenges for them
as MIS could potentially reduce surgical accuracy and introduce unexpected complications[86].
The procedure poses a learning curve risk for physicians to operate new instruments in the OR.
Another problem is that indirect vision and manipulation of soft tissues could disturb hand-eye
coordination as well as the perception of depth. In order to overcome the above challenges, one
current trend is to integrate the MIS with image-guided intervention technologies.
One typical MIS procedure—thermal energy-based tumor ablation is referring to the
destruction of human tissue via extreme temperature (high or low). Percutaneous energy-based
ablation has been applied for the treatment of many types of malignancies, such as liver[87],
kidney[88], lung[89], and bone cancers[90]. In order to control the level of energy deposition,
either multiple temperature probes[91] or specialized temperature-sensitive imaging methods
(particularly MRI) are employed[92]. In the ideal thermal therapy procedure, the targeted tissue
volume is heated to 57-60°C for protein denaturing[93]. The application of thermal surgery has
gradually increased due to the improvement of imaging guidance and monitoring. MR imaging is
sensitive to temperature changes, and recent advances have made it possible to obtain MR images
in less than 1 second, thus making it feasible to obtain and update three-dimensional temperature
change "maps" of the tissue under consideration in times matched to the temporal resolution of the
thermal changes so as to avoid artifacts [29]. This feature allows MRI thermometry to be used to
guide, monitor, and control the thermal ablation [94].

17
2.5.1 Radiofrequency Ablation
One of the most commonly used thermal ablation technique is called radiofrequency
ablation (RFA). RFA was primarily developed for the treatment of aberrant cardiac pathways and
has now been increasingly used for renal masses and prostate hyperplasia [[95]. The main
mechanism of RFA depends primarily on the principle of heat conduction caused by high
frequency alternating RF current. Many clinical cases have reported using RFA procedures under
image guidance, such as CT [96] and ultrasound [97], but not MRI due to the interference.
2.5.2 Laser Ablation
Interstitial Laser Therapy (ILT) is another minimally invasive technique that uses image-
guided needle probes, which delivers focused laser energy and destroys tumor cells[98]. MRI
monitoring of interstitial laser therapy has been suggested [99]. ILT has shown to treat many
tumor-specific pathologies such as radiation necrosis [100] and pediatric brain tumors [101]. ILT
has proved useful for cases in which the tumor locations are difficult to access or high-risk
surgical patients involved[102].
However, ILT has the drawback of a wide range of temperature profiles across the optical
fiber, which could create a non-uniform thermal lesion through the ablation site. Image guidance
has helped to mitigate the drawback of this procedure. Baccaria et al. have conducted a study of
brachytherapy of malignant lung lesions using MRI images together with interstitial laser
therapy. The results showed the technique is safe to operate [103].
2.5.3 Cryoablation
A number of studies have suggested cryotherapy could destroy tumors using extreme
cold. This would allow for the implementation of MIS treatment without damaging collagenous
tissue structures[104]. Cryoablation is a promising technology due to its relatively low cost,
effective cellular necrosis, and anesthetic effect due to cell cooling[105]. Current cryosurgical

18
procedures are either open (oral) or percutaneous (prostate). Image guidance and continuous
monitoring are required [106]. Recent technological developments in the cryoprobes have made
MRI guidance possible[107].
2.5.4 Ultrasound Ablation
Focused ultrasound (FUS) evolved from lithotripsy and has affinities to localized
hyperthermia techniques pioneered in the 1940s and 1950s. FUS uses an ultrasound transducer to
create a point source of heat at its focus[108]. High-aperture ultrasound transducers are able to
create a converging beam for focal treatment. The ablation temperature is between 70°C and
100°C. The point source of heat could generate a uniform cylindrical shape (Diameter:1—3 mm
and Length: 2—5 mm). The advantage of using FUS is that it destroys only the target without
affecting the surrounding tissues. However, the lack of appropriate localization and temperature-
monitoring techniques has made it difficult to achieve clinically useful applications. Both
Ultrasound and MRI has been suggested as the optimal technique for spatially localizing,
targeting, and controlling heat deposition and has been tested by various research groups[109-
111]. The rapid MRI image acquisition can offer instant feedback to the physicians, which
significantly reduces the risk of damaging to normal structures. Figure 2-3 shows four examples
of commercially available surgical treatment devices.

19
Figure 2-3: Show some commercially available devices. (a) LeVeen needle electrodes by
Boston scientific [112], (b) StarBurst XL & semi-flex RFA device by Angiodynamics [113],
(c) Valleylab Cool-tip RF ablation system by Covidien [114], (d) Visualase MRI-guided
ablation system by Medtronic [115].
Table 2-3 shows the details of the medical devices mentioned in Figure 2-3.
Table 2-3: The working principle and performance metrics of selected devices.
Company Commercial
System
Working
Principle Performance metric Reference
Boston Scientific
(Natick, MA)
LeVeen
Needle
Electrode
Radiofrequency
ablation (RFA)
This method enabled
safe ablation without
complications. The
mean follow-up period
was 13.5 month (range,
9–18 months). No local
recurrence was observed
at the follow-up points.
[112]
AngioDynamics
(Queensbury, NY)
StarBurst XL RFA The largest diameter of
ablation was 25.6 ±
3.7 mm, the smallest
diameter 21.9 ± 2.9 mm,
and the ablation volume
was 7.20 ± 2.38 cm3
[113]
Covidien (Mansfield,
MA)
Valleylab
Cool-tip RFA
system
RFA Long- and short-axis
diameters of the ablation
areas by RFA were
30.9 ± 1.1 mm, and
26.8 ± 2.9 mm,
respectively.
[114]

20
2.5.5 Robotic-assisted Ablation
The da Vinci robotic surgical system (Intuitive Surgical, Sunnyvale, CA) has been proved
to be one of the most prominent robotic surgical systems. It has been applied in for a wide range
of procedures, such as lung interventions. The da Vinci system has two major units—the
physician’s console unit and manipulator units. The physician’s console unit is basically the user
display and interacting system, which can provide the physician with the virtual in-vivo
operational information. Apart from that, there a variety of manipulator units, including
telemanipulators and endoscopic cameras. The physician sits at the console look at the binocular
display of the operational field while controlling the manipulator unit to carry out different surgical
tasks. Hubens et al. reported a performance study and showed that the inexperienced user was able
to complete the task with fewer mistakes and faster speed[116]. Park et al. also used this system
for a clinical trial of 34 patients, and the study approved the system was feasible and safe for video-
assisted thoracic surgeries[117]. Table 2-4 shows typical examples of commercialized robotic
systems.
Medtronic Visualase Laser Ablation The ablation ares was
0.30 ± 0.18 cm2 in
kidney samples and 0.69
± 0.41 cm2 in liver.
[115]
Table 2-4: Commercially available surgical robotic system for interventions
Company Commercial
System
Type of
surgery Performance metric
Reference
Renishaw NeuroMate Neurosurgical
procedure
(1) with the robot in a frame-
based configuration, the RMS
error was 0.86 ± 0.32 mm; (2)
with the robot in the frameless
configuration. The RMS error
was 1.95 ± 0.44 mm; (3) in a
standard stereotactic (ZD) frame-
based approach. The RMS error
was 1.17 ± 0.25 mm; (4) with an
infrared tracking system using the
[118]

21
Micro Hand S (Tianjin University, China) consists of a surgeon console as well as a slave
cart, which was claimed to require less maintenance work and adjustable sensitivity level of the
robotic operation. The first clinical trial was reported recently [124]. The Flex robotic system
(Medrobotics, Raynham, MA, USA), which received the US FDA in 2015, provides surgeons
with single-site access visualization of hard-to-reach anatomical locations. Remacle et al.
reported the first surgical application of the Flex robotic system on humans by performing three
frame for fiducial registration.
The RMS error was 1.47 ± 0.45
mm; (5) with an infrared tracking
system using screw markers for
registration. The RMS error was
0.68 ± 0.26 mm.
Prosurgics Pathfinder Neurosurgical
procedure
A total of 140 targets were tested
with an average of 3—4 targets
per patient. The mean application
accuracy was less than 1 mm, and
the application accuracy was
consistent in all targets in the
same patient.
[119]
Maxor Robotics Renaissance Spinal surgery The average distance of the
screws from the facets was 5.2 ±
2.1 mm and 2.7 ± 1.6 mm in the
Robot-PLIF and Freehand-PLIF
groups, respectively (P < 0.001).
[120]
Curexo
Technology
Corp
THINK
Surgical
TSolution-
One
Knee surgery The mean surgical duration for
our robotic-assisted TKA patients
was 91 min. The robotic-assisted
TKA can be performed by one
surgeon, one assistant, and one
scrub nurse. One additional
THINK Surgical staff is required
on-site to control the robot,
provide technical assistance, and
rectify intraoperative workspace
errors as required.
[121]
MAKO Robotic
Interactive
Arm (RIO)
Knee surgery RMS errors were within 3° for all
femoral component alignments.
The mean tibial RMS error was
1.5°, and the mean femoral RMS
error was 2.6°.
[122]
Intuitive
Surgical
da Vinci Lung surgery The operating time was 46 —300
min, averaged at 91.51 ± 30.80
min.
[123]
22
procedures of transoral robotic surgery [125]. Titan Medical (Toronto, ON, Canada), a public
company, has developed the Single Port Orifice Robotic Technology (SPORT™ surgical system).
The system contains two articulating instruments with disposable and replaceable tips and a 3D
high-definition camera. The incision can be as small as 25 mm [126].
Revo-i (Meere Company Inc., Yongin, Republic of Korea) includes a surgeon control
console, a four-arm robotic operation cart, a high-definition vision cart, and reusable endoscopic
instruments. A preclinical study of Revo-i was completed on the porcine model in 2016. Chang
et al. and Kang et al. performed human clinical trials of robotic prostatectomy and
cholecystectomy, respectively, using Revo-I [127, 128].
The multiport surgical robotic ALF-X system (SORAR SpA, Milan, Italy) was firstly
designed for gynecological surgery. Fanfani et al. reported that 146 cases of hysterectomy were
carried out with the ALF-X system for benign and malignant diseases [129]. Compared to the da
Vinci system, each arm of ALF-X can be positioned independently from the others in the
surgical field. The system has incorporated haptic feedback and a remote 3D vision with an eye-
tracking system. However, one of the limitations is the lack of wristed instruments such as
needle drivers used in the da Vinci system.

23
Figure 2-4: Shows (a) Micro Hand S system, which was developed by Tianjin University,
China, has a three-arm operation cart [124], (b) Revo-i robotic system, which was developed
by Mere company, South Korea, has a four-arm operation cart [80], (c) da Vinci robotic
system, which was developed by Intuitive Surgical, has a four-arm operation cart, a surgeon
console, and vision cart [123].
2.6 Precision Physical Rehabilitation
Physical rehabilitation, or physical medicine, aims to enhance and restore functional
ability to those whose activities of daily life (ADL) has been significantly impacted by physical
impairment and disabilities. In another words, it is a set of interventions required when a person
is experiencing or is likely to experience limitations in daily functioning due to aging or a health
condition, including chronic diseases or disorders, injuries or traumas. It is a highly person-
centered health strategy that may be delivered through specialized rehabilitation programs. There
is one specific type of rehabilitation called neurorehabilitation. It aims at treating conditions such
as movement disorders. The patients have to repetitively move their limbs so that functional
patterns can be produced. Common movement disorders include but are not limited to

24
Friedreich's ataxia [130], cervical dystonia [131], Huntington’s disease [132], and Parkinson’s
disease [133-135]. For example, Parkinson’s disease has affected 1 million people in the US and
5 million people worldwide [136]. Rehabilitative locomotor training is very labor intensive, and
requires three or four physical therapists for one patient intervention. In recent years, new
technologies have been applied to enhance the efficacy of neurorehabilitation. Significant
breakthroughs have occurred in the fields of wearable IMU sensors, rehabilitation robots, and
virtual reality (VR)–based physical therapy.
2.6.1 IMU-assisted Rehabilitation
The micro-electro-mechanical systems (MEMS) IMUs has given a new surge to motion
tracking research [137-140]. These devices are cost-effective for accurate, non-invasive, and
portable motion tracking. The major point of interest in these devices is that they can overcome
the limitations of optical systems and mechanical trackers. The use of inertial sensors has
become a common practice in ambulatory rehabilitation [141, 142]. In order to increase the
accuracy and attain drift-free orientation estimation, several works of literature reported
combining the signals from 3D gyroscopes, accelerometers, and magnetometers. Kong et al.
have developed an IMU-based motion capture system. The WB-4R sensor composed of a 3-axis
gyroscope and a 3-axis magnetometer. The results showed the accuracy of motion tracking is
comparable to a commercially optical system Optitrack[143]. However, other researches have
reported potential interference on the accelerator as well as magnetometer due to the presence of
vibration and ferromagnetic material. Chang et al. developed a new logarithm based on the
Direction Cosine Matrix (DCM), only use the input from a gyroscope. The result approved the
feasibility of measuring human joint angles via IMU sensors[144]. Table 2-5 summarizes some
of the major commercialized and under-developed systems.

25
Figure 2-6 shows some developed IMU motion tracking systems. The Xsens system has
17 sensors, which can track full-body movement (Figure 2-6 (a)). Muller et al. developed a self-
Table 2-5: Current commercially available or under-developed IMU systems
Companies
or research
group
System No. of
sensors
Main body
area
Detail Reference
Xsens
Technologies
MVN 17 Full body Xsens MVN consists of 17
inertial and magnetic sensor
modules. Data is transmitted
by a wireless connection to the
laptop computer on which the
processing is performed and
visualized. A suit is used for
quick and convenient
placement of sensors and
cables.
[145]
Muller et al. Xsens-
MTs
Awinda
2 Upper limbs The device is alignment-free
and self-calibrating using
arbitrary movements of the
user and an initial zero
reference arm pose
[146]
Chang et al. Custom 2 Upper limbs It is a device for angle
measurement method through
the IMU sensor, which can be
mounted on the fingers and
have the ability to measure each
angle of each finger.
[144]
Kong et al. WB-4R 7 Lower Limbs The IMU sensing system is
composed of seven WB-4R
IMUs. One placed on the
subject on the lumbar spine,
one on each upper leg, one on
each lower leg, and one on each
forefoot. Each IMU was
positioned roughly in the
middle of the segments
considered in the kinematic
model.
[143]
Bakhshi et al. Custom 2 Lower limbs It is a device to measure knee
angle using two IMU sensors
mounted on the body shank and
thigh. The measurements are
transmitted to a computer via
Bluetooth protocol for further
data analysis and evaluation.
[147]

26
calibrating elbow angle device (Figure 2-6 (b)). Chang et al. developed a device for finger
rehabilitation (Figure 2-6 (c)). Bakhshi et al. developed a device to track knee movement (Figure
2-6 (d)).
Figure 2-5: Different types of IMU motion tracking systems. (a) Xsens system [145], (b)
Muller et al.’s self-calibrating elbow angle device [146], (c) Chang et al.’s developed finger
device [144], and (d) Bakhshi et al.’s body joint angle measurement system [147].
2.6.2 Robotic-assisted Rehabilitation
Robotic rehabilitation is currently regarded as a rapidly developing field, which is
considered as a complementary technology to the therapist’s work [148-151]. One of the major
advantages of using robots is that they can deliver highly intensive training [152]. Assistive
robotic systems are designed to allow patients to have more autonomy with a wider range of
exercise tasks. The use of robotic devices has been reported to be an effective additional
therapeutic treatment and motor learning [153], including the effectiveness of repetitive grasp and
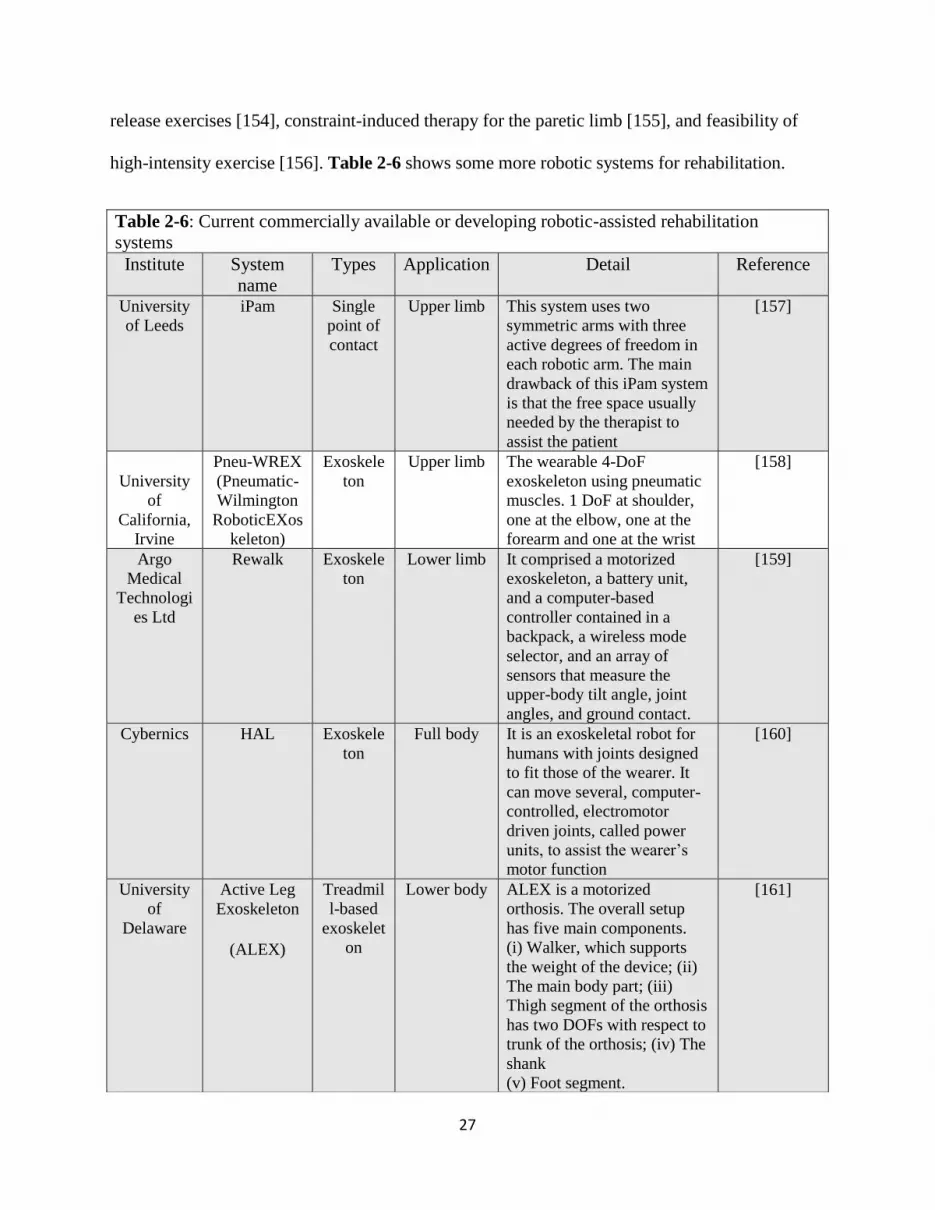
27
release exercises [154], constraint-induced therapy for the paretic limb [155], and feasibility of
high-intensity exercise [156]. Table 2-6 shows some more robotic systems for rehabilitation.
Table 2-6: Current commercially available or developing robotic-assisted rehabilitation
systems
Institute System
name
Types Application Detail Reference
University
of Leeds
iPam Single
point of
contact
Upper limb This system uses two
symmetric arms with three
active degrees of freedom in
each robotic arm. The main
drawback of this iPam system
is that the free space usually
needed by the therapist to
assist the patient
[157]
University
of
California,
Irvine
Pneu-WREX
(Pneumatic-
Wilmington
RoboticEXos
keleton)
Exoskele
ton
Upper limb The wearable 4-DoF
exoskeleton using pneumatic
muscles. 1 DoF at shoulder,
one at the elbow, one at the
forearm and one at the wrist
[158]
Argo
Medical
Technologi
es Ltd
Rewalk Exoskele
ton
Lower limb It comprised a motorized
exoskeleton, a battery unit,
and a computer-based
controller contained in a
backpack, a wireless mode
selector, and an array of
sensors that measure the
upper-body tilt angle, joint
angles, and ground contact.
[159]
Cybernics HAL Exoskele
ton
Full body It is an exoskeletal robot for
humans with joints designed
to fit those of the wearer. It
can move several, computer-
controlled, electromotor
driven joints, called power
units, to assist the wearer’s
motor function
[160]
University
of
Delaware
Active Leg
Exoskeleton
(ALEX)
Treadmil
l-based
exoskelet
on
Lower body ALEX is a motorized
orthosis. The overall setup
has five main components.
(i) Walker, which supports
the weight of the device; (ii)
The main body part; (iii)
Thigh segment of the orthosis
has two DOFs with respect to
trunk of the orthosis; (iv) The
shank
(v) Foot segment.
[161]

28
Handy 1 (Rehab Robotics, Keele, UK) was the first commercial assistive robot for
rehabilitation [162]. It is controlled by a single switch input to select the desired actions as it was
designed to assist a young patient. Another early task-specific rehabilitation system is the Neater
Eater (Neater Solutions, Buscton, UK), a modular device assist patient’s eating recovery and can
be controlled either by hand or via head or foot switches [163]. Other research mainly focuses on
robotic arms with more degrees of freedom. Exact Dynamics’ iARM had a robotic arm and two-
fingered grasper. The robot can be mounted to electric wheelchairs and accessible via multiple
ways such as a keypad, joystick, or single button [164]. The Mobility System (Myomo,
Cambridge, MA, USA) is designed to be a wearable device that can achieve patient arm
movement activated by biosignals [165].
Figure 2-6: Shows the systems of (a) Rewalk developed by Argo Medical Technologies Ltd
[159], (b) ALEX developed by University of Delaware [161], (c) HAL developed by Cybernic
s [160], (d) I-Pam developed by University of Leeds [157].

29
2.6.3 VR-based Rehabilitation
Virtual reality (VR) in neurorehabilitation is an emerging approach that shows great
promise to enhance the motor learning of the patients, resulting in more effective motor
recovery. VR Rehabilitation is defined as a “group of all forms of clinical intervention (physical,
occupational, cognitive, or psychological) that are based on, or augmented by, the use of virtual
reality, augmented reality, and computing technology” [166]. The range of virtual rehabilitation
includes local interventions or telerehabilitation. VR therapies or interventions are conducted
using real-time motion tracking as well as computer graphic technologies to display the patients’
physiological behavior during assigned specific tasks in a virtual rehabilitation environment.
VR rehabilitation has been applied in Stroke [167], Cerebral palsy[168], Parkinson’s
[169], and many other conditions. Using VR as a tool for healthcare has the advantage of real-
time feedback and modification and flexible training programs [170]. Moreover, VR offers
personalized treatment and further standardizes the assessment and training protocols [171].
The features of immersion and interactive engagement enables VR to offer the patients
with unique experiences that are extensive, surrounding, inclusive, vivid, and matching
[172]. This will improve the assessment outcome of neurorehabilitation. The current
development of VR rehabilitation can be divided into three different categories: non-immersive,
semi-immersive, and fully immersive. Subramanian et al. studies of the upper extremity
movement patterns of the patients with a fully immersive system. They use a head-mounted
device (HMD) with a FOV of 50°, a rear-projection system, and a motion tracking system
(Optotrak Certus, NDI, Ontario Canada) [173]. Slobounov et al. compared the postural stability
and navigation success rates between 3D VR (fully immersive system) and 2D projection screen
(semi-immersive system) in spatial navigation tasks. The test results reported that the fully
immersive system enables the patients to focus more on cognitive and motor training. The
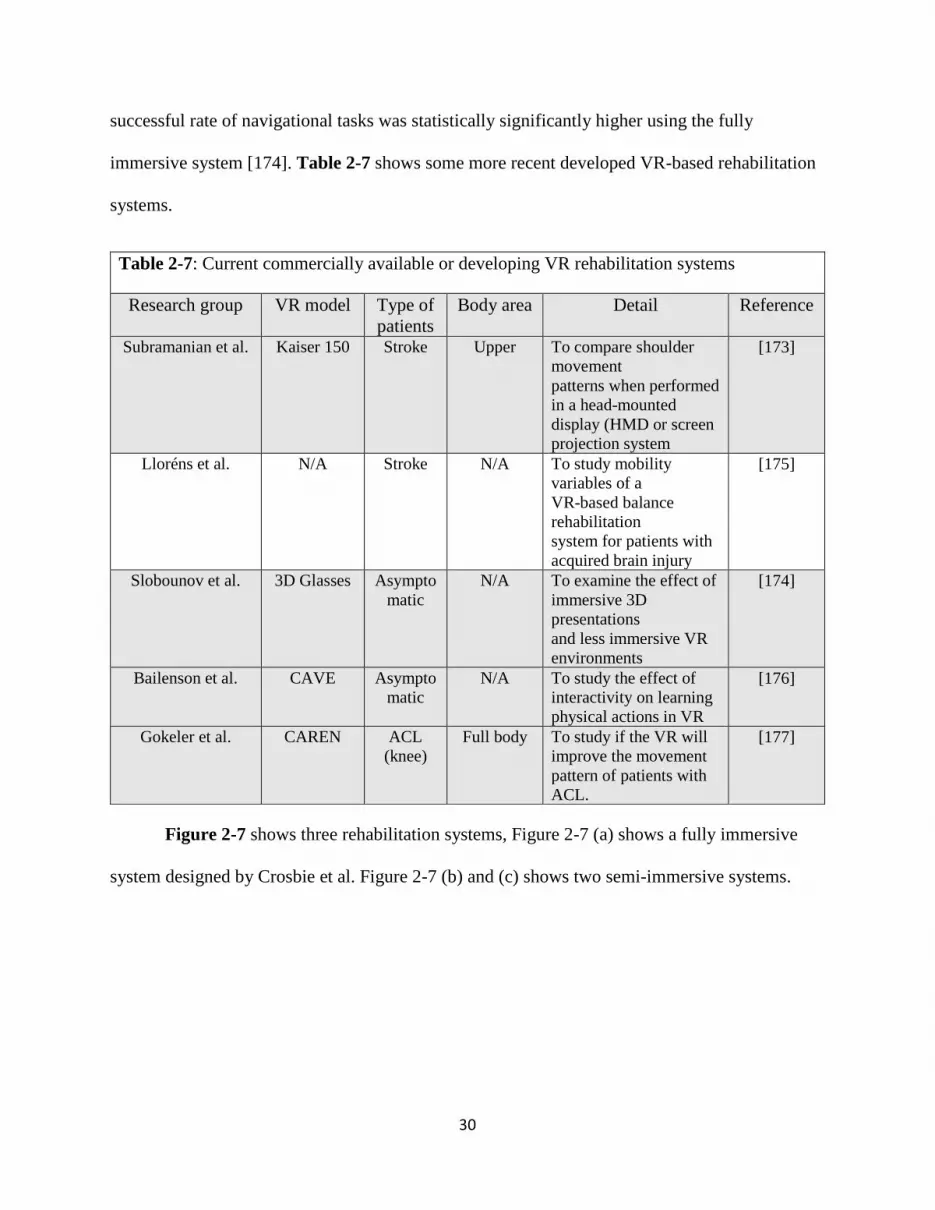
30
successful rate of navigational tasks was statistically significantly higher using the fully
immersive system [174]. Table 2-7 shows some more recent developed VR-based rehabilitation
systems.
Figure 2-7 shows three rehabilitation systems, Figure 2-7 (a) shows a fully immersive
system designed by Crosbie et al. Figure 2-7 (b) and (c) shows two semi-immersive systems.
Table 2-7: Current commercially available or developing VR rehabilitation systems
Research group VR model Type of
patients
Body area Detail Reference
Subramanian et al. Kaiser 150 Stroke Upper To compare shoulder
movement
patterns when performed
in a head-mounted
display (HMD or screen
projection system
[173]
Lloréns et al. N/A Stroke N/A To study mobility
variables of a
VR-based balance
rehabilitation
system for patients with
acquired brain injury
[175]
Slobounov et al. 3D Glasses Asympto
matic
N/A To examine the effect of
immersive 3D
presentations
and less immersive VR
environments
[174]
Bailenson et al. CAVE Asympto
matic
N/A To study the effect of
interactivity on learning
physical actions in VR
[176]
Gokeler et al. CAREN ACL
(knee)
Full body To study if the VR will
improve the movement
pattern of patients with
ACL.
[177]
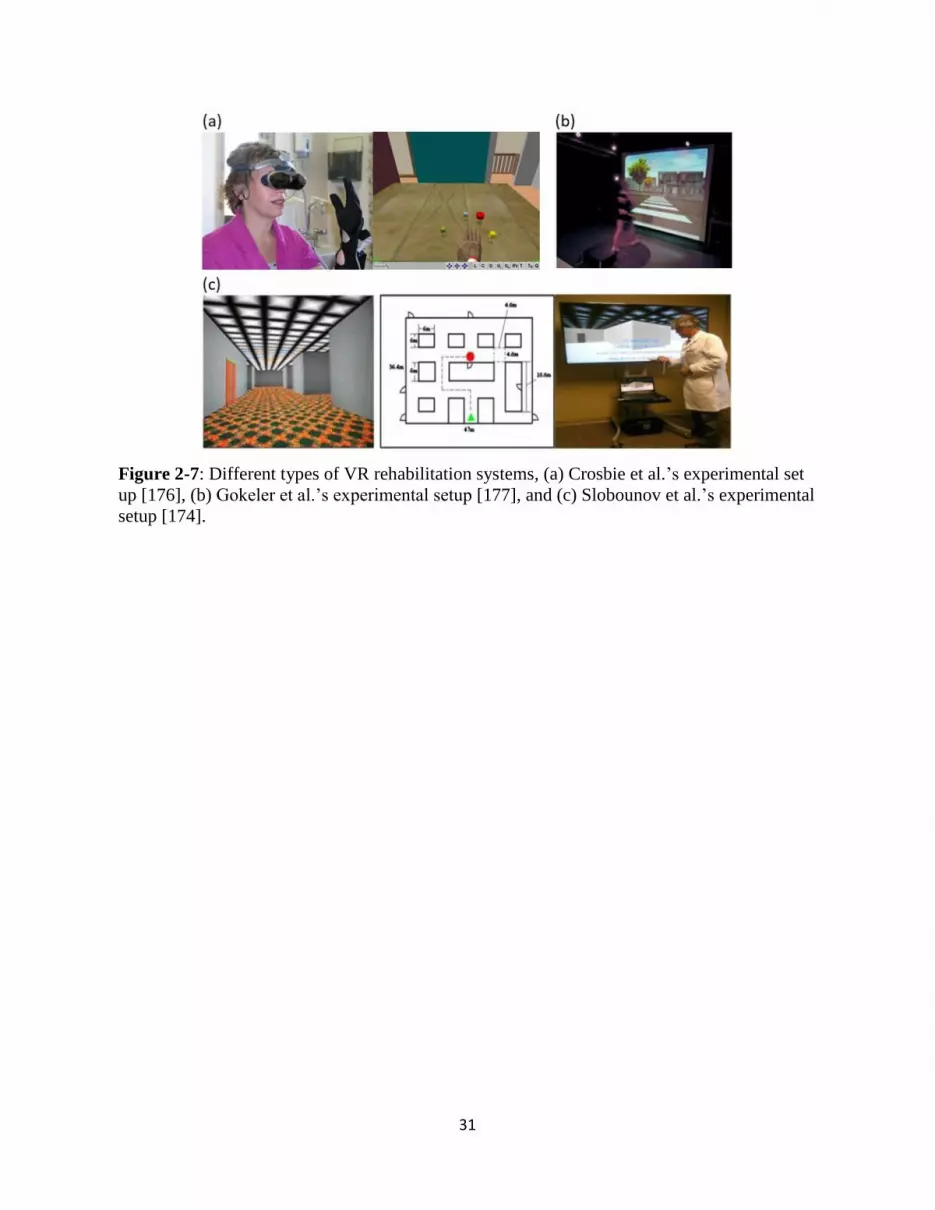
31
Figure 2-7: Different types of VR rehabilitation systems, (a) Crosbie et al.’s experimental set
up [176], (b) Gokeler et al.’s experimental setup [177], and (c) Slobounov et al.’s experimental
setup [174].

32
3. CHAPTER 3
LANDSCAPE OF PRECISION MEDICINE IN CLINICAL APPLICATIONS1
1 Li, R., Jumet, B., Ren, H.L., Song, W.Z. and Tse, Z.T.H. To be submitted to Minially Invasie Therapy & Allied
Technolgies.
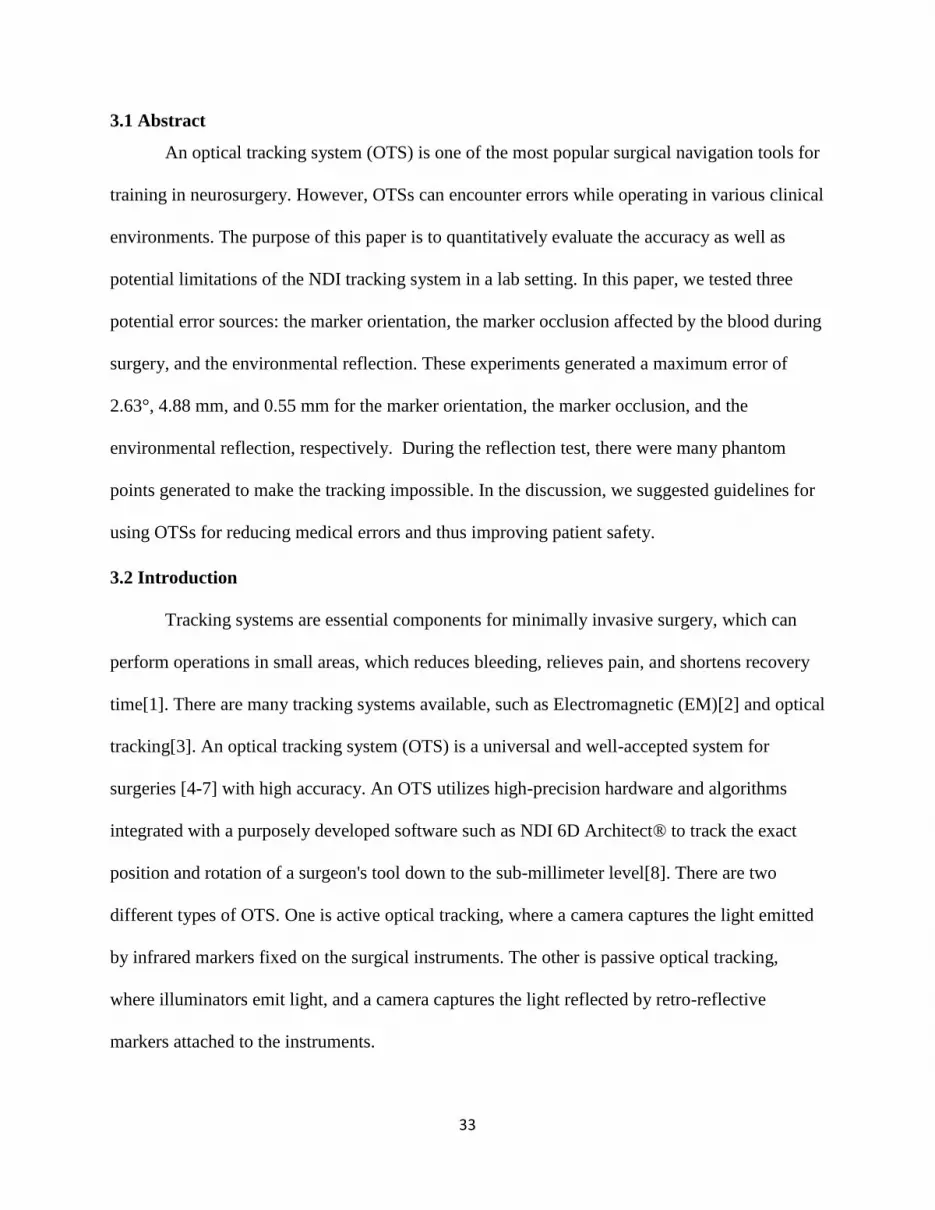
33
3.1 Abstract
An optical tracking system (OTS) is one of the most popular surgical navigation tools for
training in neurosurgery. However, OTSs can encounter errors while operating in various clinical
environments. The purpose of this paper is to quantitatively evaluate the accuracy as well as
potential limitations of the NDI tracking system in a lab setting. In this paper, we tested three
potential error sources: the marker orientation, the marker occlusion affected by the blood during
surgery, and the environmental reflection. These experiments generated a maximum error of
2.63°, 4.88 mm, and 0.55 mm for the marker orientation, the marker occlusion, and the
environmental reflection, respectively. During the reflection test, there were many phantom
points generated to make the tracking impossible. In the discussion, we suggested guidelines for
using OTSs for reducing medical errors and thus improving patient safety.
3.2 Introduction
Tracking systems are essential components for minimally invasive surgery, which can
perform operations in small areas, which reduces bleeding, relieves pain, and shortens recovery
time[1]. There are many tracking systems available, such as Electromagnetic (EM)[2] and optical
tracking[3]. An optical tracking system (OTS) is a universal and well-accepted system for
surgeries [4-7] with high accuracy. An OTS utilizes high-precision hardware and algorithms
integrated with a purposely developed software such as NDI 6D Architect® to track the exact
position and rotation of a surgeon's tool down to the sub-millimeter level[8]. There are two
different types of OTS. One is active optical tracking, where a camera captures the light emitted
by infrared markers fixed on the surgical instruments. The other is passive optical tracking,
where illuminators emit light, and a camera captures the light reflected by retro-reflective
markers attached to the instruments.
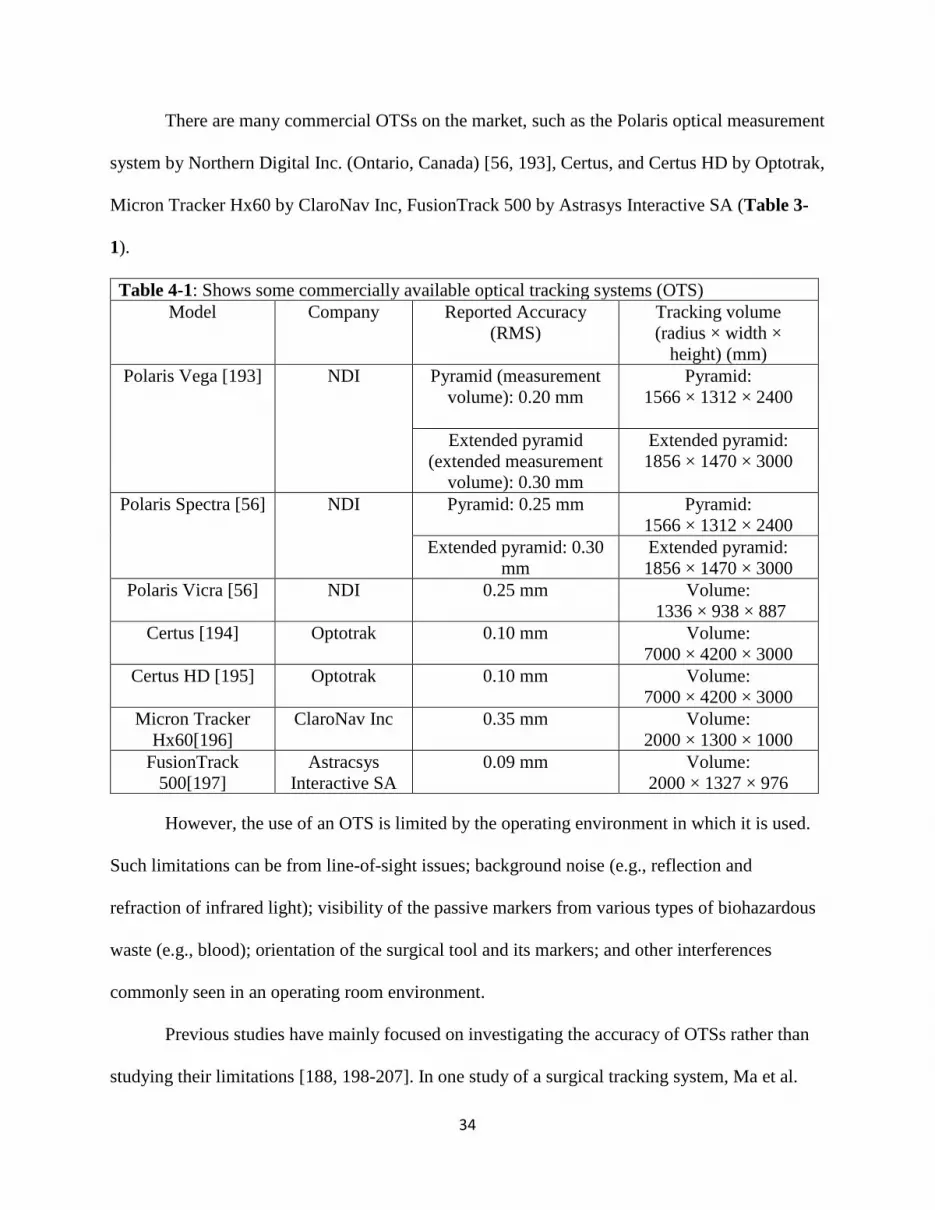
34
There are many commercial OTSs on the market, such as the Polaris optical measurement
system by Northern Digital Inc. (Ontario, Canada) [56, 193], Certus, and Certus HD by Optotrak,
Micron Tracker Hx60 by ClaroNav Inc, FusionTrack 500 by Astrasys Interactive SA (Table 3-
1).
Table 4-1: Shows some commercially available optical tracking systems (OTS)
Model Company Reported Accuracy
(RMS)
Tracking volume
(radius × width ×
height) (mm)
Polaris Vega [193] NDI Pyramid (measurement
volume): 0.20 mm
Pyramid:
1566 × 1312 × 2400
Extended pyramid
(extended measurement
volume): 0.30 mm
Extended pyramid:
1856 × 1470 × 3000
Polaris Spectra [56] NDI Pyramid: 0.25 mm
Pyramid:
1566 × 1312 × 2400
Extended pyramid: 0.30
mm
Extended pyramid:
1856 × 1470 × 3000
Polaris Vicra [56] NDI 0.25 mm Volume:
1336 × 938 × 887
Certus [194] Optotrak 0.10 mm Volume:
7000 × 4200 × 3000
Certus HD [195] Optotrak 0.10 mm Volume:
7000 × 4200 × 3000
Micron Tracker
Hx60[196]
ClaroNav Inc 0.35 mm Volume:
2000 × 1300 × 1000
FusionTrack
500[197]
Astracsys
Interactive SA
0.09 mm Volume:
2000 × 1327 × 976
However, the use of an OTS is limited by the operating environment in which it is used.
Such limitations can be from line-of-sight issues; background noise (e.g., reflection and
refraction of infrared light); visibility of the passive markers from various types of biohazardous
waste (e.g., blood); orientation of the surgical tool and its markers; and other interferences
commonly seen in an operating room environment.
Previous studies have mainly focused on investigating the accuracy of OTSs rather than
studying their limitations [188, 198-207]. In one study of a surgical tracking system, Ma et al.

35
reported Micron Tracker (ClaroNav Inc, Toronto, Canada) is sensitive to illumination and fail to
track two or more surgical tools. However, they did not quantitatively analyze the errors[208].
Kral et al. claimed the accuracy of one OTS—Stealth Station S7 (Medtronic SNT, Louisville,
CO) was 0.22 mm and also mentioned the problem of line-of-sight. However, the authors did not
quantify the tracking error [209].
The purpose of this study is to fill the knowledge gap left from the previous studies and
provide an in-depth assessment of the inaccuracies of an OTS due to interferences from a clinical
environment. The novelty of this work is to use a high-precision robotic system in a purposely
created environment to exam possible limitations of NDI OTS in detail and give quantifiable
error reports. It is hypothesized that there are three major factors introducing errors to OTSs. The
first factor is the optical distances between the markers. Marker orientation becomes an issue
when the tool is rotated to an extreme angle such that two markers eclipse each other. This
causes the system to have difficulty in differentiating between the two markers, determining a
center point of each marker, and thus locating the tip of the tool inside the patient. The second
factor is the partial occlusion of markers. As the marker gets covered by blood splatter or surface
marks during one single procedure, the reflective surface is no longer an ideal reflective sphere
that the OTS uses to determine the marker location. The third factor is environmental reflection.
The stainless-steel tools, trays, and other reflective materials omnipresent in surgical settings are
bound to redirect infrared waves undesirably and thus interfere with the abilities of the OTS.
This paper aims to quantify the magnitudes of errors that result from these factors and provide
quickly implementable solutions to reduce or prevent these errors and ultimately provide
suggestions for training.

36
3.3 Materials and Methods
Figure 3-1 shows a detailed description of tracking methods, environment, and
assessment. In the section of tracking methods, it shows reflective markers are continuously
tracked by the NDI OTS. In the section of the environment, a 3D-printed tool was used to hold
the needle in position. There are three experiments performed to assess the accuracy of the NDI
OTS: marker orientation, maker occlusion, and environmental reflection.
Figure 4-1: Overall test design for assessing the accuracy of the OTS.
The working principle of NDI OTS, as well as the tracking volume of the NDI, are shown
in Figure 3-2. OTS often employ infrared sensing through two or more cameras to triangulate a
position in three dimensions. The sensors often use passive markers that are attached to the
surgical tool and employ a reflective surface to reflect infrared light from emitters surrounding
the camera lenses back to the cameras. NDI Polaris Vega® (NDI OTS) (Ontario, Canada) was
used in this study for accurate tracking of a training tool. The tool, as shown in Figure 3-2(c),
was designed as a rigid body according to the NDI tool design guideline[210], and 3D printed
using MakerBot Replicator® (Kowloon, Hong Kong). The tool was to hold the biopsy needle as

37
well as the infrared (IR) reflective markers. The markers were configured to be seen as normal to
the NDI. Therefore, although the markers were position to be orthogonal to the typical normal
direction, they were correctly observed by the NDI.
All the tool tracking parameters of the NDI software shown in Table 3-2. The maximum
3D angle means the marker can be facing away from the position sensor. The maximum 3D error
means the maximum difference between the marker's expected and measured positions. The
minimum spread means the system is checking the minimum distance requirement between the
markers for tool transformation. However, the marker spread check is not implemented for
passive Polaris.
Table 4-2: The tool tracking parameters used in this study
Maximum 3D angle 90°
Maximum 3D error 2
Minimum spread 0
The Universal Robot 10® (Odense, Denmark), hereafter referred to as the UR10, allows
precise movement of the designed tracking tool and mitigates additional human errors. The
movement precision for the UR 10 is ± 0.05 mm. Thus, the UR10 was used to manipulate a
needle in the OTS assessments conducted in this study. Finally, the software used was 6D
Architect® developed by NDI. This software allows the user to create a rigid body and track the
rigid body using the optical sensors. Additionally, Microsoft Excel was used as the processing
software to analyze the exported data from 6D Architect®.

38
(a) The experimental workflow
(b) Tracking volume of the NDI OTS (c) Tool dimensions
Figure 4-2: Shows the experimental and tool setup, (a) displays the working principle of NDI OTS,
UR 10, and relevant hardware, (b) shows the tracking volume of the NDI OTS, (c) shows the tool
dimensions.
Each experiment was run five times and Eqs. (1) — (11) were used to quantify the
movements and errors of the needle. Table 3-2 defines all the symbols used in the equations; the
coordinate system referred to was shown in Figure 3-3 (d).
Each experiment used the middle 50% of the time elapsed. The experiments lasted 10—
20 seconds at each orientation or position. The first 25% of each orientation or position were
avoided for analysis due to the induced frequency of a sudden start and stop. The last 25% of
each orientation or position were excluded because the frame rate and thus, time tracking of the
NDI was not consistent and would deviate further from the actual elapsed time throughout each
experiment. For consistent analysis, the middle 50% of each actual ten-second window was used.

39
These specific time allotments were qualitatively observed to be sufficient to avoid both
problematic situations.
The marker orientation experiment analyzed the orientation accuracy when subjecting the
tool to the rotation. These calculations used the incremental difference in marker orientation.
This theoretical difference would be 1° at every measurement. (Eqs. (1) – (2)). The other two
experiments (marker occlusion and reflective interference from the surgical tool) used a
translational analysis of the needle tip. These experiments analyzed the difference between the
control experiment with no interference and the same movements with the interference
introduced. The control experiment was also conducted twice: once before the interference, and
once after. That would make sure that no perturbations had occurred during the process of the
recorded interference experiments. These two controls were averaged and compared relative to
the trials with the interference introduced. Further, if the deviation of measurements between the
prior and post control experiments is more than 5%, the experiment data would not be included
for analysis.
Table 4-3: Shows the Symbols used for equations in Table 3-4 (The coordinate system is shown in
Figure 3(d)).
Optical Proximity
Variable Definition Unit
Rx Rotation in NDI X-Z Plane (Around NDI Y-Axis) Degrees
Ry Rotation in NDI Y-Z Plane (Around NDI X-Axis) Degrees
n nth degree
Marker visibility and Reflection
Tx Translational Position in X Direction mm
Ty Translational Position in Y Direction mm
Tz Translational Position in Z Direction mm
n Trial Number
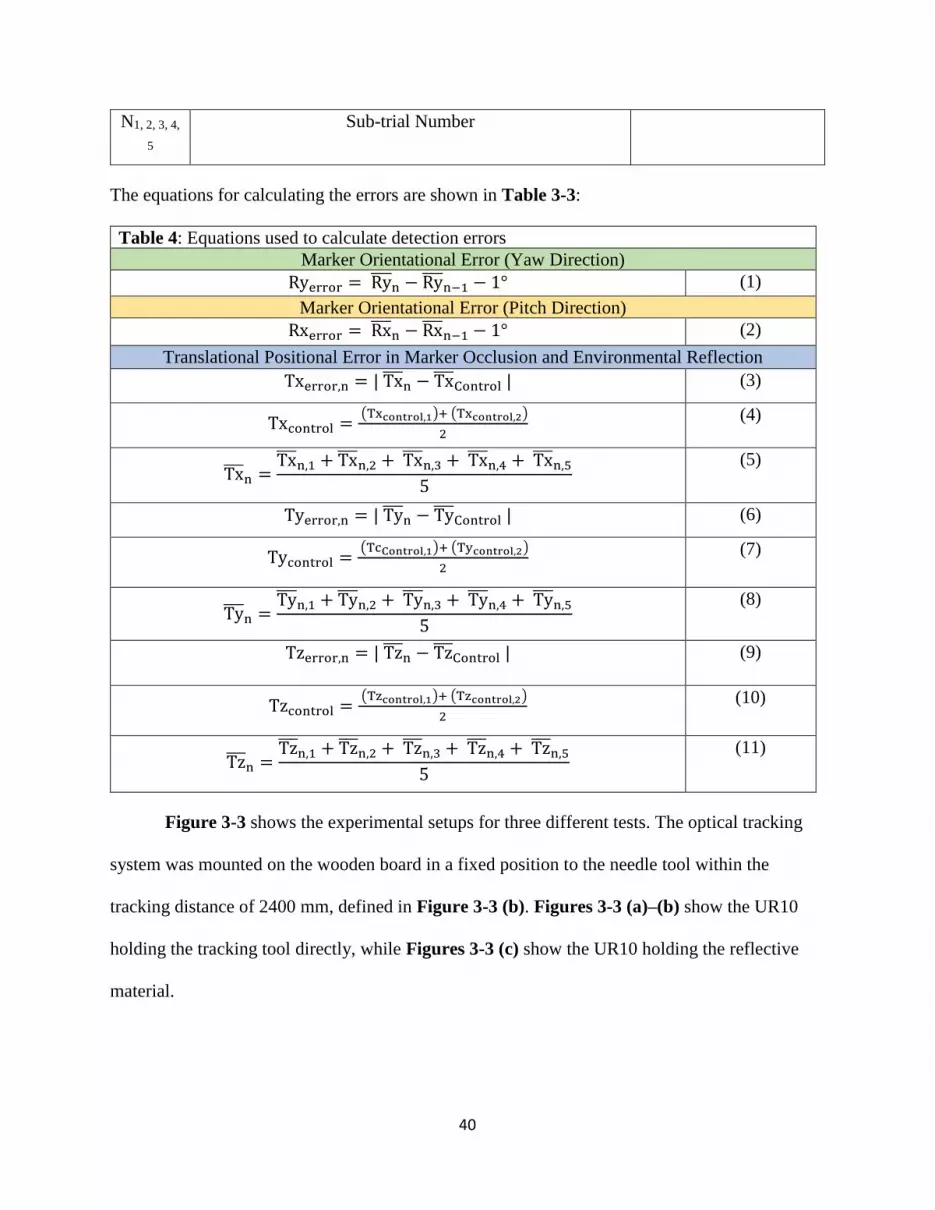
40
The equations for calculating the errors are shown in Table 3-3:
Table 4: Equations used to calculate detection errors
Marker Orientational Error (Yaw Direction)
Ryerror = Ry̅̅̅̅n − Ry̅̅̅̅
n−1 − 1° (1)
Marker Orientational Error (Pitch Direction)
Rxerror = Rx̅̅̅̅n − Rx̅̅̅̅
n−1 − 1° (2)
Translational Positional Error in Marker Occlusion and Environmental Reflection
Txerror,n = | Tx̅̅ ̅n − Tx̅̅ ̅
Control | (3)
Txcontrol = (Txcontrol,1)+ (Txcontrol,2)
2
(4)
Tx̅̅ ̅n =
Tx̅̅ ̅n,1 + Tx̅̅ ̅
n,2 + Tx̅̅ ̅n,3 + Tx̅̅ ̅
n,4 + Tx̅̅ ̅n,5
5
(5)
Tyerror,n = | Ty̅̅ ̅n − Ty̅̅ ̅
Control | (6)
Tycontrol = (TcControl,1)+ (Tycontrol,2)
2
(7)
Ty̅̅ ̅n =
Ty̅̅ ̅n,1 + Ty̅̅ ̅
n,2 + Ty̅̅ ̅n,3 + Ty̅̅ ̅
n,4 + Ty̅̅ ̅n,5
5
(8)
Tzerror,n = | Tz̅̅ ̅n − Tz̅̅ ̅
Control |
(9)
Tzcontrol = (Tzcontrol,1)+ (Tzcontrol,2)
2
(10)
Tz̅̅ ̅n =
Tz̅̅ ̅n,1 + Tz̅̅ ̅
n,2 + Tz̅̅ ̅n,3 + Tz̅̅ ̅
n,4 + Tz̅̅ ̅n,5
5
(11)
Figure 3-3 shows the experimental setups for three different tests. The optical tracking
system was mounted on the wooden board in a fixed position to the needle tool within the
tracking distance of 2400 mm, defined in Figure 3-3 (b). Figures 3-3 (a)–(b) show the UR10
holding the tracking tool directly, while Figures 3-3 (c) show the UR10 holding the reflective
material.
N1, 2, 3, 4,
5
Sub-trial Number

41
(a) The marker orientation test (b) The marker occlusion test
(c) The environmental reflection test (d) The global coordinate system of the NDI
Polaris Vega®
Figure 4-3: Experimental setup for testing: (a) the marker orientation, (b) the marker
occlusion, (c) the environmental reflection, and (d) shows the global coordinate system of the
NDI OTS. The optical tracking system was mounted on the wooden board in a fixed position
to the needle tool within the tracking distance of 2400 mm. A vacuum base vise was used to
hold the marker coverage tool.
3.3.1 Marker Orientation
The marker orientation test simulated the clinical environment where the biopsy needle
was inserted into human skin under the guidance of NDI OTS. The NDI detected the presence of
markers by IR light. The system employs four markers in total, and a minimum of three markers
need to be visible simultaneously.
If the markers are too close to each other, the reflection interference will affect the
process of marker detection. This is because the NDI OTS algorithm determines the location of

42
the tool tip by assessing the centers of each of the markers from the pre-determined tool
geometry. The NDI user guideline mentioned that if the markers start to eclipse each other, the
system would have difficulties determining specific marker positions and would thus lose
accuracy in determining the tool tip's exact position. It is worth noting that all tools require the
use of at least three markers at all times to be tracked in 3D space.
Yaw direction
The UR10 was programmed to rotate clockwise from −90° to −70° and +70° to +90° in
1° increment starting from an orthogonal view relative to the NDI OTS in the NDI Y-Z plane
(Figure 3-3 (a)). At every increment, the needle was held in place before being rotated to the
next position. Each position was recorded; the average Rx, Ry, and Rz were taken for each
interval. The orientational errors were calculated using Eq. (2).
Pitch direction
The needle was again contained in the 3D-printed needle tool and held by the UR10’s
gripper. The UR10 was programmed to rotate the needle counter-clockwise from +60° to +90° in
1° increment in the NDI’s X-Z plane. At every increment, the needle was held in position and
had its rotational Rx, Ry, and Rz data averaged for each increment. The orientational errors were
calculated using Eq. (2).
3.3.2 Marker Occlusion
The percentage of marker visibility test was conducted to examine the inaccuracies
caused by partial coating from blood in real surgical situations. The 3D printed mesh could
simulate the situation by partially blocking the marker from the NDI. The percentage of
visualization was varied from 10% to 30%. This was done by using the UR10’s gripper, holding
the 3D-printed tool orthogonal to the NDI, and introducing different percentages of marker
43
visibility between the needle and NDI. Each increment started with a 20-second control
experiment with no interference, allowing for the determination of a true position from which
deviations were calculated. The specified mesh coverage sheet was then introduced between the
needle and the NDI to a point where all four passive markers were covered but still allowed for
the tool to be tracked. This was recorded for 20 seconds. The mesh was removed and then re-
introduced. This was done five times. The mesh was removed for a final time before recording
another 20 seconds for a secondary control. This secondary control was used to verify that no
experimental procedures caused an unintended deviation from the original position. The middle
10 seconds of each data set were used. The average X, Y, and Z positions of the five tests per
coverage were used for data analysis and plotted against each percentage of cover. The raw data
was normalized and averaged for each mesh tested (Eqs. (3) — (11)).
3.3.3 Environmental Reflection
The environmental reflection test aimed to test inaccuracies introduced by using
stainless-steel surgical tools and other reflective materials in the OR. A stainless-steel panel
attached to the UR10 was held behind the needle and rotated from −10° to +10° in 2° increments
around the vertical NDI OTS X-axis. The dimensions of the panel were 335 mm (L) × 350 mm
(W) × 0.5 mm (H), and the surface finish was polished. Lights were projected onto this panel
from roughly 45° and roughly 45 cm away from the panel. Each recording at the 2° increments
was 20 seconds long, and the middle 10 seconds were used to reduce the noise from the panel
shaking after moving positions. The resulting error was calculated similarly to the previous test.
There were two controls taken: one preceding the test and one succeeding the test. These controls
were averaged and subtracted from the average calculated position for each interval (Eqs. (3) —
(11)).
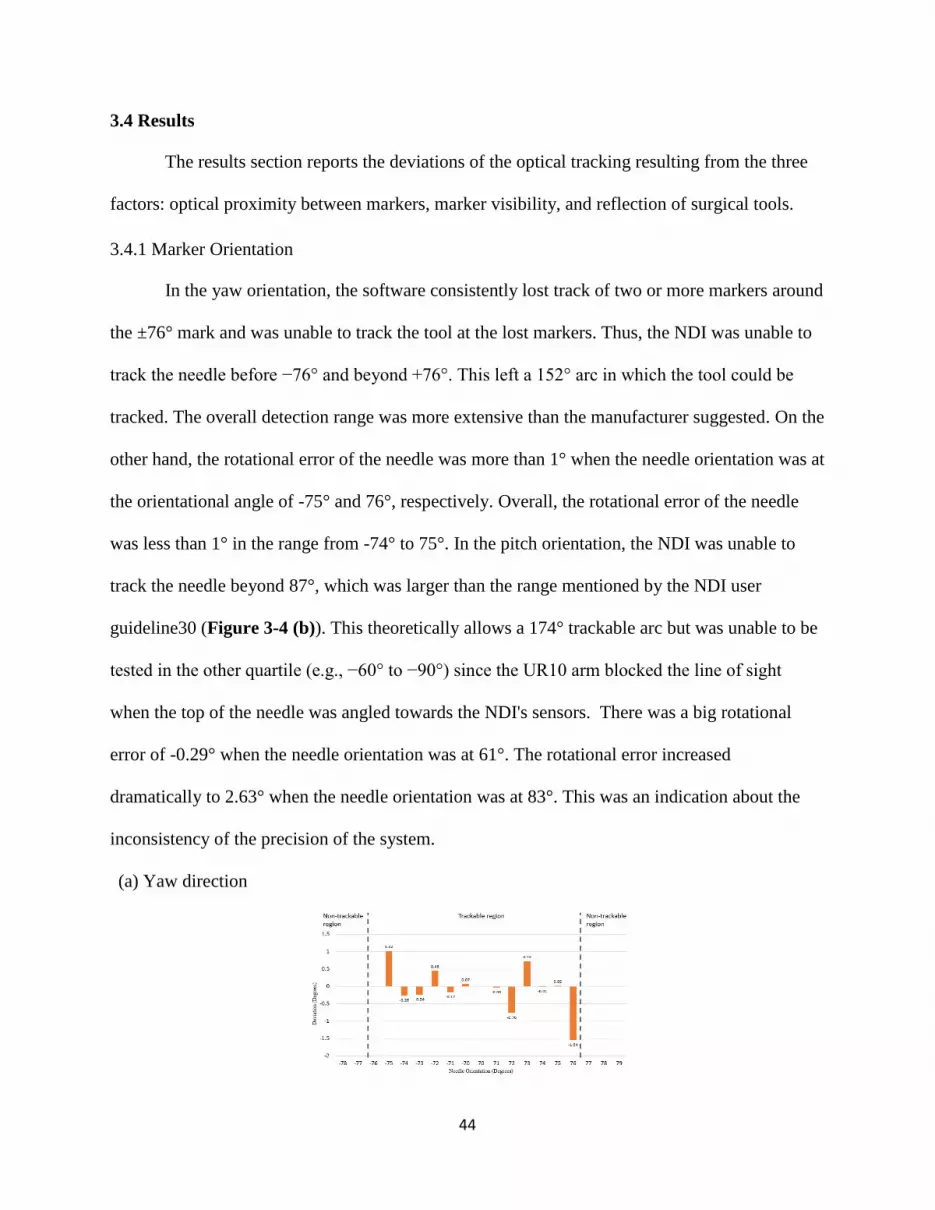
44
3.4 Results
The results section reports the deviations of the optical tracking resulting from the three
factors: optical proximity between markers, marker visibility, and reflection of surgical tools.
3.4.1 Marker Orientation
In the yaw orientation, the software consistently lost track of two or more markers around
the ±76° mark and was unable to track the tool at the lost markers. Thus, the NDI was unable to
track the needle before −76° and beyond +76°. This left a 152° arc in which the tool could be
tracked. The overall detection range was more extensive than the manufacturer suggested. On the
other hand, the rotational error of the needle was more than 1° when the needle orientation was at
the orientational angle of -75° and 76°, respectively. Overall, the rotational error of the needle
was less than 1° in the range from -74° to 75°. In the pitch orientation, the NDI was unable to
track the needle beyond 87°, which was larger than the range mentioned by the NDI user
guideline30 (Figure 3-4 (b)). This theoretically allows a 174° trackable arc but was unable to be
tested in the other quartile (e.g., −60° to −90°) since the UR10 arm blocked the line of sight
when the top of the needle was angled towards the NDI's sensors. There was a big rotational
error of -0.29° when the needle orientation was at 61°. The rotational error increased
dramatically to 2.63° when the needle orientation was at 83°. This was an indication about the
inconsistency of the precision of the system.
(a) Yaw direction

45
(b) Pitch direction
Figure 4-4: Tracking errors generated when the tool was oriented in the (a) yaw direction, and
(b) pitch direction.
3.4.2 Marker Occlusion
The test results show large errors in situations that have a high potential for occurring
since very little fluid is required to cover the markers to the extent being tested. The results in
Figure 3-5(a) are 10%, 20%, 25%, 30%, and 40% of all four markers covered. The translational
position Tz had a maximum error of 4.88 mm at 30%. This was more than enough to cause a
significant medical error and potentially pain or death in surgeries. There was a dramatic
increase in error from 25 % to 50 %, which was another indication of the inconsistency of system
precision. Throughout the experiment, the positional errors of Tx and Ty were within the range
of 0.05—0.8 mm, which was significantly smaller than the positional error of Tz.
3.4.3 Environmental Reflection
Figure 3-5 (b) shows the reflective material test as the stainless-steel panel was rotated
around the X-axis by the robotic arm from -10° to 10°. When the orientation of the reflective
surface was at 0°, the positional error of Tz was at its largest value of 0.55 mm. Throughout the
experiment, the positional errors of Tx and Ty were within the range of 0.01—0.2 mm, which
was much smaller than the positional error of Tz.
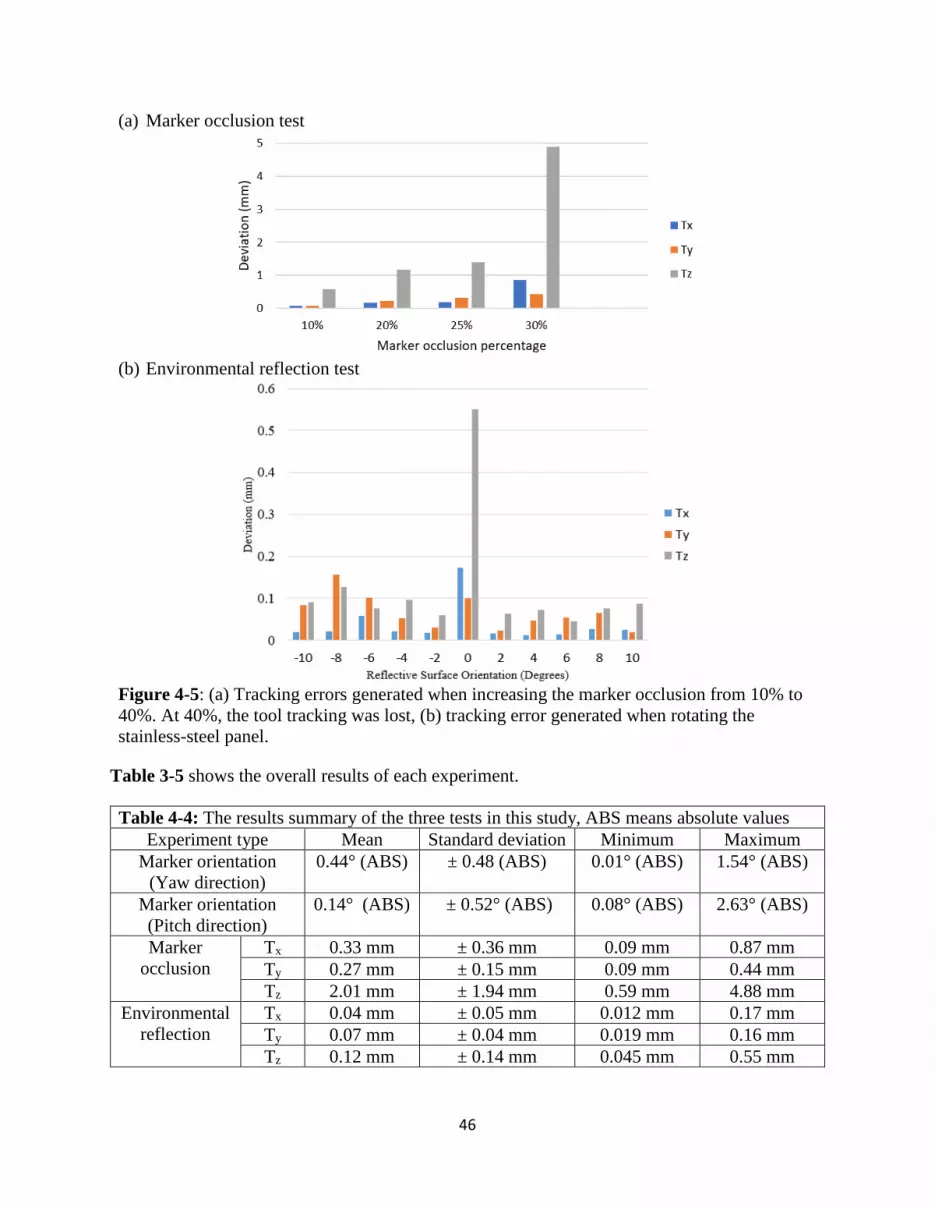
46
(a) Marker occlusion test
(b) Environmental reflection test
Figure 4-5: (a) Tracking errors generated when increasing the marker occlusion from 10% to
40%. At 40%, the tool tracking was lost, (b) tracking error generated when rotating the
stainless-steel panel.
Table 3-5 shows the overall results of each experiment.
Table 4-4: The results summary of the three tests in this study, ABS means absolute values
Experiment type Mean Standard deviation Minimum Maximum
Marker orientation
(Yaw direction)
0.44° (ABS) ± 0.48 (ABS) 0.01° (ABS) 1.54° (ABS)
Marker orientation
(Pitch direction)
0.14° (ABS) ± 0.52° (ABS) 0.08° (ABS) 2.63° (ABS)
Marker
occlusion
Tx 0.33 mm ± 0.36 mm 0.09 mm 0.87 mm
Ty 0.27 mm ± 0.15 mm 0.09 mm 0.44 mm
Tz 2.01 mm ± 1.94 mm 0.59 mm 4.88 mm
Environmental
reflection
Tx 0.04 mm ± 0.05 mm 0.012 mm 0.17 mm
Ty 0.07 mm ± 0.04 mm 0.019 mm 0.16 mm
Tz 0.12 mm ± 0.14 mm 0.045 mm 0.55 mm

47
Meanwhile, during the test, many phantom points appeared when the orientation was at
0° (Figure 3-6). A plausible explanation was that since the software was not able to justify the
correct location of the optical markers because of the background noise, it displayed all the
possible locations.
(a) Y-Z plane (b) X-Y plane (c) X-Z plane
Figure 4-6: NDI software interface showed phantom points (in black color) appeared
during the experiment when reflections had a significant influence on the tracking quality.
The coordinate system was previously defined in Figure 3-3 (d).
3.5 Discussion
The accuracy of the NDI OTS is affected by the complexity of the surgical environment,
particularly the rotation of the needle into different positions, the partial occlusion of the marker
with blood or other substances, and the environmental reflection.
3.5.1 Marker Orientation
The results of the optical proximity test showed the rotational errors from each interval's
expected angular position. Each interval had a Δ1° rotation performed by the UR10 coded into a
loop. Thus, every angle should have a 1° difference from the previous angle. Should the errors be
of significant but consistent magnitude, then the error can be attributed to either the UR10 or
NDI. However, if the rotational error is inconsistent, with large jumps relative to the surrounding
data, then these rotational errors can be attributed to the NDI.

48
From the data, it can be seen that the deviations increased as the needle tool rotated. This
most likely stemmed from optical proximity and eclipsing of the passive markers, making it
difficult for the NDI to distinguish between markers and determine their exact positions. The
inconsistent deviations from the expected Δ1° at each interval indicate some limitations of the
NDI. As previously stated, if these deviations were consistent and small, the inaccuracies could
be attributed to the UR10’s ability in positioning. However, since the UR10 performed the same
rotations coded in a loop, this inconsistent nature demonstrated NDI’s inaccuracy. The highest
magnitude was 1.54° away from the expected 1° change.
Furthermore, the NDI had a bigger accuracy issue before 87°. At 83°, the deviation from
the previous position was shown to be 2.65° more than the expected 1° change. The inaccuracy
at this exact angle could be attributed to an algorithm miscalculation due to the high angle of the
tool and the optical proximity of the markers. There are a few other potential explanations:
surgical tool reflections were only apparent at this angle due to the robot or tool not blocking
them. It can also be seen as an abnormally high deviation in the pitch direction at 61°. The same
previous explanations could apply for this deviation. From our findings, it seems that optical
proximity has a minor effect on the NDI. However, blind spots are a problem since a commonly
used tool could not be tracked beyond 76° around the vertical axis nor beyond 85° around the
horizontal axis, which differed from the claimed visibility of >90°.
3.5.2 Marker Occlusion
The positional error shown in Figure 3-5 (a) is because the NDI sensors are not able to
localize the center of each marker. Thus, the position of the tool tip cannot be correctly
calculated. The NDI had difficulty tracking the tool at as little as 20% coverage, and it could not
find the tool when the markers were covered 40% or more. Any percentage lower than 10%
49
would be difficult to spot in a clinical setting, and would cause relatively small errors in
translational position. The 30% coverage condition had significant effects on the interpreted
position and introduced much difficulty in keeping track of the tool; at the 40% coverage
condition, the NDI could not track the tool at any time or position of the 40% mesh experiment.
The reason why only the translational position Tz was closely analyzed is the positional errors of
Tx and Ty were significantly smaller and under the level of submillimeter.
3.5.3 Environmental Reflection
Similarly, in this test, only the translational position Tz was closely analyzed as the
positional errors of Tx and Ty were significantly smaller and under the level of submillimeter.
The most significant impacts of reflection on the translational position Tz of the NDI OTS were
observed at minor angles near 0°. Although most of the surgical tools are rarely large, metal
panels like the panel used in the test, these findings suggest that any infrared reflection can play a
significant role in affecting the NDI OTS usage. It can be seen that a relatively large positional
error (~0.1 mm) occurred at most orientations except for near the 0° position. This could be due
to the panel reflecting the NDI's infrared light to the NDI sensors and causing confusion about
what the infrared was hitting and how to interpret the reflected infrared.
At its peak, the reflection caused an average positional error of 0.55 mm for Tz. Although
the average positional errors were significantly less for Tx (0.17 mm) and Ty (0.10 mm), there
was a significant increase in all directions at 0°. These errors are undesirable for surgeries with
high accuracy (e.g., neurosurgery) and have the potential to cause adverse effects on patients.
Given enough interference, a few other effects can occur, further reducing the NDI's ability.
Occasionally, the NDI will lose track of a single marker. Most passive tools used in the NDI
OTS have more markers attached than required by the tool file associated with the tool.

50
However, when the NDI loses one of these markers, the algorithm recalculates based on the new
amount of points. This causes a new position to be determined that often differs from the
previously calculated position by 0.5—1 mm. Another effect beyond losing track of a single
marker is the addition of phantom points. The NDI sometimes had so many phantom points that
the algorithm could no longer compute and returned an error, as seen in Figure 3-6. This means
the tool can no longer be trackable within the detection range (2400 mm). A plausible
explanation was that since the software was not able to justify the correct location of the optical
markers because of the background noise, it displayed all the possible locations.
3.5.4 Limitation of the Study
Admittedly, the NDI OTS accuracy could depend on tool design. Also, a range of tool
tracking parameters should be used to make the conclusion more generalizable to real-world
situations.
Some other tracking errors could be potentially introduced into the experiment due to the
dynamic nature of the tests. For example, the sampling rate of the NDI optical tracking was not
optimized with the robotic system. This will result in some tracking data lost due to continuous
robotic movement. Another limitation could include our use of a single-faced tool. Some other
tracking errors could be potentially introduced into the experiment due to the dynamic nature of
the tests. More realistic instruments such as hemostats, retractors, or clamps could be used to
assess the accuracy of the NDI system. Moreover, in the environmental reflection test, the test
ideally should happen in the OR room to best resemble the lighting condition.
In this study, there are still many influencing factors that could impact the accuracy
assessment. The deviation between the test and reference measurement was only a quantitative
indication of system limitation. The experimental results conducted could be impacted by

51
influencing factors as follows: the 3D printed model accuracy compared to tool geometry
generated in the navigation software, the location-dependent accuracy of the navigation system
within the tracking volume, the positional accuracy of the needle in the tool after repetitive
insertion, the mesh position and mesh design, the positioning and brightness of the light source.
Due to the scope of this study, the above factors are not possible to analyze and all assigned to
the inaccuracy of the navigation system.
3.5.5 Operation suggestions
To minimize the orientational error, the suggested ranges for needle orientation are
between -76° and 76° on the yaw direction, and between 62° and 82° on the pitch direction,
respectively. The surgical environment interference should be reduced by limiting the number of
polished metal tools and turning off unnecessary lights, as well as ensuring that any necessary
large, metal objects are kept shielded from the direct line of sight of the NDI OTS.
A proper line of sight to the NDI OTS should be maintained with the tracking tool.
Although these systems can often track with fewer than the included markers, the reliability may
be reduced. Furthermore, even if the NDI OTS can track all the markers, it should have as close
to an orthogonal view of the tool face as possible. A potential way to maintain a line of sight is to
have a tool with multiple facets that can be tracked by the NDI OTS.
Finally, proper cleanliness of the markers should be maintained. Although similar to the
line of sight issue, it is recommended that the markers need to be wholly visible by the OTS.
Therefore, the markers should be adequately cleaned as soon as they become covered, being
mindful of the ease with which the reflective finish can be scratched off of the markers since
removing the reflective finish is the same as covering it up. Markers should be replaced as
necessary when they become uncleanable or too damaged.

52
3.6 Summary
Overall, three tests were conducted to evaluate the impacts of three essential factors on
the tracking ability of an OTS. Rotating the needle to change the optical proximity between the
markers led to a maximum error of 2.63°, covering the markers to various coverage percentages
led to a maximum error of 4.88 mm, and introducing a reflective material near the needle and
OTS led to a maximum error of 0.55 mm. Many phantom points appeared because of a system
error during the reflection test. Suggestions on how to properly use optical tracking systems were
provided so that medical errors can be further reduced.

53
4. CHAPTER 4
A WEARABLE SMART DIAGNOSTIC DEVICE FOR HEATSTROKE PREVENTION2
2 Li, R., Smith, A., Tadinada, H., Sierra, H., and Tse, Z.T.H. Accepted by Proceedings of the IMechE, Part H: Journal
of Engineering in Medicine.
Reprinted here with permission of publisher.

54
4.1 Abstract
Heatstroke is one of the most serious forms of heat injury and is classified as a medical
emergency. It is characterized by an elevated core body temperature along with the failed body
cooling mechanism in response to the sudden heat-up. People vulnerable to heatstroke are
children, elders, and sports professionals. Previous efforts have emphasized exercise adjustments
and post-treatments, such as environmental-based activity modification and cold-water-
immersion (CWI). However, the general public, especially elders, will have difficulty to conduct
such adjustments by themselves. Moreover, few studies have been done on the early preventative
measurement stage. A wearable 3D printed thermochromic device presented can warn the people
of a sudden rise in skin temperature and can advise them to take quick action. Combined with the
smartphone applications, for both the android and iPhone platforms, the device is able to monitor
real-time skin temperature and alerts the people who are vulnerable to heatstroke. The 3D
printable resin developed, can change color at a specific activation temperature. The device has
undergone a series of performance tests in order to optimize the color transition rate and stability
of color change. The accuracy of our device is compared to the conventional thermometer. The
regression analysis shows the R-square value is 0.7599, and the average error is 1.3 ºC. Future
work will be to mitigate the surrounding lighting effects on the smartphone camera and further
improve our device accuracy.
Keywords: Heatstroke, 3D-printing, Thermochromic, Temperature-sensitive
4.2 Introduction
Heatstroke is a life-threatening condition. An elevated core body temperature over certain
specific temperature such as 40°C will result in central nervous system dysfunctions that can
cause delirium, convulsions, and coma[211-215]. From 2001 to 2010, 20 states in the United

55
States recorded a total of about 28,000 heat-related hospitalizations[216]. Classic heat stroke
primarily occurs during annual heat waves within vulnerable groups, including the elderly and
children[217-219]. Moreover, exertional heat stroke (EHS) happens most often in outdoor sports
enthusiasts and professionals[220-222]. The current prevention and treatment methods include
heat acclimatization, environmental-based activity modification, and cold-water immersion
(CWI)[223-226]. However, those who do survive a heat stroke may have permanent neurological
damage[227-230]. Some studies reported that heatstroke could be monitored or predicted using
physiological measures[231-233]. Measuring core body temperature is the golden standard to
prevent heat stroke; however, the limitation of this approach is the accessibility and invasiveness
of the measuring tool needed to obtain the internal temperature[234-236]. Alternatively, many
works of literature have revealed the relationship between sharp-rising skin temperature due to
outdoor activity and an indication of heatstroke[237-239]. The current methods for monitoring
skin temperature are mainly electronic-based, so batteries are required[240-243]. The above
literature has indicated that the skin temperature is a valuable and measurable factor that could
help to prevent heatstroke. The normal skin temperature is typically ranging from 31°C to
34°C[244].
A new method is needed to inform individuals of a sharp rise in their skin temperature
before heatstroke occurs. The proposed thermochromic material provides a practical solution that
can transform an unseen rising skin temperature into a visible color change, which can notify the
user and cause them to take quick action. Moreover, it is a cost-effective device that can be
widely used in developing countries. It can be concluded that the 3D printed wearable device
developed is able to detect anomalies of skin temperature at a comparable accuracy level to a
conventional thermometer. This will give the users a new way to prevent time-sensitive

56
heatstroke before receiving any post-treatment. Moreover, the device will have a smartphone
platform where physical data can be converted into digital information for network uploading
and sharing.
4.3 Materials and Methods
4.3.1 System Overview
The presented system consists of two parts. Part one is to use the chemical property to
detect the skin temperature change as a result of color transformation. Part two is to use the
smartphone application to convert the color transformation into digital readings and alert the
users of potential hazards of heatstroke. Figure 4-1 (a) shows the workflow of the device. The
temperature device is designed to be wearable so that people can check their skin temperature on
a regular basis. The smartphone application developed is not only able to provide the accurate
temperature reading of the device, but also provides the location as well as the time information.
The users will be alerted by the device, and they can then take quick action in order to prevent
the heatstroke from happening. Moreover, the temperature data would be uploaded and shared on
a local health emergency network.
(a) System architecture (b) Commonly used thermochromic chemical
Figure 5-1: (a) The working principle of the device, (b) Chemical transformation of Leuco
dyes[245, 246]
57
4.3.2 Thermochromic Chemicals
The concept behind the product is thermochromism, which is the result of a color change
depending on a unique activation by temperature. Leuco dyes are organic chemicals that change
color when heat energy makes their molecules shift back and forth between two subtly different
structures, which is known as the leuco and non-leuco forms. The leuco and non-leuco forms
absorb and reflect natural light in a different way. The color appearance of the product changes
accordingly. Typical leuco dyes used for thermochromic mixtures are spirolactones, fluorans,
spiropyran, and fulgides. Some transformations such as spiroxazine [245] and fluourans [246]
are shown in their molecular structures in Figure 4-1 (b).
The external temperature is acting as a stimulus that changes the structure of the leuco
dye. This change of structure results in the change of light wavelength that is reflected; thus, it
provides a color change. Based on these properties found in thermochromic powder, experiments
were conducted to create a 3D printable resin that is characterized by sharp color contrast and
rapid color transition. For example, one of the resins used to make the wearable devices will
change its color from dark purple to grey, then finally to white in color.
4.3.3 Principle of Skin Temperature Monitoring Device
The assumption is that under a fixed skin temperature, the amount of heat transferred to
the bracelet is constant. Since the thermochromic material can display a broad range of color
based on the specific activation temperature, the final color displayed on the bracelet will be a
direct indication of the user’s current skin temperature. Admittedly, the ambient temperature is
the main disturbance that impacts the optimal performance of the device. A bracelet design with
maximum contact area to the skin will allow for the heat transfer between the device and the skin
to be more predominant than between the device and the ambient environment. This will help
58
increase the accuracy of the temperature being monitored. The main benefit of this material is its
ability to be 3D printed, which allows it to be highly customizable and inexpensive to produce.
4.3.4 Smartphone Application
The smartphone application is used to determine the temperature of the surroundings
through the red-green-blue (RGB) analysis. For Android phones, the program platform used to
develop the application is MIT app inventor® (Cambridge, Massachusetts). For iPhone, the
program platform used in Xcode (Cupertino, California). This camera application converts the
whole area of the picture into an average RGB value, which is then compared to a local color
map database that correlates each RGB value to a specific temperature. The corresponding
temperature is outputted from the database and displayed on the smartphone screen. This
application has additional features such as a map view and a location sharing network service
that is shared with local emergency departments.
The camera application is split into four user interface views, shown in Figure 4-2. The
initial view is the camera with an outline of the thermochromic product. The second view has an
analyze button that calculates the RGB value and the temperature by comparing it to a database.
It then displays the picture that the user captured. The third view outputs the surrounding
temperature that was calculated and had a “send to the network button,” which sends the data to
a local cloud server. It also has a “current location” button, which shifts the screen to the fourth
view. The location view displays the coordinates, timestamp, temperature, and the map of the
current location.
The program uses image-processing tactics to calculate the average RGB value of the
object. Its calibration process is shown in Table 4-1. The region of interest (ROI) is used to

59
identify a specific area for color analysis. An average RGB is calculated for the ROI, which
represents the entire product.
(1) Initial view (2) Analysis (3) Temperature (4) Location
Figure 5-2: Proposed workflow of the application
The calibration process for color mapping is described in Table 4-1.
Table 5-1: Calibration process of obtaining a color map
Step 1 Step 2 Step 3 Step 4
A thermochromic 3D
object model, which
has a size of 38mm by
38mm, was used to
determine the
temperature and color
change.
The hot plate was
heated to 25 °C and
continue to increase by
an incremental value of
1°C until the model
color change stops. The
total color change time
is recorded.
A video was used to
record the color
transition of the model
The images were taken
from the video, which
is corresponding to
different temperatures.
The RGB value of the
ROI was obtained from
each image, and a color
map is generated.
4.3.5 Manufacturing Process
0.5g thermochromic powder is weighed on a Mettler Toledo® analytical balance
(Columbus, OH). 250ml formlabs® resin (RS-F2-GPCL-04) is poured into a 500ml chemical
beaker and mixed with the thermochromic powder. A Scilogex ® overhead stirrer is used for
increasing the uniformity of the thermochromic powder suspension in the clear resin. The
continuous stirring process lasts for 20 minutes until the color of the clear resin turns into a
similar color of the thermochromic powder. The suspension is then poured into an empty
Formlabs® tank and ready for print.

60
Figure 5-3: Temperature sensor development and operating demonstration: (a) the resin used
to create the temperature sensor, (b) bracelet-shaped sensor model, (c) 3D-printed sensor, (d)
demonstration of sensor changing color with skin temperature, (e) and using the smartphone to
take a picture (f) to measure the temperature and alert.
A bracelet prototype has been printed out in order to demonstrate the feasibility of the
color change as well as the temperature display. The entire fabrication process from the
production of the temperature-sensitive material to a final prototype is shown in Figure 4-3 (a) –
(c). The temperature sensing steps show that the final prototype changed color when it was in
contact with the user’s skin. The corresponding temperature was displayed on the smartphone
screen.
The reason for designing a device in terms of the bracket is that it can ensure the
maximum skin contact with the thermochromic material so that heat transfer between the device
and skin can reach maximum. This is critical for the temperature monitoring functionality of the
device.

61
4.3.6 Performance Test
The performance test is to ensure the proposed device and thermochromic material can
make accurate and reliable skin temperature predictions.
Thickness Test
The first parameter aims to ensure that the device responds fast since a heatstroke occurs
very quickly. The thickness of the device will be optimized so that the rate of heat transfer, as
well as the color change through our device, is fast enough for notifying users (Figure 4-4 (a)).
A series of 3D-printed thin circular blocks have been used for tests. The purpose of this test is to
determine the heat-transfer property of the thermochromic material. The heat gun is placed on
the top of the wooden board.
Color Change Rate and Extension
The second parameter determines whether the temperature-monitoring device can give
users a reliable signal for heatstroke prevention. The reason why using the circular block rather
than the device itself is that the rate of color transition is more visible in the form of circular
blocks. Hence, the color variation of the device will be tested to ensure that there is a large
contrast as well as a stable final color, shown in Figure 4-4 (b). A temperature control system
was used in this case for the purpose of adjusting the heat conduction and making quantitative
analysis to color change. It can control the surface temperature of the heated board, where a
circular block was placed on top. Constant heat was applied to the surface of a circular block
(with a diameter of 23mm and a thickness of 2mm) while a video was taken to record the color
transition of the block. The set temperature of heating was 38 °C. After using the smartphone
application, three-color lines representing Red, Green, and Blue light compositions (RGB) of the
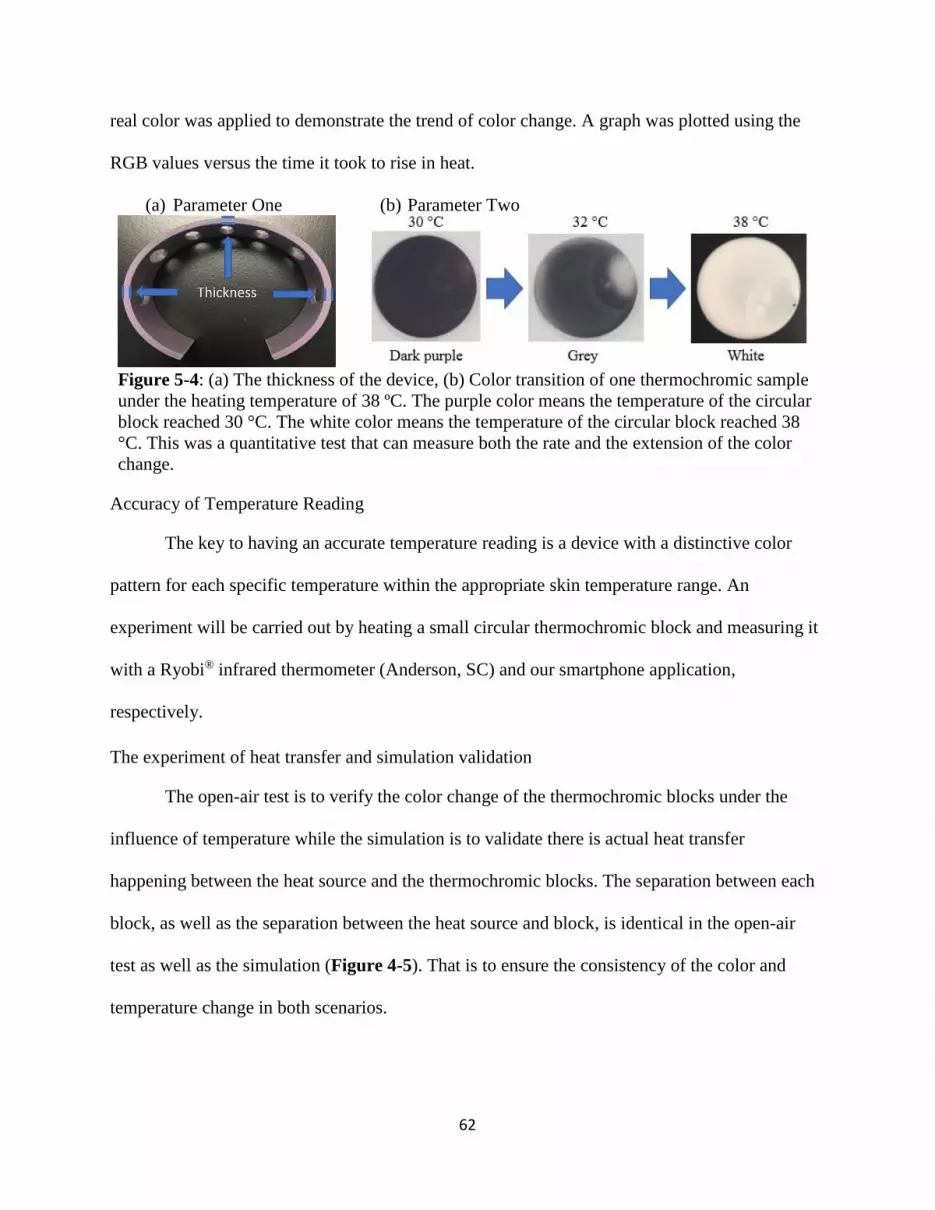
62
real color was applied to demonstrate the trend of color change. A graph was plotted using the
RGB values versus the time it took to rise in heat.
(a) Parameter One (b) Parameter Two
Figure 5-4: (a) The thickness of the device, (b) Color transition of one thermochromic sample
under the heating temperature of 38 ºC. The purple color means the temperature of the circular
block reached 30 °C. The white color means the temperature of the circular block reached 38
°C. This was a quantitative test that can measure both the rate and the extension of the color
change.
Accuracy of Temperature Reading
The key to having an accurate temperature reading is a device with a distinctive color
pattern for each specific temperature within the appropriate skin temperature range. An
experiment will be carried out by heating a small circular thermochromic block and measuring it
with a Ryobi® infrared thermometer (Anderson, SC) and our smartphone application,
respectively.
The experiment of heat transfer and simulation validation
The open-air test is to verify the color change of the thermochromic blocks under the
influence of temperature while the simulation is to validate there is actual heat transfer
happening between the heat source and the thermochromic blocks. The separation between each
block, as well as the separation between the heat source and block, is identical in the open-air
test as well as the simulation (Figure 4-5). That is to ensure the consistency of the color and
temperature change in both scenarios.

63
Figure 5-5: Open-air test setup and simulation layout. As for the simulation, the dimensions of
the block and the heat source were identical to the real thermochromic block and heat source in
the open-air test. The separation distance C between the blocks was proportional to the
distance A in the open-air test. The separation distance D between the block to the center of
heat source was proportional to the distance B in the open-air test.
Table 4-2 shows the conditions of the simulation. The simulation was run in the Energy
2D® (Concord, MA).
Table 5-2: Conditions of simulation
Medium density 1200 kg/m3
Medium thermal conductivity 0.5 W/(m·K)
Thermochromic material density 1.1 kg/m3
Thermochromic material thermal conductivity 0.3 W/(m·K)
Initial temperature of the thermochromic blocks 23.5 °C
Diameter of the thermochromic blocks 25 mm
The final temperature of the thermochromic blocks 38 °C
4.4 Results
Key elements for a high-quality product is to use evidence-based decision-making and
continuous improvements. There are three parameters for quantifying the performance of the
skin temperature-monitoring device in order to determine the device’s effectiveness on
heatstroke detection: color change rate, the extension of color change, and the accuracy of the

64
temperature reading. The color change rate and extension of color change will be used to
quantify the effectiveness of the device. Accuracy is quantified by comparing our device with
other commercial devices. Finally, the experimental result is compared with the simulation to
ensure the consistency of the heat transfer.
4.4.1 Thickness Test
An initial experiment was done on circular blocks, and preliminary data has been
collected, shown in Figure 4-6 (a). The data provides an important understanding of how to
design a fast-responsive wearable device. The linear correlation between the color change time
and the thickness indicates that the heat transfer is mainly carried out in terms of conduction.
When considering the mechanical strength of the device, the optimal thickness is 2mm, which
corresponds to 70 seconds for the complete color change of the device.
(a) Color change rate experiment (b) Extension of color change experiment
Figure 5-6: (a) Shows the time taken for a thin block made from thermochromic material to
change from dark purple to completely white. The linear relationship indicates that there is a
positive correlation between the time taken for the color change to occur and the thickness of
the object, (b) Shows the time taken for the complete color change, which includes two states,
the color transition period (t = 0-80 s) and steady-state (after t = 80 s).
4.4.2 Color Change Rate and Extension
A test has been carried out, and the results are shown in Figure 4-6 (b). During the initial
80 seconds, three light compositions (RGB) increase gradually. This is indicated by the gradual

65
fade of the original color and formation of the white color. At this moment, heat transfer occurs
between the block and its surroundings. After the RGB values have reached a steady-state, there
are no obvious variations in the values, which means the final color of the material is stabilized
even when the temperature of the block continues to rise. In this test, the block will remain white
in color once it reaches the temperature of 38°C.
4.4.3 Accuracy of the Temperature Reading
Figure 4-7 (a) shows an accuracy test has been done; each data point was calculated as a
mean value of 20 repeated trials. Figure 4-7 (b) shows the Bland-Altman analysis. It can be
concluded there is a comparable accuracy between our device and the conventional device.
(a) Comparison between our device and conventional laser thermometer
(b) The Bland-Altman analysis with the conventional device
Figure 5-7: (a) Comparison between the temperature readings from our device and
conventional laser thermometer, which has an accuracy of ±0.1°C. The average error of these

66
two devices is 0.06°C. Each data point is the average value of twenty repetitions of trials. (b)
The Bland-Altman plot is used to evaluate the accuracy of the device.
4.4.4 Heat transfer experiment and simulation results
Figure 4-8 (a) —(b) shows the experimental result and temperature analysis. The
temperature analysis is done in the Matlab 2017b® (Natick, MA). Figure 4-8 (c) shows the
simulation result. The heat transfer pattern, as well as the local temperature distribution from the
experimental result, is consistent with the ones from the simulation. The simulation is designed
and carried out on the platform Energy 2D® (Concord, MA).
Figure 5-8: the experimental and simulation result for heat transfer between the
thermochromic circular blocks and round heat source underneath. (a) shows the color image
from the experiment, which shows the color changes from purple to white as the heat transfer
happens between the heat source and thermochromic blocks, (b) is the processed grayscale
image using Matlab 2017b® (Natick, MA) with the color bar on the side indicating the
temperature distribution ranging from 25 °C to 40 °C. (c) is the simulation result using Energy

67
2D®(Concord, MA), the dotted red line is the isotherm line of 30 °C. As time elapses, the
isotherm line expands outwardly, which matches consistently with both the color appearance
and temperature analysis in (a) and (b).
4.5 Discussion
Thermochromism is a phenomenon in which the color appearance of a material change
based on external hot or cold stimuli. In other words, the material will change color according to
its own temperature variation. Early investigation in the application of thermochromism has
begun in many industries, such as strip thermometers, battery testers, and fabric[247-249]. So
far, commercial thermochromic products can only give visual information to users. There is no
interaction between the users and the device. The presented device not only gives users a more
accurate temperature reading via color analysis but also converts the physical temperature data
into digital information, which can be uploaded and shared on a network for future reference. In
this way, the users can track their history of skin temperature and receive notifications from the
smartphone application about any anomalies. Moreover, the device can still indicate the rise of
skin temperature without the smartphone application because the color change can be observed
with the naked eye.
Admittedly, there is a small temperature difference between the inner surface of the
bracelet in contact with the skin and the outer surface exposed to the ambient environment. The
thickness of the device is chosen to be one of the design criteria so that the temperature
difference can be minimized. The device can then adequately display the color change based on
skin temperature. The purpose of using thermochromic material is that it can vary colors in a
certain temperature range. The variation of normal human body temperature is within 10°C and
below 35°C, so the range of the thermochromic material in this article was selected to be from
25°C to 35°C[250]. Due to its color-changing ability, this material can detect a sharp rise in skin

68
temperature, which is a possible indication of heatstroke. However, the small temperature range
could be a limitation under certain conditions. It would be ideal to have a broader range of
temperature detection so that the device would be applicable to a wider range of scenarios with
various environmental, clothing, and exertion conditions.
The 3D-printed material used here is not stretchable. However, there is flexible material
made by Formlabs (Somerville, MA), which can be used in the future to increase the skin contact
area and improve the heat transfer efficiency between the skin and our device. 3D printing
technology has many advantages of developing an optimal device for detecting heatstroke. First,
it provides a way of fast-prototyping for product design optimization. Second, it can offer
customized design to users, which opens up a wide range of applications such as food containers,
wearable devices, and indoor thermal decors. Thirdly, the cost of 3D print operation and the raw
material is very low compared with the traditional industrial manufacturing process. Before 3D
printing can be used for fabricating the wearable device, two important issues need to be
addressed. One is whether the mixture of thermochromic material and resin can still retain the
physical property as the pure thermochromic powder after the 3D printing process. From the
results, one single 3D printed thermochromic block starts the color change after 1 second and can
reach a stable color appearance after 80 seconds. The performance of the newly developed resin
mixture not only shares the same physical property as the original thermochromic material but
also ideal for the fast detection of heatstroke. Another question is whether the resin mixture has
an optimal thickness for the color change to be visible for users. Another experiment has been
done here to give an optimal thickness of 2mm.
Traditional thermometers, such as mercury-in-glass thermometers, need both close
contact with the skin for a long time and a stable environment in order to accurately read skin
69
temperatures. Meanwhile, the new-generation thermometer, such as a laser thermometer, can
obtain a temperature reading in a fast manner. However, it requires the users to press the start
button and initiate the temperature detection. The new type of temperature sensor proposed here
offers an alternative principle of measuring temperature disregarding the surface structure and
property of the material. The resin proposed here is able to be 3D-printed into any shape and can
be easily integrated with smartphone cameras for instantly temperature sensing.
On the contrary, the accuracy of our device is impacted by three factors. One is the
lighting condition of the background since the color of the thermochromic block will appear
significantly different under bright and dim lighting backgrounds. A possible solution is to force-
start the phone’s camera light while taking pictures to make the light background constant under
any circumstances. The second factor is the inhomogeneity of the resin during the mixing
preparation, which can potentially affect the uniformity of the color density distribution. Thus,
the color analysis can differ based on the location of the region of interest (ROI). More
sophisticated mixing and curing equipment should be used in the future. The third factor is the
contact area between the heat source and the device. As can be seen in Figure 4-7 (b), the
temperature discrepancy of ±1.5°C between the measured and reference values is due to the
variation of the total amount of heat transfer, which correlates with the continuously changing
contact area.
In secion “Heat transfer experiment and simulation results”, both the experimental and
simulation results are able to show there is a strong and quantifiable relationship between the
color appearance of the thermochromic material and temperature variation on the contact
surface. The consistent outcomes validate the proposed material as well as the device is able to
detect temperature variation on the contact surface if being placed onto the human skin.
70
4.6 Summary
A temperature-sensitive resin combined with 3D printing can detect skin temperature in
order to warn individuals of potential risk with heat-related illnesses. This product can
potentially be customized to fit different age groups since children and elders are more
susceptible to heatstroke. The experiments conducted are able to show that the resin can change
color at a specific activation temperature in a fast and stable manner. The accuracy of our device
is similar to the conventional temperature-measuring device, such as the laser thermometer. The
regression analysis shows the R-square value is 0.7599, and the average error is 1.3 ºC. Combine
with the smartphone application, the device combines with a smartphone application to provide
monitoring of real-time skin temperatures and alerts people who are vulnerable to heatstroke.

71
5. CHAPTER 5
A LOW-COST, MRI-VISIBLE, AND 3D-PRINTED FLEXIBLE TEMPLATE FOR
PRECISION TUMOR TARGETING3
3 Li, R., Xu, S., Bakhutashvili, I., Turkbey, I.B., Choyke, P.L., Pinto, P.A., Wood, B.J., and Tse, Z.T.H. Accepted by
Annals of Biomedical Engineering.
Reprinted here with permission of publisher.

72
5.1 Abstract
To improve the targeting accuracy and reduce procedure time in magnetic resonance
imaging (MRI)-guided procedures, a 3D-printed flexible template was developed. The template
was printed using a flexible photopolymer resin FLFLGR02 in Form 2 printer (Formlabs, Inc.,
Somerville, MA). The flexible material gives the template a unique advantage by allowing it to
make close contact with human skin and provide accurate insertion with the help of the newly
developed OncoNav software. At the back of the template, there is a grid comprised of circular
containers filled with contrast agent. At the front of the template, the guide holes between the
containers provide space and angular flexibility for needle insertion. MRI scans are initially used
to identify tumor position as well as the template location. The OncoNav software then pre-
selects the best guide hole for targeting a specific lesion and suggests insertion depth for the
physician. A phantom study of 13 insertions in a CT scanner was carried out for assessing needle
placement accuracy. The mean total distance error between planned and actual insertion is 2.7
mm, the maximum error was 4.78 mm, and the standard deviation was 1.1 mm. The accuracy of
the OncoNav-assisted and template-guided needle targeting is comparable to the robot-assisted
procedure. The proposed template is a low-cost, quickly-deployable, and disposable medical
device. The presented technology will be further evaluated in prostate cancer patients to quantify
its accuracy in needle biopsy.
Keywords: MRI-guided procedure, 3D-printed template, MRI-visible
5.2 Introduction
Prostate cancer is a common site of malignancy in men [251]. Approximately 1 million
prostate biopsy procedures are conducted in the US each year [68, 69] for the diagnosis of

73
prostate cancer. Image-guided biopsy is able to increase the accuracy of prostate cancer
diagnosis by providing physicians image-based feedback during the biopsy procedure.
Transrectal Ultrasound (TRUS) and Magnetic Resonance Imaging (MRI) have been commonly
used as the modalities for prostate imaging and image-guided biopsy. TRUS is widely available
for guiding prostate biopsy, but prostate tumors often are not visible in ultrasound. MRI,
especially multi-parametric MRI, is currently the most promising imaging modality for detecting
prostate cancer with great accuracy [73, 74]. MRI-TRUS fusion for guidance of targeted prostate
biopsy has been reported in the literature [252-254]. However, prostate patients without rectum
are excluded from this method, and ultrasound artifacts oftentimes compromise the efficiency of
the image fusion[255, 256]. An early investigation by D’Amico A.V. et al., performed
transperineal MRI-guided prostate biopsy in an open configuration 0.5 Tesla MRI scanner [75].
Since then, the advancement of prostate MRI imaging and interventional devices as well the
availability of wide-bore MRI scanners favorable for interventional use have enabled in-bore
biopsies to be performed more easily [257-261].
Robotics is understood to be an effective method to overcome the problem of limited
patient access inside the bore of the MRI scanner. Also, the high accuracy of the robotic
procedure has been widely recognized. Fichtinger et al. firstly reported designs of a manually
powered platform for prostate interventions in a closed MR system [262-265]. Since then, the
development of prostate robots has been demonstrated in closed MRI scanners [266-269].
However, the addition of a robotic operation onto the current interventional procedure requires a
significantly modified clinical workflow and extensive training. Moreover, certain parts of the
robots have a negative impact on the Signal-to-Noise (SNR) in the MR image.

74
Alternatively, some studies have investigated the possibility of improving template
biopsies without disrupting clinical workflow. Given the fact that the diagnostic outcome from
this freehand approach is strongly dependent on the physician’s skills and experience, repetitive
biopsy insertions and sampling are very common, which increases the potential risks and
complications of the procedure. Beekley Medical (Bristol, CT) has developed a fiducial marker
(PinPoint®) that can improve the accuracy of freehand needle insertion [68]. But the marker
provides the surgeon with limited positional guidance. The other effective approach is to use a
template or grid and provide the relative positional information of the tumor to the physicians. So
far, most of the templates available in the market or reported in the research can only achieve a
2-dimensional vertical insertion and have been mainly used in Ultrasound and CT modalities.
Table 5-1 and Table 5-2 shows the current development of CT/MRI compatible assistive needle
guidance system. Kokoda J. et al., has reported using a specially designed needle guidance
template to perform the prostate biopsy in a 70cm bore 3T MRI [77]. The promising result shows
an improved accuracy compared to the conventional freehand procedure. However, the
conventional MRI marker-based registration is used, which requires the physician to manually
enter the positions of the MRI markers of the Z-frame read from the scanner console.
Table 6-1:Existing assistive needle guidance systems
Lead Author Template
Type
Dimension Function Application
Tokuda J. et al. [77] Acrylic block 100×120×25mm Biopsy needle
guide
Prostate biopsy
Hata N. et al. [270] Standard
template
0.0059-inch
holes spaced
5mm apart
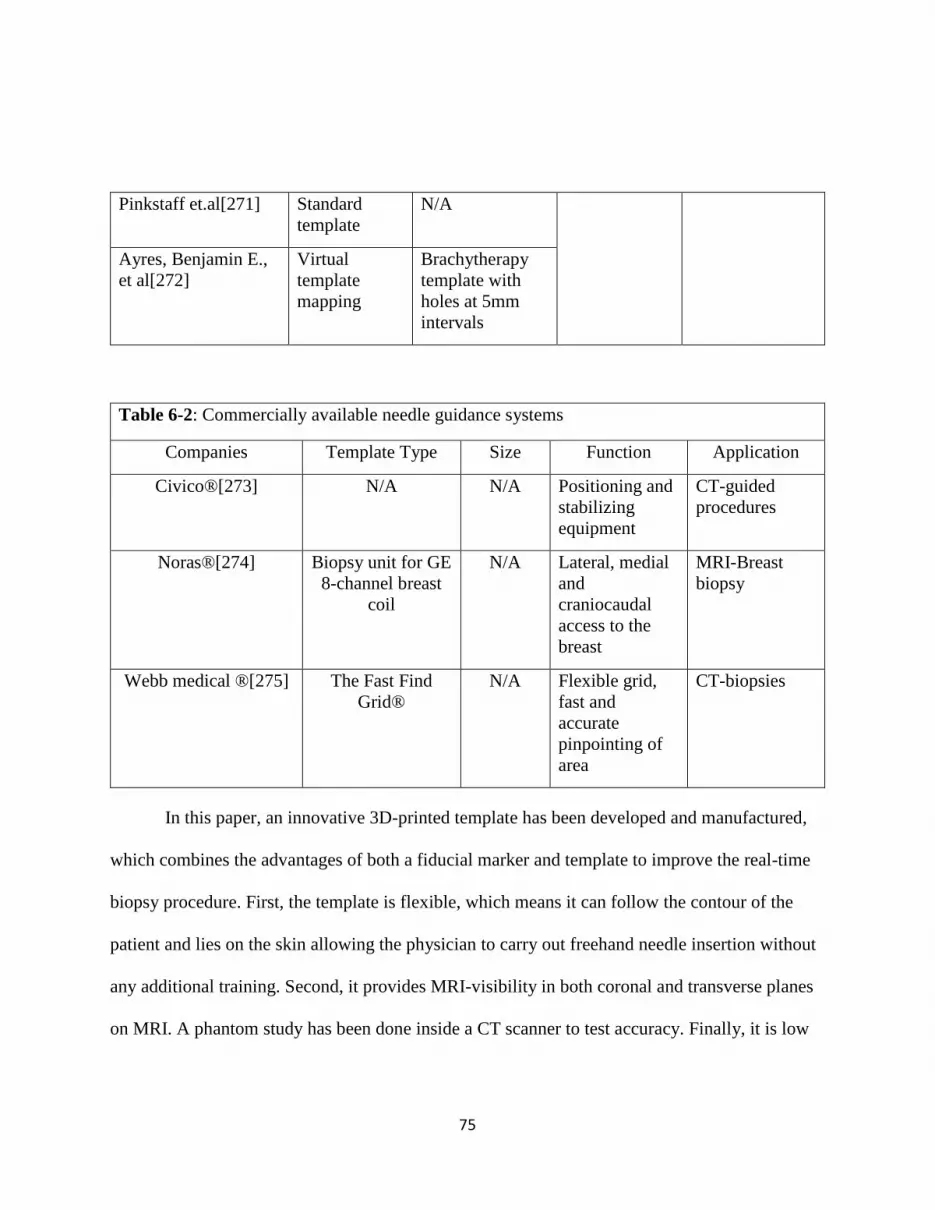
75
Pinkstaff et.al[271] Standard
template
N/A
Ayres, Benjamin E.,
et al[272]
Virtual
template
mapping
Brachytherapy
template with
holes at 5mm
intervals
Table 6-2: Commercially available needle guidance systems
Companies Template Type Size Function Application
Civico®[273] N/A N/A Positioning and
stabilizing
equipment
CT-guided
procedures
Noras®[274]
Biopsy unit for GE
8-channel breast
coil
N/A Lateral, medial
and
craniocaudal
access to the
breast
MRI-Breast
biopsy
Webb medical ®[275]
The Fast Find
Grid®
N/A Flexible grid,
fast and
accurate
pinpointing of
area
CT-biopsies
In this paper, an innovative 3D-printed template has been developed and manufactured,
which combines the advantages of both a fiducial marker and template to improve the real-time
biopsy procedure. First, the template is flexible, which means it can follow the contour of the
patient and lies on the skin allowing the physician to carry out freehand needle insertion without
any additional training. Second, it provides MRI-visibility in both coronal and transverse planes
on MRI. A phantom study has been done inside a CT scanner to test accuracy. Finally, it is low

76
cost and disposable because it is 3D-printed from commonly available resin as raw material. In
the future, it will be tested in clinical trials to prove its effectiveness and accuracy.
5.3 Materials and Methods
The final printed version of the template will be directly mounted on the patient’s body.
There will be a guidance system for the physician to insert the needle at different angles and hit
the tumors at different locations. (Figure 5-1)
Figure 6-1: The presented template-guided system for minimally invasive interventional
procedure
5.3.1 Design Criteria
Our design criteria are based on a survey of interventional radiologists who frequently
perform prostate interventions. The general criteria show the features which a template should
have to meet the market demand, environmental regulations, training and setup requirement, site
restrictions, patient accessibility, and safety. The operational criteria show the technical
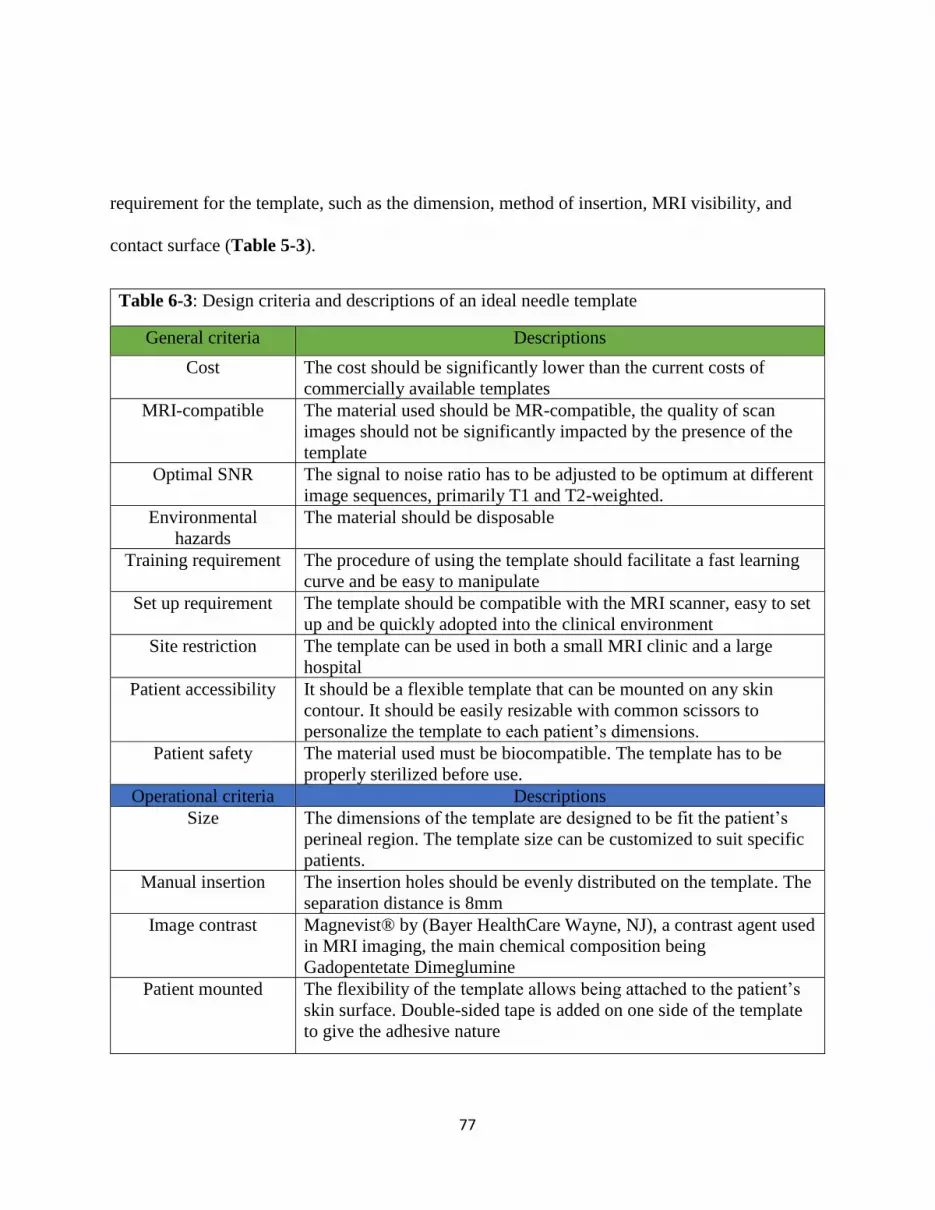
77
requirement for the template, such as the dimension, method of insertion, MRI visibility, and
contact surface (Table 5-3).
Table 6-3: Design criteria and descriptions of an ideal needle template
General criteria Descriptions
Cost The cost should be significantly lower than the current costs of
commercially available templates
MRI-compatible The material used should be MR-compatible, the quality of scan
images should not be significantly impacted by the presence of the
template
Optimal SNR The signal to noise ratio has to be adjusted to be optimum at different
image sequences, primarily T1 and T2-weighted.
Environmental
hazards
The material should be disposable
Training requirement The procedure of using the template should facilitate a fast learning
curve and be easy to manipulate
Set up requirement The template should be compatible with the MRI scanner, easy to set
up and be quickly adopted into the clinical environment
Site restriction The template can be used in both a small MRI clinic and a large
hospital
Patient accessibility It should be a flexible template that can be mounted on any skin
contour. It should be easily resizable with common scissors to
personalize the template to each patient’s dimensions.
Patient safety The material used must be biocompatible. The template has to be
properly sterilized before use.
Operational criteria Descriptions
Size The dimensions of the template are designed to be fit the patient’s
perineal region. The template size can be customized to suit specific
patients.
Manual insertion The insertion holes should be evenly distributed on the template. The
separation distance is 8mm
Image contrast Magnevist® by (Bayer HealthCare Wayne, NJ), a contrast agent used
in MRI imaging, the main chemical composition being
Gadopentetate Dimeglumine
Patient mounted The flexibility of the template allows being attached to the patient’s
skin surface. Double-sided tape is added on one side of the template
to give the adhesive nature

78
5.3.2 Flexible Template Design
The template was initially designed in Solidworks® (Solidworks Corporation, Waltham,
MA). The template should be large enough to cover the whole perineal region. The size of the
template is 80mm×80mm, which is finalized after consultation with the physician in NIH lab
facilities. It has 144 Gadolinium (Gd) containers (Figure 5-2 (a)); each container is filled with a
diluted Gd solution for MRI visualization. The material used for printing out the template is a
flexible photopolymer FLFLGR02 manufactured by Formlabs® (Formlabs Inc, Somerville,
MA). The advantage of using the 3D printing method over other fabrication methods is its low
cost and fast-prototyping. The template is designed for 16, 17, and 18 G biopsy or treatment
needles, which are commonly used needle sizes for clinical trials in NIH facilities.
Figure 6-2: (a) shows the design of the template, (b) shows the 3D print result from the
formlabs®, (c) shows the template flexibility test, the template was able to bend and make full
contact with the arch. (d) shows the cap design for sealing the contrast agent, (d) shows the
final assembly result of the template, (f) shows the MR image (T1-weighted).

79
The print was tested on a platform with maximum curvature of 120 degrees. The cap for
closing the Gd containers is designed to have one insertion module. The circular-shaped module
underneath is for closing the Gd container. In addition, the double-sided tape was used to firmly
attach the template onto the patient's body during the operation. The mechanical design of the
template has experienced systematic optimizations. The idea is to make a template that is both
durable and easy-to-use. Figure 5-3 illustrates the detailed design consideration.
5.3.3 Image Contrast
There are two factors that should be taken into consideration in order to make sure the
template can be MRI visible under any circumstances: container size and the concentration of the
(a) Top view of the template Number Description
(1) Needle
insertion
point
The holes are suitable for
16, 17 and 18G needles.
(2) Container The diameter is 4mm, the
circular design is to
ensure the best print
result and mechanical
stability. A circular
cavity opening is more
easily covered.
(3) , (5)
Connector
It is optimized to be 2mm
in length and 2mm in
height, this achieves a
balance between strength
and flexibility.
(4) Container The height is optimized
to be 10mm to ensure the
best visibility in MRI
images period.
(b) Sideview of the template
Figure 6-3: Detailed design information on optimization

80
Gd solution. These two factors are independent of each other. The MRI scans were conducted to
find out the suitable diameter for optimal MRI signal intensity.
5.3.4 Preparation of Contrast Agent
To find out the optimum concentration for Gd concentration, a test block situated with a
series of containers was prepared, which has a diameter of 4mm. The Gadolinium to water ratio
increased from 0 to 10% for eight containers. The MRI scans were conducted to find a suitable
mixing ratio for optimal MRI signal intensity (Figure 5-4 (a)). It is also equally important to
finding out the optimum diameter for the Gd container. A test block situated with a series of
containers of gradual increasing diameters was prepared. The Gadolinium to water ratio was
optimized and fixed in this case (Figure 5-4 (b)).
(a) Test block for Gd concentration (b) Test block for diameter
Figure 6-4: Two different types of test blocks were CAD designed, and 3D printed for
optimizing both the Gd concentration and container size. (a) shows the circular containers with
a constant diameter of 4mm but the concentration of Gd-water solution increases from
0.9mg/ml to 42.6mg/ml and pure water as a control reference is placed at the bottom right
corner, (b) shows a series of containers with gradual decreasing size, optimal Gd concentration
is applied to all the containers in this case.
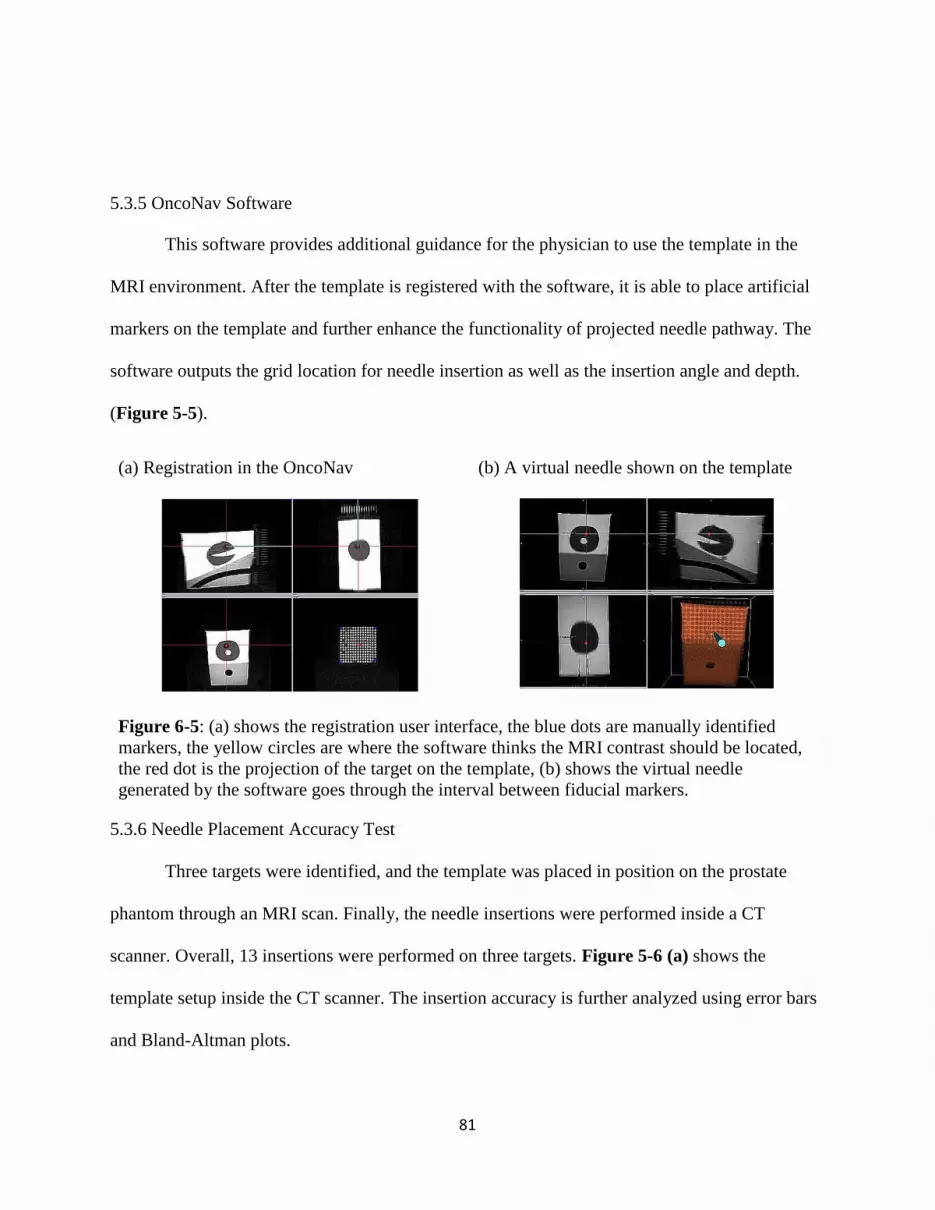
81
5.3.5 OncoNav Software
This software provides additional guidance for the physician to use the template in the
MRI environment. After the template is registered with the software, it is able to place artificial
markers on the template and further enhance the functionality of projected needle pathway. The
software outputs the grid location for needle insertion as well as the insertion angle and depth.
(Figure 5-5).
(a) Registration in the OncoNav (b) A virtual needle shown on the template
Figure 6-5: (a) shows the registration user interface, the blue dots are manually identified
markers, the yellow circles are where the software thinks the MRI contrast should be located,
the red dot is the projection of the target on the template, (b) shows the virtual needle
generated by the software goes through the interval between fiducial markers.
5.3.6 Needle Placement Accuracy Test
Three targets were identified, and the template was placed in position on the prostate
phantom through an MRI scan. Finally, the needle insertions were performed inside a CT
scanner. Overall, 13 insertions were performed on three targets. Figure 5-6 (a) shows the
template setup inside the CT scanner. The insertion accuracy is further analyzed using error bars
and Bland-Altman plots.
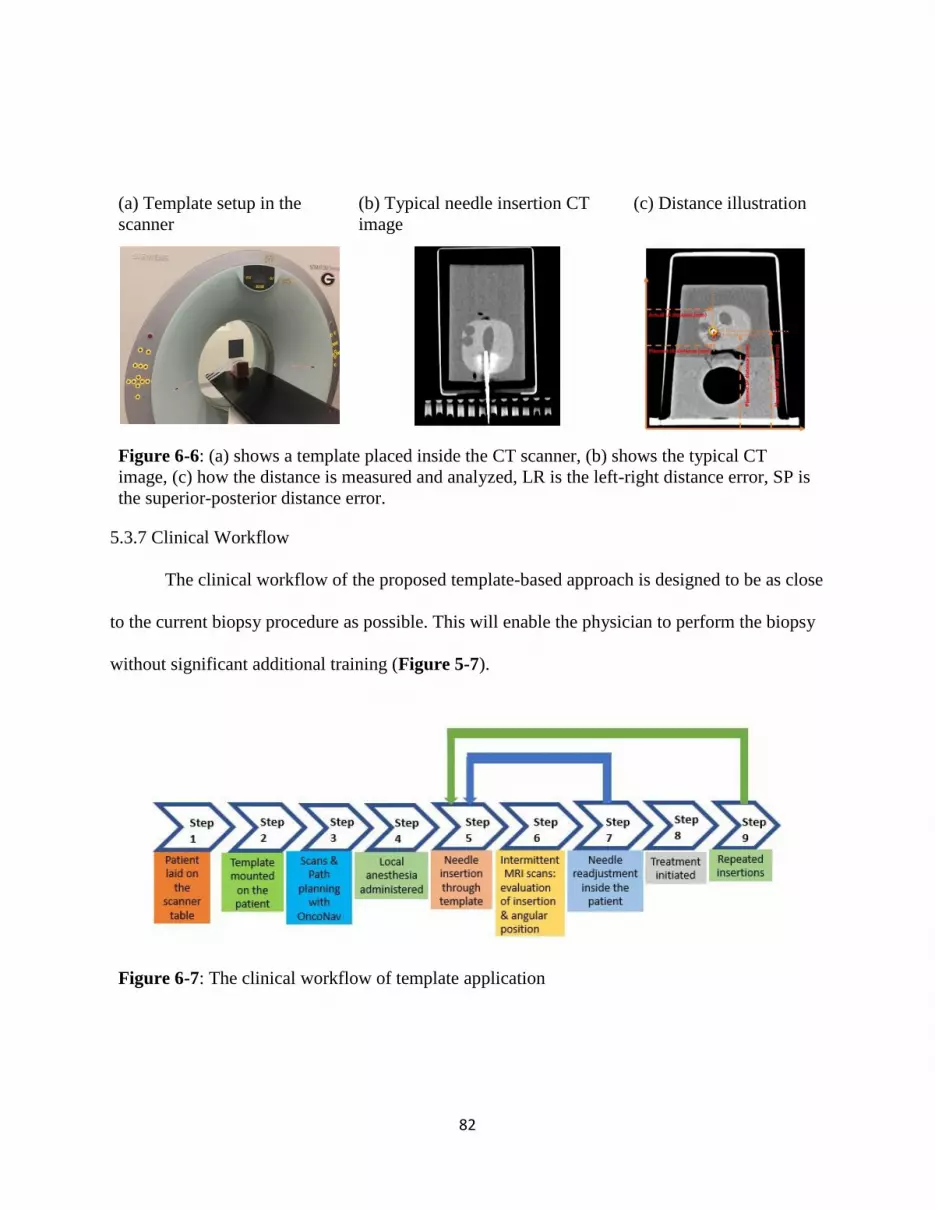
82
(a) Template setup in the
scanner
(b) Typical needle insertion CT
image
(c) Distance illustration
Figure 6-6: (a) shows a template placed inside the CT scanner, (b) shows the typical CT
image, (c) how the distance is measured and analyzed, LR is the left-right distance error, SP is
the superior-posterior distance error.
5.3.7 Clinical Workflow
The clinical workflow of the proposed template-based approach is designed to be as close
to the current biopsy procedure as possible. This will enable the physician to perform the biopsy
without significant additional training (Figure 5-7).
Figure 6-7: The clinical workflow of template application
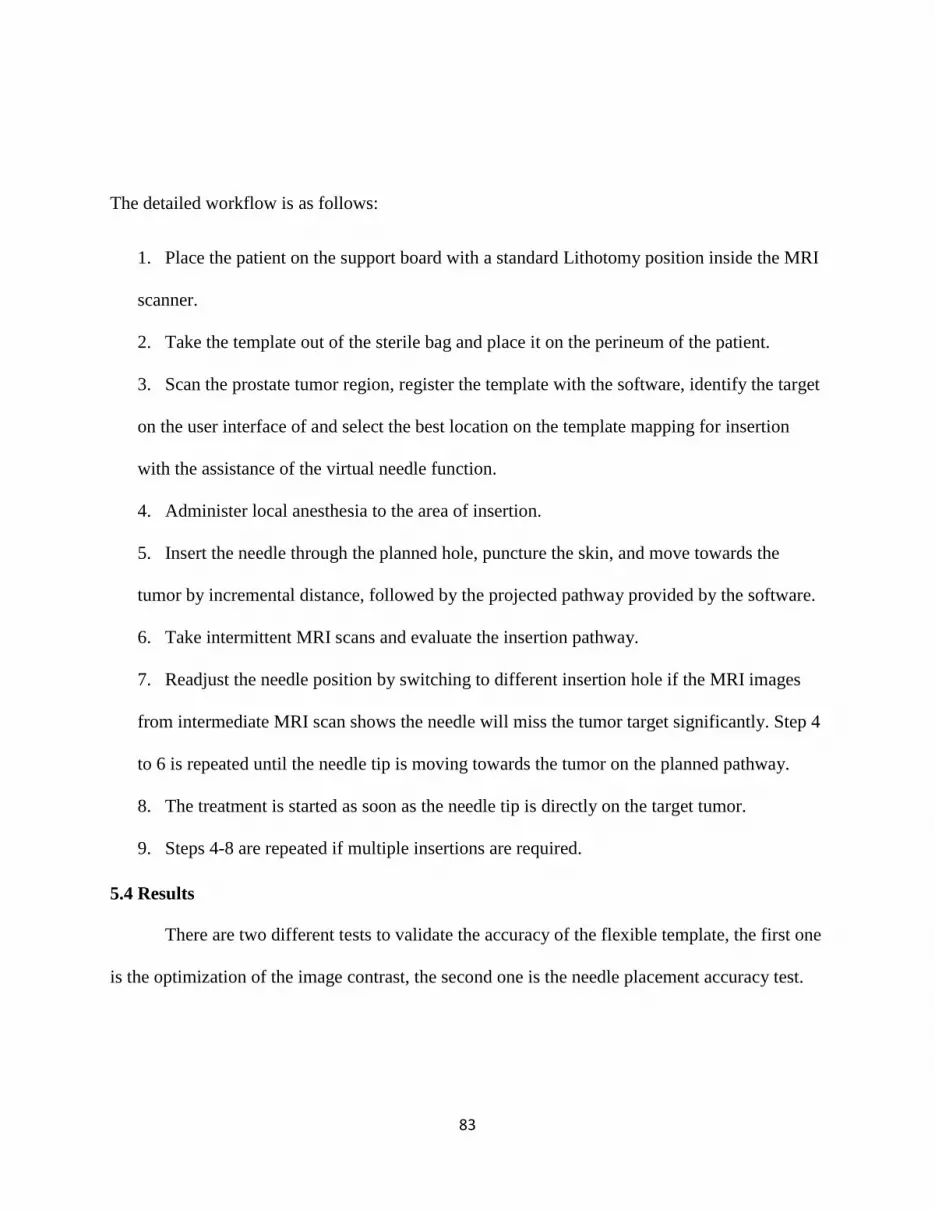
83
The detailed workflow is as follows:
1. Place the patient on the support board with a standard Lithotomy position inside the MRI
scanner.
2. Take the template out of the sterile bag and place it on the perineum of the patient.
3. Scan the prostate tumor region, register the template with the software, identify the target
on the user interface of and select the best location on the template mapping for insertion
with the assistance of the virtual needle function.
4. Administer local anesthesia to the area of insertion.
5. Insert the needle through the planned hole, puncture the skin, and move towards the
tumor by incremental distance, followed by the projected pathway provided by the software.
6. Take intermittent MRI scans and evaluate the insertion pathway.
7. Readjust the needle position by switching to different insertion hole if the MRI images
from intermediate MRI scan shows the needle will miss the tumor target significantly. Step 4
to 6 is repeated until the needle tip is moving towards the tumor on the planned pathway.
8. The treatment is started as soon as the needle tip is directly on the target tumor.
9. Steps 4-8 are repeated if multiple insertions are required.
5.4 Results
There are two different tests to validate the accuracy of the flexible template, the first one
is the optimization of the image contrast, the second one is the needle placement accuracy test.
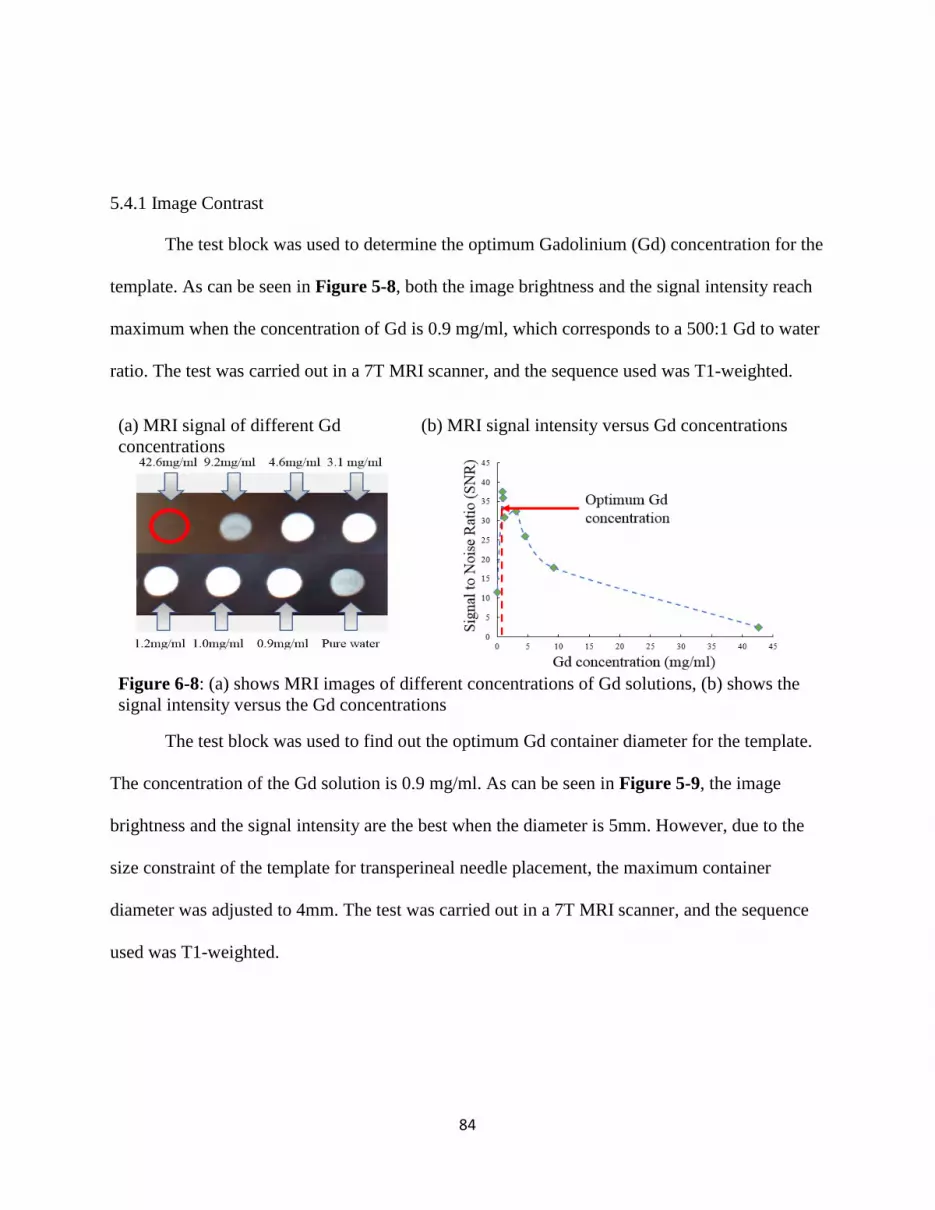
84
5.4.1 Image Contrast
The test block was used to determine the optimum Gadolinium (Gd) concentration for the
template. As can be seen in Figure 5-8, both the image brightness and the signal intensity reach
maximum when the concentration of Gd is 0.9 mg/ml, which corresponds to a 500:1 Gd to water
ratio. The test was carried out in a 7T MRI scanner, and the sequence used was T1-weighted.
(a) MRI signal of different Gd
concentrations
(b) MRI signal intensity versus Gd concentrations
Figure 6-8: (a) shows MRI images of different concentrations of Gd solutions, (b) shows the
signal intensity versus the Gd concentrations
The test block was used to find out the optimum Gd container diameter for the template.
The concentration of the Gd solution is 0.9 mg/ml. As can be seen in Figure 5-9, the image
brightness and the signal intensity are the best when the diameter is 5mm. However, due to the
size constraint of the template for transperineal needle placement, the maximum container
diameter was adjusted to 4mm. The test was carried out in a 7T MRI scanner, and the sequence
used was T1-weighted.
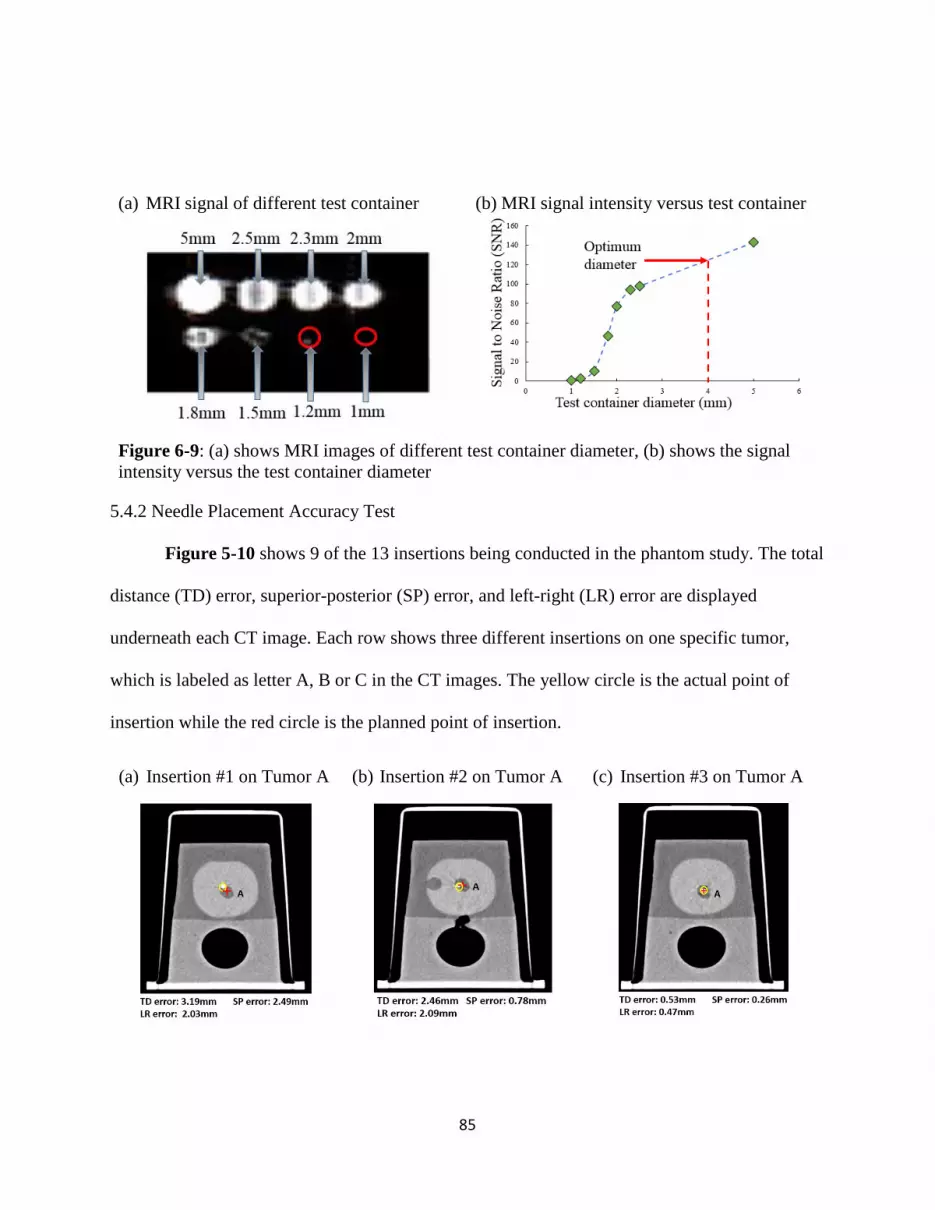
85
(a) MRI signal of different test container (b) MRI signal intensity versus test container
Figure 6-9: (a) shows MRI images of different test container diameter, (b) shows the signal
intensity versus the test container diameter
5.4.2 Needle Placement Accuracy Test
Figure 5-10 shows 9 of the 13 insertions being conducted in the phantom study. The total
distance (TD) error, superior-posterior (SP) error, and left-right (LR) error are displayed
underneath each CT image. Each row shows three different insertions on one specific tumor,
which is labeled as letter A, B or C in the CT images. The yellow circle is the actual point of
insertion while the red circle is the planned point of insertion.
(a) Insertion #1 on Tumor A (b) Insertion #2 on Tumor A (c) Insertion #3 on Tumor A

86
(d) Insertion #1 on Tumor B (e) Insertion #2 on Tumor B (a) Insertion #3 on Tumor B
(b) Insertion #1 on Tumor C (c) Insertion #2 on Tumor C (d) Insertion #3 on Tumor C
Figure 6-10: shows the 9 out of 13 insertions on the prostate phantom are displayed and
analyzed. (a)—(c) is on Tumor A, (d)— (f) is on Tumor B, and (g)—(I) is on Tumor C.
The SP, LR, and overall distance errors are shown in terms of error bars in Figure 5-11.

87
Figure 6-11: Shows a comparison of absolute values of SP, LR, and TD errors for 13
insertions.
The SP and LR errors have been analyzed, and Bland-Altman plots are in Figure 5-12.
(a) For the SP error (b) For the LR error
Figure 6-12: Shows the Bland-Altmann plot for SP and LR respectively.
5.5 Discussion
A new method for real-time MRI-guided biopsy is described. Although a prospective
analysis of a large cohort of patients will be required to critically assess the clinical feasibility of
this procedure, the ability to target simulated prostate tumors with acceptable accuracy has been
demonstrated in a CT phantom study in this paper.
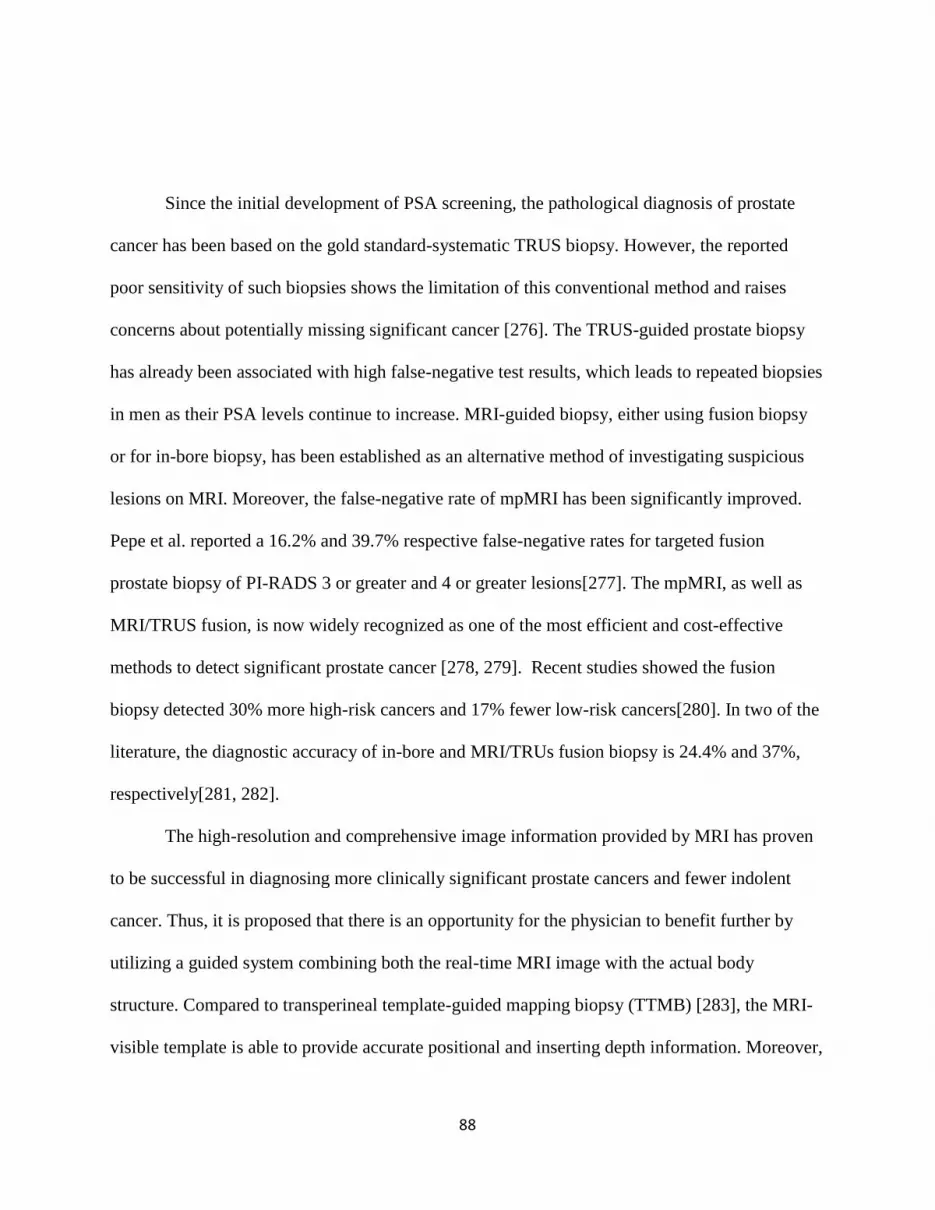
88
Since the initial development of PSA screening, the pathological diagnosis of prostate
cancer has been based on the gold standard-systematic TRUS biopsy. However, the reported
poor sensitivity of such biopsies shows the limitation of this conventional method and raises
concerns about potentially missing significant cancer [276]. The TRUS-guided prostate biopsy
has already been associated with high false-negative test results, which leads to repeated biopsies
in men as their PSA levels continue to increase. MRI-guided biopsy, either using fusion biopsy
or for in-bore biopsy, has been established as an alternative method of investigating suspicious
lesions on MRI. Moreover, the false-negative rate of mpMRI has been significantly improved.
Pepe et al. reported a 16.2% and 39.7% respective false-negative rates for targeted fusion
prostate biopsy of PI-RADS 3 or greater and 4 or greater lesions[277]. The mpMRI, as well as
MRI/TRUS fusion, is now widely recognized as one of the most efficient and cost-effective
methods to detect significant prostate cancer [278, 279]. Recent studies showed the fusion
biopsy detected 30% more high-risk cancers and 17% fewer low-risk cancers[280]. In two of the
literature, the diagnostic accuracy of in-bore and MRI/TRUs fusion biopsy is 24.4% and 37%,
respectively[281, 282].
The high-resolution and comprehensive image information provided by MRI has proven
to be successful in diagnosing more clinically significant prostate cancers and fewer indolent
cancer. Thus, it is proposed that there is an opportunity for the physician to benefit further by
utilizing a guided system combining both the real-time MRI image with the actual body
structure. Compared to transperineal template-guided mapping biopsy (TTMB) [283], the MRI-
visible template is able to provide accurate positional and inserting depth information. Moreover,
89
the physicians are able to perform needle insertion on optimal skin entry point and adjust the
needle pathway to reach the tumor.
The template-assisted needle biopsy insertion is done by MRI for a clinical procedure.
One of the limitations of this study is that the validation test was carried out in CT instead of
MRI. CT scan is not part of the clinical workflow. During the CT-guided procedure, intra-
operative imaging is not used to adjust needle insertions. Therefore, CT is merely a tool to
evaluate accuracy. CT is used in the accuracy test because it is more accessible than MRI and
better at localizing the needle.
3D printing material is flexible and highly elastic. In addition, the Formlabs® printer can
provide a high printing accuracy of 0.05mm. This allows the design of tight-fit and high-
tolerance holes for specific needle sizes, such as 17 G needles, which are commonly used in
clinical practice. Therefore, once the needle is positioned on the template, the orientation of the
needle can be manually adjusted.
The connectors are designed to be removable so that the template not only can be easily
segmented into smaller pieces and sizes for different populations but also can be flexible enough
so that it can attach to the skin surface directly. Together with the MRI-visible Gd containers, the
template is able to appear as a series of columns along the curvature of the skin surface in MRI
images at the transverse view.
Due to the proximity of the template, the physician can have an understanding of the
distance from the skin entry point to the target. Since the template appears consistently on MRI
slices on both coronal and transverse views, it allows the physicians to track the needle trajectory
based on the position and orientation of the template. The physician uses coronal-plane images to
90
determine the best skin entry point. After the needle is inserted, template images at transverse
planes provide angular and depth information of the needle. One limitation of the template is that
all the markers may not be shown on the single slice of the MRI image. However, a software
used is able to register each marker of the template and display both existing and software
simulated marker positions. During the insertion, the template stays firmly on the skin surface so
that the physicians can take intermediate MRI scans, adjust the needle orientation if it deviates
from the planned trajectory or any unplanned occurrences. This can ensure insertion accuracy
comparable to the robot-assisted approach without dedicated training. Zandman et al. have
developed a robotic device with an average error of 1.84 mm [284]. Other robotic systems like
Srimathveeravalli et al. have achieved an accuracy of 2.58 mm [285]. The mean error of the
proposed template is 2.7 mm.
The signal intensity is the key for the template to be visible in the scan images. There are
four factors influencing the signal intensity; the first is the mixing ratio between Gd solution and
pure water; the optimized value is 1ml:500ml. In Figure 5-9, the pure water appears darker than
the rest of the Gd solutions. This is because the higher the Gd concentration, the more quickly
the molecules in Gd concentration can realign its longitudinal magnetization with B0 after RF
pulse, thus shortening T1. Therefore, the image will appear brighter on T1 weighted scans. On
the other hand, the concentration of 42.6 mg/ml is dark because of the profound shortening of
T2. The second factor is the size of the Gd container. A larger container will have more visibility
in the MRI images. However, because the overall size of the template is limited to the perineal
region, a larger container will greatly increase the separation distance between the insertion
holes. This will reduce the accuracy of the needle insertion process. The third factor is the
91
sequence used during the MRI scanning. A T1-weighted sequence is used in the MRI scan
because it is a standard procedure for experimental purposes in the research institution. In the
future, a T2-weighted sequence will be used so that tumors can be optimally visible. The final
factor is the location of the organ. The prostate is closer to the bladder, which will lower the
template visibility because of the urine storage.
The uniqueness of the procedure is that the template can be mounted to the patient with
close skin contact. The template is filled with the optimal concentration of contrast agent, which
is MRI-visible in both transverse and coronal planes. The physician is able to perform the needle
insertion with a real-time indication of needle position. However, one of the limitations is that
the contrast agent will gradually lose its MRI visibility over a month’s time due to the
vaporization of the solution. We will find out a better way to seal the contrast agent and retain its
maximum visibility in the future. The other limitation is that the flexibility could potentially self-
introduce some errors because some insertion holes on the template will be slightly stretched on
the uneven surface. One solution is the intermittent scans will further guarantee the needle
remains targeting towards the lesion.
In terms of economic potential, the template can be printed out in a 3D printer repeatedly
with consistent quality. The print material is a flexible photopolymer resin FLFLGR02
developed by Formlabs®, which is commercially available. Finally, the template is designed to
be reusable for a predetermined number of uses and then becomes disposable.

92
5.6 Summary
This chapter presents an innovative, flexible template that can be 3D-printed with
biocompatible material. The template is designed specifically for the transperineal prostate
biopsy in MRI scanners. The template can be cut into customized sizes for different age groups.
Other important features are its visibility on MRI and the ability to quickly register it to standard
images. The phantom study shows, with the assistance of the template and software, the accuracy
of the prostate biopsy is comparable to a robotic system. It can be foreseen that the overall
clinical procedure time will be reduced without significant alteration of the clinical workflow.
Future work will be testing the diagnostic accuracy of the template in a human clinical study and
compare the results with the standard procedure for a needle biopsy.

93
6. CHAPTER 6
A LOW-COST PATIENT-MOUNTED NEEDLE LOCALIZER FOR IN-PLANE RF
THERMAL ABLATION4
4 Li, R., Xu S., Wood B., Tse, Z.T.H. To be submitted to Journal of Vascular and Interventional Radiology.

94
6.1 Abstract
CT-guided percutaneous needle insertion is one of the most common guidance techniques
in interventional radiology (IR) but requires experienced operators and multiples X-ray controls.
We aimed to evaluate the feasibility and performance of CT-guided radiofrequency liver ablation
assisted by a new angular tracker in an in-vivo animal model. A low cost, ergonomic, patient-
mounted, and smartphone-based micro-electromechanical system (MEMS) angular localizer was
designed, and 3D printed as a needle holder. It was first tested and calibrated in a rigid and
controlled benchtop environment, followed by an in vivo experiment on a live swine. Six CT-
guided percutaneous liver ablations were conducted and assisted by our novel device.
The mean tip-to-target distance error, measured as a minimum needle path to the target, was 5.2
mm, with a standard deviation of ± 1.4 mm. The average tip to target distance was 7.4 mm. The
mean tip-to-target angular error was 4.2°, with a standard deviation of ± 2.6°. The average
puncture time was 25.5 s. Only one of the punctures required an intermediary CT scan, and none
required any needle drawback or repositioning. No major complication was noted during the
procedure. This MEMS angular tracker device can reliably assist in-vivo percutaneous insertions
conducted under CT-guidance.
Keywords: MEME Sensor, Cancer Ablation, In-vivo Study, Image-guided
6.2 Introduction
Primary liver cancer is the most common cancer worldwide, causing an estimated one
million deaths every year [286]. For patients with inoperable or recurrent liver cancer, RFA
provides a safe and successful option [287]. RFA is minimally invasive, safe, and effective and
has great potential for local tumor destruction.
95
Recent advancements in radiofrequency thermal ablation (RFA) have opened a variety of
treatment options for certain oncology patients [287-289]. Image-guided percutaneous therapy
[290, 291] may now provide an effective local treatment of isolated or localized neoplastic
disease, and can also be used as an adjunct to conventional surgery [292], systemic
chemotherapy [293], or radiation [294]. RFA is a classic example of utilizing heat in medical
applications. During the procedure, the locations of the tumors are identified with various
imaging modalities such as ultrasound [294], computed tomography (CT) [295], or magnetic
resonance imaging (MRI) [296]. The principle for RFA is that the patient is treated into an
electrical circuit by placing grounding pads on the thigh area. The physician inserts a small
needle, which has the electrode, through the skin, and then reaches the tumor target. The needle
tip generates ionic vibration and leads to frictional heat.
However, in the RFA procedure, failed to target and ablate the tumor with clean edges
will result in regrowth of the tumor [297]. Also, the ablation will damage all the healthy cells
along the needle pathway during the retracting process at the end of the treatment session. In
other words, improper path planning will result in a potential risk of thermal injury to critical
structures [298].
In order to increase the insertion accuracy to avoid the above problems, various efforts
have been put to improve either needle trajectory planning or tracking. Some of the research
groups focused on trajectory planning. DiMaio et al. developed effective motion planning and
needle steering model base on finite element analysis (FEA) [299]. The others focused more on
trajectory tracking. In the category of trajectory tracking, there were two subclasses: active
systems such as needle steering robots. Cleary et al. developed a “needle driver” robotic system

96
for minimally invasive procedures [300], where the precision results were comparable to the
manual procedure. Ben-Davis et al. developed a CT-Guided Robotic system with a maximum
error of 4.8 mm for liver insertion [301].
Other groups were leaning towards the development of real-time tracking devices using
Electromagnetic (EM) [302]. Apart from that, commercially available needle tracking systems
such as VirtuTRAX® instrument navigator [303] and NeoRad SimpliCT [304] developed
hardware and software platforms to assist needle navigation.
Table 6-1 shows the recent development of tracking devices. Most of the devices have
reached the stage of the clinical study.
Table 6-1: The comparison between other devices and the presented device in this study
Research groups Technology Year Types of
studies
Accuracy Reference
Ben-David et al. Xact Robotics 2018 Animal The mean distance to
target was 92.9 mm ± 19.7
(range, 64—146 mm).
[301]
Abayazid et al. Inertial
Measurement
Unit
2017 Phantom The mean errors of the
experimental trials varied
between 0.86 mm and
1.29 mm.
[305]
Basafa et al. ClearPoint 2016 Phantom,
animal, and
human
The total systematic error
was (3.99 ± 1.43) mm.
[306]
Koethe Perfint Maxio 2014 Phantom Mean entry-to-target
distance was 11.0 ± 3.8 cm
(range, 10.2—11.5 cm) for
needle insertions
simulating percutaneous
biopsy.
[307]
Appelbaum et al. VirtuTRAX 2013 Animal The target accuracy was
4.0 ± 3.2 mm when an EM
sensor was installed on the
needle tip.
[308]
Roberts et al. SeeStar 2006 Phantom and
animal
N/A [309]
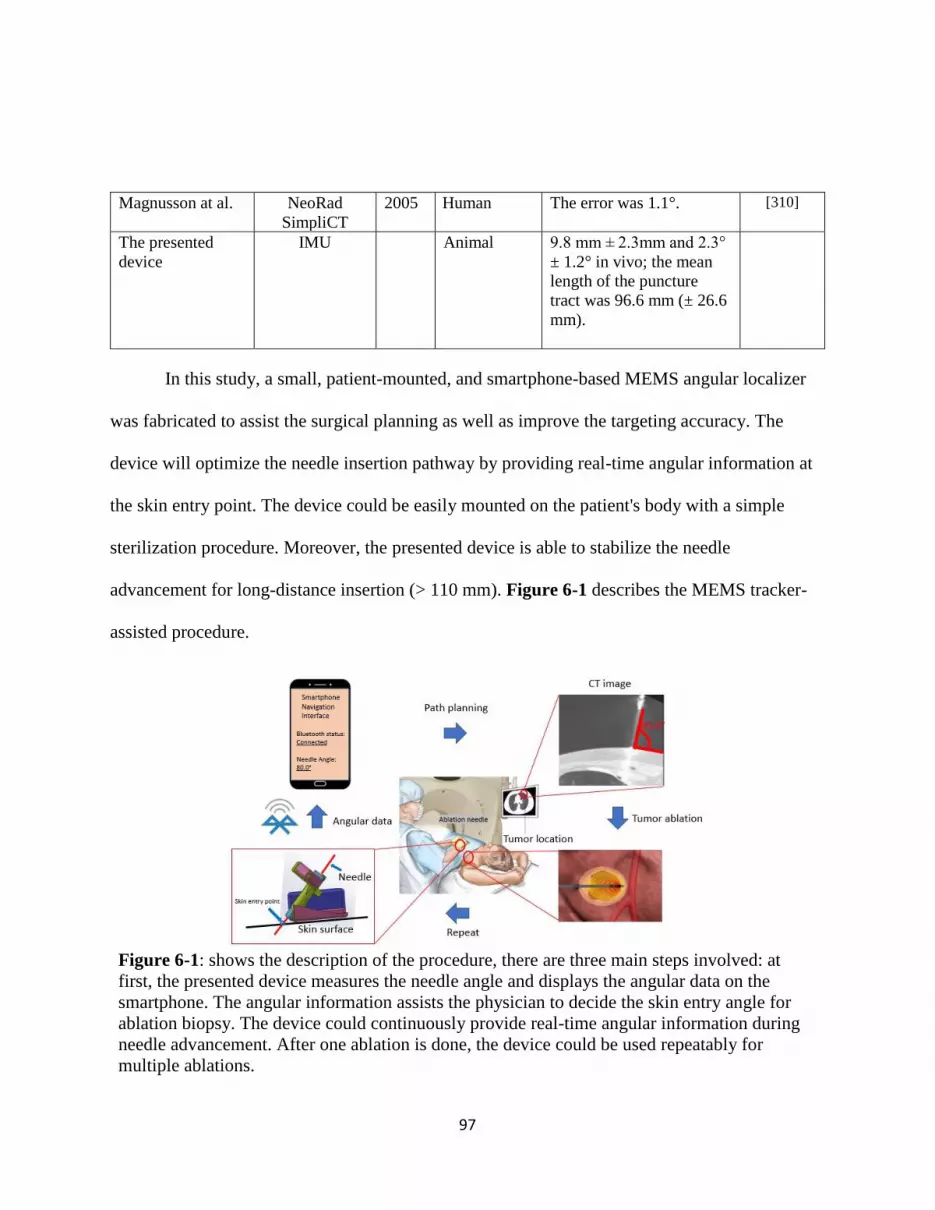
97
Magnusson at al. NeoRad
SimpliCT
2005 Human The error was 1.1°. [310]
The presented
device
IMU Animal 9.8 mm ± 2.3mm and 2.3°
± 1.2° in vivo; the mean
length of the puncture
tract was 96.6 mm (± 26.6
mm).
In this study, a small, patient-mounted, and smartphone-based MEMS angular localizer
was fabricated to assist the surgical planning as well as improve the targeting accuracy. The
device will optimize the needle insertion pathway by providing real-time angular information at
the skin entry point. The device could be easily mounted on the patient's body with a simple
sterilization procedure. Moreover, the presented device is able to stabilize the needle
advancement for long-distance insertion (> 110 mm). Figure 6-1 describes the MEMS tracker-
assisted procedure.
Figure 6-1: shows the description of the procedure, there are three main steps involved: at
first, the presented device measures the needle angle and displays the angular data on the
smartphone. The angular information assists the physician to decide the skin entry angle for
ablation biopsy. The device could continuously provide real-time angular information during
needle advancement. After one ablation is done, the device could be used repeatably for
multiple ablations.
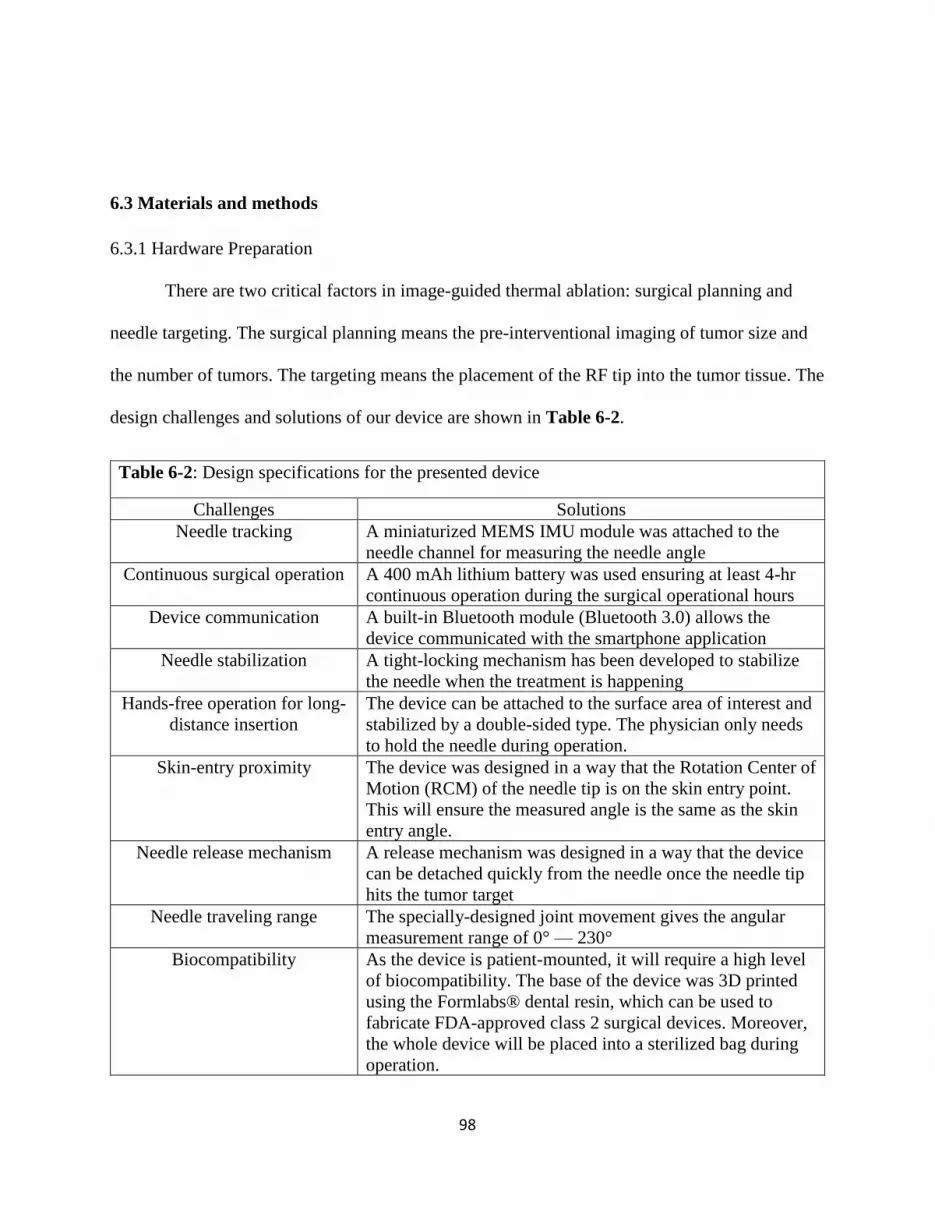
98
6.3 Materials and methods
6.3.1 Hardware Preparation
There are two critical factors in image-guided thermal ablation: surgical planning and
needle targeting. The surgical planning means the pre-interventional imaging of tumor size and
the number of tumors. The targeting means the placement of the RF tip into the tumor tissue. The
design challenges and solutions of our device are shown in Table 6-2.
Table 6-2: Design specifications for the presented device
Challenges Solutions
Needle tracking A miniaturized MEMS IMU module was attached to the
needle channel for measuring the needle angle
Continuous surgical operation A 400 mAh lithium battery was used ensuring at least 4-hr
continuous operation during the surgical operational hours
Device communication A built-in Bluetooth module (Bluetooth 3.0) allows the
device communicated with the smartphone application
Needle stabilization A tight-locking mechanism has been developed to stabilize
the needle when the treatment is happening
Hands-free operation for long-
distance insertion
The device can be attached to the surface area of interest and
stabilized by a double-sided type. The physician only needs
to hold the needle during operation.
Skin-entry proximity The device was designed in a way that the Rotation Center of
Motion (RCM) of the needle tip is on the skin entry point.
This will ensure the measured angle is the same as the skin
entry angle.
Needle release mechanism A release mechanism was designed in a way that the device
can be detached quickly from the needle once the needle tip
hits the tumor target
Needle traveling range The specially-designed joint movement gives the angular
measurement range of 0° — 230°
Biocompatibility As the device is patient-mounted, it will require a high level
of biocompatibility. The base of the device was 3D printed
using the Formlabs® dental resin, which can be used to
fabricate FDA-approved class 2 surgical devices. Moreover,
the whole device will be placed into a sterilized bag during
operation.

99
Repeatable usage The device was designed to be mechanically robust and can
be used in multiple insertions.
Low-cost solution The total material cost of the device was less than $100,
including the 3D printing material as well as the MEMS
IMU sensor.
Figure 6-2 shows the overall design and fabrication process. The device was firstly
designed and assembled in Solidworks®. Then the Formlabs® 3D printer was used to print out
the device. The rotational joint was made with a metal rod. A white cable was used to connect
the MEMS tracker with the microprocessor. Moreover, there is a Bluetooth module inside the
black case, which enables the tracker to communicate with and output angular data to the
smartphone application.
(a) CAD design (b) Needle rotating and release mechanism
(c) Final device assembly (d) Pairing with a mobile platform
Figure 6-2: shows (a) CAD design, (b) Needle release and Remote Center of Motion (RCM)
mechanism, (c) final device assembly using biocompatible material, and (d) Bluetooth
communication with the mobile platform, which shows the real-time needle angle.

100
The device was 3D-printed using a biocompatible material RS-F2-DBOP-01 by
Formlabs® (Sommerville, CA). The resin has a class II biocompatibility with high accuracy of 50
microns. Moreover, during the operation, a sterile bag was used to enclose the device and ensure
the device was sterilized. The device includes a microprocessor, a battery, a Bluetooth
communication module, and a measurement unit. The measurement unit includes a gyroscope, a
magnetometer sensor, and an accelerometer to provide angular measurements on three axes. The
Bluetooth module allows communicating with a smartphone app for angular display.
6.3.2 Clinical Workflow
Figure 6-3 shows the proposed clinical workflow for this device. It mainly breaks down
into the following steps:
Step 1 Trajectory planning: intravenous conscious sedation is required. The skin area on
the patient is aseptically prepared and draped. The skin entry point, as well as the planned
insertion angle, was defined after the initial CT scan.
Step 2 Needle placement: the physician first places the device on the skin entry point
using double-sided tape. The angle of the needle channel was set to the planned insertion angle,
and the needle was locked in position on the device.
Step 3 Needle advancement and adjustment: the needle was punctured through the skin
and advanced towards the tumor target. Intermediate CT evaluation allows the stepwise
correction of the needle’s position to the tumor target as the target may move under natural
respiration.

101
Step 4 Needle confirmation: one final CT scan was conducted to confirm the needle
position relating to the tumor target for ablation treatment.
Step 5 Treatment initialization: the physician detaches the device from the skin entry
point and initiates the ablation treatment.
Step 6 Multiple sites of ablation: the physician retract the needle and reinitiate the needle
insertion if multiple ablation sites are required.
Figure 6-3: presented clinical workflow, which has six steps. Step 1, Step 2-4, and Step 5-6
are the planning step, the target acquiring steps, and the treatment steps, respectively.
6.3.3 Accuracy Test
Two tests have been carried out to test the accuracy of the device. The first one is the
benchtop test, which tests the measuring accuracy of the device in an ex-vivo environment. The
second test was carried out in a live swine, which validate the insertion accuracy of the device in
an in-vivo surgical environment.
6.3.4 Benchtop Test
The purpose of the benchtop test is to calibrate the needle in a rigid and controlled
environment. The test takes place on a flat surface, where protractor was used to measure the
actual inclination angle, which was compared to the IMU measurement.

102
6.3.5 In-vivo Study
All procedures were performed under a protocol approved by the Institutional Animal
Care and Use Committee using one healthy castrated male Yorkshire domestic swine study (70
pounds). After the test was finished, all the CT images were analyzed in the software
MircoDicom viewer®.
6.4 Results
There are two different tests to validate the accuracy of the handheld tracker, the first one
is the benchtop test, the second one is the live swine study.
6.4.1 Benchtop Test
Figure 6-4 shows the benchtop test. The Root-Mean-Square (RMS) error is 0.64°.
Figure 6-4: shows the results of the benchtop test. The number of trials is listed underneath,
along with the absolute errors in each trial.
1 2 3 4 5 6 7 8 9 10
Planned angle 0 10 20 30 40 50 60 70 80 90
Measured angle 0.23 10.5 20 29.4 39.5 50.5 61 69 79.3 89.3
0102030405060708090
An
gle
(deg
rees
)

103
6.4.2 In-vivo Study
Figure 6-5 shows one typical example of how the planned and actual insertion depth was
obtained from the CT study. The swine was scanned on the transverse plane to locate the targets.
Then the pre-planned pathway was determined and measured for one specific target, shown in a
red line in Figure 6-5 (b). The target was marked as a red circle. Finally, after the actual
insertion was done, the pathway was scanned, measured, and highlighted in the yellow line. The
needle tip was marked as a yellow square.
(a) Pre-inserted targets (b)Pre-planned pathway (c) Actual insertion pathway
Figure 6-5: One example of needle insertion from the stage of planning to completion, (a)
shows pre-inserted CT visible targets (0.5mm-BB beads), (b) shows pre-planned insertion
pathway, (c) shows the final scan of the actual pathway.
Table 6-3 shows the definition of symbols used in Figure 6-6 as the device is skin-
mounted, so the planned and actual insertion depth was calculated from the skin entry point.
Table 6-3: Definition of Symbols used in the image analysis
Symbols Meanings
PDS Planned Insertion Depth from Skin Entry Point
ADS Actual Insertion Depth from Skin Entry Point
TTD Needle Tip-to-Target Distance Error
AE Needle Angular Error between PDS and ADS

104
Figure 6-6 shows 6 insertion results from the in-vivo study. The average actual insertion
depth is 96.2 mm (± 28.5 mm).
(a) Target 1
(b) Target 2
(c) Target 3
(d) Target 4
83.0
80.0
7.2
8.0
0 20 40 60 80 100
PDS
ADS
TTD
AE
mm
143.0
140.0
7.4
3.0
0 30 60 90 120 150
PDS
ADS
TTD
AE
mm
112.0
117.0
6.2
1.0
0 30 60 90 120 150
PDS
ADS
TTD
AE
mm
60
65.5
11.7
6.0
0 30 60 90 120 150
PDS
ADS
TTD
AE
mm

105
(e) Target 5
(f) Target 6
Figure 6-6: shows all the CT images of insertions for 6 targets. On each row, the first image
presents the overall needle pathway. The second image displays the needle and tumor location.
Besides the images, there are four parameters, PDS (planned insertion distance from skin entry
point), ADS (actual insertion distance from skin entry point), TTD (needle tip-to-target
distance error), and AE (needle angular error). The red line is the planned insertion with a
circle end indicating the tumor position. The yellow line is the actual insertion with a square
end indicating the actual needle position.
Figure 6-7 shows the comparisons between the planning pathway and the actual pathway
in terms of TTD and AE. Figure 6-7 (a) shows the comparison between planned and actual
insertion distances. Figure 6-7 (b) shows the corresponding tip-to-target error. Figure 6-7 (c)
shows the comparison between planned and actual insertion angles and Figure 6-7 (d) shows the
corresponding angular error.
81.0
82.0
7.4
5.0
0 30 60 90 120 150
PDS
ADS
TTD
AE
mm
84.0
90.0
4.2
2.0
0 20 40 60 80 100
PDS
ADS
TTD
AE
mm

106
(a) Comparison between planned and actual insertion distances
(b) Tip-to-target Distance Error (TTD)
(c) Comparison between planned and actual insertion angles
(d) Angular Error (AE)
Figure 6-7: Results of six insertions for the in-vivo study, (a) shows the comparison between
the actual and planned insertion distance, (b) shows the TTD errors, (c) shows the comparison
between the actual and planned insertion angle, (d) shows the AE errors. The mean accuracy,
measured as the minimum needle path to the target, was 5.2 mm. The average tip to target
1 2 3 4 5 6
Planned insertion distance (mm) 83 140 112 60 81 84
Actual insertion distance (mm) 80 143 117 65.5 82 90
0
50
100
150
Inse
rtio
n d
ista
nce
(m
m)
1 2 3 4 5 6
TTD error (mm) 7.16 7.41 6.21 11.74 7.4 4.2
0
5
10
15
Aso
lute
TTD
err
or
(mm
)
1 2 3 4 5 6
Planned angle (degrees) 65.0 77.0 73.0 50.0 43.0 116.0
Actual angle (degrees) 57.0 74.0 72.0 44.0 38.0 118.0
0
50
100
150
Inse
rtio
n a
ngl
e (d
egre
es)
1 2 3 4 5 6
AE error (degrees) 8.0 3.0 1.0 6.0 5.0 2.0
0.0
5.0
10.0
Ab
solu
te A
E (d
egre
es)

107
distance was 7.4 mm. The average puncture time was 25.5 s. Only one of the punctures
required an intermediary CT scan, and none of the insertions required any needle drawback or
repositioning.
6.5 Discussion
The In-plane needle localizer could provide real-time angular information. There are
many design consideration to ensure the consistent and accurate angular output. However, there
are some limitations of the device which will be addressed in this section.
6.5.1 Angular Measurement
Although IMU sensors have benefits of large operation range and free of the line of sight
problem compared to the optical sensors, they suffer from the drifting problem. In our case, a
tri-axial accelerometer and a tri-axial magnetometer were integrated with the gyroscope inside
the MEMS IMU module. The combined data from each sensor were processed via an extended
Kalman filter-based data fusion algorithm. This approach can significantly reduce the
measurement error and provide a more accurate angular estimation. Moreover, as the MEMS
IMU sensor detects the three-dimensional position, and the device needs to output two-
dimensional angular information, the tilt angle was used to calculate from the pitch and roll
angles of the IMU sensor.
6.5 2 Assistive Image-guided Devices
The past literature has explored a wide range of assistive devices in different image
modalities, such as CT biopsy templates [311, 312]. For those image-guided devices, the biggest
issue is the lengthy image registration [39]. The current solutions were to use fiducial [313, 314]
or apply computing-based methods [315]. Alternatively, devices could be designed to be close
contact with the skin surface, which greatly shorten the distance to the surgical references, and

108
thus lower the registration difficulty. The only requirement is to align the device with the laser
guide during the surgical planning, so the device is on the same image slice as the tumor target.
Moreover, the Remote Center of Motion (RCM) point was designed to overlap with the
skin entry point. This means the skin entry angles measured from the CT images will be the same
as the needle rotational angles measured from the MEMS IMU sensor. In other words, during the
incremental needle advancement, the physician could firstly measure the skin entry angle, plan
the new skin entry angle judged by the extent for targeting deviation, then set the new needle
angle using the device. Admittedly, the orientation of the inserted needle tip may not be
consistent with the one of outside needle shaft as the needle was likely deflected by the motion
of soft tissue. The current practice of mitigating this impact was to steer the needle or manipulate
the tissue manually. The tissue deflection is out of the scope of this study. In the future, another
study could be conducted to combine the device with a steerable needle and evaluate the TTD
and AE.
6.5.3 Other Errors in the Experiment
During the in-vivo study, the respiratory movement of the animal model could potentially
deflect the needle direction. Moreover, the punctuation through the skin surface and into soft and
inhomogeneous tissue will cause the needle to deviate from the planned pathway due to the
curvature of the needle shaft. In the clinical setting, the accuracy of the needle placement could
be largely impacted by difficult inserting approach, respiratory motion, peristalsis, and changing
target location sue to mechanical pressure in soft tissues [316].

109
6.5.4 Limitations
Currently, the device can only carry out in-plane insertion because of its design
constraints. The device has to be aligned with the laser guide so that the device can be registered
with the CT image, and the measured angle is consistent with the skin entry angle. The laser line
acted as a reference for in-plane insertions. The needle has to be maintained in the axial plane
during insertion.
6.6 Summary
Radiofrequency thermal ablation (RFA) is a minimally invasive approach for cancer
treatment that uses the images for needle path planning and applies thermal energy at the needle
tip to damage cancer cells. Deviated needle pathway, however, could result in ineffective
treatment while posing risks of thermal injury to healthy surrounding organ tissues. Several
research groups have made substantial progress in optimizing the needle trajectory.
In this study, a 3D-printed, portable, easy-to-mount, and smartphone-based MEMS
tracker was developed to assist the operation of cancer ablation. The benchtop test showed the
device has an RMS error of 0.64°. The in-vivo study on a swine model demonstrated that the
mean tip-to-target distance error, measured as a minimum needle path to the target, was 5.2 mm,
with a standard deviation of ± 1.3 mm. The mean tip-to-target angular error was 4.2°, with a
standard deviation of ± 2.6 °. The average puncture time was 25.5 s. This study prove that this
device could effectively assist accurate needle insertion.

110
7. CHAPTER 7
A LOW-COST, SMARTPHONE-BASED, AND MEMS IMU-ENABLED HANDHELD
TRACKER FOR CT-GUIDED INTERVENTION5
5 Li, R., Xu, S., Pritchard, W.F., Karanian, J.W., Krishnasamy, V.P., Wood, B.J., and Tse, Z.T.H. Accepted by Annals
of biomedical engineering.
Reprinted here with permission of publisher.

111
7.1 Abstract
As a low-cost needle navigation system, AngleNav may be used to improve the accuracy, speed,
and ease of CT-guided needle punctures. The AngleNav hardware includes a wireless device with a
microelectromechanical (MEMS) tracker that can be attached to any standard needle. The
physician defines the target, desired needle path, and skin entry point on a CT slice image. The accuracy
of AngleNav was first tested in a 3D-printed calibration platform in a benchtop setting. An abdominal
phantom study was then performed in a CT scanner to validate the accuracy of the device’s angular
measurement. Finally, an in-vivo swine study was performed to guide the needle towards liver targets
(n = 8). CT scans of the targets were used to quantify the angular errors and needle tip-to-targeting
distance errors between the planned needle path and the final needle position. The MEMS tracker
showed a mean angular error of 0.01° with a standard deviation (SD) of ± 0.62° in the benchtop setting.
The abdominal phantom test showed a mean angular error of 0.87° with an SD of ± 1.19° and a mean
tip-to-target distance error of 4.89 mm with an SD of ± 1.57 mm. The animal experiment resulted in a
mean angular error of 6.6° with an SD of ± 1.9° and a mean tip-to-target distance error of 8.7 mm with
an SD of ± 3.1 mm. These results demonstrated the feasibility of AngleNav for CT-guided
interventional workflow. The angular and distance errors were reduced by 64.4 and 54.8%, respectively,
if using AngleNav instead of freehand insertion, with a limited number of operators. AngleNav assisted
the physicians in delivering accurate needle insertion during CT-guided intervention. The device could
potentially reduce the learning curve for physicians to perform CT-guided needle targeting.
Keywords: CT-guided biopsy or ablation, MEMS sensor, Tracker, Angular tracking

112
7.2 Introduction
In conventional needle placement procedures, the physician manually orients the needle to
match the needle’s physical angle with the planned computed tomography (CT) insertion angle. Needle
placement errors can lead to missing the tumor or injury to vital structures. Image guidance for needle
placement procedures, therefore, is highly desirable for improving accuracy.
CT -guided needle placement is one of the most common techniques in interventional
radiology. It is used for many procedures, including biopsy, drainage, and ablation [317-323].
One drawback of CT-guided therapies is ionizing radiation exposure [324, 325]. Cone Beam CT
(CBCT) as an option on a fluoroscopy system is an alternative method for CT guided needle
placement. CBCT integrated with needle guidance systems, and fluoroscopy allows the
physician to see needle locations in real-time, relative to target locations, and surrounding
organs [326, 327].
Needle guidance systems could improve needle puncture procedures by providing more
accurate needle targeting [328-338], reducing needle deflection [339] and the number of total
needle passes [328, 329, 331, 333, 334, 337, 340-343], decreasing radiation exposure [333, 334,
337, 340-343] and procedural time [329, 330, 334, 337, 340-342], reducing the number of needle
repositionings [328, 329, 331, 333, 334, 337, 340-343], and thus decreasing procedural risks
[334-336, 344]. Many commercially available needle guidance systems utilize electromagnetic
tracking [345, 346], optical tracking[347], mechanical tracking [348, 349], and inertial
measurement tracking. Commercially available systems include Philips PercuNav, NeoRad
SimpliCT, amedo-LNS, and CAScination CAS-ONE[350-355]. However, needle guidance
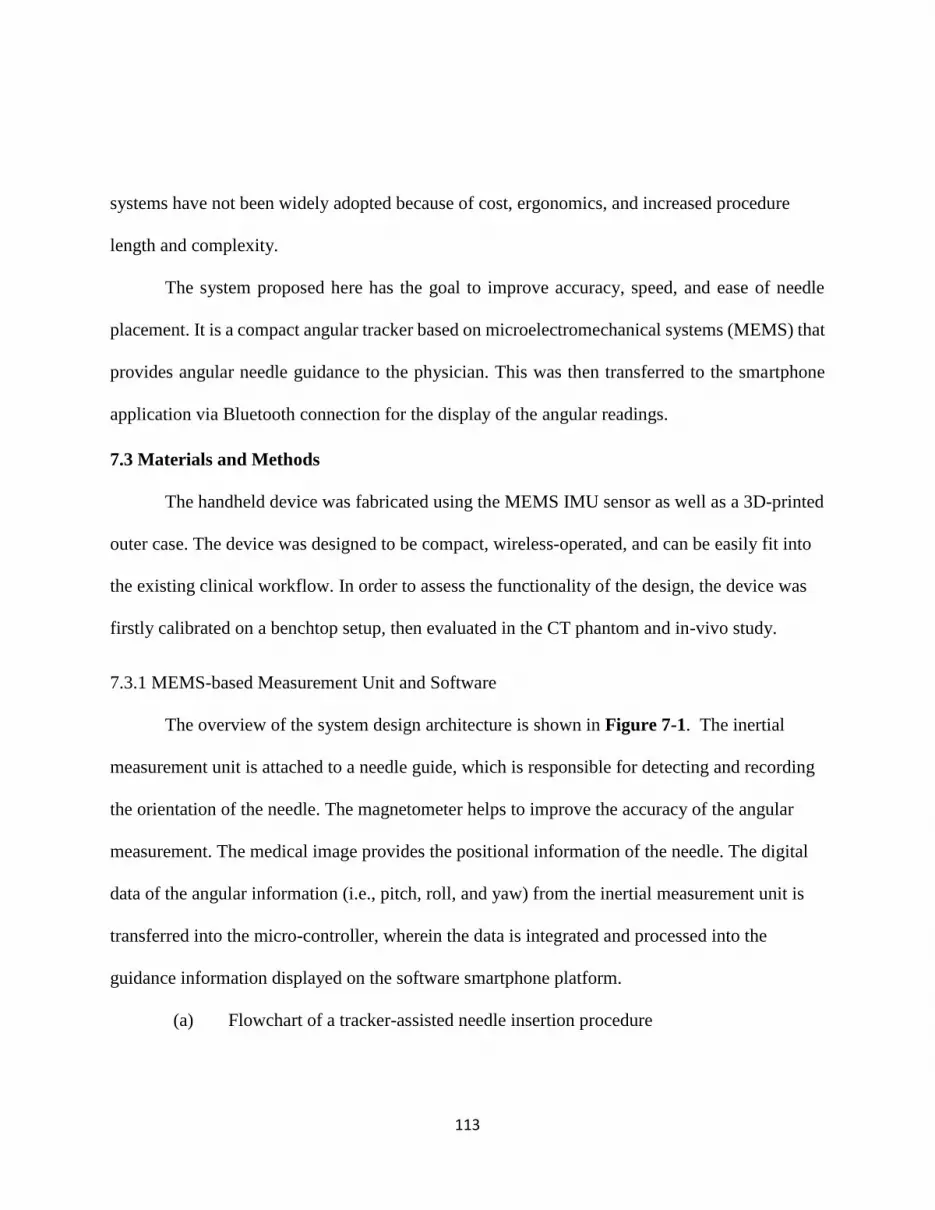
113
systems have not been widely adopted because of cost, ergonomics, and increased procedure
length and complexity.
The system proposed here has the goal to improve accuracy, speed, and ease of needle
placement. It is a compact angular tracker based on microelectromechanical systems (MEMS) that
provides angular needle guidance to the physician. This was then transferred to the smartphone
application via Bluetooth connection for the display of the angular readings.
7.3 Materials and Methods
The handheld device was fabricated using the MEMS IMU sensor as well as a 3D-printed
outer case. The device was designed to be compact, wireless-operated, and can be easily fit into
the existing clinical workflow. In order to assess the functionality of the design, the device was
firstly calibrated on a benchtop setup, then evaluated in the CT phantom and in-vivo study.
7.3.1 MEMS-based Measurement Unit and Software
The overview of the system design architecture is shown in Figure 7-1. The inertial
measurement unit is attached to a needle guide, which is responsible for detecting and recording
the orientation of the needle. The magnetometer helps to improve the accuracy of the angular
measurement. The medical image provides the positional information of the needle. The digital
data of the angular information (i.e., pitch, roll, and yaw) from the inertial measurement unit is
transferred into the micro-controller, wherein the data is integrated and processed into the
guidance information displayed on the software smartphone platform.
(a) Flowchart of a tracker-assisted needle insertion procedure
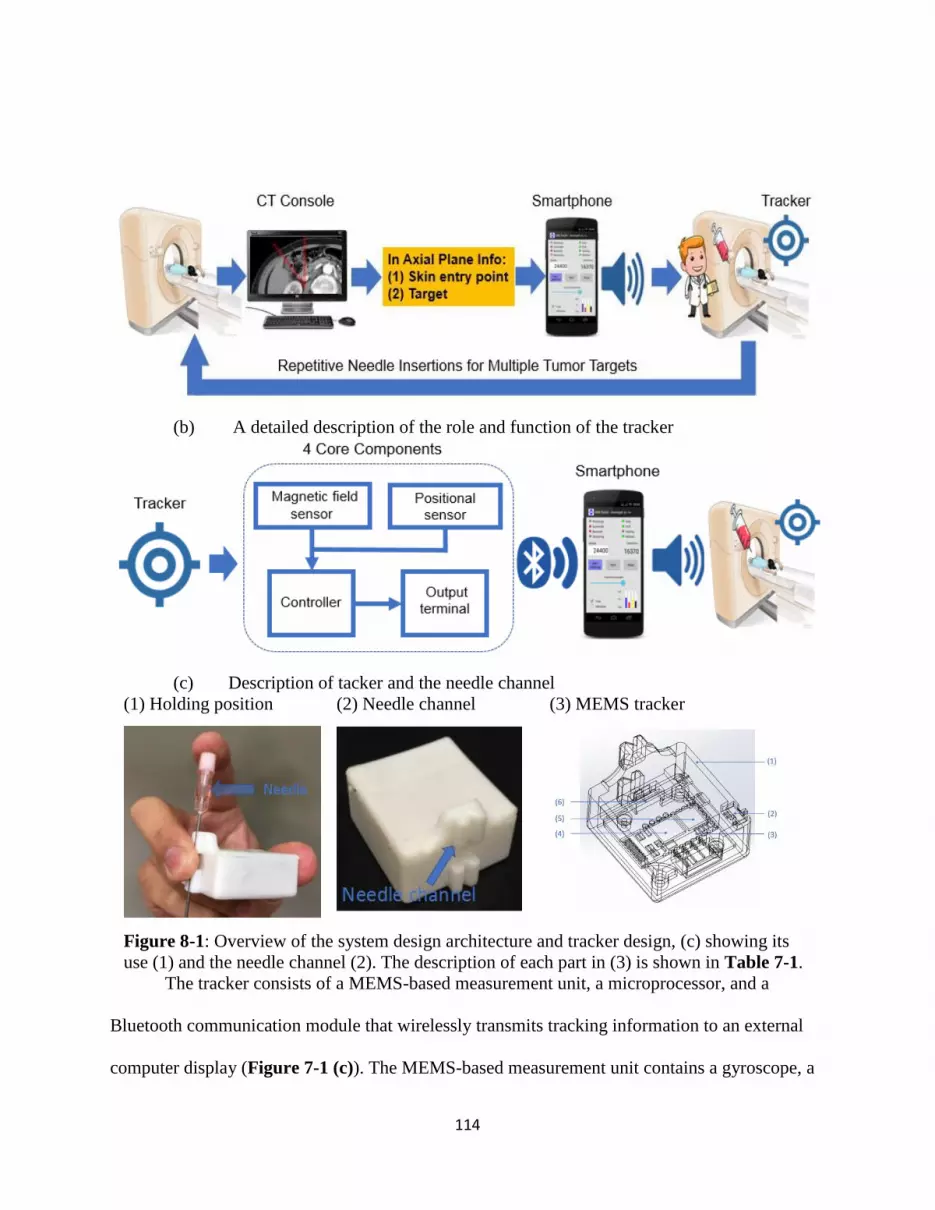
114
(b) A detailed description of the role and function of the tracker
(c) Description of tacker and the needle channel
(1) Holding position (2) Needle channel (3) MEMS tracker
Figure 8-1: Overview of the system design architecture and tracker design, (c) showing its
use (1) and the needle channel (2). The description of each part in (3) is shown in Table 7-1.
The tracker consists of a MEMS-based measurement unit, a microprocessor, and a
Bluetooth communication module that wirelessly transmits tracking information to an external
computer display (Figure 7-1 (c)). The MEMS-based measurement unit contains a gyroscope, a

115
magnetometer sensor, and an accelerometer to provide angular measurements on three axes. The
microprocessor manages data fusion from different sensors, digital signal processing as well as
communications between each part of the tracker. The tracker case was designed in Solidworks®
(Dassault Systèmes, Vélizy-Villacoublay, France) and printed with a Form 2® 3D printer
(Formlabs Inc, Somerville, MA). The case was designed with a needle channel that allows the
needle to be aligned with the tracker. The rechargeable battery in the tracker provides four hours
of continuous use of the tracker after one hour of charging. The tracker case was made to be
disposable but can also be reusable with a sterilization cover bag.
Table 8-1: Specifications of hardware elements shown in Figure 7-1.
Part Description Specifications
(1) Tracker Case Electronics & needle
guide
37 mm (L) x 34 mm (W) x 19.7 mm (H)
(2) Switch Microslide on/off 6.7 mm (L) ×2.9 mm (W) ×1.4 mm (H)
(3) MEMS unit Measure angular,
acceleration &
magnetic info
30 mm(L) ×30 mm (W) ×1mm (H)
Maximum range: Acceleration: ±16 g,
Angular speed measurement: ±2000°/s,
angular measurement: ±180°
Accuracy of angular reading: 0.01°
(4) Bluetooth Communicate to PC or
smartphone
Effective range: 10 m
(5) Microprocessor Digital signal
processing
MPU6050, comprised of triple-axis
MEMS gyroscope and triple-axis MEMS
accelerometer and 9-Axis Motion Fusion
by the on-chip Digital Motion Processor
(6) Battery Lithium battery 4-hour continuous operation, 400 mAh
116
7.3.2 Benchtop Test
The purpose of the benchtop test is to calibrate the needle in a rigid and controlled
environment. A 3D-printed evaluation platform comprised of a series of holes that point at the
center cross, which is situated underneath the arch. The directions of the holes are organized so
that the accuracy of the needle can be evaluated in two dimensions. The three-dimensional X-Y-
Z Cartesian coordinate system is defined in Figure 7-2(b). On the XZ plane, the holes are evenly
distributed so that insertion angles are range from 0°to 180° (Figure 7-2(a)). On the XY plane,
the holes are organized into four sets of rows; the first row is at 0° with respect to the XZ plane,
and the other three are at 10°, 20°, and 30° to the XZ plane respectively.
A digital level was used to adjust the flatness of the platform before the calibration. If the
platform is uneven, the four screws at each corner are used for leveling. During the evaluation
process, the needle was held firmly with the tracker when going through a specific hole with a
corresponding incline angle (e.g., 30°) until it hit the targeting cross. The positional information
of the needle was then sent to a smartphone application to display the angular reading (e.g.,
29.9°). The reading was then compared to the actual inclined angle of the needle, and the
accuracy of the tracker was evaluated. The typical range for acceptable accuracy is ±1°. If the
performance of the tracker is outside this range, the software has a function to calibrate the
tracker to an acceptable level of accuracy. For the benchtop test, 200 insertions were performed
in the 3D-printed evaluation platform. Two statistical analyses were carried out to investigate the
angular accuracy of the needle insertions.
(a) Side view of the
evaluation platform
(b) Top view of the
evaluation platform
(c) Actual review of the
evaluation platform
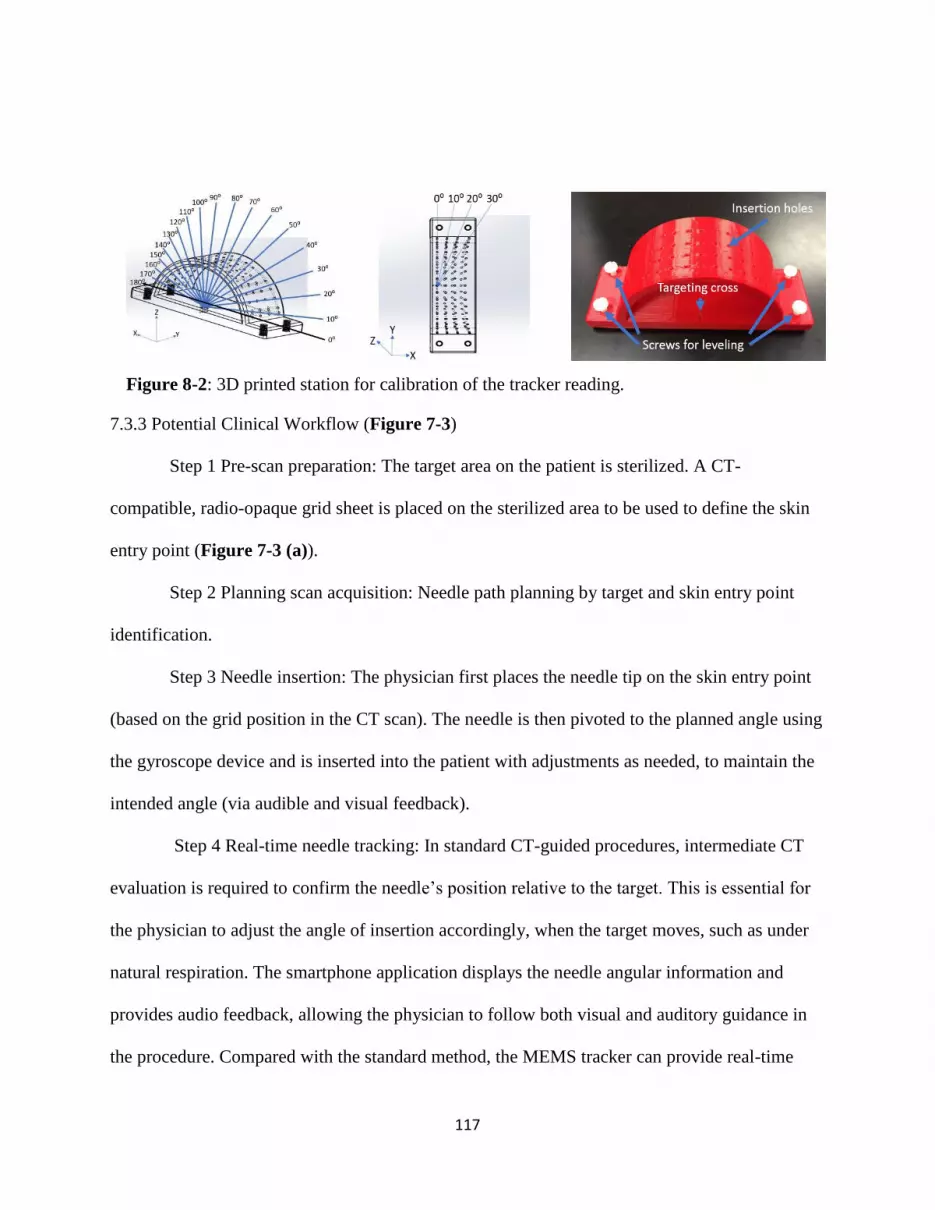
117
7.3.3 Potential Clinical Workflow (Figure 7-3)
Step 1 Pre-scan preparation: The target area on the patient is sterilized. A CT-
compatible, radio-opaque grid sheet is placed on the sterilized area to be used to define the skin
entry point (Figure 7-3 (a)).
Step 2 Planning scan acquisition: Needle path planning by target and skin entry point
identification.
Step 3 Needle insertion: The physician first places the needle tip on the skin entry point
(based on the grid position in the CT scan). The needle is then pivoted to the planned angle using
the gyroscope device and is inserted into the patient with adjustments as needed, to maintain the
intended angle (via audible and visual feedback).
Step 4 Real-time needle tracking: In standard CT-guided procedures, intermediate CT
evaluation is required to confirm the needle’s position relative to the target. This is essential for
the physician to adjust the angle of insertion accordingly, when the target moves, such as under
natural respiration. The smartphone application displays the needle angular information and
provides audio feedback, allowing the physician to follow both visual and auditory guidance in
the procedure. Compared with the standard method, the MEMS tracker can provide real-time
Figure 8-2: 3D printed station for calibration of the tracker reading.

118
measurement of the needle’s orientation, which may greatly shorten procedure time and increase
insertion accuracy.
Step 5: Needle advancement. Step 4 and Step 5 were repeated until the needle tip was
reasonably close to the target. While intermediate and final CT scans are to confirm the position,
the frequency of intermediate scans during needle insertion may be reduced.
Step 6: Biopsy and/or ablation.
Figure 8-3: Comparison between conventional and tracker-assisted CT-guided clinical
workflow. (a) shows the conventional procedure. More intermittent CT scans (steps 3–5, as
shown in the orange arrows) are likely required in this workflow, lengthening the procedure.
Treatments that require multiple needle insertions for multiple targets repeat steps 3–7 (green
arrows). (b) Tracker-assistance shows the alternative method for step 4, in which online
monitoring of needle position provides instant feedback, potentially reducing the number of
confirmatory CT scans for positioning and improving the efficiency of CT in guiding needle
placement.

119
Step 7: Repeated insertions for multiple targets. Steps 3–7 are repeated for more than one
specific target.
In the results section, all the CT images are analyzed and interpreted as the way shown in
Figure 7-4. Moreover, Table 7-2 shows the definition of symbols for the results and discussion
section. The yellow line indicates the planned insertion pathway, and the red line indicates the
actual insertion pathway.
Needle advancement is an iterative process and requires a high level of physician operating
skills. Step 4 is a time-consuming process because the physicians need to confirm the real-time
needle location. The MEMS tracker with software navigation may shorten the operation time by
giving physicians simultaneous and continuous feedback of the relative angle during insertion
from the skin to the target. The MEMS tracker may reduce human errors in needle orientation and
the number of needle path corrections, especially in procedures that require multiple ablations at
Table 8-2: Definitions of symbols
PD: planned insertion depth
AD: actual insertion depth
AE: axial insertion distance error
RE: radial insertion distance error
TTE: tip-to-target insertion distance error
ARE: angular insertion error
Figure 8-4: Interpretation of the CT image. The yellow line shows the planned pathway, and
the red line shows the actual insertion pathway. The blue lines indicate each parameter.

120
different locations. Finally, this method may reduce the number of unnecessary needle re-
insertions by providing accurate needle targeting.
7.3.4 CT Abdominal Phantom
After the tracker passed the benchtop accuracy evaluation, the accuracy and functionality
were further evaluated using an abdominal phantom (CRIS Triple Modality 3D Abdominal
Phantom Model 057A) in a CT scanner (MX8000 IDT 16-Detector CT, Philips, Cleveland, OH)
(Figure 7-5 (a)).
(a) Phantom in the CT scanner (b) CT image of insertion (c) Angular reading
(d) Needle alignment with the laser (e) Needle insertion on a template
Figure 8-5: Comparison of the angular measurement (a) using the phantom, (b) In-axial
plane angle measured by CT compared to (c) the smartphone application’s reading. In (c),
the smartphone displays: (1) X, Y, Z as angles of rotation about the roll, pitch and yaw, (2)
Time function enables the creation of a needle time log/event, (3) Acceleration of the angular
movement, (4) Velocity of the angular movement, (5) Output function logs out the file and
data can be transferable to a computer. The schematic diagram of beeping vs. angle deviation
is shown in (d), and needle alignment and insertion are shown in (e).

121
The CT phantom was made of silicone, and the needle can be easily inserted and held
firmly. In one test, the smartphone application showed an angular reading of 50.03°, while the
CT image shows the needle was positioned at 50.00° (Figure 7-5 (b)). The difference between
these two values was hardly measure-able (~0.03°), and likely within the error of measurements.
In total, there were 25 insertions performed.
7.3.5 In-vivo Study
All procedures were performed under a protocol approved by the Institutional Animal
Care and Use Committee using one healthy castrated male Yorkshire domestic swine (54kg).
The animal was sedated with intramuscular ketamine (25mg/kg), midazolam (0.5mg/kg), and
glycopyrrolate (0.01mg/kg); anesthetized with propofol (1mg/kg IV) and then intubated and
maintained under general anesthesia with isoflurane throughout the procedure. Multiple 1.5mm
stainless steel balls were inserted through a needle under ultrasound imaging guidance to serve as
targets. With the animal on the CT scanner table, a radiopaque grid was placed on the skin of the
upper abdomen over the liver to guide skin entry point selection (Figure 7-5 (e)). After insertion
planning, the laser line acted as a reference for in-plane insertions. The needle was maintained in
the axial plane during insertion. An 18-gauge needle was used by physicians to perform the
insertions, with or without tracking assistance. CT scans were obtained after each insertion for
measurement of accuracy. Following the completion of the study, the animal was euthanized.
7.4 Results
There are three different tests to validate the accuracy of the handheld tracker: benchtop
test, phantom test, and in-vivo study

122
7.4.1 Benchtop Test
A scatterplot shows the slope coefficient between the measured angle and the actual
angle to be 1.0053 and R2 as 0.9999. This defines a strong linear relationship between these two
quantities. Furthermore, the Bland-Altman plot (Figure 7-6 (a)) shows the mean targeting
accuracy of 0.01° with a maximum absolute error of 1.35° and an SD of 0.62°.
(a)Benchtop test
(1) Scatter plot (2) Bland-Altman plot
(b) Abdominal phantom study
(3) Scatter plot (4) Bland-Altman plot
Figure 8-6: Statistical analysis between the measured angle and actual angle. (a) shows the
data analysis on the benchtop test, (b) shows the data analysis on the abdominal phantom
study.
7.4.2 CT Abdominal Phantom Study
Figure 7-6 (b) shows the statistical analysis of all 25 insertions. A scatterplot shows the
slope coefficient between the actual angle and measured angle to be 1.0011 and R2 as 0.9994.

123
This means there is a strong linear relationship between these two quantities. Furthermore, the
Bland-Altman plot shows the mean angular accuracy of 0.86° with a maximum absolute error of
2° and SD of ±1.20°. Based on the analysis of the CT images (Figure 7-7 (I)), the mean tip-to-
target distance error is 4.89 mm, with an SD of ±1.57 mm. Figure 7-7 (I) shows three insertion
examples. The tip-to-target insertion distance errors (TTE) for three insertions are 8.6, 2.2, and
3.1 mm, respectively. The angular insertion errors (ARE) for each of the three insertions are 1.9°,
1.1°, and 1.1°, respectively. Taking the first insertion as an example, quantitative analysis shows
the ARE is 1.9°, the planned insertion depth (PD) is 95.2 mm, and the actual insertion depth
(AD) is 90.0 mm. The tip-to-target distance error is 8.6 mm.
7.4.3 In-vivo Study
At first, the physician followed traditional freehand cognitive guidance, and conducted
insertions on four targets inside the liver, as a single pass. Second, the physician followed the
tracker-assisted clinical workflow and conducted insertions on eight targets inside the liver.
Overall, a mean angular error of 6.6° (SD = ± 1.9°) and a mean tip-to-target distance
error of 8.7 mm (SD = ± 3.1 mm) were achieved for in-plane insertion in 8 liver targets by
tracker-assisted insertions (Figure 7-7 (II)). In comparison, a mean angular error of 18.6° (SD =
± 11.0°) and a mean tip-to-target distance error of 19.3 mm (SD = ± 8.0 mm) was achieved in 4
liver targets by the radiologist’s freehand cognitive guidance (Figure 7-7 (III)).

124
I. CT images of the phantom study
(a) Insertion #1-approaching
target
(b) Insertion #2-approaching
target
(c) Insertion #3-approaching
target
(d) Insertion #1-needle
advances towards target
(e) Insertion #2- needle
advances towards target
(f) Insertion #3- needle
advances towards target
II. Tracker-assisted needle insertion
(h) Insertion #1: (i) Insertion #2: (j) Insertion #3:
III. Cognitive guided freehand needle insertion
(k) Insertion #1: (l) Insertion #2: (m) Insertion #3:
Figure 8-7: (I) shows three examples of needle insertions performed in the phantom: (a), (b),
and (c) show relative positions of needles with respect to the target; (d), (e), and (f) are the
quantitative analysis of needle trajectories. (II) and (III) shows the results from the tracker-
assisted and cognitive guided freehand needle insertion, respectively. The yellow lines show
the planned needle trajectory, and the red lines show the actual insertion pathway. The yellow
squares show the position of the target, and the red circles show the position of the needle tip.

125
The mean angular insertion error (ARE) and tip-to-target distance insertion error (TTE)
were reduced by 64.4% and 54.8% during CT-guided needle procedures (Table 7-3).
Table 8-3: Statistical analysis between two insertion methods
Angular Error (degree)
Insertion methods Mean ARE
(degree)
Maximum ARE
(degree)
The standard
deviation of ARE
MEMS tracker (a) 6.6 9.4 1.9
Free hand cognitive guidance (b) 18.6 34.8 11.0
Improvement (1-a/b) (%) 64.4 73.0 83.2
Tip-to-Target Distance Error (mm)
Insertion methods Mean TTE
(mm)
Maximum TTE
(mm)
The standard
deviation of TTE
MEMS tracker (a) 8.7 14.4 3.1
Free hand cognitive guidance (b) 19.3 29.0 8.0
Improvement (1- a/b) (%) 54.8 50.3 61.2
Figure 7-8 (a) shows all eight tracker-assisted insertions. In (a), (1) shows the average
planned insertion distance (PD) is 67.3 mm, which is only 1.5mm longer than the actual insertion
distance (AD). (3) and (4) shows the tip-to-target insertion distance error (TTE), as well as the
angular insertion error (ARE), varies in a range that is consistent with the numbers in Table 7-3.
On the right-hand side of each image, the six parameters are displayed: PD, AD, RE, AE,
TTE, and ARE.

126
7.5 Discussion
The CT abdominal phantom experiment showed a mean angular error of 0.87° (SD = ±
1.19°) while the in vivo experiment showed a mean angular error of 6.60° (SD = ± 1.9°). The
errors could be attributed to the tissue deformation, respiration motion, and human deployment
error.
a. Error analysis of tracker-assisted insertions in the in vivo study
(1) Comparison between PD and AD
(2) Comparison between AE and RE
(3) Trend of TTE (4) Trend of ARE
b. Comparison between the tracker-assisted and freehand procedures
Figure 8-8: In (a), (1) shows the comparison between the PD and AD; (2) shows the
comparison between the AE and RE; (3–4) show the trends of TTE and ARE. (b) shows the
comparison of ARE and TTE between the tracker-assisted and freehand procedures.

127
However, tissue could be deformed during insertions in both phantom study and in-vivo
study. After the needle was released, tissue resistance often changed the angle of the needle,
resulting in much larger errors in validation CT scans. In addition, the respiration motion of the
swine could cause difficulty in reaching the target. Also, with audible feedback, more attention
may have been paid to keeping the needle steadily in the same plane, which might over-
emphasize the improvement seen. In the animal experiment, insertions showed a mean angular
error of 6.60° (SD = ± 1.9°) compared to a mean angular error of 18.6° (SD = ± 11.0°) by the
radiologist’s freehand insertions.
7.5.1 Comparison With Other Navigation Systems Designed for CT-Guided Interventions
In the field of CT-guided interventions, a variety of methods have been applied to improve
the accuracy of the conventional freehand needle insertion. Some research has been conducted
with robotic systems—for example, Mbalisike et al. proposed a novel robotic guidance system for
microwave thermoablation.[356]. The study claimed that the smallest tip deviation from the target
tumor was 5.3 mm. Meanwhile, the tip-to-target errors shown by other groups such as Dou et
al.[357] (1.5 ± 1.7 mm), Kettenbach et al.[358] (2.3 ± 0.8 mm), and Martinez et al.[359] (1.8±1.1
mm) are smaller than our current system. However, the downside of these robotic systems is cost,
complexity, workflow, and the need for repetitive needle adjustments. Moreover, these robotic
systems require a lengthy registration process as well as extensive operator and staff training.
Leschka et al.[360] reported that a Cone Beam CT (CBCT)-guided procedure achieved a
mean tip-to-target distance error of 2.8 mm. Another study conducted by Schulz et al.[361] had a
tip-to-target error, which was less than 4.5 mm. The accuracy of those studies is comparable to our
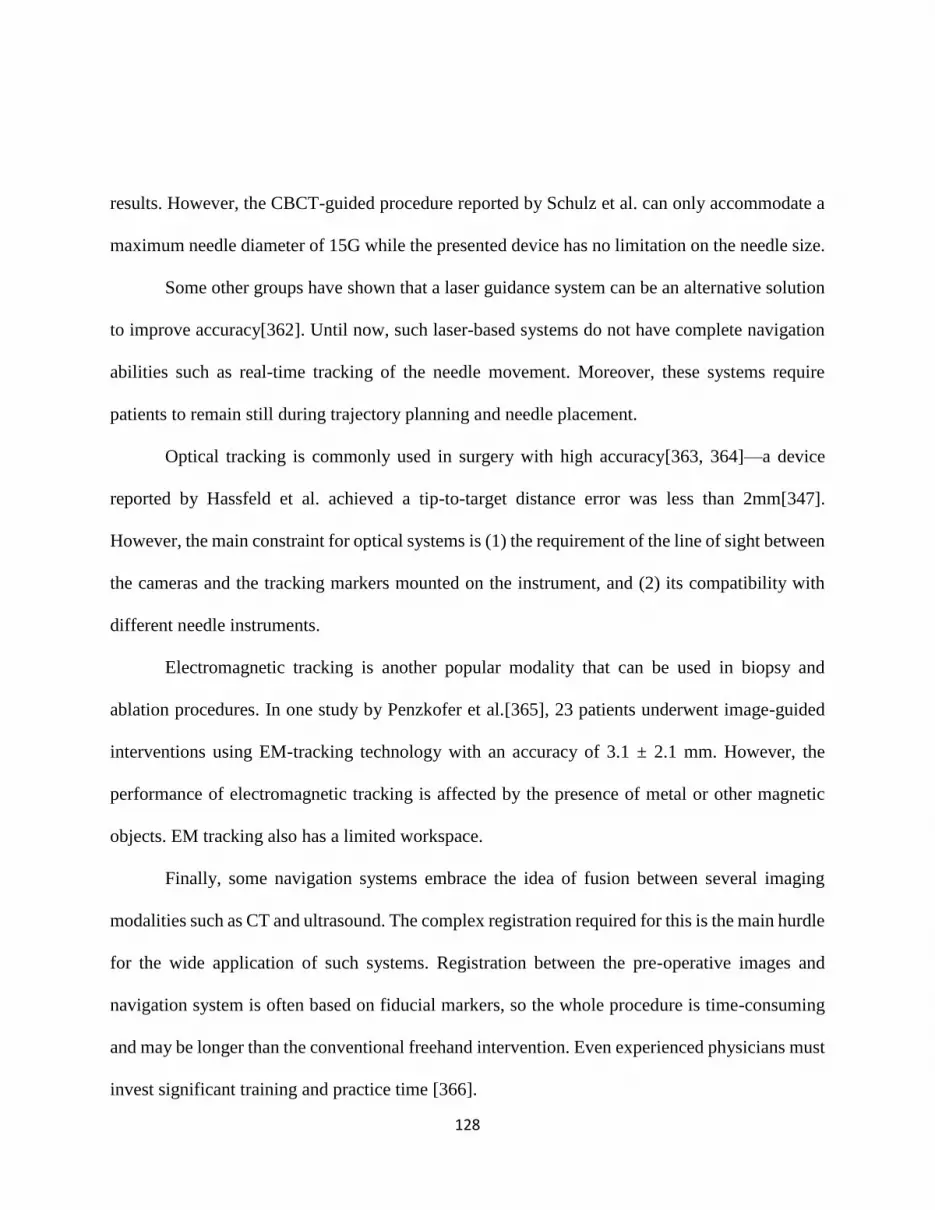
128
results. However, the CBCT-guided procedure reported by Schulz et al. can only accommodate a
maximum needle diameter of 15G while the presented device has no limitation on the needle size.
Some other groups have shown that a laser guidance system can be an alternative solution
to improve accuracy[362]. Until now, such laser-based systems do not have complete navigation
abilities such as real-time tracking of the needle movement. Moreover, these systems require
patients to remain still during trajectory planning and needle placement.
Optical tracking is commonly used in surgery with high accuracy[363, 364]—a device
reported by Hassfeld et al. achieved a tip-to-target distance error was less than 2mm[347].
However, the main constraint for optical systems is (1) the requirement of the line of sight between
the cameras and the tracking markers mounted on the instrument, and (2) its compatibility with
different needle instruments.
Electromagnetic tracking is another popular modality that can be used in biopsy and
ablation procedures. In one study by Penzkofer et al.[365], 23 patients underwent image-guided
interventions using EM-tracking technology with an accuracy of 3.1 ± 2.1 mm. However, the
performance of electromagnetic tracking is affected by the presence of metal or other magnetic
objects. EM tracking also has a limited workspace.
Finally, some navigation systems embrace the idea of fusion between several imaging
modalities such as CT and ultrasound. The complex registration required for this is the main hurdle
for the wide application of such systems. Registration between the pre-operative images and
navigation system is often based on fiducial markers, so the whole procedure is time-consuming
and may be longer than the conventional freehand intervention. Even experienced physicians must
invest significant training and practice time [366].

129
7.6 Summary
Overall, a mean angular error of 6.6° (SD = ± 1.9°) and a mean tip-to-target distance
error of 8.7 mm (SD = ± 3.1 mm) were achieved for in-plane insertion in 8 liver targets in a live
swine by tracker-assisted insertions. The accuracy of angular insertion was improved by
approximately 64.4%, and the accuracy of tip-to-target insertion distance was improved by
54.8%, compared to freehand cognitive guidance. The tracker-assisted CT-guided procedure
provided real-time needle tracking and hence may reduce the number of intermediate scans for
needle path confirmations.

130
8. CHAPTER 8
A HUMAN STUDY OF LOW-COST, SMARTPHONE-BASED AND MEMS IMU-
ENABLED BODY TRACKER6
6 Li, R., Jumet, B., Ren, H.L., Song, W.Z., and Tse, Z.T.H. Accepted by Proceedings of the IMechE, Part H: Journal
of Engineering in Medicine.
Reprinted here with permission of publisher.

131
8.1 Abstract
The recent advancement of motion-tracking technology offers better treatment tools for
conditions such as movement disorders as the outcome of the rehabilitation could be
quantitatively defined. The accurate and fast angular information output of the inertial
measurement unit (IMU) tracking systems enables the collection of accurate kinematic data for
clinical assessment. This paper presents a study of a low-cost micro-electro-mechanical system
(MEMS) IMU-based tracking system in comparison with the conventional optical tracking
system (OTS). The system consists of seven MEMS IMUs, which could be mounted on the
lower limbs of the subjects. For the feasibility test, ten human participants were instructed to
perform three different motions: walking, running, and fencing lunging when wearing specially
designed sleeves. The subjects’ lower body movements were tracked using our IMU-based
system and compared with the gold standard—the NDI Polaris Vega optical tracking system®
(NDI). The results of the angular comparison between IMU and NDI were as follows: the
average cross-correlation value was 0.85, the mean difference of joint angles was 2.00°, and the
standard deviation of joint angles was ± 2.65°. The developed MEMS-based tracking system
provides an alternative low-cost solution to track joint movement. Moreover, it is able to operate
on an Android platform and could potentially be used to assist outdoor or home-based
rehabilitation.
Keywords: Body movement, Wireless sensors, Optical tracking, Joint angles
8.2 Introduction
Movement disorders are characterized as either impaired voluntary movement or the
presence of involuntary movement. Typical movement disorders are Friedreich's Ataxia [130],

132
Dystonia [367], Huntington’s disease [132], cerebral palsy and Parkinson’s disease[133, 134].
Parkinson’s disease, for example, affects up to 1 million people in the US, and there are 60,000
new cases diagnosed annually [368].
Rehabilitation of movement disorders usually consists of activity-dependent and goal-
directed training, where patients repeatedly move their limbs to produce functional patterns. In
many cases, the patient may be incapable of completing these movements unassisted, particularly
in the early stage of recovery after injury. Therapists support and move the limbs during these
exercises, and regularly adjust the amount of assistance according to the needs of the patient. In
recent years, robotics rehabilitation devices have been proposed as a means to complement
therapists’ activities [148-151]. Alternatively, in this paper, a smartphone-based
microelectromechanical systems (MEMS) tracking device was developed, which is easy-to-
operate and easy-to-follow and specifically designed to facilitate a better recovery procedure. This
device may not only improve conventional therapy, but it may also allow the patients to carry out
more challenging and effective outdoor recovery exercises. Furthermore, the device may improve
the training of older or younger individuals, such as children, because it is operational in both the
home and outdoors. The future plan is to further develop the device and use it for interactive
training in populations with medical conditions.
Motion tracking has received extensive attention since the 1990s [369-372]. Several
techniques allow for motion reconstruction based on different information sources. As one of its
primary applications, motion tracking has been used for monitoring rehabilitation progress of
movement disorders [373]. Movement disorders refer to a group of conditions that are related to
the nervous system and cause unusual body movements. Common movement disorders include

133
Huntington’s disease [374] and Parkinson’s disease [375, 376]. As an example, Parkinson’s
disease is a chronic neurodegenerative disorder that has affected 1 million people in the US and 5
million people worldwide [377]. There is a specific type of rehabilitation, called
neurorehabilitation, aimed at treating conditions such as movement disorders, where patients
repetitively move their limbs so that functional patterns can be produced. The motion tracking
could provide feedback to the patients as well as the therapist in real-time.
One of the biggest challenges in motion tracking is to obtain an accurate estimation with
non-invasive sensors within a confined workspace. A mainstream solution is to use the optical
tracking system (OTS). The NDI Polaris Vega® system, for example, delivers a tracking
accuracy of 0.12 mm Root Mean Square (RMS) and a 95% confidence interval accuracy to 0.2
mm at a measurement rate of 60–250 Hz. The main disadvantage of the OTS is the requirement
for a clear line-of-sight between the patient, the instrument trackers, and the optical cameras.
Recently, a type of inertial measurement unit (IMU) called micro-electro-mechanical
systems (MEMS) IMUs has given a new surge to motion tracking research [137-140]. These
systems are cost-effective for providing accurate, non-invasive, and portable motion
measurements. The primary point of interest in these systems is that they can overcome the
limitations of optical systems and mechanical trackers. In one of the early studies, Ren et al. used
raw data from a class of miniaturized IMU—integrated system of the magnetic field, angular
rate, and gravity (MARG) to estimate the orientation of a surgical instrument, this again
demonstrated the IMU’s ability to track movement [378].
Much research work has been published based on motion tracking using different types of
IMUs, such as Xsens [379], Opal [380], and Noraxon [381]. In the area of joint movement,
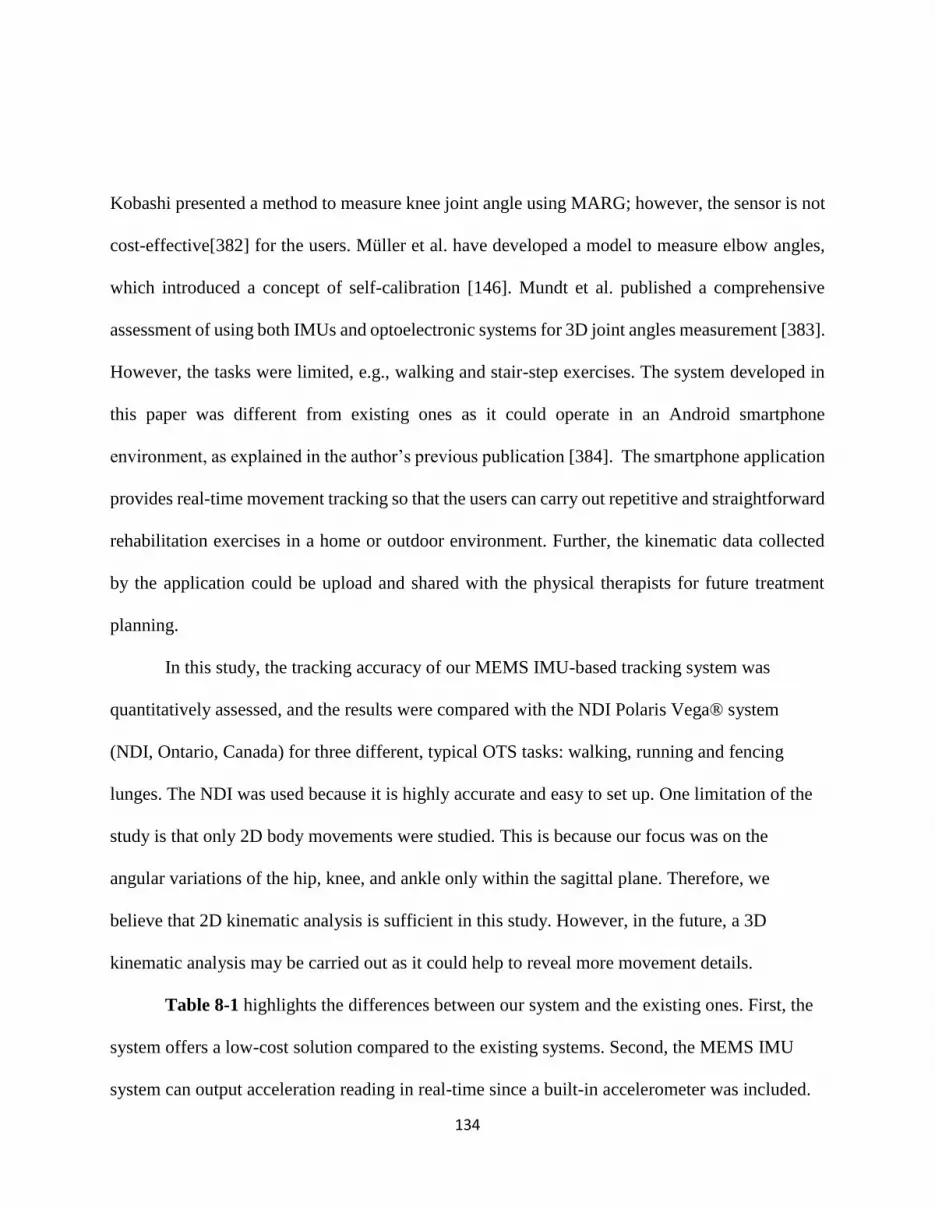
134
Kobashi presented a method to measure knee joint angle using MARG; however, the sensor is not
cost-effective[382] for the users. Müller et al. have developed a model to measure elbow angles,
which introduced a concept of self-calibration [146]. Mundt et al. published a comprehensive
assessment of using both IMUs and optoelectronic systems for 3D joint angles measurement [383].
However, the tasks were limited, e.g., walking and stair-step exercises. The system developed in
this paper was different from existing ones as it could operate in an Android smartphone
environment, as explained in the author’s previous publication [384]. The smartphone application
provides real-time movement tracking so that the users can carry out repetitive and straightforward
rehabilitation exercises in a home or outdoor environment. Further, the kinematic data collected
by the application could be upload and shared with the physical therapists for future treatment
planning.
In this study, the tracking accuracy of our MEMS IMU-based tracking system was
quantitatively assessed, and the results were compared with the NDI Polaris Vega® system
(NDI, Ontario, Canada) for three different, typical OTS tasks: walking, running and fencing
lunges. The NDI was used because it is highly accurate and easy to set up. One limitation of the
study is that only 2D body movements were studied. This is because our focus was on the
angular variations of the hip, knee, and ankle only within the sagittal plane. Therefore, we
believe that 2D kinematic analysis is sufficient in this study. However, in the future, a 3D
kinematic analysis may be carried out as it could help to reveal more movement details.
Table 8-1 highlights the differences between our system and the existing ones. First, the
system offers a low-cost solution compared to the existing systems. Second, the MEMS IMU
system can output acceleration reading in real-time since a built-in accelerometer was included.

135
In contrast, the systems like the OTS can only calculate acceleration based on the trajectories of
reflective markers. With the acceleration information, the users would benefit from knowing how
fast they can perform an exercise. Moreover, the MEMS IMU system was wireless and wearable
by the test subject, providing a high degree of flexibility required for exercise, whereas the OTS
has field-of-view and line-of-sight problems. When using the OTS, tracking errors or phantom
points are generated when the reflective markers are blocked or not positioned correctly.
However, some limitations of MEMS IMU systems are that the IMU can suffer from drift
due to instrumentation biases, and more affordable IMUs are prone to noisy data and a lack of
precision relative to other tracking systems.
Table 9-1: Comparison of functionality between our system and existing ones
Robotics
system
VR
rehabilitation
OTS system Our system
Low-cost
solution?
No,
price range:
$18,000-
40,000[385,
386]
No,
price range:
$1,400—
2,000[387,
388]
No,
price range (passive
system):
$150,000—
250,000[389]
Yes,
the IMU modules
cost $280, 3D
printing material
$10, Flexible bands
$20. The total cost is
$ 310.
Easy-to-use? No Yes No Yes
Outdoor use? No No No Yes
Exercise
range
limitation?
No Yes, near a
station
(desktop,
laptop)[390]
Yes, within the
coverage area of the
camera system,
NDI tracking range:
2400 mm[391]
No
Portable? No No No Yes
Data logging? Yes Yes Yes Yes
Data Sharing? No No No Yes
Acceleration
info?
No No No Yes
136
8.3 Materials and Methods
The purpose of this study was to develop a new MEMS IMU-based angular tracking
system that could be integrated with an Android platform to monitor human movement. Three
main design criteria were addressed in this study. The first criterion was the orientation of the
IMU. Since the IMUs commonly have a drift problem on the yaw angles, the orientation of the
IMU was set to be vertical. Therefore, the reading of yaw angles from the Z-axis did not need to
be used as the experiment consisted of two-dimensional motion analysis. The pitch and roll
angles were calibrated with the gravity vector, and therefore drifting was not an issue. The
second criterion was the mounting method and the positioning of the IMU. During the jogging
and fencing lunge exercises, the IMU module could be easily detached from the body. The
solution was to use a stretchable waist, thigh, and foot sleeves with the IMU sensors sewn on the
surface. With this design, not only could the sensors be mounted more securely and adequately
on the designated position, but less time was required for test preparation.
Additionally, the sleeves were more comfortable and were able to fit many different body
types with no adjustment. This proper fitting also disallowed significant relative movement of
the components during and in between exercises. The final criterion was the derivation of joint
angles from the IMU data. As mentioned for the NDI, the pivot point was defined as the
intersection between two straight lines projected from the two longitudinal markers on each
sleeve, and each straight line was defined by the physical position of the IMU sensors as the
markers were placed equidistant from the IMU. By positioning the IMU in the middle of the two
markers, this allowed for the NDI and IMU local coordinate systems of each limb segment to
have similar origins to facilitate data analysis after the experiment better.

137
8.3.1 Tracking Device
The system was designed to track lower limb posture with seven mountable IMU sensors.
Each sensor outputs the movement angle of different parts of the leg. A therapist may evaluate
the performance of the patient based on the recorded angular data. The specifications of the
tracking system are shown in Table 8-2.
Table 9-2: Head-to-head comparison between the IMU and NDI optical tracking system
Specification of the IMU system NDI Polaris Vega
Dimensions For individual sensors: 37 mm (L) × 34
mm (W) × 19.7 mm (H)
591 mm (L) × 103 mm (W) ×
106 mm (H)
Components Switch
12 mm (L) × 2.9 mm (W) × 1.4 mm (H)
Near-infrared (IR) light
Acceleration: ±16 g
Angular speed measurement: ±2000°/s
Angular measurement: ±180°
Accuracy of angular reading: 0.01°
Sampling rate: 50 Hz
IR sensor, sampling rate: 60 Hz
Communicate to smartphone
Valid range: 10 m
Reflective markers
Figure 8-1 (a) shows the tracking system, which consists three different parts, the waist
wear, the knee wear and the foot wear. Figure 8-1 (b) shows the mounting locations of the
sensors.

138
(a) Tracking system (b) Mounting instruction
Figure 9-1: (a) shows the overview of the tracking system with reflective markers, and (b)
suggested mounting locations on the hip, knees, and ankles of end-users. The IMU modules
were placed on the outer surface of the hip, knees, and ankles.
Figure 8-2 (a) shows the IMU sensor’s internal components: a gyroscope, an
accelerometer, a microprocessor, a battery, a Bluetooth module, and a switch. All the
components were placed in a 3D-printed case. Figure 8-2 (b) shows the coordinate system of the
MEMS IMU sensor. Figure 8-2 (c) shows the experimental set up for human trials. The blue
lines on the floor is the exercise distance, and the MEMS IMU sensor was mounted on human
participants. The NDI optical tracking system was placed at a detectable range to the
participants.

139
(a) The inner structure (b) The coordinate
system
(c) Experimental setup
Figure 9-2: (a) shows the interior structure of the IMU sensor, which has a gyroscope, an
accelerometer, a microprocessor, a battery, a Bluetooth module, and a switch. All the
components were placed in a 3D-printed case, (b) shows the coordinate system of the IMU
sensor, (c) shows the experimental set up for human trials. The blue lines on the floor are the
measuring distance, and the IMU sensor was mounted on human participants using flexible
bands. The NDI equipment was set on the table at a detectable distance to the participants. The
control console was placed nearby for data recording.
8.3.2 Android System Application Design
The smartphone application was developed in the App inventor® (MIT, Cambridge,
MA), which can provide real-time angle tracking when the sensor is in connection with the
smartphone via Bluetooth. Moreover, the application is able to process the angular data and then
translate into physical positional data, which can be displayed on the smartphone screen (Figure
8-3).
Figure 9-3: Smartphone interface

140
8.3.3 Application of NDI System
The experiment was set at a distance of 1.5 m from the NDI, and the walking distance
was set at 2 m in order for markers to remain in the detectable range. NDI claims to have a
volumetric accuracy of 0.12 mm RMS. However, three main challenges when using the NDI are
the blockage of optical markers during exercise, the alignment between the optical markers, and
the positioning of optical markers relating to the IMU sensors and tracking range of NDI.
Additionally, the position of the NDI optical markers and IMU sensors for each wearable sleeve
had to be on the same plane and centerline so that there would be the same pivot point for the
calculation of angles. The calculations use a two-line angle determination as opposed to a three-
vertex angle determination (Figure 8-4). Each limb segment had a sleeve where the IMU was
sewn into place following the longitudinal axis of the pertinent segment. Two NDI markers were
placed around each IMU, one superior and one inferior to the IMU along the same longitudinal
axis (Figure 8-2 (b)). The two markers would then be able to be two points on a line that
imitated the segment’s position and motion. This line could then be analyzed relative to other
limb segment lines for determining the angle between two segments and, thus, the joint angle.
This allowed us to disregard the interpreted position of the joint determined by the NDI that
would have resulted from placing one marker per segment with a median marker placed on each
joint. This was preferred because joints are complex anatomical objects that do not move as
consistently as limb segments due to the internal structure, causing the outer skin to move and
stretch in all directions, which would make joint angle calculations less accurate.
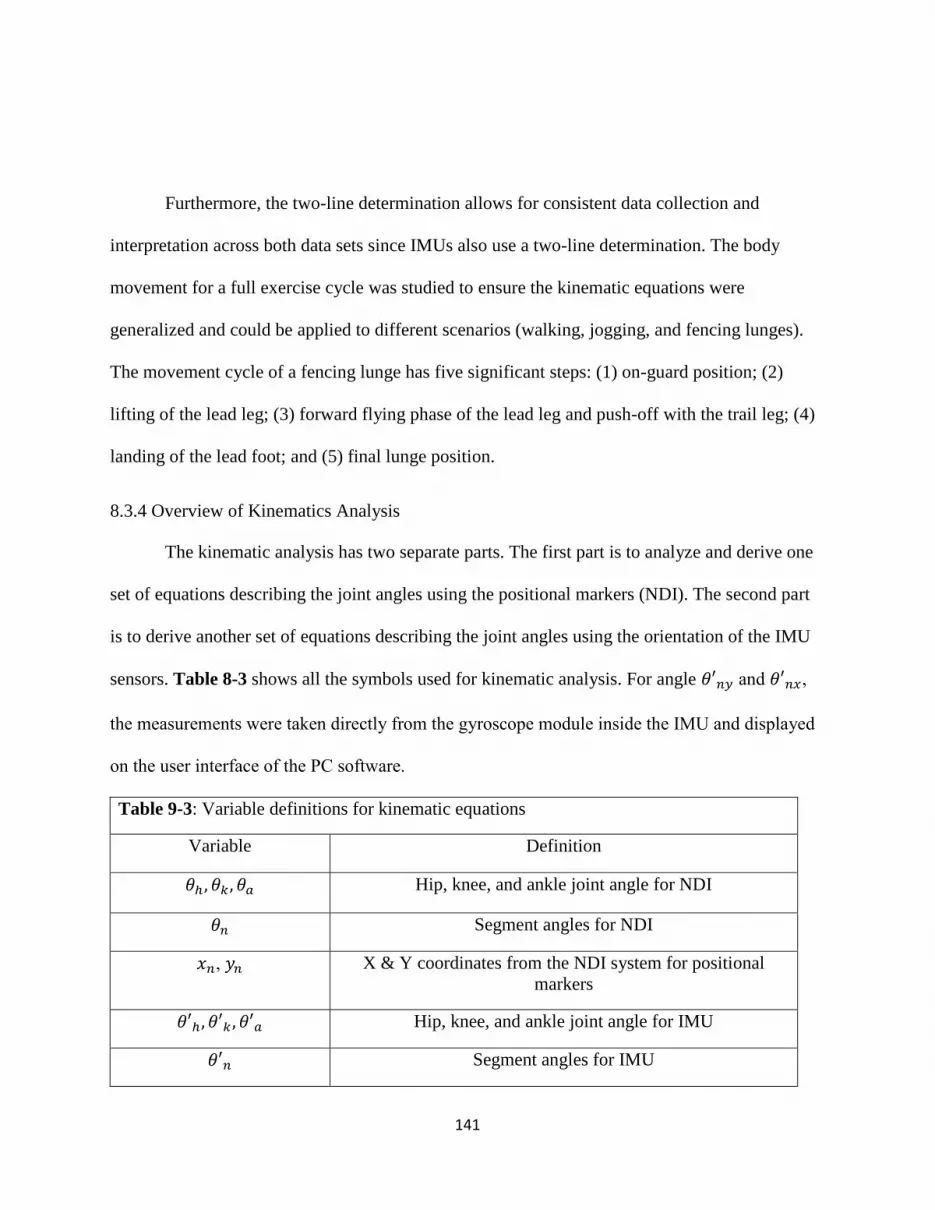
141
Furthermore, the two-line determination allows for consistent data collection and
interpretation across both data sets since IMUs also use a two-line determination. The body
movement for a full exercise cycle was studied to ensure the kinematic equations were
generalized and could be applied to different scenarios (walking, jogging, and fencing lunges).
The movement cycle of a fencing lunge has five significant steps: (1) on-guard position; (2)
lifting of the lead leg; (3) forward flying phase of the lead leg and push-off with the trail leg; (4)
landing of the lead foot; and (5) final lunge position.
8.3.4 Overview of Kinematics Analysis
The kinematic analysis has two separate parts. The first part is to analyze and derive one
set of equations describing the joint angles using the positional markers (NDI). The second part
is to derive another set of equations describing the joint angles using the orientation of the IMU
sensors. Table 8-3 shows all the symbols used for kinematic analysis. For angle 𝜃′𝑛𝑦 and 𝜃′𝑛𝑥,
the measurements were taken directly from the gyroscope module inside the IMU and displayed
on the user interface of the PC software.
Table 9-3: Variable definitions for kinematic equations
Variable Definition
𝜃ℎ , 𝜃𝑘 , 𝜃𝑎 Hip, knee, and ankle joint angle for NDI
𝜃𝑛 Segment angles for NDI
𝑥𝑛, 𝑦𝑛 X & Y coordinates from the NDI system for positional
markers
𝜃′ℎ, 𝜃′𝑘 , 𝜃′𝑎 Hip, knee, and ankle joint angle for IMU
𝜃′𝑛 Segment angles for IMU

142
𝜃′𝑛𝑦, 𝜃′𝑛𝑥 Angular readings of pitch and roll from IMU
8.3.5 Kinematics Analysis for NDI System
Figure 8-4 shows the detailed kinematics analysis for the NDI system; the optical markers
have been placed on the waist, thigh, and leg sections of the human body. Three segments were
used to construct the model: waist, knee, and ankle (Figure 8-4 (b)—(c)). The hip segment was
defined as the joint region between the waist and thigh sections of the human body. The knee
segment was defined as the joint region between the thigh and leg sections of the human body; the
ankle segment was defined as the joint region between the thigh and foot sections of the human
body.
(a) Overall kinematics (b) Hip -NDI (c) Knee -NDI (d) Ankle -NDI
Figure 9-4: (a) shows NDI lower-limb kinematic analysis and NDI segmented kinematics
analysis for each NDI marker on the (b) hip, (c) knee, and (d) ankle. Each segment was
defined based on the joint region between the waist and the thigh, the thigh and the leg, the
leg and the foot, respectively.
Equations 1–9 show how to calculate the hip, knee, and ankle angles based on the two pairs of
reflective markers (Table 8-4).

143
Table 9-4: Motion analysis using NDI optical tracking system
(a)Kinematic analysis for the hip section
(1)
(2)
(3)
(b)Kinematic analysis for the knee section
(4)
(5)
𝜃𝑘 = 180° − 𝜃4 + 𝜃6 (6)
(c)Kinematic analysis for the ankle section
(7)
𝜃8 = 𝜃7 = {
90° + atan (𝑥7 − 𝑥8
𝑦7 − 𝑦8) , atan (
𝑥7 − 𝑥8
𝑦7 − 𝑦8) < 0
−90° + atan (𝑥7 − 𝑥8
𝑦7 − 𝑦8) , atan (
𝑥7 − 𝑥8
𝑦7 − 𝑦8) ≥ 0
(8)
𝜃𝑎 = 90° + 𝜃6 − 𝜃8 (9)
8.3.6 Kinematics Analysis for MEMS IMU-based Angular Tracking System
Figure 8-5 shows the detailed kinematics analysis for the IMU system.
𝜃6 = 𝜃5 = atan (𝑥5 − 𝑥6
𝑦5 − 𝑦6)
𝜃2 = atan (𝑥3 − 𝑥4
𝑦3 − 𝑦4)
𝜃1 = atan (𝑥1 − 𝑥2
𝑦1 − 𝑦2)
𝜃ℎ = 180° − 𝜃1 − 𝜃2
𝜃4 = 𝜃3 = atan (𝑥3 − 𝑥4
𝑦3 − 𝑦4)
𝜃6 = 𝜃5 = atan (𝑥5 − 𝑥6
𝑦6 − 𝑦5)
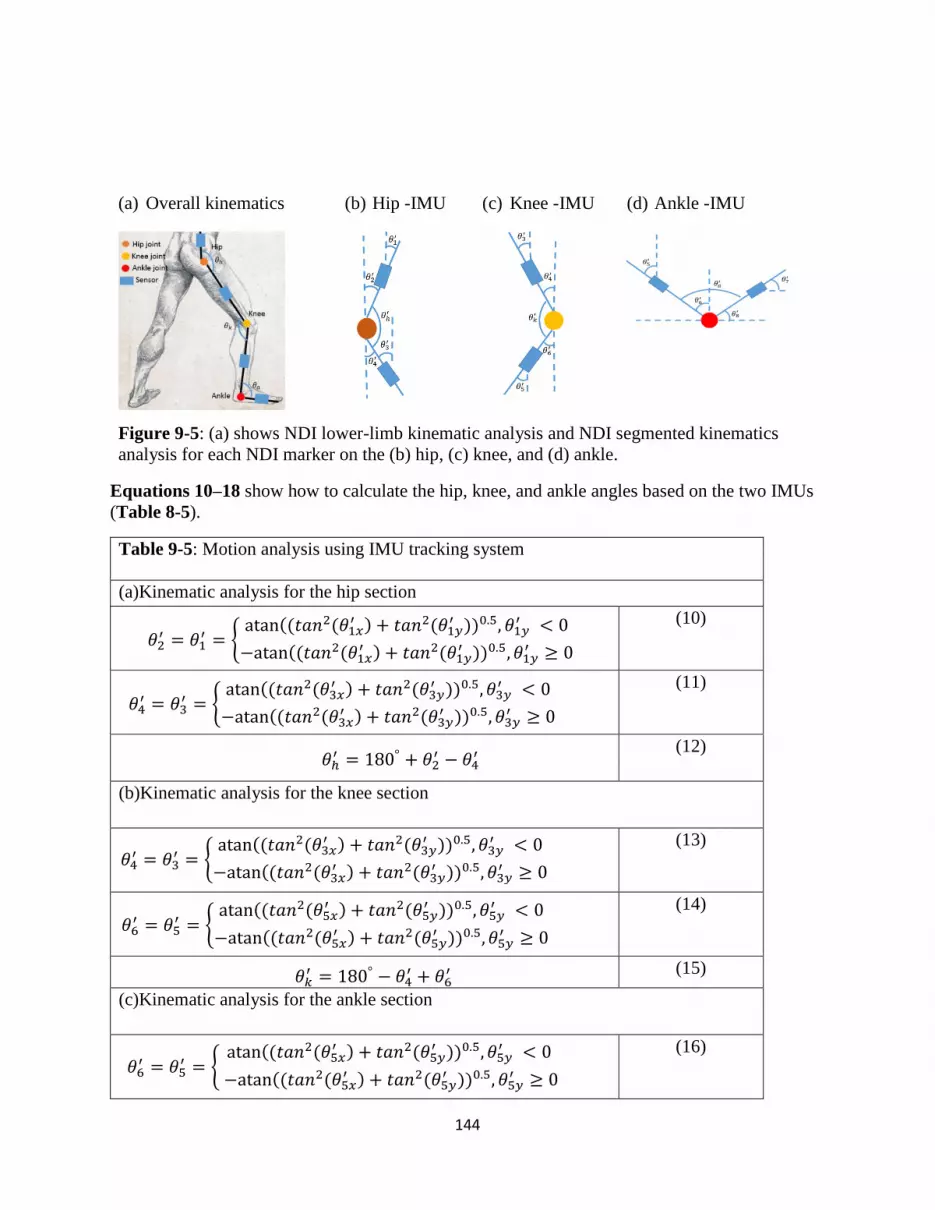
144
𝜃2′ = 𝜃1
′ = {atan ((𝑡𝑎𝑛2(𝜃1𝑥
′ ) + 𝑡𝑎𝑛2(𝜃1𝑦′ ))0.5, 𝜃1𝑦
′ < 0
−atan ((𝑡𝑎𝑛2(𝜃1𝑥′ ) + 𝑡𝑎𝑛2(𝜃1𝑦
′ ))0.5, 𝜃1𝑦′ ≥ 0
𝜃ℎ′ = 180° + 𝜃2
′ − 𝜃4′
𝜃4′ = 𝜃3
′ = {atan ((𝑡𝑎𝑛2(𝜃3𝑥
′ ) + 𝑡𝑎𝑛2(𝜃3𝑦′ ))0.5, 𝜃3𝑦
′ < 0
−atan ((𝑡𝑎𝑛2(𝜃3𝑥′ ) + 𝑡𝑎𝑛2(𝜃3𝑦
′ ))0.5, 𝜃3𝑦′ ≥ 0
𝜃6′ = 𝜃5
′ = {atan ((𝑡𝑎𝑛2(𝜃5𝑥
′ ) + 𝑡𝑎𝑛2(𝜃5𝑦′ ))0.5, 𝜃5𝑦
′ < 0
−atan ((𝑡𝑎𝑛2(𝜃5𝑥′ ) + 𝑡𝑎𝑛2(𝜃5𝑦
′ ))0.5, 𝜃5𝑦′ ≥ 0
𝜃4′ = 𝜃3
′ = {atan ((𝑡𝑎𝑛2(𝜃3𝑥
′ ) + 𝑡𝑎𝑛2(𝜃3𝑦′ ))0.5, 𝜃3𝑦
′ < 0
−atan ((𝑡𝑎𝑛2(𝜃3𝑥′ ) + 𝑡𝑎𝑛2(𝜃3𝑦
′ ))0.5, 𝜃3𝑦′ ≥ 0
𝜃6′ = 𝜃5
′ = {atan ((𝑡𝑎𝑛2(𝜃5𝑥
′ ) + 𝑡𝑎𝑛2(𝜃5𝑦′ ))0.5, 𝜃5𝑦
′ < 0
−atan ((𝑡𝑎𝑛2(𝜃5𝑥′ ) + 𝑡𝑎𝑛2(𝜃5𝑦
′ ))0.5, 𝜃5𝑦′ ≥ 0
𝜃𝑘′ = 180° − 𝜃4
′ + 𝜃6′
(a) Overall kinematics (b) Hip -IMU (c) Knee -IMU (d) Ankle -IMU
Figure 9-5: (a) shows NDI lower-limb kinematic analysis and NDI segmented kinematics
analysis for each NDI marker on the (b) hip, (c) knee, and (d) ankle.
Equations 10–18 show how to calculate the hip, knee, and ankle angles based on the two IMUs
(Table 8-5).
Table 9-5: Motion analysis using IMU tracking system
(a)Kinematic analysis for the hip section
(10)
(11)
(12)
(b)Kinematic analysis for the knee section
(13)
(14)
(15)
(c)Kinematic analysis for the ankle section
(16)
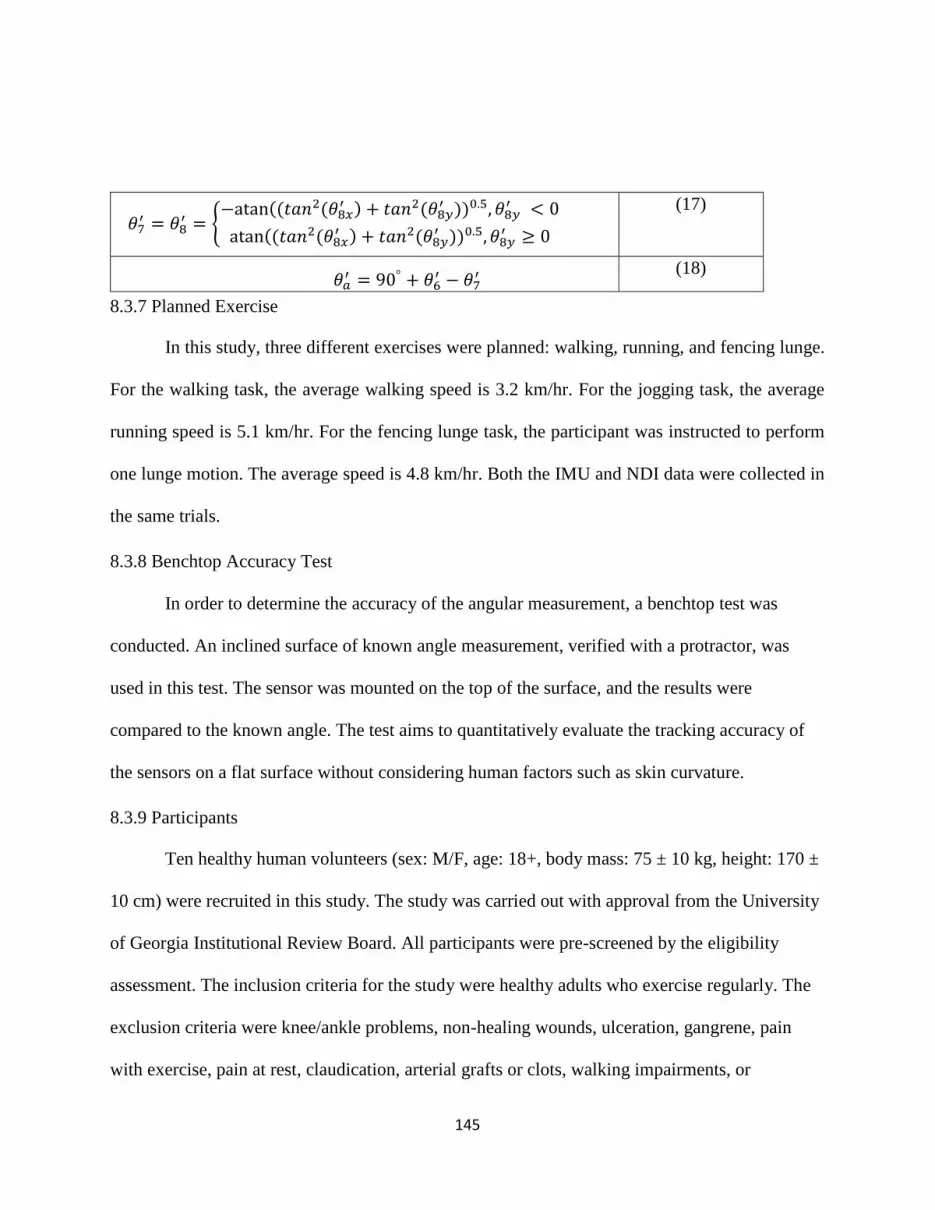
145
𝜃7′ = 𝜃8
′ = {−atan ((𝑡𝑎𝑛2(𝜃8𝑥
′ ) + 𝑡𝑎𝑛2(𝜃8𝑦′ ))0.5, 𝜃8𝑦
′ < 0
atan ((𝑡𝑎𝑛2(𝜃8𝑥′ ) + 𝑡𝑎𝑛2(𝜃8𝑦
′ ))0.5, 𝜃8𝑦′ ≥ 0
𝜃𝑎′ = 90° + 𝜃6
′ − 𝜃7′
(17)
(18)
8.3.7 Planned Exercise
In this study, three different exercises were planned: walking, running, and fencing lunge.
For the walking task, the average walking speed is 3.2 km/hr. For the jogging task, the average
running speed is 5.1 km/hr. For the fencing lunge task, the participant was instructed to perform
one lunge motion. The average speed is 4.8 km/hr. Both the IMU and NDI data were collected in
the same trials.
8.3.8 Benchtop Accuracy Test
In order to determine the accuracy of the angular measurement, a benchtop test was
conducted. An inclined surface of known angle measurement, verified with a protractor, was
used in this test. The sensor was mounted on the top of the surface, and the results were
compared to the known angle. The test aims to quantitatively evaluate the tracking accuracy of
the sensors on a flat surface without considering human factors such as skin curvature.
8.3.9 Participants
Ten healthy human volunteers (sex: M/F, age: 18+, body mass: 75 ± 10 kg, height: 170 ±
10 cm) were recruited in this study. The study was carried out with approval from the University
of Georgia Institutional Review Board. All participants were pre-screened by the eligibility
assessment. The inclusion criteria for the study were healthy adults who exercise regularly. The
exclusion criteria were knee/ankle problems, non-healing wounds, ulceration, gangrene, pain
with exercise, pain at rest, claudication, arterial grafts or clots, walking impairments, or

146
extremity pain from other causes and cardiovascular disease. The participants gave informed
consent to their inclusion in the study as required, and the work adhered to the Declaration of
Helsinki. Each participant performed three different motions: walking, jogging, and fencing
lunge. The overall exercise time was about 25 minutes, including preparation.
8.3.10 Pretest Calibration
The IMUs were calibrated through a method named static test, in order to reduce the
tracking errors of angular measurement. In detail, each IMU module was placed on a flat surface
and rotated on three axes, one at a time. The axis alignment between the IMU module and the
surface was calibrated. After the calibration, another test was carried out on an inclined surface
with an adjustable angle. The angular reading from the IMUs was then compared to a protractor,
which was used as a reference. If the angular difference between IMUs and protractor is less than
0.05°, the IMUs were ready to use in the exercises.
8.3.11 Statistical Tool
In this study, the cross-correlation method was used to assess the similarity between two
sets of data—IMU and NDI. As the sampling rate of two systems is different, in order to do
cross-correlation, the raw data of each system was firstly pre-processed stage and ensure the time
stamp was consistent for both data sets. The cross-correlation method allows for an angle-to-
angle comparison of the angular variation between the NDI and IMU over a certain period. This
pre-processing included the following processes: at first, all the collected raw data were checked
and cleaned; since the NDI’s sampling rate (60Hz) was different from the IMU’s sampling rate
(50Hz), it is important to adjust the sample sizes from both systems and make sure they are

147
identical. Moreover, each system’s data set was aligned according to the peaks of the calculated
angles.
9.4 Results
There are two different steps to validate the accuracy of the body movement tracker:
benchtop test and human trial.
8.4.1 Benchtop Accuracy Test
Angular and acceleration data were recorded. The scatter plot in Figure 8-6 (a) shows the
consistency between the angle output from the calibrated sensor and the actual angle from the
protractor reading of the inclined mounting surface (R2 = 0.999). The Bland-Altman plot in
Figure 8-7 (b) shows the close agreement between the angle measurement from the sensor and
the actual angle. Both the upper and lower limit is two standard deviations from the mean. The
result shows the difference is within the acceptable range. A t-test was conducted between the
two sets of data, and no significant difference between the angle detected by the MEMS
gyroscope and angle measured by the protractor was observed (p = 0.9997).
(a) Scatter plot (b) Bland-Altman plot
Figure 9-6: Shows the analysis of (a) scatter plot and (b) Bland-Altman plot.

148
8.4.2 Detailed Result of One Participant
The results of the gait analysis of one participant are shown in Figure 8-7. The blue line
is the NDI data, and the orange line is the IMU data.
Figure 9-7: Gait comparison between the NDI optical tracking and our tracking system for
one participant
8.4.3 Overall Results of Ten Participants
The angular variations of the hip, knee, and ankle during walking and jogging for all ten
participants are shown in Figure 8-8. In each exercise, the solid line and the dashed line
represents the IMU and the NDI data, respectively. The two lines were artificially separated by
adding an offset of 40⁰ for better visualization.

149
Figure 9-8: The walking, jogging, and fencing lunging results for 10 participants. The
solid line is the IMU data, and the dashed line is the NDI data. Taking one graph of the hip
movement of subject one as an example, µ= 4.40, σ= 4.70, cc= 0.81 means the mean of
differences is 4.40⁰, the average standard deviation is 4.70⁰, and the cross-correlation is
0.81. The two lines were artificially separated from each other by adding an offset of 40⁰
for better presentation.
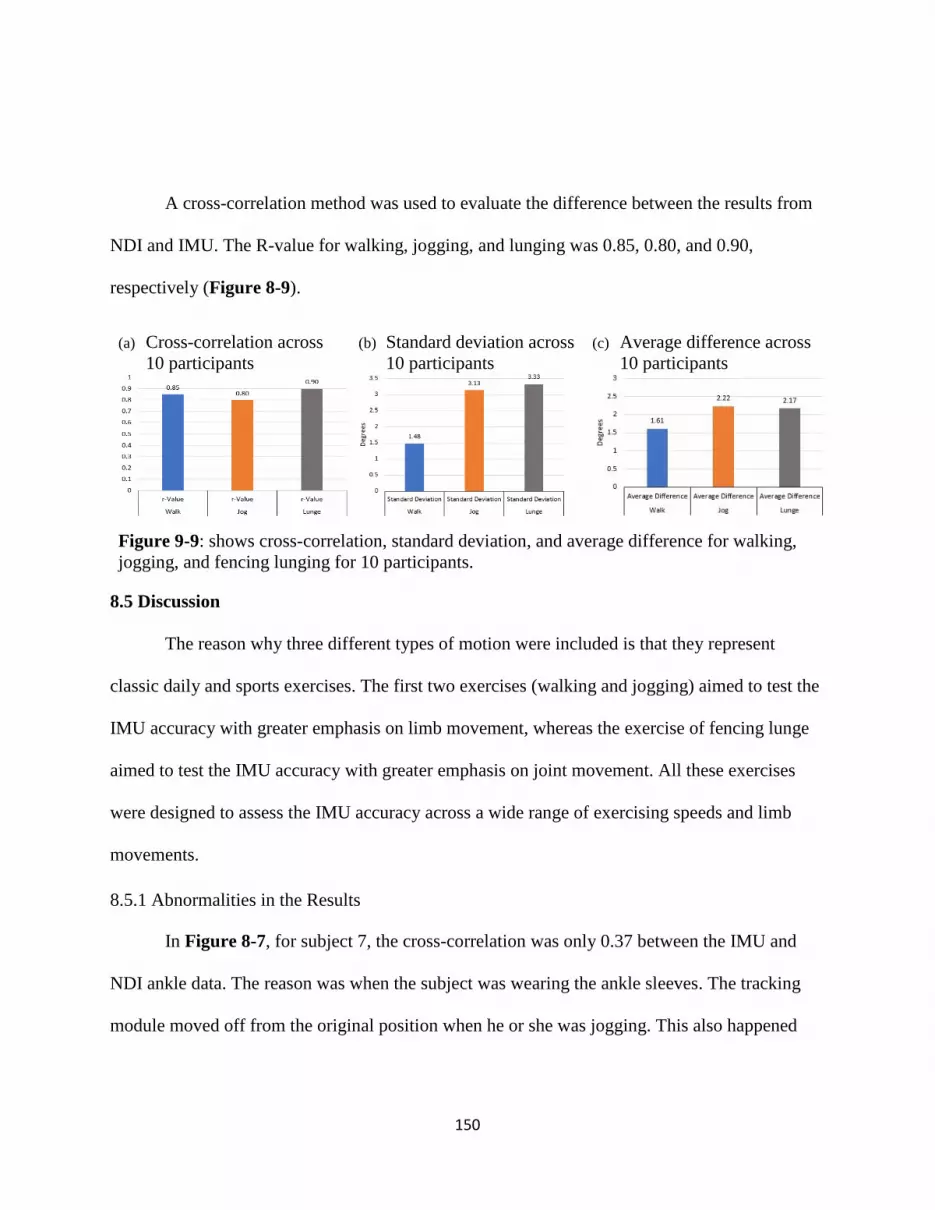
150
A cross-correlation method was used to evaluate the difference between the results from
NDI and IMU. The R-value for walking, jogging, and lunging was 0.85, 0.80, and 0.90,
respectively (Figure 8-9).
(a) Cross-correlation across
10 participants
(b) Standard deviation across
10 participants
(c) Average difference across
10 participants
Figure 9-9: shows cross-correlation, standard deviation, and average difference for walking,
jogging, and fencing lunging for 10 participants.
8.5 Discussion
The reason why three different types of motion were included is that they represent
classic daily and sports exercises. The first two exercises (walking and jogging) aimed to test the
IMU accuracy with greater emphasis on limb movement, whereas the exercise of fencing lunge
aimed to test the IMU accuracy with greater emphasis on joint movement. All these exercises
were designed to assess the IMU accuracy across a wide range of exercising speeds and limb
movements.
8.5.1 Abnormalities in the Results
In Figure 8-7, for subject 7, the cross-correlation was only 0.37 between the IMU and
NDI ankle data. The reason was when the subject was wearing the ankle sleeves. The tracking
module moved off from the original position when he or she was jogging. This also happened

151
when subjects were wearing smaller sizes of shoes, which gave the sleeve more room to rotate.
That explained why the cross-correlations were worse in the ankle angles.
8.5.2 Comparability Between NDI and IMU
The average value for cross-correlation was 0.9. These findings suggest that the MEMS-
guided tracking device presented in this study is comparable to a commercially available optical
tracking system. It could track real-time body motion, offering instant feedback to patients and
therapists.
8.5.3 Limitations of NDI
The reflective markers were designed to be mounted on the side of the body (i.e., sagittal
plane), specifically on the position of the iliotibial band of the thigh section, so that the reflective
markers on both legs would not interfere with each other. The human subjects performed each
exercise when one side of their body was exposed to the NDI, then turned around and performed
the same exercise on the other side of the body. For brevity, only the results of the left side of the
body were shown in Figure 8-8. The marker arrangement created a line of sight issues, such as
when an arm swings down in front of the marker or a piece of clothing moves during exercise
and covers the marker. This problem was solved by instructing the subjects to hold one arm
above the markers when the left side of the body was facing the NDI.
8.5.4 Limitations of IMU
Generally speaking, the IMU module has a drift problem on the Z-axis. In order to
mitigate the drift problem, one solution is to orientate the IMU module vertically so that the
measured angle was derived only from X- and Y-axis. After that, the Euler angles of the X- and

152
Y-axis were used to calculate the tilt angle, which was ideal for measuring 2D movement. All the
calculation has been conducted in a smartphone application. Furthermore, the human subject had
to stand straight, so the orientation of the IMU sensor could be adjusted and confirmed.
8.5.5 Advantages of IMU Over NDI
From the experiments conducted, it can be seen that the IMU is more suitable in dynamic
situations and environments than passive marker systems such as NDI due to the following
reasons. During the experiment on the NDI, the subjects had to pay attention to the positions of
markers and take actions to avoid marker blockage; this inevitably impacted the quality of
exercise. In contrast, the performance of IMU was stable and did not interfere with the body
posture of the subjects. For the consideration of accurate joint angle calculation, the relative
position between the optical markers has to be fixed. In this study, due to the sleeve and 3D-
printed mount design, this is less problematic. However, it could be a prevalent issue in many
gait analyses when the reflective markers are attached with less secure options. The IMU has its
own coordinate system, whereas the coordinates of NDI marker positions are dependent on the
NDI emitter/receiver coordinate system. This makes the IMU an ideal option for the fabrication
of a portable movement-monitoring system. The future application of the device is to aid in
training a patient to carry out the repetitive activity in an outdoor environment.
8.6 Summary
The findings suggest that the MEMS-guided tracking device presented in this study could
track real-time body motion, offering instant feedback to the patients and therapists. The device
is low-cost, easy-to-mount, user-friendly, and portable for outdoor use. In the future, acceleration

153
data will be included, so more kinematic information can be integrated to generate an analysis of
the repetitive rehabilitation exercise and assess the effectiveness of the exercise. Moreover, the
device would detect not only movement of the lower limbs but also the movement of the upper
limbs, including the movement of the fingers, after the system is scaled-down.
To sum up, in this study, a new MEMS IMU-based tracking system was developed. Ten
human subjects were instructed to perform three different motions: walking, running, lunging.
The same trials were then conducted together with IMU devices and the NDI Polaris Vega
optical tracking system® (NDI). Comparing the IMU to the NDI, the average cross-correlation
value was 0.85, the standard deviation was 2.65°, and the mean difference was 2.00°. This
verified that the proposed MEMS tracking device is able to provide accurate information on joint
angles and could potentially be used for outdoor or home-based rehabilitation.

154
9. CHAPTER 9
CONCLUSION AND FUTURE WORK
9.1 Conclusion
This dissertation aims to develop novel medical devices using smartphones, wireless
sensors, and 3D-printing technology. Reflecting on the purpose of the study stated in Chapter 1,
the conclusion begins with presenting the outcomes of six different studies, followed by
suggestions for future work. The first study looked into the efficiency and limitations of one
state-of-art navigation system—the NDI optical tracking system. Then the second study
presented wearable medical devices for fast and accurate measurement of skin temperature.
Another three studies explored the use of smartphone applications, wireless sensors, and 3D-
printing technology in precision cancer diagnosis and treatment. Last, a human study was
conducted to evaluate the accuracy of a real-time motion tracking system. All the developed
devices were low-cost and had comparable accuracies to commercially available products.
Chapter 3 presented a thorough evaluation of one NDI tracking system in a lab setting.
This detailed investigation shows the capability of current medical devices. Three potential error
sources were tested: the marker orientation, the marker occlusion affected by the blood during
surgery, and the environmental reflection. These experiments generated a maximum error of
2.63°, 4.88 mm, and 0.55 mm for the marker orientation, the marker occlusion, and the
environmental reflection, respectively. During the reflection test, there were many phantom
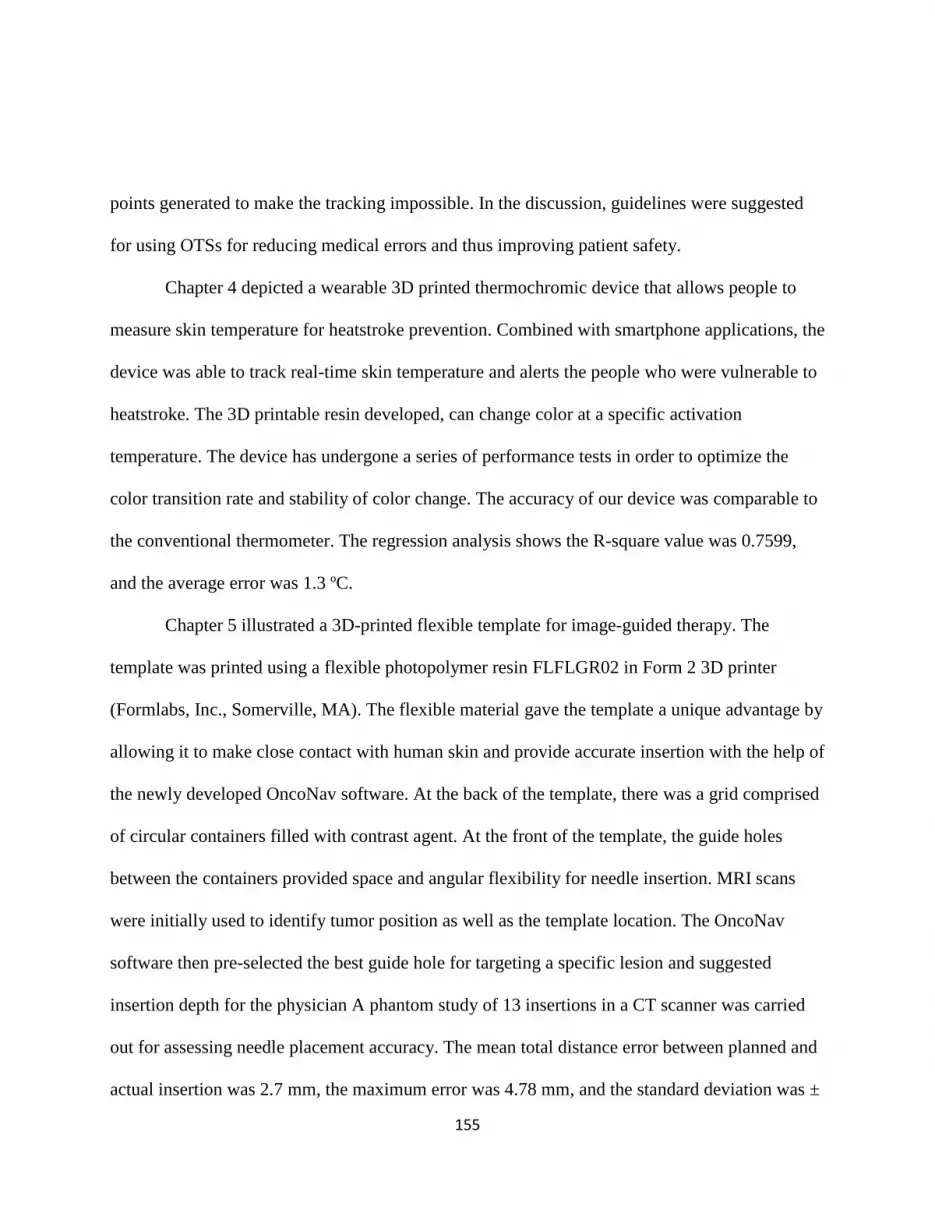
155
points generated to make the tracking impossible. In the discussion, guidelines were suggested
for using OTSs for reducing medical errors and thus improving patient safety.
Chapter 4 depicted a wearable 3D printed thermochromic device that allows people to
measure skin temperature for heatstroke prevention. Combined with smartphone applications, the
device was able to track real-time skin temperature and alerts the people who were vulnerable to
heatstroke. The 3D printable resin developed, can change color at a specific activation
temperature. The device has undergone a series of performance tests in order to optimize the
color transition rate and stability of color change. The accuracy of our device was comparable to
the conventional thermometer. The regression analysis shows the R-square value was 0.7599,
and the average error was 1.3 ºC.
Chapter 5 illustrated a 3D-printed flexible template for image-guided therapy. The
template was printed using a flexible photopolymer resin FLFLGR02 in Form 2 3D printer
(Formlabs, Inc., Somerville, MA). The flexible material gave the template a unique advantage by
allowing it to make close contact with human skin and provide accurate insertion with the help of
the newly developed OncoNav software. At the back of the template, there was a grid comprised
of circular containers filled with contrast agent. At the front of the template, the guide holes
between the containers provided space and angular flexibility for needle insertion. MRI scans
were initially used to identify tumor position as well as the template location. The OncoNav
software then pre-selected the best guide hole for targeting a specific lesion and suggested
insertion depth for the physician A phantom study of 13 insertions in a CT scanner was carried
out for assessing needle placement accuracy. The mean total distance error between planned and
actual insertion was 2.7 mm, the maximum error was 4.78 mm, and the standard deviation was ±
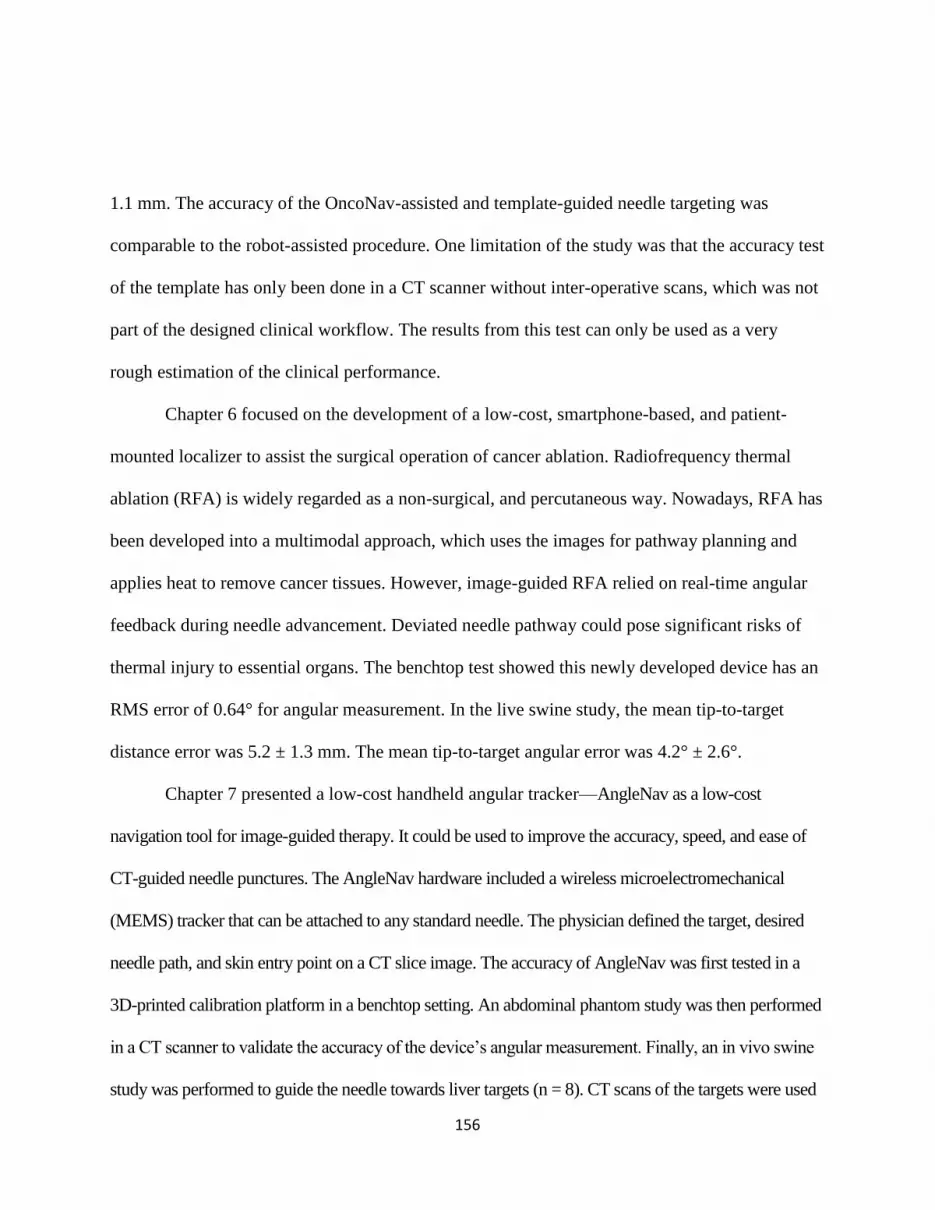
156
1.1 mm. The accuracy of the OncoNav-assisted and template-guided needle targeting was
comparable to the robot-assisted procedure. One limitation of the study was that the accuracy test
of the template has only been done in a CT scanner without inter-operative scans, which was not
part of the designed clinical workflow. The results from this test can only be used as a very
rough estimation of the clinical performance.
Chapter 6 focused on the development of a low-cost, smartphone-based, and patient-
mounted localizer to assist the surgical operation of cancer ablation. Radiofrequency thermal
ablation (RFA) is widely regarded as a non-surgical, and percutaneous way. Nowadays, RFA has
been developed into a multimodal approach, which uses the images for pathway planning and
applies heat to remove cancer tissues. However, image-guided RFA relied on real-time angular
feedback during needle advancement. Deviated needle pathway could pose significant risks of
thermal injury to essential organs. The benchtop test showed this newly developed device has an
RMS error of 0.64° for angular measurement. In the live swine study, the mean tip-to-target
distance error was 5.2 ± 1.3 mm. The mean tip-to-target angular error was 4.2° ± 2.6°.
Chapter 7 presented a low-cost handheld angular tracker—AngleNav as a low-cost
navigation tool for image-guided therapy. It could be used to improve the accuracy, speed, and ease of
CT-guided needle punctures. The AngleNav hardware included a wireless microelectromechanical
(MEMS) tracker that can be attached to any standard needle. The physician defined the target, desired
needle path, and skin entry point on a CT slice image. The accuracy of AngleNav was first tested in a
3D-printed calibration platform in a benchtop setting. An abdominal phantom study was then performed
in a CT scanner to validate the accuracy of the device’s angular measurement. Finally, an in vivo swine
study was performed to guide the needle towards liver targets (n = 8). CT scans of the targets were used
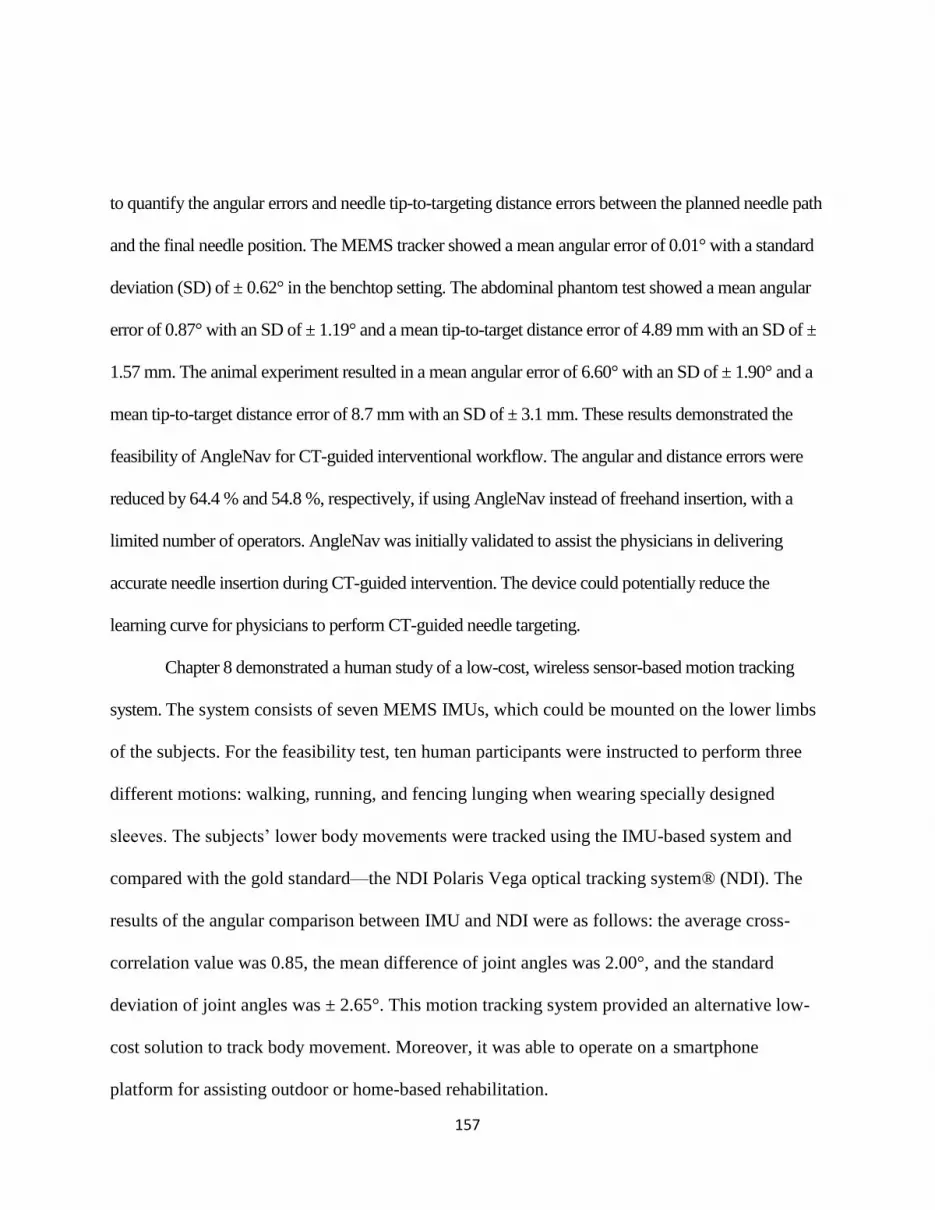
157
to quantify the angular errors and needle tip-to-targeting distance errors between the planned needle path
and the final needle position. The MEMS tracker showed a mean angular error of 0.01° with a standard
deviation (SD) of ± 0.62° in the benchtop setting. The abdominal phantom test showed a mean angular
error of 0.87° with an SD of ± 1.19° and a mean tip-to-target distance error of 4.89 mm with an SD of ±
1.57 mm. The animal experiment resulted in a mean angular error of 6.60° with an SD of ± 1.90° and a
mean tip-to-target distance error of 8.7 mm with an SD of ± 3.1 mm. These results demonstrated the
feasibility of AngleNav for CT-guided interventional workflow. The angular and distance errors were
reduced by 64.4 % and 54.8 %, respectively, if using AngleNav instead of freehand insertion, with a
limited number of operators. AngleNav was initially validated to assist the physicians in delivering
accurate needle insertion during CT-guided intervention. The device could potentially reduce the
learning curve for physicians to perform CT-guided needle targeting.
Chapter 8 demonstrated a human study of a low-cost, wireless sensor-based motion tracking
system. The system consists of seven MEMS IMUs, which could be mounted on the lower limbs
of the subjects. For the feasibility test, ten human participants were instructed to perform three
different motions: walking, running, and fencing lunging when wearing specially designed
sleeves. The subjects’ lower body movements were tracked using the IMU-based system and
compared with the gold standard—the NDI Polaris Vega optical tracking system® (NDI). The
results of the angular comparison between IMU and NDI were as follows: the average cross-
correlation value was 0.85, the mean difference of joint angles was 2.00°, and the standard
deviation of joint angles was ± 2.65°. This motion tracking system provided an alternative low-
cost solution to track body movement. Moreover, it was able to operate on a smartphone
platform for assisting outdoor or home-based rehabilitation.
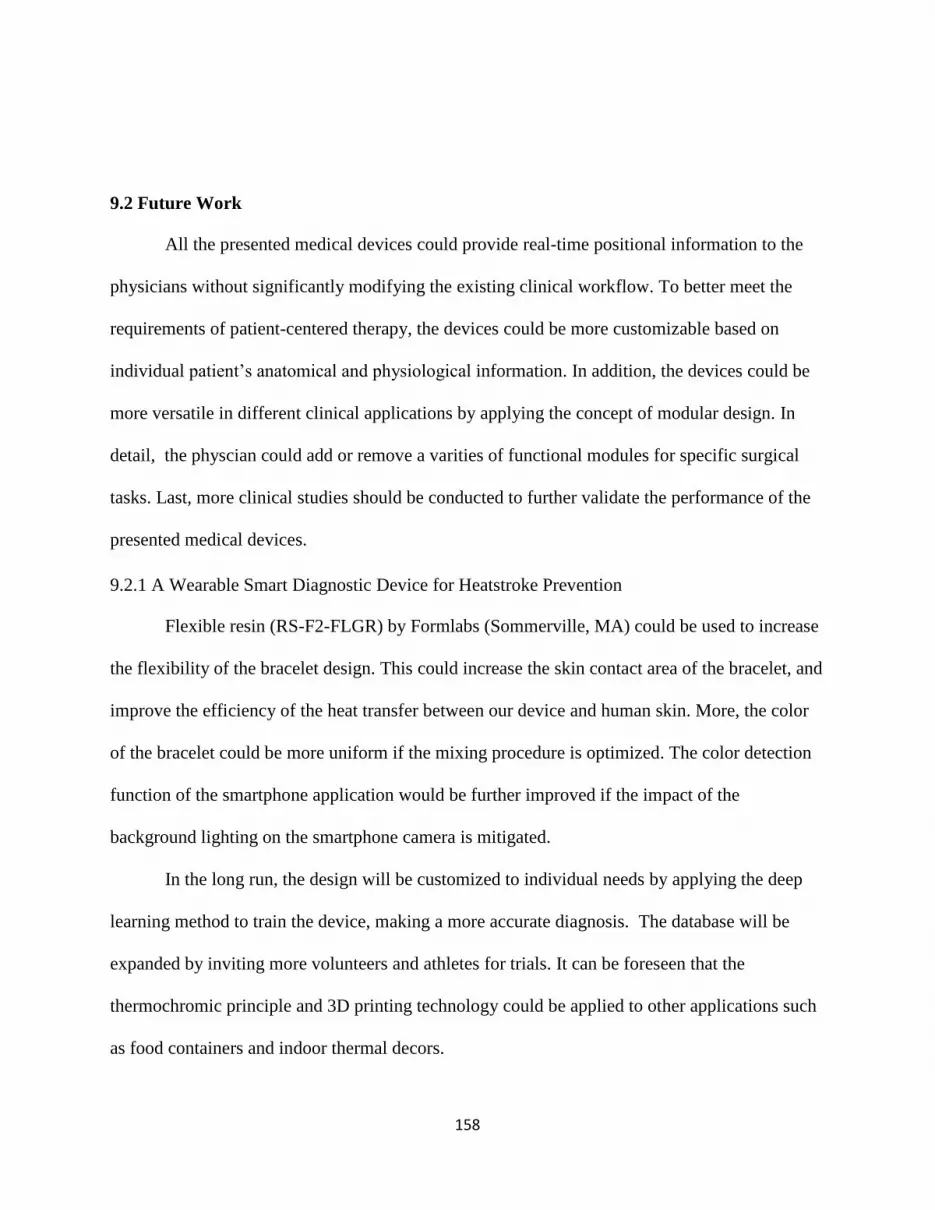
158
9.2 Future Work
All the presented medical devices could provide real-time positional information to the
physicians without significantly modifying the existing clinical workflow. To better meet the
requirements of patient-centered therapy, the devices could be more customizable based on
individual patient’s anatomical and physiological information. In addition, the devices could be
more versatile in different clinical applications by applying the concept of modular design. In
detail, the physcian could add or remove a varities of functional modules for specific surgical
tasks. Last, more clinical studies should be conducted to further validate the performance of the
presented medical devices.
9.2.1 A Wearable Smart Diagnostic Device for Heatstroke Prevention
Flexible resin (RS-F2-FLGR) by Formlabs (Sommerville, MA) could be used to increase
the flexibility of the bracelet design. This could increase the skin contact area of the bracelet, and
improve the efficiency of the heat transfer between our device and human skin. More, the color
of the bracelet could be more uniform if the mixing procedure is optimized. The color detection
function of the smartphone application would be further improved if the impact of the
background lighting on the smartphone camera is mitigated.
In the long run, the design will be customized to individual needs by applying the deep
learning method to train the device, making a more accurate diagnosis. The database will be
expanded by inviting more volunteers and athletes for trials. It can be foreseen that the
thermochromic principle and 3D printing technology could be applied to other applications such
as food containers and indoor thermal decors.

159
9.2.2 Low-cost MRI-visible Flexible Template
In the percutaneous surgical procedure, one of the challenges is to stabilize the needle on
a moving skin surface due to respiratory motion. In order to increase the needle stability, one of
the improvements is to adjust the hole sizes of the template and allowing tight-fit features for
more selection of biopsy needles. Another method to improve needle stability is to add an
insertion block with different needle insertion pathways. Moreover, in order to overcome the
problem of vaporization of liquid-form MRI contrast agents, an ideal alternative—Barium
Sulphate power could be used to develop a new MRI-visible template.
The proposed new template design comprises two parts. One part is the flexible connection,
and the other one is the needle insertion block. The template will be fabricated using Form 2
printer® (Formlabs Inc, Somerville, MA). The flexible connection will be printed using an optimal
mixture of high-density Barium Sulphate and Formlabs® flexible resin (RS-F2-GPCL-04). The
insertion block will be 3D-printed using the Formlabs® clear resin (RS-F2-GPCL-04); the
insertion holes are designed for 17G and 18G biopsy needles. The addition of Barium Sulphate
allows the template to become MRI-visible while avoiding the problem of Magnevist® leakage.
The flexible connection enables close proximity to human skin. The needle insertion block made
from Formlabs® clear resin has high accuracy and tolerance for the biopsy needle. The accuracy
of this new stereotactic device will be evaluated in phantom and in-vivo MRI studies.
(a) Drawing (b) Template design
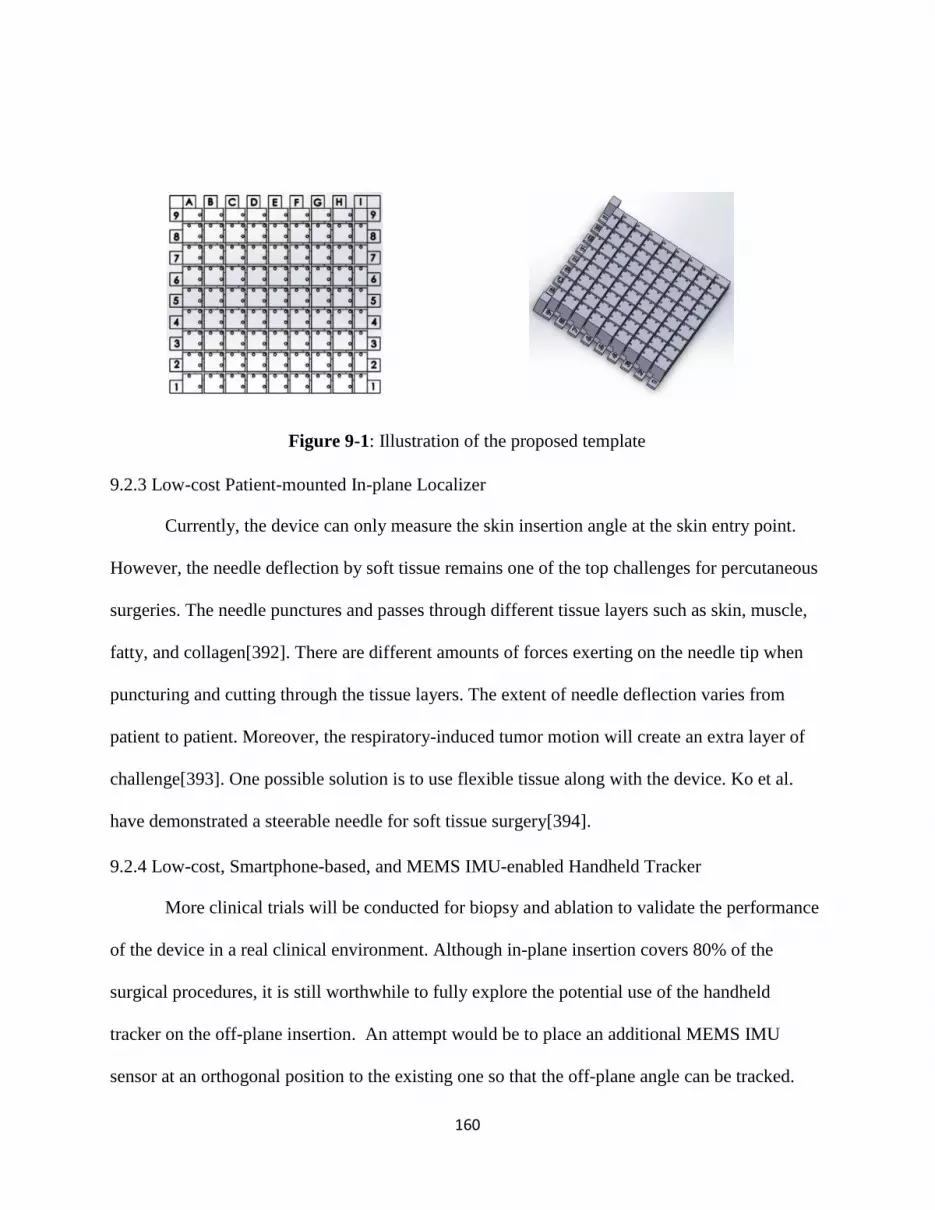
160
Figure 9-1: Illustration of the proposed template
9.2.3 Low-cost Patient-mounted In-plane Localizer
Currently, the device can only measure the skin insertion angle at the skin entry point.
However, the needle deflection by soft tissue remains one of the top challenges for percutaneous
surgeries. The needle punctures and passes through different tissue layers such as skin, muscle,
fatty, and collagen[392]. There are different amounts of forces exerting on the needle tip when
puncturing and cutting through the tissue layers. The extent of needle deflection varies from
patient to patient. Moreover, the respiratory-induced tumor motion will create an extra layer of
challenge[393]. One possible solution is to use flexible tissue along with the device. Ko et al.
have demonstrated a steerable needle for soft tissue surgery[394].
9.2.4 Low-cost, Smartphone-based, and MEMS IMU-enabled Handheld Tracker
More clinical trials will be conducted for biopsy and ablation to validate the performance
of the device in a real clinical environment. Although in-plane insertion covers 80% of the
surgical procedures, it is still worthwhile to fully explore the potential use of the handheld
tracker on the off-plane insertion. An attempt would be to place an additional MEMS IMU
sensor at an orthogonal position to the existing one so that the off-plane angle can be tracked.

161
In order to further minimize the size and cost of the device, a concept of modular product
design (MPD) could be applied. The MPD offers benefits such as a reduction in manufacturing
cost, interoperability between different functional modules, shorter learning time for the users,
more design flexibility, and less maintenance as well as upgrade constrains. According to MPD,
the presented tracker could be divided into more function-based, scalable and reusable
modules[395]. For example, the major electronic component of the tracker can be partitioned
into an integrated wireless communication unit, a compact positional tracking unit, and a
reusable charging unit. The major mechanical component can be divided into a handheld module
and base operating module. One proposed idea is shown in Figure 9-2.
Figure 9-2: Shows a developed prototype using the MPD concept
Since both medical devices are not suitable for steam sterilization, alternative low-
temperature sterilization methods would be considered, such as Ethylene Oxide Sterilization.
The advantage of the EtO process is that it has high efficiency, large sterilization volume, and
162
non-corrosive to the 3D printed plastic material. But it is time-consuming as well as has some
toxicity concerns.
9.2.5 Low-cost, Smartphone-based and MEMS Sensor-enabled Body Tracker
So far, the system could only track the joint movement of the lower limbs as the
investigation was mainly focused on the lower limb recovery. For understanding more about the
body locomotion, the upper limb movement would also be tracked. To better assess the patient’s
activities in daily life (ADL), the acceleration of limbs should also be used as another movement
parameter. Moreover, the system could be upgraded to conduct a 3D kinematic analysis as it
could help to reveal more movement details. As mentioned in Chapter 8, some limitations of
MEMS IMU systems are that the IMU can suffer from drift due to instrumentation biases. A new
way of fast pre-test calibration should be developed so that the users could instantly calibrate all
the trackers when wearing them.
On the other hand, the data storage and cloud sharing function need to be further
improved. The smartphone interface should be more informative and provide instant feedback
and a historical review of the routine recovery exercises. This will make the system more
customizable for the individual patient. Sport-related injuries greatly restricted game
participation and created a large economic burden for athletes and clubs[396]. The application of
a smartphone-based tracking system can identify potential risk factors and provide targeted risk-
reduction training programs for players. For example, motion-tracking technology could be used
in the fencing industry for coaching assistance and injury reduction. The MEMS IMU sensor

163
provides real-time positional and orientational data to the users, and the smartphone application
will store and upload all the training data onto an online server (Figure 9-3).
(a) The conventional coaching (b) Common injuries (c) New proposed training
Figure 9-3: Shows a future trend for fencing analytics: (a) conventional coaching technique for
fencing, (b) common fencing injuries-knee problem, (c) new training practice using sensors and
smartphone application

164
REFERENCES
[1] A. C. Schlaerth and N. R. Abu-Rustum, "Role of minimally invasive surgery in gynecologic
cancers," Oncologist, vol. 11, no. 8, pp. 895-901, 2006
[2] N. Aghakhani, M. Geravand, N. Shahriari, M. Vendittelli, and G. Oriolo, "Task control with
remote center of motion constraint for minimally invasive robotic surgery," in 2013 IEEE
International Conference on Robotics and Automation, 6-10 May 2013 2013, pp. 5807-5812
[3] A. Biondi et al., "Laparoscopic vs. open approach for colorectal cancer: evolution over time of
minimal invasive surgery," BMC surgery, vol. 13, no. 2, p. S12, 2013
[4] M. Abdelgadir Adam et al., "Minimally invasive versus open pancreaticoduodenectomy for
cancer," Annals of surgery, vol. 262, no. 2, pp. 372-377, 2015
[5] B. a. W. s. Hospital. "What Is Image-guided Therapy?" Brigham and Women's Hospital.
https://www.brighamandwomens.org/research/amigo/image-guided-therapy-at-bwh (accessed 6-
1-2020, 2020).
[6] K. Cleary and T. M. Peters, "Image-Guided Interventions: Technology Review and Clinical
Applications," Annual Review of Biomedical Engineering, vol. 12, no. 1, pp. 119-142, 2010/07/01
2010
[7] P. R. DeLucia, R. D. Mather, J. A. Griswold, and S. Mitra, "Toward the improvement of image-
guided interventions for minimally invasive surgery: Three factors that affect performance,"
Human factors, vol. 48, no. 1, pp. 23-38, 2006
[8] P. Dutkiewicz, M. Kielczewski, and M. Kowalski, "Visual tracking of surgical tools for
laparoscopic surgery," in Proceedings of the Fourth International Workshop on Robot Motion
and Control (IEEE Cat. No. 04EX891), 2004: IEEE, pp. 23-28

165
[9] J. Marescaux and M. Diana, "Next step in minimally invasive surgery: hybrid image-guided
surgery," Journal of Pediatric Surgery, vol. 50, no. 1, pp. 30-36, 2015/01/01/ 2015
[10] Z. Zhou, B. Wu, J. Duan, X. Zhang, N. Zhang, and Z. Liang, "Optical surgical instrument
tracking system based on the principle of stereo vision," Journal of biomedical optics, vol. 22, no.
6, p. 065005, 2017
[11] R. Elfring, M. de la Fuente, and K. Radermacher, "Assessment of optical localizer accuracy for
computer aided surgery systems," Computer Aided Surgery, vol. 15, no. 1-3, pp. 1-12, 2010
[12] N. Enayati, E. D. Momi, and G. Ferrigno, "A Quaternion-Based Unscented Kalman Filter for
Robust Optical/Inertial Motion Tracking in Computer-Assisted Surgery," IEEE Transactions on
Instrumentation and Measurement, vol. 64, no. 8, pp. 2291-2301, 2015
[13] C. Nafis, V. Jensen, and M. Ron von Jako, "Method for evaluating compatibility of commercial
electromagnetic (EM) microsensor tracking systems with surgical and imaging tables," in
Medical Imaging 2008: Visualization, Image-Guided Procedures, and Modeling, 2008, vol. 6918:
International Society for Optics and Photonics, p. 691820
[14] C. Hayhurst, P. Byrne, P. R. Eldridge, and C. L. Mallucci, "Application of electromagnetic
technology to neuronavigation: a revolution in image-guided neurosurgery," Journal of
neurosurgery, vol. 111, no. 6, pp. 1179-1184, 2009
[15] E. J. Hermann, H. H. Capelle, C. A. Tschan, and J. K. Krauss, "Electromagnetic-guided
neuronavigation for safe placement of intraventricular catheters in pediatric neurosurgery," (in
eng), J Neurosurg Pediatr, vol. 10, no. 4, pp. 327-33, Oct 2012
[16] J. L. McMillen, M. Vonau, and M. J. Wood, "Pinless frameless electromagnetic image-guided
neuroendoscopy in children," (in eng), Childs Nerv Syst, vol. 26, no. 7, pp. 871-8, Jul 2010
[17] P. Maciejasz, J. Eschweiler, K. Gerlach-Hahn, A. Jansen-Troy, and S. Leonhardt, "A survey on
robotic devices for upper limb rehabilitation," Journal of NeuroEngineering and Rehabilitation,
vol. 11, no. 1, p. 3, 2014
[18] A. Vakanski, H.-P. Jun, D. Paul, and R. Baker, "A Data Set of Human Body Movements for

166
Physical Rehabilitation Exercises," (in eng), Data (Basel), vol. 3, no. 1, p. 2, 2018
[19] G. D. Dockery, "Chapter 4 - Surgical principles," in Lower Extremity Soft Tissue & Cutaneous
Plastic Surgery (Second Edition), G. D. Dockery and M. E. Crawford Eds. Oxford: W.B.
Saunders, 2012, pp. 23-27.
[20] M. Imbault, D. Chauvet, J.-L. Gennisson, L. Capelle, and M. Tanter, "Intraoperative functional
ultrasound imaging of human brain activity," Scientific reports, vol. 7, no. 1, pp. 1-7, 2017
[21] K. S. Randall, J. A. Urbano, and L. A. Engle, "Ultrasound imaging systems and methods of
performing ultrasound procedures," 2017.
[22] L. C. Sousa et al., "Computational simulation of carotid stenosis and flow dynamics based on
patient ultrasound data–A new tool for risk assessment and surgical planning," Advances in
medical sciences, vol. 61, no. 1, pp. 32-39, 2016
[23] N. Houssami, R. M. Turner, and M. Morrow, "Meta-analysis of pre-operative magnetic resonance
imaging (MRI) and surgical treatment for breast cancer," Breast cancer research and treatment,
vol. 165, no. 2, pp. 273-283, 2017
[24] N. Wake et al., "3D printed renal cancer models derived from MRI data: application in pre-
surgical planning," Abdominal Radiology, vol. 42, no. 5, pp. 1501-1509, 2017
[25] N. Heller et al., "The kits19 challenge data: 300 kidney tumor cases with clinical context, ct
semantic segmentations, and surgical outcomes," arXiv preprint arXiv:1904.00445, 2019
[26] C. T. Yeo et al., "Utility of 3D reconstruction of 2D liver computed tomography/magnetic
resonance images as a surgical planning tool for residents in liver resection surgery," Journal of
surgical education, vol. 75, no. 3, pp. 792-797, 2018
[27] N. F. Deana and N. Alves, "Cone Beam CT in diagnosis and surgical planning of dentigerous
cyst," Case reports in dentistry, vol. 2017, 2017
[28] O. G. Avrunin et al., "Principles of computer planning in the functional nasal surgery," Przegląd
Elektrotechniczny, vol. 93, no. 3, pp. 140--143, 2017
[29] N. R. Council, Mathematics and physics of emerging biomedical imaging. National Academies

167
Press, 1996.
[30] M. C. Olson, T. D. Atwell, L. A. Mynderse, B. F. King, T. Welch, and A. H. Goenka, "CT-guided
transgluteal biopsy for systematic sampling of the prostate in patients without rectal access: a 13-
year single-center experience," European Radiology, vol. 27, no. 8, pp. 3326-3332, 2017/08/01
2017
[31] N. Lang, M. Dawood, F. Büther, O. Schober, M. Schäfers, and K. Schäfers, "Organ movement
reduction in PET/CT using dual-gated listmode acquisition," Zeitschrift für medizinische Physik,
vol. 16, no. 1, pp. 93-100, 2006
[32] G. Xu et al., "Photoacoustic and ultrasound dual-modality imaging of human peripheral joints,"
Journal of biomedical optics, vol. 18, no. 1, p. 010502, 2012
[33] J. M. Koski, "Ultrasound guided injections in rheumatology," The Journal of rheumatology, vol.
27, no. 9, pp. 2131-2138, 2000
[34] T. Szyszko and G. Cook, "PET/CT and PET/MRI in head and neck malignancy," Clinical
radiology, vol. 73, no. 1, pp. 60-69, 2018
[35] Philips. "CT 6000 iCT." Philips.
https://www.usa.philips.com/healthcare/product/HCNOCTN194/ct-6000-ict-ct-scanner (accessed
5-17-2020, 2020).
[36] G. Healthcare. "Your standards, beyond your expectations." GE Healthcare.
https://www.gehealthcare.com/products/ultrasound/voluson/voluson-s10-ultrasound (accessed 5-
17-2020, 2020).
[37] D. Blog. "Siemens Avanto vs. Siemens Espree: How Do They Compare?" DMS Health.
https://www.dmshealth.com/siemens-avanto-vs-siemens-espree/ (accessed 5-17-2020, 2020).
[38] R. Liao, L. Zhang, Y. Sun, S. Miao, and C. Chefd'Hotel, "A Review of Recent Advances in
Registration Techniques Applied to Minimally Invasive Therapy," IEEE Transactions on
Multimedia, vol. 15, no. 5, pp. 983-1000, 2013
[39] J. Hoffmann, C. Westendorff, C. Leitner, D. Bartz, and S. Reinert, "Validation of 3D-laser
168
surface registration for image-guided cranio-maxillofacial surgery," Journal of Cranio-
Maxillofacial Surgery, vol. 33, no. 1, pp. 13-18, 2005
[40] S. Xu et al., "Real-time MRI-TRUS fusion for guidance of targeted prostate biopsies," Computer
Aided Surgery, vol. 13, no. 5, pp. 255-264, 2008/01/01 2008
[41] F. R. Khan and J. M. Henderson, "Chapter 3 - Deep brain stimulation surgical techniques," in
Handbook of Clinical Neurology, vol. 116, A. M. Lozano and M. Hallett Eds.: Elsevier, 2013, pp.
27-37.
[42] R. A. Brown, "A stereotactic head frame for use with CT body scanners," Investigative radiology,
vol. 14, no. 4, pp. 300-304, 1979
[43] V. Huang, J. Kamarn, R. D'Arcy, and K. Kohli, "SU‐G‐IeP2‐02: A Proposed Solution to
Accurate Delineation of External Body Contour Within CT Extended Field of View (eFOV) and
the Evaluation of Dosimetric Impact from Image Distortion in EFOV," Medical physics, vol. 43,
no. 6Part26, pp. 3655-3656, 2016
[44] N. Harada-Shoji et al., "Usefulness of lesion image mapping with multidetector-row helical
computed tomography using a dedicated skin marker in breast-conserving surgery," European
radiology, vol. 19, no. 4, p. 868, 2009
[45] A. A. Khankan and M. Al-Muaikeel, "Image-guided percutaneous transthoracic biopsy in lung
cancer–Emphasis on CT-guided technique," Journal of infection and public health, vol. 5, pp.
S22-S30, 2012
[46] W. Lee, S. Chong, J. Seo, and H. Shim, "Transthoracic fine-needle aspiration biopsy of the lungs
using a C-arm cone-beam CT system: diagnostic accuracy and post-procedural complications,"
The British journal of radiology, vol. 85, no. 1014, pp. e217-e222, 2012
[47] K. R. Birchard, "Transthoracic needle biopsy," in Seminars in interventional radiology, 2011,
vol. 28, no. 01: © Thieme Medical Publishers, pp. 087-097
[48] J. Krücker et al., "Clinical utility of real-time fusion guidance for biopsy and ablation," Journal of

169
vascular and interventional radiology, vol. 22, no. 4, pp. 515-524, 2011
[49] D. J. Grand, M. A. Atalay, J. J. Cronan, W. W. Mayo-Smith, and D. E. Dupuy, "CT-guided
percutaneous lung biopsy: comparison of conventional CT fluoroscopy to CT fluoroscopy with
electromagnetic navigation system in 60 consecutive patients," European journal of radiology,
vol. 79, no. 2, pp. e133-e136, 2011
[50] W. Medical. "The fast find grid." Webb Medical. https://www.fastfindgrid.com/ (accessed 4-26-
2020, 2020).
[51] R. Peng et al., "Dosimetric analysis of 3D-printed coplanar template-assisted and CT-guided 125I
seed implantation for the treatment of malignant tumors," Chinese Journal of Radiation
Oncology, vol. 26, no. 9, pp. 1062-1066, 2017
[52] P. J. Klopotek, "Tracking system for laser surgery," ed: Google Patents, 1994.
[53] R. Khadem et al., "Comparative tracking error analysis of five different optical tracking systems,"
Computer Aided Surgery, vol. 5, no. 2, pp. 98-107, 2000
[54] F. Poulin and L.-P. Amiot, "Interference during the use of an electromagnetic tracking system
under OR conditions," Journal of biomechanics, vol. 35, no. 6, pp. 733-737, 2002
[55] N. Medical. "Aurora." NDI Medical. https://www.ndigital.com/medical/products/aurora/
(accessed 3-21-2020, 2020).
[56] N. Medical. "Polaris Spectra and Vicra." https://www.ndigital.com/medical/products/polaris-
family/ (accessed 7-31-2019, 2019).
[57] D. Putzer et al., "Comparison of Two Electromagnetic Navigation Systems For CT-Guided
Punctures: A Phantom Study," (in eng), Rofo, vol. 188, no. 5, pp. 470-8, 2016
[58] T. Gruber-Rouh et al., "Intervention Planning Using a Laser Navigation System for CT-Guided
Interventions: A Phantom and Patient Study," Korean J Radiol, vol. 16, no. 4, pp. 729-735, 2015
[59] J. Engstrand, G. Toporek, P. Harbut, E. Jonas, H. Nilsson, and J. Freedman, "Stereotactic CT-
Guided Percutaneous Microwave Ablation of Liver Tumors With the Use of High-Frequency Jet
Ventilation: An Accuracy and Procedural Safety Study," American Journal of Roentgenology,

170
vol. 208, no. 1, pp. 193-200, 2016
[60] Y. Schwarz et al., "Electromagnetic navigation during flexible bronchoscopy," Respiration, vol.
70, no. 5, pp. 516-522, 2003
[61] E. E. Folch et al., "Electromagnetic Navigation Bronchoscopy for Peripheral Pulmonary Lesions:
One-Year Results of the Prospective, Multicenter NAVIGATE Study," Journal of Thoracic
Oncology, vol. 14, no. 3, pp. 445-458, 2019/03/01/ 2019
[62] G. Mauri et al., "Real-Time US-CT/MRI Image Fusion for Guidance of Thermal Ablation of
Liver Tumors Undetectable with US: Results in 295 Cases," CardioVascular and Interventional
Radiology, vol. 38, no. 1, pp. 143-151, 2015
[63] B. J. Dixon, M. J. Daly, H. Chan, A. Vescan, I. J. Witterick, and J. C. Irish, "Augmented real-
time navigation with critical structure proximity alerts for endoscopic skull base surgery," The
Laryngoscope, vol. 124, no. 4, pp. 853-859, 2014
[64] S. Xu, V. Krishnasamy, E. Levy, M. Li, Z. T. H. Tse, and B. J. Wood, "Smartphone-Guided
Needle Angle Selection During CT-Guided Procedures," American Journal of Roentgenology,
vol. 210, no. 1, pp. 207-213, 2018/01/01 2017
[65] G. Fichtinger et al., "Image overlay guidance for needle insertion in CT scanner," IEEE
Transactions on Biomedical Engineering, vol. 52, no. 8, pp. 1415-1424, 2005
[66] M. Bovenzi, "Finger thermometry in the assessment of subjects with vibration-induced white
finger," Scandinavian journal of work, environment & health, pp. 348-351, 1987
[67] N. Harada, "Cold-stress tests involving finger skin temperature measurement for evaluation of
vascular disorders in hand-arm vibration syndrome: review of the literature," International
Archives of Occupational and Environmental Health, vol. 75, no. 1, pp. 14-19, 2002/01/01 2002
[68] S. Begley. "Thousands of men with prostate cancer get risky treatment they don’t need. New
approaches could curb that." https://www.statnews.com/2017/05/04/prostate-cancer-research-psa/
(accessed July 16th 2017, 2017).
[69] S. J. Haker et al., "Magnetic Resonance-guided Prostate Interventions," Top Magn Reson

171
Imaging, vol. 16, no. 5, pp. 355-368, 2005
[70] J. S. Wu, J. D. Goldsmith, P. J. Horwich, S. K. Shetty, and M. G. Hochman, "Bone and soft-tissue
lesions: what factors affect diagnostic yield of image-guided core-needle biopsy?," Radiology,
vol. 248, no. 3, pp. 962-970, 2008
[71] G. Fichtinger, A. Krieger, R. C. Susil, A. Tanacs, L. L. Whitcomb, and E. Atalar, "Transrectal
prostate biopsy inside closed MRI scanner with remote actuation, under real-time image
guidance," in International Conference on Medical Image Computing and Computer-Assisted
Intervention, 2002: Springer, pp. 91-98
[72] L. A. Simmons et al., "The PICTURE study: diagnostic accuracy of multiparametric MRI in men
requiring a repeat prostate biopsy," British journal of cancer, vol. 116, no. 9, pp. 1159-1165,
2017
[73] S. D. "Problems with Transrectal Ultrasound-Guided Prostate Biopsy." Sperling Medical Group.
http://sperlingprostatecenter.com/problems-with-transrectal-ultrasound-guided-prostate-biopsy/
(accessed July 27th 2017, 2017).
[74] K. M. Pondman et al., "MR-guided biopsy of the prostate: an overview of techniques and a
systematic review," European urology, vol. 54, no. 3, pp. 517-27, Sep 2008
[75] A. D’amico et al., "Transperineal magnetic resonance image guided prostate biopsy," J Urol, vol.
164, no. 2, pp. 385-387, 2000
[76] G. Fichtinger et al., "System for robotically assisted prostate biopsy and therapy with
intraoperative CT guidance," Academic radiology, vol. 9, no. 1, pp. 60-74, Jan 2002
[77] J. Tokuda et al., "Preliminary accuracy evaluation of 3T MRI-guided transperineal prostate
biopsy with grid template," in Proc Intl Soc Mag Reson Med, 2011, pp. 7-13
[78] M. K. Samplaski and J. S. Jones, "Two centuries of cystoscopy: the development of imaging,
instrumentation and synergistic technologies," (in eng), BJU Int, vol. 103, no. 2, pp. 154-8, Jan
2009
[79] E. v. Lima et al., "Transvesical thoracoscopy: a natural orifice translumenal endoscopic approach

172
for thoracic surgery," Surgical endoscopy, vol. 21, no. 6, pp. 854-858, 2007
[80] C. H. Park, "Current application of minimally invasive surgery for gastrointestinal diseases," The
Korean journal of gastroenterology= Taehan Sohwagi Hakhoe chi, vol. 50, no. 4, pp. 217-219,
2007
[81] F. Devernay, F. Mourgues, and È. Coste-Manière, "Towards endoscopic augmented reality for
robotically assisted minimally invasive cardiac surgery," in Proceedings International Workshop
on Medical Imaging and Augmented Reality, 2001: IEEE, pp. 16-20
[82] R. L. Witt, H. Iro, M. Koch, M. McGurk, O. Nahlieli, and J. Zenk, "Minimally invasive options
for salivary calculi," The Laryngoscope, vol. 122, no. 6, pp. 1306-1311, 2012
[83] A. H. Wille, J. Roigas, S. Deger, M. Tüllmann, I. Türk, and S. A. Loening, "Laparoscopic radical
nephrectomy: techniques, results and oncological outcome in 125 consecutive cases," European
urology, vol. 45, no. 4, pp. 483-489, 2004
[84] P. Alison and A. McKee, "Chapter 9 - Surgery for Coronary Artery Disease," in Cardiothoracic
Critical Care, D. Sidebotham, A. McKee, M. Gillham, and J. H. Levy Eds. Philadelphia:
Butterworth-Heinemann, 2007, pp. 141-157.
[85] V. J. Miele, S. Vadera, and E. C. Benzel, "15 - Spinal Stenosis with Spondylolisthesis," in The
Comprehensive Treatment of the Aging Spine, J. J. Yue, R. D. Guyer, J. P. Johnson, L. T. Khoo,
and S. H. Hochschuler Eds. Philadelphia: W.B. Saunders, 2011, pp. 82-87.
[86] J. L. Ochsner, "Minimally invasive surgical procedures," (in eng), Ochsner J, vol. 2, no. 3, pp.
135-136, 2000
[87] E. Buscarini et al., "Radiofrequency thermal ablation of liver tumors," European radiology, vol.
15, no. 5, pp. 884-894, 2005
[88] J. S. Lewin et al., "Phase II clinical trial of interactive MR imaging–guided interstitial
radiofrequency thermal ablation of primary kidney tumors: initial experience," Radiology, vol.
232, no. 3, pp. 835-845, 2004
[89] D. E. Dupuy, "Image-guided thermal ablation of lung malignancies," Radiology, vol. 260, no. 3,

173
pp. 633-655, 2011
[90] C. Pusceddu, B. Sotgia, R. M. Fele, and L. Melis, "Treatment of bone metastases with microwave
thermal ablation," Journal of Vascular and Interventional Radiology, vol. 24, no. 2, pp. 229-233,
2013
[91] K. L. Carr and R. C. Allison, "Method and apparatus for aligning an ablation catheter and a
temperature probe during an ablation procedure," 2014.
[92] J. C. Chen et al., "Prostate Cancer: MR Imaging and Thermometry during Microwave Thermal
Ablation-Initial Experience," Radiology, vol. 214, no. 1, pp. 290-297, 2000/01/01 2000
[93] V. Rieke et al., "Comparison of temperature processing methods for monitoring focused
ultrasound ablation in the brain," (in eng), J Magn Reson Imaging, vol. 38, no. 6, pp. 1462-1471,
2013
[94] P. Wang, "Evaluation of MR thermometry with proton resonance frequency method at 7T," (in
eng), Quant Imaging Med Surg, vol. 7, no. 2, pp. 259-266, 2017
[95] E. F. Kelly and R. J. Leveillee, "Image-Guided Radiofrequency Ablation for Small Renal
Masses," in The Management of Small Renal Masses: Diagnosis and Management, K. Ahmed, N.
Raison, B. Challacombe, A. Mottrie, and P. Dasgupta Eds. Cham: Springer International
Publishing, 2018, pp. 61-74.
[96] S. D. Brown, P. R. Morrison, L. Diller, and R. C. Shamberger, "CT-guided radiofrequency
ablation of pediatric Wilms tumor in a solitary kidney," Pediatric radiology, vol. 35, no. 9, pp.
923-928, 2005
[97] B. Skjoldbye, F. Burcharth, J. Christensen, F. Moesgaard, J. Struckmann, and C. Nolsøe,
"Ultrasound-guided radiofrequency ablation of malignant liver tumors," Ugeskrift for laeger, vol.
164, no. 40, pp. 4646-4650, 2002
[98] A. Semonche et al., "MR-Guided Laser Interstitial Thermal Therapy for Treatment of Brain
Tumors," in Neurosurgical Procedures-Innovative Approaches: IntechOpen, 2019.
[99] U. Salem et al., "Neurosurgical applications of MRI guided laser interstitial thermal therapy

174
(LITT)," Cancer Imaging, vol. 19, no. 1, p. 65, 2019/10/15 2019
[100] M. S. Rao, E. L. Hargreaves, A. J. Khan, B. G. Haffty, and S. F. Danish, "Magnetic resonance-
guided laser ablation improves local control for postradiosurgery recurrence and/or radiation
necrosis," (in eng), Neurosurgery, vol. 74, no. 6, pp. 658-67; discussion 667, Jun 2014
[101] Z. Tovar-Spinoza and H. Choi, "Magnetic resonance-guided laser interstitial thermal therapy:
report of a series of pediatric brain tumors," (in eng), J Neurosurg Pediatr, vol. 17, no. 6, pp. 723-
33, Jun 2016
[102] O. Ashraf, N. V. Patel, S. Hanft, and S. F. Danish, "Laser-Induced Thermal Therapy in Neuro-
Oncology: A Review," (in eng), World Neurosurg, vol. 112, pp. 166-177, Apr 2018
[103] K. Beccaria, M. S. Canney, and A. C. Carpentier, "Magnetic Resonance-Guided Laser Interstitial
Thermal Therapy for Brain Tumors," in Tumors of the Central Nervous System, Volume 5:
Astrocytomas, Hemangioblastomas, and Gangliogliomas, M. A. Hayat Ed. Dordrecht: Springer
Netherlands, 2012, pp. 173-185.
[104] A. Kawczyk-Krupka et al., "Comparison of cryotherapy and photodynamic therapy in treatment
of oral leukoplakia," Photodiagnosis and Photodynamic Therapy, vol. 9, no. 2, pp. 148-155,
2012/06/01/ 2012
[105] J. P. Erinjeri and T. W. Clark, "Cryoablation: mechanism of action and devices," Journal of
Vascular and Interventional Radiology, vol. 21, no. 8, pp. S187-S191, 2010
[106] M. A. A. J. van den Bosch et al., "MR imaging-guided percutaneous cryoablation of the prostate
in an animal model: in vivo imaging of cryoablation-induced tissue necrosis with immediate
histopathologic correlation," (in eng), Journal of vascular and interventional radiology : JVIR,
vol. 20, no. 2, pp. 252-258, 2009
[107] D. B. Rukstalis, M. Khorsandi, F. U. Garcia, D. M. Hoenig, and J. K. Cohen, "Clinical experience
with open renal cryoablation," Urology, vol. 57, no. 1, pp. 34-39, 2001
[108] T. Ikeda, S. Yoshizawa, N. Koizumi, M. Mitsuishi, and Y. Matsumoto, "Focused Ultrasound and
Lithotripsy," (in eng), Adv Exp Med Biol, vol. 880, pp. 113-29, 2016

175
[109] C. M. Tempany, E. A. Stewart, N. McDannold, B. J. Quade, F. A. Jolesz, and K. Hynynen, "MR
imaging–guided focused ultrasound surgery of uterine leiomyomas: a feasibility study,"
Radiology, vol. 226, no. 3, pp. 897-905, 2003
[110] E. A. Stewart et al., "Clinical outcomes of focused ultrasound surgery for the treatment of uterine
fibroids," Fertility and sterility, vol. 85, no. 1, pp. 22-29, 2006
[111] J. E. Kennedy, G. Ter Haar, and D. Cranston, "High intensity focused ultrasound: surgery of the
future?," The British journal of radiology, vol. 76, no. 909, pp. 590-599, 2003
[112] M. Nakai et al., "Radiofrequency Ablation Assisted by Real-Time Virtual Sonography and CT
for Hepatocellular Carcinoma Undetectable by Conventional Sonography," CardioVascular and
Interventional Radiology, vol. 32, no. 1, pp. 62-69, 2009/01/01 2009
[113] D. L. Stippel, S. Böhm, T. K. Beckurts, H. G. Brochhagen, and A. H. Hölscher, "Experimental
evaluation of accuracy of radiofrequency ablation using conventional ultrasound or a third-
dimension navigation tool," Langenbeck's Archives of Surgery, vol. 387, no. 7, pp. 303-308,
2002/11/01 2002
[114] F. Di Vece, P. Tombesi, F. Ermili, C. Maraldi, and S. Sartori, "Coagulation Areas Produced by
Cool-Tip Radiofrequency Ablation and Microwave Ablation Using a Device to Decrease Back-
Heating Effects: A Prospective Pilot Study," CardioVascular and Interventional Radiology, vol.
37, no. 3, pp. 723-729, 2014/06/01 2014
[115] S. J. Graham et al., "Quantifying tissue damage due to focused ultrasound heating observed by
MRI," Magnetic Resonance in Medicine, vol. 41, no. 2, pp. 321-328, 1999
[116] G. Hubens, H. Coveliers, L. Balliu, M. Ruppert, and W. Vaneerdeweg, "A performance study
comparing manual and robotically assisted laparoscopic surgery using the da Vinci system,"
Surgical Endoscopy And Other Interventional Techniques, vol. 17, no. 10, pp. 1595-1599,
2003/10/01 2003
[117] B. J. Park, R. M. Flores, and V. W. Rusch, "Robotic assistance for video-assisted thoracic
surgical lobectomy: Technique and initial results," The Journal of Thoracic and Cardiovascular

176
Surgery, vol. 131, no. 1, pp. 54-59, 2006/01/01/ 2006
[118] Q. H. Li, L. Zamorano, A. Pandya, R. Perez, J. Gong, and F. Diaz, "The application accuracy of
the NeuroMate robot--A quantitative comparison with frameless and frame-based surgical
localization systems," (in eng), Comput Aided Surg, vol. 7, no. 2, pp. 90-8, 2002
[119] M. S. Eljamel, "Robotic neurological surgery applications: accuracy and consistency or pure
fantasy?," (in eng), Stereotact Funct Neurosurg, vol. 87, no. 2, pp. 88-93, 2009
[120] H. J. Kim, W. I. Jung, B. S. Chang, C. K. Lee, K. T. Kang, and J. S. Yeom, "A prospective,
randomized, controlled trial of robot-assisted vs freehand pedicle screw fixation in spine
surgery," (in eng), Int J Med Robot, vol. 13, no. 3, Sep 2017
[121] M. H. L. Liow, P. L. Chin, H. N. Pang, D. K.-J. Tay, and S.-J. Yeo, "THINK surgical TSolution-
One(®) (Robodoc) total knee arthroplasty," (in eng), SICOT J, vol. 3, pp. 63-63, 2017
[122] S. W. Bell, I. Anthony, B. Jones, A. MacLean, P. Rowe, and M. Blyth, "Improved Accuracy of
Component Positioning with Robotic-Assisted Unicompartmental Knee Arthroplasty: Data from
a Prospective, Randomized Controlled Study," (in eng), J Bone Joint Surg Am, vol. 98, no. 8, pp.
627-35, Apr 20 2016
[123] J. Huang, J. Li, H. Li, H. Lin, P. Lu, and Q. Luo, "Continuous 389 cases of Da Vinci robot-
assisted thoracoscopic lobectomy in treatment of non-small cell lung cancer: experience in
Shanghai Chest Hospital," (in eng), J Thorac Dis, vol. 10, no. 6, pp. 3776-3782, 2018
[124] B. Yi et al., "The first clinical use of domestically produced Chinese minimally invasive surgical
robot system “Micro Hand S”," Surgical endoscopy, vol. 30, no. 6, pp. 2649-2655, 2016
[125] M. Remacle, M. N. P. V, G. Lawson, L. Plisson, V. Bachy, and S. Van der Vorst, "Transoral
robotic surgery (TORS) with the Medrobotics Flex System: first surgical application on humans,"
(in eng), Eur Arch Otorhinolaryngol, vol. 272, no. 6, pp. 1451-5, Jun 2015
[126] B. Seeliger, M. Diana, J. P. Ruurda, K. M. Konstantinidis, J. Marescaux, and L. L. Swanström,
"Enabling single-site laparoscopy: the SPORT platform," Surgical Endoscopy, vol. 33, no. 11, pp.
3696-3703, 2019/11/01 2019

177
[127] K. D. Chang, A. Abdel Raheem, Y. D. Choi, B. H. Chung, and K. H. Rha, "Retzius‐sparing
robot‐assisted radical prostatectomy using the Revo‐i robotic surgical system: surgical technique
and results of the first human trial," BJU international, vol. 122, no. 3, pp. 441-448, 2018
[128] C. M. Kang et al., "Robotic cholecystectomy using the newly developed Korean robotic surgical
system, Revo-i: a preclinical experiment in a porcine model," Yonsei medical journal, vol. 58, no.
5, pp. 1075-1077, 2017
[129] F. Fanfani et al., "The new robotic TELELAP ALF-X in gynecological surgery: single-center
experience," Surgical Endoscopy, vol. 30, no. 1, pp. 215-221, 2016/01/01 2016
[130] J. M. Cooper and A. H. V. Schapira, "Friedreich's Ataxia: Disease mechanisms, antioxidant and
Coenzyme Q10 therapy," Biofactors, vol. 18, no. 1‐4, pp. 163-171, 2003
[131] J. Chan, M. F. Brin, and S. J. M. d. o. j. o. t. M. D. S. Fahn, "Idiopathic cervical dystonia: clinical
characteristics," vol. 6, no. 2, pp. 119-126, 1991
[132] R. A. C. Roos, "Huntington's disease: a clinical review," Orphanet journal of rare diseases, vol.
5, pp. 40-40, 2010
[133] G. DeMaagd and A. Philip, "Parkinson's Disease and Its Management: Part 1: Disease Entity,
Risk Factors, Pathophysiology, Clinical Presentation, and Diagnosis," P & T : a peer-reviewed
journal for formulary management, vol. 40, no. 8, pp. 504-532, 2015
[134] C. Frank, G. Pari, and J. P. Rossiter, "Approach to diagnosis of Parkinson disease," Canadian
family physician Medecin de famille canadien, vol. 52, no. 7, pp. 862-868, 2006
[135] A. E. Lang and A. M. Lozano, "Parkinson's disease," J New England Journal of Medicine, vol.
339, no. 16, pp. 1130-1143, 1998
[136] D. Tarsy, "Treatment of Parkinson Disease: A 64-Year-Old Man With Motor Complications of
Advanced Parkinson DiseaseMotor Complications in Advanced Parkinson Disease," JAMA, vol.
307, no. 21, pp. 2305-2314, 2012
[137] Y. Tian, X. Meng, D. Tao, D. Liu, and C. Feng, "Upper limb motion tracking with the integration

178
of IMU and Kinect," Neurocomputing, vol. 159, pp. 207-218, 2015
[138] J. A. Corrales, F. Candelas, and F. Torres, "Hybrid tracking of human operators using
IMU/UWB data fusion by a Kalman filter," in 2008 3rd ACM/IEEE International Conference on
Human-Robot Interaction (HRI), 2008: IEEE, pp. 193-200
[139] Q. Yuan and I.-M. Chen, "Localization and velocity tracking of human via 3 IMU sensors,"
Sensors and Actuators A: Physical, vol. 212, pp. 25-33, 2014
[140] H. Zhou, T. Stone, H. Hu, and N. Harris, "Use of multiple wearable inertial sensors in upper limb
motion tracking," Medical engineering & physics, vol. 30, no. 1, pp. 123-133, 2008
[141] S. Yang and Q. Li, "IMU-based ambulatory walking speed estimation in constrained treadmill
and overground walking," Computer Methods in Biomechanics and Biomedical Engineering, vol.
15, no. 3, pp. 313-322, 2012/03/01 2012
[142] W. Teufl, M. Lorenz, M. Miezal, B. Taetz, M. Fröhlich, and G. Bleser, "Towards Inertial Sensor
Based Mobile Gait Analysis: Event-Detection and Spatio-Temporal Parameters," (in eng),
Sensors (Basel), vol. 19, no. 1, p. 38, 2018
[143] W. Kong et al., "Development of a real-time IMU-based motion capture system for gait
rehabilitation," in 2013 IEEE International Conference on Robotics and Biomimetics (ROBIO),
12-14 Dec. 2013 2013, pp. 2100-2105
[144] H. T. Chang, L. A. Cheng, and J. J. Chang, "Development of IMU-based angle measurement
system for finger rehabilitation," in 23rd International Conference on Mechatronics and Machine
Vision in Practice (M2VIP), 28-30 Nov. 2016 2016, pp. 1-6
[145] D. Roetenberg, H. Luinge, and P. Slycke, "Xsens MVN: Full 6DOF human motion tracking using
miniature inertial sensors," Xsens Motion Technologies BV, Tech. Rep, vol. 1, 2009
[146] P. Müller, M. Bégin, T. Schauer, and T. Seel, "Alignment-Free, Self-Calibrating Elbow Angles
Measurement Using Inertial Sensors," IEEE Journal of Biomedical and Health Informatics, vol.
21, no. 2, pp. 312-319, 2017
[147] S. Bakhshi, M. H. Mahoor, and B. S. Davidson, "Development of a body joint angle

179
measurement system using IMU sensors," in 2011 Annual International Conference of the IEEE
Engineering in Medicine and Biology Society, 30 Aug.-3 Sept. 2011 2011, pp. 6923-6926
[148] A. Frisoli, M. Bergamasco, M. C. Carboncini, and B. Rossi, "Robotic assisted rehabilitation in
virtual reality with the L-EXOS," J Stud Health Technol Inform, vol. 145, pp. 40-54, 2009
[149] G. Kwakkel, B. J. Kollen, and H. I. Krebs, "Effects of robot-assisted therapy on upper limb
recovery after stroke: a systematic review," J Neurorehabilitation and neural repair, vol. 22, no.
2, pp. 111-121, 2008
[150] A. Montagner et al., "A pilot clinical study on robotic assisted rehabilitation in VR with an arm
exoskeleton device," in Virtual Rehabilitation, 2007, 2007: IEEE, pp. 57-64
[151] S. Masiero, A. Celia, G. Rosati, M. Armani, and rehabilitation, "Robotic-assisted rehabilitation of
the upper limb after acute stroke," J Archives of physical medicine, vol. 88, no. 2, pp. 142-149,
2007
[152] G. Abbruzzese, R. Marchese, L. Avanzino, and E. Pelosin, "Rehabilitation for Parkinson's
disease: Current outlook and future challenges," Parkinsonism & Related Disorders, vol. 22, pp.
S60-S64, 2016/01/01/ 2016
[153] A. Meyer-Heim and H. J. van Hedel, "Robot-assisted and computer-enhanced therapies for
children with cerebral palsy: current state and clinical implementation," (in eng), Semin Pediatr
Neurol, vol. 20, no. 2, pp. 139-45, Jun 2013
[154] X. Tu et al., "Upper Limb Rehabilitation Robot Powered by PAMs Cooperates with FES Arrays
to Realize Reach-to-Grasp Trainings," (in eng), J Healthc Eng, vol. 2017, pp. 1282934-1282934,
2017
[155] R. Nijland, G. Kwakkel, J. Bakers, and E. van Wegen, "Constraint-induced movement therapy for
the upper paretic limb in acute or sub-acute stroke: a systematic review," (in eng), Int J Stroke,
vol. 6, no. 5, pp. 425-33, Oct 2011
[156] A. A. Blank, J. A. French, A. U. Pehlivan, and M. K. O'Malley, "Current Trends in Robot-
Assisted Upper-Limb Stroke Rehabilitation: Promoting Patient Engagement in Therapy," (in
180
eng), Curr Phys Med Rehabil Rep, vol. 2, no. 3, pp. 184-195, 2014
[157] A. Jackson et al., "Initial patient testing of iPAM - a robotic system for Stroke rehabilitation," in
2007 IEEE 10th International Conference on Rehabilitation Robotics, 13-15 June 2007 2007, pp.
250-256
[158] D. J. Reinkensmeyer, E. T. Wolbrecht, V. Chan, C. Chou, S. C. Cramer, and J. E. Bobrow,
"Comparison of three-dimensional, assist-as-needed robotic arm/hand movement training
provided with Pneu-WREX to conventional tabletop therapy after chronic stroke," (in eng), Am J
Phys Med Rehabil, vol. 91, no. 11 Suppl 3, pp. S232-S241, 2012
[159] G. Zeilig, H. Weingarden, M. Zwecker, I. Dudkiewicz, A. Bloch, and A. Esquenazi, "Safety and
tolerance of the ReWalk™ exoskeleton suit for ambulation by people with complete spinal cord
injury: a pilot study," The journal of spinal cord medicine, vol. 35, no. 2, pp. 96-101, 2012
[160] H. Kawamoto, S. Lee, S. Kanbe, and Y. Sankai, "Power assist method for HAL-3 using EMG-
based feedback controller," in SMC'03 Conference Proceedings. 2003 IEEE International
Conference on Systems, Man and Cybernetics. Conference Theme-System Security and Assurance
(Cat. No. 03CH37483), 2003, vol. 2: IEEE, pp. 1648-1653
[161] S. K. Banala, S. H. Kim, S. K. Agrawal, and J. P. Scholz, "Robot assisted gait training with active
leg exoskeleton (ALEX)," IEEE transactions on neural systems and rehabilitation engineering,
vol. 17, no. 1, pp. 2-8, 2008
[162] M. Topping, "An Overview of the Development of Handy 1, a Rehabilitation Robot to Assist the
Severely Disabled," Journal of Intelligent and Robotic Systems, vol. 34, no. 3, pp. 253-263,
2002/07/01 2002
[163] M. Hillman, "2 rehabilitation robotics from past to present–a historical perspective," in Advances
in Rehabilitation Robotics: Springer, 2004, pp. 25-44.
[164] A. Campeau-Lecours et al., "Jaco assistive robotic device: Empowering people with disabilities
through innovative algorithms," in RESNA/NCART 2016, Arlington, VA, 2016,
[165] J. M. McBean and K. N. Narendran, "Powered orthotic device and method of using same," ed:

181
Google Patents, 2015.
[166] L. Ferreira dos Santos, O. Christ, K. Mate, H. Schmidt, J. Krüger, and C. Dohle, "Movement
visualisation in virtual reality rehabilitation of the lower limb: a systematic review," BioMedical
Engineering OnLine, vol. 15, no. 3, p. 144, 2016/12/19 2016
[167] D. Jack et al., "Virtual reality-enhanced stroke rehabilitation," IEEE transactions on neural
systems and rehabilitation engineering, vol. 9, no. 3, pp. 308-318, 2001
[168] D. T. Reid, "Benefits of a virtual play rehabilitation environment for children with cerebral palsy
on perceptions of self-efficacy: a pilot study," Pediatric rehabilitation, vol. 5, no. 3, pp. 141-148,
2002
[169] K. Dockx et al., "Virtual reality for rehabilitation in Parkinson's disease," Cochrane Database of
Systematic Reviews, no. 12, 2016
[170] A. S. Rizzo and G. J. Kim, "A SWOT analysis of the field of virtual reality rehabilitation and
therapy," Presence: Teleoperators & Virtual Environments, vol. 14, no. 2, pp. 119-146, 2005
[171] H. Sveistrup, "Motor rehabilitation using virtual reality," Journal of NeuroEngineering and
Rehabilitation, vol. 1, no. 1, p. 10, 2004/12/10 2004
[172] M. Slater, V. Linakis, M. Usoh, and R. Kooper, "Immersion, presence and performance in virtual
environments: An experiment with tri-dimensional chess," in Proceedings of the ACM symposium
on virtual reality software and technology, 1996, pp. 163-172
[173] S. K. Subramanian and M. F. Levin, "Viewing medium affects arm motor performance in 3D
virtual environments," Journal of neuroengineering and rehabilitation, vol. 8, no. 1, p. 36, 2011
[174] S. M. Slobounov, W. Ray, B. Johnson, E. Slobounov, and K. M. Newell, "Modulation of cortical
activity in 2D versus 3D virtual reality environments: an EEG study," International Journal of
Psychophysiology, vol. 95, no. 3, pp. 254-260, 2015
[175] R. Lloréns, C. Colomer-Font, M. Alcaniz, and E. Noé-Sebastián, "BioTrak virtual reality system:
effectiveness and satisfaction analysis for balance rehabilitation in patients with brain injury,"
Neurología (English Edition), vol. 28, no. 5, pp. 268-275, 2013

182
[176] T. Rose, C. S. Nam, and K. B. Chen, "Immersion of virtual reality for rehabilitation-Review,"
Applied ergonomics, vol. 69, pp. 153-161, 2018
[177] A. Gokeler et al., "Immersive virtual reality improves movement patterns in patients after ACL
reconstruction: implications for enhanced criteria-based return-to-sport rehabilitation," Knee
Surgery, Sports Traumatology, Arthroscopy, vol. 24, no. 7, pp. 2280-2286, 2016
[178] M. F. Yanik, H. Cinar, H. N. Cinar, A. D. Chisholm, Y. Jin, and A. Ben-Yakar, "Neurosurgery:
functional regeneration after laser axotomy," Nature, vol. 432, no. 7019, p. 822, 2004
[179] A. A. Cohen-Gadol, D. G. Piepgras, S. Krishnamurthy, and R. D. Fessler, "Resident duty hours
reform: results of a national survey of the program directors and residents in neurosurgery
training programs," Neurosurgery, vol. 56, no. 2, pp. 398-403, 2005
[180] A. R. Cohen, S. Lohani, S. Manjila, S. Natsupakpong, N. Brown, and M. C. Cavusoglu, "Virtual
reality simulation: basic concepts and use in endoscopic neurosurgery training," Child's Nervous
System, vol. 29, no. 8, pp. 1235-1244, 2013
[181] T. A. B. o. N. Surgery. "Training requirement." https://www.abns.org/training-requirements/
(accessed 7-14-2019, 2019).
[182] W. C. Newman, Y.-F. Chang, and L. D. Lunsford, "Professionalism and performance issues
during neurosurgical training and job satisfaction after training: a single training center 50-year
experience," Journal of neurosurgery, vol. 131, no. 1, pp. 245-251, 2018
[183] A. Nabavi et al., "Surgical navigation in the open MRI," in Intraoperative Imaging in
Neurosurgery: Springer, 2003, pp. 121-125.
[184] U. Herwig et al., "The navigation of transcranial magnetic stimulation," vol. 108, no. 2, pp. 123-
131, 2001
[185] T. N. Hernes, S. Ommedal, T. Lie, F. Lindseth, T. Langø, and G. J. m.-M. I. N. Unsgaard,
"Stereoscopic navigation-controlled display of preoperative MRI and intraoperative 3D
ultrasound in planning and guidance of neurosurgery: new technology for minimally invasive
image-guided surgery approaches," vol. 46, no. 03, pp. 129-137, 2003

183
[186] A. Meola, F. Cutolo, M. Carbone, F. Cagnazzo, M. Ferrari, and V. J. N. r. Ferrari, "Augmented
reality in neurosurgery: a systematic review," vol. 40, no. 4, pp. 537-548, 2017
[187] K. Cai et al., "Synchronization design and error analysis of near-infrared cameras in surgical
navigation," Journal of medical systems, vol. 40, no. 1, p. 7, 2016
[188] S. Engelhardt et al., "Accuracy evaluation of a mitral valve surgery assistance system based on
optical tracking," International journal of computer assisted radiology and surgery, vol. 11, no.
10, pp. 1891-1904, 2016
[189] A. D. Wiles, D. G. Thompson, and D. D. Frantz, "Accuracy assessment and interpretation for
optical tracking systems," in Medical Imaging 2004: Visualization, Image-Guided Procedures,
and Display, 2004, vol. 5367: International Society for Optics and Photonics, pp. 421-432
[190] M. Ribo, A. Pinz, and A. L. Fuhrmann, "A new optical tracking system for virtual and
augmented reality applications," in IMTC 2001. Proceedings of the 18th IEEE Instrumentation
and Measurement Technology Conference. Rediscovering Measurement in the Age of Informatics
(Cat. No. 01CH 37188), 2001, vol. 3: IEEE, pp. 1932-1936
[191] L. A. Groves, P. Carnahan, D. R. Allen, R. Adam, T. M. Peters, and E. C. Chen, "Accuracy
assessment for the co-registration between optical and VIVE head-mounted display tracking,"
International journal of computer assisted radiology and surgery, vol. 14, no. 7, pp. 1207-1215,
2019
[192] R. Elfring, M. de la Fuente, and K. Radermacher, "Assessment of optical localizer accuracy for
computer aided surgery systems," (in eng), Comput Aided Surg, vol. 15, no. 1-3, pp. 1-12, 2010
[193] N. Medical. "NDI Polaris Vega." https://www.ndigital.com/medical/products/polaris-vega/
(accessed 7-31-2019, 2019).
[194] NDI. "Optotrak Certus." NDI. https://wigi725ylkk16hjts2tbfo9i-wpengine.netdna-
ssl.com/msci/wp-content/uploads/sites/17/2014/02/8300324_rev001_optotrak_Certus.pdf
(accessed 5-12-2020, 2020).
[195] NDI. "Optotrak Certus HD." NDI. https://www.ndigital.com/msci/products/certus-hd/ (accessed
184
5-12-2020, 2020).
[196] ClaroNav. "Microntracker specifications."
https://www.claronav.com/microntracker/microntracker-specifications/ (accessed 5-12-2020,
2020).
[197] Atracsys. "FusionTrack 500." Atracsys. https://www.atracsys-measurement.com/wp-
content/documents/fTk500-datasheet.pdf (accessed 5-12-2020, 2020).
[198] D. F. Abawi, J. Bienwald, and R. Dorner, "Accuracy in optical tracking with fiducial markers: an
accuracy function for ARToolKit," in Proceedings of the 3rd IEEE/ACM International
Symposium on Mixed and Augmented Reality, 2004: IEEE Computer Society, pp. 260-261
[199] P. Haggard and A. M. Wing, "Assessing and reporting the accuracy of position measurements
made with optical tracking systems," Journal of Motor Behavior, vol. 22, no. 2, pp. 315-321,
1990
[200] R. D. Ferguson, D. X. Hammer, L. A. Paunescu, S. Beaton, and J. S. Schuman, "Tracking optical
coherence tomography," Optics letters, vol. 29, no. 18, pp. 2139-2141, 2004
[201] C. R. Mascott, "In vivo accuracy of image guidance performed using optical tracking and
optimized registration," Journal of neurosurgery, vol. 105, no. 4, pp. 561-567, 2006
[202] L. Qin et al., "Prospective head‐movement correction for high‐resolution MRI using an in‐bore
optical tracking system," Magnetic Resonance in Medicine: An Official Journal of the
International Society for Magnetic Resonance in Medicine, vol. 62, no. 4, pp. 924-934, 2009
[203] A. E. Kedgley, T. Birmingham, and T. R. Jenkyn, "Comparative accuracy of radiostereometric
and optical tracking systems," Journal of biomechanics, vol. 42, no. 9, pp. 1350-1354, 2009
[204] B. J. Lopresti et al., "Implementation and performance of an optical motion tracking system for
high resolution brain PET imaging," IEEE Transactions on Nuclear Science, vol. 46, no. 6, pp.
2059-2067, 1999
[205] J. Schmidt, D. R. Berg, H.-L. Ploeg, and L. Ploeg, "Precision, repeatability and accuracy of

185
Optotrak® optical motion tracking systems," International Journal of Experimental and
Computational Biomechanics, vol. 1, no. 1, pp. 114-127, 2009
[206] W. Birkfellner, F. Watzinger, F. Wanschitz, R. Ewers, and H. Bergmann, "Calibration of tracking
systems in a surgical environment," IEEE Transactions on Medical Imaging, vol. 17, no. 5, pp.
737-742, 1998
[207] S. Lee, H. Lee, H. Choi, S. Jeon, and J. Hong, "Effective calibration of an endoscope to an optical
tracking system for medical augmented reality," Cogent Engineering, vol. 4, no. 1, p. 1359955,
2017
[208] S. Ma and Z. Zhao, "A New Method of Surgical Tracking System Based on Fiducial Marker," in
Medical Image Understanding and Analysis, Cham, M. Valdés Hernández and V. González-
Castro, Eds., 2017// 2017: Springer International Publishing, pp. 886-896
[209] F. Kral, E. J. Puschban, H. Riechelmann, and W. Freysinger, "Comparison of optical and
electromagnetic tracking for navigated lateral skull base surgery," The International Journal of
Medical Robotics and Computer Assisted Surgery, vol. 9, no. 2, pp. 247-252, 2013
[210] N. Medical, Polaris Tool Design Guide. Ontario, Canada: NDI Medical 2018.
[211] A. Bouchama and J. P. Knochel, "Heat stroke," New England Journal of Medicine, vol. 346, no.
25, pp. 1978-1988, 2002
[212] E. Choudhary and A. Vaidyanathan, "Heat stress illness hospitalizations—Environmental public
health tracking program, 20 states, 2001–2010," Morbidity and Mortality Weekly Report:
Surveillance Summaries, vol. 63, no. 13, pp. 1-10, 2014
[213] P. Larsen and T. Mousel, "Radio‐Frequency Based Detection of Unattended Children to Reduce
In‐Vehicle Heat Stroke Fatalities," in IRCOBI Conference Proceedings, 2017,
[214] E. Lawton, G. Gabb, and H. Pearce, "Environmental heat stroke and long‐term clinical
neurological outcomes: a literature review of case reports and case series 2000–2016," Internal
Medicine Journal, vol. 47, no. S3, pp. 20-20, 2017

186
[215] L. R. Leon and B. G. Helwig, "Heat stroke: role of the systemic inflammatory response," Journal
of applied physiology, vol. 109, no. 6, pp. 1980-1988, 2010
[216] A. S. Ogbomo, C. J. Gronlund, M. S. O’Neill, T. Konen, L. Cameron, and R. Wahl,
"Vulnerability to extreme-heat-associated hospitalization in three counties in Michigan, USA,
2000–2009," International journal of biometeorology, vol. 61, no. 5, pp. 833-843, 2017
[217] A. N. Peiris, S. Jaroudi, and R. Noor, "Heat Stroke," Jama, vol. 318, no. 24, pp. 2503-2503, 2017
[218] S. Shibolet, M. C. Lancaster, and Y. Danon, "Heat stroke: a review," Aviation, space, and
environmental medicine, vol. 47, no. 3, pp. 280-301, 1976
[219] B. C. Davis et al., "Heat stroke leading to acute liver injury & failure: A case series from the
Acute Liver Failure Study Group," Liver International, vol. 37, no. 4, pp. 509-513, 2017
[220] R. Katch et al., "Cold Water Immersion in the Treatment of Exertional Heat Stroke Remains the
Gold Standard at the Falmouth Road Race," Journal of Athletic Training, vol. 52, no. 6, p. S313,
2017
[221] M. A. King, M. D. Ward, C. H. Gabrial, G. N. Audet, B. Adams, and L. R. Leon, "Prior Infection
and Prior Heat Illness as Risk Factors for Exertional Heat Stroke," The FASEB Journal, vol. 31,
no. 1 Supplement, pp. 1018.4-1018.4, 2017
[222] N. Knight, J. Parkin, R. Smith, and C. Kipps, "The Incidence Of Exertional Heat Stroke During
Mass-participation Triathlon Races: Optimising Athlete Safety," Br J Sports Med, vol. 51, no. 4,
pp. 344-345, 2017
[223] K. C. Schellhase, J. Plant, and S. M. Mazerolle, "Athletic Trainers' Attitudes and Perceptions
Regarding Exertional Heat Stroke Before and After an Educational Intervention," Athletic
Training Education Journal, vol. 12, no. 3, pp. 179-187, 2017
[224] T. T. Truxton and K. C. Miller, "Can Temperate-Water Immersion Effectively Reduce Rectal
Temperature in Exertional Heat Stroke? A Critically Appraised Topic," Journal of sport
rehabilitation, vol. 26, no. 5, pp. 447-451, 2017
[225] D. J. Casa, Y. Hosokawa, L. N. Belval, W. M. Adams, and R. L. Stearns, "Preventing death from

187
exertional heat stroke—The long road from evidence to policy," Kinesiology Review, vol. 6, no.
1, pp. 99-109, 2017
[226] C. Chang, M. Lin, and K. Niu, "Reduction of neurological injury by hyperbaric oxygen in
exertional heat stroke rats," Journal of the Neurological Sciences, vol. 381, p. 751, 2017
[227] Jesse. "Three Common Misconceptions About Infrared Thermometers." ThermoWorks.
https://blog.thermoworks.com/2012/03/infrared-thermometry/ (accessed 2018-4-8, 2018).
[228] Y.-F. Lin, T.-T. Liu, C.-H. Hu, C.-C. Chen, and J.-Y. Wang, "Expressions of chemokines and
their receptors in the brain after heat stroke-induced cortical damage," Journal of
neuroimmunology, 2018
[229] C. Mora, C. W. Counsell, C. R. Bielecki, and L. V. Louis, "Twenty-Seven Ways a Heat Wave
Can Kill You:: Deadly Heat in the Era of Climate Change," Circulation: Cardiovascular Quality
and Outcomes, vol. 10, no. 11, p. e004233, 2017
[230] S.-F. Hsu, K.-C. Niu, C.-L. Lin, and M.-T. Lin, "Brain cooling causes attenuation of cerebral
oxidative stress, systemic inflammation, activated coagulation, and tissue ischemia/injury during
heatstroke," Shock, vol. 26, no. 2, pp. 210-220, 2006
[231] J. González-Alonso, C. Teller, S. L. Andersen, F. B. Jensen, T. Hyldig, and B. Nielsen,
"Influence of body temperature on the development of fatigue during prolonged exercise in the
heat," vol. 86, no. 3, pp. 1032-1039, 1999
[232] G. M. Varghese, G. John, K. Thomas, O. C. Abraham, and D. Mathai, "Predictors of multi-organ
dysfunction in heatstroke," Emergency Medicine Journal, vol. 22, no. 3, p. 185, 2005
[233] L. R. Leon and B. G. Helwig, "Heat stroke: Role of the systemic inflammatory response," vol.
109, no. 6, pp. 1980-1988, 2010
[234] A. Uchiyama, T. Hamatani, and T. Higashino, "Estimation of core temperature based on a human
thermal model using a wearable sensor," in 2015 IEEE 4th Global Conference on Consumer
Electronics (GCCE), 27-30 Oct. 2015 2015, pp. 605-609
[235] H. Brinnel and M. J. J. o. T. B. Cabanac, "Tympanic temperature is a core temperature in

188
humans," vol. 14, no. 1, pp. 47-53, 1989
[236] Y. Epstein, W. J. S. j. o. m. Roberts, and s. i. sports, "The pathopysiology of heat stroke: an
integrative view of the final common pathway," vol. 21, no. 6, pp. 742-748, 2011
[237] J. Kravchenko, A. P. Abernethy, M. Fawzy, and H. K. J. A. j. o. p. m. Lyerly, "Minimization of
heatwave morbidity and mortality," vol. 44, no. 3, pp. 274-282, 2013
[238] F. Matos et al., "The use of thermal imaging to monitoring skin temperature during cryotherapy:
a systematic review," vol. 73, pp. 194-203, 2015
[239] R. R. Pryor, D. J. Casa, J. C. Holschen, F. G. O'Connor, and L. W. J. C. P. E. M. Vandermark,
"Exertional heat stroke: strategies for prevention and treatment from the sports field to the
emergency department," vol. 14, no. 4, pp. 267-278, 2013
[240] T. Q. Trung, S. Ramasundaram, B. U. Hwang, and N. E. J. A. M. Lee, "An all‐elastomeric
transparent and stretchable temperature sensor for body‐attachable wearable electronics," vol. 28,
no. 3, pp. 502-509, 2016
[241] J. Stivoric et al., "Non-invasive temperature monitoring device," ed: Google Patents, 2014.
[242] H. Lee et al., "A graphene-based electrochemical device with thermoresponsive microneedles for
diabetes monitoring and therapy," vol. 11, no. 6, p. 566, 2016
[243] S. Amendola, G. Bovesecchi, P. Coppa, and G. Marrocco, "Thermal characterization of
epidermal RFID sensor for skin temperature measurements," in Antennas and Propagation
(APSURSI), 2016 IEEE International Symposium on, 2016: IEEE, pp. 461-462
[244] A. Farzana. "The Physics Factbook." https://hypertextbook.com/facts/2001/AbantyFarzana.shtml
(accessed 2-5-2019, 2019).
[245] S.-H. Kim, H.-J. Suh, J.-Z. Cui, Y.-S. Gal, S.-H. Jin, and K. Koh, "Crystalline-state
photochromism and thermochromism of new spiroxazine," Dyes and Pigments, vol. 53, no. 3, pp.
251-256, 2002/06/01/ 2002
[246] F. Azizian, A. J. Field, and B. M. Heron, "Reductive alkylation of aminofluorans: A simple route

189
to intrinsically thermochromic fluorans," Dyes and Pigments, vol. 99, no. 2, pp. 432-439,
2013/11/01/ 2013
[247] L. C. Glover and E. F. Lopez, "Method for coating a polymeric article with a thermochromic
paint," ed: Google Patents, 1980.
[248] K. Senga, K. Fujita, and S. Koide, "Thermally color-developing reversibly thermochromic
pigment," ed: Google Patents, 2008.
[249] L. C. Glover and E. F. Lopez, "Thermochromic paint for use on plastic substrates," ed: Google
Patents, 1978.
[250] A. S. University. "Facts About Your Skin - Temperatures in and on the human body."
http://www.healthyheating.com/Definitions/facts_about_skin.htm#.XBcoQttKiM8 (accessed
2018-12-16, 2018).
[251] A. Jemal, R. Siegel, J. Xu, and E. Ward, "Cancer statistics, 2010," (in eng), CA: a cancer journal
for clinicians, vol. 60, no. 5, pp. 277-300, Sep-Oct 2010
[252] S. Xu et al., "Real-time MRI-TRUS fusion for guidance of targeted prostate biopsies," Comput
Aided Surg, vol. 13, no. 5, pp. 255-264, 2008
[253] A. R. Rastinehad et al., "Improving detection of clinically significant prostate cancer: magnetic
resonance imaging/transrectal ultrasound fusion guided prostate biopsy," J Urol, vol. 191, no. 6,
pp. 1749-1754, 2014
[254] P. Pepe, A. Garufi, G. Priolo, and M. Pennisi, "Can MRI/TRUS fusion targeted biopsy replace
saturation prostate biopsy in the re-evaluation of men in active surveillance?," World J Urol, vol.
34, no. 9, pp. 1249-1253, 2016
[255] G. Reusz, P. Sarkany, J. Gal, and A. Csomos, "Needle-related ultrasound artifacts and their
importance in anaesthetic practice," Br J Anaesth, vol. 112, no. 5, pp. 794-802, 2014
[256] Y. Chen, S. Zhang, F. Gao, Y. Chen, J. He, and T. Qi, "TRUS/MRI Fusion-Guided Prostate
Biopsy Based on Improved Intracavitary Markers," in Proceedings of the International
Conference on Bioinformatics and Computational Intelligence, 2017: ACM, pp. 6-10

190
[257] W. Venderink, T. M. Govers, M. de Rooij, J. J. Fütterer, and J. M. Sedelaar, "Cost-effectiveness
comparison of imaging-guided prostate biopsy techniques: systematic transrectal ultrasound,
direct in-bore MRI, and image fusion," AJR Am J Roentgenol, vol. 208, no. 5, pp. 1058-1063,
2017
[258] C. Arsov et al., "Prospective randomized trial comparing magnetic resonance imaging (MRI)-
guided in-bore biopsy to MRI-ultrasound fusion and transrectal ultrasound-guided prostate biopsy
in patients with prior negative biopsies," European urology, vol. 68, no. 4, pp. 713-720, 2015
[259] F. Cornud et al., "Precision Matters in MR Imaging–targeted Prostate Biopsies: Evidence from a
Prospective Study of Cognitive and Elastic Fusion Registration Transrectal Biopsies," Radiology,
vol. 287, no. 2, pp. 534-542, 2018
[260] D. Hausmann et al., "Prostate cancer detection among readers with different degree of experience
using ultra-high b-value diffusion-weighted Imaging: Is a non-contrast protocol sufficient to
detect significant cancer?," Eur Radiol, journal article vol. 28, no. 2, pp. 869-876, February 01
2018
[261] V. Kasivisvanathan et al., "MRI-Targeted or Standard Biopsy for Prostate-Cancer Diagnosis," N
Engl J Med, vol. 378, no. 19, pp. 1767-1777, 2018
[262] K. Engelhard, H. P. Hollenbach, B. Kiefer, A. Winkel, K. Goeb, and D. Engehausen, "Prostate
biopsy in the supine position in a standard 1.5-T scanner under real time MR-imaging control
using a MR-compatible endorectal biopsy device," (in eng), Eur Radiol, vol. 16, no. 6, pp. 1237-
43, Jun 2006
[263] D. Beyersdorff, A. Winkel, B. Hamm, S. Lenk, S. A. Loening, and M. Taupitz, "MR Imaging–
guided Prostate Biopsy with a Closed MR Unit at 1.5 T: Initial Results," Radiology, vol. 234, no.
2, pp. 576-581, 2005
[264] A. G. Anastasiadis et al., "MRI-guided biopsy of the prostate increases diagnostic performance in
men with elevated or increasing PSA levels after previous negative TRUS biopsies," (in eng),
European urology, vol. 50, no. 4, pp. 738-48; discussion 748-9, Oct 2006

191
[265] G. Fichtinger, A. Krieger, R. C. Susil, A. Tanacs, L. L. Whitcomb, and E. Atalar, "Transrectal
Prostate Biopsy Inside Closed MRI Scanner with Remote Actuation, under Real-Time Image
Guidance," in Medical Image Computing and Computer-Assisted Intervention — MICCAI 2002:
5th International Conference Tokyo, Japan, September 25–28, 2002 Proceedings, Part I, T. Dohi
and R. Kikinis Eds. Berlin, Heidelberg: Springer Berlin Heidelberg, 2002, pp. 91-98.
[266] A. Krieger et al., "Design of a novel MRI compatible manipulator for image guided prostate
interventions," (in eng), IEEE transactions on bio-medical engineering, vol. 52, no. 2, pp. 306-
13, Feb 2005
[267] R. C. Susil et al., "Transrectal Prostate Biopsy and Fiducial Marker Placement in a Standard 1.5T
Magnetic Resonance Imaging Scanner," J Urol, vol. 175, no. 1, pp. 113-120, 2006
[268] S. P. DiMaio et al., "A System for MRI-guided Prostate Interventions," in The First IEEE/RAS-
EMBS International Conference on Biomedical Robotics and Biomechatronics, 20-22 Feb. 2006
2006, pp. 68-73
[269] S. P. DiMaio et al., "Robot-assisted needle placement in open MRI: system architecture,
integration and validation," (in eng), Comput Aided Surg, vol. 12, no. 1, pp. 15-24, Jan 2007
[270] N. Hata et al., "MR Imaging-guided Prostate Biopsy with Surgical Navigation Software: Device
Validation and Feasibility," Radiology, vol. 220, no. 1, pp. 263-268, 2001
[271] D. M. Pinkstaff, T. C. Igel, S. P. Petrou, G. A. Broderick, M. J. Wehle, and P. R. Young,
"Systematic transperineal ultrasound-guided template biopsy of the prostate: three-year
experience," Urology, vol. 65, no. 4, pp. 735-739, 2005
[272] B. E. Ayres et al., "The role of transperineal template prostate biopsies in restaging men with
prostate cancer managed by active surveillance," BJU int, vol. 109, no. 8, pp. 1170-1176, 2012
[273] Civco. "Disposable Template Grids." Civco medical solutions.
http://civco.com/mmi/ultrasound/positioning/brachytherapy/disposable-template-grids-
PID5150.htm (accessed 5-1-2018, 2018).
[274] Noras. "Biopsy Unit for GE 8-Channel Breast Coil." Noras MRI products.

192
http://www.noras.de/en/mri-accessories/biopsy-units/bu-for-ge-8-ch-breast-coil/ (accessed sept 6,
2017).
[275] Webb. "THE FAST FIND GRID." Webb medical. http://www.fastfindgrid.com/ (accessed 10-3-
2018, 2018).
[276] G. P. Haas, N. Delongchamps, O. W. Brawley, C. Y. Wang, and G. de la Roza, "The worldwide
epidemiology of prostate cancer: perspectives from autopsy studies," (in eng), The Canadian
journal of urology, vol. 15, no. 1, pp. 3866-71, Feb 2008
[277] P. Pepe, A. Garufi, G. D. Priolo, A. Galia, F. Fraggetta, and M. Pennisi, "Is it time to perform
only MRI targeted cores? Our experience in 1032 men submitted to prostate biopsy," J Urol, vol.
200, no. 4, pp. 774-778, 2018
[278] F. Cornud, J. Bomers, J. Futterer, S. Ghai, J. Reijnen, and C. Tempany, "MR imaging-guided
prostate interventional imaging: Ready for a clinical use?," Diagn Interv Imaging, 2018
[279] S. Pahwa, N. K. Schiltz, L. E. Ponsky, Z. Lu, M. A. Griswold, and V. Gulani, "Cost-effectiveness
of MR imaging–guided strategies for detection of prostate cancer in biopsy-naive men,"
Radiology, vol. 285, no. 1, pp. 157-166, 2017
[280] T. H. Kuru et al., "How to Perform Image-guided Prostate Biopsy: In-bore and Fusion
Approaches," Eur Urol Focus, vol. 2, no. 2, p. 151, 2016
[281] A. Sciarra et al., "Value of magnetic resonance spectroscopy imaging and dynamic contrast-
enhanced imaging for detecting prostate cancer foci in men with prior negative biopsy," Clin
Cancer Res, pp. 1078-0432. CCR-09-2195, 2010
[282] S. Vourganti et al., "Multiparametric magnetic resonance imaging and ultrasound fusion biopsy
detect prostate cancer in patients with prior negative transrectal ultrasound biopsies," J Urol, vol.
188, no. 6, pp. 2152-2157, 2012
[283] A. V. Taira et al., "Performance of transperineal template-guided mapping biopsy in detecting
prostate cancer in the initial and repeat biopsy setting," Prostate Cancer Prostatic Dis, Original
Article vol. 13, p. 71, 09/29/online 2009

193
[284] P. Moreira et al., "The MIRIAM Robot: a novel robotic system for MR-guided needle insertion in
the prostate," J Med Robot Res, vol. 2, no. 04, p. 1750006, 2017
[285] G. Srimathveeravalli et al., "MRI‐safe robot for targeted transrectal prostate biopsy: animal
experiments," BJU int, vol. 113, no. 6, pp. 977-985, 2014
[286] D. Sia, A. Villanueva, S. L. Friedman, and J. M. Llovet, "Liver cancer cell of origin, molecular
class, and effects on patient prognosis," Gastroenterology, vol. 152, no. 4, pp. 745-761, 2017
[287] H. Takahashi, B. Kahramangil, E. Kose, and E. Berber, "A comparison of microwave
thermosphere versus radiofrequency thermal ablation in the treatment of colorectal liver
metastases," HPB, vol. 20, no. 12, pp. 1157-1162, 2018
[288] A. M. Dietzek, R. Ahmad, and M. N. Richard, "Radiofrequency Thermal Ablation: Current
Data," in Atlas of Endovascular Venous Surgery: Elsevier, 2019, pp. 215-231.
[289] I. Roberto et al., "Radiofrequency thermal ablation of renal graft neoplasms: A literature review,"
Transplantation Reviews, 2019
[290] M. J. Norton and N. D. Ischy, "Apparatus and method for minimally invasive surgery," ed:
Google Patents, 2017.
[291] T. T. Kim, J. P. Johnson, R. Pashman, and D. Drazin, "Minimally invasive spinal surgery with
intraoperative image-guided navigation," BioMed research international, vol. 2016, 2016
[292] Y. Wang et al., "Mandibular reconstruction with the vascularized fibula flap: comparison of
virtual planning surgery and conventional surgery," International journal of oral and
maxillofacial surgery, vol. 45, no. 11, pp. 1400-1405, 2016
[293] P. Lu et al., "Systemic chemotherapy and survival in patients with metastatic low‐grade
appendiceal mucinous adenocarcinoma," Journal of Surgical Oncology, vol. 120, no. 3, pp. 446-
451, 2019
[294] W. U. Shipley et al., "Radiation with or without antiandrogen therapy in recurrent prostate
cancer," New England Journal of Medicine, vol. 376, no. 5, pp. 417-428, 2017

194
[295] B. Zhou et al., "PEGylated polyethylenimine-entrapped gold nanoparticles modified with folic
acid for targeted tumor CT imaging," Colloids and Surfaces B: Biointerfaces, vol. 140, pp. 489-
496, 2016
[296] Y. Zhao et al., "Tumor-targeted and clearable human protein-based MRI nanoprobes," Nano
letters, vol. 17, no. 7, pp. 4096-4100, 2017
[297] M. Ahmed et al., "Hepatic Radiofrequency Ablation-induced Stimulation of Distant Tumor
Growth Is Suppressed by c-Met Inhibition," (in eng), Radiology, vol. 279, no. 1, pp. 103-117,
2016
[298] J. Izaaryene et al., "Pathological effects of lung radiofrequency ablation that contribute to
pneumothorax, using a porcine model," (in eng), Int J Hyperthermia, vol. 33, no. 7, pp. 713-716,
Nov 2017
[299] S. P. DiMaio and S. E. Salcudean, "Needle steering and motion planning in soft tissues," IEEE
Transactions on Biomedical Engineering, vol. 52, no. 6, pp. 965-974, 2005
[300] K. Cleary et al., "Precision placement of instruments for minimally invasive procedures using a
“needle driver” robot," The International Journal of Medical Robotics and Computer Assisted
Surgery, vol. 1, no. 2, pp. 40-47, 2005
[301] E. Ben-David, M. Shochat, I. Roth, I. Nissenbaum, J. Sosna, and S. N. Goldberg, "Evaluation of a
CT-Guided Robotic System for Precise Percutaneous Needle Insertion," Journal of Vascular and
Interventional Radiology, vol. 29, no. 10, pp. 1440-1446, 2018/10/01/ 2018
[302] P. Bruners et al., "Electromagnetic tracking for CT-guided spine interventions: phantom, ex-vivo
and in-vivo results," European Radiology, vol. 19, no. 4, pp. 990-994, 2009/04/01 2009
[303] Civco. "VirtuTRAX™ Instrument Navigator." Civco. https://www.civco.com/catalog/fusion-
tracking-technology/virtutrax-instrument-navigator/ (accessed 2-18-2020, 2020).
[304] NeoRad. "SimpliCT." NeoRad. https://www.neorad.no/products/simplict-for-ct-and-pet-ct
(accessed 2-18-2020, 2020).
[305] M. Abayazid, T. Kato, S. G. Silverman, and N. Hata, "Using needle orientation sensing as

195
surrogate signal for respiratory motion estimation in percutaneous interventions," (in eng),
International journal of computer assisted radiology and surgery, vol. 13, no. 1, pp. 125-133,
2018
[306] E. Basafa, M. Hoßbach, and P. J. Stolka, "Fast, Intuitive, Vision-Based: Performance Metrics for
Visual Registration, Instrument Guidance, and Image Fusion," in Clinical Image-Based
Procedures. Translational Research in Medical Imaging, Cham, R. Shekhar et al., Eds., 2016//
2016: Springer International Publishing, pp. 9-17
[307] Y. Koethe, S. Xu, G. Velusamy, B. J. Wood, and A. M. Venkatesan, "Accuracy and efficacy of
percutaneous biopsy and ablation using robotic assistance under computed tomography guidance:
a phantom study," European Radiology, vol. 24, no. 3, pp. 723-730, 2014/03/01 2014
[308] L. Appelbaum, L. Solbiati, J. Sosna, Y. Nissenbaum, N. Greenbaum, and S. N. Goldberg,
"Evaluation of an Electromagnetic Image-Fusion Navigation System for Biopsy of Small
Lesions: Assessment of Accuracy in an In Vivo Swine Model," Academic radiology, vol. 20, no.
2, pp. 209-217, 2013/02/01/ 2013
[309] C. Roberts, W. Morrison, D. Deely, A. Zoga, G. Koulouris, and C. Winalski, "Use of a novel
percutaneous biopsy localization device: initial musculoskeletal experience," Skeletal radiology,
vol. 36, no. 1, pp. 53-57, 2007
[310] A. Magnusson, E. Radecka, M. Lönnemark, and H. Raland, "Computed-tomography-guided
punctures using a new guidance device," Acta Radiologica, vol. 46, no. 5, pp. 505-509,
2005/08/01 2005
[311] A. Behneke, M. Burwinkel, and N. Behneke, "Factors influencing transfer accuracy of cone beam
CT‐derived template‐based implant placement," Clinical oral implants research, vol. 23, no. 4,
pp. 416-423, 2012
[312] G. Widmann, R. Widmann, E. Widmann, W. Jaschke, and R. Bale, "Use of a surgical navigation
system for CT-guided template production," International Journal of Oral & Maxillofacial

196
Implants, vol. 22, no. 1, 2007
[313] G. Eggers, J. Mühling, and R. Marmulla, "Template-Based Registration for Image-Guided
Maxillofacial Surgery," Journal of Oral and Maxillofacial Surgery, vol. 63, no. 9, pp. 1330-1336,
2005/09/01/ 2005
[314] W. G. Campbell, M. Miften, and B. L. Jones, "Automated target tracking in kilovoltage images
using dynamic templates of fiducial marker clusters," Medical physics, vol. 44, no. 2, pp. 364-
374, 2017
[315] M. V. Wyawahare, P. M. Patil, and H. K. Abhyankar, "Image registration techniques: an
overview," International Journal of Signal Processing, Image Processing and Pattern
Recognition, vol. 2, no. 3, pp. 11-28, 2009
[316] M. C. Bernardes, B. V. Adorno, P. Poignet, and G. A. Borges, "Robot-assisted automatic
insertion of steerable needles with closed-loop imaging feedback and intraoperative trajectory
replanning," Mechatronics, vol. 23, no. 6, pp. 630-645, 2013/09/01/ 2013
[317] J. R. Haaga and R. J. Alfidi, "Precise biopsy localization by computer tomography," Radiology,
vol. 118, no. 3, pp. 603-7, 1976
[318] J. R. Haaga, R. J. Alfidi, T. R. Havrilla, A. M. Cooperman, F. E. Seidelmann, and N. E. Reich,
"CT detection and aspiration of abdominal abscesses," AJR, vol. 128, no. 3, pp. 465-74, 1977
[319] G. E. Wile, J. R. Leyendecker, K. A. Krehbiel, R. B. Dyer, and R. J. Zagoria, "CT and MR
imaging after imaging-guided thermal ablation of renal neoplasms," Radiographics, vol. 27, no.
2, pp. 325-39, 2007
[320] A. Gupta et al., "Computerized tomography guided percutaneous renal cryoablation with the
patient under conscious sedation: initial clinical experience," The Journal of urology, vol. 175,
no. 2, pp. 447-453, 2006
[321] F. J. Wolf, D. J. Grand, J. T. Machan, T. A. DiPetrillo, W. W. Mayo-Smith, and D. E. Dupuy,
"Microwave Ablation of Lung Malignancies: Effectiveness, CT Findings, and Safety in 50
Patients," Radiology, vol. 247, no. 3, pp. 871-879, 2008

197
[322] Z. Amin et al., "Hepatic metastases: interstitial laser photocoagulation with real-time US
monitoring and dynamic CT evaluation of treatment," Radiology, vol. 187, no. 2, pp. 339-347,
1993
[323] E. R. Ryan et al., "Split-Dose Technique for FDG PET/CT–guided Percutaneous Ablation: A
Method to Facilitate Lesion Targeting and to Provide Immediate Assessment of Treatment
Effectiveness," Radiology, vol. 268, no. 1, pp. 288-295, 2013
[324] J. J. Froelich, B. Saar, M. Hoppe, N. Ishaque, E. M. Walthers, and J. Regn, "Real-time Ct-
fluoroscopy for guidance of percutaneous drainage procedures," J Vasc Interv Radiol, vol. 9, no.
5, pp. 735-40, 1998
[325] S. G. Silverman, K. Tuncali, D. F. Adams, R. D. Nawfel, K. H. Zou, and P. F. Judy, "CT
fluoroscopy-guided abdominal interventions: techniques, results, and radiation exposure,"
Radiology, vol. 212, no. 3, pp. 673-81, 1999
[326] B. Daly and P. A. Templeton, "Real-time CT fluoroscopy: evolution of an interventional tool,"
Radiology, vol. 211, no. 2, pp. 309-15, 1999
[327] L. Tselikas et al., "Percutaneous Bone Biopsies: Comparison between Flat-Panel Cone-Beam CT
and CT-Scan Guidance," CardioVascular and Interventional Radiology, journal article vol. 38,
no. 1, pp. 167-176, February 01 2015
[328] K. T. Brown, G. I. Getrajdman, and J. F. Botet, "Clinical trial of the Bard CT guide system," (in
eng), J Vasc Interv Radiol, vol. 6, no. 3, pp. 405-10, May-Jun 1995
[329] P. R. Frederick, T. H. Brown, M. H. Miller, A. L. Bahr, and K. H. Taylor, "A light-guidance
system to be used for CT-guided biopsy," (in eng), Radiology, vol. 154, no. 2, pp. 535-6, Feb
1985
[330] A. Gangi, B. Kastler, J. M. Arhan, A. Klinkert, J. M. Grampp, and J. L. Dietemann, "A compact
laser beam guidance system for interventional CT," (in eng), Journal of computer assisted
tomography, vol. 18, no. 2, pp. 326-8, Mar-Apr 1994
[331] W. Hruby and H. Muschik, "Belt device for simplified CT-guided puncture and biopsy: a
198
technical note," (in eng), Cardiovasc Intervent Radiol, vol. 10, no. 5, pp. 301-2, 1987
[332] V. Jacobi, A. Thalhammer, and J. Kirchner, "Value of a laser guidance system for CT
interventions: a phantom study," (in eng), Eur Radiol, vol. 9, no. 1, pp. 137-40, 1999
[333] R. Kloeppel, T. Weisse, F. Deckert, W. Wilke, and S. Pecher, "CT-guided intervention using a
patient laser marker system," (in eng), Eur Radiol, vol. 10, no. 6, pp. 1010-4, 2000
[334] Y. Miaux et al., "Laser guidance system for CT-guided procedures," (in eng), Radiology, vol.
194, no. 1, pp. 282-4, Jan 1995
[335] C. Ozdoba, K. Voigt, and F. Nusslin, "New device for CT-targeted percutaneous punctures," (in
eng), Radiology, vol. 180, no. 2, pp. 576-8, Aug 1991
[336] F. S. Pereles, M. Baker, R. Baldwin, E. Krupinski, and E. C. Unger, "Accuracy of CT biopsy:
laser guidance versus conventional freehand techniques," (in eng), Academic radiology, vol. 5,
no. 11, pp. 766-70, Nov 1998
[337] F. Wunschik, M. Georgi, and O. Pastyr, "Stereotactic biopsy using computed tomography," (in
eng), Journal of computer assisted tomography, vol. 8, no. 1, pp. 32-7, Feb 1984
[338] G. Fichtinger et al., "Robotic assistance for ultrasound-guided prostate brachytherapy," (in eng),
Medical image analysis, vol. 12, no. 5, pp. 535-45, Oct 2008
[339] N. Abolhassani, R. V. Patel, and F. Ayazi, "Minimization of needle deflection in robot-assisted
percutaneous therapy," (in eng), Int J Med Robot, vol. 3, no. 2, pp. 140-8, Jun 2007
[340] A. Chellathurai, S. Kanhirat, K. Chokkappan, T. S. Swaminathan, and N. Kulasekaran,
"Technical note: CT-guided biopsy of lung masses using an automated guiding apparatus," (in
eng), The Indian journal of radiology & imaging, vol. 19, no. 3, pp. 206-7, Jul-Sep 2009
[341] G. Onik et al., "CT body stereotaxis: an aid for CT-guided biopsies," (in eng), AJR Am J
Roentgenol, vol. 146, no. 1, pp. 163-8, Jan 1986
[342] G. Onik et al., "CT-guided aspirations for the body: comparison of hand guidance with
stereotaxis," (in eng), Radiology, vol. 166, no. 2, pp. 389-94, Feb 1988
[343] A. M. Palestrant, "Comprehensive approach to CT-guided procedures with a hand-held guidance
199
device," (in eng), Radiology, vol. 174, no. 1, pp. 270-2, Jan 1990
[344] G. D. Reyes, "A guidance device for CT-guided procedures," (in eng), Radiology, vol. 176, no. 3,
pp. 863-4, Sep 1990
[345] M. H. Howard and R. C. Nelson, "An electronic device for needle placement during
sonographically guided percutaneous intervention," Radiology, vol. 218, no. 3, pp. 905-911, 2001
[346] G. A. Krombach and A. Mahnken, "US-guided nephrostomy with the aid of a magnetic field-
based navigation device in the porcine pelvicaliceal system," J Vasc Interv Radiol, vol. 12, no. 5,
pp. 623-628, 2001
[347] S. Hassfeld and J. Mühling, "Comparative examination of the accuracy of a mechanical and an
optical system in CT and MRT based instrument navigation," International Journal of Oral and
Maxillofacial Surgery, vol. 29, no. 6, pp. 400-407,
[348] M. Jakopec, F. y. Baena, and S. J. Harris, "The hands-on orthopaedic robot "Acrobot": Early
clinical trials of total knee replacement surgery," IEEE Transactions on Robotics, vol. 19, no. 5,
2003
[349] J. Cobb, J. Henckel, P. Gomes, and S. Harris, "Hands-on robotic unicompartmental knee
replacement," Bone & Joint, 2006
[350] S. Bartling, M. Kachelrieß, J. Kuntz, R. Gupta, C. Walsh, and I. S. Wang, CT-Guided
Interventions: Current Practice and Future Directions. 2014.
[351] NeoRad. "SimpliCT." http://neorad.no/products_1/simplict_for_ct_and_pet_ct/ (accessed
10/16/2017, 2017).
[352] A. S. T. S. GmbH. "Quick and uncomplicated CT-guided interventions on the highest level with
3D-LNS!" http://www.amedo-gmbh.com/index.php/en/ (accessed 10/16/2017, 2017).
[353] CAScination. "CAS-ONE Liver." http://www.cascination.com/products/cas-one-liver/ (accessed
10/16/2017, 2017).
[354] P. H. P. Ltd. "MAXIO is a USFDA 510(k) approved device."
http://www.perfinthealthcare.com/MaxioOverview.asp (accessed 10/16/2017, 2017).

200
[355] K. P. N.V. "EPIQ PercuNav." https://www.philips.co.in/healthcare/product/HCNOCTN150/epiq-
percunav-premium-fusion-and-navigation (accessed 10/16/2017, 2017).
[356] E. C. Mbalisike, T. J. Vogl, S. Zangos, K. Eichler, P. Balakrishnan, and J. Paul, "Image-guided
microwave thermoablation of hepatic tumours using novel robotic guidance: an early
experience," (in eng), Eur Radiol, vol. 25, no. 2, pp. 454-62, Feb 2015
[357] H. Dou, S. Jiang, Z. Yang, L. Sun, X. Ma, and B. Huo, "Design and validation of a CT-guided
robotic system for lung cancer brachytherapy," (in eng), Medical physics, vol. 44, no. 9, pp. 4828-
4837, Sep 2017
[358] J. Kettenbach, L. Kara, G. Toporek, M. Fuerst, and G. Kronreif, "A robotic needle-positioning
and guidance system for CT-guided puncture: Ex vivo results," (in eng), Minimally invasive
therapy & allied technologies : MITAT : official journal of the Society for Minimally Invasive
Therapy, vol. 23, no. 5, pp. 271-8, Oct 2014
[359] R. M. Martinez et al., "CT-Guided, Minimally Invasive, Postmortem Needle Biopsy Using the B-
Rob II Needle-Positioning Robot," Journal of Forensic Sciences, vol. 59, no. 2, pp. 517-521,
2014
[360] S. C. Leschka, D. Babic, S. El Shikh, C. Wossmann, M. Schumacher, and C. A. Taschner, "C-
arm cone beam computed tomography needle path overlay for image-guided procedures of the
spine and pelvis," (in eng), Neuroradiology, vol. 54, no. 3, pp. 215-23, Mar 2012
[361] B. Schulz et al., "Accuracy and speed of robotic assisted needle interventions using a modern
cone beam computed tomography intervention suite: a phantom study," European Radiology,
journal article vol. 23, no. 1, pp. 198-204, January 01 2013
[362] C. Moser, J. Becker, M. Deli, M. Busch, M. Boehme, and D. H. W. Groenemeyer, "A novel Laser
Navigation System reduces radiation exposure and improves accuracy and workflow of CT-
guided spinal interventions: A prospective, randomized, controlled, clinical trial in comparison to
conventional freehand puncture," European Journal of Radiology, vol. 82, no. 4, pp. 627-632,
2013/04/01/ 2013

201
[363] R. F. Grasso et al., "Percutaneous lung biopsy: comparison between an augmented reality CT
navigation system and standard CT-guided technique," International Journal of Computer
Assisted Radiology and Surgery, journal article vol. 8, no. 5, pp. 837-848, September 01 2013
[364] N. D. Glossop, "Advantages of Optical Compared with Electromagnetic Tracking," JBJS, vol. 91,
no. Supplement_1, pp. 23-28, 2009
[365] T. Penzkofer et al., "Free-hand CT-based electromagnetically guided interventions: accuracy,
efficiency and dose usage," (in eng), Minimally invasive therapy & allied technologies : MITAT :
official journal of the Society for Minimally Invasive Therapy, vol. 20, no. 4, pp. 226-33, Jul 2011
[366] E. Kim, T. J. Ward, R. S. Patel, A. M. Fischman, S. Nowakowski, and R. A. Lookstein, "CT-
guided liver biopsy with electromagnetic tracking: results from a single-center prospective
randomized controlled trial," (in eng), AJR Am J Roentgenol, vol. 203, no. 6, pp. W715-23, Dec
2014
[367] M. Hallett, "The neurophysiology of dystonia," Archives of Neurology, vol. 55, no. 5, pp. 601-
603, 1998
[368] G. Gex, J. A. Pralong, C. Combescure, L. Seijo, T. Rochat, and P. M. Soccal, "Diagnostic Yield
and Safety of Electromagnetic Navigation Bronchoscopy for Lung Nodules: A Systematic
Review and Meta-Analysis," Respiration, vol. 87, no. 2, pp. 165-176, 2014
[369] E. Machida, M. Cao, T. Murao, and H. Hashimoto, "Human motion tracking of mobile robot
with Kinect 3D sensor," in 2012 Proceedings of SICE Annual Conference (SICE), 2012: IEEE,
pp. 2207-2211
[370] D. Murray and A. Basu, "Motion tracking with an active camera," IEEE transactions on pattern
analysis and machine intelligence, vol. 16, no. 5, pp. 449-459, 1994
[371] J.-H. Zhang, P. Li, C.-C. Jin, W.-A. Zhang, and S. Liu, "A Novel Adaptive Kalman Filtering
Approach to Human Motion Tracking with Magnetic-Inertial Sensors," IEEE Transactions on
Industrial Electronics, 2019
[372] C.-Y. Chang et al., "Towards pervasive physical rehabilitation using Microsoft Kinect," in 2012

202
6th international conference on pervasive computing technologies for healthcare
(PervasiveHealth) and workshops, 2012: IEEE, pp. 159-162
[373] W. Zhao, M. A. Reinthal, D. D. Espy, and X. Luo, "Rule-based human motion tracking for
rehabilitation exercises: Realtime assessment, feedback, and guidance," IEEE Access, vol. 5, pp.
21382-21394, 2017
[374] M. R. Hayden, Huntington’s chorea. Springer Science & Business Media, 2012.
[375] A. E. Lang and A. M. Lozano, "Parkinson's disease," New England Journal of Medicine, vol. 339,
no. 16, pp. 1130-1143, 1998
[376] D. L. Radder, I. H. Sturkenboom, M. van Nimwegen, S. H. Keus, B. R. Bloem, and N. M. de
Vries, "Physical therapy and occupational therapy in Parkinson's disease," International Journal
of Neuroscience, vol. 127, no. 10, pp. 930-943, 2017
[377] D. Tarsy, "Treatment of Parkinson disease: a 64-year-old man with motor complications of
advanced Parkinson disease," (in eng), The Journal of the American Medical Association, vol.
307, no. 21, pp. 2305-14, Jun 6 2012
[378] H. Ren and P. Kazanzides, "Investigation of Attitude Tracking Using an Integrated Inertial and
Magnetic Navigation System for Hand-Held Surgical Instruments," IEEE/ASME Transactions on
Mechatronics, vol. 17, no. 2, pp. 210-217, 2012
[379] H. Guo, M. Uradzinski, H. Yin, and M. Yu, "Indoor positioning based on foot-mounted IMU,"
Bulletin of the Polish Academy of Sciences Technical Sciences, vol. 63, no. 3, pp. 629-634, 2015
[380] R. Sun, R. G. Aldunate, and J. J. Sosnoff, "The Validity of a Mixed Reality-Based Automated
Functional Mobility Assessment," Sensors, vol. 19, no. 9, p. 2183, 2019
[381] T. Miyatake et al., "Biomechanical analysis and inertial sensing of ankle joint while stepping on
an unanticipated bump," in Wearable Robotics: Challenges and Trends: Springer, 2017, pp. 343-
347.
[382] S. Kobashi, Y. Tsumori, S. Imawaki, S. Yoshiya, and Y. Hata, "Wearable knee kinematics
monitoring system of MARG sensor and pressure sensor systems," in 2009 IEEE International
203
Conference on System of Systems Engineering (SoSE), 2009: IEEE, pp. 1-6
[383] M. Mundt et al., "Assessment of the measurement accuracy of inertial sensors during different
tasks of daily living," Journal of Biomechanics, vol. 84, pp. 81-86, 2019/02/14/ 2019
[384] R. Li, C. M. Modlesky, and Z. T. H. Tse, "Smartphone-enabled Trackers for Lower-body
Monitoring," in 2019 International Symposium on Medical Robotics (ISMR), 3-5 April 2019
2019, pp. 1-5
[385] W. Roush. "an Tibion’s Bionic Leg Rewire Stroke Victims’ Brains?" Xconomy.
https://xconomy.com/san-francisco/2010/12/13/can-tibions-bionic-leg-rewire-stroke-victims-
brains/ (accessed 3-8-2020, 2020).
[386] V. Wiwanitkit, "Rehabilitation Robotics: Cost Effectiveness Issue," Journal of Rehabilitation
Robotics, vol. 4, p. 1, 2016
[387] R. Lloréns, E. Noé, C. Colomer, and M. Alcañiz, "Effectiveness, usability, and cost-benefit of a
virtual reality–based telerehabilitation program for balance recovery after stroke: A randomized
controlled trial," Archives of physical medicine and rehabilitation, vol. 96, no. 3, pp. 418-425. e2,
2015
[388] C. Zirbel, X. Zhang, and C. Hughes, "The VRehab System: A Low-Cost Mobile Virtual Reality
System for Post-Stroke Upper Limb Rehabilitation for Medically Underserved Populations," in
2018 IEEE Global Humanitarian Technology Conference (GHTC), 2018: IEEE, pp. 1-8
[389] M. motion. "Optical Motion Capture Systems." META motion. https://metamotion.com/motion-
capture/optical-motion-capture-1.htm (accessed 3-8-2020, 2020).
[390] H. Morse, L. Biggart, V. Pomeroy, and S. Rossit, "Virtual reality telerehabilitation for spatial
neglect post-stroke: perspectives from stroke survivors, carers and clinicians," medRxiv, p.
2020.01.07.20016782, 2020
[391] NDI. "Polaris optical tracking systems." NDI. http://www.ndigital.com/medical/wp-
content/uploads/sites/4/2013/12/Polaris.pdf (accessed 3-8-2020, 2020).
[392] N. Abolhassani, R. Patel, and M. Moallem, "Needle insertion into soft tissue: A survey," Medical

204
Engineering & Physics, vol. 29, no. 4, pp. 413-431, 2007/05/01/ 2007
[393] S. A. Yoganathan, K. J. Maria Das, A. Agarwal, and S. Kumar, "Magnitude, Impact, and
Management of Respiration-induced Target Motion in Radiotherapy Treatment: A
Comprehensive Review," (in eng), J Med Phys, vol. 42, no. 3, pp. 101-115, Jul-Sep 2017
[394] S. Y. Ko and F. R. y. Baena, "Toward a Miniaturized Needle Steering System With Path Planning
for Obstacle Avoidance," IEEE Transactions on Biomedical Engineering, vol. 60, no. 4, pp. 910-
917, 2013
[395] J. Ma and G. E. Okudan Kremer, "A Modular Product Design Approach With Key Components
Consideration to Improve Sustainability," 2014. [Online]. Available:
https://doi.org/10.1115/DETC2014-35091.
[396] S. Polinder, J. Haagsma, M. Panneman, A. Scholten, M. Brugmans, and E. Van Beeck, "The
economic burden of injury: Health care and productivity costs of injuries in the Netherlands,"
Accident Analysis & Prevention, vol. 93, pp. 92-100, 2016/08/01/ 2016

205
APPENDIX
LIST OF PUBLICATIONS
A. Journal Papers (published)
1. Rui Li, Sheng Xu, William F Pritchard, John W Karanian, Venkatesh P Krishnasamy,
Bradford J Wood, Zion Tsz Ho Tse, “AngleNav: MEMS Tracker to Facilitate CT-Guided
Puncture”, Annals of Biomedical Engineering, Volume 46, pages 452-463, March 2018.
2. Rui Li, Sheng Xu, Ivane Bakhutashvili, Ismail B Turkbey, Peter L Choyke, Peter A Pinto,
Bradford Wood, Zion Tsz Ho Tse, “Template for MR visualization and needle targeting”,
Annals of Biomedical Engineering, Volume 46, Page 1-13, December 2018.
3. Rui Li, Aaron Smith, Harshitha Tadinada, Hovet Sierra, Zion Tsz Ho Tse, “Heatguard: An
Ultra-low-cost 3D-printed Sensor for Skin Temperature Alert & Reporting System”,
Proceedings of the IMechE, Part H: Journal of Engineering in Medicine.
4. Rui Li, Barclay Jumet, Zion Tse, “A Smartphone-based IMU Tracking System for Body
Movement in Comparison with Optical Tracking”, Proceedings of the IMechE, Part H:
Journal of Engineering in Medicine.
B. Journal Papers (under review)
1. Rui Li, Barclay Jumet, Zion Tse, “Common Errors of Optical Tracking in Clinical
Environment”, Proceedings of the IMechE, Part H: Journal of Engineering in Medicine.
2. Rui Li, Austin Taylor, Zion Tse, “Rapid Prototyping of Custom Radiocontrast Agent
Markers for CT-guided Procedures”, Proceedings of the IMechE, Part H: Journal of
Engineering in Medicine.

206
3. Zhuo Zhao, Rui Li, Zion Tse, “A low-cost Angular Tracker for CT Applications”,
International Journal of Computer Assisted Radiology and Surgery.
C. Journal Articles (in preparation)
1. Rui Li, Julian Moore, Sheng Xu, Bradford Wood, Hongliang Ren, Zion Tse, A
Feasibility Study of Using Thermochromic Material for Radiofrequency Ablation
Phantom.
D. Conference Publications
1. Rui Li, Sheng Xu, Bradford Wood, John Oshinski, Zion Tsz Ho Tse, “Towards Precise
Freehand MRI-guided Cellular Therapeutic Targeting for Amyotrophic Lateral Sclerosis”,
9th National IGT Workshop, Bethesda, March 2017.
2. Rui Li, Sheng Xu, Bradford Wood, Zion Tsz Ho Tse, “3D-printed MRI Grid for Guiding
Transperineal Prostate Focal Laser Ablation”, 9th National IGT Workshop, Bethesda,
March 2017.
3. Rui Li, Aaron A Smith, Harshitha S Tadinada, Zion Tsz Ho Tse, “Heatguard: An Ultra-
Low-Cost 3D Printed Sensor for Body Temperature Alert and Reporting System”, 2018
Design of Medical Devices Conference, ASME, Pages V001T10A008-V001T10A008,
Minneapolis, April 2018.
4. Rui Li, Ivane Bakhutashvili, Sheng Xu, Bradford Wood, Zion Tsz Ho Tse, “Flexible
Template to Assist MRI-Guided Biopsy on Prostate Cancer”, 2018 Design of Medical
Devices Conference, ASME, pages V001T04A002-V001T04A002, Minneapolis, April
2018.
5. Ivane Bakhutashvili, Sheng Xu, Rui Li, Zion Tsz Ho Tse, Ismail Turkbey, Peter Choyke,
Peter Pinto, Bradford Wood, “Software Assisted MRI-visible Grid for Transperineal MR-

207
guided Prostate Needle Interventions”, Society of Interventional Oncology, Boston, June
2018.
6. Aaron Smith, Rui Li, Zion Tsz Ho Tse “AirCure: a 2in1 System for 3D SLA Prints and
Medical Applications”, BMES annual meeting, Atlanta, October 2018.
7. Sheng Xu, Zion Tse, Rui Li, Quirina De Ruiter, Braford Wood, “Virtual bronchoscopy
navigation using a wireless gyroscope”, Journal of Vascular and Interventional Radiology
30 (3), S227, March 2019.
8. Noah Scott, Rui Li, Zion Tse, “MobileGyro: Android Application for Bluetooth
Gyroscope Tracking With Potential for Impact in Rehabilitative Processes”, 2019 Design
of Medical Devices Conference, ASME, pages V001T04A001-V001T04A001,
Minneapolis, April 2019.
Related Documents

![Indoornavigationforalibrary - CEUR-WS.orgceur-ws.org/Vol-2498/short19.pdf · Reference [3] presents an algorithm that uses smartphone MEMS sensors to estimate the position of a smartphone](https://static.cupdf.com/doc/110x72/5ec0e1e198d67572c40b1716/indoornavigationforalibrary-ceur-wsorgceur-wsorgvol-2498-reference-3.jpg)


