Exploring the Use of Cytochrome Oxidase c Subunit 1 (COI) for DNA Barcoding of Free-Living Marine Nematodes Sofie Derycke 1,2 *, Jan Vanaverbeke 1 , Annelien Rigaux 1,2 , Thierry Backeljau 3,4 , Tom Moens 1 1 Marine Biology Research Group, Department of Biology, Ghent University, Ghent, Belgium, 2 Centrum for Molecular Phylogeny and Evolution, Ghent University, Ghent, Belgium, 3 Joint Experimental Molecular Unit, Royal Belgian Institute of Natural Sciences, Brussels, Belgium, 4 Evolutionary Biology Group, Department of Biology, University of Antwerp, Antwerp, Belgium Abstract Background: The identification of free-living marine nematodes is difficult because of the paucity of easily scorable diagnostic morphological characters. Consequently, molecular identification tools could solve this problem. Unfortunately, hitherto most of these tools relied on 18S rDNA and 28S rDNA sequences, which often lack sufficient resolution at the species level. In contrast, only a few mitochondrial COI data are available for free-living marine nematodes. Therefore, we investigate the amplification and sequencing success of two partitions of the COI gene, the M1-M6 barcoding region and the I3-M11 partition. Methodology: Both partitions were analysed in 41 nematode species from a wide phylogenetic range. The taxon specific primers for the I3-M11 partition outperformed the universal M1-M6 primers in terms of amplification success (87.8% vs. 65.8%, respectively) and produced a higher number of bidirectional COI sequences (65.8% vs 39.0%, respectively). A threshold value of 5% K2P genetic divergence marked a clear DNA barcoding gap separating intra- and interspecific distances: 99.3% of all interspecific comparisons were .0.05, while 99.5% of all intraspecific comparisons were ,0.05 K2P distance. Conclusion: The I3-M11 partition reliably identifies a wide range of marine nematodes, and our data show the need for a strict scrutiny of the obtained sequences, since contamination, nuclear pseudogenes and endosymbionts may confuse nematode species identification by COI sequences. Citation: Derycke S, Vanaverbeke J, Rigaux A, Backeljau T, Moens T (2010) Exploring the Use of Cytochrome Oxidase c Subunit 1 (COI) for DNA Barcoding of Free- Living Marine Nematodes. PLoS ONE 5(10): e13716. doi:10.1371/journal.pone.0013716 Editor: Peter Roopnarine, California Academy of Sciences, United States of America Received July 9, 2010; Accepted October 6, 2010; Published October 28, 2010 Copyright: ß 2010 Derycke et al. This is an open-access article distributed under the terms of the Creative Commons Attribution License, which permits unrestricted use, distribution, and reproduction in any medium, provided the original author and source are credited. Funding: This research was financially supported by the Flemish Fund for Scientific Research (F.W.O.) through the project 3G040407 and the research grant 1507709, and by Ghent University through the Special Research Fund (B.O.F.) project B/07778/02. S.D. acknowledges a postdoctoral fellowship from the F.W.O. The funders had no role in study design, data collection and analysis, decision to publish, or preparation of the manuscript. Competing Interests: The authors have declared that no competing interests exist. * E-mail: [email protected] Introduction Free-living nematodes dominate marine sediments both in terms of densities (10 5 –10 7 individuals m 22 ) and diversity (.10 species cm 22 ) [1]. They play an important role in benthic food webs where they are a high quality food source for higher trophic groups [2] and at the same time influence the composition of lower trophic groups [3,4]. Nevertheless, the study of free-living marine nematodes is held back because their morphological identification is notoriously difficult. This is due to the paucity of diagnostic characters and the fact that these characters are often doubtful to score and interpret, particularly when relying on traditional light microscopy [5]. Therefore, nematode communities are usually only surveyed up to genus rather than species level. This may be problematic, because functional roles of nematodes may be highly species-specific [3,6] and their population dynamics can be affected by the presence of closely related species, often congeners [7–9]. Hence, the identification of nematodes could greatly benefit from the use of molecular tools, as these may provide a faster and more reliable estimate of nematode diversity [10–12]. Such molecular studies typically use the 18S rDNA, mainly because of the availability of universal nematode primers and its phylogenetic resolution at the genus and higher taxon level [5]. Unfortunately, the 18S gene has low resolution when it comes to distinguishing closely related species [5,13–15]. The mitochondrial cytochrome oxidase c subunit 1 (COI) gene is one of the most popular markers for population genetic and phylogeographic studies across the animal kingdom [16]. Its popularity has increased even more since it appears that the M1- M6 partition of the COI gene (hereafter referred to as the Folmer region) is an efficient identification tool for Metazoan species, turning it into the core fragment for DNA barcoding [17]. Nevertheless, COI based DNA barcoding sometimes faces problems: (1) in some taxa, such as Porifera, Anthozoa, fungi, plants [18–20], the Folmer region shows little resolution at the species level so that other COI regions such as I3-M11 [21], or other genes such as the nuclear ribosomal ITS [22] have been proposed for barcoding purposes, and (2) the occurrence of PLoS ONE | www.plosone.org 1 October 2010 | Volume 5 | Issue 10 | e13716

Welcome message from author
This document is posted to help you gain knowledge. Please leave a comment to let me know what you think about it! Share it to your friends and learn new things together.
Transcript
Exploring the Use of Cytochrome Oxidase c Subunit 1(COI) for DNA Barcoding of Free-Living MarineNematodesSofie Derycke1,2*, Jan Vanaverbeke1, Annelien Rigaux1,2, Thierry Backeljau3,4, Tom Moens1
1 Marine Biology Research Group, Department of Biology, Ghent University, Ghent, Belgium, 2 Centrum for Molecular Phylogeny and Evolution, Ghent University, Ghent,
Belgium, 3 Joint Experimental Molecular Unit, Royal Belgian Institute of Natural Sciences, Brussels, Belgium, 4 Evolutionary Biology Group, Department of Biology,
University of Antwerp, Antwerp, Belgium
Abstract
Background: The identification of free-living marine nematodes is difficult because of the paucity of easily scorablediagnostic morphological characters. Consequently, molecular identification tools could solve this problem. Unfortunately,hitherto most of these tools relied on 18S rDNA and 28S rDNA sequences, which often lack sufficient resolution at thespecies level. In contrast, only a few mitochondrial COI data are available for free-living marine nematodes. Therefore, weinvestigate the amplification and sequencing success of two partitions of the COI gene, the M1-M6 barcoding region andthe I3-M11 partition.
Methodology: Both partitions were analysed in 41 nematode species from a wide phylogenetic range. The taxon specificprimers for the I3-M11 partition outperformed the universal M1-M6 primers in terms of amplification success (87.8% vs.65.8%, respectively) and produced a higher number of bidirectional COI sequences (65.8% vs 39.0%, respectively). Athreshold value of 5% K2P genetic divergence marked a clear DNA barcoding gap separating intra- and interspecificdistances: 99.3% of all interspecific comparisons were .0.05, while 99.5% of all intraspecific comparisons were ,0.05 K2Pdistance.
Conclusion: The I3-M11 partition reliably identifies a wide range of marine nematodes, and our data show the need for astrict scrutiny of the obtained sequences, since contamination, nuclear pseudogenes and endosymbionts may confusenematode species identification by COI sequences.
Citation: Derycke S, Vanaverbeke J, Rigaux A, Backeljau T, Moens T (2010) Exploring the Use of Cytochrome Oxidase c Subunit 1 (COI) for DNA Barcoding of Free-Living Marine Nematodes. PLoS ONE 5(10): e13716. doi:10.1371/journal.pone.0013716
Editor: Peter Roopnarine, California Academy of Sciences, United States of America
Received July 9, 2010; Accepted October 6, 2010; Published October 28, 2010
Copyright: � 2010 Derycke et al. This is an open-access article distributed under the terms of the Creative Commons Attribution License, which permitsunrestricted use, distribution, and reproduction in any medium, provided the original author and source are credited.
Funding: This research was financially supported by the Flemish Fund for Scientific Research (F.W.O.) through the project 3G040407 and the research grant1507709, and by Ghent University through the Special Research Fund (B.O.F.) project B/07778/02. S.D. acknowledges a postdoctoral fellowship from the F.W.O.The funders had no role in study design, data collection and analysis, decision to publish, or preparation of the manuscript.
Competing Interests: The authors have declared that no competing interests exist.
* E-mail: [email protected]
Introduction
Free-living nematodes dominate marine sediments both in
terms of densities (105–107 individuals m22) and diversity (.10
species cm22) [1]. They play an important role in benthic food
webs where they are a high quality food source for higher trophic
groups [2] and at the same time influence the composition of lower
trophic groups [3,4]. Nevertheless, the study of free-living marine
nematodes is held back because their morphological identification
is notoriously difficult. This is due to the paucity of diagnostic
characters and the fact that these characters are often doubtful to
score and interpret, particularly when relying on traditional light
microscopy [5]. Therefore, nematode communities are usually
only surveyed up to genus rather than species level. This may be
problematic, because functional roles of nematodes may be highly
species-specific [3,6] and their population dynamics can be
affected by the presence of closely related species, often congeners
[7–9]. Hence, the identification of nematodes could greatly benefit
from the use of molecular tools, as these may provide a faster and
more reliable estimate of nematode diversity [10–12]. Such
molecular studies typically use the 18S rDNA, mainly because of
the availability of universal nematode primers and its phylogenetic
resolution at the genus and higher taxon level [5]. Unfortunately,
the 18S gene has low resolution when it comes to distinguishing
closely related species [5,13–15].
The mitochondrial cytochrome oxidase c subunit 1 (COI) gene
is one of the most popular markers for population genetic and
phylogeographic studies across the animal kingdom [16]. Its
popularity has increased even more since it appears that the M1-
M6 partition of the COI gene (hereafter referred to as the Folmer
region) is an efficient identification tool for Metazoan species,
turning it into the core fragment for DNA barcoding [17].
Nevertheless, COI based DNA barcoding sometimes faces
problems: (1) in some taxa, such as Porifera, Anthozoa, fungi,
plants [18–20], the Folmer region shows little resolution at the
species level so that other COI regions such as I3-M11 [21], or
other genes such as the nuclear ribosomal ITS [22] have been
proposed for barcoding purposes, and (2) the occurrence of
PLoS ONE | www.plosone.org 1 October 2010 | Volume 5 | Issue 10 | e13716
nuclear copies of the COI gene (so-called ‘numts’) may confuse
DNA barcoding results and may lead to an overestimation of
taxonomic diversity [23]. For marine nematodes, COI based DNA
barcoding is problematic because the ‘universal’ invertebrate M1-
M6 primers [24] generally give very poor amplification results
[5,10], while the I3-M11 primers amplify satisfactorily in three
nematode species complexes belonging to different families, viz.
Monhysteridae [25], Rhabditidae [26], Leptosomatidae [15].
Furthermore, the I3-M11 partition proved its taxonomic utility
by uncovering cryptic diversity in both parasitic [27,28] and
marine free-living nematodes [25,29]. It remains, however,
unclear to what extent the I3-M11 partition can be amplified
more generally in other marine free-living nematodes and thus can
be used as a more general DNA barcoding fragment in this group.
Against this background, we here compare the amplification
and sequencing success of a modified version of the COI primerset
for the I3-M11 fragment developed by Bowles et al. [27] with that
of the universal invertebrate Folmer primers for the M1-M6
fragment, in 41 marine nematode species representing all marine
orders dealt with in Meldal et al. [14]. To this end, nematodes
were morphologically identified to species level, their morphology
was video vouchered and sequences of both COI partitions were
(1) checked against Genbank and used for constructing a neighbor
joining tree to verify their nematode origin, (2) subjected to a strict
quality control, and (3) used to construct frequency distributions of
intra- and interspecific genetic distances to detect barcoding gaps.
Materials and Methods
Specimen collectionNematodes were collected during upcoming tide at four
intertidal locations along the Westerschelde estuary (The Nether-
lands) and in one coastal location (Nieuwpoort, Belgium) on April
22nd 2009 (Table 1). Three perspex cores (10 cm2) were randomly
placed in the sediment midway between the low and high water
line. The uppermost two centimeters of sediment were pooled for
each location. In the lab, nematodes were removed from the
sediment by decantation, and the nematodes were rinsed off a
38 mm sieve with artificial sea water (Instant OceanH salt,
Aquarium Systems, France). Subsequently, living specimens were
screened under a dissecting microscope, and nematodes with
different morphological features and/or different behavior were
handpicked, temporarily mounted in a microcompressor slide
(Taylor’s Microcompressor Mk II; Taylor, 1991) and heat killed.
Identification to species or genus level was done by an expert
nematode taxonomist (J.V.) using a LEICA DMR research
microscope. In addition to the freshly collected field specimens,
six marine nematode species from permanent lab cultures were
added. Digital photographic vouchers representing head and tail
regions of each specimen were taken at small, intermediate and
immersion oil magnification. Immediately after the vouchering
procedure, nematodes were collected from the temporary slide,
put in lysis buffer and stored at 220uC until further processing.
I3-M11 primer developmentTwo I3-M11 primer sets were constructed based on an existing
primer set developed for the parasitic platyhelminth Echinococcus
granulosus ([27], Table 1). Initially, the unmodified primer set
worked well for Rhabditis (Pellioditis) marina, except for one
population [29]. We therefore modified the reverse primer based
on an alignment of complete COI sequences from mostly
parasitic nematodes available from Genbank (Accession numbers
AF538716.1, AY265417.1, AJ537512.1, AJ556134.1, AJ417719.2,
AF015193.1, AY591323.1, AJ558163.1, X54252.1). This modified
primer set (JB3 and JB5, Table 1) has successfully been used in
rhabditid and leptosomatid nematode species [15,26], but was
unable to amplify the I3-M11 fragment in the monhysterid
Halomonhystera disjuncta [25]. For this species complex, we then
developed a degenerated primer set (JB2-JB5 GED, Table 1) based
on an alignment with the Genbank sequences we had downloaded
before, the rhabditid sequences we had by then, and one
Halomonhystera sequence we had obtained by using a reverse
primer further downstream (JB7GED, Table 1).
DNA extraction and amplification of the I3-M11 andFolmer partitions
Proteinase K (1 ml of 10 mg/ml) was added to the tubes
containing a single nematode in 20 ml lysis buffer (50 mM KCl,
10 mM Tris pH 8.3, 2.5 mM MgCl2, 0.45% NP40, 0.45% Tween
20), followed by incubation at 65uC for one hour and at 95uC for
10 min. From each species, one specimen was randomly chosen to
test the amplification success of the JB3-JB5 and JB2-JB5GED
primer sets. PCR cycling conditions were: initial denaturation of
5 min at 94uC, 5 cycles of (94uC for 30 s; 54uC for 30 s and
temperature decreasing with 1uC for each cycle; 72uC for 30 s)
followed by 35 cycles of (94uC for 30 s; 50uC for 30 s; 72uC for
30 s), and a final extension of 10 min at 72uC. Reactions were
performed for each primer set separately in total volumes of 25 ml
containing 2.5 ml of 10x PCR buffer with 15 mM MgCl2, 2 ml of
MgCl2 25 mM, 0.5 ml dNTP (10 mM), 0.125 ml of each primer
(25 nM), 0.125 ml TopTaq DNA polymerase (Qiagen), 18.625 ml
sterile distilled water and 1 ml DNA. For the degenerated primer
set JB2-JB5GED, 0.5 ml of each primer (25 nM) was used. In our
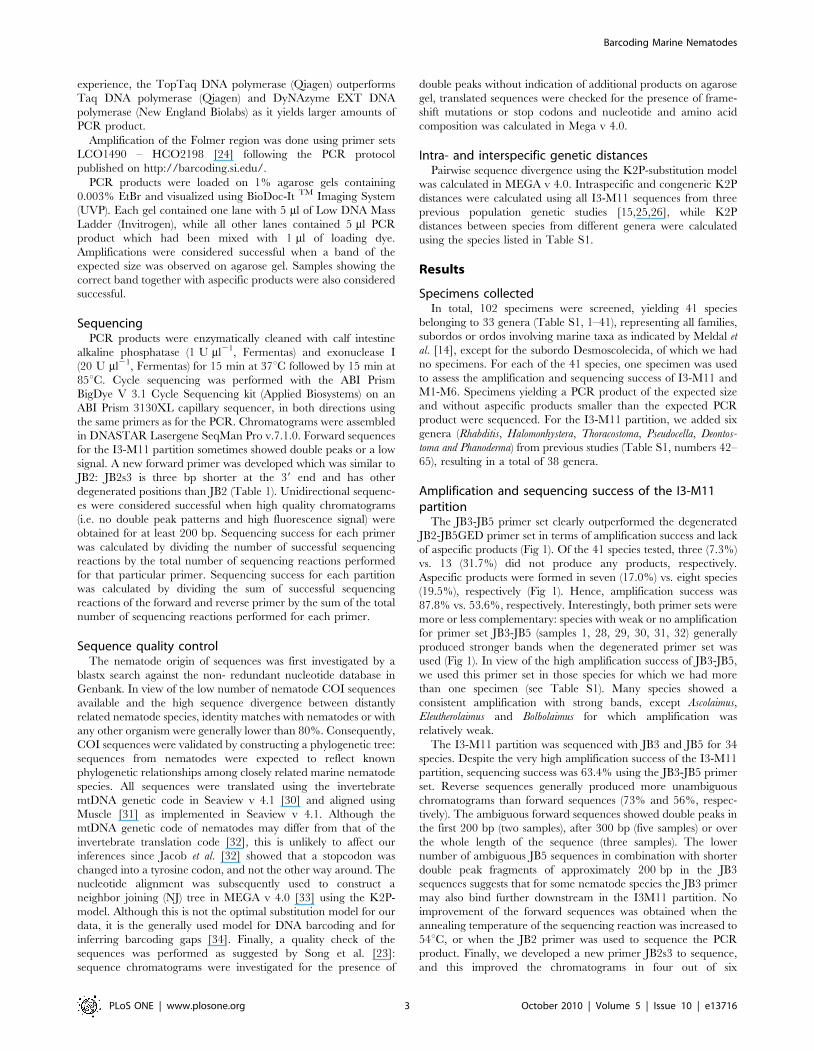
Table 1. Primer sequences for amplification of the I3-M11 partition in marine nematodes.
Primer Sequence (59-39) Position Source
JB3 (F) TTT TTT GGG CAT CCT GAG GTT TAT 2179 Bowles et al. 1992
JB4.5 (R) TAA AGA AAG AAC ATA ATG AAA ATG 2597 Bowles et al. 1992
JB5 (R) AGC ACC TAA ACT TAA AAC ATA ATG AAA ATG 2597 Derycke et al. 2005
JB2 (F) ATG TTT TGA TTT TAC CWG CWT TYG GTG T 2201 Derycke et al. 2007
JB2s3 (F) ATG TTT TGA TTT TAC CWG SWT TTG G 2201 this study
JB5GED (R) AGC ACC TAA ACT TAA AAC ATA RTG RAA RTG 2597 Derycke et al. 2007
JB7GED (R) ATC AGG ATA ATC CAA ATA YTT WCG WGG 2780 this study
(Primer): name of the primer. (F) forward primer; (R) reverse primer. (Sequence): primer sequence. (Position): starting position of each primer along the COI sequence ofDrosophila yakuba. (Source): publication of the primer.doi:10.1371/journal.pone.0013716.t001
Barcoding Marine Nematodes
PLoS ONE | www.plosone.org 2 October 2010 | Volume 5 | Issue 10 | e13716
experience, the TopTaq DNA polymerase (Qiagen) outperforms
Taq DNA polymerase (Qiagen) and DyNAzyme EXT DNA
polymerase (New England Biolabs) as it yields larger amounts of
PCR product.
Amplification of the Folmer region was done using primer sets
LCO1490 – HCO2198 [24] following the PCR protocol
published on http://barcoding.si.edu/.
PCR products were loaded on 1% agarose gels containing
0.003% EtBr and visualized using BioDoc-It TM Imaging System
(UVP). Each gel contained one lane with 5 ml of Low DNA Mass
Ladder (Invitrogen), while all other lanes contained 5 ml PCR
product which had been mixed with 1 ml of loading dye.
Amplifications were considered successful when a band of the
expected size was observed on agarose gel. Samples showing the
correct band together with aspecific products were also considered
successful.
SequencingPCR products were enzymatically cleaned with calf intestine
alkaline phosphatase (1 U ml21, Fermentas) and exonuclease I
(20 U ml21, Fermentas) for 15 min at 37uC followed by 15 min at
85uC. Cycle sequencing was performed with the ABI Prism
BigDye V 3.1 Cycle Sequencing kit (Applied Biosystems) on an
ABI Prism 3130XL capillary sequencer, in both directions using
the same primers as for the PCR. Chromatograms were assembled
in DNASTAR Lasergene SeqMan Pro v.7.1.0. Forward sequences
for the I3-M11 partition sometimes showed double peaks or a low
signal. A new forward primer was developed which was similar to
JB2: JB2s3 is three bp shorter at the 39 end and has other
degenerated positions than JB2 (Table 1). Unidirectional sequenc-
es were considered successful when high quality chromatograms
(i.e. no double peak patterns and high fluorescence signal) were
obtained for at least 200 bp. Sequencing success for each primer
was calculated by dividing the number of successful sequencing
reactions by the total number of sequencing reactions performed
for that particular primer. Sequencing success for each partition
was calculated by dividing the sum of successful sequencing
reactions of the forward and reverse primer by the sum of the total
number of sequencing reactions performed for each primer.
Sequence quality controlThe nematode origin of sequences was first investigated by a
blastx search against the non- redundant nucleotide database in
Genbank. In view of the low number of nematode COI sequences
available and the high sequence divergence between distantly
related nematode species, identity matches with nematodes or with
any other organism were generally lower than 80%. Consequently,
COI sequences were validated by constructing a phylogenetic tree:
sequences from nematodes were expected to reflect known
phylogenetic relationships among closely related marine nematode
species. All sequences were translated using the invertebrate
mtDNA genetic code in Seaview v 4.1 [30] and aligned using
Muscle [31] as implemented in Seaview v 4.1. Although the
mtDNA genetic code of nematodes may differ from that of the
invertebrate translation code [32], this is unlikely to affect our
inferences since Jacob et al. [32] showed that a stopcodon was
changed into a tyrosine codon, and not the other way around. The
nucleotide alignment was subsequently used to construct a
neighbor joining (NJ) tree in MEGA v 4.0 [33] using the K2P-
model. Although this is not the optimal substitution model for our
data, it is the generally used model for DNA barcoding and for
inferring barcoding gaps [34]. Finally, a quality check of the
sequences was performed as suggested by Song et al. [23]:
sequence chromatograms were investigated for the presence of
double peaks without indication of additional products on agarose
gel, translated sequences were checked for the presence of frame-
shift mutations or stop codons and nucleotide and amino acid
composition was calculated in Mega v 4.0.
Intra- and interspecific genetic distancesPairwise sequence divergence using the K2P-substitution model
was calculated in MEGA v 4.0. Intraspecific and congeneric K2P
distances were calculated using all I3-M11 sequences from three
previous population genetic studies [15,25,26], while K2P
distances between species from different genera were calculated
using the species listed in Table S1.
Results
Specimens collectedIn total, 102 specimens were screened, yielding 41 species
belonging to 33 genera (Table S1, 1–41), representing all families,
subordos or ordos involving marine taxa as indicated by Meldal et
al. [14], except for the subordo Desmoscolecida, of which we had
no specimens. For each of the 41 species, one specimen was used
to assess the amplification and sequencing success of I3-M11 and
M1-M6. Specimens yielding a PCR product of the expected size
and without aspecific products smaller than the expected PCR
product were sequenced. For the I3-M11 partition, we added six
genera (Rhabditis, Halomonhystera, Thoracostoma, Pseudocella, Deontos-
toma and Phanoderma) from previous studies (Table S1, numbers 42–
65), resulting in a total of 38 genera.
Amplification and sequencing success of the I3-M11partition
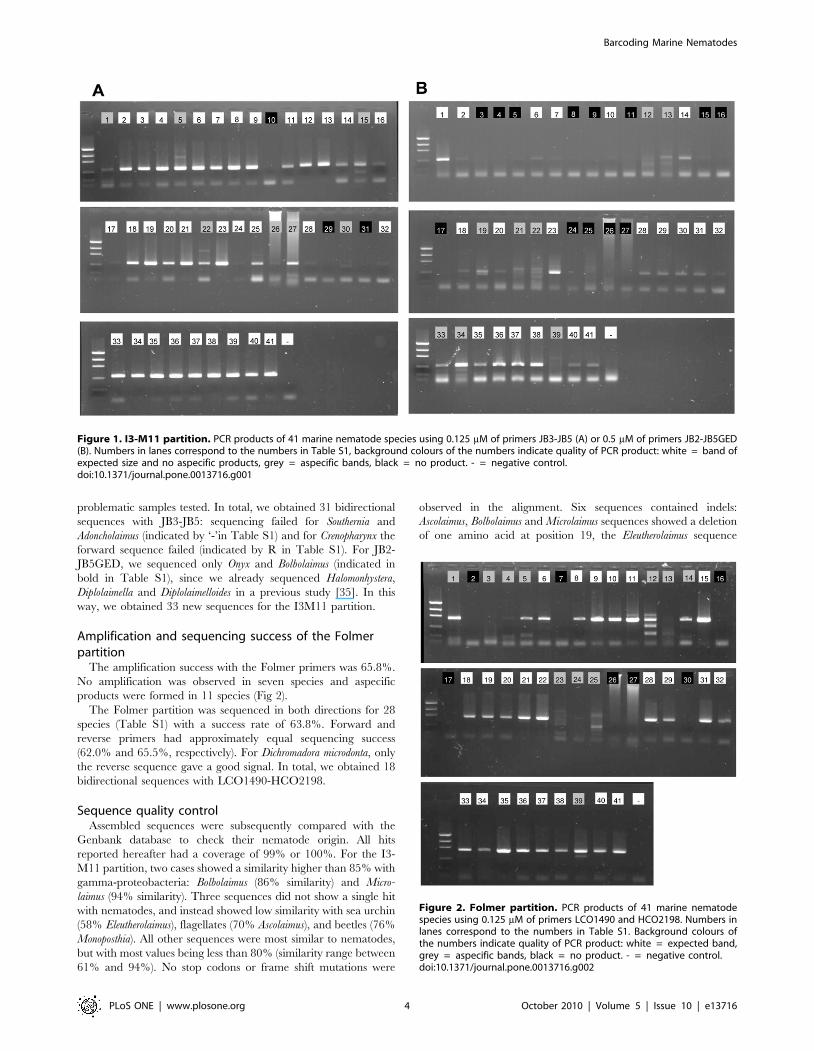
The JB3-JB5 primer set clearly outperformed the degenerated
JB2-JB5GED primer set in terms of amplification success and lack
of aspecific products (Fig 1). Of the 41 species tested, three (7.3%)
vs. 13 (31.7%) did not produce any products, respectively.
Aspecific products were formed in seven (17.0%) vs. eight species
(19.5%), respectively (Fig 1). Hence, amplification success was
87.8% vs. 53.6%, respectively. Interestingly, both primer sets were
more or less complementary: species with weak or no amplification
for primer set JB3-JB5 (samples 1, 28, 29, 30, 31, 32) generally
produced stronger bands when the degenerated primer set was
used (Fig 1). In view of the high amplification success of JB3-JB5,
we used this primer set in those species for which we had more
than one specimen (see Table S1). Many species showed a
consistent amplification with strong bands, except Ascolaimus,
Eleutherolaimus and Bolbolaimus for which amplification was
relatively weak.
The I3-M11 partition was sequenced with JB3 and JB5 for 34
species. Despite the very high amplification success of the I3-M11
partition, sequencing success was 63.4% using the JB3-JB5 primer
set. Reverse sequences generally produced more unambiguous
chromatograms than forward sequences (73% and 56%, respec-
tively). The ambiguous forward sequences showed double peaks in
the first 200 bp (two samples), after 300 bp (five samples) or over
the whole length of the sequence (three samples). The lower
number of ambiguous JB5 sequences in combination with shorter
double peak fragments of approximately 200 bp in the JB3
sequences suggests that for some nematode species the JB3 primer
may also bind further downstream in the I3M11 partition. No
improvement of the forward sequences was obtained when the
annealing temperature of the sequencing reaction was increased to
54uC, or when the JB2 primer was used to sequence the PCR
product. Finally, we developed a new primer JB2s3 to sequence,
and this improved the chromatograms in four out of six
Barcoding Marine Nematodes
PLoS ONE | www.plosone.org 3 October 2010 | Volume 5 | Issue 10 | e13716
problematic samples tested. In total, we obtained 31 bidirectional
sequences with JB3-JB5: sequencing failed for Southernia and
Adoncholaimus (indicated by ‘-’in Table S1) and for Crenopharynx the
forward sequence failed (indicated by R in Table S1). For JB2-
JB5GED, we sequenced only Onyx and Bolbolaimus (indicated in
bold in Table S1), since we already sequenced Halomonhystera,
Diplolaimella and Diplolaimelloides in a previous study [35]. In this
way, we obtained 33 new sequences for the I3M11 partition.
Amplification and sequencing success of the Folmerpartition
The amplification success with the Folmer primers was 65.8%.
No amplification was observed in seven species and aspecific
products were formed in 11 species (Fig 2).
The Folmer partition was sequenced in both directions for 28
species (Table S1) with a success rate of 63.8%. Forward and
reverse primers had approximately equal sequencing success
(62.0% and 65.5%, respectively). For Dichromadora microdonta, only
the reverse sequence gave a good signal. In total, we obtained 18
bidirectional sequences with LCO1490-HCO2198.
Sequence quality controlAssembled sequences were subsequently compared with the
Genbank database to check their nematode origin. All hits
reported hereafter had a coverage of 99% or 100%. For the I3-
M11 partition, two cases showed a similarity higher than 85% with
gamma-proteobacteria: Bolbolaimus (86% similarity) and Micro-
laimus (94% similarity). Three sequences did not show a single hit
with nematodes, and instead showed low similarity with sea urchin
(58% Eleutherolaimus), flagellates (70% Ascolaimus), and beetles (76%
Monoposthia). All other sequences were most similar to nematodes,
but with most values being less than 80% (similarity range between
61% and 94%). No stop codons or frame shift mutations were
observed in the alignment. Six sequences contained indels:
Ascolaimus, Bolbolaimus and Microlaimus sequences showed a deletion
of one amino acid at position 19, the Eleutherolaimus sequence
Figure 2. Folmer partition. PCR products of 41 marine nematodespecies using 0.125 mM of primers LCO1490 and HCO2198. Numbers inlanes correspond to the numbers in Table S1. Background colours ofthe numbers indicate quality of PCR product: white = expected band,grey = aspecific bands, black = no product. - = negative control.doi:10.1371/journal.pone.0013716.g002
Figure 1. I3-M11 partition. PCR products of 41 marine nematode species using 0.125 mM of primers JB3-JB5 (A) or 0.5 mM of primers JB2-JB5GED(B). Numbers in lanes correspond to the numbers in Table S1, background colours of the numbers indicate quality of PCR product: white = band ofexpected size and no aspecific products, grey = aspecific bands, black = no product. - = negative control.doi:10.1371/journal.pone.0013716.g001
Barcoding Marine Nematodes
PLoS ONE | www.plosone.org 4 October 2010 | Volume 5 | Issue 10 | e13716
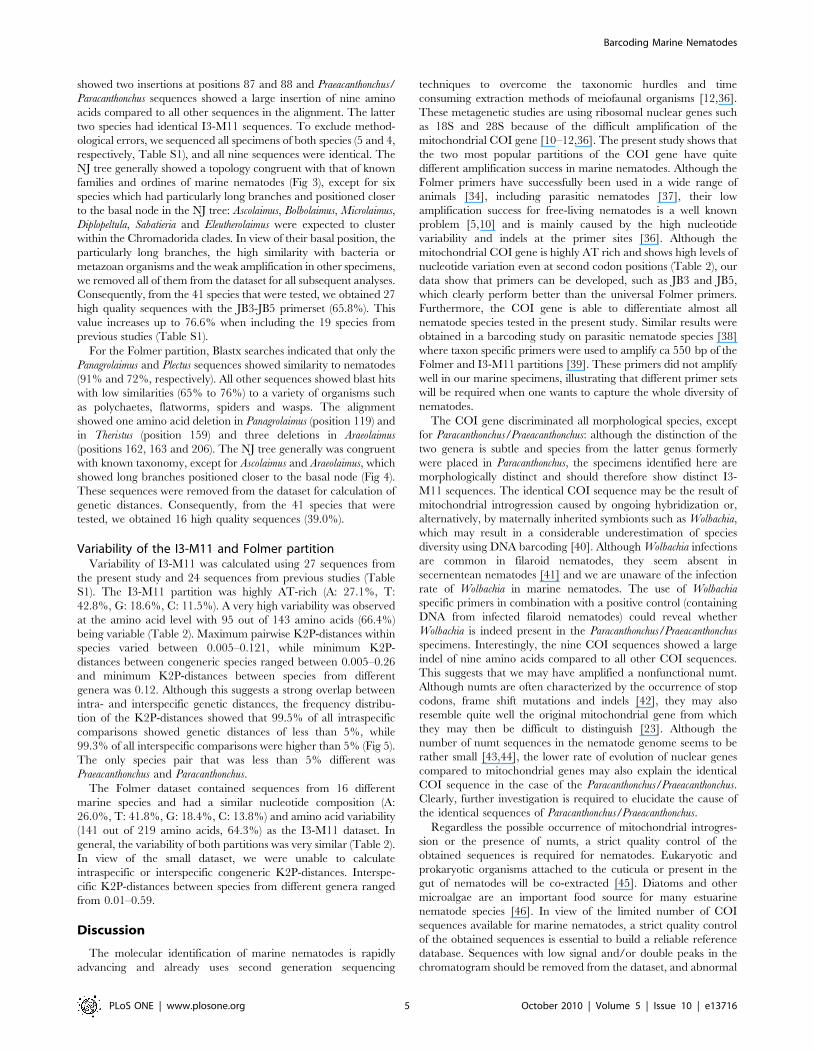
showed two insertions at positions 87 and 88 and Praeacanthonchus/
Paracanthonchus sequences showed a large insertion of nine amino
acids compared to all other sequences in the alignment. The latter
two species had identical I3-M11 sequences. To exclude method-
ological errors, we sequenced all specimens of both species (5 and 4,
respectively, Table S1), and all nine sequences were identical. The
NJ tree generally showed a topology congruent with that of known
families and ordines of marine nematodes (Fig 3), except for six
species which had particularly long branches and positioned closer
to the basal node in the NJ tree: Ascolaimus, Bolbolaimus, Microlaimus,
Diplopeltula, Sabatieria and Eleutherolaimus were expected to cluster
within the Chromadorida clades. In view of their basal position, the
particularly long branches, the high similarity with bacteria or
metazoan organisms and the weak amplification in other specimens,
we removed all of them from the dataset for all subsequent analyses.
Consequently, from the 41 species that were tested, we obtained 27
high quality sequences with the JB3-JB5 primerset (65.8%). This
value increases up to 76.6% when including the 19 species from
previous studies (Table S1).
For the Folmer partition, Blastx searches indicated that only the
Panagrolaimus and Plectus sequences showed similarity to nematodes
(91% and 72%, respectively). All other sequences showed blast hits
with low similarities (65% to 76%) to a variety of organisms such
as polychaetes, flatworms, spiders and wasps. The alignment
showed one amino acid deletion in Panagrolaimus (position 119) and
in Theristus (position 159) and three deletions in Araeolaimus
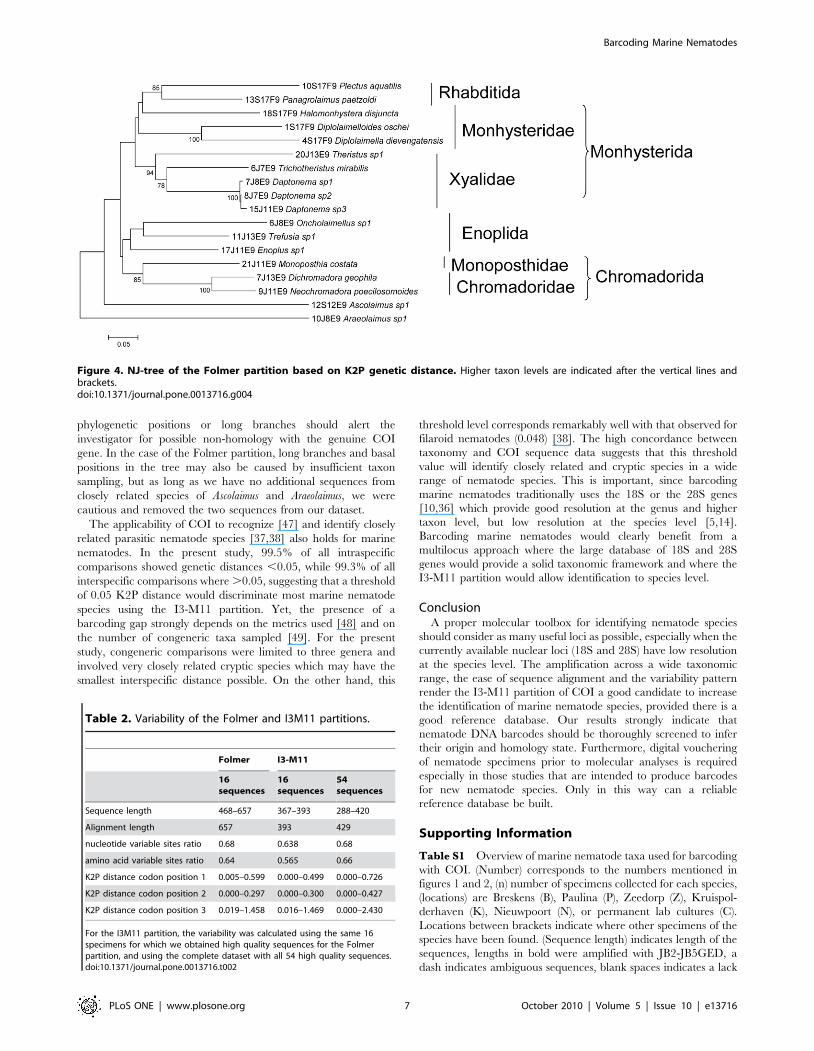
(positions 162, 163 and 206). The NJ tree generally was congruent
with known taxonomy, except for Ascolaimus and Araeolaimus, which
showed long branches positioned closer to the basal node (Fig 4).
These sequences were removed from the dataset for calculation of
genetic distances. Consequently, from the 41 species that were
tested, we obtained 16 high quality sequences (39.0%).
Variability of the I3-M11 and Folmer partitionVariability of I3-M11 was calculated using 27 sequences from
the present study and 24 sequences from previous studies (Table
S1). The I3-M11 partition was highly AT-rich (A: 27.1%, T:
42.8%, G: 18.6%, C: 11.5%). A very high variability was observed
at the amino acid level with 95 out of 143 amino acids (66.4%)
being variable (Table 2). Maximum pairwise K2P-distances within
species varied between 0.005–0.121, while minimum K2P-
distances between congeneric species ranged between 0.005–0.26
and minimum K2P-distances between species from different
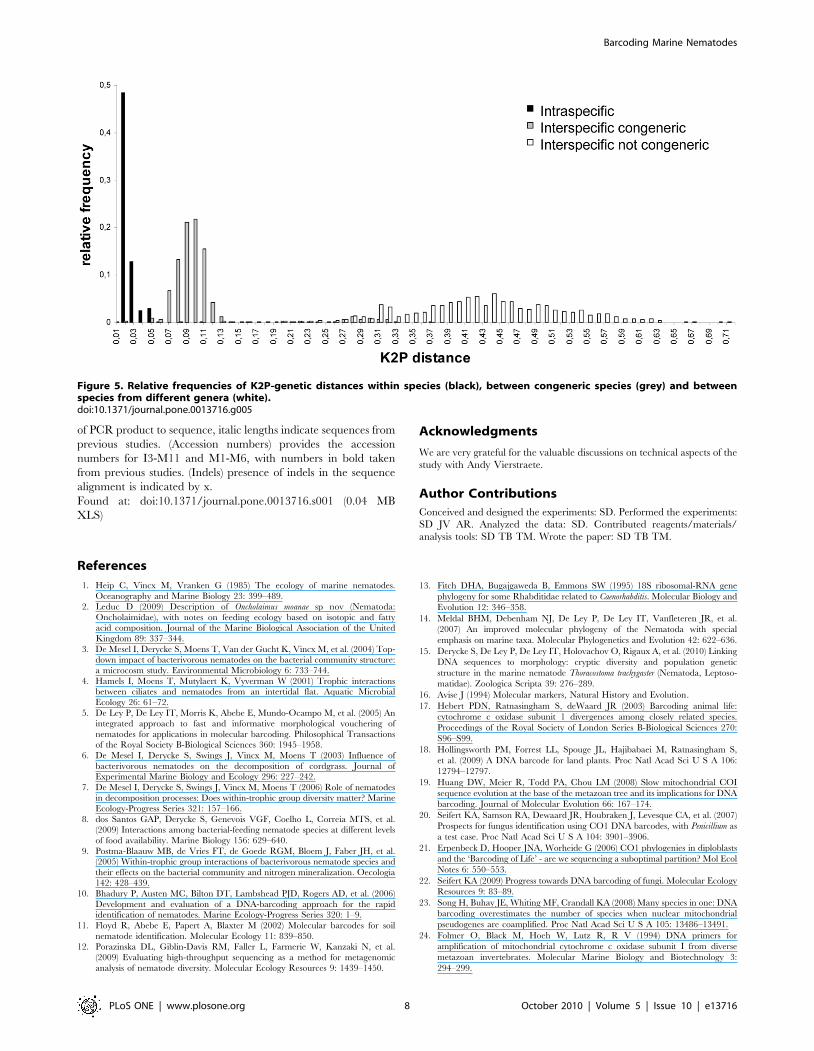
genera was 0.12. Although this suggests a strong overlap between
intra- and interspecific genetic distances, the frequency distribu-
tion of the K2P-distances showed that 99.5% of all intraspecific
comparisons showed genetic distances of less than 5%, while
99.3% of all interspecific comparisons were higher than 5% (Fig 5).
The only species pair that was less than 5% different was
Praeacanthonchus and Paracanthonchus.
The Folmer dataset contained sequences from 16 different
marine species and had a similar nucleotide composition (A:
26.0%, T: 41.8%, G: 18.4%, C: 13.8%) and amino acid variability
(141 out of 219 amino acids, 64.3%) as the I3-M11 dataset. In
general, the variability of both partitions was very similar (Table 2).
In view of the small dataset, we were unable to calculate
intraspecific or interspecific congeneric K2P-distances. Interspe-
cific K2P-distances between species from different genera ranged
from 0.01–0.59.
Discussion
The molecular identification of marine nematodes is rapidly
advancing and already uses second generation sequencing
techniques to overcome the taxonomic hurdles and time
consuming extraction methods of meiofaunal organisms [12,36].
These metagenetic studies are using ribosomal nuclear genes such
as 18S and 28S because of the difficult amplification of the
mitochondrial COI gene [10–12,36]. The present study shows that
the two most popular partitions of the COI gene have quite
different amplification success in marine nematodes. Although the
Folmer primers have successfully been used in a wide range of
animals [34], including parasitic nematodes [37], their low
amplification success for free-living nematodes is a well known
problem [5,10] and is mainly caused by the high nucleotide
variability and indels at the primer sites [36]. Although the
mitochondrial COI gene is highly AT rich and shows high levels of
nucleotide variation even at second codon positions (Table 2), our
data show that primers can be developed, such as JB3 and JB5,
which clearly perform better than the universal Folmer primers.
Furthermore, the COI gene is able to differentiate almost all
nematode species tested in the present study. Similar results were
obtained in a barcoding study on parasitic nematode species [38]
where taxon specific primers were used to amplify ca 550 bp of the
Folmer and I3-M11 partitions [39]. These primers did not amplify
well in our marine specimens, illustrating that different primer sets
will be required when one wants to capture the whole diversity of
nematodes.
The COI gene discriminated all morphological species, except
for Paracanthonchus/Praeacanthonchus: although the distinction of the
two genera is subtle and species from the latter genus formerly
were placed in Paracanthonchus, the specimens identified here are
morphologically distinct and should therefore show distinct I3-
M11 sequences. The identical COI sequence may be the result of
mitochondrial introgression caused by ongoing hybridization or,
alternatively, by maternally inherited symbionts such as Wolbachia,
which may result in a considerable underestimation of species
diversity using DNA barcoding [40]. Although Wolbachia infections
are common in filaroid nematodes, they seem absent in
secernentean nematodes [41] and we are unaware of the infection
rate of Wolbachia in marine nematodes. The use of Wolbachia
specific primers in combination with a positive control (containing
DNA from infected filaroid nematodes) could reveal whether
Wolbachia is indeed present in the Paracanthonchus/Praeacanthonchus
specimens. Interestingly, the nine COI sequences showed a large
indel of nine amino acids compared to all other COI sequences.
This suggests that we may have amplified a nonfunctional numt.
Although numts are often characterized by the occurrence of stop
codons, frame shift mutations and indels [42], they may also
resemble quite well the original mitochondrial gene from which
they may then be difficult to distinguish [23]. Although the
number of numt sequences in the nematode genome seems to be
rather small [43,44], the lower rate of evolution of nuclear genes
compared to mitochondrial genes may also explain the identical
COI sequence in the case of the Paracanthonchus/Praeacanthonchus.
Clearly, further investigation is required to elucidate the cause of
the identical sequences of Paracanthonchus/Praeacanthonchus.
Regardless the possible occurrence of mitochondrial introgres-
sion or the presence of numts, a strict quality control of the
obtained sequences is required for nematodes. Eukaryotic and
prokaryotic organisms attached to the cuticula or present in the
gut of nematodes will be co-extracted [45]. Diatoms and other
microalgae are an important food source for many estuarine
nematode species [46]. In view of the limited number of COI
sequences available for marine nematodes, a strict quality control
of the obtained sequences is essential to build a reliable reference
database. Sequences with low signal and/or double peaks in the
chromatogram should be removed from the dataset, and abnormal
Barcoding Marine Nematodes
PLoS ONE | www.plosone.org 5 October 2010 | Volume 5 | Issue 10 | e13716
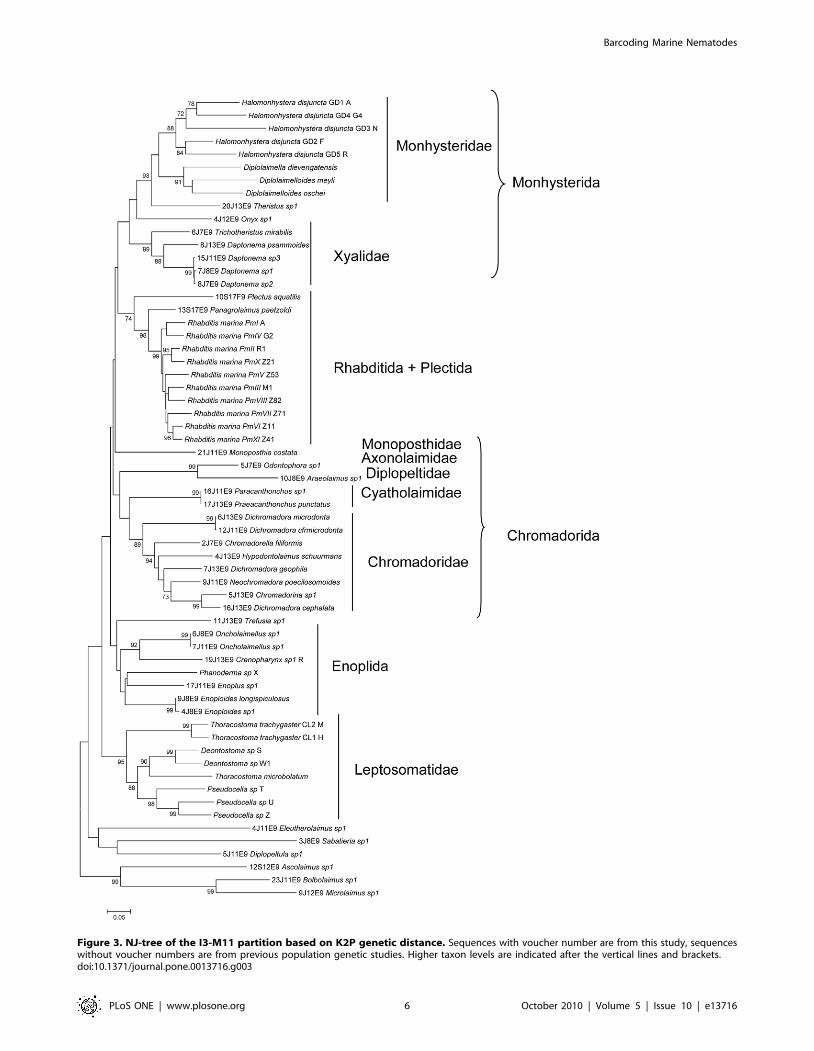
Figure 3. NJ-tree of the I3-M11 partition based on K2P genetic distance. Sequences with voucher number are from this study, sequenceswithout voucher numbers are from previous population genetic studies. Higher taxon levels are indicated after the vertical lines and brackets.doi:10.1371/journal.pone.0013716.g003
Barcoding Marine Nematodes
PLoS ONE | www.plosone.org 6 October 2010 | Volume 5 | Issue 10 | e13716
phylogenetic positions or long branches should alert the
investigator for possible non-homology with the genuine COI
gene. In the case of the Folmer partition, long branches and basal
positions in the tree may also be caused by insufficient taxon
sampling, but as long as we have no additional sequences from
closely related species of Ascolaimus and Araeolaimus, we were
cautious and removed the two sequences from our dataset.
The applicability of COI to recognize [47] and identify closely
related parasitic nematode species [37,38] also holds for marine
nematodes. In the present study, 99.5% of all intraspecific
comparisons showed genetic distances ,0.05, while 99.3% of all
interspecific comparisons where .0.05, suggesting that a threshold
of 0.05 K2P distance would discriminate most marine nematode
species using the I3-M11 partition. Yet, the presence of a
barcoding gap strongly depends on the metrics used [48] and on
the number of congeneric taxa sampled [49]. For the present
study, congeneric comparisons were limited to three genera and
involved very closely related cryptic species which may have the
smallest interspecific distance possible. On the other hand, this
threshold level corresponds remarkably well with that observed for
filaroid nematodes (0.048) [38]. The high concordance between
taxonomy and COI sequence data suggests that this threshold
value will identify closely related and cryptic species in a wide
range of nematode species. This is important, since barcoding
marine nematodes traditionally uses the 18S or the 28S genes
[10,36] which provide good resolution at the genus and higher
taxon level, but low resolution at the species level [5,14].
Barcoding marine nematodes would clearly benefit from a
multilocus approach where the large database of 18S and 28S
genes would provide a solid taxonomic framework and where the
I3-M11 partition would allow identification to species level.
ConclusionA proper molecular toolbox for identifying nematode species
should consider as many useful loci as possible, especially when the
currently available nuclear loci (18S and 28S) have low resolution
at the species level. The amplification across a wide taxonomic
range, the ease of sequence alignment and the variability pattern
render the I3-M11 partition of COI a good candidate to increase
the identification of marine nematode species, provided there is a
good reference database. Our results strongly indicate that
nematode DNA barcodes should be thoroughly screened to infer
their origin and homology state. Furthermore, digital vouchering
of nematode specimens prior to molecular analyses is required
especially in those studies that are intended to produce barcodes
for new nematode species. Only in this way can a reliable
reference database be built.
Supporting Information
Table S1 Overview of marine nematode taxa used for barcoding
with COI. (Number) corresponds to the numbers mentioned in
figures 1 and 2, (n) number of specimens collected for each species,
(locations) are Breskens (B), Paulina (P), Zeedorp (Z), Kruispol-
derhaven (K), Nieuwpoort (N), or permanent lab cultures (C).
Locations between brackets indicate where other specimens of the
species have been found. (Sequence length) indicates length of the
sequences, lengths in bold were amplified with JB2-JB5GED, a
dash indicates ambiguous sequences, blank spaces indicates a lack
Figure 4. NJ-tree of the Folmer partition based on K2P genetic distance. Higher taxon levels are indicated after the vertical lines andbrackets.doi:10.1371/journal.pone.0013716.g004
Table 2. Variability of the Folmer and I3M11 partitions.
Folmer I3-M11
16sequences
16sequences
54sequences
Sequence length 468–657 367–393 288–420
Alignment length 657 393 429
nucleotide variable sites ratio 0.68 0.638 0.68
amino acid variable sites ratio 0.64 0.565 0.66
K2P distance codon position 1 0.005–0.599 0.000–0.499 0.000–0.726
K2P distance codon position 2 0.000–0.297 0.000–0.300 0.000–0.427
K2P distance codon position 3 0.019–1.458 0.016–1.469 0.000–2.430
For the I3M11 partition, the variability was calculated using the same 16specimens for which we obtained high quality sequences for the Folmerpartition, and using the complete dataset with all 54 high quality sequences.doi:10.1371/journal.pone.0013716.t002
Barcoding Marine Nematodes
PLoS ONE | www.plosone.org 7 October 2010 | Volume 5 | Issue 10 | e13716
of PCR product to sequence, italic lengths indicate sequences from
previous studies. (Accession numbers) provides the accession
numbers for I3-M11 and M1-M6, with numbers in bold taken
from previous studies. (Indels) presence of indels in the sequence
alignment is indicated by x.
Found at: doi:10.1371/journal.pone.0013716.s001 (0.04 MB
XLS)
Acknowledgments
We are very grateful for the valuable discussions on technical aspects of the
study with Andy Vierstraete.
Author Contributions
Conceived and designed the experiments: SD. Performed the experiments:
SD JV AR. Analyzed the data: SD. Contributed reagents/materials/
analysis tools: SD TB TM. Wrote the paper: SD TB TM.
References
1. Heip C, Vincx M, Vranken G (1985) The ecology of marine nematodes.
Oceanography and Marine Biology 23: 399–489.
2. Leduc D (2009) Description of Oncholaimus moanae sp nov (Nematoda:
Oncholaimidae), with notes on feeding ecology based on isotopic and fattyacid composition. Journal of the Marine Biological Association of the United
Kingdom 89: 337–344.
3. De Mesel I, Derycke S, Moens T, Van der Gucht K, Vincx M, et al. (2004) Top-down impact of bacterivorous nematodes on the bacterial community structure:
a microcosm study. Environmental Microbiology 6: 733–744.
4. Hamels I, Moens T, Mutylaert K, Vyverman W (2001) Trophic interactionsbetween ciliates and nematodes from an intertidal flat. Aquatic Microbial
Ecology 26: 61–72.
5. De Ley P, De Ley IT, Morris K, Abebe E, Mundo-Ocampo M, et al. (2005) Anintegrated approach to fast and informative morphological vouchering of
nematodes for applications in molecular barcoding. Philosophical Transactionsof the Royal Society B-Biological Sciences 360: 1945–1958.
6. De Mesel I, Derycke S, Swings J, Vincx M, Moens T (2003) Influence of
bacterivorous nematodes on the decomposition of cordgrass. Journal ofExperimental Marine Biology and Ecology 296: 227–242.
7. De Mesel I, Derycke S, Swings J, Vincx M, Moens T (2006) Role of nematodesin decomposition processes: Does within-trophic group diversity matter? Marine
Ecology-Progress Series 321: 157–166.
8. dos Santos GAP, Derycke S, Genevois VGF, Coelho L, Correia MTS, et al.(2009) Interactions among bacterial-feeding nematode species at different levels
of food availability. Marine Biology 156: 629–640.
9. Postma-Blaauw MB, de Vries FT, de Goede RGM, Bloem J, Faber JH, et al.(2005) Within-trophic group interactions of bacterivorous nematode species and
their effects on the bacterial community and nitrogen mineralization. Oecologia142: 428–439.
10. Bhadury P, Austen MC, Bilton DT, Lambshead PJD, Rogers AD, et al. (2006)
Development and evaluation of a DNA-barcoding approach for the rapididentification of nematodes. Marine Ecology-Progress Series 320: 1–9.
11. Floyd R, Abebe E, Papert A, Blaxter M (2002) Molecular barcodes for soil
nematode identification. Molecular Ecology 11: 839–850.
12. Porazinska DL, Giblin-Davis RM, Faller L, Farmerie W, Kanzaki N, et al.
(2009) Evaluating high-throughput sequencing as a method for metagenomic
analysis of nematode diversity. Molecular Ecology Resources 9: 1439–1450.
13. Fitch DHA, Bugajgaweda B, Emmons SW (1995) 18S ribosomal-RNA gene
phylogeny for some Rhabditidae related to Caenorhabditis. Molecular Biology and
Evolution 12: 346–358.
14. Meldal BHM, Debenham NJ, De Ley P, De Ley IT, Vanfleteren JR, et al.
(2007) An improved molecular phylogeny of the Nematoda with special
emphasis on marine taxa. Molecular Phylogenetics and Evolution 42: 622–636.
15. Derycke S, De Ley P, De Ley IT, Holovachov O, Rigaux A, et al. (2010) Linking
DNA sequences to morphology: cryptic diversity and population genetic
structure in the marine nematode Thoracostoma trachygaster (Nematoda, Leptoso-
matidae). Zoologica Scripta 39: 276–289.
16. Avise J (1994) Molecular markers, Natural History and Evolution.
17. Hebert PDN, Ratnasingham S, deWaard JR (2003) Barcoding animal life:
cytochrome c oxidase subunit 1 divergences among closely related species.
Proceedings of the Royal Society of London Series B-Biological Sciences 270:
S96–S99.
18. Hollingsworth PM, Forrest LL, Spouge JL, Hajibabaei M, Ratnasingham S,
et al. (2009) A DNA barcode for land plants. Proc Natl Acad Sci U S A 106:
12794–12797.
19. Huang DW, Meier R, Todd PA, Chou LM (2008) Slow mitochondrial COI
sequence evolution at the base of the metazoan tree and its implications for DNA
barcoding. Journal of Molecular Evolution 66: 167–174.
20. Seifert KA, Samson RA, Dewaard JR, Houbraken J, Levesque CA, et al. (2007)
Prospects for fungus identification using CO1 DNA barcodes, with Penicillium as
a test case. Proc Natl Acad Sci U S A 104: 3901–3906.
21. Erpenbeck D, Hooper JNA, Worheide G (2006) CO1 phylogenies in diploblasts
and the ‘Barcoding of Life’ - are we sequencing a suboptimal partition? Mol Ecol
Notes 6: 550–553.
22. Seifert KA (2009) Progress towards DNA barcoding of fungi. Molecular Ecology
Resources 9: 83–89.
23. Song H, Buhay JE, Whiting MF, Crandall KA (2008) Many species in one: DNA
barcoding overestimates the number of species when nuclear mitochondrial
pseudogenes are coamplified. Proc Natl Acad Sci U S A 105: 13486–13491.
24. Folmer O, Black M, Hoeh W, Lutz R, R V (1994) DNA primers for
amplification of mitochondrial cytochrome c oxidase subunit I from diverse
metazoan invertebrates. Molecular Marine Biology and Biotechnology 3:
294–299.
Figure 5. Relative frequencies of K2P-genetic distances within species (black), between congeneric species (grey) and betweenspecies from different genera (white).doi:10.1371/journal.pone.0013716.g005
Barcoding Marine Nematodes
PLoS ONE | www.plosone.org 8 October 2010 | Volume 5 | Issue 10 | e13716
25. Derycke S, Backeljau T, Vlaeminck C, Vierstraete A, Vanfleteren J, et al. (2007)
Spatiotemporal analysis of population genetic structure in Geomonhystera disjuncta
(Nematoda, Monhysteridae) reveals high levels of molecular diversity. Marine
Biology 151: 1799–1812.
26. Derycke S, Remerie T, Backeljau T, Vierstraete A, Vanfleteren J, et al. (2008)Phylogeography of the Rhabditis (Pellioditis) marina species complex: evidence for
long-distance dispersal, and for range expansions and restricted gene flow in thenortheast Atlantic. Molecular Ecology 17: 3306–3322.
27. Bowles J, Blair D, McManus DP (1992) Genetic variants within the genus
Echinococcus identified by mitochondrial DNA sequencing. Molecular andBiochemical Parasitology 54: 165–174.
28. Hu M, Chilton NB, Zhu XQ, Gasser RB (2002) Single-strand conformationpolymorphism-based analysis of mitochondrial cytochrome c oxidase subunit 1
reveals significant substructuring in hookworm populations. Electrophoresis 23:27–34.
29. Derycke S, Remerie T, Vierstraete A, Backeljau T, Vanfleteren J, et al. (2005)
Mitochondrial DNA variation and cryptic speciation within the free-livingmarine nematode Pellioditis marina. Marine Ecology-Progress Series 300: 91–103.
30. Galtier N, Gouy M, Gautier C (1996) SEAVIEW and PHYLO_WIN: Twographic tools for sequence alignment and molecular phylogeny. Computer
Applications in the Biosciences 12: 543–548.
31. Edgar RC (2004) MUSCLE: multiple sequence alignment with high accuracyand high throughput. Nucleic Acids Research 32: 1792–1797.
32. Jacob JEM, Vanholme B, Van Leeuwen T, Gheysen G (2009) A unique geneticcode change in the mitochondrial genome of the parasitic nematode Radopholus
similis. BMC Reserach Notes 2: 192–202.33. Tamura K, Dudley J, Nei M, Kumar S (2007) MEGA4: Molecular evolutionary
genetics analysis (MEGA) software version 4.0. Molecular Biology and Evolution
24: 1596–1599.34. Hebert PDN, Cywinska A, Ball SL, DeWaard JR (2003) Biological identifica-
tions through DNA barcodes. Proceedings of the Royal Society of London SeriesB-Biological Sciences 270: 313–321.
35. dos Santos GAP, Derycke S, Fonseca-Genevois VG, Coelho L, Correia MTS,
et al. (2008) Differential effects of food availability on population growth andfitness of three species of estuarine, bacterial-feeding nematodes. Journal of
Experimental Marine Biology and Ecology 355: 27–40.36. Creer S, Fonseca VG, Porazinska DL, Giblin-Davis RM, Sung W, et al. (2010)
Ultrasequencing of the meiofaunal biosphere: practice, pitfalls and promises.Molecular Ecology 19: 4–20.
37. Elsasser SC, Floyd R, Hebert PDN, Schulte-Hostedde AI (2009) Species
identification of North American guinea worms (Nematoda: Dracunculus) with
DNA barcoding. Molecular Ecology Resources 9: 707–712.
38. Ferri E, Barbuto M, Bain O, Galimberti A, Uni S, et al. (2009) Integrated
taxonomy: traditional approach and DNA barcoding for the identification of
filarioid worms and related parasites (Nematoda). Frontiers in Zoology 6: Article
Number 1.
39. Casiraghi M, Anderson TJC, Bandi C, Bazzocchi C, Genchi C (2001) A
phylogenetic analysis of filarial nematodes: comparison with the phylogeny of
Wolbachia endosymbionts. Parasitology 122: 93–103.
40. Whitworth TL, Dawson RD, Magalon H, Baudry E (2007) DNA barcoding
cannot reliably identify species of the blowfly genus Protocalliphora (Diptera:
Calliphoridae). Proceedings of the Royal Society B-Biological Sciences 274:
1731–1739.
41. Bordenstein SR, Fitch DHA, Werren JH (2003) Absence of Wolbachia in
nonfilariid nematodes. Journal of Nematology 35: 266–270.
42. Zhang DX, Hewitt GM (1996) Nuclear integrations: Challenges for mitochon-
drial DNA markers. Trends in Ecology & Evolution 11: 247–251.
43. Bensasson D, Zhang DX, Hartl DL, Hewitt GM (2001) Mitochondrial
pseudogenes: evolution’s misplaced witnesses. Trends in Ecology & Evolution
16: 314–321.
44. Richly E, Leister D (2004) NUMTs in sequenced eukaryotic genomes.
Molecular Biology and Evolution 21: 1081–1084.
45. Bhadury P, Bridge PD, Austen MC, Bilton DT, Smerdon GR (2009) Detection
of fungal 18S rRNA sequences in conjunction with marine nematode 18S rRNA
amplicons. Aquatic Biology 5: 149–155.
46. Moens T, Vincx M (1997) Observations on the feeding ecology of estuarine
nematodes. Journal of the Marine Biological Association of the United Kingdom
77: 211–227.
47. Blouin MS (2002) Molecular prospecting for cryptic species of nematodes:
mitochondrial DNA versus internal transcribed spacer. International Journal for
Parasitology 32: 527–531.
48. Meier R, Zhang GY, Ali F (2008) The use of mean instead of smallest
interspecific distances exaggerates the size of the ‘‘barcoding gap’’ and leads to
misidentification. Systematic Biology 57: 809–813.
49. Jansen G, Savolainen R, Vepsalainen K (2009) DNA barcoding as a heuristic
tool for classifying undescribed Nearctic Myrmica ants (Hymenoptera:
Formicidae). Zoologica Scripta 38: 527–536.
Barcoding Marine Nematodes
PLoS ONE | www.plosone.org 9 October 2010 | Volume 5 | Issue 10 | e13716
Related Documents