Exploring the Social-Spatial Context of the Energy Transition Dr Sangeetha Chandrashekeran, Fanqi Li • School of Geography • geography.unimelb.edu.au • Melbourne Sustainable Society Institute • sustainable.unimelb.edu.au 1

Welcome message from author
This document is posted to help you gain knowledge. Please leave a comment to let me know what you think about it! Share it to your friends and learn new things together.
Transcript
Exploring the Social-Spatial Context of the Energy Transition
Dr Sangeetha Chandrashekeran, Fanqi Li
• School of Geography• geography.unimelb.edu.au
• Melbourne Sustainable Society Institute• sustainable.unimelb.edu.au 1
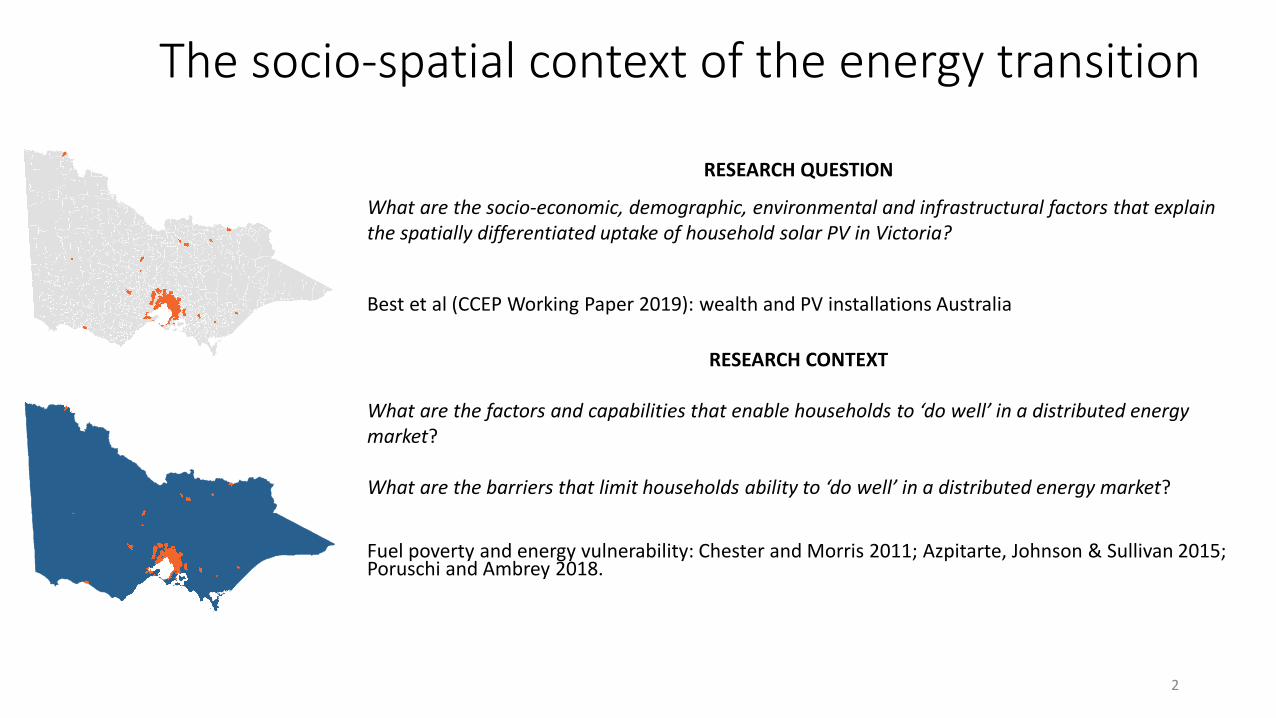
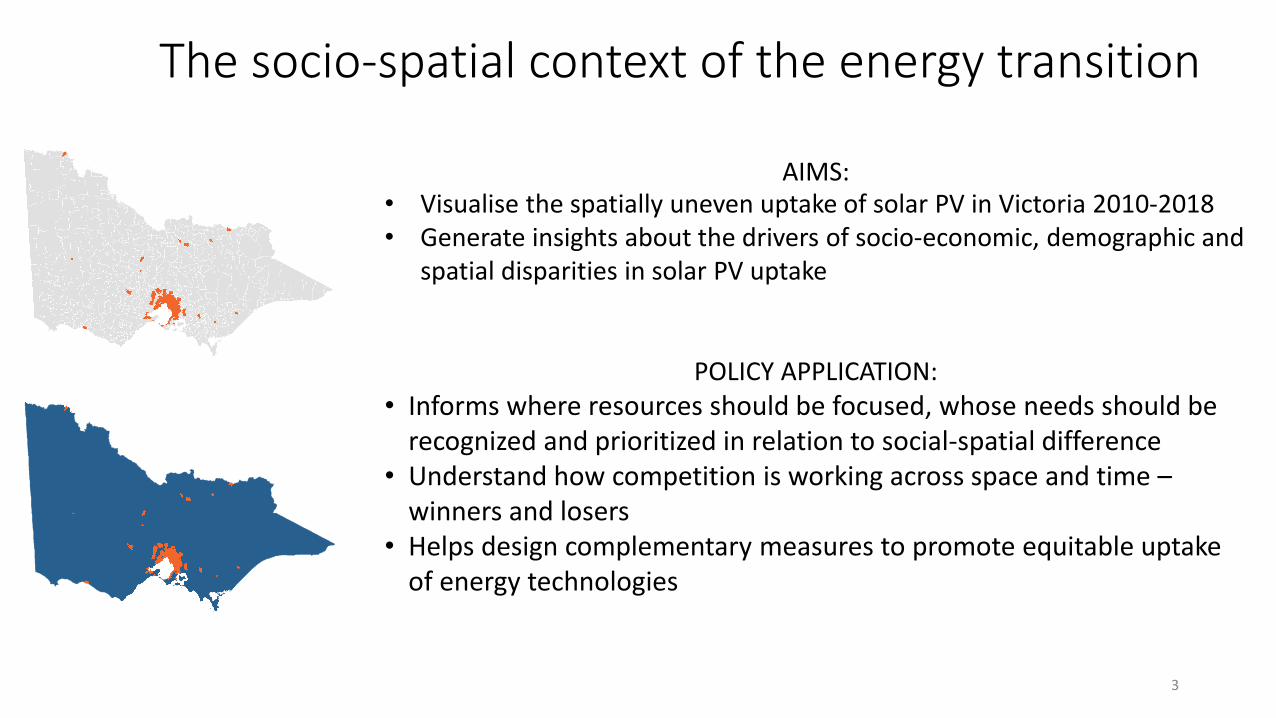
The socio-spatial context of the energy transition
RESEARCH QUESTION
What are the socio-economic, demographic, environmental and infrastructural factors that explain the spatially differentiated uptake of household solar PV in Victoria?
Best et al (CCEP Working Paper 2019): wealth and PV installations Australia
RESEARCH CONTEXT
What are the factors and capabilities that enable households to ‘do well’ in a distributed energy market?
What are the barriers that limit households ability to ‘do well’ in a distributed energy market?
Fuel poverty and energy vulnerability: Chester and Morris 2011; Azpitarte, Johnson & Sullivan 2015; Poruschi and Ambrey 2018.
2
The socio-spatial context of the energy transition
AIMS:• Visualise the spatially uneven uptake of solar PV in Victoria 2010-2018• Generate insights about the drivers of socio-economic, demographic and
spatial disparities in solar PV uptake
POLICY APPLICATION:• Informs where resources should be focused, whose needs should be
recognized and prioritized in relation to social-spatial difference • Understand how competition is working across space and time –
winners and losers• Helps design complementary measures to promote equitable uptake
of energy technologies
3
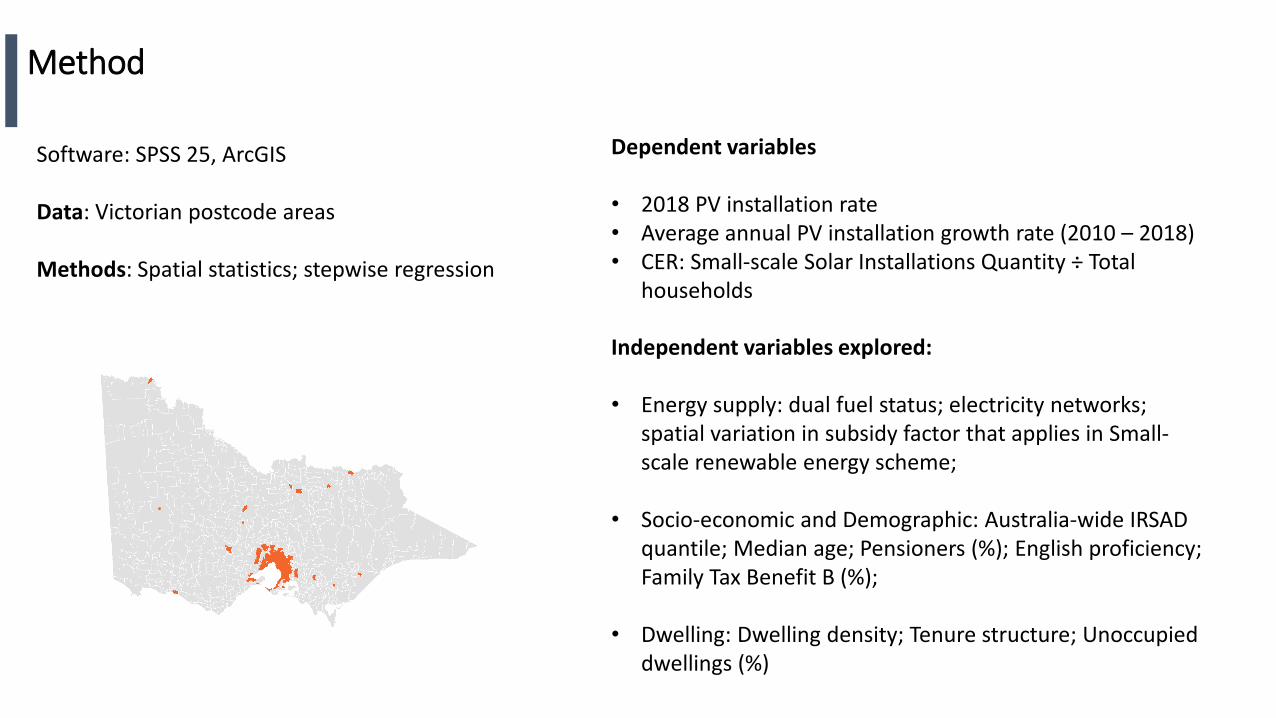
Method
Software: SPSS 25, ArcGIS
Data: Victorian postcode areas
Methods: Spatial statistics; stepwise regression
Dependent variables
• 2018 PV installation rate• Average annual PV installation growth rate (2010 – 2018)• CER: Small-scale Solar Installations Quantity ÷ Total
households
Independent variables explored:
• Energy supply: dual fuel status; electricity networks; spatial variation in subsidy factor that applies in Small-scale renewable energy scheme;
• Socio-economic and Demographic: Australia-wide IRSAD quantile; Median age; Pensioners (%); English proficiency; Family Tax Benefit B (%);
• Dwelling: Dwelling density; Tenure structure; Unoccupied dwellings (%)
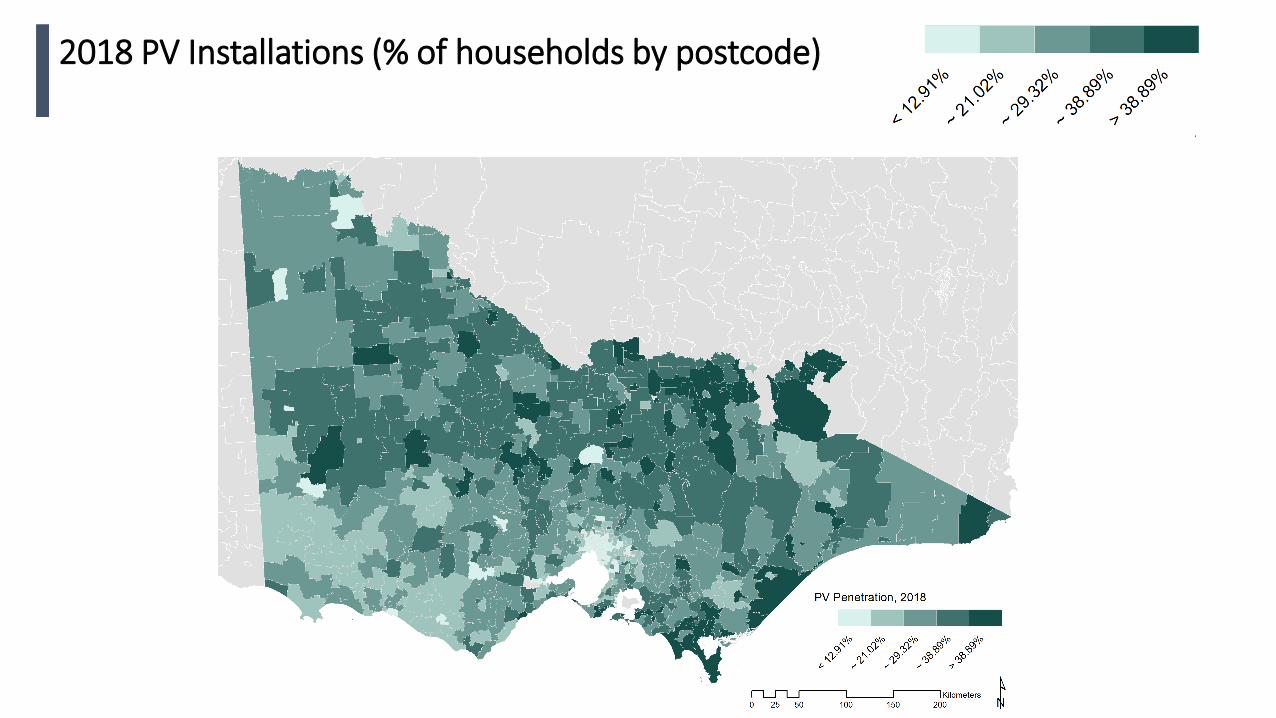
2018 PV Installations (% of households by postcode)
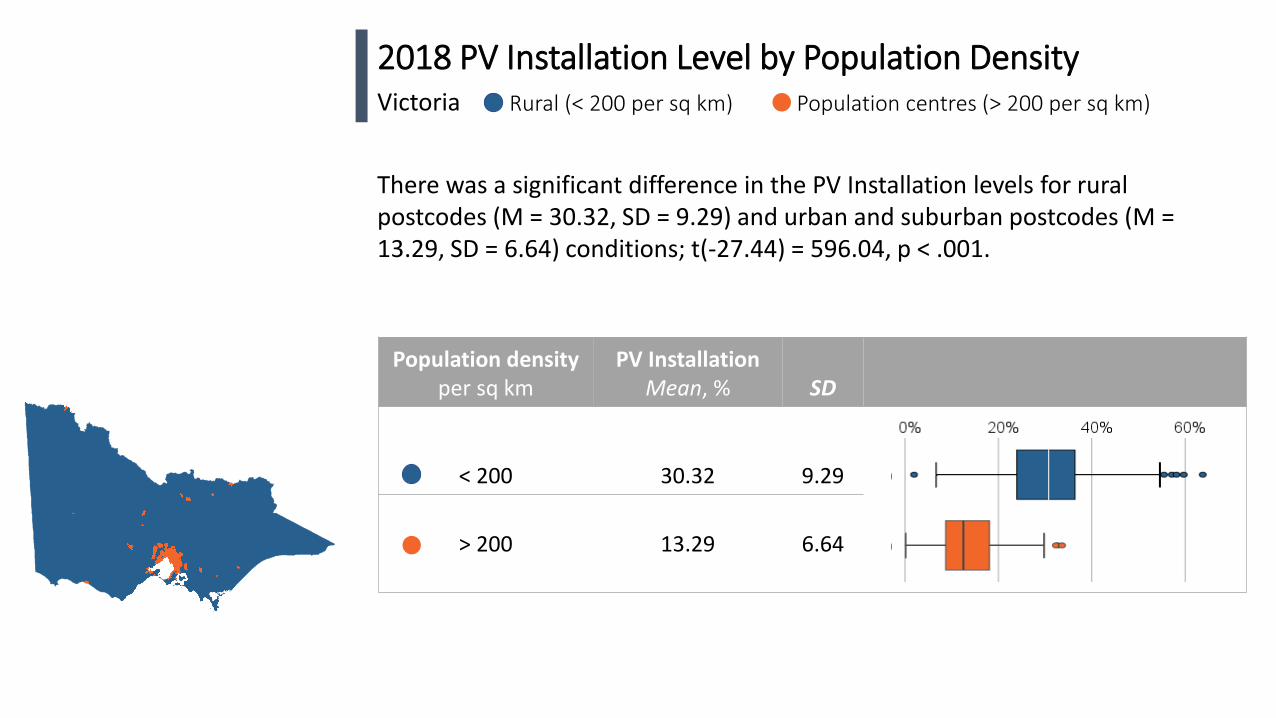
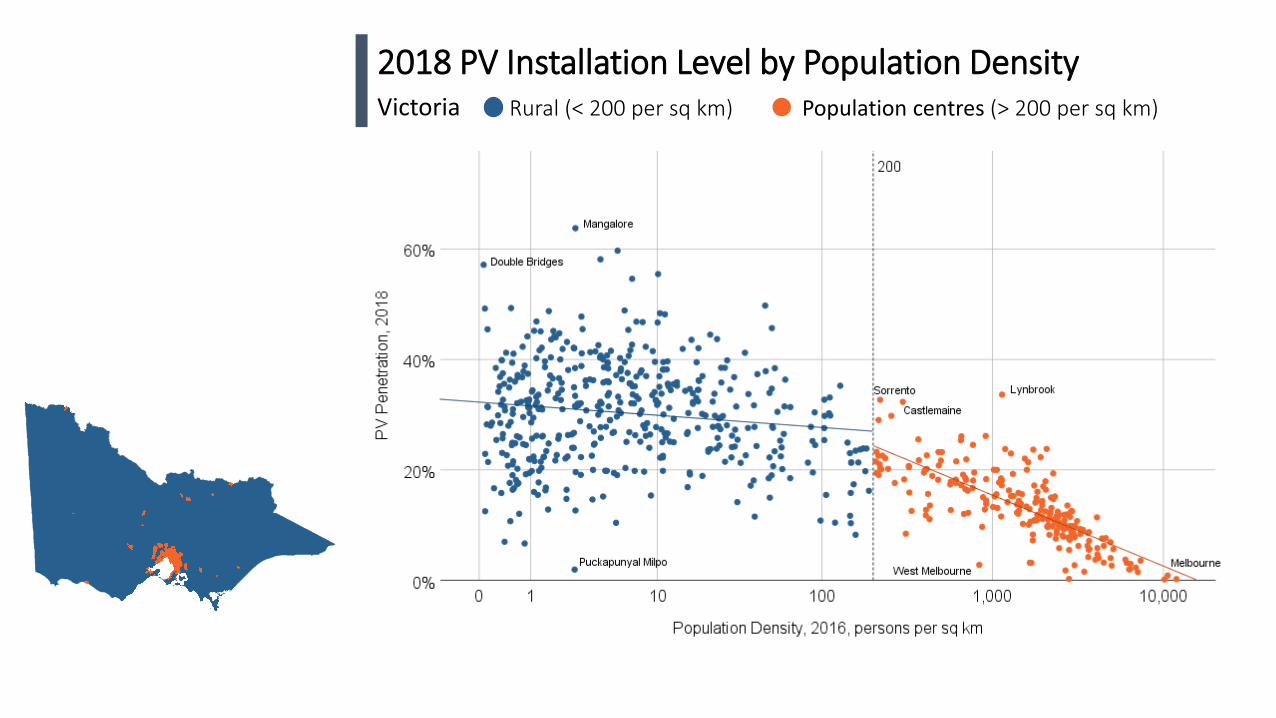
2018 PV Installation Level by Population DensityVictoria Rural (< 200 per sq km) Population centres (> 200 per sq km)
There was a significant difference in the PV Installation levels for rural postcodes (M = 30.32, SD = 9.29) and urban and suburban postcodes (M = 13.29, SD = 6.64) conditions; t(-27.44) = 596.04, p < .001.
Population densityper sq km
PV InstallationMean, % SD
< 200 30.32 9.29
> 200 13.29 6.64
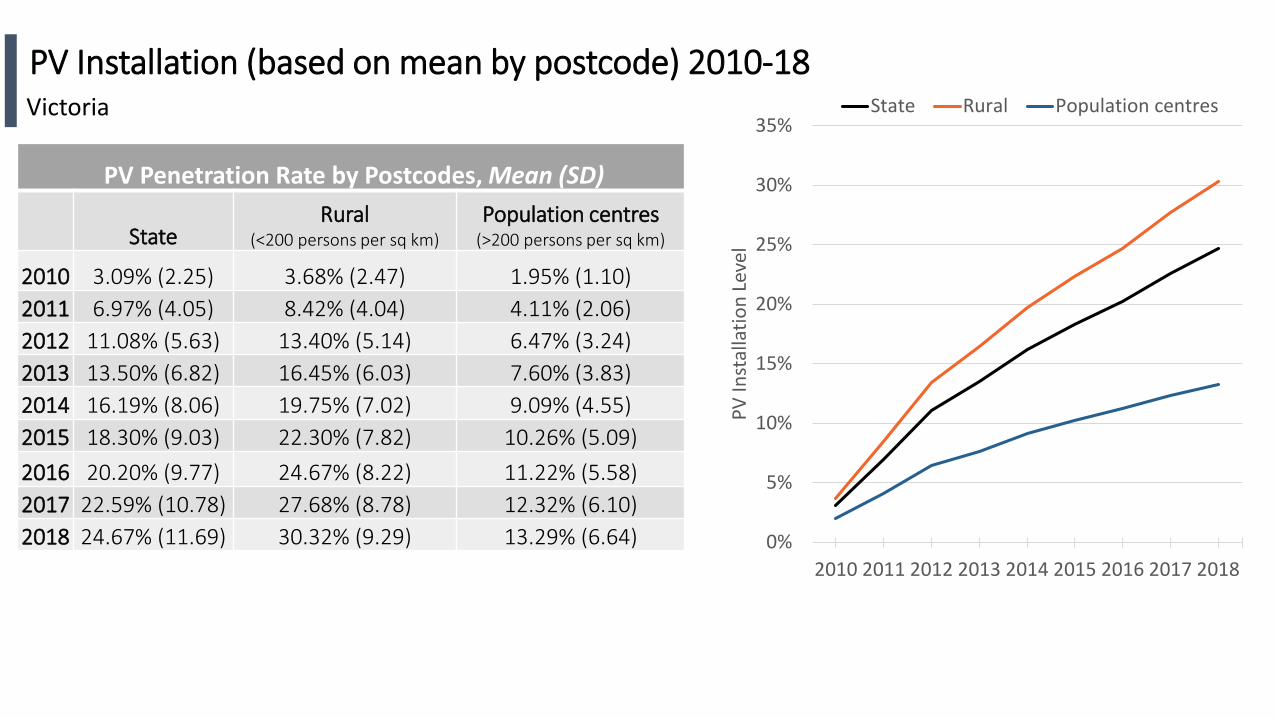
PV Installation (based on mean by postcode) 2010-18Victoria
PV Penetration Rate by Postcodes, Mean (SD)
StateRural
(<200 persons per sq km)Population centres
(>200 persons per sq km)
2010 3.09% (2.25) 3.68% (2.47) 1.95% (1.10)2011 6.97% (4.05) 8.42% (4.04) 4.11% (2.06)2012 11.08% (5.63) 13.40% (5.14) 6.47% (3.24)2013 13.50% (6.82) 16.45% (6.03) 7.60% (3.83)2014 16.19% (8.06) 19.75% (7.02) 9.09% (4.55)2015 18.30% (9.03) 22.30% (7.82) 10.26% (5.09)2016 20.20% (9.77) 24.67% (8.22) 11.22% (5.58)2017 22.59% (10.78) 27.68% (8.78) 12.32% (6.10)2018 24.67% (11.69) 30.32% (9.29) 13.29% (6.64) 0%
5%
10%
15%
20%
25%
30%
35%
2010 2011 2012 2013 2014 2015 2016 2017 2018
PV In
stal
latio
n Le
vel
State Rural Population centres
2018 PV Installation Level by Population DensityVictoria Rural (< 200 per sq km) Population centres (> 200 per sq km)
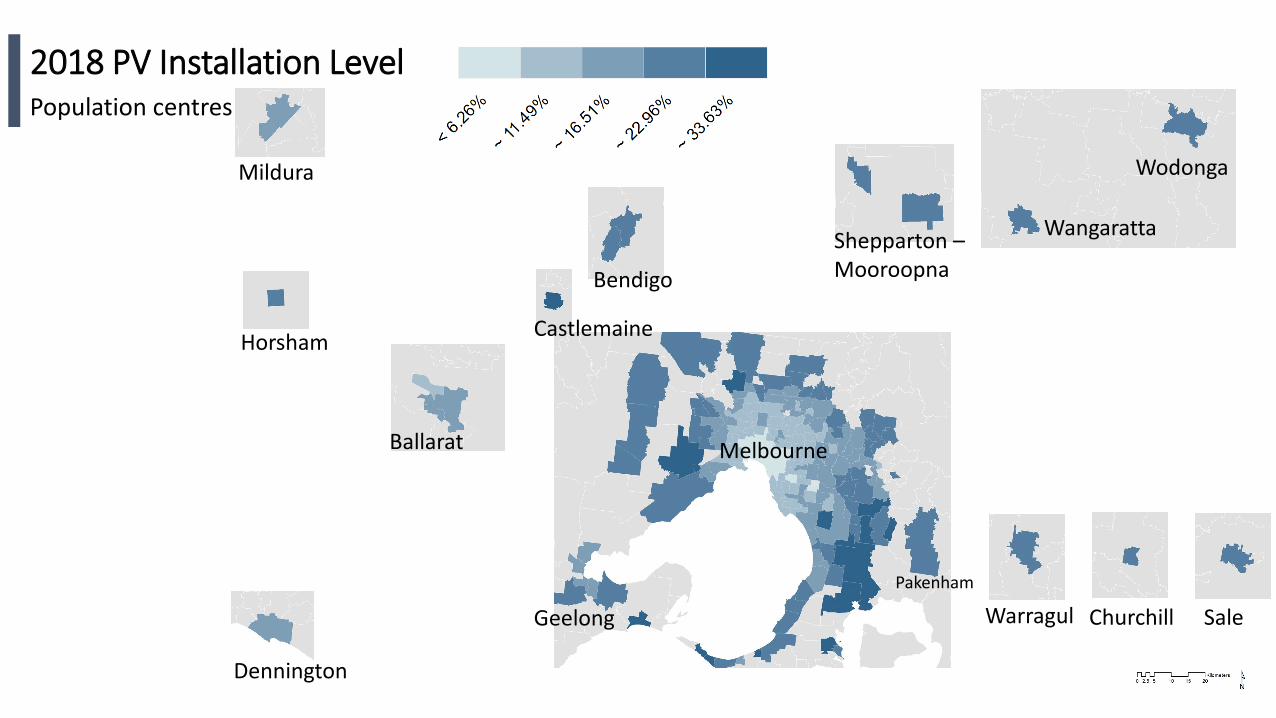
2018 PV Installation LevelPopulation centres
Sale
Ballarat
Castlemaine
Shepparton –MooroopnaBendigo
Warragul Churchill
Wodonga
Wangaratta
Horsham
Mildura
Dennington
Melbourne
GeelongPakenham
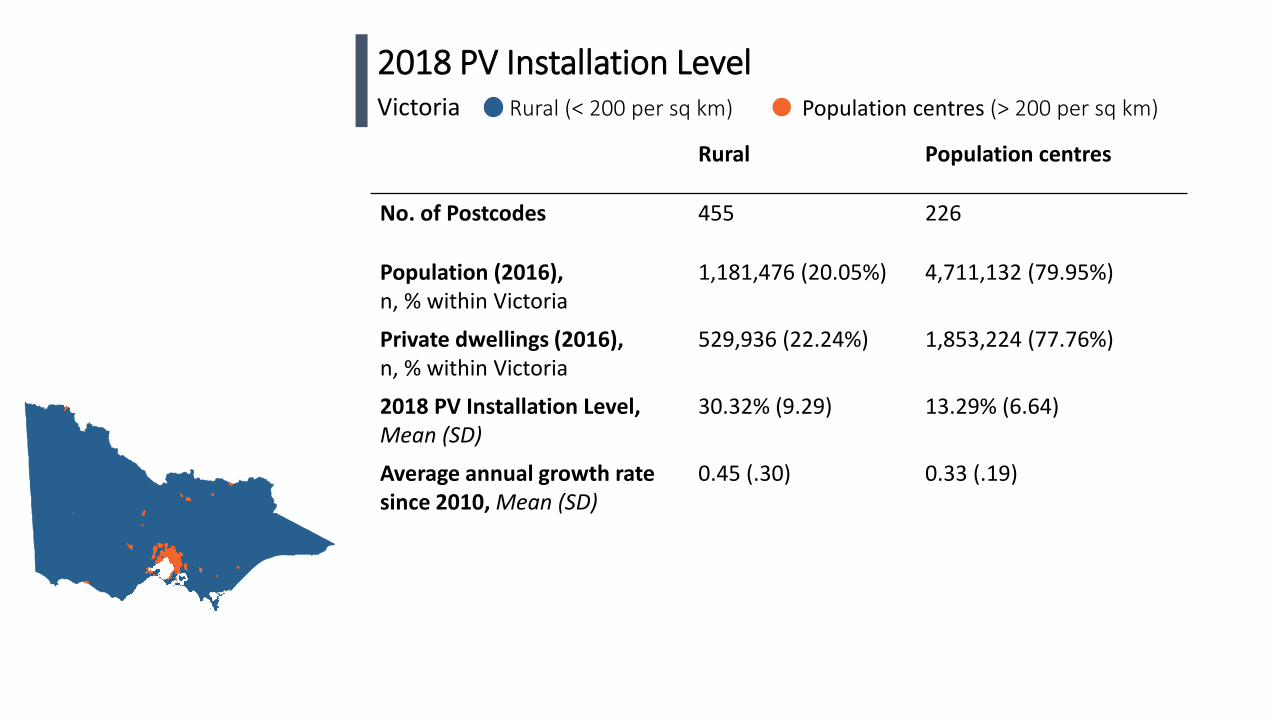
Rural Population centres
No. of Postcodes 455 226
Population (2016),n, % within Victoria
1,181,476 (20.05%) 4,711,132 (79.95%)
Private dwellings (2016),n, % within Victoria
529,936 (22.24%) 1,853,224 (77.76%)
2018 PV Installation Level, Mean (SD)
30.32% (9.29) 13.29% (6.64)
Average annual growth rate since 2010, Mean (SD)
0.45 (.30) 0.33 (.19)
2018 PV Installation LevelVictoria Rural (< 200 per sq km) Population centres (> 200 per sq km)
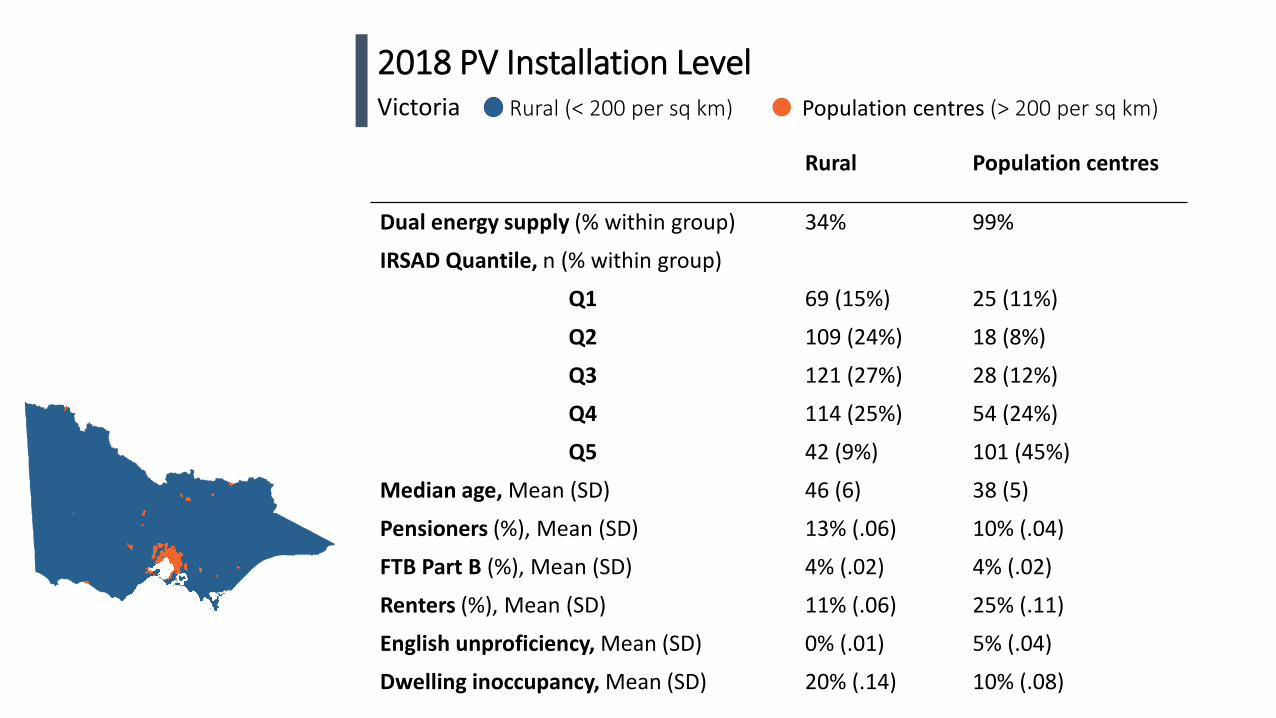
Rural Population centres
Dual energy supply (% within group) 34% 99%
IRSAD Quantile, n (% within group)
Q1 69 (15%) 25 (11%)
Q2 109 (24%) 18 (8%)
Q3 121 (27%) 28 (12%)
Q4 114 (25%) 54 (24%)
Q5 42 (9%) 101 (45%)
Median age, Mean (SD) 46 (6) 38 (5)
Pensioners (%), Mean (SD) 13% (.06) 10% (.04)
FTB Part B (%), Mean (SD) 4% (.02) 4% (.02)
Renters (%), Mean (SD) 11% (.06) 25% (.11)
English unproficiency, Mean (SD) 0% (.01) 5% (.04)
Dwelling inoccupancy, Mean (SD) 20% (.14) 10% (.08)
2018 PV Installation LevelVictoria Rural (< 200 per sq km) Population centres (> 200 per sq km)
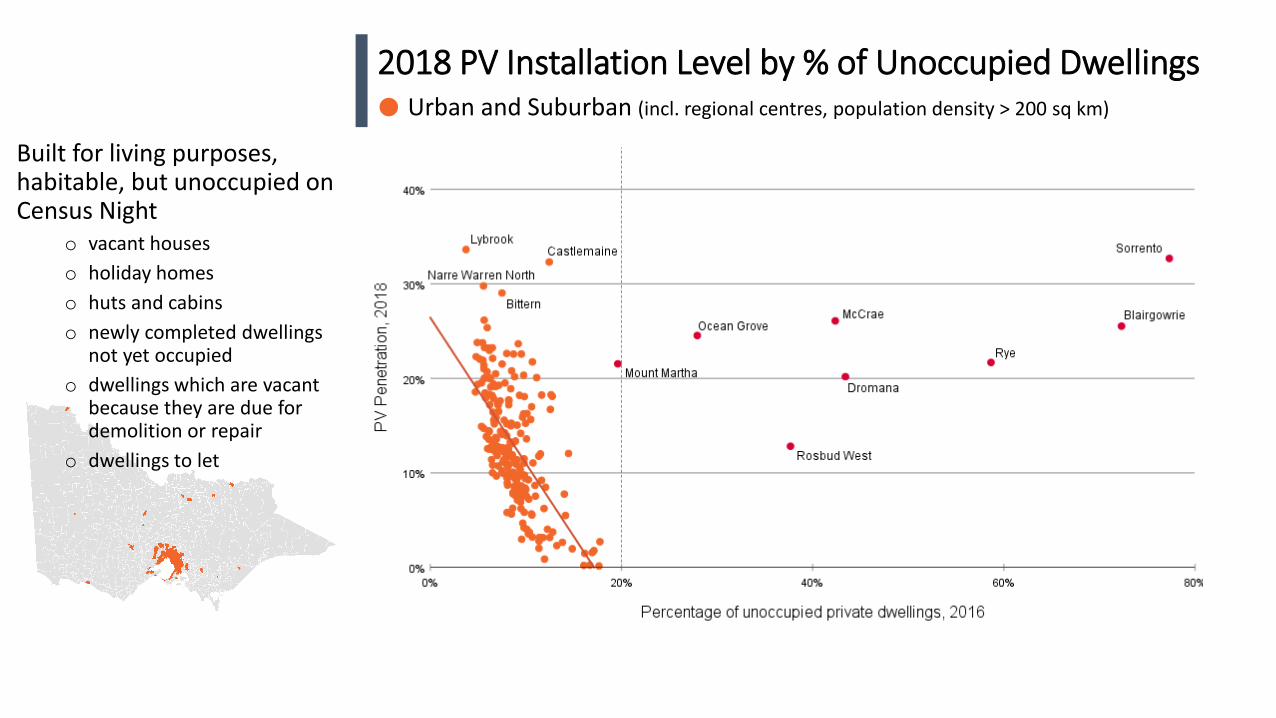
2018 PV Installation Level by % of Unoccupied DwellingsUrban and Suburban (incl. regional centres, population density > 200 sq km)
Built for living purposes, habitable, but unoccupied on Census Night
o vacant houseso holiday homeso huts and cabinso newly completed dwellings
not yet occupiedo dwellings which are vacant
because they are due for demolition or repair
o dwellings to let
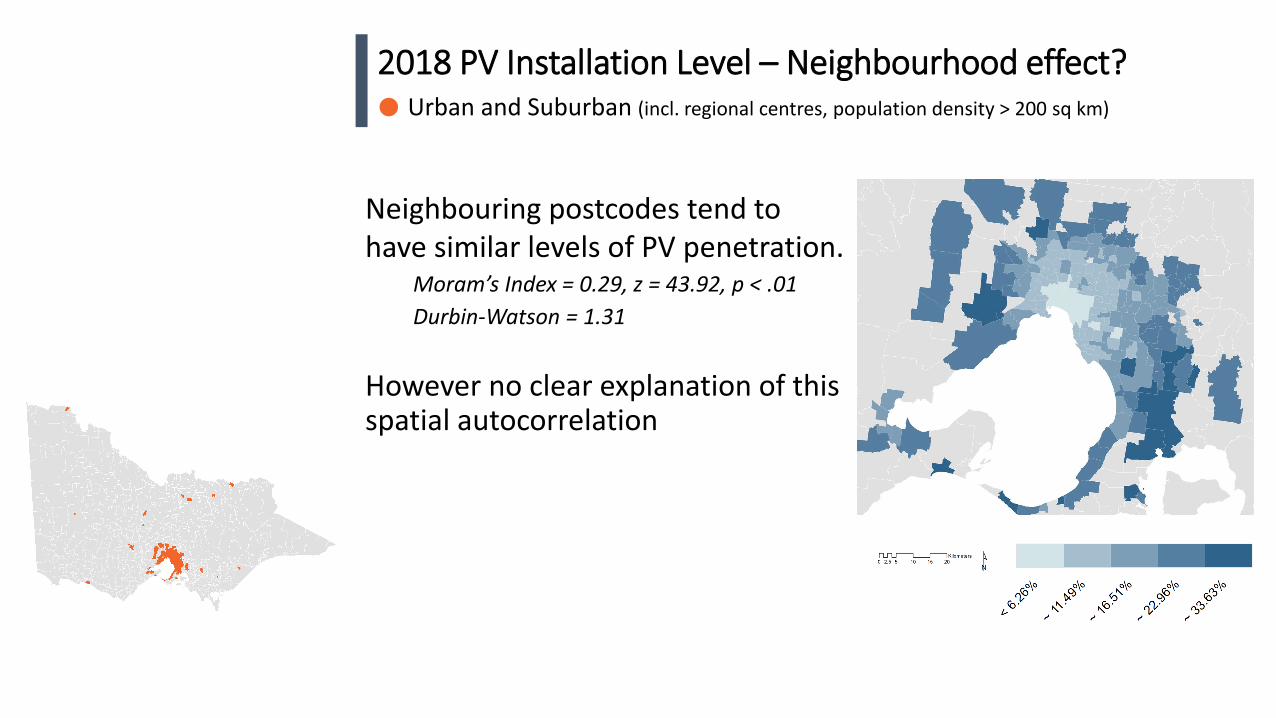
2018 PV Installation Level – Neighbourhood effect?Urban and Suburban (incl. regional centres, population density > 200 sq km)
Neighbouring postcodes tend to have similar levels of PV penetration.
Moram’s Index = 0.29, z = 43.92, p < .01Durbin-Watson = 1.31
However no clear explanation of this spatial autocorrelation
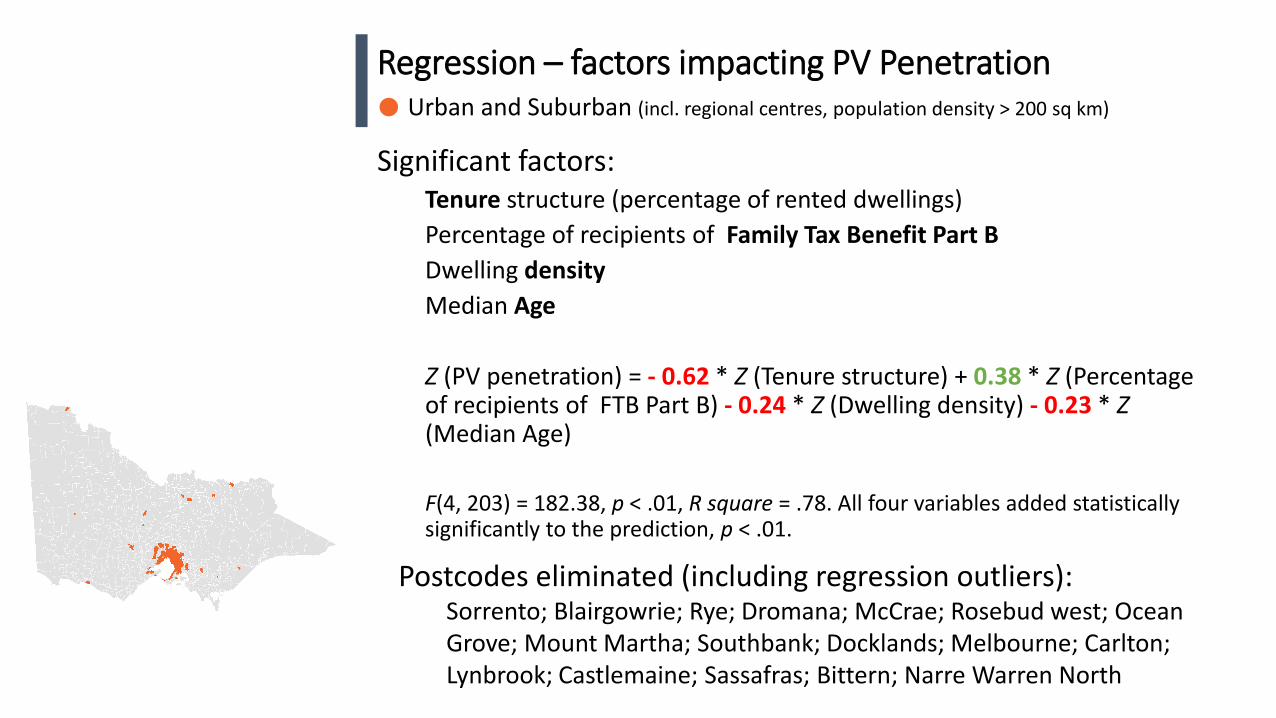
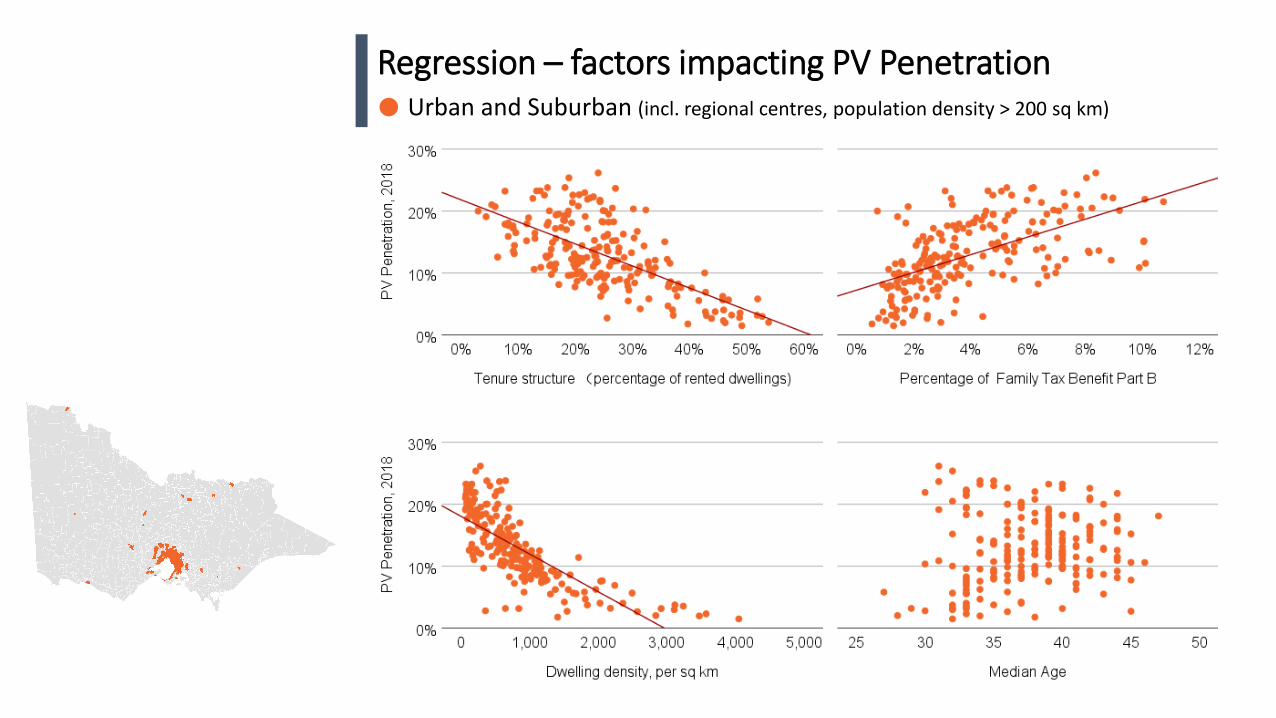
Regression – factors impacting PV PenetrationUrban and Suburban (incl. regional centres, population density > 200 sq km)
Significant factors:Tenure structure (percentage of rented dwellings)Percentage of recipients of Family Tax Benefit Part BDwelling densityMedian Age
Z (PV penetration) = - 0.62 * Z (Tenure structure) + 0.38 * Z (Percentage of recipients of FTB Part B) - 0.24 * Z (Dwelling density) - 0.23 * Z(Median Age)
F(4, 203) = 182.38, p < .01, R square = .78. All four variables added statistically significantly to the prediction, p < .01.
Postcodes eliminated (including regression outliers):Sorrento; Blairgowrie; Rye; Dromana; McCrae; Rosebud west; Ocean Grove; Mount Martha; Southbank; Docklands; Melbourne; Carlton; Lynbrook; Castlemaine; Sassafras; Bittern; Narre Warren North
Regression – factors impacting PV PenetrationUrban and Suburban (incl. regional centres, population density > 200 sq km)
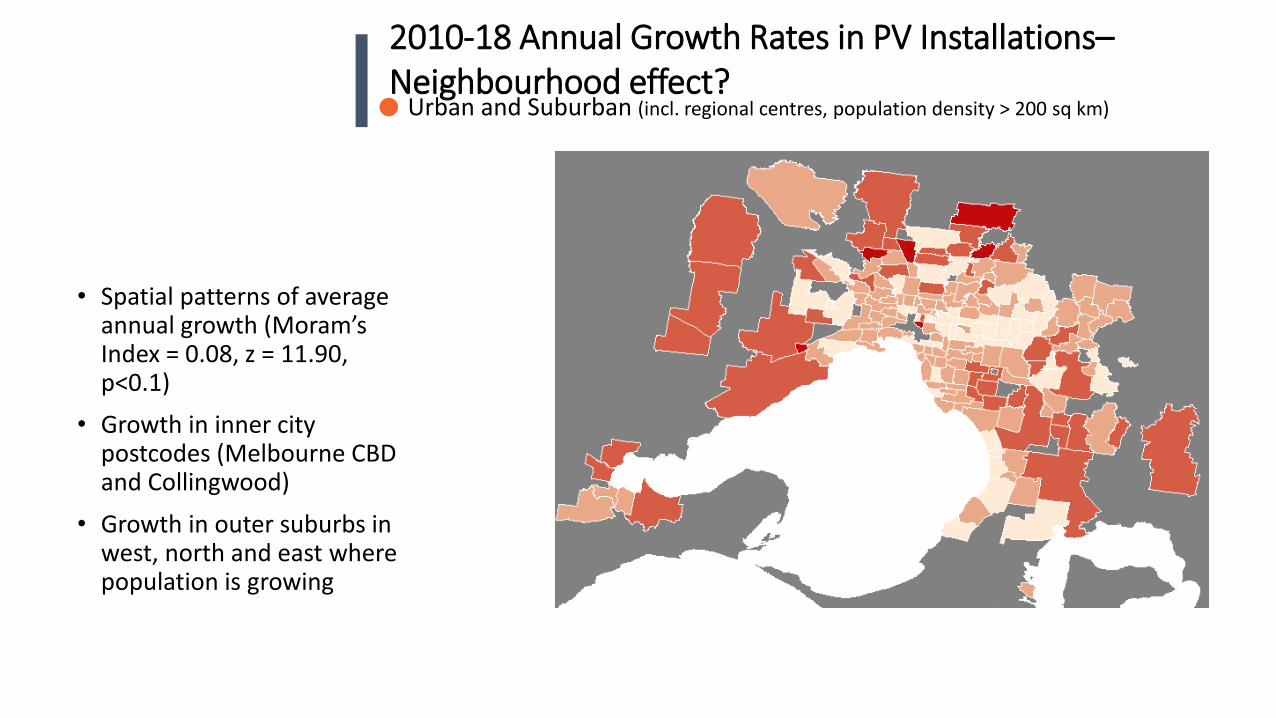
• Spatial patterns of average annual growth (Moram’sIndex = 0.08, z = 11.90, p<0.1)
• Growth in inner city postcodes (Melbourne CBD and Collingwood)
• Growth in outer suburbs in west, north and east where population is growing
2010-18 Annual Growth Rates in PV Installations–Neighbourhood effect?
Urban and Suburban (incl. regional centres, population density > 200 sq km)
Regression – factors impacting PV Penetration
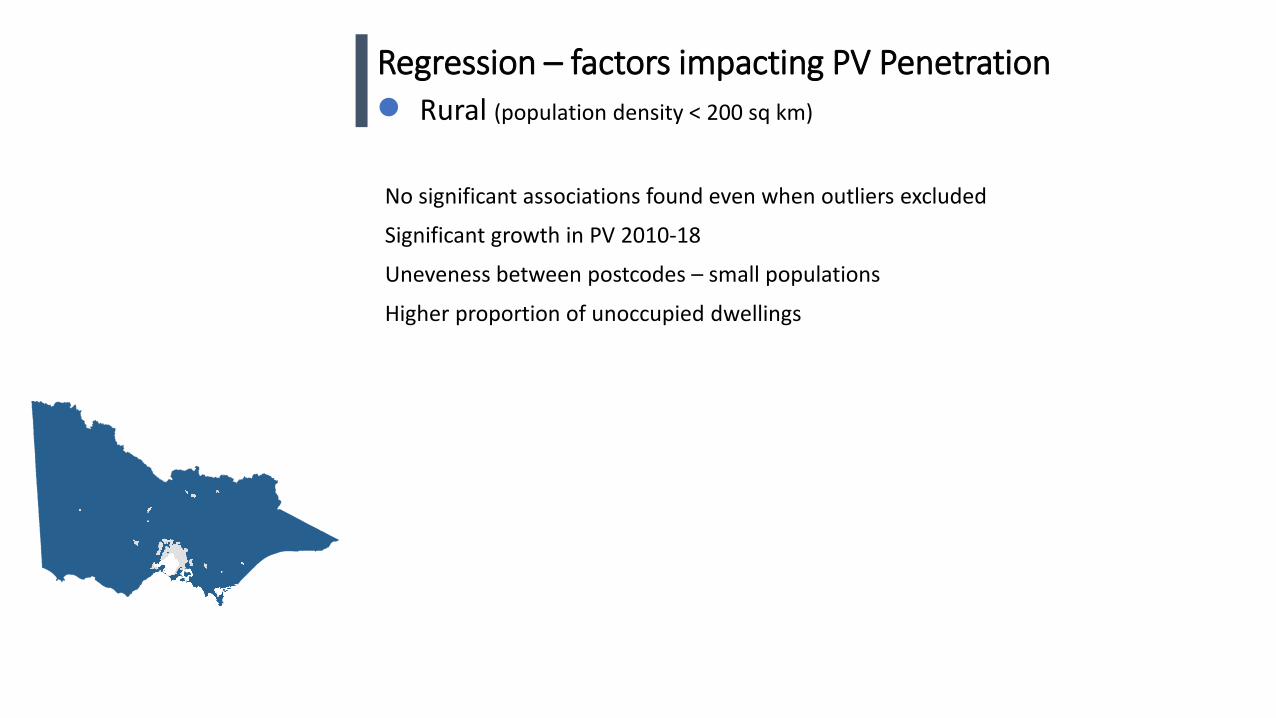
No significant associations found even when outliers excluded
Significant growth in PV 2010-18
Uneveness between postcodes – small populations
Higher proportion of unoccupied dwellings
Rural (population density < 200 sq km)
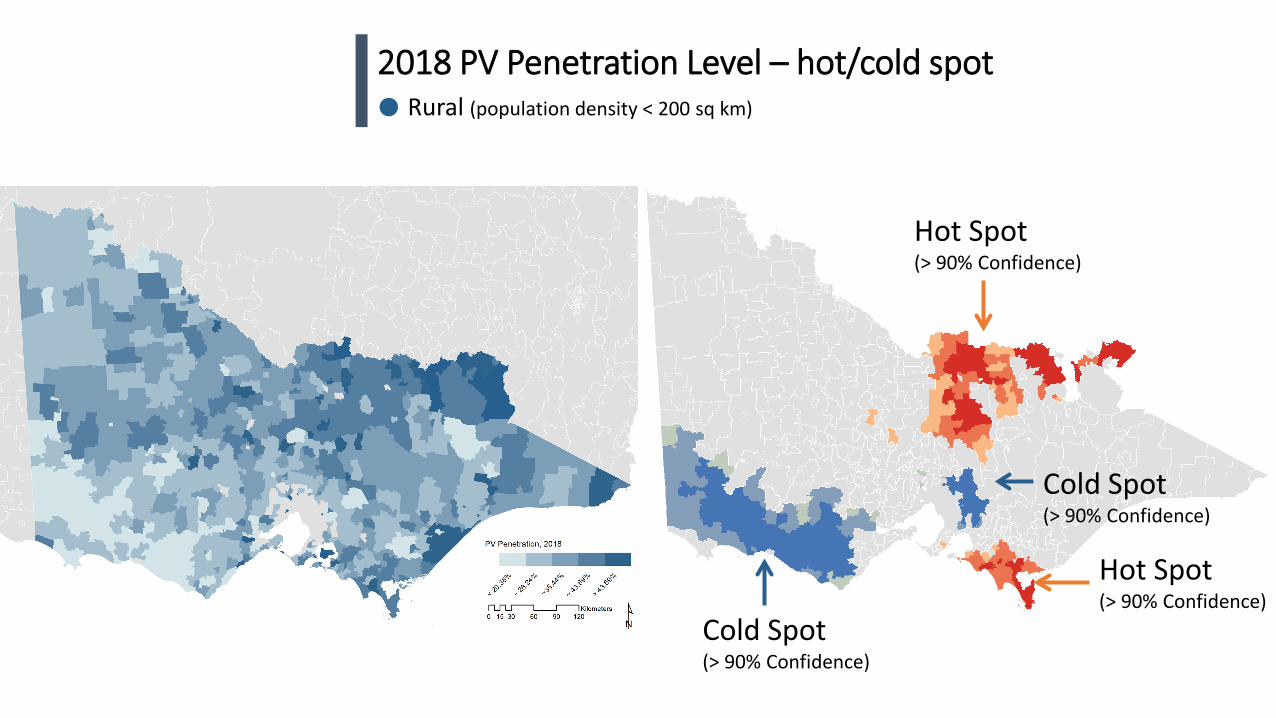
2018 PV Penetration Level – hot/cold spotRural (population density < 200 sq km)
Hot Spot(> 90% Confidence)
Hot Spot(> 90% Confidence)
Cold Spot(> 90% Confidence)
Cold Spot(> 90% Confidence)

Conclusions
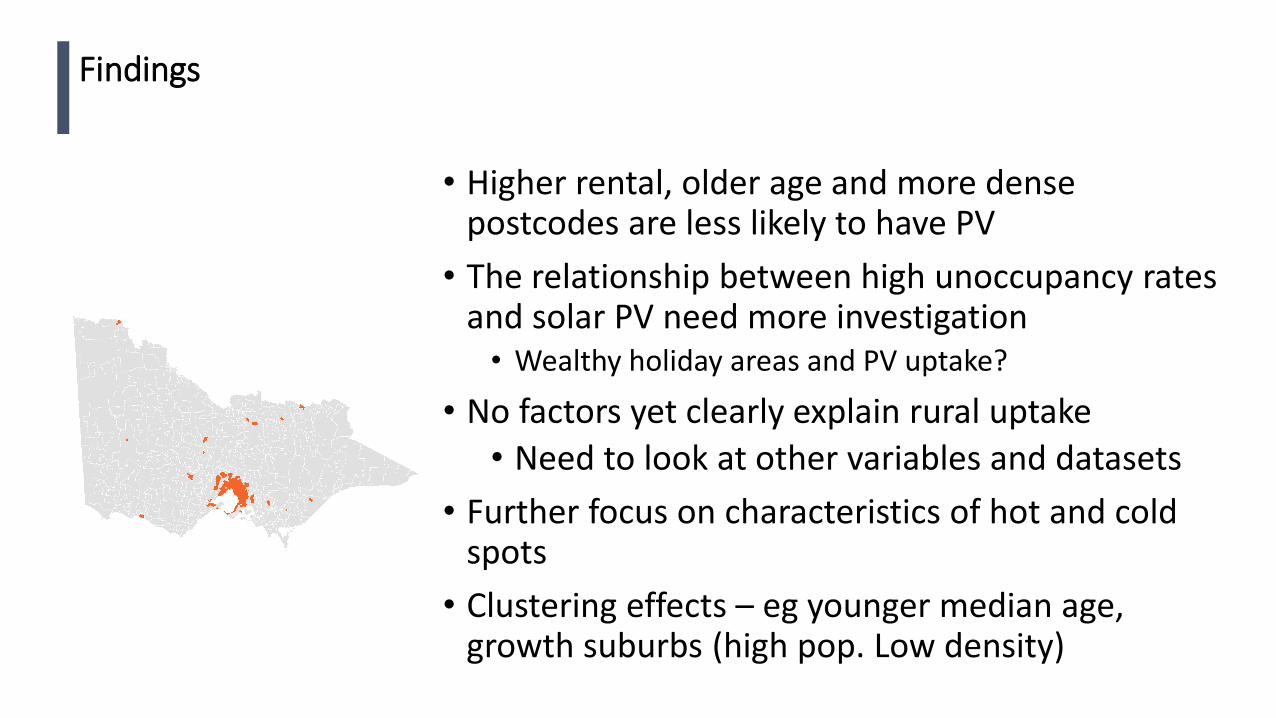
• Higher rental, older age and more dense postcodes are less likely to have PV
• The relationship between high unoccupancy rates and solar PV need more investigation
• Wealthy holiday areas and PV uptake?
• No factors yet clearly explain rural uptake • Need to look at other variables and datasets
• Further focus on characteristics of hot and cold spots
• Clustering effects – eg younger median age, growth suburbs (high pop. Low density)
Findings
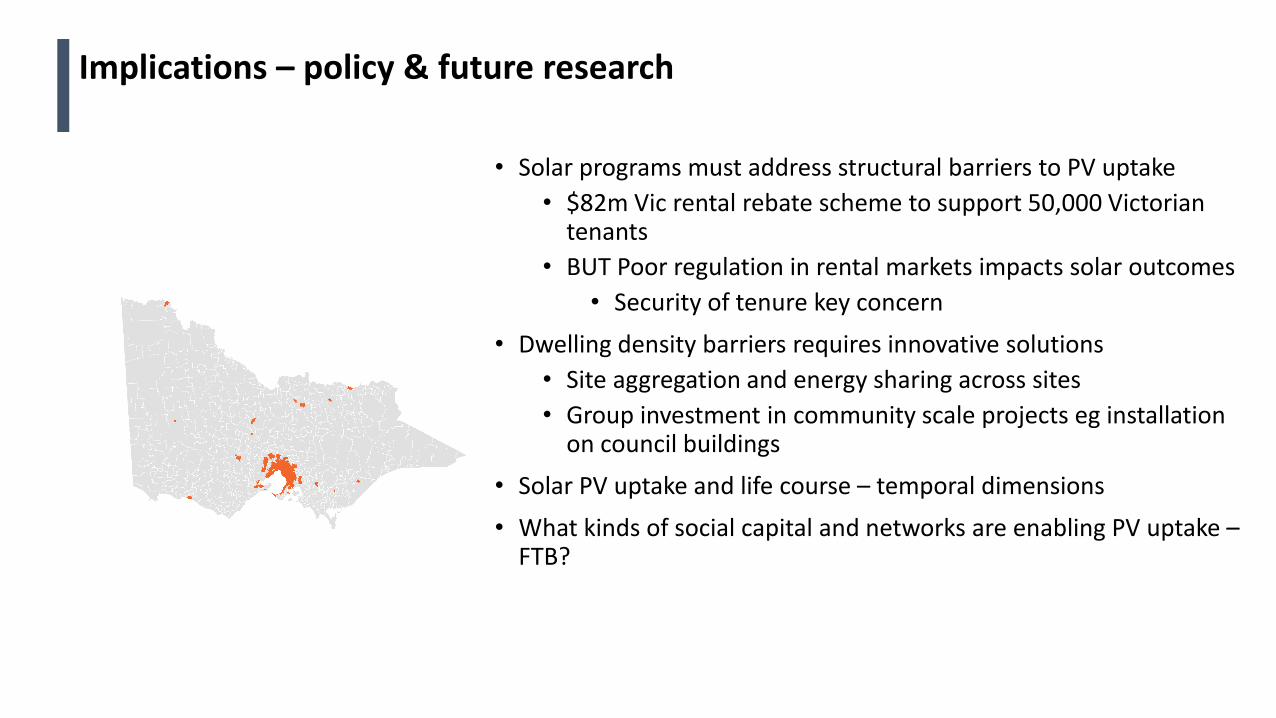
• Solar programs must address structural barriers to PV uptake • $82m Vic rental rebate scheme to support 50,000 Victorian
tenants• BUT Poor regulation in rental markets impacts solar outcomes
• Security of tenure key concern• Dwelling density barriers requires innovative solutions
• Site aggregation and energy sharing across sites• Group investment in community scale projects eg installation
on council buildings• Solar PV uptake and life course – temporal dimensions• What kinds of social capital and networks are enabling PV uptake –
FTB?
Implications – policy & future research
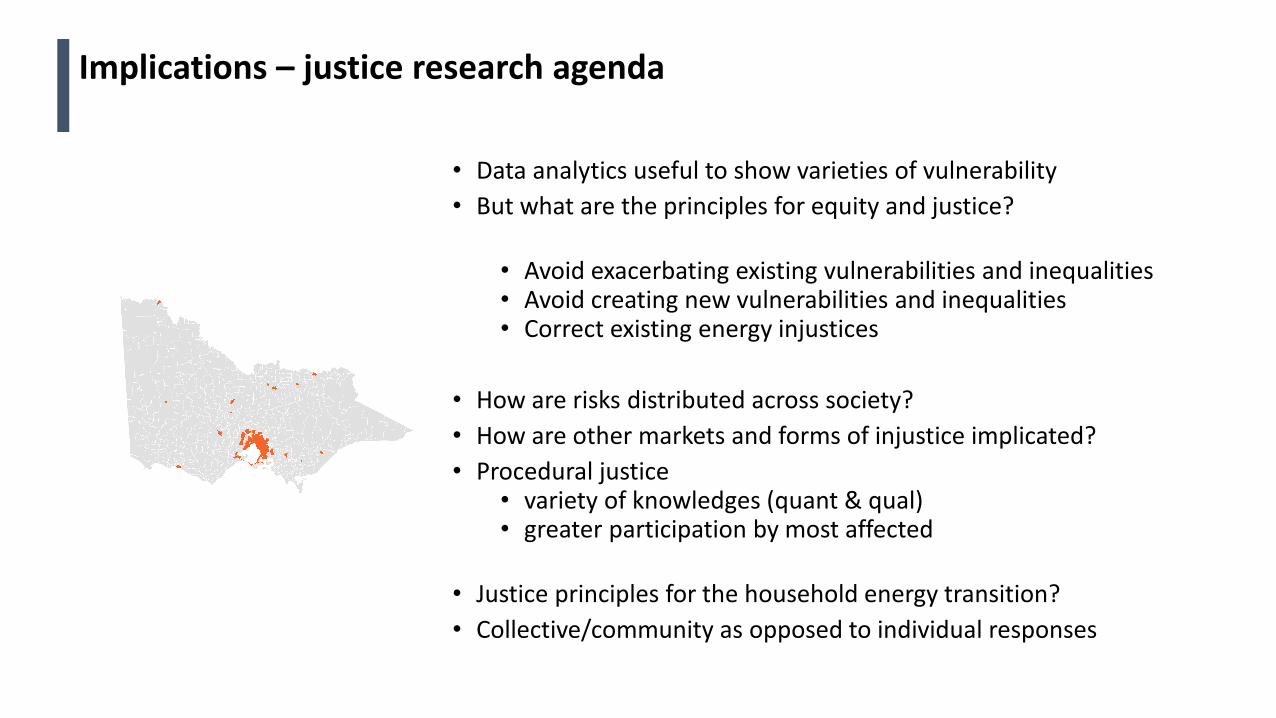
• Data analytics useful to show varieties of vulnerability• But what are the principles for equity and justice?
• Avoid exacerbating existing vulnerabilities and inequalities• Avoid creating new vulnerabilities and inequalities• Correct existing energy injustices
• How are risks distributed across society? • How are other markets and forms of injustice implicated? • Procedural justice
• variety of knowledges (quant & qual)• greater participation by most affected
• Justice principles for the household energy transition?• Collective/community as opposed to individual responses
Implications – justice research agenda
References
Best, R., Burke, P., Nishitateno, K. (2019) Understanding the determinants of rooftop solar installation: evidence from household surveys in Australia CCEP Working Paper
Chester, L. (2013). The Impacts and Consequences for Low-Income Australian Households of Rising Energy Prices. Sydney: The University of Sydney.Chester, L., & Morris, A. (2011). A New Form of Energy Poverty Is the Hallmark of Liberalised Electricity Sectors. Australian Journal of Social Issues, 46(4), 435-459.
Azpitarte, F., Johnson, V., & Sullivan, D. (2015). Fuel Poverty, Household Income and Energy Spending: An Empirical Analysis for Australia Using HILDA Data. Fitzroy: Brotherhood of St Laurance.
Poruschi, L., & Ambrey, C. L. (2018). Densification, what does it mean for fuel poverty and energy justice? An empirical analysis. Energy Policy, 117, 208-217.

Related Documents