Foresight, Government Office for Science Exploring the “robot phase transition” in experimental human- algorithmic markets Driver Review DR25

Welcome message from author
This document is posted to help you gain knowledge. Please leave a comment to let me know what you think about it! Share it to your friends and learn new things together.
Transcript

Foresight, Government Office for Science
Exploring the “robot phase transition” in experimental human-algorithmic markets
Driver Review DR25

Exploring the “robot phase transition” in experimental human-algorithmic markets
1
Contents
1. Abstract ............................................................................................................................................. 3 2. Introduction ....................................................................................................................................... 3 3. Background ....................................................................................................................................... 5
3.1. Human-vs.-robot experimental economics ................................................................................. 5 3.2. Measuring the performance of markets ...................................................................................... 6
4. Experiment methodology .................................................................................................................. 9 4.1. Open Exchange (OpEx) platform ............................................................................................... 9 4.2. Experiment design & participation ............................................................................................ 10 4.3. Supply & demand schedules .................................................................................................... 12 4.4. Robot configuration .................................................................................................................. 14
5. Results ............................................................................................................................................ 15 5.1. Market data ............................................................................................................................... 15 ........................................................................................................................ Smith’s 19 5.3. Efficiency .................................................................................................................................. 20 5.4. Profit dispersion ........................................................................................................................ 21 5.5. Execution counterparties .......................................................................................................... 22
6. Discussion ....................................................................................................................................... 23 6.1. Evidence for the ‘robot phase transition’ .................................................................................. 23 6.2. Artefacts or evidence? .............................................................................................................. 24 6.3. Reproduction vs. replication: A methodological journey through the badlands of ‘spread-jumping’ robots. .................................................................................................................................. 25 6.4. Future work ............................................................................................................................... 27
7. Conclusions .................................................................................................................................... 28 Acknowledgements ................................................................................................................................ 28 References ............................................................................................................................................ 29 Appendix A – Detailed results from day 2, Wed. 21st March, 2012 ........................................................ 31
Time series figures of quotes and trades ........................................................................................... 31 Robust Rank Order (RRO) analysis for day 2, Wed 21st March, 2012 .............................................. 39
Appendix B – Summary of results for day 1, Wed 7th March, 2012 ....................................................... 45 Appendix C – Screenshots of OpEx sales trading GUI .......................................................................... 48

Exploring the “robot phase transition” in experimental human-algorithmic markets
2
Exploring the “robot phase transition” in experimental human-algorithmic markets
John Cartlidge and Dave Cliff
2 April 2012
This review has been commissioned as part of the UK Government’s Foresight Project, The Future of Computer Trading in Financial Markets. The views expressed do not represent the policy of any Government or organisation.
Exploring the “robot phase transition” in experimental human-algorithmic markets
3
1. Abstract
Johnson et al. (2012) recently argued that analysis of millisecond-by-millisecond stock-price movements between 2006 and 2011 suggests the existence of a step-change or phase transition in the dynamics and behaviour of financial markets, in which human traders and automated algorithmic “robot” trading systems freely interact. Above a particular time-threshold, humans and algorithmic systems trade with one another; below the threshold, there is a sudden change to a market in which humans cannot participate and where all transactions are robot-to-robot. We refer to this abrupt system transition from a mixed human-robot phase to an all-robot phase as the ‘robot phase transition’. At sub-second timescales, below the robot transition, Johnson et al. argue that the robot-only market exhibits ‘fractures’ – ultra-fast swings in price akin to mini flash-crashes – that are undesirable, little understood, and intriguingly appear to be linked to longer-term instability of the market as a whole. He we report on using a complementary approach to the historical data analysis employed by Johnson et al.: in March 2012 we conducted laboratory-style experiments where human traders interacted with algorithmic trading agents (i.e., robots) in minimal experimental models of electronic financial markets using De Luca’s (2011) OpEx artificial financial exchange. Our aim was to see if correlates of the two regimes suggested by Johnson et al. occur in such laboratory conditions. Our results thus far do indeed indicate that when trading robots act on a super-human timescale, the market starts to fragment, with statistically lower human-robot interactions than we would expect from a fully mixed market. In contrast, when robotic trader-agents are slowed to a thinking-and-reaction speed similar to that of humans, less fragmentation is observed. We tentatively conclude that this is evidence for the robot transition occurring in controlled experimental financial market systems. The work reported here also explore the effects of increasing the degree of realism in the laboratory experiments: we find that some statistically significant effects may be consequences of constraints introduced to make the analysis of the experiment results easier, and we report on our discovery of a problem with earlier OpEx experiments that casts doubt on their results.
2. Introduction
In February 2012, Johnson et al. (2012) published a working paper that immediately received widespread media attention, including coverage in eFinancialNews (Price, 2012), New Scientist (Giles, 2012) and Wired (Keim, 2012). Having analysed millisecond-by-millisecond stock-price movements between 2006 and 2011, Johnson et al. argued that there was evidence for a phase transition in the behaviour of financial markets at the sub-second time-scale. At the point of this transition, the market dynamics switch from a domain involving interactions among a mix of human traders and ‘robot’ automated algorithmic trading systems, to a domain newly-identified by Johnson et al. in which the automated trading systems interact only among themselves, with no human traders involved. Here, we name this abrupt system-wide transition from mixed human-algorithm phase to a new all-algorithm phase, the ‘robot phase transition’.
At sub-second timescales, below the robot transition, the robot-only market exhibits ‘fractures’ – ultra-fast swings in price akin to mini flash-crashes – that are undesirable, little understood, and intriguingly appear to be linked to longer-term instability of the market as a whole.
This discovery has the potential for significant impact in the global financial markets. If the short term micro-effects can indeed give some indication of longer-term macro-scale behaviour then

Exploring the “robot phase transition” in experimental human-algorithmic markets
4
it is possible that new methods for monitoring the stability of markets could be developed, offering early-warning systems for future flash-crashes.
In March 2012, we were commissioned by the UK Government Office for Science’s Foresight unit to run a series of experiments exploring the robot transition under controlled laboratory conditions. We did this by varying the speed/reaction of robot-trader agents in OpEx, an “artificial stock exchange” electronic market that had been developed as an apparatus for evaluating human-robot and robot-robot interaction in electronic markets. OpEx was developed by Marco De Luca at the University of Bristol and had been used as the experimental economics platform in a number of previous studies (e.g.: De Luca & Cliff, 2011a; De Luca & Cliff, 2011b), before being used for a major Foresight review document that De Luca, Charlotte Szostek, and we the two authors of this paper had produced in the summer of 2011 (De Luca et al., 2011), and then again in a follow-up paper that the four of us subsequently co-authored (Cartlidge et al., 2012). In February 2012 OpEx was placed in the public domain as an open-source release via the popular SourceForge web service (OpEx SourceForge, 2012), as a service to the scientific community with the intent of helping other researchers replicate and build on our previous experiments.
In this current paper, our primary aim is to test the hypothesis that when robot trader agents in OpEx are able to act/react on a timescale quicker than the human traders are, we will see a transition from a mixed market (where humans and robots are equally likely to interact with one another) to a more fragmented market where robots are more likely to trade with robots, and humans with humans.
However, in the course of undertaking the experiments reported in this paper, we also wanted to explore the effects of increasing the realism of the structure of the experiments conducted on OpEx (we explain what we mean by this in more detail in Section 5.2). In doing this, we discovered that some statistically significant effects that we observe in artificial, constrained experimental set-ups, disappear when we make the experiments more realistic and less constrained. The lesson that we draw from this is that the more realistic laboratory experiments of humans and robots interacting in electronic markets can be, the better. This might seem like a rather obvious observation, but it reinforces the message that was first made in (De Luca et al., 2011) that there is a real necessity to break away from experiment designs that have been handed down from experimenter to experimenter since the birth of experimental economics in Vernon Smith’s laboratory in the late 1950’s.
Moreover, in conducting the study reported in this paper, our first batch of new experiments yielded results that we found very difficult to make sense of, and in the course of trying to understand them we identified a problem, a bug, with the OpEx implementation of the robot-trader algorithm we were using (the “AA” algorithm invented by Vytelingum, 2006). Further investigation revealed that this bug had affected the results that were presented in our previous co-authored papers (De Luca et al., 2011; Cartlidge et al., 2012). The full implications of this, and the lesson to be learned, are discussed in Section 5.3.
Our first conclusion is that our results are supportive of Johnson et al.’s (2012) hypothesis concerning the robot phase transition, although in our experiments the effects of increasing robot speed seem to give a progressive response rather than a step-change.
Our second conclusion is that in experiments such as those reported here, the more realistic the set-up of the experiment, the more the results can be trusted: this conclusion is based on our observation that when we increased the realism of the experiment set-up, some statistically

Exploring the “robot phase transition” in experimental human-algorithmic markets
5
significant effects seen in results from less-realistic experiment set-ups (ones with simplifying constraints introduced for ease of control and analysis) disappeared.
Our third conclusion will be rather obvious to anyone with a background in laboratory-based hard-science research, but nevertheless is probably illuminating to computer science researchers who study electronic markets and/or automated trading agents: independent replication of results is vitally important in ensuring the quality of research and providing trusted results. In the course of conducting the experiments reported here, we identified a bug that casts doubt on results in previous papers that we have co-authored. If we hadn’t attempted a (semi-independent) replication of our earlier work, we may not have discovered this.
The remainder of this paper is structured as follows. Section 2 introduces the relevant background material, and Section 3 then describes the methods we used for our experiments studying human-robot interactions in the OpEx artificial financial exchange. Results from our experiments are presented in summary form in Section 4, with more detailed data being made available in the Appendix A. In Section 5 we discuss our results, and lay out plans for further research. The discussion in Section 5 draws three main conclusions.
3. Background
3.1. Human-vs.-robot experimental economics There are two complementary approaches for understanding the dynamics of financial markets: forensic analysis of real market data, and experimental economics. Forensic analysis of real market data is characterised by data-intensive statistical analysis of real-world transaction data. In contrast, the experimental economics approach involves setting up simple, laboratory-style markets with a small number of participants acting in specified roles, and then observing the effects of controlled changes in the market. The former approach is the one taken by Johnson et al. (2012) to provide evidence for the existence of a robot phase transition in financial markets. The latter approach is the one we take in this report, to see if we can identify a correlate of Johnson et al.’s robot phase transition under simple, controlled, laboratory conditions.
The experimental economics approach was established in a series of seminal papers by Vernon Smith in the early 1960’s, a contribution for which he was awarded the Nobel Prize in Economics in 2002 (for further details, see Smith, 2006). Smith created experimental markets with human participants trading via the continuous double auction (CDA) mechanism: the same mechanism that underlies the majority of the world’s real financial markets. Buyers and sellers were given a limit price - the floor price at which a seller can sell and ceiling price for which a buyer can buy - and told to trade. Transaction prices, and the prices of unsuccessful quotes, were recorded and the resulting dynamics of the market analysed. Experimental economics was born.
In 2001, a group of researchers at IBM conducted the world’s first experimental economics market between humans and robot traders, automated trading algorithms that trade autonomously using internal logic capable of self-adaptation (Das et al., 2001). Their seminal results showed that the robots – using the ZIP algorithm invented by Cliff at Hewlett-Packard Labs (Cliff, 1997), and IBM’s MGD, a modified version of the GD algorithm invented by Gjerstad & Dickhaut (1998) – were able to consistently out-perform (extract more profit than) the human traders. The authors concluded that the financial impact of their results “…might be measured in billions of dollars annually”. The interest of financial institutions trading on the markets was piqued, and the world of automated trading has since blossomed. Global financial

Exploring the “robot phase transition” in experimental human-algorithmic markets
6
markets are now argued to be dominated by High Frequency Trading (HFT) robots, with major exchanges in the USA and Europe reporting that 30%-50% of all transactions currently involve automated traders. Surprisingly, given the impact of Das et al.’s (2001) result, there have been extraordinarily few human-vs.-robot market experiments conducted in the decade proceeding its publication (for a detailed review of those that have been conducted, see De Luca et al., 2011). Indeed, there have been so few human-vs.-robot experiments performed that we can briefly describe them all here. In a series of studies, Grossklags & Schmidt (2003, 2006) used human-vs.-robot experimental markets to observe the effect of knowledge/ignorance of the presence of robot trader-agents on the behaviour of human traders: they found that there was, indeed, a significant ‘knowledge effect’. In 2010, nearly a decade after the publication of Das et al. (2001), De Luca & Cliff (2011a) produced the first replication of the IBM study and confirmed the results IBM had presented. De Luca & Cliff (2011b) also demonstrated that a newer robot trading algorithm, the Adaptive Aggressive (AA) algorithm invented by Vytelingum (2006), out-performed the other published trading strategies in both robot-vs.-robot and robot-vs.-human markets. Finally, in two recent papers, we the authors, along with our colleagues Marco De Luca and Charlotte Szostek, published two papers (De Luca et al., 2011; Cartlidge et al., 2012) on the results from human-vs.-robot experimental markets that used a more ‘realistic’ continuous-replenishment design than had been used before. The surprising results of these experiments are discussed further in Section 5.3. Finally, this report provides what is, to the best of our knowledge, the only other documented series of human-vs.-robot market experiments, performed in March, 2012.
Having been demonstrated to be the dominant robot algorithm in the academic literature (De Luca & Cliff, 2011b), for all the experiments described in this report, we use the AA strategy as the control logic for our robot trader algorithms. AA robots have short-term and longer-term learning processes. In the short-term, robots update the aggressiveness of their bidding behaviour; with more aggressiveness meaning an agent will trade off profit to improve its chance of transacting. In the longer-term, robots learn how to best combine their aggressiveness with their estimation of the market equilibrium price, calculated by observing transaction prices over a time window, to choose which bids or asks to submit in the market (for full details, refer to Vytelingum, 2006). In the designer’s own words: “The principal motivation for the short-term learning is to enable the agent to immediately respond to market fluctuations, while for the long-term learning it is to adapt to broader trends in the way in which the market demand and supply changes over time” (Vytelingum, Cliff, & Jennings, 2008).
3.2. Measuring the performance of markets An ‘ideal’ market can be perfectly described by the aggregate quantity supplied by sellers and demanded by buyers (the supply and demand schedules) at every price point. As prices increase, in general there is a tendency for supply to increase, with increased potential revenues from sales encouraging more sellers to enter the market; while, at the same time, there is a tendency for demand to decrease as buyers look to spend their money elsewhere. At some price-point, the quantity demanded will equal the quantity supplied. This is the theoretical market equilibrium. Fig. 3.2.1 shows an example demand and supply schedule for a theoretical market. Market equilibrium is determined by the intersection between supply and demand (P0, Q0) toward which an ideal market will tend. For all prices above P0, supply will exceed demand, forcing suppliers to reduce their prices to make a trade; whereas for all prices below P0, demand exceeds supply, forcing buyers to increase their price to make a trade. All quantity demanded and supplied to the left of equilibrium, Q0, is called ‘intra-marginal’; all quantity demanded and supplied to the right of equilibrium, Q0, is called ‘extra-marginal’. In an ideal market, all intra-marginal units and no extra-marginal units are expected to trade.

Exploring the “robot phase transition” in experimental human-algorithmic markets
7
Figure 3.2.1. Supply and Demand curves (here illustrated as straight lines) relate the quantities supplied by sellers and demanded by buyers, respectively, to the price per item: as the price increases, the quantity supplied increases but the quantity demanded falls. The point at which the two curves intersect is the theoretical equilibrium point for this supply and demand schedule: Q0 is the equilibrium quantity and P0 is the equilibrium price.
In the real world, markets are not ideal. They will always trade away from equilibrium at least some of the time. We can use metrics to calculate the ‘performance’ of a market by how far from ideal equilibrium it trades, allowing us to compare between markets. In this report, we make use of the following metrics for measuring market performance:
Smith’s alpha:
Following Vernon Smith (1962), we measure the equilibration (equilibrium-finding) behaviour of markets, α, as the root mean square difference between each of n transaction prices, pi (for i=1…n) over some period, and the P0 value for that period, expressed as a percentage of the equilibrium price:
(1)
In essence, α captures the standard deviation of trade prices about the theoretical equilibrium. A low value of α is desirable, indicating a market trading close to P0.
Allocative efficiency:
For each trader, i, the maximum theoretical profit available, πi*, is the difference between the price they are prepared to pay (their ‘limit price’) and the theoretical market equilibrium price, P0. Efficiency, E, is used to calculate the performance of a group of n traders as the mean ratio of realised profit, πI, to theoretical profit, πi*:
∑=
=n
i i
i
nE
1*
1ππ
(2)
As profit values cannot go below zero (traders in these experiments are not allowed to enter into loss-making deals), a value of 1.0 indicates that the group has earned the maximum
∑ =−=
n
i i PpnP 1
20
0
)(11α

Exploring the “robot phase transition” in experimental human-algorithmic markets
8
theoretical profit available, πi*, on all trades. A value below 1.0 indicates that some opportunities have been missed. Finally, a value above 1.0 means that additional profit has been made by taking advantage of a trading counterparty’s willingness to trade away from the equilibrium price, P0. So, for example, a group of sellers might record an allocative efficiency of 1.2 if their counterparties (a group of buyers) consistently enter into transactions at prices greater than P0; in such a situation, the buyers’ allocative efficiency would not be more than 0.8.
Profit dispersion:
Profit dispersion is a measure of the extent to which the profit/utility generated by a group of traders in the market differs from the profit that would be expected of them if all transactions took place at the equilibrium price. For a group of n traders, profit dispersion is calculated as the root mean square difference between the profit achieved, πI, by each trader, i, and the maximum theoretical profit available, πi*:
(3)
Low values of πdisp indicate that traders are extracting actual profits close to those available if all trades take place at the equilibrium price P0; while higher values of πdisp indicate that traders’ profits differ from those expected at equilibrium. The attraction of this statistic is that it is not masked by zero-sum effects between buyers and sellers. Gode & Sunder (1993) introduced this metric after they discovered that the trading activity of human traders and simple “ZI-C” robots in market experiments could yield very similar values for a popular measure called allocative efficiency, whereas the πdisp values of markets populated by human traders were significantly lower than those of markets populated by ZI-C traders.
Delta profit:
Delta profit is used to calculate the difference in profit maximising performance between two groups, x and y, as a percentage difference relative to the mean of the two groups:
yx
yxyxPππππ
+
−=−∆
)(2)(
(4)
Delta profit directly measures the difference in profit gained by two groups. In a perfect market with identically matched groups, delta profit should be zero, since all groups should trade at the equilibrium price P0.
2*
1)(1
i
n
iidisp n
πππ −= ∑=

Exploring the “robot phase transition” in experimental human-algorithmic markets
9
4. Experiment methodology
4.1. Open Exchange (OpEx) platform
Figure 4.1.1. The Lab-in-a-box hardware arranged ready to run an Open Exchange (OpEx) human-vs.-robot trading experiment. Six small net-book computers run human trader Sales GUIs, with 3 buyers (near-side) sitting opposite 3 sellers (far-side). Net-book clients are networked via Ethernet cable to a network switch for buyers and a network switch for sellers, which in turn are connected to a router. The central exchange and robots servers run on the dedicated hardware server (standing vertically, top-left), which is also networked to the router. Finally, an Administrator laptop (top table, centre; networked via the router) is used to remote desktop to the hardware server to enable the experiment administrator to configure and run experiments. Photograph Copyright © 2012 J. Cartlidge.
Open Exchange (OpEx) is a real-time financial-market simulator specifically designed to enable economic trading experiments between humans and automated trading algorithms (robots). OpEx was designed and developed by Marco De Luca between 2009-2010 while he was a PhD student at the University of Bristol, and is now freely available for open-source download from SourceForge.net (OpEx SourceForge, 2012; first open-source release in Feb. 2012), under the terms of the Creative Commons Public License. For a detailed technical description of the OpEx platform, refer to De Luca et al. (2011).
Historically, trading experiments between humans and robots have rarely been performed. Indeed, before the development of OpEx, the number of published academic papers describing human-vs.-robot trading experiments could be counted on the fingers of one hand! (De Luca et al., 2011). In large part, this was due to the difficulty of running human-vs.-robot experiments, which required the proprietary development of relatively sophisticated software and the purchase of expensive hardware. The time and expense of such an endeavour often outweighed the potential research benefits. To address this issue, De Luca developed OpEx to be a multi-purpose off-the-shelf simulation platform that can be easily configured to run human-vs.-robot trading experiments on generic commodity hardware. At the University of Bristol, the

Exploring the “robot phase transition” in experimental human-algorithmic markets
10
Lab-in-a-box hardware used to run OpEx experiments – including a collection of netbooks, windows server, admin laptop, router, switches, network and power cables – costs only a few thousand pounds and can easily fit inside one large suitcase. Fig. 4.1.1 shows the Lab-in-a-box hardware arranged ready for a human-vs.-robot experiment.
OpEx has been successfully used in a series of published human-vs.-robot experiments by De Luca and others at the University of Bristol (DeLuca & Cliff, 2011a; DeLuca & Cliff, 2011b; DeLuca et al., 2011; Cartlidge et al., 2012). These papers demonstrate the utility of OpEx and to date have more than doubled the historical human-vs.-robot literature. At the time of writing, less than two months after its first release as open-source software on the popular Sourceforge website, OpEx has been downloaded more than 100 times (OpEx SourceForge Stats, 2012), suggesting that there is significant interest and demand amongst academic and commercial researchers for an experimental trading platform.
In this report, we use the open-source release of OpEx (OpEx SourceForge, 2012, downloaded Feb 2012) to perform a series of human-vs.-robot experiments.
4.2. Experiment design & participation Version 1.0 of the OpEx platform was used1
1. Students enrolled on the module Algorithmic and Economic Aspects of the Internet, a final year undergraduate and postgraduate module in computer science that includes coverage of the design of automated trading agents.
to perform a total of 48 human-vs.-robot trading experiments during March 2012. Experiments took place on Wed. 7th March and Wed. 21st March, at Park House Business Centre, Park Street, Bristol, UK. Each day, 24 experiments were run. In each experiment, the market contained six human traders (arranged as 3 buyers and 3 sellers) and six robot traders (similarly arranged as 3 buyers and 3 sellers). Human buyers were seated opposite human sellers (as shown in Fig. 4.1.1). All human participants were registered full-time students at the University of Bristol, UK. Participants were selected on a first-come basis from the group of students that responded to adverts broadcast to two groups:
2
2. Members of the Bristol Investment Society, a body of students interested in pursuing a career in finance.
3
We assume that these students have the knowledge and skills suitable to embark on a career as a trader in a financial institution. All volunteers were paid £25 for participating in the trading experiments, plus, to incentivise traders to make profit, the two human traders scoring the highest profit on each experimental day were rewarded with an Apple iPad (cash value £400). Since there were 48 participants in total and 4 iPad winners, participants had a 1-in-12 chance of winning the prize. This incentive structure produced intense competition and focus among participants as they battled for the large value monetary reward, as would traders in real financial markets. The total cost for participation and prizes was £25*48 + £400*4 = £2800.
1 After we downloaded OpEx v.1.0, we made minor edits to introduce the “fast” robots, and to fix a “spread-crossing” bug in the OpEx v1.0 code; both edits are discussed at greater length later in this paper.
2 Module homepage: http://www.cs.bris.ac.uk/Tools/Local/Handbook/unit.jsp?unit=COMSM2006. Last accessed, March 28th 2012.
3 University of Bristol Investment Society: http://www.uobis.co.uk/. Last accessed, 28th March 2012.

Exploring the “robot phase transition” in experimental human-algorithmic markets
11
To reduce the total number of participants required, each group of participants were used in six separate experiments. In that way, we were able to conduct 48 experiments using only 48 participants. Each experimental day, we ran four sessions, each consisting of six rounds of experiments. For each session, a new group of human volunteers was used. At the start of each session, humans were randomly allocated to a seat corresponding to a specific market role: {Buyer1, Buyer2, Buyer3, Seller1, Seller2, Seller3}. Then, after each experimental round, humans rotated seats (market roles) anti-clockwise. Thus, by the end of the session, each human had played each market role once, while cohorts of Buyers and Sellers contained a different mix of humans each time. Human roles were purposely mixed between experiment rounds to reduce the opportunity for collusion and counteract any bias in market role.
Figure 4.2.1. Sales trading GUI for a human buyer. New client order assignments arrive over time in the Client Orders panel (top-left); and listed in descending order of potential profit. To work an order, select it by double-clicking. This opens a ‘New Order’ dialogue popup (shown top-centre); price and quantity can be selected before order is entered into the market. The market Order Book is displayed top-right, with all bids and asks displayed. Orders currently in the market are listed in the ‘Orders’ panel (middle); and can be amended from here by double-clicking. When an order executes it is removed from the orders panel and listed in the ‘Trades’ history panel (bottom). Current profit and time left until close is displayed for humans to monitor progress (top-centre, obscured by ‘New Order’ pop-up). For further GUI screen shots, refer to Appendix C.
At the start of each session, human participants were seated at a terminal and given a brief introduction and tutorial to the system (explaining the human trading GUI illustrated in Fig. 4.2.1), during which they were able to make test trades among themselves, while no robots were present in the market. Participants were told that the ‘aim of the game’ was simply to make as much profit as possible by trading client orders that will arrive over time. The tutorial lasted approximately 10 minutes, after which the tutorial was ended and the market closed. Six rounds of experiments were then run, with each experiment having a market open period of 10 minutes. Between rounds, approximately two minutes were taken for participants to rotate seating positions, and for the administrator to set the new experimental configuration. Thus, in total, the session lasted less than 90 minutes, with 60 minutes of experiment time. We were able to run four sessions in one business day, allowing us enough time to set up and pack away the hardware.
Exploring the “robot phase transition” in experimental human-algorithmic markets
12
4.3. Supply & demand schedules
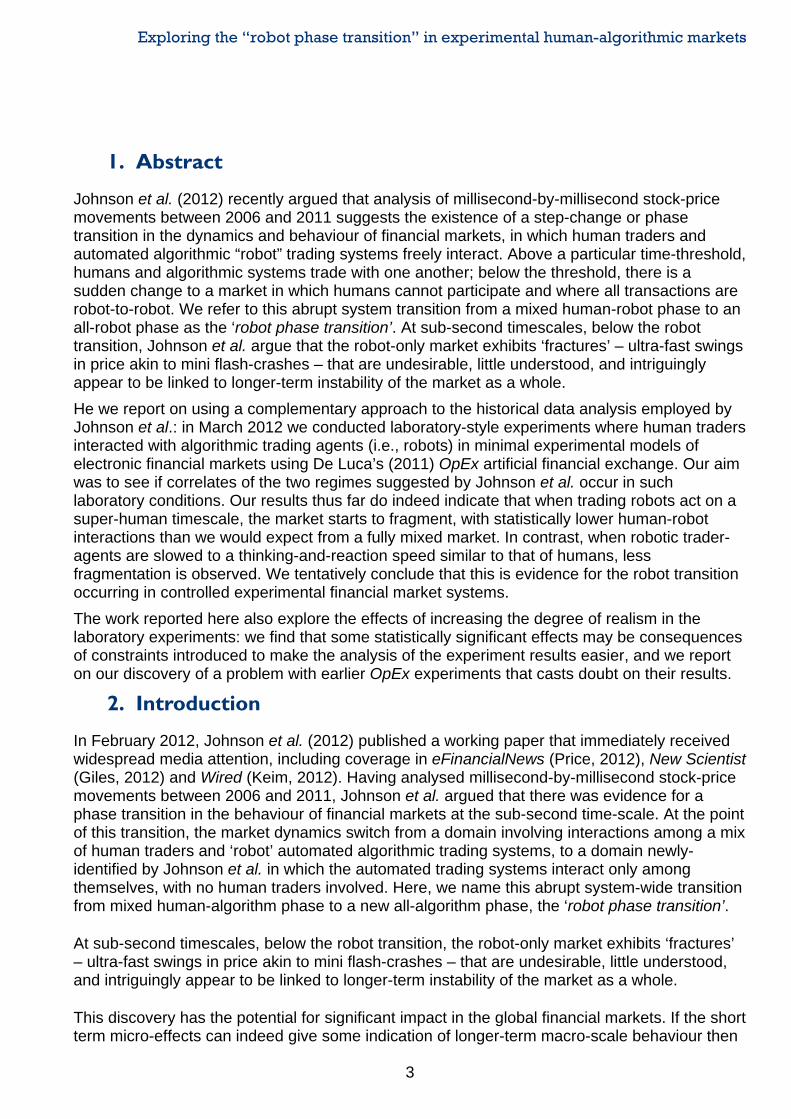
Figure 4.3.1. Stepped supply and demand curves. Curves show the aggregate quantity that participants are prepared to buy (demand) and sell (supply) at every price point. The point at which the two curves intersect is the theoretical equilibrium point for the market: Q0=144 is the equilibrium quantity; and P0 is the equilibrium price. Values of P0 used in the experiments are listed in Table 4.3.1. The market is symmetric about P0.
An experimental market is defined by the aggregate supply and demand of participants; otherwise called the supply and demand schedules. Fig. 4.3.1 shows the demand and supply schedules used for each experiment. The market is purposely symmetric about P0 in order to make the theoretical profit of buyers and sellers equal: π*buyers = π*sellers. The market crosses at Q0=144, indicating the quantity of intra-marginal units in the market; i.e., the quantity of units we would expect to execute in a ‘perfect’ market that consistently trades at the theoretical equilibrium price P0. If more than this quantity of units trade, the market must be trading away from equilibrium for at least some of the time. The shape of the supply and demand schedules were specifically chosen to be qualitatively similar to those used in De Luca et al. (2011), to aid in the comparison of results.

Exploring the “robot phase transition” in experimental human-algorithmic markets
13
Table 4.3.1. Permit-schedule timetable. Six permit types are issued to each market participant, depending on their role. For each role, there is one human and one robot participant. Permit values show limit price - P0. Thus, for e.g., if P0=100, a permit of type 4 to Buyer1 would have a limit price of 91. For buyers, limit prices are the maximum value to bid; and for sellers, limit prices are the minimum value to ask. Numbers in brackets show the time-step sequence in which permits are allocated. Thus, after 11 time-steps, Buyer2 and Seller2 each receive a permit of type 4. For all experiments, the inter-arrival time-step between permits is 4 seconds. Permits are always allocated in pairs, symmetric about P0. In cyclical markets, the sequence is repeated 8 times until the experiment ends. In non-cyclical or ‘random’ markets, the time-step of permits is randomised across the run. Participants receive the same set of permits in both cyclical and random markets, but in a different order.
The units of supply and demand shown in Fig. 4.3.1 are allocated to market participants during the course of an experiment. Rather than allocate all units when the market opens, units to trade are continuously drip-fed into the market throughout the market open period. Table 4.3.1 shows the permit schedule timetable that describes how units are allocated to participants. During an experiment, each participant receives six permit types (of 8 units each). The value indicates the limit price of the permit, which corresponds directly to the supply and demand schedule of Fig. 4.3.1. Limit values set the ceiling price at which a buyer can buy and the floor price at which a seller can sell, and are all given relative to the market equilibrium value P0. Values in parentheses indicate the time-step that the permit is allocated to a market participant. For all experiments, the inter-arrival time of permits, or time-step, was fixed at 4 seconds. Permits are always allocated in pairs symmetric about P0, such that the theoretical market equilibrium is not altered. To ensure equality between humans and robots, each time a permit is allocated to a human, an identical permit is allocated to a robot that has the same role (Buyer1, Buyer2, etc.). Thus, each human in the market has a ‘shadow’ robot that plays exactly the same role.
For each experiment, markets are configured to be either ‘cyclical’, or ‘random’. In cyclical markets, permits are allocated in strict sequence for the duration of an experiment, following the timetable of Table 4.3.1. After 18 time-steps (72 seconds), the cycle restarts. This is repeated 8 times before the market is closed. By contrast, in random markets, the permit sequence across the entire run is randomised. However, permits are still allocated in symmetric Buyer-Seller pairs, and each permit is received by a human and robot playing the same role. Overall, the aggregate market supply and demand schedules are unaltered, only the order of allocation.

Exploring the “robot phase transition” in experimental human-algorithmic markets
14
Table 4.3.2. Schedule ID table describing the schedules used in experiments: P0 indicates market equilibrium price; the ‘cyclical’ binary indicates whether the market schedule is cyclical or random. Refer to text for details. Experiments in each session were run in order from lowest to highest schedule ID.
In De Luca et al. (2011), we discussed at length the importance of trying to incorporate more ‘realism’ into experimental design. In all previous continuous market human-robot experiments (De Luca et al., 2011; Cartlidge et al., 2012), cyclical-replenishment was used, replicating the design used by Cliff & Priest (2001). By using cyclical replenishment, therefore, it is easier to compare new results with those from the literature. However, cyclical replenishment is manifestly artificial: real markets are not cyclical. For this reason, we introduce random-replenishment here to add more realism. Further, we test both cyclical-replenishment and random-replenishment in order to see if any artefactual differences are introduced in the results. This enables us to infer that if a statistical difference is present in results from cyclical-replenishment markets that is not present in random-replenishment markets, ceteris paribus, our expectation is then that the effect is an artefactual consequence of the artificial experimental constraint of cyclically replenishing the traders’ entitlements to buy and sell.
During each experimental session, six experiments were run, with each following a different supply and demand schedule and permit timetable. Table 4.3.2 summarises the schedule IDs used for each experiment, indicating the theoretical equilibrium price of the market, P0, and whether or not the market permits are allocated cyclically, or randomly. In every session, experiments {1, 2, ..., 6}, were configured to use schedule IDs = {5001, 5002, …, 5006}.
4.4. Robot configuration
Table 4.4.1. Agent types used in experiments. ‘Maximum spread’ indicates the maximum relative spread size that an agent will automatically cross. For instance, a value of 0.01 means that if the spread is less than 1% of the best ask price, the agent will always cross with the best bid/ask on the other side.
In each experiment, a set of robots is configured to ‘shadow’ the human participants. As described in section 3.3, above, for each human in the market a ‘shadow’ robot plays the same role and receives the same allocation of permits to trade. For each experiment, all robots within a market are configured with an identical parameter set, detailed in Table 4.4.1. Agents are

Exploring the “robot phase transition” in experimental human-algorithmic markets
15
selected from one of four configurations: AA-0.1, AA-1, AA-5, and AA-10. The numerical suffix indicates a robot’s sleep-wake cycle time in seconds. The greater the value, the longer the robot ‘sleeps’ between actions. By varying this sleep parameter, we are able to control the ‘speed’ at which the robots act. Johnson et al. (2012) suggest that: “in many areas of human activity, the quickest that someone can notice [a] cue and physically react, is approximately 1000 milliseconds”. Thus, to test the effect of robot speed on the market, we select sleep values that comfortably range from well below human reaction speed (0.1s) to well above human reaction speed (10s). In this way we should be certain that our collection of robot configurations ‘cross the boundary’ of human reaction time, enabling us to compare the dynamics of markets containing robots that act at super-humanly fast speeds, with markets containing robots that act on human time-scales. This will allow us to explore whether a correlate of the two regimes proposed by Johnson et al. (2012) exists in our experimental market and, if so, where the transition boundary occurs.
To ensure that robots are able to act sensibly upon waking from sleep, robots are enabled to observe the market and perform internal calculations during their ‘sleep’ phase. To achieve this, a second ‘internal’ timer is used to control when a robot will observe and calculate. Table 4.4.1 shows the internal timers used for each robot configuration; in each case, the internal timer has a shorter period than the sleep-wake cycle. Robots are also configured to wake from sleep upon a new order stimulus and new trade stimulus.
The final parameter shown in Table 4.4.1 is ‘maximum spread’. This parameter indicates the maximum relative spread size that an agent will automatically cross. For instance, a value of 0.01 means that if the spread is less than 1% of the best ask price, the agent will always cross with the best bid/ask on the other side, regardless of other market conditions. Since P0 values used in experiments vary from 209 – 291, at equilibrium a spread of 1% of best ask will be less than 3, so in effect, agents are configured to ‘jump the spread’ if the difference between best bid and ask is less than 3. This function enables robots to trade quickly in converged markets. For more on spread-jumping robots, refer to Section 5.3.
Under all conditions, the algorithm used for robot logic was Adaptive Aggressive (AA), introduced in Section 2.1. This algorithm has been shown to outperform other robots from the literature in both robot-vs.-robot and robot-vs.-human markets (De Luca & Cliff, 2011b), and so represents the current state-of-the-art in published financial-trading algorithms.
5. Results
Here, we present detailed discussion of results from a series of experiments run on 21st March 2012. Results from an earlier series of experiments, run on 7th March 2012, are discussed separately in Section 5.3. Throughout this section, for evaluating statistical significance we use the nonparametric Robust Rank Order (RRO) test reported by Feltovich (2003).
During one experiment (session 2, round 6), a problem caused the GUI trading interface of human Seller 2 to close and reopen after approximately 4 minutes, leading to some loss of order information and resulting in a low efficiency for the human. For this reason, we treat the results of session 2, round 6, on Day 2 as ‘suspect’ data. Unless otherwise stated, we do not include these suspect data in the results presented.
5.1. Market data OpEx records time-stamped data for every exchange event. This produces rich datasets containing every quote (orders entered into the exchange’s order-book) and trade (orders that

Exploring the “robot phase transition” in experimental human-algorithmic markets
16
execute in the exchange) in a market. In total, we gathered 8 hours of trading data (two days each involving four one-hour sessions), but for brevity we explore only a small set of indicative results here; however, for completeness, further datasets are presented in Appendix A.
Figs. 5.1.1-5.1.4, plot time series of quotes and trades for two cyclical markets with AA-0.1 robots (Figs. 5.1.1 & 5.1.2) and AA-10 robots (Figs. 5.1.3 & 5.1.4). In each plot, the dotted horizontal line represents the theoretical market equilibrium, P0, and vertical dotted lines indicate the start of each new permit replenishment cycle (every 72s). In both markets, we see trade activity is largely clustered in the first half of each permit-replenishment cycle; this correlates with the phase in which intra-marginal units are allocated and trades are easiest to execute. After the initial ‘exploratory’ period, execution prices tend toward P0 in subsequent cycles.
Figure 5.1.1. Time series of quote and trade prices from a cyclical market (i.d. 5001) containing AA-0.1 robots. The dotted horizontal line represents the theoretical market equilibrium, P0. Vertical dotted lines indicate the start of each new permit replenishment cycle (every 72s). In the initial period, robots (blue) ‘explore’ the space of prices. In subsequent periods, robots quote much closer to equilibrium. Robot quotes are densely clustered near to the start of each period, during the phase that intra-marginal units are allocated. In contrast, humans (red) tend to enter ‘exploratory’ quotes throughout the market’s open period.

Exploring the “robot phase transition” in experimental human-algorithmic markets
17
Figure 5.1.2. Time series of trade prices from a cyclical market (i.d. 5001) containing AA-0.1 robots. We see that the majority of trades occur in the first half of each cycle period, as intra-marginal units are allocated to market participants during this phase. After the initial ‘exploratory’ period, trade prices tend toward P0 in subsequent cycles. Blue markets indicate a trade between homogeneous counterparties (agent-agent or human-human); red markers indicate trades between heterogeneous counterparties (agent-human or human-agent). We see the majority of trades are homogeneous (blue: totals indicated in legend parentheses).

Exploring the “robot phase transition” in experimental human-algorithmic markets
18
Figure 5.1.3. Time series of quote prices from a cyclical market (i.d. 5001) containing AA-10 robots. In the initial period, robots (blue) and humans (red) shout at prices much greater than equilibrium. In subsequent periods, quotes are distributed symmetrically about equilibrium. Overall, there is less activity in the market than observed with AA-0.1 robots (Figure 5.1.1).

Exploring the “robot phase transition” in experimental human-algorithmic markets
19
Figure 5.1.4. Time series of trade prices from a cyclical market (i.d. 5001) containing AA-10 robots. The market initially trades very far from equilibrium; and does not trade near equilibrium until mid-way through Cycle 2. As the market settles near equilibrium, the majority of trades become clustered in the first half of each cycle period, during the time that intra-marginal units are allocated. The proportion of humans hitting robots is higher than AA-0.1, as robots are more likely to leave unamended quotes on the order book for longer.
5.2. Smith’s α
Figure 5.2.1. Smith’s α plotted for each robot type. Under all conditions, α rapidly falls from approx 10% in the initial period to approx 2% in the second period. For the remaining periods, α continues to fall gradually, tending to approx 1% by market close. There is no significant difference in α between robot types.
We can see the equilibration behaviour of the markets more clearly by plotting Smith’s α for each cycle period. Fig. 5.2.1 plots mean α for markets containing each robot agent type. There is no difference between robots. Under all conditions, α rapidly falls from a value close to 10% in the initial period, to approx 2% in period two; α then continuous to fall more gradually over the course of an experiment, tending to approx 1% by market close.

Exploring the “robot phase transition” in experimental human-algorithmic markets
20
Figure 5.2.2. Smith’s α plotted for each market type (±95% confidence interval). For cyclical markets, alpha values are significantly higher during the initial period. For the remaining periods, there is no significant difference.
In Fig.5.2.2 we see mean α (±95% confidence interval) plotted for cyclical and random markets. Under both conditions, α follows a similar pattern, tending to approx 1% by market close. However, in the first period, cyclical markets produce significantly greater α than random markets (RRO, p<0.0005). This is due to the sequential order allocation of permits in cyclical markets, where limit prices furthest from equilibrium are allocated first. This enables ‘exploratory’ shouts and trades to occur far from equilibrium. In comparison, in random markets, permits are not ordered by limit price, thus making it likely that limit prices of early orders are closer to equilibrium than they are in cyclical markets. For full Robust Rank Order analysis of Smith’s α values during the first trading cycle, refer to Appendix A.2.4.
5.3. Efficiency
Table 5.3.1. Table summarising mean results for each robot type. Under all conditions, robots achieve greater efficiency than humans and secure delta profit gains of between 0.4% and 1.8%.
When comparing the group of 23 robot efficiencies with the group of 23 human efficiencies across all experiments, robots achieve a significantly greater efficiency (RRO, p<0.025). Grouping by market type, robots achieve significantly greater efficiency in random markets (RRO, p<0.1) and robots achieve significantly greater efficiency in cyclical markets (RRO, p<0.1). When comparing the efficiencies of robots with the efficiencies of humans across all markets grouped by robot type, robots are still shown to be more efficient but the difference is

Exploring the “robot phase transition” in experimental human-algorithmic markets
21
only significant for robots AA-0.1 and AA-5 (RRO, p<0.104). The difference between robots AA-10 and humans is not significant at the p=0.104 level and the difference between robots AA-1 and humans is not significant at the p=0.104 level. However, if we include the ‘suspect’ results for session 2 round 6, the efficiency of AA-1 robots is significantly greater than the efficiency of humans (RRO, p<0.104).
Mean results for each robot type averaged across all experiments are summarised in Table 5.3.1. We see that the efficiency of robots is greater than the efficiency of humans under every condition, with robots securing a delta profit gain of between 0.4% and 1.8%.
Figure 5.3.1. Mean efficiency of robots across all markets (±95% confidence interval). As sleep time increases (left to right), mean efficiency of robots appears to decrease. However, the difference is not significant.
Fig. 5.3.1 plots mean efficiency of robots grouped by type. As robot sleep time decreases, the efficiency of robots appears to increase, however, across all markets this difference is not significant. When comparing data from only cyclical markets, however, AA-0.1 robots attain a mean efficiency score significantly higher than AA-1 (RRO, p=0.05), AA-5 (RRO, p=0.05), and AA-10 (RRO p=0.1). For full Robust Rank Order analysis of efficiency scores, refer to Appendix A.2.2.
5.4. Profit dispersion
Table 5.4.1. Summary of profit dispersion for markets. When comparing random with cyclical markets, profit dispersion in random markets is significantly lower for agents, humans, and the market as a whole.

Exploring the “robot phase transition” in experimental human-algorithmic markets
22
Comparing robot types, there is no significant difference in profit dispersion of markets, robots, or humans. However, comparing cyclical and random markets, shows that random markets have significantly lower profit dispersion of the market as a whole (RRO, 0.005<p<0.01), significantly lower profit dispersion of humans (RRO, 0.025<p<0.05), and significantly lower profit dispersion of agents (RRO, 0.001<p<0.005). For full Robust Rank Order analysis of profit dispersion, refer to Appendix A.2.3.
5.5. Execution counterparties
Table 5.5.1. Mean proportion of counterparty executions grouped by robot type. X<Y denotes “a price posted by participant X is hit by participant Y”. We see that the proportion of homogeneous counterparty interactions increases as sleep-wake cycle decreases.
Table 5.5.1 shows the mean proportion of counterparty executions grouped by robot type. In a fully mixed market, we expect roughly half of all trades to have homogeneous counterparties (humans trading with humans and robots trading with robots) and the other half to have heterogeneous counterparties (humans trading with agents, or vice versa).
Figure 5.5.1. Proportion of homogeneous counterparty executions: i.e., trades that take place between two humans or two robots. In a mixed market, the proportion of homogeneous counterparties should be 50%. When agent sleep time is 0.1s, the proportion of homogeneous counterparties is always greater than 50% indicating some market fragmentation.
Fig. 5.5.1 plots the median number of homogeneous counterparties in markets containing each of the four robot types, with error bars showing the range of values. There appears to be an inverse relationship between robot sleep time and proportion of homogeneous counterparties. RRO tests show that the proportion of homogeneous interactions in AA-0.1 markets is significantly higher than AA-1 and AA-5 markets (p<0.051), and AA-10 markets (p=0.0011); and for AA-1 and AA-5 markets the proportion is significantly higher than AA-10 (p<0.104). For

Exploring the “robot phase transition” in experimental human-algorithmic markets
23
AA-10 robots, the proportion of homogeneous counterparties is significantly lower in random markets than cyclical markets (p<0.05). For all other robot types, there is no significant difference in the proportion of homogeneous counterparties between markets.
If we assume a normal distribution for the counterparty distributions, then calculating confidence intervals shows that in all (six) markets containing AA-0.1 robots, the proportion of homogeneous counterparties is significantly greater than 50% (p<0.0001). In contrast, for markets containing AA-1 robots (five), AA-5 robots (six), and AA-10 robots (six), the null hypothesis that the proportion of homogeneous counterparties is 50% is not rejected at the 10% level of significance. This suggests that for the fastest robots (AA-0.1) there is a trend to market fragmentation, with humans trading with humans and robots trading with robots more than would be expected by chance. For a full summary of Robust Rank Order analysis of execution counterparties, refer to Appendix A.2.1.
6. Discussion
6.1. Evidence for the ‘robot phase transition’ In Section 4, above, we presented results of laboratory experiments performed on Wed 7th March. Here, we summarize the main results that hold across all markets. In Section 5.2, below, we discuss results that demonstrate significant differences between cyclical and random markets.
Across all markets, and for all robot types, robots are shown to outperform humans, securing greater allocative efficiency scores under every condition and gaining a delta profit increase of between 0.4%-1.8%. These results are significant across all markets and robot types, except AA-10, the slowest of the robots.
For readers familiar with our previous work (De Luca et al., 2011; Cartlidge et al., 2012), this result may come as something as a surprise: prima facie, this is the first time that robots have been shown to be more efficient than humans in a continuous replenishment, real-time experimental market with liquidity drip-fed into the market over time. There is weak evidence (not statistically significant) of a trend for the efficiency of agents to decrease as sleep time of agents increases, suggesting that speed is beneficial to agents. This is an intuitively appealing interpretation, but is not confirmed with a reasonable level of statistical significance by our results. Furthermore, the prima facie novelty of this result is primarily due to problems with the earlier results published in (De Luca et al., 2011; Cartlidge et al., 2012). Those earlier results, we learned in the course of analysing the results of the experiments reported here, were affected by a bug in the OpEx implementation of the MGD robot-trader algorithm, and fixing that bug was the main cause of the increase in efficiency with respect to those earlier results: we discuss this further in Section 5.3.
Across all markets, α values start high (in the region of 10%) as traders ‘explore’ the space of prices and then quickly reduce, with markets tending to an equilibration level of α=1%. This demonstrates markets trading at a level much closer to equilibrium than previously observed in De Luca et al., (2011) and Cartlidge et al., (2012); and suggests that the price-discovery of markets is regularly finding values close to the theoretical equilibrium value.
These results demonstrate a well-functioning robot-human market trading near equilibrium, with robots out-competing humans on profit. This is an interesting result, but for our purpose of exploring the robot phase transition described by Johnson et al. (2012) it only serves as demonstrative proof that our experimental markets are performing as we would expect. The

Exploring the “robot phase transition” in experimental human-algorithmic markets
24
real interest lies in whether we can observe a phase transition between two regimes: one dominated by robot-robot interactions, and one dominated by human-robot interactions. We seek evidence of this by observing the proportion of homogeneous counterparties within a market; that is, the number of trade executions that occur between a pair of humans or a pair of robots, as a proportion of all market trades. Theory suggests that in a fully mixed market with no asymmetry in the behaviour of participants, we should expect 50% of trade counterparties to be homogeneous, and 50% to be heterogeneous, as traders execute with counterparties at random. From Section 4.5, evidence demonstrates that for markets containing AA-0.1 robots, the proportion of homogeneous counterparties is significantly higher than we would expect in a mixed market, whereas with slower-acting robots, the proportion of homogeneous counterparties cannot be significantly differentiated from 50%. We present this as tentative first evidence for a robot-phase transition in experimental markets with a boundary between 100 milliseconds and 1 second, although in our experiments the effects of increasing robot speed seem to give a progressive response rather than a step-change. However, we feel obliged to caveat this result as non-conclusive proof until further experiments have been run and results are replicated (for more on the replication of results, refer to Section 5.2).
The careful reader may have noticed that the results presented have not demonstrated the ‘fractures’ – an ultra-fast series of multiple sequential up-tick or down-tick trades that cause market price to deviate rapidly from equilibrium and then just as quickly return - that Johnson et al. (2012) showed occur in real markets. Since we are constraining market participants to one role (as buyer, or seller) and strictly controlling the flow of orders into the market and limit prices of trades, the simple markets we have constructed do not have the capacity to demonstrate such fractures. For this reason, we use the proportion of homogeneous counterparties as proxy evidence for the robot phase transition.
6.2. Artefacts or evidence? As we argued in Section 3.3, our cyclical-replenishment experimental markets are a poorer approximation to real-world markets than are the random-replenishment markets. For that reason, where our results from cyclical markets show a significant effect of agent-speed that is not also present in the random markets is best interpreted as another indication that introducing artificial constraints into experimental markets for ease of analysis runs the risk of also introducing artefacts that, because they are statistically significant, can be misleading. The following relationships were all observed to be statistically significant in cyclical-replenishment markets and not statistically significant in random-replenishment markets; providing further support for the argument for ‘realism’ in artificial-market experiment design that we advanced at length in De Luca et al. (2011).
• Cyclical-replenishment markets produced significantly greater α values in the first period of trade. This is a direct consequence of cyclical-replenishment allocating orders in a monotonically decreasing sequence from most profitable to least profitable. As such, the first orders allocated into the market have limit prices far from equilibrium. Since the market is empty, there is no mechanism for price discovery available other than trial-and-error exploration; leading to α. In random-replenishment markets, the initial orders entering the market are drawn at random from the demand and supply schedules. This (in the limit) leads to lower bounds on limit prices and leads to lower α. In subsequent periods, price discovery is led by the order book, resulting in much lower α values in both market types (with no significant difference).
• In cyclical-replenishment markets, the efficiency of AA-0.1 robots is significantly higher than the efficiency of the other robot types. While there is some evidence of an inverse relationship
Exploring the “robot phase transition” in experimental human-algorithmic markets
25
between robot sleep time and robot efficiency across all markets, we infer that this difference is an artefact of cyclical replenishment until further experimental trials can confirm otherwise.
• When comparing random and cyclical markets, profit dispersion in cyclical-replenishment markets is significantly higher for agents, humans, and the market as a whole. Since lower profit dispersion is a desirable property of a market, this suggests that the relatively high profit dispersion observed in previous cyclical-replenishment experiments (De Luca et al., 2011; Cartlidge et al., 2012) is an artefact of the experimental design.
These results demonstrate dangers of accidently introducing artefacts through experimental simplification and give justification to De Luca et al.’s (2011) argument for more realism in the design of experiment scenarios for experimental-economics-style studies of human and robot traders interacting in electronic markets.
6.3. Reproduction vs. replication: A methodological journey through the badlands of ‘spread-jumping’ robots.
On Wed. 7th March, 2012, we ran 24 human-vs.-robot trading experiments using random-replenishment markets, with the same P0 values and supply and demand schedules as Day 2 (for full results data, refer to Appendix B).
As we started to analyse the data we collected, we were confused by our findings: time series plots of trade prices (e.g., Fig. 6.3.1) showed that trades were consistently taking place at prices more than 5% away from the equilibrium price P0. Comparison results of the efficiency of humans and robots showed that humans significantly outperformed robots across all markets, with a significant delta profit in favour of humans of 11.3% (RRO, p<0.0005). Across all markets, the mean efficiency of agents was only 0.887, and the market as a whole was only 0.94. Humans, meanwhile, were securing a healthy mean efficiency across all markets of 0.994. This left us pondering just what was making the robots perform so poorly, that was also enabling the humans to perform so well?

Exploring the “robot phase transition” in experimental human-algorithmic markets
26
Figure 6.3.1. Series of trade prices from day 1, session 1, round 1 (i.d. 1001), a random-replenishment market containing AA-0.1 robots. We see that the majority of trades are symmetrically distributed around P0, but execute some distance away (compare with results from day 2, Figs. 5.1.2 and 5.1.4, where trades execute much closer to equilibrium). The majority of trades are executed by robots ‘hitting’ a human quote (open faced red square), suggesting that intransigent humans tend to passively post quotes on the order book and wait for a ‘hit’, while robots trade more aggressively, executing against posted quotes.
Observation of time-series data of trades (Fig. 6.3.1) and anecdotal evidence of human participants suggested that the dominant strategy of humans was to passively post quotes on the order book away from equilibrium, i.e. away from P0, and then wait intransigently for a more aggressive counterparty to hit the quote. Further analysis of execution counterparties in the market confirmed that robots were acting as the aggressive counterparties in the market. Indeed, the market was dominated by robot traders executing against quotes published by humans, accounting for a staggering 63.1% of all trades.
But why were AA robots accepting human quotes away from equilibrium time and time again? Nothing in the original design of AA suggests that this should happen (Vytelingum, 2006; Vytelingum, Cliff, & Jennings, 2008). AA robots estimate market equilibrium and then adapt their aggressiveness over time to maximise profit; they should consistently trade aggressively away from P0.
This led us to rigorously test the source code of OpEx, publicly available since the open-source release of OpEx in Feb 2012. It was through this that we discovered an unanticipated feature, a ‘bug’, in the execution logic of OpEx-AA agents that does not exist in the original AA definition: if the spread between the best bid and ask is less than 15% of the best ask, then execute against the best bid/offer on the other side of the book if it is within limit price bounds. This logic induces ‘spread-jumping’ behaviour in AA robots that explains the market dynamics we observe – namely, aggressive execution behaviour across wide spreads away from equilibrium values. We decided that the results from Wed 7th March were contaminated by the spread-jumping behaviour of robots and decided to perform a second day of experiments on Wed 21st March (detailed in Section 4). We altered the spread-jumping parameter from the absurdly provocative value of 15%, to a much more conservative value of 1% for the experiments of Day 2. The bug was reported to De Luca and acknowledged on the OpEx SourceForge download page: “Latest News: 25 March 2012: Bug fixed in AA Agent. AA Agent would cross the spread

Exploring the “robot phase transition” in experimental human-algorithmic markets
27
if the relative spread is <= 0.15. The bug has been fixed in version 1.1” (OpEx SourceForge, 2012).
This episode serves as an exemplar to highlight an important methodological point that has been raised before elsewhere (De Luca et al., 2011): empirical results gathered through experimentation should not be fully trusted until they have been replicated at least once; and yet there is an embarrassingly poor record in the literature on robot-human trading experiments. For example, the experiments reported by De Luca & Cliff (2011a) were the first-ever replication of a key paper in the field, widely-cited, that had been published a decade previously. That is, for ten years, very many people cited the paper but no-one took the step of confirming its results via direct replication. Similarly, Toft (2007) reported significant difficulty in replicating the published results for a number of peer-reviewed trading-agent studies, and also discussed the difficulties he encountered when he contacted the researchers concerned and asked them to help him better understand how they had generated their published results.
Put simply, the computer science researchers who work on studies of trader-agents have a simple but very valuable lesson to learn from the replication-as-standard approach that is commonplace in “hard science” (physics, chemistry, biology) laboratories around the world.
Unfortunately, the problem we faced here is that in truth we were reproducing experimental results, not independently replicating them (that is, we used the same platform on which the previous results had been generated, rather than independently rebuilding a substantial part of the platform ourselves). Because of this, we reproduced results that were contaminated by the same bug as the original ones. We hope this serves as something of a salutary tale for other researchers engaged in similar research.
Given the significant differences in our results from Day 1 and Day 2, we must conclude that the spread-jumping behaviour of AA-robots has a significant effect on market dynamics. For this reason, in light of our discovery of the spread-jumping bug, we now have serious doubts about the tenability of the conclusions reached in De Luca et al. (2011) and Cartlidge et al. (2012), and we suggest that they be regarded with extreme doubt, at the very least, until they have been replicated independently.
6.4. Future work As usual, in trying to explore the research question driving this report, on the nature of the robot phase transition, many pertinent questions have arisen, including:
• What would we need to change to observe market dynamics analogous to the market ‘fractures’ reported by Johnson et al. (2102)? Could the introduction of role diversity - enabling participants to buy and sell and hence ‘make the market’ – produce dynamics qualitatively similar to the ultra-fast mini-crashes observed in real markets?
• What happens if we vary the rate of order replenishment inter-arrival times? When orders start to arrive faster than humans can react, do we see a robot phase transition here?
• What happens if we vary the proportion of robots in the market? Are market dynamics significantly different when the market is dominated by robots? How does this effect the robot phase transition?

Exploring the “robot phase transition” in experimental human-algorithmic markets
28
• What happens if robots do not wake up on new trade stimuli? Does this make a fairer proxy of agent ‘speed’? How does this change affect the robot phase transition?
While these questions are interesting, progress will necessarily be slow. Unlike many facets of computer science, where variations on a question theme can be easily tweaked by altering the values of some parameters and then pressing ‘run’, experimental economics offers the pragmatic challenge of soliciting and remunerating participants, arranging a venue, ensuring participants arrive, and finally, ensuring that the system is ‘correctly’ configured and functioning error-free during the ‘one-shot performance’ of each experiment. For many empirical computer scientists, this is an alien landscape.
7. Conclusions
We have presented results from a series of human-vs.-robot experimental financial markets to test the hypothesis that when robot trader agents in OpEx are able to act/react on a timescale quicker than the human traders are, we will see a transition from a mixed market (where humans and robots are equally likely to interact with one another) to a more fragmented market where robots are more likely to trade with robots, and humans with humans, similar to the robot phase transition that Johnson et al. (2012) presented evidence for in real financial markets. Our primary conclusion is that our results are supportive of Johnson et al.’s (2012) hypothesis concerning the robot phase transition, although in our experiments the effects of increasing robot speed seem to give a progressive response rather than a step-change.
During the course of running the experiments presented in this paper, we also explored the effects of increasing the ‘realism’ of the structure of the experiments conducted on OpEx. In doing this, we discovered that some statistically significant effects that we observe in artificial, constrained experimental set-ups, disappear when we make the experiments more realistic and less constrained. This leads us to our second conclusion: that in experiments such as those reported here, the more realistic the set-up of the experiment, the more the results can be trusted.
Our third and final conclusion will be rather obvious to anyone with a background in laboratory-based hard-science research, but nevertheless is probably illuminating to computer science researchers who study electronic markets and/or automated trading agents: independent replication of results is vitally important in ensuring the quality of research and providing trusted results. During the course of conducting the experiments reported here, we identified a bug that casts doubt on results in previous papers that we have co-authored. If we hadn’t attempted a (semi-independent) replication of our earlier work, we may not have discovered this.
Acknowledgements
We are grateful to Neil Johnson and the two anonymous peer-reviewers appointed by Foresight whose comments on an earlier version of this paper were very useful. Thanks also to Angela Cheng, who provided administrative support during the experiments. Primary financial support for Dave Cliff’s research comes from EPSRC grant number EP/F001096/1; John Cartlidge is supported by EPSRC grant number EP/H042644/1. Financial assistance in the funding of the prizes we used as rewards and incentives for our experiments came from Syritta Algorithmics Ltd. We are also extremely grateful to all the participants of our experiments.

Exploring the “robot phase transition” in experimental human-algorithmic markets
29
References
J. Cartlidge, C. Szostek, M. De Luca, & D. Cliff (2012). Too fast too furious: faster financial-market trading agents can give less efficient markets, in Proc. 4th Int. Conf. Agents and Artif. Intelligence, Vol. 2 – Agents (ICAART-2012), J. Filipe & A. Fred, Eds. Vilamoura, Portugal: SciTePress, Feb. 2012, pp 126-135. Available [Online]: http://dx.doi.org/10.5220/0003720301260135.
D. Cliff (1997). Minimal-Intelligence Agents for Bargaining Behaviors in Market-Based Environments. Technical Report HPL-97-91, Hewlett-Packard Laboratories. Available [Online]: http://www.hpl.hp.com/techreports/97/HPL-97-91.pdf.
D. Cliff & C. Preist (2001). Days Without End: On the Stability of Experimental Single-Period Continuous Double Auction Markets. Technical Report HPL-2001-325, Hewlett-Packard Laboratories. Available [Online]: http://www.hpl.hp.com/techreports/2001/HPL-2001-325.pdf.
M. De Luca & D. Cliff (2011a). Agent-Human Interactions in the Continuous Double Auction, Redux: Using the OpEx Lab-in-a-Box to explore ZIP and GDX. In Proceedings of the Third International Conference on Agents and Artificial Intelligence (ICAART-2011). Rome, Jan., 2011. Available [Online]: http://lscits.cs.bris.ac.uk/docs/DeLuca_Cliff_ICAART_CAMERA_READY.pdf.
M. De Luca & D. Cliff (2011b). Human-Agent Auction Interactions: Adaptive-Aggressive Agents Dominate. In Walsh, T. (Ed.), Proceedings of the 22ndInternational Joint Conference on Artificial Intelligence (IJCAI-2011), pp. 178-185, Barcelona, Spain, July 2011. AAAI Press. Available [online]: http://ijcai.org/papers11/Papers/IJCAI11-041.pdf.
M. De Luca, C. Szostek, J. Cartlidge, & D. Cliff, (2011). Studies of Interactions Between Human Traders and Algorithmic Trading Systems. Briefing paper commissioned as part of the UK Government’s Foresight Project, The Future of Computer Trading in Financial Markets – Foresight Driver Review – DR 13, Crown Copyright, Sep. 2011. Available [online]: http://www.bis.gov.uk/assets/foresight/docs/computer-trading/11-1232-dr13-studies-of-interactions-between-human-traders-and-algorithmic-trading-systems.pdf
N. Feltovich (2003). Nonparametric Tests of Differences in Medians: Comparison of the Wilcoxon-Mann-Whitney and Robust Rank-Order Tests. Experimental Economics, 6: 273-297. Available [Online]: http://www.uh.edu/~nfelt/papers/robust.pdf.
.
J. Giles (2012). Stock trading ‘fractures’ may warn of next crash. In New Scientist (2852), pp. 21, 15th Feb. 2012. Available [Online]: http://www.newscientist.com/article/mg21328525.700-stock-trading-fractures-may-warn-of-next-crash.html
S. Gjerstad & J. Dickhaut (1998). Price Formation in Double Auctions. Games and Economic Behavior, 22(1):1–29. Available [Online]: http://www.research.ibm.com/iac/papers/pfdalnai.pdf.
.
D. Gode & S. Sunder (1993). Allocative Efficiency of Markets with Zero-Intelligence Traders: Markets as a Partial Substitute for Individual Rationality. Journal of Political Economy. 101(1):119-137.
J. Grossklags & C. Schmidt (2003). Artificial software agents on thin double auction markets: a human trader experiment. In: Proceedings of the IEEE/WIC International Conference on

Exploring the “robot phase transition” in experimental human-algorithmic markets
30
Intelligent Agent Technology (IAT 2003), pp.400-407. http://www.sims.berkeley.edu/~jensg/research/agents_iat.html.
J. Grossklags & C. Schmidt (2006). Software agents and market (in)efficiency: a human trader experiment. IEEE Transactions on Systems, Man and Cybernetics, Part C (Applications and Reviews), 36(1): pp. 56-67. [Online]: http://www.sims.berkeley.edu/~jensg/research/agents_SMC.html.
N. Johnson, G. Zhao, E. Hunsader, J. Meng, A. Ravindar, S. Carran, and B. Tivnan (2012). Financial black swans driven by ultrafast machine ecology. Working paper published on arXiv repository, 7th Feb 2012, arXiv:1202.1448v1. Available [online]: http://arxiv.org/pdf/1202.1448v1.pdf.
B. Keim (2012). Nanosecond trading could make markets go haywire. In Wired, Vol. 20, No. 02, 16th Feb 2012. Available [online]: http://www.wired.com/wiredscience/2012/02/high-speed-trading/
OpEx SourceForge (2012). SourceForge.net open-source download homepage for Open Exchange (OpEx) project. http://sourceforge.net/p/open-exchange/home/Home/. Last accessed 28th Mar., 2012.
.
OpEx Download Stats (2012). SourceForge.net open-source download statistics for Open Exchange (OpEx) project. http://sourceforge.net/projects/open-exchange/files/stats/timeline. Last accessed 28th Mar., 2012.
M. Price (2012). New reports highlight HFT research divide. In eFinancialNews.com, 21st Feb. 2012. Available [online]: http://www.efinancialnews.com/story/2012-02-21/hft-reports-highlight-research-divide-cornell.
V. Smith (1962). An experimental study of comparative market behavior. The Journal of Political Economy, 70: pp. 111–137.
V. Smith (2006). Papers in Experimental Economics. Revised Edition. Cambridge University Press.
G. Tesauro & R. Das (2001). High-Performance Bidding Agents for the Continuous Double Auction. In Proceedings of IJCAI 2001 Economic Agents Models and Mechanisms Workshop and/or Proceedings of the Third ACM Conference on Electronic Commerce, pp.206-209. Available [Online]: http://www.research.ibm.com/infoecon/paps/ec01_dblauc.ps.
I. Toft (2007). Adaptive Bidding Agents for Single Seller and Continuous Double Auctions. PhD Thesis, Department of Computer Science, University of East Anglia, UK.
P. Vytelingum (2006). The Structure and Behaviour of the Continuous Double Auction. PhD thesis, University of Southampton School of Electronics and Computer Science, Southampton, UK.
P. Vytelingum, D. Cliff, & N. Jennings (2008). Strategic bidding in continuous double auctions. Artificial Intelligence, 172:1700–1729. Available [Online]: http://eprints.ecs.soton.ac.uk/15895/2/crc.pdf.

Exploring the “robot phase transition” in experimental human-algorithmic markets
31
Appendix A – Detailed results from day 2, Wed. 21st March, 2012
Time series figures of quotes and trades Quote and trade graphs are presented for cyclical-replenishment markets with SID = 5001 and random-replenishment markets with SID=5002 for all robot types. These 16 figures display one indicative run from each experimental market condition. The full set of figures (48) is too large to be presented here.
Human-vs-robots-AA-0.1 in a cyclical-replenishment market
Figure A.1.1a. Time series of quote prices from a cyclical-replenishment market on Day 2 (i.d. 5001).
Figure A.1.1b. Time series of trade prices from a cyclical-replenishment market on Day 2 (i.d. 5001).

Exploring the “robot phase transition” in experimental human-algorithmic markets
32
Human-vs-robots-AA-0.1 in a random-replenishment market
Figure A.1.2a. Time series of quote prices from a random-replenishment market on Day 2 (i.d. 5002).
Figure A.1.2b. Time series of trade prices from a random-replenishment market on Day 2 (i.d. 5002).

Exploring the “robot phase transition” in experimental human-algorithmic markets
33
Human-vs-robots-AA-1 in a cyclical-replenishment market
Figure A.1.3a. Time series of quote prices from a cyclical-replenishment market on Day 2 (i.d. 5001).
Figure A.1.3b. Time series of trade prices from a cyclical-replenishment market on Day 2 (i.d. 5001).
7.1.

Exploring the “robot phase transition” in experimental human-algorithmic markets
34
Human-vs-robots-AA-1 in a random-replenishment market
Figure A.1.4a. Time series of quote prices from a random-replenishment market on Day 2 (i.d. 5002).
Figure A.1.4b. Time series of trade prices from a random-replenishment market on Day 2 (i.d. 5002).
7.2.

Exploring the “robot phase transition” in experimental human-algorithmic markets
35
Human-vs-robots-AA-5 in a cyclical-replenishment market
Figure A.1.5a. Time series of quote prices from a cyclical-replenishment market on Day 2 (i.d. 5001).
Figure A.1.5b. Time series of trade prices from a cyclical-replenishment market on Day 2 (i.d. 5001).
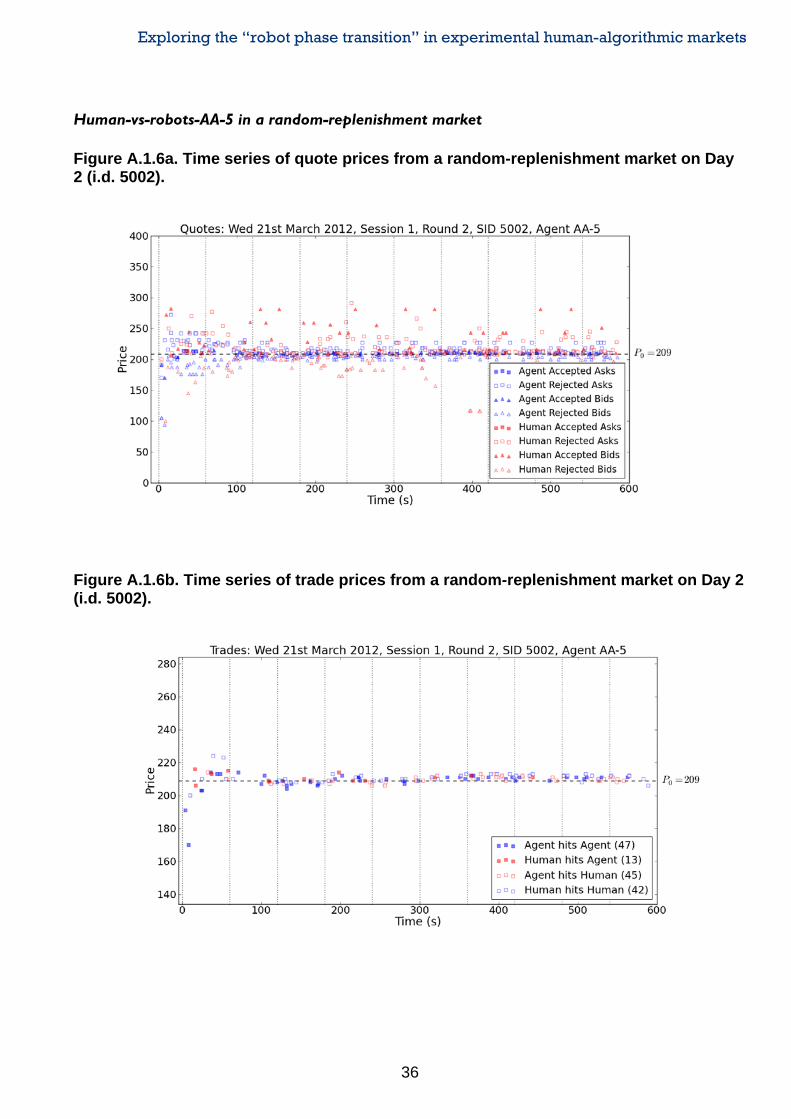
Exploring the “robot phase transition” in experimental human-algorithmic markets
36
Human-vs-robots-AA-5 in a random-replenishment market
Figure A.1.6a. Time series of quote prices from a random-replenishment market on Day 2 (i.d. 5002).
Figure A.1.6b. Time series of trade prices from a random-replenishment market on Day 2 (i.d. 5002).

Exploring the “robot phase transition” in experimental human-algorithmic markets
37
Human-vs-robots-AA-10 in a cyclical-replenishment market
Figure A.1.7a. Time series of quote prices from a cyclical-replenishment market on Day 2 (i.d. 5001).
Figure A.1.7b. Time series of trade prices from a cyclical-replenishment market on Day 2 (i.d. 5001).

Exploring the “robot phase transition” in experimental human-algorithmic markets
38
Human-vs-robots-AA-10 in a random-replenishment market
Figure A.1.8a. Time series of quote prices from a random-replenishment market on Day 2 (i.d. 5002).
Figure A.1.8b. Time series of trade prices from a random-replenishment market on Day 2 (i.d. 5002).

Exploring the “robot phase transition” in experimental human-algorithmic markets
39
Robust Rank Order (RRO) analysis for day 2, Wed 21st March, 2012 A.2.1 Execution counterparties
Table A.2.1a. Summary of RRO comparisons for proportion of Agent-Agent executions. Top: across all markets, the proportion of Agent-Agent executions is significantly greater when agent sleep time = 0.1s, and the proportion of Agent-Agent executions is significantly lower when sleep time = 10s. Middle: in cyclical-replenishment markets, sleep = 0.1s produces significantly more Agent-Agent executions. Bottom: in random-replenishment markets, sleep = 10s produces significantly less Agent-Agent executions.
Table A.2.1b. Summary of RRO comparisons for proportion of Human-Human executions. Across all markets, the proportion of Human-Human interactions is significantly greater when sleep=0.1s compared with sleep=10s
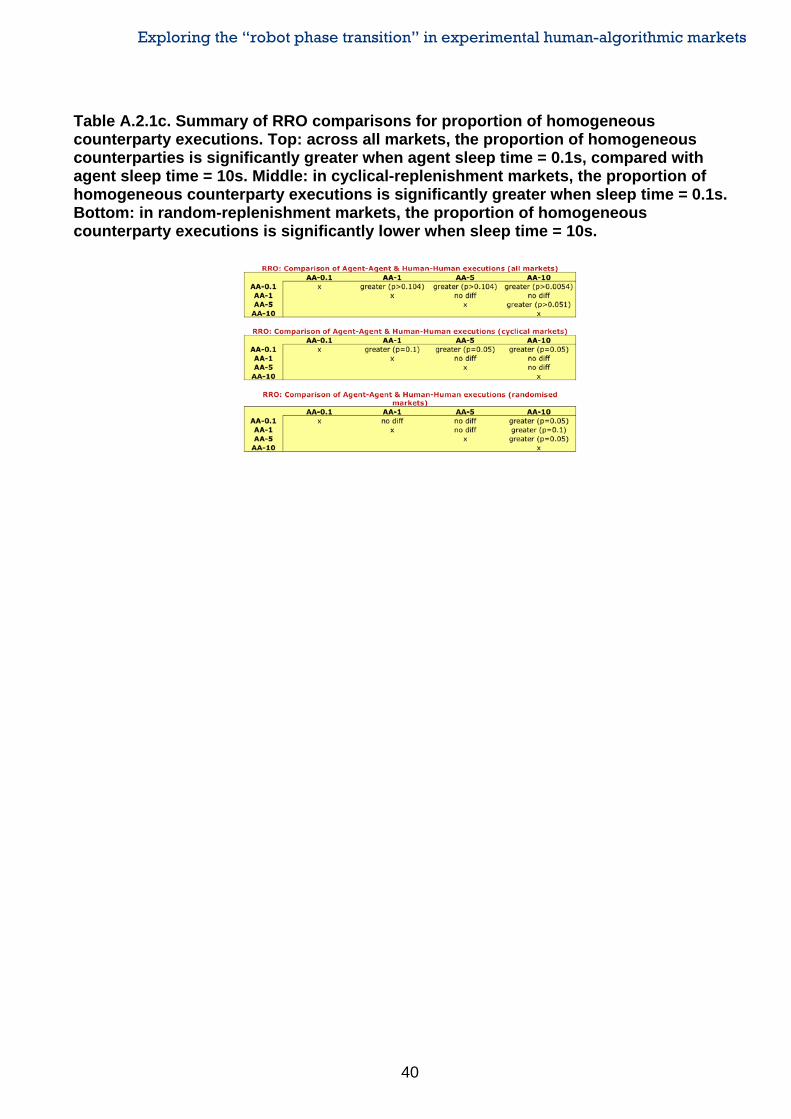
Exploring the “robot phase transition” in experimental human-algorithmic markets
40
Table A.2.1c. Summary of RRO comparisons for proportion of homogeneous counterparty executions. Top: across all markets, the proportion of homogeneous counterparties is significantly greater when agent sleep time = 0.1s, compared with agent sleep time = 10s. Middle: in cyclical-replenishment markets, the proportion of homogeneous counterparty executions is significantly greater when sleep time = 0.1s. Bottom: in random-replenishment markets, the proportion of homogeneous counterparty executions is significantly lower when sleep time = 10s.

Exploring the “robot phase transition” in experimental human-algorithmic markets
41
A.2.2 Efficiency: Human vs. robots
Table A.2.2.1. RRO comparisons of the efficiency of robots-vs.-humans by market type. Robots outperform humans across all markets (p<0.025), in cyclical-replenishment markets (p<0.1) and in random-replenishment markets (p<0.1).
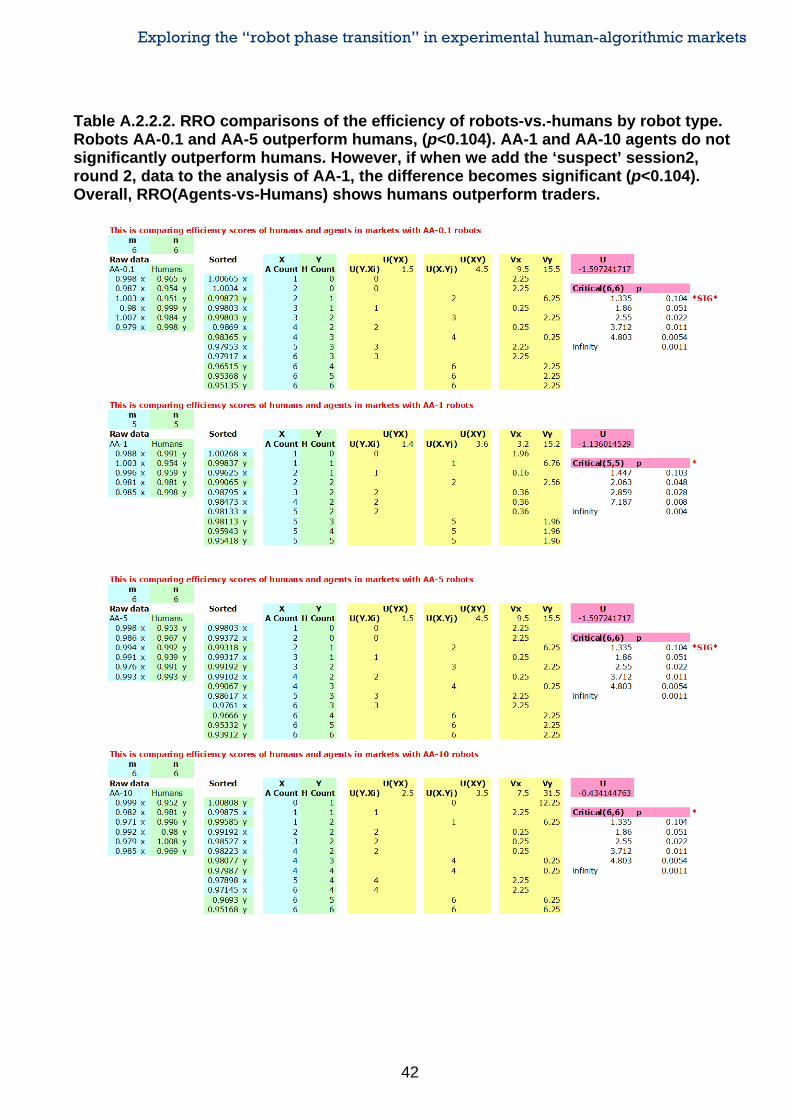
Exploring the “robot phase transition” in experimental human-algorithmic markets
42
Table A.2.2.2. RRO comparisons of the efficiency of robots-vs.-humans by robot type. Robots AA-0.1 and AA-5 outperform humans, (p<0.104). AA-1 and AA-10 agents do not significantly outperform humans. However, if when we add the ‘suspect’ session2, round 2, data to the analysis of AA-1, the difference becomes significant (p<0.104). Overall, RRO(Agents-vs-Humans) shows humans outperform traders.

Exploring the “robot phase transition” in experimental human-algorithmic markets
43
A.2.3. Profit dispersion
Table A.2.3.1. RRO comparisons of the profit dispersion of markets, robots and humans, by market type. Random-replenishment markets produce significantly lower profit dispersion of markets (0.005<p<0.01), robots (0.001<p<0.005), and humans (0.025<p<0.05).

Exploring the “robot phase transition” in experimental human-algorithmic markets
44
A.2.4. Smith’s α
Table A.2.4.1. RRO comparisons of Smith’s α for the first permit schedule period in cyclical-replenishment and random-replenishment markets. Smith’s α is significantly lower for random-replenishment markets (p<0.0005).
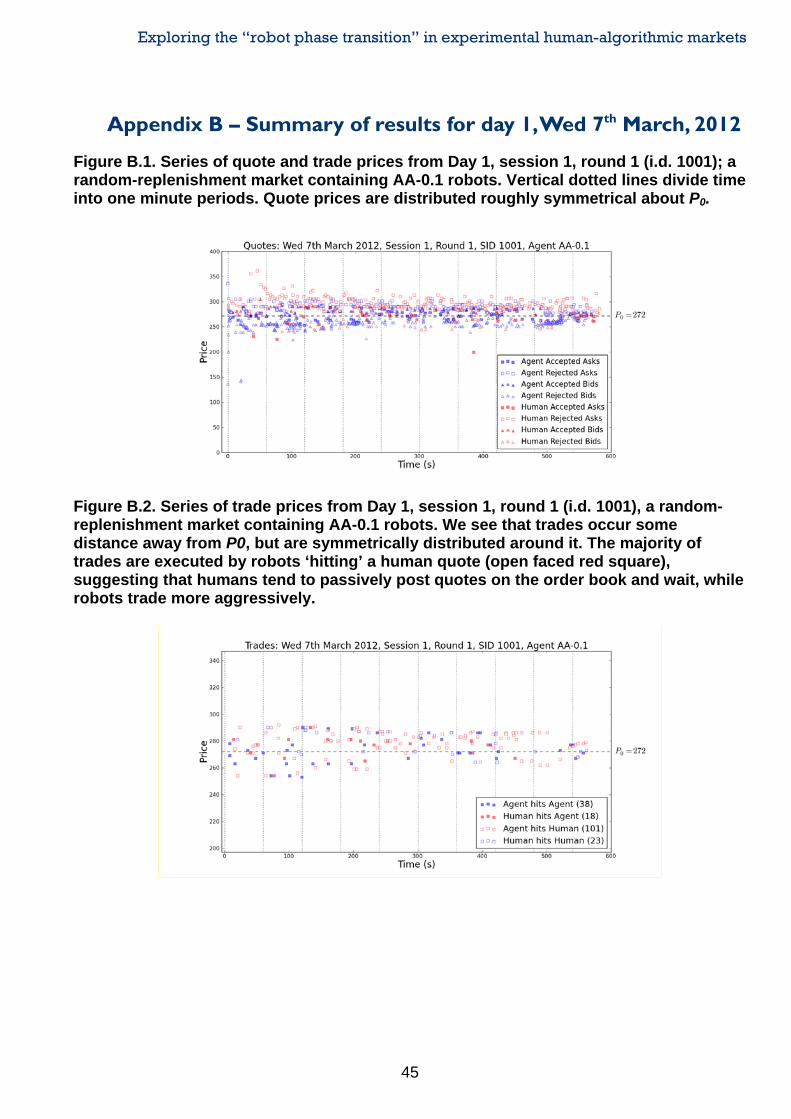
Exploring the “robot phase transition” in experimental human-algorithmic markets
45
Appendix B – Summary of results for day 1, Wed 7th March, 2012
Figure B.1. Series of quote and trade prices from Day 1, session 1, round 1 (i.d. 1001); a random-replenishment market containing AA-0.1 robots. Vertical dotted lines divide time into one minute periods. Quote prices are distributed roughly symmetrical about P0.
Figure B.2. Series of trade prices from Day 1, session 1, round 1 (i.d. 1001), a random-replenishment market containing AA-0.1 robots. We see that trades occur some distance away from P0, but are symmetrically distributed around it. The majority of trades are executed by robots ‘hitting’ a human quote (open faced red square), suggesting that humans tend to passively post quotes on the order book and wait, while robots trade more aggressively.

Exploring the “robot phase transition” in experimental human-algorithmic markets
46
Figure B.3. Smith’s α plotted for Day 1. Under all conditions, α gradually tends towards approx 2%. This is approx double the value of α that Day 2 markets tend to. In De Luca et al. (2011), under similar experimental conditions, but using cyclical-replenishment markets, mean α values across all AA-robot-vs.-human markets tended to approx. 7%. This suggests that random-replenishment helps markets to equilibrate.
Table B.4. Summary of results for Day 1. Across all robot conditions, the efficiency of humans is greater than the efficiency of agents, with delta profit ranging from 9.0% to 14.0% in favour of humans. Mean agent efficiency is less than 0.9 under all robot conditions. The efficiency of markets is roughly 5% lower than on Day 2.
Table B.5. Summary of counterparty executions for Day 1. For all robot types, markets are dominated by trades where robots hit humans (H<A: 61.3% mean), suggesting that humans tend to passively post quotes on the order book and wait to be ‘hit’ robots trading aggressively.

Exploring the “robot phase transition” in experimental human-algorithmic markets
47
Table B.6. RRO comparison on efficiency of robots vs. efficiency of humans across all markets on Day 1, showing humans outperforming robots (p<0.0005).

Exploring the “robot phase transition” in experimental human-algorithmic markets
48
Appendix C – Screenshots of OpEx sales trading GUI
Figure C.1. Sales trading GUI for humans: market closed. Client orders to be worked arrive in the panel, top-left. The order book view is top-right. Personal profit and loss (PNL) and time remaining until market close are between client orders and order book. Orders being worked in the market are shown in the middle panel. Executed trades history is listed in the bottom panel.
Figure C.2. Sales trading GUI for humans: enter buy order using ‘New Order’ popup. The ‘New Order’ pop-up opens when a client order is double-clicked.

Exploring the “robot phase transition” in experimental human-algorithmic markets
49
Figure C.3. Sales trading GUI for humans: order executes. The screen flashes green to indicate an order has executed.
Figure C.4. Sales trading GUI for humans: amend an order that is currently quoted on the order book using the ‘Amend Order’ popup. The ‘Amend Order’ pop-up opens when a client order, listed in the middle ‘Orders’ panel, is double-clicked.

Exploring the “robot phase transition” in experimental human-algorithmic markets
50
© Crown copyright 2012
You may re-use this information (not including logos) free of charge in any format or medium, under the terms of the Open Government Licence. Visit www.nationalarchives.gov.uk/doc/open-government-licence write to the information Policy Team, The National Archives, Kew, London Tw9 4DU, or email: [email protected] Foresight 1 Victoria Street London SW1H 0ET www.foresight.gov.uk URN: 12/1058
Related Documents