A CASE STUDY OF THE EUROPEAN DAIRY INDUSTRY EXPLORING THE RELATIONSHIP BETWEEN FIRM CHARACTERISTICS AND CORPORATE SOCIAL RESPONSIBILITY STRATEGY Sven Thomassen Final report

Welcome message from author
This document is posted to help you gain knowledge. Please leave a comment to let me know what you think about it! Share it to your friends and learn new things together.
Transcript

i
A CASE STUDY OF THE EUROPEAN DAIRY INDUSTRY
EXPLORING THE RELATIONSHIP BETWEEN FIRM CHARACTERISTICS
AND CORPORATE SOCIAL RESPONSIBILITY STRATEGY
Sven Thomassen Final report
ii
Exploring the relationship between firm characteristics and corporate social responsibility strategy in the European dairy industry Gerardus Lambertus (Sven) Thomassen Registration No: 941216-829-020 MST-80436 (MSc Thesis Management Studies) Business, Management and Organisation Group (BMO) Wageningen University and Research Supervisor: dr. W.J.J. (Jos) Bijman Co-supervisor: dr. V. (Vincent) Blok Credits: 36 ECTS Date: 02 – 07 – 2019 Version 4.0 Cover picture: (NIBC, n.d.) Disclaimer: this product is produced by a student of Wageningen University as a part of the course MST-80436. This is not an official publication of Wageningen University or Wageningen University and Research and the content herein does not represent any formal position or representation by Wageningen University. Copyright Ó 2019. All rights reserved. No part of this publication may be reproduced or distributed in any form of by any means, without the prior consent of the author.

iii
Preface This research was facilitated by the Business, Management and Organisations Group (BMO) located at Wageningen University and Research. The supervision was provided by dr. W.J.J. (Jos) Bijman (Wageningen University and Research) being my supervisor and dr. V. (Vincent) Blok (Wageningen University and Research) being my co-supervisor. The findings of this report are entirely the responsibility of G.L. (Sven) Thomassen and cannot be considered as an expression of Wageningen University and Research. Acknowledgements During the 6 months this research has been conducted, I was offered the possibility to develop my research skills. I would like to thank all the people involved who supported me during this journey, especially my supervisor and co-supervisor.
iv
Abstract Corporate social responsibility (hereafter CSR) is a widely known concept in management literature since the emergence of it in the early fifties. Firms can be motivated for several reasons to implement CSR in their corporate strategy, among which the increase of corporate reputation. Although this might be the case, firms encounter difficulties during the implementation of CSR in their corporate strategy. In order to understand why the implementation of CSR is hampered, this study aimed to explore the relationship between firm characteristics and CSR strategy. This study explored this relationship specifically for the European dairy industry, due to the high percentages of cooperatives and lack of industry specific research. A multiple case study design was employed to investigate 11 European dairy firms. The relationship was explored firstly by constructing a theoretical background by reviewing literature. Afterwards a content analysis of the corporate reports was conducted to obtain firms’ CSR strategies. The literature review revealed three firm characteristics which were related to CSR. These characteristics are firm size, corporate governance and ownership. By the use of different metrics, the relationship between these characteristics and CSR strategy was explored. Results suggest that firm size, corporate governance and ownership are related to the amount disclosed by the firms on CSR. Although this might be the case, results should be interpreted carefully due to limitations of the sample (e.g size). To conclude, the results of this study indicate that firm size, corporate governance and ownership have an influence on the CSR strategies of European dairy firms.
v
Executive summary Corporate social responsibility (hereafter CSR) is a widely known concept in management literature since the emergence of it in the early fifties. Within the concept of CSR, firms acknowledge and take responsibility for their impact on society. Firms can be motivated for several reasons to implement CSR in their corporate strategy, among which the increase of corporate reputation and decrease of production costs. Although this might be the case, firms encounter difficulties by implementing CSR activities in their corporate strategy. The implementation process might be hampered due to several reasons, among which the unclear relationship between CSR and firms’ financial performance. However, literature also indicates that other factors might influence the integration process of CSR into the overall corporate strategy. To be more specific, literature indicated that firm characteristics may be related to CSR strategy. Creating better understanding on this specific topic, could results in better alignment between CSR and the firm’s overall strategy. As a consequence, performance of CSR activities could be improved. An increase of the performance of CSR might be crucial for managers to persuade firm’s stakeholders to invest in CSR activities.
In order to explore this relationship, this study selected 11 European dairy firms. The European dairy industry is particularly interesting because current literature lacks industry specific research. Furthermore, the high percentages of cooperatives could lead to interesting results. The aim of this study is thus to explore the relationship between firm characteristics and CSR strategy in the context of the European dairy industry. In order to achieve this, firms’ corporate reports were analysed via a content analysis. Before the content analysis was conducted, scientific articles on CSR, CSR strategy and CSR disclosure were consulted. The literature review indicated that there is no consensus yet on a common definition. This is caused by the complex and dynamic nature of CSR. This might enable firms to formulate CSR in their own distinctive way. Furthermore, reviewed literature on CSR disclosure revealed that, based on legitimacy and stakeholder theory, three firm characteristics were found relevant to investigate in the context of the European dairy industry.
The three firm characteristics are firm size, corporate governance and ownership. Firm size was operationalised via the annual dairy turnover. Results suggests that firm size is positively related to CSR strategy. Corporate governance was operationalised via three metrics namely, number of board members, percentage of female board members and percentage of independent board members. Results of this study suggest that all three metrics are positively related to CSR strategy. Lastly, ownership was operationalised via ownership structure and ownership identity. Results suggest that, only for the private firms, ownership structure is positively related to CSR strategy. Cooperatives were not included in this analysis since cooperatives are by definition dispersed. Results regarding ownership identity suggest that private firms disclose more on average than cooperatives. Although these trends were obtained, one has to bear in mind that due to the limitations of the research design, results should be interpreted carefully. Related to the results, it is worthwhile to mention the differences between private firms and cooperative. The differences in terms of CSR disclosures, might be explained by the fact that cooperatives are less equipped in communicating their CSR strategy to stakeholders. If cooperatives fail to communicate their CSR strategy, it might have implications for their legitimacy in society and eventually their competitive position within the dairy industry. Therefore, it might be interesting for managers of the cooperatives to investigate how they could improve their CSR disclosure. Furthermore, it might be interesting for both the private firms and cooperatives to reflect upon their corporate governance structure. As this study indicates that certain board compositions might influence the CSR disclosure and thus the ability of firms to legitimize their behaviour via CSR. All in all, this study tried to explore the relationships between firm characteristics and CSR strategy and, thereby revealed that these characteristics might explain why firms face issues regarding the implementation of CSR.
vi
Table of Content
1. Introduction ............................................................................................................................................... 7 1.1 Introduction ................................................................................................................................................. 7 1.2 Research questions ...................................................................................................................................... 8
2. European dairy industry ............................................................................................................................. 9
3. Literature Review ..................................................................................................................................... 12 3.1 Corporate social responsibility strategy ..................................................................................................... 12 3.2 Corporate social responsibility disclosure .................................................................................................. 15 3.3 Firm characteristics .................................................................................................................................... 20
3.3.1 Firm size ............................................................................................................................................. 20 3.3.2 Corporate governance ........................................................................................................................ 22 3.3.3 Ownership .......................................................................................................................................... 24
3.4 Conceptual framework ............................................................................................................................... 25
4. Methodology ............................................................................................................................................ 27 4.1 Study design ............................................................................................................................................... 27 4.2 Data collection methods ............................................................................................................................ 27 4.3 Data analysis methods ............................................................................................................................... 28 4.4 Objects under study ................................................................................................................................... 29 4.5 Operationalization ..................................................................................................................................... 30
4.5.1 Corporate Social Responsibility Strategy ............................................................................................ 30 4.5.2 Firm characteristics ............................................................................................................................ 31
5. Results ..................................................................................................................................................... 34 5.1 Corporate social responsibility strategy ..................................................................................................... 34 5.2 Firm characteristics .................................................................................................................................... 34
5.1.1 Firm size ............................................................................................................................................. 35 5.1.2 Corporate governance ........................................................................................................................ 36 5.1.3 Ownership .......................................................................................................................................... 40
6. Discussion ................................................................................................................................................ 45 6.1. Comparing results with proposition .......................................................................................................... 45 6.2 Limitations .................................................................................................................................................. 47
7. Conclusion ................................................................................................................................................ 49 7.1 Conclusion .................................................................................................................................................. 49 7.2 Contributions, future research and implications ....................................................................................... 50
References ................................................................................................................................................... 51
Appendices .................................................................................................................................................. 58

7
1. Introduction
1.1 Introduction
Bangladeshi microentrepreneurs and the Danish dairy firm Arla Foods are on first sight unrelated business entities. However, from 2019 onwards they are collaborating to tackle the malnutrition in the rural areas of Bangladesh. Arla Foods started this collaboration to ensure that their product, Dano Daily Pushti, could reach the target customers. These are the residents of rural Bangladesh, which are hard to reach due to limited distribution networks and poor infrastructure (myNewsDesk, 2019). Arla Foods had to find solutions for these limitations, since 70% of the target customers are residing in the rural and remote areas of Bangladesh (myNewsDesk, 2019). To deal with these challenges, Arla Foods employed 200 local women also known as the Pushti-ambassadors. These ambassadors are responsible for delivering the product, while simultaneously educating people about health and milk nutrition (myNewsDesk, 2019). This example illustrates that Dano Pushti is not only produced to make a profit, but also to solve nutritional issues in the rural areas of Bangladesh.
The principle that firms should not only look at profits, but also have to consider their impact on society, is at the essence of corporate social responsibility (hereafter CSR). To be more precise, CSR can be defined as “the responsibility of enterprises for their impacts on society” (European Commission, 2011, p. 6). Literature indicates that CSR is not only a concept that is proposed by academics, but is demanded by society as well (Bernstein, 2000, as cited in Carroll & Shabana, 2010). Adding to that, the public believes that profits should be sacrificed in order to enable firms to improve the situation of disadvantaged stakeholders (Bernstein, 2000, as cited in Carroll & Shabana, 2010).
But why should or should not firms create, implement and execute CSR activities? Friedman argued that it is not the responsibility of the firm to be concerned about social issues (Carroll & Shabana, 2010). He believed that legislation and governments have to take responsibility for solving social issues. Another argument against CSR, is that firms will make themselves less competitive globally (Carroll & Shabana, 2010). Literature also established numerous motivations in favour of CSR among which that it strongly influences firm’s reputation (Vilanova, Lozano, & Arenas, 2009), it increases the price of products (Trudel & Cotte, 2009), and it decreases the production costs (Sprinkle & Maines, 2010). Adding to that, Bhattacharya and Sen (2004, p. 9) stated that “not only doing good is the right thing to do, but it also leads to doing better”. Implementing CSR within the corporate strategy can thus be beneficial for both society and firms. In order to create CSR activities which are in line with corporate strategy, firms formulate CSR strategies. CSR strategy can be defined as the long-term direction of the responsibilities of enterprises regarding their impact on society. Although literature indicates that pursuing CSR activities could have positive implications for firms, firms encounter difficulties by integrating CSR activities into their overall corporate strategy (Vilanova et al., 2009). McWilliams & Siegel (2001) explain these integration issues, by the unclear relationship between CSR and firm’s financial performance. Solving the implementation issues could reduce the misalignment between CSR activities and overall corporate strategy. As a result, alignment between CSR activities and overall corporate strategy could lead to greater impact of these CSR activities on firm’s results (Marín, Rubio, & de Maya, 2012). To optimise the effect of CSR strategies, this study explores how CSR strategies could be influenced. To be more precise, this study focuses on the relationship between firm characteristics and CSR strategy. Firm characteristics are selected as explaining variable, since literature indicates that for example firm size (Graafland, Van de Ven, & Stoffele, 2003) and ownership (Dam & Scholtens, 2013) explain differences in firm’s CSR strategy. Even though a vast amount of literature is already existing on the relationship between firm characteristics and CSR, specific studies for the European dairy industry were not identified. Besides the lack of industry specific research, the dairy industry is more interesting than other industries due to the high percentage of cooperatives (EDA, 2017), which might lead to interesting results.
In order to assess firm’s CSR strategy, one could use different types of sources such as corporate reports, interviews and news articles. This study used corporate reports to obtain firm’s CSR strategy, since these reports are a fruitful source of information (Lu & Abeysekera, 2014). In order to

8
make CSR tangible and measurable, literature on CSR disclosure was employed. CSR disclosure is defined as the process of providing information designed to discharge social accountability via annual reports, special publications or reports or even socially oriented advertising. This study reasons that, by investigating corporate reports, the CSR strategy of the firms could be obtained. Even though this study is aware of a gap between CSR disclosure and CSR strategy, one could argue that differences have become smaller in recent years due to higher levels of scrutinization by society. Literature on CSR disclosure revealed that the legitimacy and stakeholder theory are commonly used to explain firm’s motivations to participate in CSR (Tagesson, Blank, Broberg, & Collin, 2009). Therefore, these theories were used as a theoretical foundation to select the firm characteristics. The three firm characteristics selected for this study, are firm size, corporate governance, and ownership. By conducting this research, this study aims to reveal whether firm characteristics are related to CSR strategy in the context of the European dairy industry.
This report is structured as follows: a description of the European dairy industry is presented in chapter 2, while the literature on CSR, CSR disclosure, and the firm characteristics is reviewed in chapter 3. The research design, data collection and data analysis methods are presented in chapter 4, followed by the results in chapter 5. The results are presented in chapter 6, as well as the limitations of this study. Lastly, conclusions and recommendations for future research are presented in chapter 7.
1.2 Research questions
The objective of this research is to broaden the understanding of the relationship between firm characteristics and corporate social responsibility strategies of European dairy firms. In order to accomplish this, the following central research question is formulated:
What is the influence of firm characteristics on corporate social responsibility strategy of European dairy firms?
In order to answer the central research question, sub-questions are formulated. The sub questions are structured in two parts, including a theoretical part and an empirical part. This study answers the following research questions: Theoretical sub research questions
- What is a corporate social responsibility strategy? - What is corporate social responsibility disclosure? - Which firm characteristics can influence corporate social responsibility strategy?
Empirical sub research questions
- What is the influence of firm size on the corporate social responsibility strategy of European dairy firms?
- What is the influence of corporate governance on the corporate social responsibility strategy of European dairy companies?
- What is the influence of ownership on the corporate social responsibility strategy of European dairy firms?

9
2. European dairy industry This chapter presents an overview of the European dairy industry. An overview is necessary, to fully understand and recognize the dynamics of this industry. Statements made in this chapter, should be seen as a framework in which all dairy firms have to act.
The European dairy industry is a major contributor to the European trade balance as more than 10-billion-euro surplus is created by more than 12,000 dairy processing firms (EDA, 2018). Therefore the dairy industry can be seen as the economic backbone of rural Europe (EDA, 2018). This is demonstrated in Table 1, in which 20 global dairy firms are ranked according to their turnover. The 10 European dairy firms are highlighted in this table. Table 1. Global dairy industry 2017
Company name Country Legal Form Turnover dairy products (in billion €)
Milk intake (in billion kg)
Added Value (in euro/kg milk intake)
Nestlé Switzerland Private 21.4 13.7 1.56 Lactalis France Private 17.7 19.6 0.90 Danone France Private 15.5 8.6 1.43 Dairy Farmers of America USA Cooperative 13.0 29.2 0.45 Fonterra New Zeeland Cooperative 13.0 29.2 0.51 Friesland-Campina Netherlands Cooperative 12.0 13.6 0.88 Arla Foods Denmark Cooperative 10.3 13.9 0.74 Saputo Canada Private 9.6 9.8 0.98 Yili China Private 8.8 7.2 1.22 Mengniu China Private 7.8 6.4 1.22 Dean Foods USA Private 6.7 9.4 0.71 Unilever Netherlands Private 6.2 (est) n.a. n.a. DMK Germany Cooperative 5.8 8.1 0.72 Kraft Heinz United States
of America Private 5.5 n.a. n.a.
Meiji Japan Private 5.1 n.a. n.a. Sodiaal France Cooperative 5.1 4.9 1.04 Savencia France Private 4.9 4.1 1.20 Müller Germany Private 4.5 (est) 4.6 0.98 Agropur Canada Cooperative 4.5 6.3 0.71 Schreiber Foods USA Private 4.4 4.5 0.98
Source: adapted from Bijman and Hanisch (2018, p. 16)
At the European dairy farms, a total of 168.3 million tonnes of milk is produced of which the majority of 163 million ton is cow milk (Eurostat, 2017). The produced milk originates from ewes (2.8 million tonnes), goats (2.3 million tonnes) and buffalos (0.3 million tonnes) (Eurostat, 2017). The European milk production constitutes more than twenty per cent of the total global milk production, as 170.1 million tonnes (Eurostat, 2017) of milk were produced in Europe of the globally produced 811.9 million tonnes of milk in 2016 (Food and Agricultural Organization, 2017). In order to process all the raw milk, the dairy industry employs more than 300,000 people across Europe (EDA, 2018). A small amount of the milk is used for on-farm purposes and the majority of the produced milk is transported to dairy processing firms who use it to create products for consumption such as drinking milk, cheese, whey, butter and milk powder (Eurostat, 2017). In terms of exports, 18.74 of the 69.39 million tonnes of traded dairy products, were produced in Europe. (EDA, 2018). By exporting these products, the dairy industry employs another 45,000 people (Rabobank, 2016). The main export markets for the European dairy industry are China, Mexica and Russia with respectively 7.5, 4.3 and 4.1 million tonnes of exported dairy products (Rabobank, 2016).
10
In order to regulate the European agricultural sector, the Common Agricultural Policy (hereafter CAP) was introduced in 1962. To provide European citizens with affordable food, and to create a fair living standard for the farmers by the means of guaranteed minimum prices (European Commission, 2012). With a guaranteed price for their products, European farmers’ income increased which enabled them to switch from manual production to more sophisticated production techniques. In the seventies, the guaranteed prices eventually led to a milk surplus (European Commission, 2012). In order to reconnected farmers’ production and market demand, and to prevent overproduction, quotas on the milk production were imposed in 1984 (European Commission, 2012). Regulation changed even more in 1992, when the European Commission decided to switch from market to producer support. (European Commission, 2012). As a consequence, price support was replaced by direct payments. These changes were necessary in order to transform the CAP into a market-oriented policy. The milk quota resulted in a gradual decreasing gap between the European and world milk market price. Eventually, the milk quota was abolished in 2015. As a result of the abolishment together with the Russia import embargo, decline in Chinese demand for milk and increase in world milk production, surpluses of milk were created across Europe (Bijman & Hanisch, 2018).
As a consequence of the changes in the CAP, milk prices have become more volatile. Volatility in milk prices especially increased after the adjustment of the intervention prices in 2003 (European Commission, 2017). To illustrate, in the year 2007 the volatility of the milk prices reached 15% whereas an average of 4% volatility was common in the pre-2007 era (European Commission, 2017). Furthermore, prices in the dairy industry have lost their previous seasonal pattern (European Commission, 2017). Comparing the European dairy industry with those of Oceania and the US, it can be observed that the pattern of the volatility follows the same path on a global scale. However, the volatility of the European prices is less pronounced, more smooth and lower compared to Oceania and the US (European Commission, 2017). The increasing volatility can be explained by the continuous reforms of the CAP on the one hand and increasing dependency of European dairy firms on global demand on the other hand (Bijman & Hanisch, 2018).
Besides changes regarding the milk quota, dairy firms have to consider changes in environmental regulation. Because changes in environmental regulations could influence the firm’s strategic decisions. The European Commission (2000) concluded that the European dairy industry mainly impacts the soil, water, biodiversity and non-renewable resources, as these become depleted due to intensification and overuse. To illustrate, dairy cows produce twenty per cent of the yearly methane and are therefore partly responsible for the increasing greenhouse gas emissions (Bijman & Hanisch, 2018). In order to reduce the environmental impact of the European dairy industry, national governments and the European Commission are introducing environmental legislation. For instance, to tackle the increasing levels of nitrate, the European Commission implemented the Nitrates Directive in 1991. In order to achieve this goal, targets and restrictions have been imposed on dairy farmers and Member States have been obliged to report back their progress every four years (European Commission, 2018). As the concerns regarding the environment are increasing, it is expected that regulation to prevent further degradation will become stricter (Bijman & Hanisch, 2018). Not only regulation could be a key driver to reduce the firm’s environmental impact. Sometimes it is a collaboration between multiple stakeholders in society. This can be a collaboration between firms or between firms and governmental agencies, or other stakeholders in society. The Clean and Efficient Agricultural Sectors Covenant is such a collaboration between the Dutch government and agricultural firms, to increase energy efficiency and reduce their greenhouse gas emissions (Ministerie van Landbouw Natuur en Voedselkwaliteit, 2008).
Firms are not only challenged by the threat of stricter regulations, but also stimulated by the ongoing changes in consumer preferences. Whereas products were previously differentiated in a traditional way, in which size and colour are common examples, nowadays other factors have become more important (Saitone & Sexton, 2017). Production location and environmental implications of the production are examples of new differentiating characteristics (Saitone & Sexton, 2017). These characteristics were already existing but have become more prominent differentiation determinants in recent years due to income growth (Saitone & Sexton, 2017) and increasing consumer’ awareness
11
about environmental issues (Loureiro, McCluskey, & Mittelhammer, 2001). These two changes have led to the emergence of a new product category namely, organic food products. Organic food products differ from conventional food products as they limit the use of chemical pesticides and antibiotics and prohibit synthetic fertilizers (European Parliament, 2018). The popularity of organic food products is also growing over the recent years, due to consumers’ concerns about conventional food (Van Loo, Diem, Pieniak, & Verbeke, 2013). Consumers believe that organic food products are both healthier and safer compared to conventional food products. As a results, the organic food sector is the third largest food sector in the European Union (Van Loo et al., 2013).
Changes in regulation and consumer demand, may affect firm’s overall and CSR strategy. For example, the creation of organic food products can be seen as firms’ reactions on changing consumer demand. As stated at the beginning of this chapter, the dynamics of the firm’s environment should be considered to better understand decisions made by managers of European dairy firms. The upcoming chapter elaborates on CSR and the definitional construct of this concept. Furthermore, it elaborates on the CSR disclosure and which firm characteristics are selected for this study.
12
3. Literature Review This chapter reviewed the literature on the definition of CSR, CSR strategy, and CSR disclosure. To be more precise, section 3.1 presents literature on the construction of a CSR definition and elaborates on CSR strategies. Section 3.2 deepens our understanding of firms’ motivations to disclose information on CSR. This is accomplished by explaining and employing legitimacy and stakeholder theory. The theories were used for selecting the three firm characteristics, which is presented in section 3.3. To deal with the three firm characteristics section 3.3 is divided into three subsections, namely firm size (section 3.3.1), corporate governance (section 3.3.2) and ownership (3.3.3).
3.1 Corporate social responsibility strategy
The concept of corporate social responsibility (hereafter CSR) began to emerge in the early fifties of the previous century (Carroll, 1999). Literature found that managers are more dedicated in devoting resources to CSR activities, as this is demanded by multiple stakeholder groups (McWilliams & Siegel, 2001). Adding to that, the European Commission (2008) stated that CSR can be a key determinant in achieving sustainable development and enhancing firm’s innovativeness and competitiveness simultaneously. Therefore, CSR has become a central issue on the agenda of firms across the globe (Perrini, Russo, & Tencati, 2007; Vilanova et al., 2009). Although this might be the case, businesses encounter difficulties by integrating the CSR activities into their overall corporate strategy (Vilanova et al., 2009). In order to understand the CSR and its implications from a business perspective, this section deals with the ongoing discussion regarding the definitional construct of CSR. To properly define CSR, one must understand the origin of the complexity. The remainder of this section elaborates these difficulties in detail to create understanding of the complexity of defining CSR, before defining CSR itself. Sheehy (2014) identified multiple problems which arise when one is defining CSR which will be elaborated in detail. These difficulties include; the multifaceted nature of CSR, ambiguity of issues under consideration and the distinct agendas of the involved actors.
Firstly, CSR is difficult to define due to its multifaceted nature. This implies that CSR is involved in a dynamic and complex system such as the ecological, societal and economic system (Sheehy, 2014). To clarify, the wide variety of systems in which CSR is involved makes it challenging to honour sufficient attention to each system, without excluding systems or imposing contradictions between those systems.
Secondly, CSR is complex due to the inherent ambiguity of the issues under considerations (Sheehy, 2014). Sheehy (2014), identified three layers to explain this ambiguity, by using an example of the working conditions in developing countries. The first layer is identified as the ambiguity regarding the harms that need to be addressed, and regarding whose views should be applied on these harms (Sheehy, 2014). One could raise the questions “Should working conditions be accounted for?” and “Who should set the standards for these conditions?”. The second layer of complexity arises when one aims to solve the issue to what extent issues should be addressed (Sheehy, 2014). Sheehy raises the question, “Should all working conditions be accounted for or only include those which are formulated by the International Labour Organisation?”. The last layer of complexity is about the responsibility of these harms (Sheehy, 2014). In line with his example, the following question could be asked: “Does this responsibility lie solely with producers of the developed countries or with the subcontractors in the developing countries?”. Responsibility is a complex discussion within the CSR debate due to the multiple locations, concerns, authorities, societies and political agendas involved (Sheehy, 2014).
Thirdly, constructing a CSR definition is hampered by the different agendas of actors who are engaged in CSR. Sheehy (2014) identified four actors; businesses, academics, political movements and governments, which are trying to define CSR but hamper this process due to their own agenda. Firstly, firms create specific cases of CSR related to their organization, in order to claim they are representing a socially responsible organisation (Sheehy, 2014). As a result of this claim, firms’ actions must be socially responsible. Firms establish themselves as socially responsible, without these actions being tested for their socially responsible nature. The academics on their turn try to reflect their disciplinary
13
perspectives and priorities, within the definitional construct of CSR. Adding to that, academics try to propose new descriptive definitions (Sheehy, 2014). However, these definitions fail to identify the nature of CSR (Sheehy, 2014). Defining CSR is also hampered by the ongoing battle between political movements. Politicians debate on several themes among which the public-private divide, the role of the government and the place of private enterprise or markets (Sheehy, 2014). Again, the battle between different movements complicates the construction of a CSR definition. Lastly, governments employ CSR as a cheaper alternative to address and solve social and environmental issues in society (Sheehy, 2014). Therefore, governments need a CSR definition which is acceptable to business and motivates behavioural change to achieve the desired results. These four actors illustrate that they all have their own distinct agenda when it comes down to formulating a CSR definition. According to Sheehy (2014, p. 627) “to find or develop a definition which is not focused on one or a few of these factors, issues, actors or solutions is a challenge”. Although constructing a definition is challenging, multiple academics tried to define CSR. The upcoming part elaborates briefly on the present research constructing a CSR definition and its evolution in time.
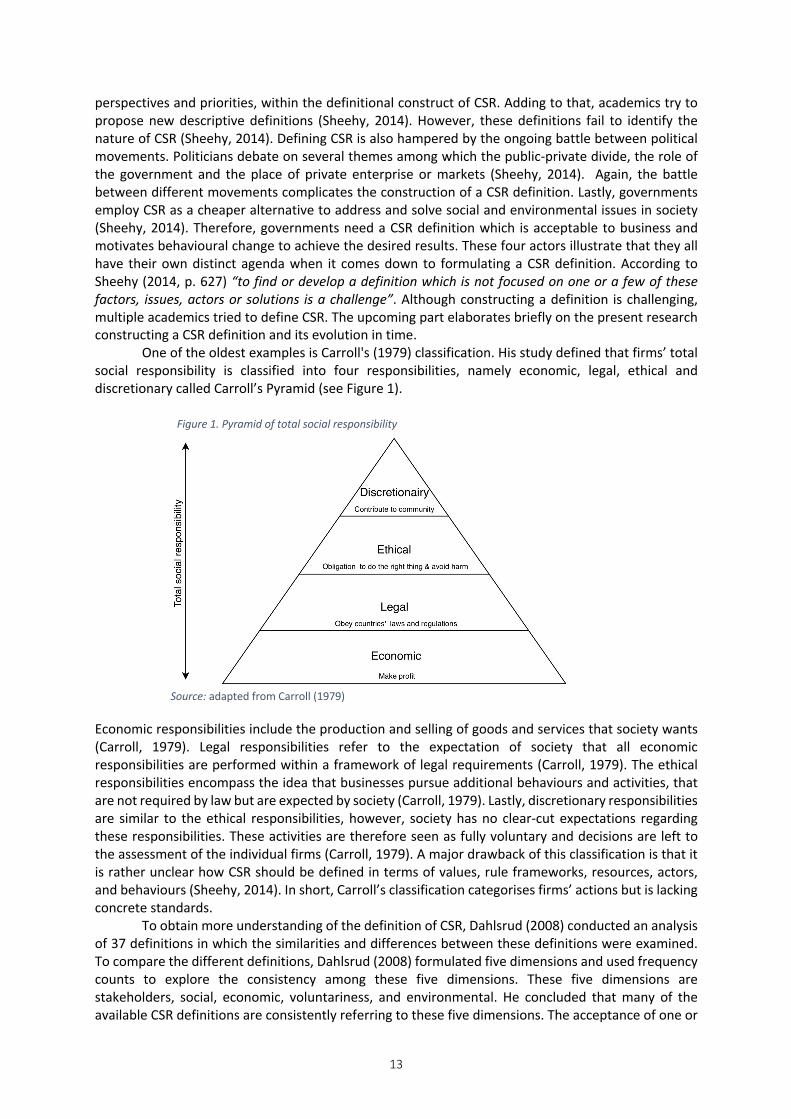
One of the oldest examples is Carroll's (1979) classification. His study defined that firms’ total social responsibility is classified into four responsibilities, namely economic, legal, ethical and discretionary called Carroll’s Pyramid (see Figure 1).
Economic responsibilities include the production and selling of goods and services that society wants (Carroll, 1979). Legal responsibilities refer to the expectation of society that all economic responsibilities are performed within a framework of legal requirements (Carroll, 1979). The ethical responsibilities encompass the idea that businesses pursue additional behaviours and activities, that are not required by law but are expected by society (Carroll, 1979). Lastly, discretionary responsibilities are similar to the ethical responsibilities, however, society has no clear-cut expectations regarding these responsibilities. These activities are therefore seen as fully voluntary and decisions are left to the assessment of the individual firms (Carroll, 1979). A major drawback of this classification is that it is rather unclear how CSR should be defined in terms of values, rule frameworks, resources, actors, and behaviours (Sheehy, 2014). In short, Carroll’s classification categorises firms’ actions but is lacking concrete standards. To obtain more understanding of the definition of CSR, Dahlsrud (2008) conducted an analysis of 37 definitions in which the similarities and differences between these definitions were examined. To compare the different definitions, Dahlsrud (2008) formulated five dimensions and used frequency counts to explore the consistency among these five dimensions. These five dimensions are stakeholders, social, economic, voluntariness, and environmental. He concluded that many of the available CSR definitions are consistently referring to these five dimensions. The acceptance of one or
Figure 1. Pyramid of total social responsibility
Source: adapted from Carroll (1979)
14
a multitude of these dimensions is still troublesome, due to the divers interests of different stakeholders. According to Dahlsrud (2008), the biggest challenge is not to define CSR, but to understand how it is constructed in a context and while incorporating this knowledge into a business strategy. In this line of reasoning, Dahlsrud did not propose a new definition like many scholars are aiming for. To elaborate, a general definition of CSR is not desirable according to Dahlsrud because of the differences between for example countries and firms. To illustrate with Sheehy’s example, it is comprehensible that US firms incorporate labour rights into their CSR strategy. However, it would be remarkable for European firms as these rights are often determined by law. For firms, similar comparisons could be made. For example, the clothing industry emphasizes the improvement of working conditions of labourers in developing countries via initiatives like the Dutch Agreement on Sustainable Garment and Textile (SER, 2019). However, the dairy industry’s main impact on society is its environmental impact due to the production of milk (European Commission, 2000). Furthermore, this example is in line with Sheehy’s first and third implication as both clothing and dairy industry pursue different agendas. One could argue that dairy firms must highlight their efforts to reduce their environmental impact of milk production.
Although Dahlsrud contributed to the knowledge on the definitional construct of CSR, Dahlsrud’s study is limited in two ways. Firstly, the five dimensions identified by Dahlsrud are not tested for their validity (Carroll & Shabana, 2010). Furthermore, Dahlsrud’s study was criticized for the limited time period, namely 1980-2003. Due to the selection of this time frame, it underestimates the true number of definitions (Carroll & Shabana, 2010). As a consequence, Dahlsrud’s study did not include essential definitions constructed by academics outside this time period (Sarkar & Searcy, 2016). Furthermore, previous studies were limited by the use of qualitative analysis. This resulted in subjective results and made it challenging to replicate these studies (Sarkar & Searcy, 2016). To overcome these problems, Sarkar and Searcy (2016) used bibliometric techniques and expanded the time frame to 1953-2014. In their study, they tried to reveal the key dimensions of the CSR and the relationships of these dimension within the CSR definitions. In total 110 definitions, which were obtained via different sources like books, journals and non-academic publications, were analysed. By analysing these definitions, they found six core dimensions of which CSR consists of; economic, ethical, social, stakeholders, sustainability and discretionary (Sarkar & Searcy, 2016). Based on these six core dimensions, they proposed the following definition of CSR;
“CSR implies that firms must foremost assume their core economic responsibility and voluntarily go
beyond legal minimums so that they are ethical in all of their activities and that they take into account the impact of their actions on stakeholders in society, while simultaneously contributing to
global sustainability” (Sarkar & Searcy, 2016, p. 1433) Sarkar and Searcy's conclusions differ from the conclusion drawn by Dahlsrud, as they found that the ethical component is a distinct concern in the CSR debate. This corresponds to Carroll’s definition, as the third was the ethical responsibility. Sarkar and Searcy (2016) concluded therefore that it is essential to incorporate the ethical considerations into a CSR definition since CSR requires firms to behave open, fair and moral. Furthermore, Dahlsrud’s view fundamentally differs from Sarkar and Searcy, as the latter considered it necessary to construct a general definition for CSR, while the opposite holds for Dahlsrud. The difference between these visions also illustrate the problem formulated by Sheehy, in which scholars formulate CSR according to their perspective and agenda. One could conclude that, although academics and scholars try to formulate a unifying description of CSR, they have failed to do so (Sheehy, 2014). This is reinforced by Dahlsrud (2008), as he was unable to develop an unbiased definition since CSR is a social construct. Adding to that, Sarkar and Searcy (2016) stated that the lack of consensus around the definition of CSR has resulted in multiple implications regarding the development, implementation and reporting of social activities. Instead of looking at general CSR definitions, this study tried to reveal whether industry specific literature could give more guidance on defining CSR. This might be the case as the dairy industry might focus on specific areas in their CSR strategy, like environment, as these areas are impacting society
15
greatly. Maloni and Brown (2006) constructed a framework in which CSR elements of the food supply chain are addressed. They constructed a new framework because they stated that different supply chains have to deal with unique CSR dimensions (Maloni & Brown, 2006). By conducting a review on both industry and academic literature, Maloni and Brown (2006) found the following dimensions are occurring in the food supply chain:
- Animal welfare - Biotechnology - Health and safety - Environment - Community - Labour and Human Rights - Fair trade - Procurement
Although these dimensions clarify to a certain extend what CSR encompasses in the food supply chain, it is hard to extrapolate these to all different firms within the food supply chain. The food supply chain encompasses a wide variety of other industries, among which the dairy industry, which is investigate in this study, is one. Since the CSR dimensions are industry-specific, one could argue that the dimensions constructed by Maloni and Brown (2006) are not suitable for the dairy industry. To illustrate, one could reason that animal welfare is more dominating the debate in dairy firms than in fast-mover-consumer-good firms as the former are closer located to the animals. In order to construct a CSR definition specifically for the dairy industry, literature regarding CSR and the dairy industry was consulted. However, current literature could not give any clear direction of specific CSR issues within the context of the dairy industry. As a consequence, it is difficult to formulate CSR definition specifically for the dairy industry.
Taking these arguments together, one could argue whether constructing a CSR definition is necessary at all. As Sheehy (2014) indicated before, CSR itself has a dynamic nature implying that the content of CSR is changing continuously. This is caused by the changing demands and expectations of the economic, environmental and social systems. Therefore, to ensure the relevance of possible CSR definitions, definitions should be dynamic instead of static. However, one could question whether academics and other stakeholders could reach consensus fast enough in order to be relevant and prevent the definition from becoming outdated.
In sum, one could argue that constructing a universally accepted CSR definition is unreachable or even undesirable. It might be more suitable to construct guidelines which indicate the domain of CSR, while allowing industries to formulate their own CSR definitions. In this line of reasoning, this study defines CSR in its broadest way as “the responsibility of enterprises for their impacts on society” (European Commission, 2011, p. 6). A definition is selected to provide this study with guidance on concept of CSR. Relating the definition to the strategy of a firm, CSR strategy in this study is defined as long-term direction of firm’s responsibilities regarding their impact on society. The upcoming section elaborates specifically on CSR disclosure, and how this is related to CSR strategy. Furthermore, it presents two theories which serve as theoretical foundation to select the firm characteristics.
3.2 Corporate social responsibility disclosure
This section presents an overview of the current state of knowledge on the relationship between various determinants and CSR disclosure. CSR disclosure literature was included specifically, since it offers the possibilities to measure CSR strategy. Even though there is a gap between CSR disclosure and CSR strategy, one could argue that differences have become smaller in recent years due to higher levels of scrutiny by society. It is assumed that levels of scrutiny have become higher, especially for firms producing nutritional products, due to scandals like the 2008 baby formula scandal in China and the 2013 horse meat scandal in Europe. To illustrate, Starbuck disclosed several CSR claims, but NGOs were suspicious whether Starbuck actually executed these claims. As a consequence, NGOs started
16
protest efforts against Starbucks causing reputational damages (Maloni & Brown, 2006). To put it differently, disclosing CSR activities while not performing these activities could cause a so-called backfire effect and eventually lead to reputational damages.
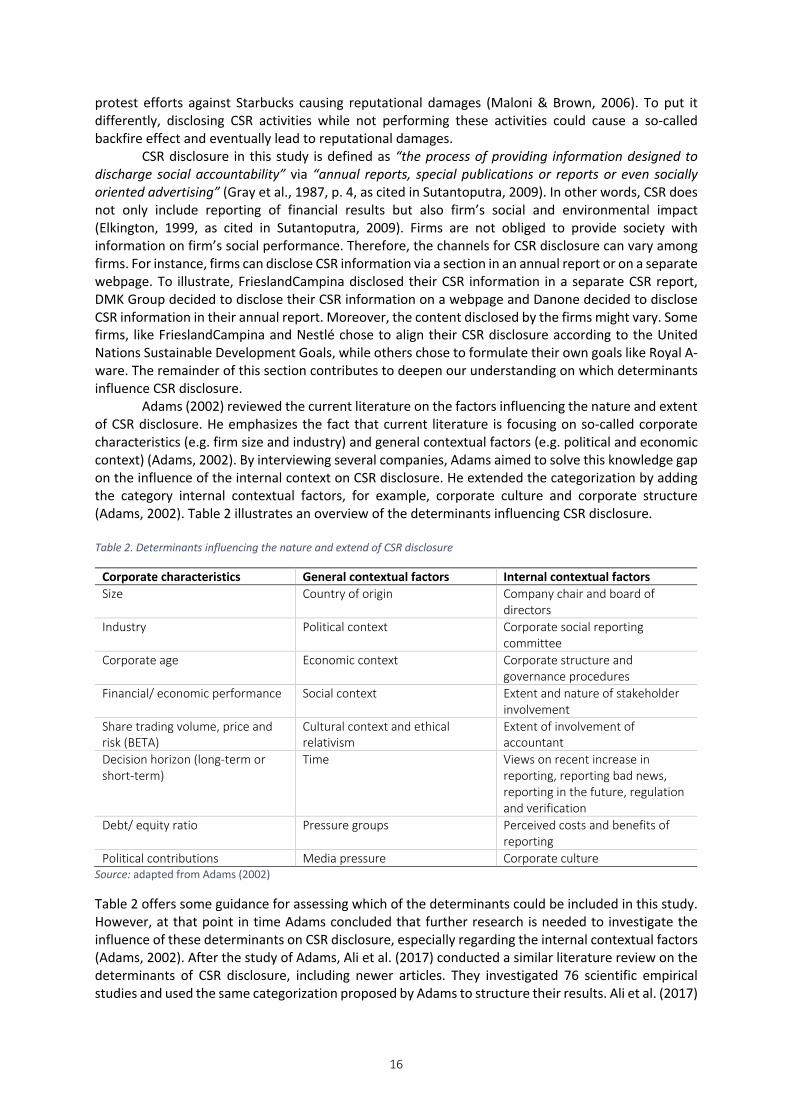
CSR disclosure in this study is defined as “the process of providing information designed to discharge social accountability” via “annual reports, special publications or reports or even socially oriented advertising” (Gray et al., 1987, p. 4, as cited in Sutantoputra, 2009). In other words, CSR does not only include reporting of financial results but also firm’s social and environmental impact (Elkington, 1999, as cited in Sutantoputra, 2009). Firms are not obliged to provide society with information on firm’s social performance. Therefore, the channels for CSR disclosure can vary among firms. For instance, firms can disclose CSR information via a section in an annual report or on a separate webpage. To illustrate, FrieslandCampina disclosed their CSR information in a separate CSR report, DMK Group decided to disclose their CSR information on a webpage and Danone decided to disclose CSR information in their annual report. Moreover, the content disclosed by the firms might vary. Some firms, like FrieslandCampina and Nestlé chose to align their CSR disclosure according to the United Nations Sustainable Development Goals, while others chose to formulate their own goals like Royal A-ware. The remainder of this section contributes to deepen our understanding on which determinants influence CSR disclosure. Adams (2002) reviewed the current literature on the factors influencing the nature and extent of CSR disclosure. He emphasizes the fact that current literature is focusing on so-called corporate characteristics (e.g. firm size and industry) and general contextual factors (e.g. political and economic context) (Adams, 2002). By interviewing several companies, Adams aimed to solve this knowledge gap on the influence of the internal context on CSR disclosure. He extended the categorization by adding the category internal contextual factors, for example, corporate culture and corporate structure (Adams, 2002). Table 2 illustrates an overview of the determinants influencing CSR disclosure. Table 2. Determinants influencing the nature and extend of CSR disclosure
Corporate characteristics General contextual factors Internal contextual factors Size Country of origin Company chair and board of
directors Industry Political context Corporate social reporting
committee Corporate age Economic context Corporate structure and
governance procedures Financial/ economic performance Social context Extent and nature of stakeholder
involvement Share trading volume, price and risk (BETA)
Cultural context and ethical relativism
Extent of involvement of accountant
Decision horizon (long-term or short-term)
Time Views on recent increase in reporting, reporting bad news, reporting in the future, regulation and verification
Debt/ equity ratio Pressure groups Perceived costs and benefits of reporting
Political contributions Media pressure Corporate culture Source: adapted from Adams (2002)
Table 2 offers some guidance for assessing which of the determinants could be included in this study. However, at that point in time Adams concluded that further research is needed to investigate the influence of these determinants on CSR disclosure, especially regarding the internal contextual factors (Adams, 2002). After the study of Adams, Ali et al. (2017) conducted a similar literature review on the determinants of CSR disclosure, including newer articles. They investigated 76 scientific empirical studies and used the same categorization proposed by Adams to structure their results. Ali et al. (2017)

17
also tried to present the differences between developed and developing countries. In the scope of this study, namely European dairy firms, only the results of the developed countries are included. Ali et al. (2017) found that two corporate characteristics are most frequently examined and consistent in results, namely firm size and industry sector. They state that the relationship between firm size and industry and CSR disclosure are strong and significant. Current literature also established a strong relationship between industry and CSR disclosure (Ali et al., 2017). The determinant financial performance and systematic risk characteristics were investigated numerous times, however, these relationships were rather unclear in terms of significance and direction. Furthermore, Ali et al. (2017) investigated literature on the general contextual factors. They found that national context can explain the differences between firms in both the CSR practices and disclosure. The included studies found significant differences in CSR disclosure between the US and European countries, as well as between European countries. Lastly, as was the case during Adams’ literature review, little attention has been paid to the internal contextual factors and their influence on CSR disclosure (Ali et al., 2017). Most studies included in Ali’s analysis, were conducted to reveal executives’ attitude towards CSR disclosure, which was overall positive. The same positive relationship holds between corporate governance and CSR disclosure. Ali et al. (2017) summarized that the included studies explained this positive relationship by the gain of competitive advantage or, enhanced corporate reputation. Summarizing, most of the literature paid attention to firm size, industry sector, profitability, and corporate governance mechanisms and their influence on CSR disclosure (Ali et al., 2017).
Although the study of Adams (2002) and Ali et al. (2017) summarizes numerous determinants of CSR disclosure, it lacks a theoretical foundation upon which determinants could be selected. In order to select the most relevant determinants, this study took a step back and ask the following question “What is the theoretical foundation for selecting proper firm characteristics?”. In other words, what is the rationale behind disclosing CSR at all. Reviewing the literature, it became clear that two theories were predominantly occurring to explain why firms would disclose CSR (Chan, Watson, & Woodliff, 2014; Tagesson et al., 2009). These two theories are the legitimacy and stakeholder theory. In order to reduce the number of determinants, this study could choose for selecting the legitimacy or stakeholder theory. However, according to Ljungdahl (as cited in Tagesson et al., 2009), these theories should be seen as complementary and not substitutes. Firms are incentivized to disclose CSR related information for multiple reasons which are hard to capture in one theory (Cormier, Magnan, & Van Velthoven, 2005). Moreover, selecting one theory would be problematic since “a comprehensive theoretical framework of the underlying determinants of corporate environmental disclosure is still elusive” (Cormier, Magnan, and Van Velthoven, 2005, p. 6). According to Cormier et al. (2005), one single theory captures CSR disclosure insufficiently since CSR disclosure is not systematic but dynamic, not associated with same-period profitability, related to firm size, subjected to industry-specific effects and subjected to country-specific effects. Tagesson et al. (2009) explained the success of these two theories specifically as a consequence of their system-oriented approach compared to other theories which are more market-oriented. Furthermore, both the legitimacy and stakeholder theory can be considered as more comprehensive theories due to their recognition of the dynamic environment in which organizations evolve (Cormier et al., 2005). To wrap up, from literature one could conclude that current literature did not reach consensus on a universally accepted theoretical framework to explain CSR disclosure, however, researcher did reached consensus on the fact that these theories should be seen as complementary rather than substitutes (Chan et al., 2014). Therefore, this study uses a combination of both the legitimacy and stakeholder theory as a theoretical foundation in order to select the determinants of CSR.
The legitimacy theory is founded on the principle that companies act in a certain way, to legitimize their behaviour to stakeholders formalized via social contracts (Branco & Rodrigues, 2006). The existence of firms is based on the fulfilment of society’s expectations on how firms should conduct their operations (Branco & Rodrigues, 2006). Specifically applied to the case of CSR, firms disclose CSR information to present their socially responsible image and to obtain legitimacy from society (Branco & Rodrigues, 2006). Firms’ legitimacy is not static, but rather dynamic due to the changing expectations of society (Montecchia, Giordano, & Grieco, 2016). As a consequence, firms can lose legitimacy when
18
they are unable to fulfil societies’ dynamic expectations. This can lead to a legitimacy gap, followed by a violation of the social contract and ultimately a loss of legitimacy (Sethi, 1979 as cited in Montecchia et al., 2016). Firms can mitigate the risk of legitimacy loss by aligning their actions with societies’ expectations. Society is possibly informed by firms’ actions via CSR disclosure, due to which disclosing this kind of information can be seen as a strategy to prevent legitimacy loss (Dowling & Pfeffer, 1975; Gray et al., 1995; Suchman, 1995, as cited in Montecchia et al., 2016). Legitimacy loss cannot only be prevented by disclosing firm’s CSR strategy, as firms have to execute these activities due to scrutinization of society. If they decide to disclose but not to execute CSR activities, firms are still risking legitimacy loss as was illustrated at the beginning of this section. Therefore, legitimacy theory provides this study with a theoretical framework to assess the relationship between firm characteristics and CSR.
Another perspective is the stakeholder theory, which uses the perspective of the firm’s stakeholders. Stakeholders can be defined as groups who can affect or are affected by fulfilling organisations’ objectives (Russo & Perrini, 2010). Central to the concept of stakeholder theory is the interaction between firms and stakeholders (Donaldson, Preston, & Preston, 1995). Stakeholder groups are influenced by firm’s business of conduct. However, to seek approval from stakeholders, firms may adjust these decisions. For example, managers might devote more resources to CSR related activities due to the positive response of (multiple) stakeholders (Donaldson & Preston, 1995; Mitchell, Agle, & Wood, 1997 as cited in McWilliams & Siegel, 2001). More general, managers are vital for firms since they balance and meet conflicting demands of multiple stakeholders (Freeman, 1984; Ullmann, 1985, as cited in Chan et al., 2014). Besides, firms depend on external stakeholders since they provide them with resources, that gives stakeholders power over the firm and its behaviour (Chan et al., 2014). Therefore, one could argue that firms need support of all of its stakeholders to achieve long-term success (Van der Laan Smith et al., 2005, as cited in Chan et al., 2014). In order to manage firms’ stakeholders, firms might employ strategic stakeholder management which compromises that firms, in order to be effective, devote attention to those stakeholders that can affect or can be affected by achieving firm’s objectives (Freeman, 1999, as cited in Chan et al., 2014). A possible way to meet stakeholders demands is to develop firm’s reputation as “socially responsible through performing and disclosing CSR activities” (Chan et al., 2014, p. 62). Moreover, if these activities are part of a strategic plan, one could argue that stakeholder power and CSR performance or disclosure are positively related (Chan et al., 2014). Therefore, stakeholder theory provides this study with a useful theoretical framework to assess the relationship between firm characteristics and CSR.
In short one could say that the legitimacy theory entails the interaction with society as a whole, while stakeholder theory focusses on firm’s interactions with stakeholders (Deegan & Blomquist, 2006, as cited in Chan et al., 2014). These theories were used as starting point to select the determinants for this study. Based on the study conducted by Ali et al. (2017), tables were constructed which give an overview of determinants that were investigated in previous studies based on the legitimacy theory (Table 3), stakeholder theory (Table 4), or combination of both (Table 5).

19
Table 3. Determinants of CSR disclosure based on legitimacy theory
Table 4. Determinants of CSR disclosure based on stakeholder theory
Stakeholder theory Study No Authors (year) Determinants 1 Roberts (1992) Financial performance (+)*, systematic risk (-)** 2 Van der Laan Smith et al. (2005) Country (+) 3 Jo and Harjoto (2012) Governance structure (+)
Source: adapted from Ali et al. (2017). Notes: *(+): significant positive correlation OR proof of influence. ** (-): significant negative correlation or proof
Table 5. Determinants of CSR disclosure based on combination of legitimacy and stakeholder theory
Combination of legitimacy theory and stakeholder theory Study No Authors (year) Determinants 1 Gray et al. (1995) Size (+)*, political development (+) 2 Reverte (2009) Size (+), industry (+), financial performance
(o)**, media exposure (+), leverage (o) 3 Taggeson et al. (2009) Size (+), industry (+), financial performance (+),
ownership (govt vs. private) (+) Source: adapted from Ali et al. (2017). Notes: * (+): significant positive correlation OR proof of influence. ** (o): no evidence OR relationship
In order to select determinants for this study, the scope of this study should be taken into account. This study is only interested in determinants which can be identified as firm characteristics. In order to select these types of determinants, firm characteristics must be defined. A characteristic can be defined as “a typical or noticeable quality of someone or something” (Cambridge Dictionairy, 2019a). In that line of reasoning and in the context of firms, this study defined firm characteristics as typical or noticeable feature of a firm. For example, a typical or noticeable feature of a firm could be its size or the industry in which it is positioned. Therefore, determinants which were not categorised as such are
Legitimacy theory Study No Authors (year) Determinants 1 Guthrie and Parker (1989) External pressure (+)* 2 Patten (1991) Size (+), industry (+), financial performance
(o)**, public pressure proxied by size and industry (+)
3 Deegan and Gordon (1996) Size (+), industry (+), env.*** concerns proxied by membership of env. groups (+)
4 Hackston and Milne (1996) Size (+), industry (+), overseas listing (+), financial performance (o)
5 Adams et al. (1998) Size (+), industry (+), country (+) 6 Neu et al. (1998) Shareholder (+), creditors (o), management
attitude (+) 7 Deegan et al. (2002) Media attention to social issues (+) 8 Patten (2002) Size (+) 9 Wilmshurst and Frost (2002) Perceived importance of shareholders (+),
investors (+), local community (+), suppliers (+), customers (+)
10 Van Staden and Hooks (2007) - 11 O’Dwyer (2002) Industry (+), management attitude (+) 12 O’Donovan (2002) To manage public relations (+), to present
positive picture of social and environmental performance (+)
Source: adapted from Ali et al. (2017). Notes: *(+): significant positive correlation OR proof of influence. ** (o): no evidence OR relationship. *** env.: environmental
20
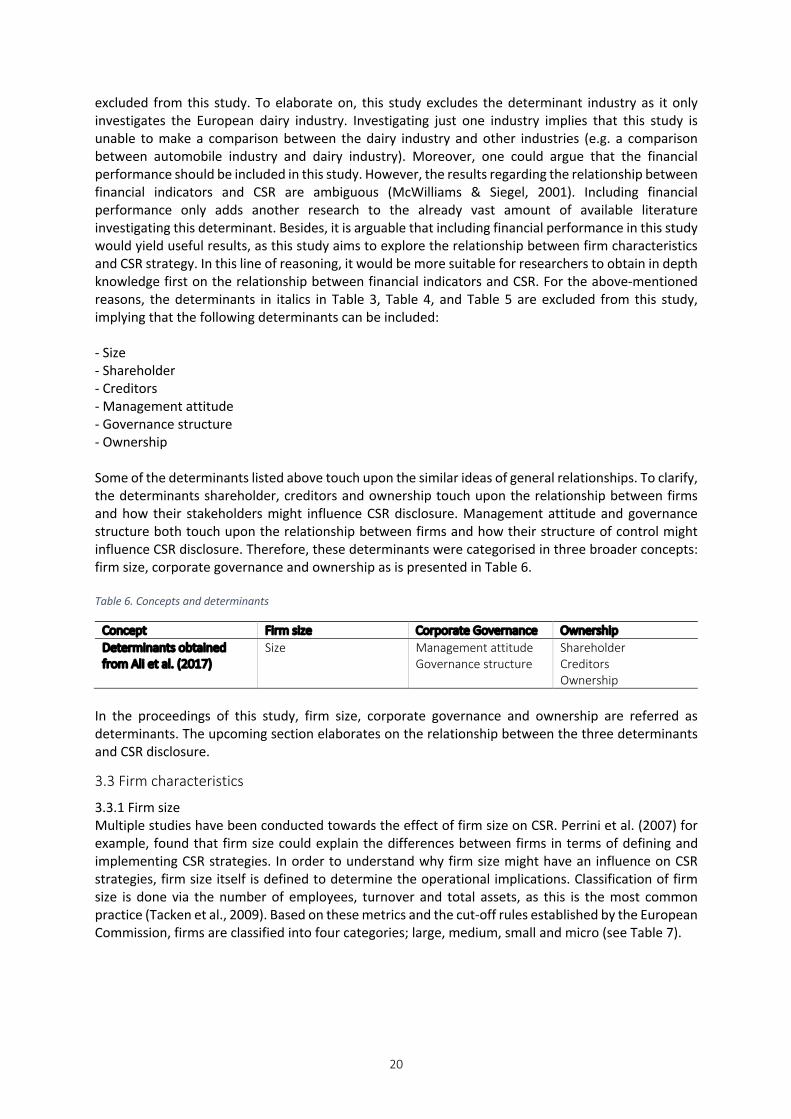
excluded from this study. To elaborate on, this study excludes the determinant industry as it only investigates the European dairy industry. Investigating just one industry implies that this study is unable to make a comparison between the dairy industry and other industries (e.g. a comparison between automobile industry and dairy industry). Moreover, one could argue that the financial performance should be included in this study. However, the results regarding the relationship between financial indicators and CSR are ambiguous (McWilliams & Siegel, 2001). Including financial performance only adds another research to the already vast amount of available literature investigating this determinant. Besides, it is arguable that including financial performance in this study would yield useful results, as this study aims to explore the relationship between firm characteristics and CSR strategy. In this line of reasoning, it would be more suitable for researchers to obtain in depth knowledge first on the relationship between financial indicators and CSR. For the above-mentioned reasons, the determinants in italics in Table 3, Table 4, and Table 5 are excluded from this study, implying that the following determinants can be included: - Size - Shareholder - Creditors - Management attitude - Governance structure - Ownership Some of the determinants listed above touch upon the similar ideas of general relationships. To clarify, the determinants shareholder, creditors and ownership touch upon the relationship between firms and how their stakeholders might influence CSR disclosure. Management attitude and governance structure both touch upon the relationship between firms and how their structure of control might influence CSR disclosure. Therefore, these determinants were categorised in three broader concepts: firm size, corporate governance and ownership as is presented in Table 6. Table 6. Concepts and determinants
Concept Firm size Corporate Governance Ownership Determinants obtained from Ali et al. (2017)
Size Management attitude Governance structure
Shareholder Creditors Ownership
In the proceedings of this study, firm size, corporate governance and ownership are referred as determinants. The upcoming section elaborates on the relationship between the three determinants and CSR disclosure.
3.3 Firm characteristics 3.3.1 Firm size Multiple studies have been conducted towards the effect of firm size on CSR. Perrini et al. (2007) for example, found that firm size could explain the differences between firms in terms of defining and implementing CSR strategies. In order to understand why firm size might have an influence on CSR strategies, firm size itself is defined to determine the operational implications. Classification of firm size is done via the number of employees, turnover and total assets, as this is the most common practice (Tacken et al., 2009). Based on these metrics and the cut-off rules established by the European Commission, firms are classified into four categories; large, medium, small and micro (see Table 7).

21
Table 7. Firm size classification
Firm size Number of employees
and Annual turnover (mil EU)
or Annual balance sheet (mil EU)
Large > 250 and > 50 or > 43 Medium 50 – 249 and 11 - 50 or 11 – 43 Small 10 -49 and 2 – 10 or 2 – 10 Micro < 10 and < 2 or < 2
Source: adapted from European Commission (2019)
Small and medium-sized enterprises (hereafter SMEs) are often characterised as organisations which are internally financed, cash-limited, multitasking, flexible, local and based on informal relationships inside and outside the firm (Marín et al., 2012). On the contrary, large enterprises are externally financed and have rigid organisational structures with formalised processes (Marín et al., 2012). Larger firms are more likely to disclose CSR information since they are more visible to the public. As a consequence, they are subject to higher levels of scrutiny from their stakeholders, compared to SMEs (Marín et al., 2012). Larger firms are more likely to be responsive with respect to environmental and community issues. They are more responsive since they can identify relevant stakeholders and meet their demands more easily (Perrini et al., 2007). Satisfying stakeholder’ demands could positively influence the firms’ competitiveness (Marín et al., 2012). Graafland, Van de Ven and Stoffele (2003) conducted a similar study in which they investigated the influence of firm size on the instruments used to foster ethical behaviour. According to Graafland et al. (2003), larger firms are more visible to the public, which makes responsible production and selling of production relatively more important for larger firms. Furthermore, both Graafland et al. (2003) and Perrini et al. (2007) argue that larger firms can use their economies of scale during the development of ethical instruments, as they are relatively small for large firms. Adding to that, larger firms are more in need to communicate their values and norms to their customers as they often operate in anonymous markets (Graafland et al., 2003). Although these results suggest that firm size is positively related to CSR, Udayasankar (2008) argues that this may be too premature to assume. Udayasankar (2008) argues that attributes should be allocated to the concept firm size, in order to properly explain the effect of firm size on CSR. She identified three dimensions of which firm size might consists of namely, firm visibility, resource access and scale of operations. To put it differently, she proposes that firm size should not be treated as a one-dimensional concept. The dimensions influence firm size each in their own way. For example regarding visibility Udayasankar (2008) stated, that even when firms are rarely visible to the public they can be equally motivated to participate in CSR. Less visible and smaller firms may gain more from participating in CSR initiatives, than highly visible and larger firms, due to a higher marginal utility of CSR for smaller firms (Udayasankar, 2008). Similar to firm’s visibility, Udayasankar (2008) reasoned that resource access can be both hampering and fostering participation in CSR initiatives. Firms which are resources-abundant and often larger, are more prone to invest in CSR because they have the resources to respond to stakeholders’ pressure (Udayasankar, 2008). On the other hand, firms which are resource-scarce and often smaller, perceive CSR initiatives as a strategic option to acquire resources at the expense of competitors (Udayasankar, 2008). Furthermore, larger scale operating firms which are often larger, are more capable of re-organizing and re-allocating resources. Therefore, larger scale operating firms are more likely to implement CSR successfully (Udayasankar, 2008). Some CSR initiatives require large scale operations in order to be socially effective and, therefore, are unattainable for smaller firms (Udayasankar, 2008). On the contrary, smaller firms cannot compete on the basis of economies of scale and, have to pursue a differentiation strategy to gain competitive advantage. CSR might be useful in obtaining a competitive advantage (Jones, 1999, as cited in Udayasankar, 2008). Medium-sized enterprises are less motivated to participate in CSR, because they are not forced by stakeholders due to their low visibility, and because they can resist pressure from stakeholders as they have resources and large scale of operations (Udayasankar, 2008).

22
Taking these arguments together, Udayasankar (2008) reasoned that both small and large firms can be motivated to participate in CSR, and therefore the relationship between firm size and CSR participation is U-shaped (Udayasankar, 2008). The study of Adams, Hill, and Roberts (1998) may indicate the existence of this U-shaped relationship as well, since super-large firms exceeding a 3 billion dollar turnover are disclosing significantly more corporate sustainability issues than their smaller competitors.
Although the Udayasankar’s study gives interesting insights on the concept firm size, it is only conceptual and empirically not validated yet. Besides, the link between firm size and CSR itself is widely recognised and accepted in literature (Brammer & Millington, 2005, as cited in Dam & Scholtens, 2013). Therefore, this study proposes that larger firms are likely to disclose more CSR information since they are facing higher public visibility. Therefore, the following proposition is formulated:
Proposition 1: larger firms disclose more CSR information
3.3.2 Corporate governance Multiple studies have been conducted to investigate whether corporate governance could influence the strategic choices of a firm. This study elaborates firstly on the definition of corporate governance, followed by explaining the differences between corporate governance systems in the dairy industry. Corporate governance can be defined as “the structure and systems of control by which managers are held accountable to those who have a legitimate stake in an organisation” (Johnson, Whittington, & Scholes, 2012, p. 82). These structures and systems can vary per country due to differences in legislation. The biggest difference between European firms in general is the use of a one- or two-tier governance structure. In the case of a one-tier governance structure, the supervisory board is included in the management board, thus control and execution are not decoupled (Kamer van Koophandel, 2019)1. In a two-tier governance structure, the supervisory board is decoupled from the management board. This is illustrated in Figure 2.
Particularly important are the differences in governance between cooperatives and private firms. Looking at the internal governance structure of a traditional cooperative, one can distinguish three entities, namely the General Assembly, the Board of Directors and the Supervisory board (Bijman, Hanisch, & van der Sangen, 2014). In the General Assembly, members of the cooperative elect the members of the Board of Directors. The directors are mandated by the members, to take the majority of the decisions (Bijman et al., 2014). The Supervisory Board monitors and controls the decisions taken by the Board of Directors. Private firms have similar governance structures, however, the General Assembly is replaced by the Shareholder Meeting. A major difference between cooperatives and private firms, is the power of members in the General Assembly, compared to the power of shareholders in the Shareholder Meeting. The General Assemblies often have a one-member-one-vote system (Bijman et al., 2014), while the power of shareholders is often determined via the percentage of holdings within of the firm. As a consequence, power and influence of the owners between private firms and cooperatives differ greatly. 1 The Dutch Chamber of Commerce
Figure 2. Corporate governance structures
23
The study of Marquis and Lee (2013), investigated the impact of organizational structure on strategies pursued by firms. In their study, they focussed on board structure in relation to corporate philanthropy. Corporate contributions are influenced by CEO tenure, director degree centrality, the board size, the percentage of women senior managers, and the percentage of women directors (Marquis & Lee, 2013). They state that shorter CEO tenure is positively and significantly associated with corporate philanthropy, as new CEOs tend to increase expenditure on philanthropy, while the opposite holds for longstanding CEOs (Marquis & Lee, 2013). Also, board size is positively, and significantly related to corporate philanthropy expenditure. A possible explanation given by Marquis, Glynn, and Davis (2007, as cited in Marquis & Lee, 2013), is that peer pressure within the organisation influences organisational strategy. It is important to mention that within larger boards, both the individual peer pressure and opportunities given by members to contribute to philanthropy are higher (Marquis & Lee, 2013). Lastly, Marquis and Lee (2013) found that the percentages of women in senior managers and board of directors, both positively and significantly influences the corporate contributions to philanthropy. This positive relation originates from the fact that women tend to contribute more to philanthropy compared to men (Marquis & Lee, 2013).
Moreover, results found by Webb (2004) indicated that socially responsible firms tend to have larger boards, more women on their boards and more independent board members. Independent board members are persons who are absent of any material conflict of interest (European Commission, 2005). Independent board members positively influence the CSR orientation, as they reduce opportunism and agency costs (Shaukat, Qiu, & Trojanowski, 2016). Independent board members are likely to be more objective and long-term focussed regarding the decision-making process (Shaukat et al., 2016). Furthermore, independent board members emphasize their external environment and legitimacy more than their insider counterparts (Shaukat et al., 2016). In other words, independent board members do not only act in the firms’ best interest, but also include the interests of stakeholders (Haniffa & Cooke, 2005).
In order to make corporate governance tangible, this study selected a number of metrics to reflect corporate governance. This study specifically focusses on the firms’ board to investigate the influence of corporate governance on CSR, as the board is the most important control mechanism of a firm (Hernández-Nicolás, Martín-Ugedo, & Mínguez-Vera, 2019). Hence, the board has the power to influence corporate strategy and thus CSR strategies. The study of Mohamed Adnan, Hay, and van Staden (2018) revealed that board size and board composition are often used metrics to express corporate governance. Board size can be defined as the number of members in the board, while board composition can be operationalised in different ways. This study chose to operationalise board composition via two metrics. Firstly, it operationalised board composition by using the percentage of female board members as this study found that there is a relationship between female representation in the board and CSR. Furthermore, some studies indicate that female representation between private firms and cooperatives might differ. To illustrate, the study of (Hernández-Nicolás et al., 2019) found that cooperatives have on average a slightly higher percentages of female board members (14%) than large firms (10%) and SMEs (8.4%) have on average (Hernández-Nicolás et al., 2019). This could indicate that, if cooperatives have a higher percentage of female board members, cooperatives disclose more information on CSR than private firms. Secondly, corporate governance is measured by using the percentage of independent board members, since literature stated that especially these board members include the perspective of the wider environment reflecting firms’ stakeholders. Based on the reviewed literature, the following propositions are formulated:
Proposition 2a: firms with larger boards disclose more CSR information
Proposition 2b: firms with a higher share of female board members disclose more CSR information
Proposition 2c: firms with a higher share of independent board members disclose more CSR
information

24
3.3.3 Ownership Graves & Waddock (1994) showed that ownership characteristics could influence CSR. To deepen our understanding of this relationship, ownership is defined as “the state of fact of owning something” (Cambridge Dictionairy, 2019b). Related to businesses, ownership is often referred to as a share or a piece of an organisation. In case of the cooperatives, this share is a membership, while owners of private firms have a percentage of shares. Literature indicated that ownership can influence CSR in two different ways: ownership structure and ownership identity. In other words, this study used two components in order to account for ownership, which are described below. Ownership structure Ownership structure could be measured and defined in several ways. The most common way to measure this construct is through ownership concentration which is the degree a firm is held by one or multiple persons (Tagesson et al., 2009). If one person possesses a firm, it can be characterised as concentrated ownership, while firms become less concentrated when the number of owners increases. Low ownership concentration could influence corporate decisions since, none of the owners will have an incentive to spend their time monitoring and evaluating the managerial decisions (Oh, Chang, & Martynov, 2011). Even if owners monitor and evaluate these decisions they lack the means and, therefore, the power to influence decisions (Oh et al., 2011). The opposite holds for high ownership concentration, in which large shareholders have the power to influence the corporate decisions (Admati et al. 1994; Boyd, 1994; Lee & Lounsbury, 2011; Smith, 1996 as cited by Oh et al., 2011). These shareholders influence firm’s decisions indirectly via appointing directors and directly via shareholder activism (Admati et al. 1994; Boyd, 1994; Lee & Lounsbury, 2011; Smith, 1996 as cited by Oh et al., 2011). In support of this reasoning, Salvioni and Gennari (2016) found that if owners possess a significant percentage of shares, the decision-making process has a long-term sustainable focus compared to organizations with a more scattered group of shareholders. Prado-Lorenzo, Gallego-Alvarez and Garcia-Sanchez (2009) argued that dominant shareholders are interested in the long-term survival of the firm and maintaining their own reputation, which is strongly related to the firm. Therefore, dominant shareholders are more likely to adopt decisions which ensure maximization of benefits on economic, social and environmental dimensions (Prado-Lorenzo et al., 2009). On the contrary, research from other authors indicates that ownership concentration is negatively related to CSR (Brammer and Pavelin, 2008; Gamerschlag et al., 2011; Reverte, 2009; Roberts, 1992; Ullmann, 1985, as cited in Lopatta, Jaeschke, Canitz, & Kaspereit, 2017). Lopatta et al. (2017) explained this phenomenon by the fact that similar shareholders may pursue the same goals at the expense of the diversified interests of the dispersed owners. Dam and Scholtens (2013) argued that larger shareholders prefer social initiatives less than smaller shareholders since, it might be the case that benefits do not outweigh the costs even in a social optimum. If those large shareholders do improve their CSR policies, other stakeholders may benefit at their expense and, therefore, privately provide a public good (Dam & Scholtens, 2013). Although the literature presented above does not give a clear view on the relationship between ownership structure and CSR, it indicates that larger shareholders feel pressured by stakeholders to act and invest in a responsible way. They indirectly indicate that both firms and shareholders are aiming to obtain legitimacy from society. In this study it is assumed that ownership concentration is positively related to CSR, since larger shareholders want to legitimize their behaviour. Therefore, the following proposition is formulated:
Proposition 3a: firms with higher levels of ownership concentration disclose more CSR information Ownership identity Another dimension which could influence firm’s CSR strategy is the ownership identity, in which the preferences of the different owners are crucial. Oh et al. (2011) illustrated this by dividing ownership identity into three categories; institutional investors, managers and foreign investors. Oh et al. (2011)

25
found that both institutional and foreign investors are significantly and positively related to firm CSR rating, while the opposite holds for those firms with managers as owners. Oh et al. (2011) reasoned that managers may use their stock to obtain personal benefits, while institutional and foreign investors are increasingly long-term focused. Furthermore, Dam and Scholtens (2012) investigated six ownership identities related to CSR involvement and concluded that in many cases ownership influences CSR. CSR performance was negatively influenced by the ownership identities corporations, individuals and employees, while no effects were found for the ownership identities institutional investors, banks, and states (Dam & Scholtens, 2012). Dam and Scholtens (2012) explained these results by the different functions of each owner in society. For example, banks act as intermediaries in order to manage both risk and money on behalf of others. The opposite holds for firms and employees who have a strategic agenda (Dam & Scholtens, 2012). The study of Tagesson et al. (2009) also investigated ownership identity by including 267 Swedish firms. They concluded that state-owned firms are disclosing more CSR than private firms, as they serve as a “best practice” example. State-owned firms are scrutinized by the mass media and pressured by their owner to act and disclose properly (Tagesson et al., 2009). Central in this study is the European dairy industry. In this industry two major ownership identities can be identified, namely private firms and cooperatives. Cooperatives are organizations controlled and owned by their members, in order to reach benefits for these members (Soboh, Lansink, Giesen, & van Dijk, 2009). Besides achieving benefits for the members, cooperatives may also strive to gain profits. Therefore, cooperatives are called multiple-objective organisations (Soboh et al., 2009). Van der Krogt, Nilsson, & Høst (2007) identified that cooperatives, due to their membership structure, are constrained in attracting capital. Cooperatives primarily depend on their members to provide them with new capital, while private firms can attract equity by the emission of stock (Van der Krogt et al., 2007). However, members are not incentivized to provide equity due to vaguely defined property rights (Bretos & Marcuello, 2017; Soboh et al., 2009). Furthermore, due to the multiple-objective nature, cooperatives are more risk averse than private firms (Van der Krogt et al., 2007). The rationale behind this is that the board of directors, which represents the members of the cooperative, double check the decisions made by the board of managers. Therefore, decisions are made under higher levels of risk aversion in comparison to private firms (Van der Krogt et al., 2007). Besides, cooperatives tend to follow a modest strategy, since the board should weigh all members’ interests (Van der Krogt et al., 2007). Furthermore, the multi-objective nature also restricts the cooperatives in the way they can employ their resources. To illustrate, members are entitled to the net income earned by the firm (Soboh et al., 2009). However, investing in a CSR strategy implies lower income for the members. It is plausible to assume that members are less willing to agree with investing in CSR strategies, causing members’ income to decline. This study reasoned, that it is plausible to assume that members are less willing to give up their income and to invest in CSR, since payoffs of CSR are uncertain (McWilliams & Siegel, 2001). Based on the multiple objective nature of cooperatives and its implications, it is proposed that cooperatives employ less CSR than private firms since. Therefore, the following proposition is formulated:
Proposition 3b: cooperatives disclose less CSR information compared to private firms
3.4 Conceptual framework
Using the findings from literature as presented above, the following propositions were formulated:
- Size - Proposition 1: larger firms disclose more CSR information
- Corporate governance - Proposition 2a: firms with larger boards disclose more CSR information - Proposition 2b: firms with a higher share of female board members disclose more
CSR information
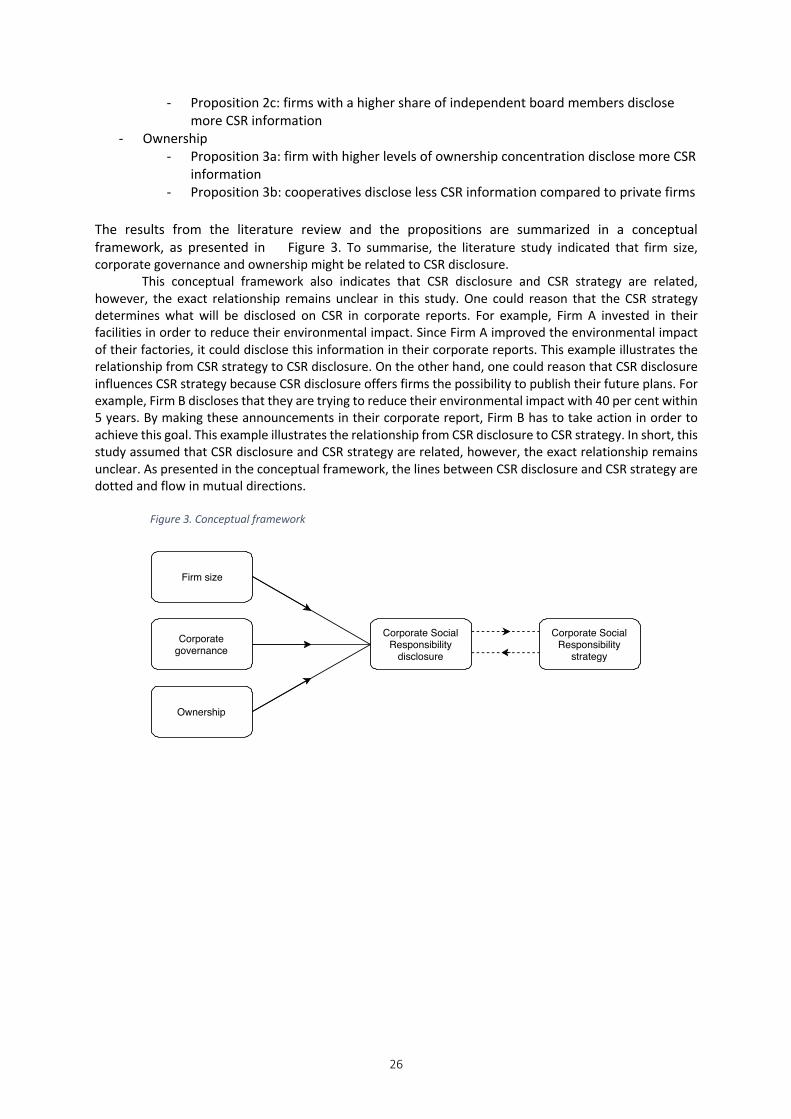
26
- Proposition 2c: firms with a higher share of independent board members disclose more CSR information
- Ownership - Proposition 3a: firm with higher levels of ownership concentration disclose more CSR
information - Proposition 3b: cooperatives disclose less CSR information compared to private firms
The results from the literature review and the propositions are summarized in a conceptual framework, as presented in Figure 3. To summarise, the literature study indicated that firm size, corporate governance and ownership might be related to CSR disclosure.
This conceptual framework also indicates that CSR disclosure and CSR strategy are related, however, the exact relationship remains unclear in this study. One could reason that the CSR strategy determines what will be disclosed on CSR in corporate reports. For example, Firm A invested in their facilities in order to reduce their environmental impact. Since Firm A improved the environmental impact of their factories, it could disclose this information in their corporate reports. This example illustrates the relationship from CSR strategy to CSR disclosure. On the other hand, one could reason that CSR disclosure influences CSR strategy because CSR disclosure offers firms the possibility to publish their future plans. For example, Firm B discloses that they are trying to reduce their environmental impact with 40 per cent within 5 years. By making these announcements in their corporate report, Firm B has to take action in order to achieve this goal. This example illustrates the relationship from CSR disclosure to CSR strategy. In short, this study assumed that CSR disclosure and CSR strategy are related, however, the exact relationship remains unclear. As presented in the conceptual framework, the lines between CSR disclosure and CSR strategy are dotted and flow in mutual directions.
Figure 3. Conceptual framework
Corporate Social
Responsibility
disclosure
Firm size
Corporate
governance
Ownership
Corporate Social
Responsibility
strategy
27
4. Methodology This chapter elaborates on various parts of this study’s research design. Section 4.1 elaborates on the study’s design. The data collection methods and data analysis methods are elaborated on in section 4.2 and 4.3 respectively. Section 4.4 deals with the objects under study, while section 4.5 elaborates on the operationalisation of both CSR and the firm characteristics.
4.1 Study design
As indicated in the introduction, current literature is lacking research regarding the relationship between firm characteristics and CSR strategy in the dairy industry. Therefore, an explorative study was conducted towards this matter. An explorative study can be defined as “a study with the objective either to explore an area where little is known or to investigate the possibilities of undertaking a particular research study” (Kumar, 2012, p. 370). In order to explore the relationship between firm characteristics and CSR strategy, this study used a case study design. A case study design was selected since this design is particularly useful when one is exploring an under investigated area (Kumar, 2012). To be more precise, a multiple case study design was selected since these are more powerful and convincing, and as they provide more insights than single case study designs (de Vaus, 2013). In total 11 cases were selected to investigate this relationship in the European dairy industry. As the main objective is only to broaden our understanding and not to obtain a pattern over several years, one base year was used.
4.2 Data collection methods
To answer the theoretical research questions, a literature study was conducted. To find the most relevant articles for this study, key search words as “firm”, “characteristics”, “CSR OR Corporate Social Responsibility”, “cooperatives”, “IOF* OR invested-owned-firm* OR private firm*” were used. Articles were obtained via the WURLibrary and Scopus database. An overview of the key search words is attached to Appendix C. To ensure that the articles in this study were still relevant and had not lost their impact, the Field-Weighted Citation Impact (hereafter FWCI) factors were used. This metric describes how well the document is cited compared to similar documents. It is a ratio between the actual citations of an article in one year and the average number of citations by similar publications measured over three years (Delasalle & Plume, 2016). A FWCI factor higher than 1.00 indicates that an article is cited above average and is still relevant (Delasalle & Plume, 2016). To illustrate, when an article has a FWCI factor of 1.30, it indicates that this article is cited 30% more than expected.
Additionally, to answer the empirical sub research questions, corporate communications were consulted. Ideally, one should capture and analyse all firm’s communications to obtain a clear view of firms’ CSR strategies (Gray, Kouhy, & Lavers, 1995). Moreover, it is desirable to use both the annual reports and CSR reports as it is likely to assume that stakeholders use all publicly available documents to include in their decision making process (Van Staden & Hooks, 2007, as cited in Lu & Abeysekera, 2014). However, practically it would be difficult to capture and analyse all firm’s communications due to constraints such as time. Therefore, this study pragmatically chose to include CSR reports in order to obtain firms’ CSR strategies. Corporate reports, such as CSR reports, could be a fruitful source of information since it was assumed these reports are used by stakeholders in their decision-making process (Lu & Abeysekera, 2014). Furthermore, CSR reports offer managers the possibility to articulate focus points towards their stakeholders (Guthrie, Petty, Yongvanich, & Ricceri, 2004). As there is no obligation by law to publish separate reports specifically on CSR, annual reports were included in the analysis for those firms which did not disclose a CSR report. Choosing for one corporate report per firm, reduced the workload of this study. Besides, it was assumed that firms which publish CSR reports, disclose all relevant information regarding their CSR strategy in this report. Furthermore, it is plausible to assume that if stakeholders would like to find information on firm’s CSR strategy, they would consult CSR reports if available. When these reports were not available, it was assumed that firms will disclose information regarding the CSR strategy in the annual reports, since they want to inform their stakeholders on CSR related issues as well. In this line of reasoning, it was assumed that adding an
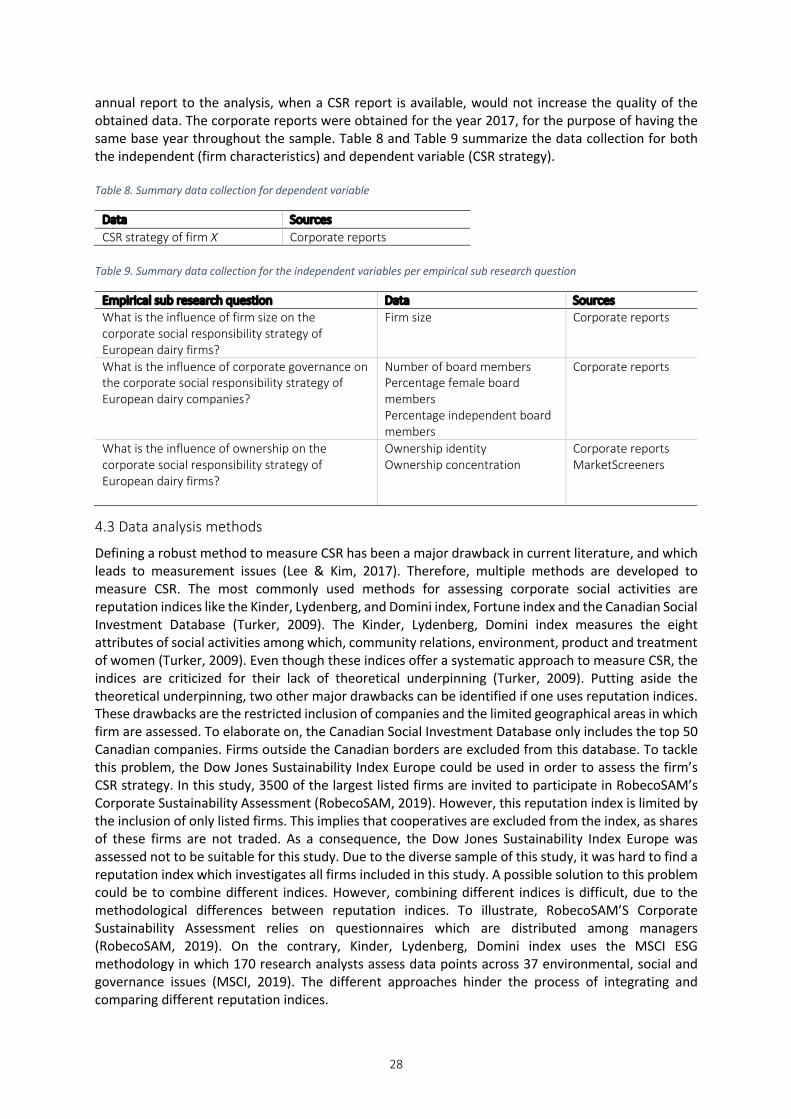
28
annual report to the analysis, when a CSR report is available, would not increase the quality of the obtained data. The corporate reports were obtained for the year 2017, for the purpose of having the same base year throughout the sample. Table 8 and Table 9 summarize the data collection for both the independent (firm characteristics) and dependent variable (CSR strategy).
Table 8. Summary data collection for dependent variable
Data Sources CSR strategy of firm X Corporate reports
Table 9. Summary data collection for the independent variables per empirical sub research question
Empirical sub research question Data Sources What is the influence of firm size on the corporate social responsibility strategy of European dairy firms?
Firm size Corporate reports
What is the influence of corporate governance on the corporate social responsibility strategy of European dairy companies?
Number of board members Percentage female board members Percentage independent board members
Corporate reports
What is the influence of ownership on the corporate social responsibility strategy of European dairy firms?
Ownership identity Ownership concentration
Corporate reports MarketScreeners
4.3 Data analysis methods
Defining a robust method to measure CSR has been a major drawback in current literature, and which leads to measurement issues (Lee & Kim, 2017). Therefore, multiple methods are developed to measure CSR. The most commonly used methods for assessing corporate social activities are reputation indices like the Kinder, Lydenberg, and Domini index, Fortune index and the Canadian Social Investment Database (Turker, 2009). The Kinder, Lydenberg, Domini index measures the eight attributes of social activities among which, community relations, environment, product and treatment of women (Turker, 2009). Even though these indices offer a systematic approach to measure CSR, the indices are criticized for their lack of theoretical underpinning (Turker, 2009). Putting aside the theoretical underpinning, two other major drawbacks can be identified if one uses reputation indices. These drawbacks are the restricted inclusion of companies and the limited geographical areas in which firm are assessed. To elaborate on, the Canadian Social Investment Database only includes the top 50 Canadian companies. Firms outside the Canadian borders are excluded from this database. To tackle this problem, the Dow Jones Sustainability Index Europe could be used in order to assess the firm’s CSR strategy. In this study, 3500 of the largest listed firms are invited to participate in RobecoSAM’s Corporate Sustainability Assessment (RobecoSAM, 2019). However, this reputation index is limited by the inclusion of only listed firms. This implies that cooperatives are excluded from the index, as shares of these firms are not traded. As a consequence, the Dow Jones Sustainability Index Europe was assessed not to be suitable for this study. Due to the diverse sample of this study, it was hard to find a reputation index which investigates all firms included in this study. A possible solution to this problem could be to combine different indices. However, combining different indices is difficult, due to the methodological differences between reputation indices. To illustrate, RobecoSAM’S Corporate Sustainability Assessment relies on questionnaires which are distributed among managers (RobecoSAM, 2019). On the contrary, Kinder, Lydenberg, Domini index uses the MSCI ESG methodology in which 170 research analysts assess data points across 37 environmental, social and governance issues (MSCI, 2019). The different approaches hinder the process of integrating and comparing different reputation indices.

29
An alternative to measure CSR is the use of single or multiple- issue indicators. Scholars for instance use corporate crime as an indicator to measure responsible behaviour (Turker, 2009). However, this method is only applicable to a limited number of countries (Turker, 2009). Furthermore, content analysis of annual reports is used more often due to the increasing literature on corporate social reporting (Turker, 2009). Content analysis of annual reports is criticized for the discrepancy between the written and actual behaviour of the firm. Studies which investigated the relationship between corporate environmental disclosure and actual performance found that there was no significant association (Turker, 2009). The study of Ingram and Frazier (1980, as cited in Turker, 2009) even found that poor performers provide longer environmental disclosures. Although this might be the case, one could question whether firms in today’s society can afford to perform bad on environmental dimension while publishing longer environmental disclosures, due to higher levels of scrutinization of society. Due to the drawbacks of the presented measurement methods, Turker (2009) proposed a new method in order to overcome these problems. Turker (2009) formulated new scales in order to measure CSR via the expectations of various stakeholders. Although the author acknowledge that the proposed scales are plausible, more research in different industries and countries is needed to confirm these results (Turker, 2009).
As illustrated above, each method has its own limitations and strengths. Even newer methods, like Turkers’ method, needs further empirical research before it can be characterized as a robust measurement method. Concluding, due to the variety of firms included in this study and the arguments presented above, this study performed a content analysis in order to measure firm’s CSR strategy. The content analysis is deemed to be a suitable method for this study as is “systematically transforms a large amount of text into a highly organised and concise summary of key results” (Erlingsson & Brysiewicz, 2017, p. 97). Furthermore, according to Stemler (2001), the content analysis is useful to obtain trends and patterns in documents, such as corporate reports. The discrepancy between written and actual behaviour is a drawback of the content analysis. However, as stated in section 3.2 it is plausible to assume that firms act in line with their disclosure, due to scrutinization of society.
4.4 Objects under study
In order to explore the relationship between firm characteristics and CSR strategy, this study included a multitude of European dairy firms. The sample is restricted to firms which are founded and operating in European countries and disclose corporate reports. To determine the sample, the top 10 European dairy firms were included, since they absorb and produce more than fifty per cent2 of the European milk (Eurostat, 2017). Although these dairy firms give a representative overview of the European dairy industry, this sample would give limited data since these firms all can be characterised as large firms. In order to obtain more diversified data, also the list of the 25 dairy firms located in the Netherlands was consulted (ZuivelNL, 2017). Of these 25 dairy firms, only 3 firms were added due to several reasons among which their country of origin and availability of corporate reports. The following firms are included in this study: Top 10 European dairy firms
- Nestlé - Danone - Friesland-Campina - Arla Foods - Unilever - DMK - Sodiaal
2 Calculated by dividing the total milk intake by European dairy firms which was 91,1 million tonnes of milk (Table 1) by the milk used at dairies which was 159 million tonnes of milk (Eurostat, 2017). 57,3% of the milk used by dairies was used by the top 10 dairy firms. As no data was available for Unilever, this figure was excluded from the calculations.
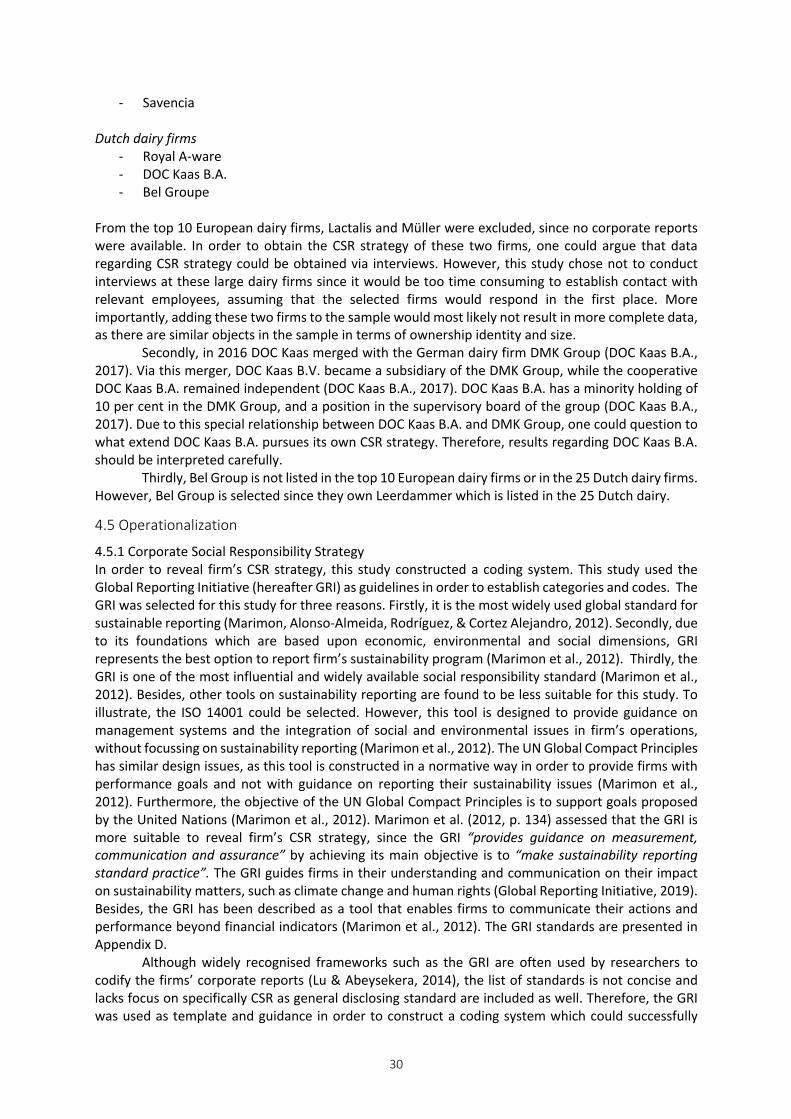
30
- Savencia
Dutch dairy firms - Royal A-ware - DOC Kaas B.A. - Bel Groupe
From the top 10 European dairy firms, Lactalis and Müller were excluded, since no corporate reports were available. In order to obtain the CSR strategy of these two firms, one could argue that data regarding CSR strategy could be obtained via interviews. However, this study chose not to conduct interviews at these large dairy firms since it would be too time consuming to establish contact with relevant employees, assuming that the selected firms would respond in the first place. More importantly, adding these two firms to the sample would most likely not result in more complete data, as there are similar objects in the sample in terms of ownership identity and size. Secondly, in 2016 DOC Kaas merged with the German dairy firm DMK Group (DOC Kaas B.A., 2017). Via this merger, DOC Kaas B.V. became a subsidiary of the DMK Group, while the cooperative DOC Kaas B.A. remained independent (DOC Kaas B.A., 2017). DOC Kaas B.A. has a minority holding of 10 per cent in the DMK Group, and a position in the supervisory board of the group (DOC Kaas B.A., 2017). Due to this special relationship between DOC Kaas B.A. and DMK Group, one could question to what extend DOC Kaas B.A. pursues its own CSR strategy. Therefore, results regarding DOC Kaas B.A. should be interpreted carefully. Thirdly, Bel Group is not listed in the top 10 European dairy firms or in the 25 Dutch dairy firms. However, Bel Group is selected since they own Leerdammer which is listed in the 25 Dutch dairy.
4.5 Operationalization
4.5.1 Corporate Social Responsibility Strategy In order to reveal firm’s CSR strategy, this study constructed a coding system. This study used the Global Reporting Initiative (hereafter GRI) as guidelines in order to establish categories and codes. The GRI was selected for this study for three reasons. Firstly, it is the most widely used global standard for sustainable reporting (Marimon, Alonso-Almeida, Rodríguez, & Cortez Alejandro, 2012). Secondly, due to its foundations which are based upon economic, environmental and social dimensions, GRI represents the best option to report firm’s sustainability program (Marimon et al., 2012). Thirdly, the GRI is one of the most influential and widely available social responsibility standard (Marimon et al., 2012). Besides, other tools on sustainability reporting are found to be less suitable for this study. To illustrate, the ISO 14001 could be selected. However, this tool is designed to provide guidance on management systems and the integration of social and environmental issues in firm’s operations, without focussing on sustainability reporting (Marimon et al., 2012). The UN Global Compact Principles has similar design issues, as this tool is constructed in a normative way in order to provide firms with performance goals and not with guidance on reporting their sustainability issues (Marimon et al., 2012). Furthermore, the objective of the UN Global Compact Principles is to support goals proposed by the United Nations (Marimon et al., 2012). Marimon et al. (2012, p. 134) assessed that the GRI is more suitable to reveal firm’s CSR strategy, since the GRI “provides guidance on measurement, communication and assurance” by achieving its main objective is to “make sustainability reporting standard practice”. The GRI guides firms in their understanding and communication on their impact on sustainability matters, such as climate change and human rights (Global Reporting Initiative, 2019). Besides, the GRI has been described as a tool that enables firms to communicate their actions and performance beyond financial indicators (Marimon et al., 2012). The GRI standards are presented in Appendix D. Although widely recognised frameworks such as the GRI are often used by researchers to codify the firms’ corporate reports (Lu & Abeysekera, 2014), the list of standards is not concise and lacks focus on specifically CSR as general disclosing standard are included as well. Therefore, the GRI was used as template and guidance in order to construct a coding system which could successfully
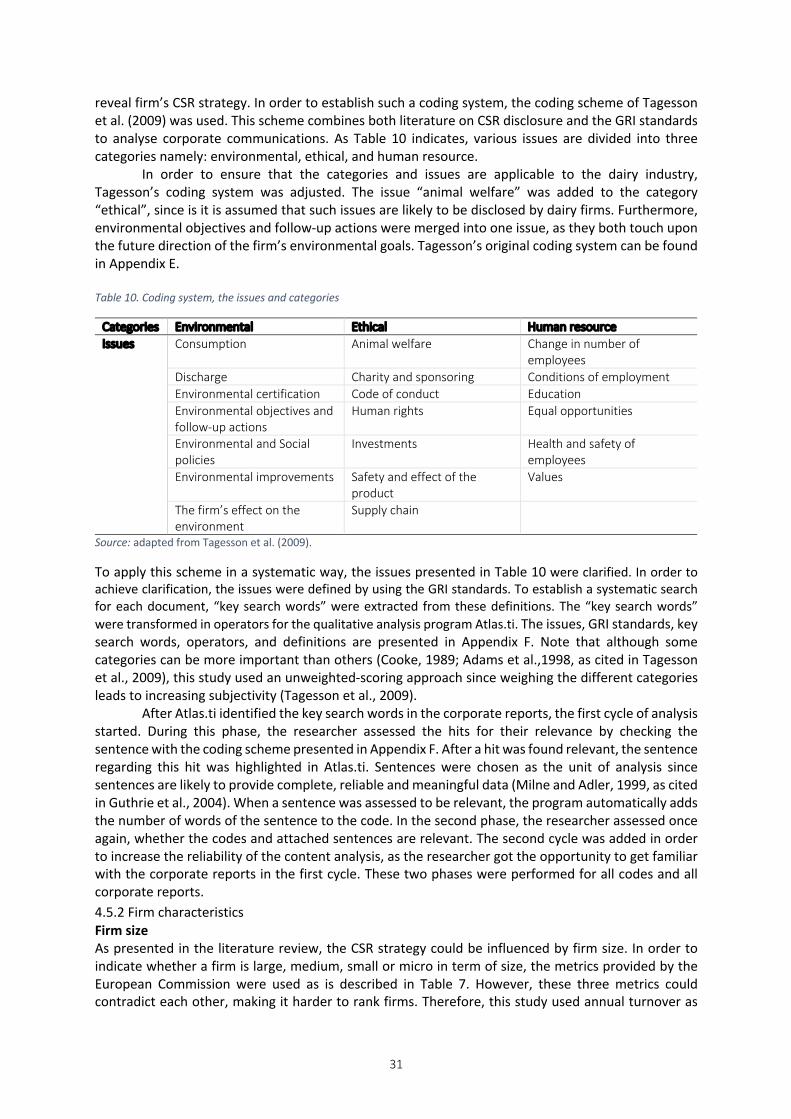
31
reveal firm’s CSR strategy. In order to establish such a coding system, the coding scheme of Tagesson et al. (2009) was used. This scheme combines both literature on CSR disclosure and the GRI standards to analyse corporate communications. As Table 10 indicates, various issues are divided into three categories namely: environmental, ethical, and human resource.
In order to ensure that the categories and issues are applicable to the dairy industry, Tagesson’s coding system was adjusted. The issue “animal welfare” was added to the category “ethical”, since is it is assumed that such issues are likely to be disclosed by dairy firms. Furthermore, environmental objectives and follow-up actions were merged into one issue, as they both touch upon the future direction of the firm’s environmental goals. Tagesson’s original coding system can be found in Appendix E. Table 10. Coding system, the issues and categories
Categories Environmental Ethical Human resource Issues Consumption Animal welfare Change in number of
employees Discharge Charity and sponsoring Conditions of employment Environmental certification Code of conduct Education Environmental objectives and follow-up actions
Human rights Equal opportunities
Environmental and Social policies
Investments Health and safety of employees
Environmental improvements Safety and effect of the product
Values
The firm’s effect on the environment
Supply chain
Source: adapted from Tagesson et al. (2009).
To apply this scheme in a systematic way, the issues presented in Table 10 were clarified. In order to achieve clarification, the issues were defined by using the GRI standards. To establish a systematic search for each document, “key search words” were extracted from these definitions. The “key search words” were transformed in operators for the qualitative analysis program Atlas.ti. The issues, GRI standards, key search words, operators, and definitions are presented in Appendix F. Note that although some categories can be more important than others (Cooke, 1989; Adams et al.,1998, as cited in Tagesson et al., 2009), this study used an unweighted-scoring approach since weighing the different categories leads to increasing subjectivity (Tagesson et al., 2009).
After Atlas.ti identified the key search words in the corporate reports, the first cycle of analysis started. During this phase, the researcher assessed the hits for their relevance by checking the sentence with the coding scheme presented in Appendix F. After a hit was found relevant, the sentence regarding this hit was highlighted in Atlas.ti. Sentences were chosen as the unit of analysis since sentences are likely to provide complete, reliable and meaningful data (Milne and Adler, 1999, as cited in Guthrie et al., 2004). When a sentence was assessed to be relevant, the program automatically adds the number of words of the sentence to the code. In the second phase, the researcher assessed once again, whether the codes and attached sentences are relevant. The second cycle was added in order to increase the reliability of the content analysis, as the researcher got the opportunity to get familiar with the corporate reports in the first cycle. These two phases were performed for all codes and all corporate reports. 4.5.2 Firm characteristics Firm size As presented in the literature review, the CSR strategy could be influenced by firm size. In order to indicate whether a firm is large, medium, small or micro in term of size, the metrics provided by the European Commission were used as is described in Table 7. However, these three metrics could contradict each other, making it harder to rank firms. Therefore, this study used annual turnover as
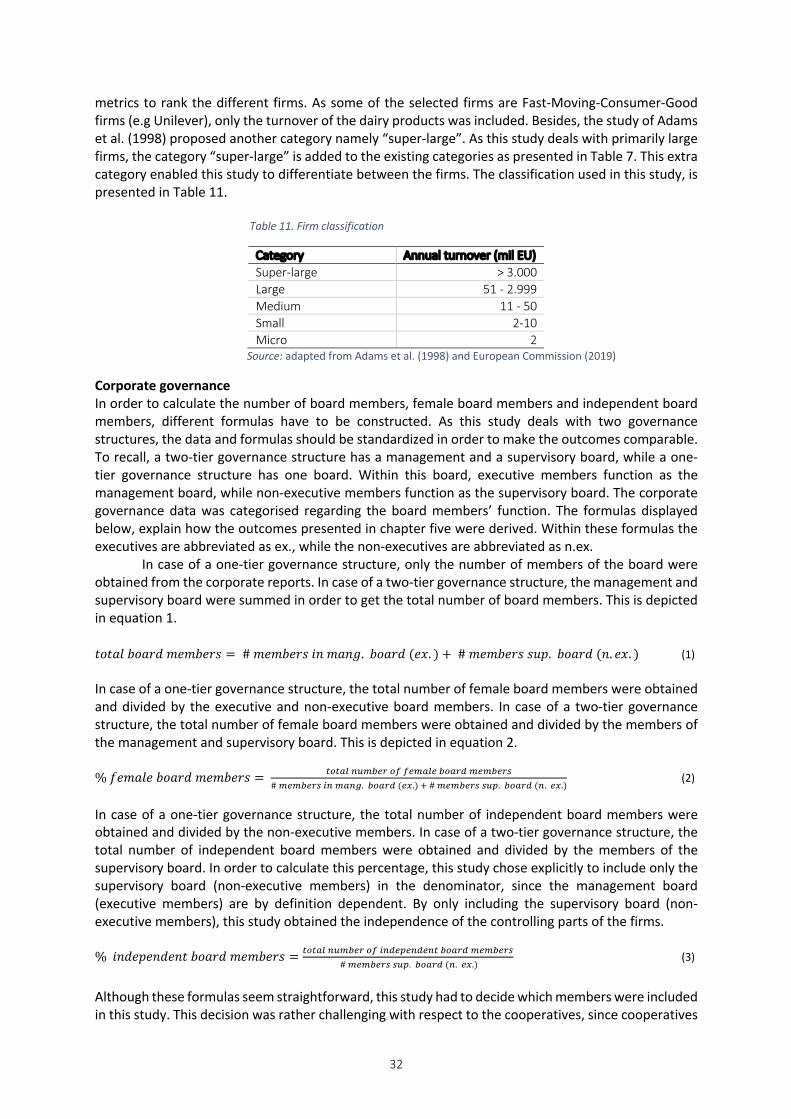
32
metrics to rank the different firms. As some of the selected firms are Fast-Moving-Consumer-Good firms (e.g Unilever), only the turnover of the dairy products was included. Besides, the study of Adams et al. (1998) proposed another category namely “super-large”. As this study deals with primarily large firms, the category “super-large” is added to the existing categories as presented in Table 7. This extra category enabled this study to differentiate between the firms. The classification used in this study, is presented in Table 11.
Table 11. Firm classification
Category Annual turnover (mil EU) Super-large > 3.000 Large 51 - 2.999 Medium 11 - 50 Small 2-10 Micro 2
Source: adapted from Adams et al. (1998) and European Commission (2019)
Corporate governance In order to calculate the number of board members, female board members and independent board members, different formulas have to be constructed. As this study deals with two governance structures, the data and formulas should be standardized in order to make the outcomes comparable. To recall, a two-tier governance structure has a management and a supervisory board, while a one-tier governance structure has one board. Within this board, executive members function as the management board, while non-executive members function as the supervisory board. The corporate governance data was categorised regarding the board members’ function. The formulas displayed below, explain how the outcomes presented in chapter five were derived. Within these formulas the executives are abbreviated as ex., while the non-executives are abbreviated as n.ex.
In case of a one-tier governance structure, only the number of members of the board were obtained from the corporate reports. In case of a two-tier governance structure, the management and supervisory board were summed in order to get the total number of board members. This is depicted in equation 1. 𝑡𝑜𝑡𝑎𝑙𝑏𝑜𝑎𝑟𝑑𝑚𝑒𝑚𝑏𝑒𝑟𝑠 = #𝑚𝑒𝑚𝑏𝑒𝑟𝑠𝑖𝑛𝑚𝑎𝑛𝑔.𝑏𝑜𝑎𝑟𝑑(𝑒𝑥. ) + #𝑚𝑒𝑚𝑏𝑒𝑟𝑠𝑠𝑢𝑝.𝑏𝑜𝑎𝑟𝑑(𝑛. 𝑒𝑥. ) (1) In case of a one-tier governance structure, the total number of female board members were obtained and divided by the executive and non-executive board members. In case of a two-tier governance structure, the total number of female board members were obtained and divided by the members of the management and supervisory board. This is depicted in equation 2.
%𝑓𝑒𝑚𝑎𝑙𝑒𝑏𝑜𝑎𝑟𝑑𝑚𝑒𝑚𝑏𝑒𝑟𝑠 = :;:<=>?@ABC;DDB@<=BA;<CE@B@ABCF#@B@ABCFG>@<>H.A;<CE(BI.)J#@B@ABCFF?K.A;<CE(>.BI.)
(2)
In case of a one-tier governance structure, the total number of independent board members were obtained and divided by the non-executive members. In case of a two-tier governance structure, the total number of independent board members were obtained and divided by the members of the supervisory board. In order to calculate this percentage, this study chose explicitly to include only the supervisory board (non-executive members) in the denominator, since the management board (executive members) are by definition dependent. By only including the supervisory board (non-executive members), this study obtained the independence of the controlling parts of the firms.
%𝑖𝑛𝑑𝑒𝑝𝑒𝑛𝑑𝑒𝑛𝑡𝑏𝑜𝑎𝑟𝑑𝑚𝑒𝑚𝑏𝑒𝑟𝑠 = :;:<=>?@ABC;DG>EBKB>EB>:A;<CE@B@ABCF#@B@ABCFF?K.A;<CE(>.BI.)
(3)
Although these formulas seem straightforward, this study had to decide which members were included in this study. This decision was rather challenging with respect to the cooperatives, since cooperatives
33
often own a private firm to exploit the economic activities of the cooperative. For instance, the cooperative Zuivelcooperatie FrieslandCampina U.A. owns 100% of the firm Royal FrieslandCampina N.V. (FrieslandCampina, 2019). Therefore, one could state that FrieslandCampina consists of two entities, namely the cooperative to which dairy farmers deliver their milk. And the private firm, which is supplied by the cooperatives and produces dairy products. In order to govern these entities, each entity has its own corporate governance mechanisms. To investigate the influence of corporate governance on CSR disclosure, this study chose to only include the board of the private firms. It is assumed that the board members of these private firms, can initiate strategic change and make decisions regarding the firms CSR strategy.
In order to construct the management board (executive board), this study chose to include only the board members who have the ability to initiate strategic changes. This implied that only board members who hold a position, as for example Chief Executive Officer or Chief Financial Officer, were included in the management board. To illustrate, the executive board of FrieslandCampina consists of a CEO and a CFO. Moreover, FrieslandCampina’s corporate governance consists of an Executive Leadership Team, including the executive board, for the day to day operations. In this case, the CEO and the CFO delegate tasks and responsibilities to other board members of the Executive Leadership Team. The Executive Leadership Team can be seen as the managers who execute the strategy planned by the CEO and CFO. Therefore, only the board members who hold a position as CEO, CFO, or other chief officer functions, were selected as management board (executive board). Ownership As indicated before, the concept ownership was divided into two concepts, namely ownership structure and ownership identity. In order to assess the ownership structure, this study used the Shareholder Concentration Index (hereafter SCI). The SCI is based on the Herfindahl Hirschman Index (hereafter HHI), which assesses the concentration of industries (Dam & Scholtens, 2013). Using this metric, competition authorities could assess whether the competition in certain industries is endangered and thus whether industries are concentrated or not. The difference between the SCI and the HHI is thus that the former is specifically for firms while the latter is for a whole industry. In terms of calculation, the SCI and the HHI are similar. The SCI was calculated by summing the squared shareholdings of every shareholder of the firm (Dam & Scholtens, 2013) as is depicted in equation 4. 𝑆ℎ𝑎𝑟𝑒ℎ𝑜𝑙𝑑𝑒𝑟𝐶𝑜𝑛𝑐𝑒𝑛𝑡𝑟𝑎𝑡𝑖𝑜𝑛𝐼𝑛𝑑𝑒𝑥 = ∑(𝑥RS + 𝑥SS+. . . 𝑥TS) (4)
A higher SCI value implies higher ownership concentration. SCI is used in this study as it provides a continuous measure (Dam & Scholtens, 2012). This was helpful by assessing the differences between firms. In order to calculate the SCI, data regarding shareholder percentages were obtained. Information regarding the ten main shareholders of each private firm was included in the calculation. These figures were obtained via platforms such as MarketScreener or via corporate reports. Calculating ownership concentration was only necessary for private firms since the cooperatives are dispersed in terms of ownership, due to the membership construction with equal voting rights of the cooperatives.
Where: 𝑥 = percentage of shares 𝑥T= shareholder j

34
5. Results This chapter presents the results obtained via the content analysis of the corporate reports. Section 5.1 presents the number of words disclosed by the firms under study. Section 5.2 presents the results on the relationship between three firm characteristics and CSR disclosure. To be more precise, the results of the characteristics firm size, corporate governance and ownership were compared with the number of words disclosed on CSR topics in firms’ corporate reports.
5.1 Corporate social responsibility strategy
In this study, Nestlé, FrieslandCampina, Arla Foods, DMK, Bel Groupe and Royal A-ware disclosed their CSR strategy via a CSR report. The opposite holds for Danone, Unilever, Sodiaal, Savencia and DOC Kaas B.A., as they disclosed their CSR strategy via their annual reports. In the case of Unilever, there was a CSR report available. However, this report was published as a webpage and therefore not suitable for analysis via Atlas.ti. Danone, Sodiaal, Savencia and DOC Kaas B.A. did not disclose a specific CSR report. Therefore the annual reports were analysed for these firms. Specific information on the reports which were used for the analysis can be found in Appendix J. As stated in chapter four, the number of words devoted to CSR in the corporate reports were counted. The results of the content analysis are presented in Figure 4. In this figure, the horizontal axis represents the absolute number of words devoted to CSR, while the vertical axis represents the firms under study. To illustrate, Nestlé disclosed the most words on CSR topics among all firms under study, namely 7568 words. On the contrary, DOC Kaas B.A. disclosed the least number of words on CSR topics among all firms under study, namely 405 words. Figure 4. Corporate social responsibility disclosure in the European dairy industry
5.2 Firm characteristics
Before presenting the results of this study, one should bear in mind that this study aims to explore the relationship between firm characteristics and CSR strategy. Figures presented in this chapter, are only constructed for the sake of exploring the phenomena. These figures have no statistical value due to
7568
6500
4211
3814
3086
2606
2448
1372
1057
982
405
0 1000 2000 3000 4000 5000 6000 7000 8000
Nestlé
Bel Group
Savencia
Unilever
Arla Foods
FrieslandCampina
Danone
Royal A-ware
DMK
Sodiaal
DOC Kaas B.A.
Number of words disclosed
Firm
s und
er st
udy
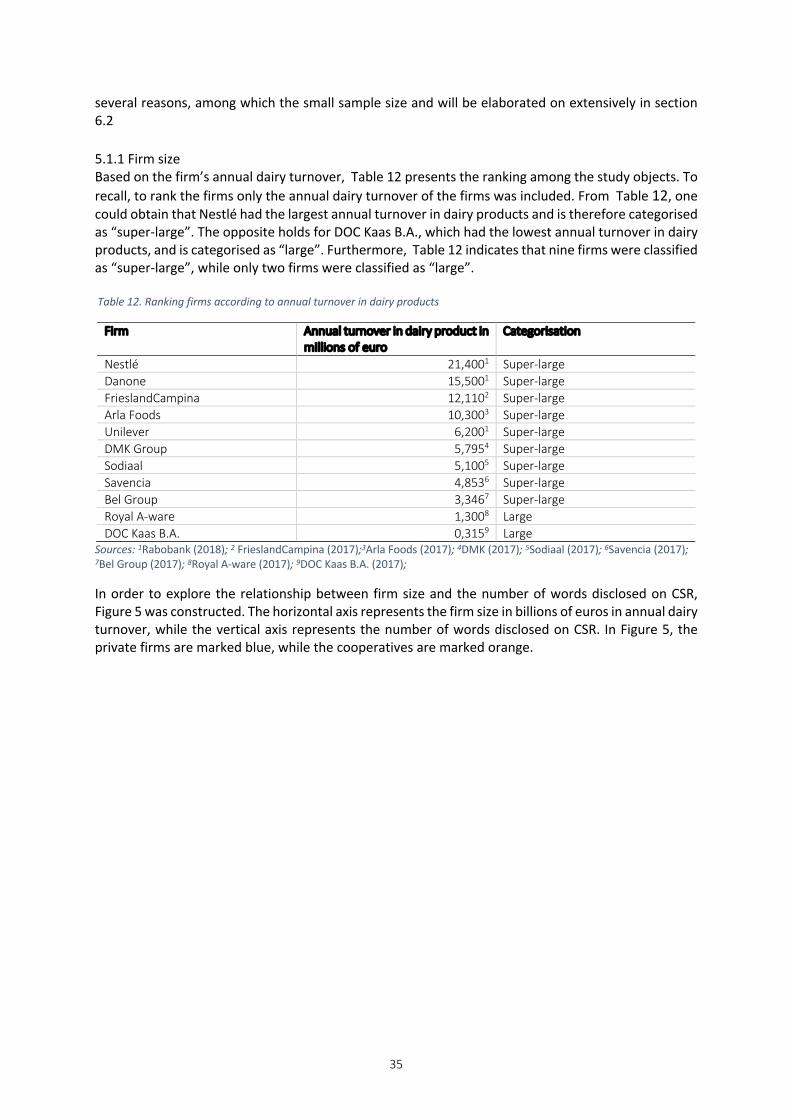
35
several reasons, among which the small sample size and will be elaborated on extensively in section 6.2 5.1.1 Firm size Based on the firm’s annual dairy turnover, Table 12 presents the ranking among the study objects. To recall, to rank the firms only the annual dairy turnover of the firms was included. From Table 12, one could obtain that Nestlé had the largest annual turnover in dairy products and is therefore categorised as “super-large”. The opposite holds for DOC Kaas B.A., which had the lowest annual turnover in dairy products, and is categorised as “large”. Furthermore, Table 12 indicates that nine firms were classified as “super-large”, while only two firms were classified as “large”. Table 12. Ranking firms according to annual turnover in dairy products
Firm Annual turnover in dairy product in millions of euro
Categorisation
Nestlé 21,4001 Super-large Danone 15,5001 Super-large FrieslandCampina 12,1102 Super-large Arla Foods 10,3003 Super-large Unilever 6,2001 Super-large DMK Group 5,7954 Super-large Sodiaal 5,1005 Super-large Savencia 4,8536 Super-large Bel Group 3,3467 Super-large Royal A-ware 1,3008 Large DOC Kaas B.A. 0,3159 Large
Sources: 1Rabobank (2018); 2 FrieslandCampina (2017);3Arla Foods (2017); 4DMK (2017); 5Sodiaal (2017); 6Savencia (2017); 7Bel Group (2017); 8Royal A-ware (2017); 9DOC Kaas B.A. (2017);
In order to explore the relationship between firm size and the number of words disclosed on CSR, Figure 5 was constructed. The horizontal axis represents the firm size in billions of euros in annual dairy turnover, while the vertical axis represents the number of words disclosed on CSR. In Figure 5, the private firms are marked blue, while the cooperatives are marked orange.
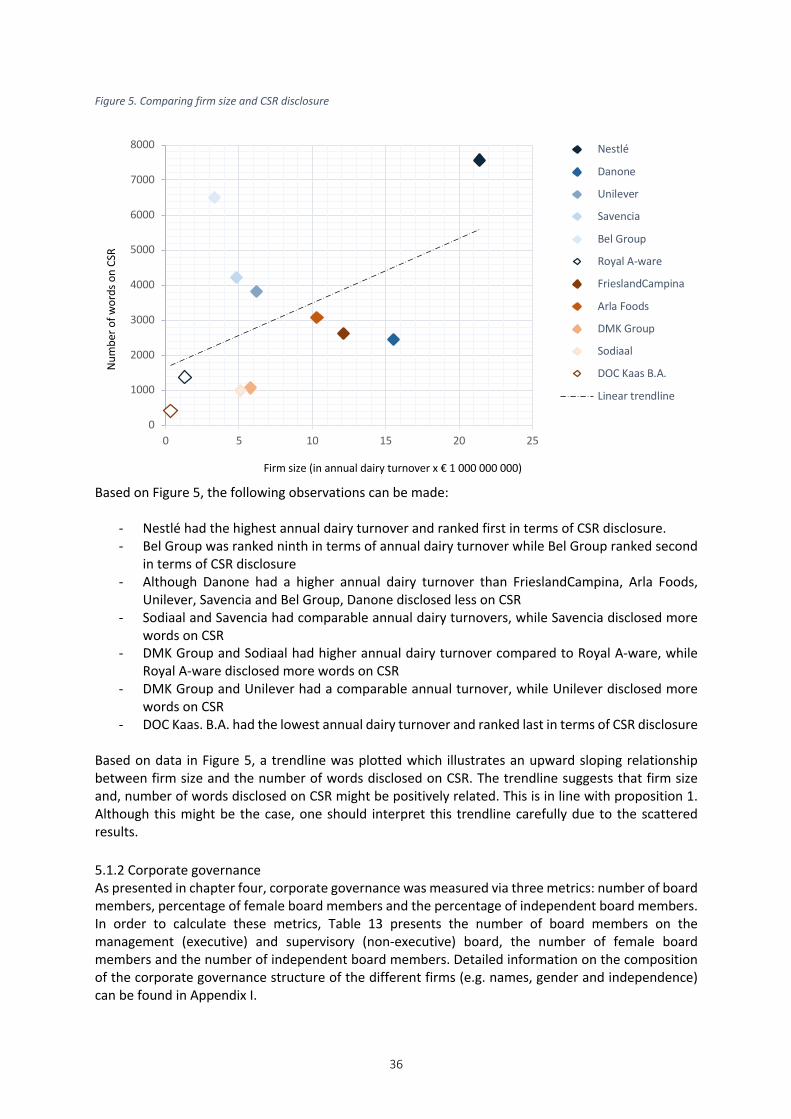
36
Figure 5. Comparing firm size and CSR disclosure
Based on Figure 5, the following observations can be made:
- Nestlé had the highest annual dairy turnover and ranked first in terms of CSR disclosure. - Bel Group was ranked ninth in terms of annual dairy turnover while Bel Group ranked second
in terms of CSR disclosure - Although Danone had a higher annual dairy turnover than FrieslandCampina, Arla Foods,
Unilever, Savencia and Bel Group, Danone disclosed less on CSR - Sodiaal and Savencia had comparable annual dairy turnovers, while Savencia disclosed more
words on CSR - DMK Group and Sodiaal had higher annual dairy turnover compared to Royal A-ware, while
Royal A-ware disclosed more words on CSR - DMK Group and Unilever had a comparable annual turnover, while Unilever disclosed more
words on CSR - DOC Kaas. B.A. had the lowest annual dairy turnover and ranked last in terms of CSR disclosure
Based on data in Figure 5, a trendline was plotted which illustrates an upward sloping relationship between firm size and the number of words disclosed on CSR. The trendline suggests that firm size and, number of words disclosed on CSR might be positively related. This is in line with proposition 1. Although this might be the case, one should interpret this trendline carefully due to the scattered results. 5.1.2 Corporate governance As presented in chapter four, corporate governance was measured via three metrics: number of board members, percentage of female board members and the percentage of independent board members. In order to calculate these metrics, Table 13 presents the number of board members on the management (executive) and supervisory (non-executive) board, the number of female board members and the number of independent board members. Detailed information on the composition of the corporate governance structure of the different firms (e.g. names, gender and independence) can be found in Appendix I.
0
1000
2000
3000
4000
5000
6000
7000
8000
0 5 10 15 20 25
Num
ber o
f wor
ds o
n CS
R
Firm size (in annual dairy turnover x € 1 000 000 000)
Nestlé
Danone
Unilever
Savencia
Bel Group
Royal A-ware
FrieslandCampina
Arla Foods
DMK Group
Sodiaal
DOC Kaas B.A.
Linear trendline

37
Table 13. Corporate governance structure
Firm # of Management Board members/ Executive members
# of Supervisory Board members/ non-executive members
# female board members
# independent board members
Nestlé 2 12 5 12 Danone 1 16 7 10 FrieslandCampina 2 13 3 4 Arla Foods 2 17 2 0 Unilever 2 11 5 11 DMK Group 2 12 1 0 Sodiaal 2 0 0 0 Savencia 4 12 4 6 Bel Group 2 6 2 4 Royal A-ware 4 5 0 5 DOC Kaas B.A. 6 0 1 0
Table 14 presents the outcome of the calculations and. For instance, Nestlé had
the total number of board member of 14, percentage of female board members of 36%, and percentage of independent board member of 100%. When the table indicates a zero, it implies that no female or independent board members could be identified at this firm.
Table 14. Outcome calculations corporate governance metrics
Firm # of total board members
% of female board members
% of independent board members
Nestlé 14 36 100 Danone 17 41 63 FrieslandCampina 15 20 31 Arla Foods 19 11 0 Unilever 13 38 100 DMK Group 14 7 0 Sodiaal 2 0 0 Savencia 16 25 50 Bel Group 8 25 67 Royal A-ware 9 0 100 DOC Kaas B.A. 6 0 0
In order to explore the relationship between the numbers of board members and the number of words disclosed on CSR, Figure 6 was constructed. In this figure, the horizontal axis represents the number of board members, while the vertical axis presents the number of words disclosed on CSR. In Figure 6, the private firms are marked blue, while the cooperatives are marked orange.
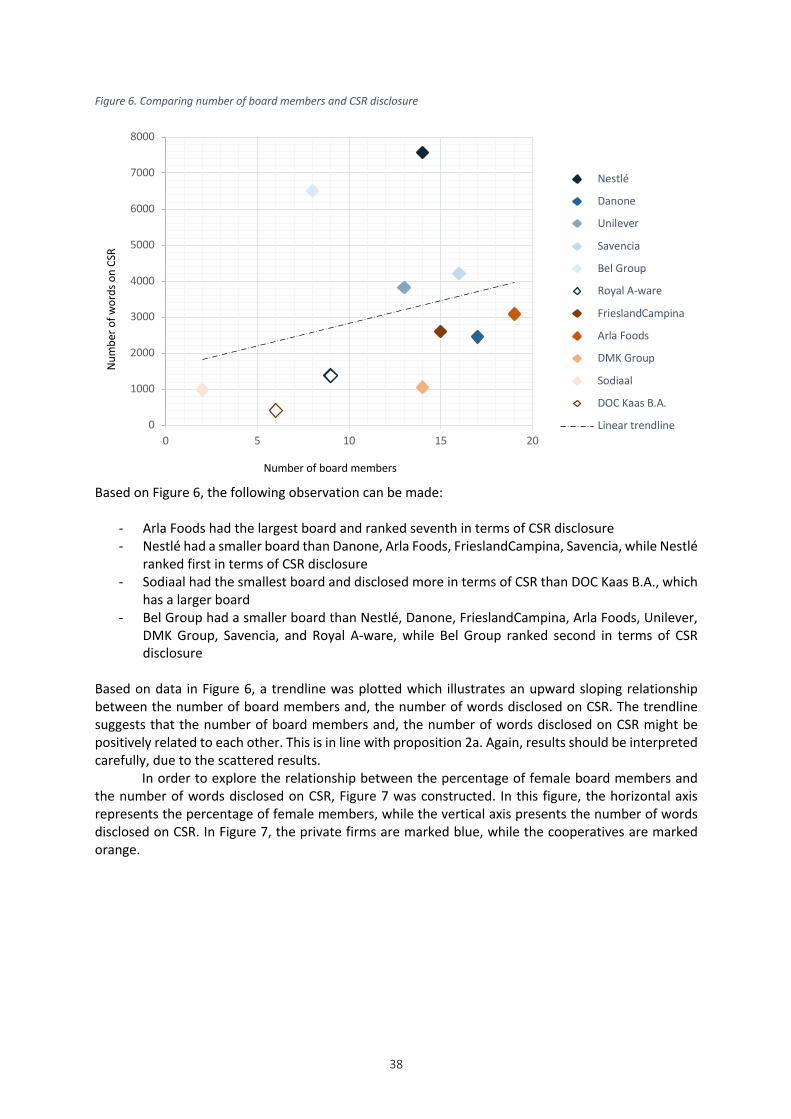
38
Figure 6. Comparing number of board members and CSR disclosure
Based on Figure 6, the following observation can be made:
- Arla Foods had the largest board and ranked seventh in terms of CSR disclosure - Nestlé had a smaller board than Danone, Arla Foods, FrieslandCampina, Savencia, while Nestlé
ranked first in terms of CSR disclosure - Sodiaal had the smallest board and disclosed more in terms of CSR than DOC Kaas B.A., which
has a larger board - Bel Group had a smaller board than Nestlé, Danone, FrieslandCampina, Arla Foods, Unilever,
DMK Group, Savencia, and Royal A-ware, while Bel Group ranked second in terms of CSR disclosure
Based on data in Figure 6, a trendline was plotted which illustrates an upward sloping relationship between the number of board members and, the number of words disclosed on CSR. The trendline suggests that the number of board members and, the number of words disclosed on CSR might be positively related to each other. This is in line with proposition 2a. Again, results should be interpreted carefully, due to the scattered results.
In order to explore the relationship between the percentage of female board members and the number of words disclosed on CSR, Figure 7 was constructed. In this figure, the horizontal axis represents the percentage of female members, while the vertical axis presents the number of words disclosed on CSR. In Figure 7, the private firms are marked blue, while the cooperatives are marked orange.
0
1000
2000
3000
4000
5000
6000
7000
8000
0 5 10 15 20
Num
ber o
f wor
ds o
n CS
R
Number of board members
Nestlé
Danone
Unilever
Savencia
Bel Group
Royal A-ware
FrieslandCampina
Arla Foods
DMK Group
Sodiaal
DOC Kaas B.A.
Linear trendline
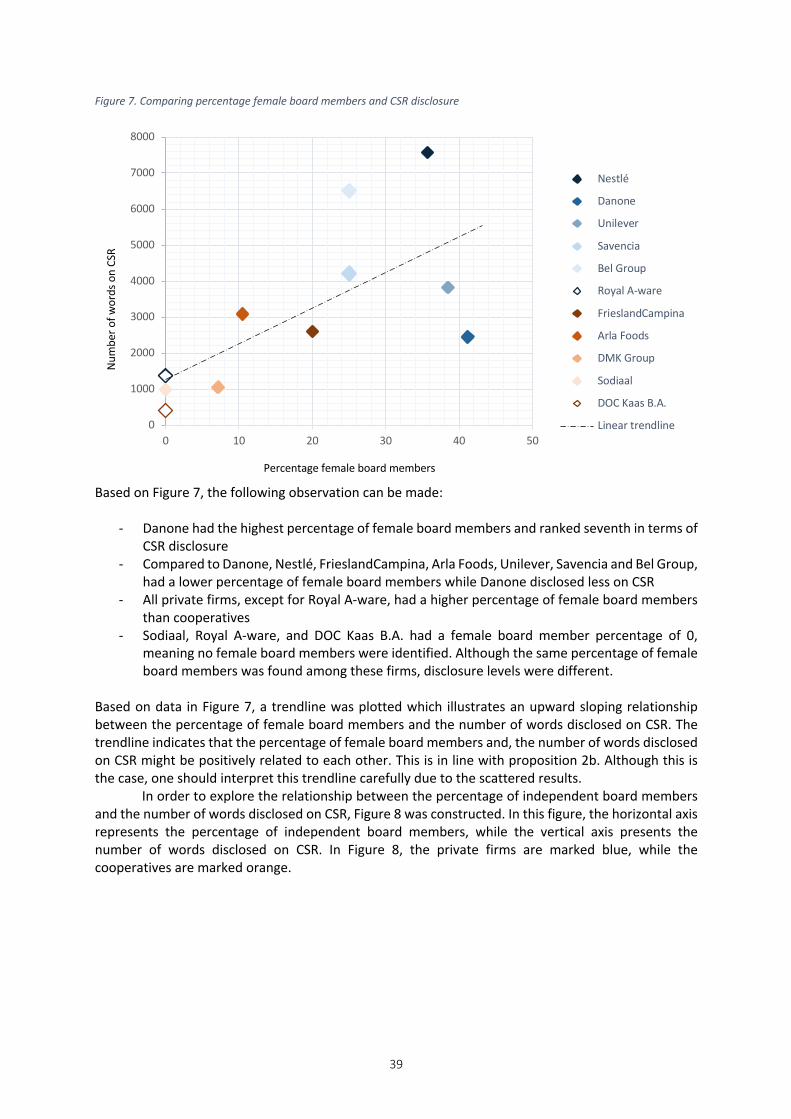
39
Figure 7. Comparing percentage female board members and CSR disclosure
Based on Figure 7, the following observation can be made:
- Danone had the highest percentage of female board members and ranked seventh in terms of CSR disclosure
- Compared to Danone, Nestlé, FrieslandCampina, Arla Foods, Unilever, Savencia and Bel Group, had a lower percentage of female board members while Danone disclosed less on CSR
- All private firms, except for Royal A-ware, had a higher percentage of female board members than cooperatives
- Sodiaal, Royal A-ware, and DOC Kaas B.A. had a female board member percentage of 0, meaning no female board members were identified. Although the same percentage of female board members was found among these firms, disclosure levels were different.
Based on data in Figure 7, a trendline was plotted which illustrates an upward sloping relationship between the percentage of female board members and the number of words disclosed on CSR. The trendline indicates that the percentage of female board members and, the number of words disclosed on CSR might be positively related to each other. This is in line with proposition 2b. Although this is the case, one should interpret this trendline carefully due to the scattered results.
In order to explore the relationship between the percentage of independent board members and the number of words disclosed on CSR, Figure 8 was constructed. In this figure, the horizontal axis represents the percentage of independent board members, while the vertical axis presents the number of words disclosed on CSR. In Figure 8, the private firms are marked blue, while the cooperatives are marked orange.
0
1000
2000
3000
4000
5000
6000
7000
8000
0 10 20 30 40 50
Num
ber o
f wor
ds o
n CS
R
Percentage female board members
Nestlé
Danone
Unilever
Savencia
Bel Group
Royal A-ware
FrieslandCampina
Arla Foods
DMK Group
Sodiaal
DOC Kaas B.A.
Linear trendline

40
Figure 8. Comparing independent board members and CSR disclosure
Based on Figure 8, the following observation can be made:
- Nestlé, Unilever, and Royal A-ware, had an independent board member percentage of 100, meaning all board members are independent. Although the same percentage of independent board members was found among these firms, disclosure levels were different.
- Bel Group had a lower percentage of independent board members and disclosed more than Unilever and Royal A-ware.
- Savencia had a lower percentage of independent board members and disclosed more than Danone, Unilever, and Royal A-ware.
- Arla Foods had no independent board members and disclosed more than Danone, FrieslandCampina and Royal A-ware.
- Arla Foods, DMK Group, Sodiaal and DOC Kaas B.A., had an independent board member percentage of 0, meaning no independent board members were identified. Although the same percentage of independent board members was found among these firms, disclosure levels were different.
Based on data in Figure 8, a trendline was plotted which illustrates an upward sloping relationship between the percentage of independent board members and the number of words disclosed on CSR. The trendline indicates that the percentage of independent board members and, the number of words disclosed on CSR might be positively related to each other. This is in line with proposition 2c. Although this is the case, one should interpret this trendline carefully due to the scattered results. 5.1.3 Ownership Ownership structure In order to analyse the results regarding the influence of ownership structure and CSR disclosure, the firms with ownership identity private and cooperative were analysed separately, as they were measured in different ways. Table 15 presents the SCI values for Nestlé, Danone, Unilever, Savencia, Bel Group and Royal A-ware. The SCI value for Royal A-ware was not calculated, since they are a family owned business (Royal A-ware, 2017), and did not disclosed information on shareholder division. Table 15 ranks the firms according to their SCI value. Bel Group had the highest SCI value and was the most
0
1000
2000
3000
4000
5000
6000
7000
8000
0 20 40 60 80 100
Num
ber o
f wor
ds o
n CS
R
Percentage independent board members
Nestlé
Danone
Unilever
Savencia
Bel Group
Royal A-ware
FrieslandCampina
Arla Foods
DMK Group
Sodiaal
DOC Kaas B.A.
Linear trendline

41
concentrated firm, while Nestlé had the lowest SCI value and was the least concentrated firm. Calculations of these SCI values can be found in Appendix H.
Table 15. Shareholder Concentration Index (SCI) values
Private firm SCI Bel Group 0.5179 Savencia 0.4466 Danone 0.0166 Unilever 0.0156 Nestlé 0.0058 Royal A-ware -
In order to explore the relationship between the ownership structure of private firms and the number of words disclosed on CSR, Figure 9 was constructed. In this figure, the horizontal axis represents the SCI value, while the vertical axis presents the number of words disclosed on CSR. In Figure 9, the private firms are marked blue. Figure 9. Comparing ownership structure and CSR disclosure
Based on Figure 9, the following observation can be made:
- Bel Group was the most concentrated firm and ranked second in terms of CSR disclosure - Savencia was the second most concentrated firm and ranked third in terms of CSR disclosure - Savencia was more concentrated and disclosed more than Danone and Unilever - Danone was more concentrated than Unilever and, disclosed less on CSR than Unilever - Nestlé was the least concentrated firm, and ranked first in terms of CSR disclosure
Based on data in Figure 9, a trendline was plotted which illustrates an upward sloping relationship between the SCI value and the number of words disclosed on CSR. The trendline indicates that ownership structure and, the number of words disclosed on CSR might be positively related. This is in line with proposition 3a. Although this might be the case, one should interpret this trendline carefully
0
1000
2000
3000
4000
5000
6000
7000
8000
0 0,1 0,2 0,3 0,4 0,5 0,6
Num
ber o
f wor
ds o
n CS
R
Shareholder Concentration Index value (SCI)
Nestlé
Danone
Unilever
Savencia
Bel Group
Linear trendline

42
due to the scattered results. As stated before, ownership concentration is only captured for the private firms due to the one-member-one-vote system of the cooperatives, which implies that all cooperatives are dispersed. Ownership identity In this study, six private firms were identified, namely Nestlé Danone, Unilever, Savencia, Bel Group and Royal A-ware. In which, Nestlé, Danone, Unilever, Savencia and Bel Group are publicly traded, and Royal A-ware is family owned. Furthermore, five cooperatives were identified, namely FrieslandCampina, Arla Foods, DMK, Sodiaal and DOC Kaas B.A.3.
In order to explore the relationship between ownership identity and the number of words disclosed on CSR, Figure 4 has to be consulted. From this figure, one can obtain that Nestlé, Bel Group, Savencia and Unilever disclosed the most words on CSR and are private firms. Arla Foods and FrieslandCampina are ranked fifth and sixth, in terms of their CSR disclosure and are cooperatives. Subsequently, Danone and Royal A-ware, which are private firms, are ranked seventh and eighth. The last three firms are DMK, Sodiaal and DOC Kaas B.A. which are cooperatives and ranked ninth, tenth and eleventh respectively.
In order to explore the differences between private firms and cooperatives in depth, Table 16 was constructed. Table 16 presents the firm’s disclosure regarding the different codes. This table presents both the absolute and relative frequencies of each code. To make a fair comparison between the private firms and the cooperatives, it is decided to erase DOC Kaas B.A. for this calculation due to its special relationship with DMK Group, as described in chapter 4. This implies that the total number of words disclosed by cooperatives decreases with 405 from 8,136 to 7,731. In terms of calculations, in the case of consumption, the private firms disclosed 1,511 words while the cooperatives disclosed 385 words. The relative frequencies were calculated by dividing the aggregated amount disclosed by private firms or cooperatives (excluding DOC Kaas B.A.) for one particular code, by the aggregated amount disclosed by private firms or cooperatives (excluding DOC Kaas B.A.) in total. In the case of consumption, the relative frequency for the private firms was calculated by dividing 1,511 words by 25,913 words, resulting in a relative frequency of 5.83%.
3 To obtain these results, Bijman and Hanisch (2018) was consulted for the firms Nestlé, Danone, FrieslandCampina, Arla Foods, Unilever, DMK, Sodiaal and Savencia. Results for Bel Group, Royal A-ware and DOC Kaas B.A. were obtained by consulting firms’ disclosure (Bel Group, 2017; DOC Kaas B.A., 2019; Royal A-ware, 2019b)

43
Table 16. Comparing private firms and cooperatives on code level
A weighted average was calculated in order to make the results comparable, as is presented in Table 17. The averages were calculated by dividing the number of words devoted on CSR by the number of firms. For example, the average for a private firm was calculated by dividing 25,913 words by 6 firms.
Table 17. The weighted average of private firms and cooperatives
Firms Number of firms Number of words on CSR
Average number of words on CSR
Private firms 6 25,913 4,319 Cooperatives 4 7,731 1,933
Based on Table 16 and Table 17 the following observations can be made:
- On average, a private firm disclosed 4,319 words on CSR - On average, a cooperative disclosed 1,933 words on CSR - Private firms devoted 1.45% of their CSR on animal welfare while, cooperatives devoted 6.70
% of their CSR on animal welfare - Private firms devoted 7.01% of their CSR on supply chain while, cooperatives devoted 4.62%
of their CSR on supply chain - Private firms devoted 5.75% of their CSR on condition of employment while, cooperatives
devoted 3.39% of their CSR on condition of employment - Private firms devoted 5.82% of their CSR on equality while, cooperatives devoted 3.26% of
their CSR on equality
Code Number of words disclosed by private firms
Number of words disclosed by cooperatives
% Number of words
% Number of words
Consumption 5.83% 1,511 4.98% 385 Discharge 2.98% 773 1.90% 147 Environmental and Social policies 8.48% 2,197 8.28% 640 Environmental certification 2.03% 527 3.25% 251 Environmental improvements 7.44% 1,928 8.49% 656 Environmental objectives and follow-ups
4.30% 1,113 6.33%
489
The firm’s effect on the environment
5.58% 1,447 4.97%
384
Animal welfare 1.45% 375 6.70% 518 Charity and sponsoring 1.70% 441 1.63% 126 Code of conduct 4.16% 1,079 5.39% 417 Human rights 6.30% 1,633 7.79% 602 Investments 2.47% 641 1.13% 87 Safety and effect of the product 9.41% 2,438 10.09% 780 Supply chain 7.01% 1,817 4.62% 357 Change in number of employees 1.19% 309 0.91% 70 Conditions of employment 5.75% 1,491 3.39% 262 Education 9.11% 2,360 8.96% 693 Equality 5.82% 1,508 3.26% 252 Firm’s values 2.91% 754 1.94% 150 Health and safety of employees 6.06% 1,571 6.01% 465 Total 100,00% 25,913 100,00% 7,731

44
Based on these tables, one could observe that the private firms were disclosing more than the cooperatives. This is in line with proposition 3b. Furthermore, one could state that regarding the content private firms and cooperatives differ.
45
6. Discussion This chapter elaborates on the results and compares these results with the literature presented in chapter three. In addition, this chapter provides possible explanations of the deviation between the results and the literature as is presented in section 6.1. Subsequently, section 6.2 discusses various limitations regarding the research design, the data analysis, the sample, and the use of secondary source.
6.1. Comparing results with proposition
This study investigated three determinants and their influence on CSR disclosure directly, and CSR strategy indirectly. Firstly, the literature indicates that the extent of CSR disclosure is related to firm size, as larger firms are disclosing more information on CSR compared to smaller firms (Graafland et al., 2003; Marín et al., 2012; Perrini et al., 2007). Larger firms are more visible to the public and therefore, under higher levels of scrutiny by society (Graafland et al., 2003; Marín et al., 2012). Therefore, they might be forced to disclose their CSR strategy to a greater extent. However, according to Udayasankar (2008), this might be too premature to state. She reasons that, although motivations between the firms can differ, firms of different sizes could be equally motivated to engage in CSR activities. Udayasankar (2008) draws limitations on the current explanation of the concept firm size and states that firm size is a multi-dimensional construct. Therefore, Udayasankar (2008) reasons that the relationship between firm size and CSR is U-shaped, which implies that both small and large firms engage more in CSR, than medium-sized firms. From the results presented in Figure 5, one could obtain that the trendline suggests that there might be a positive relationship between firm size and the number of words disclosed. In other words, the results from the trendline suggest that larger firms are more likely to disclose more information on CSR. However, the majority of the results of the individual firms are not in line with the proposition stated in chapter three. To illustrate, Royal A-ware had a lower annual dairy turnover than DMK Group and Sodiaal. Nonetheless, Royal A-ware disclosed more words on CSR. Secondly, comparing DMK Group and Sodiaal to Unilever and Savencia, the former group disclosed fewer words on CSR than the latter. Comparing these results among each other, one could remark that DMK Group and Sodiaal are cooperatives while Unilever, Savencia and Royal A-ware are private firms. Besides, it is remarkable to notice that one of the smallest firms, namely the Bel Group, disclosed the second highest number of words among all firms. Due to these scattered results, the suggestions made by the trendline have to be interpreted carefully. In sum, a majority of the individual results are contradicting the proposition that firm size and CSR are positively related, and only the trendline of Figure 5 suggests that the proposition might hold. Results from Figure 5, however, do not suggests that the relationship between firm size and CSR disclosure is convex, as was proposed by (Udayasankar, 2008).
Alternatively, the differences between those firms, as is presented in Figure 5, might be explained due to different organisational cultures. This is plausible to assume since literature indicates that organisational culture may affect CSR (Lee & Kim, 2017). Organisational culture represents the shared believes and values within a firm (Lee & Kim, 2017). One could argue that these shared believes and values are different between private firms and cooperatives, because of deviating primary functions. To elaborate on, private firms are solely focussed on making profits, while cooperatives have to bear in mind members’ interests and making profits at the same time.
Next to firm size, chapter three also proposed that corporate governance might influence CSR disclosure. By the use of three metrics, namely board size, female board members and independent board members, corporate governance was investigated for the European dairy industry. Literature proposed that larger boards, more female board members and more independent board members are positively related to CSR (Webb, 2004). From Figure 6, Figure 7, and Figure 8 one could obtain that the trendline suggests a positive relationship between board size, female board members and independent board members on the one hand, and CSR disclosure on the other hand. In other words, when a firm had a larger board, a higher percentage of female or a higher percentage of independent board members, they were might be likely to disclose more information on CSR. However, the majority

46
of the individual results are not in line with the propositions stated in chapter three. To illustrate, Danone had the highest percentage of female board members but disclosed less on CSR than Nestlé, FrieslandCampina, Arla Foods, Unilever, Savencia and Bel Group. Due to these scattered results, the suggestions made by the trendline have to be interpreted carefully. Furthermore, two remarkable results were obtained from Figure 7 and Figure 8. Firstly, Figure 7 indicates that all private firms except for Royal A-ware, have a higher percentage of female board members compared to the cooperatives. These results imply that private firms are employing more females within their governance bodies, than cooperatives. The results of this study contradict earlier studies, which stated that cooperatives might employ less female members than private firms (Mateos et al., 2009, as cited in Hernández-Nicolás et al., 2019) This might be explained by the fact that private firms and cooperatives have different organisational cultures, as is explained earlier. Secondly, Figure 8 indicates that all the private firms had a higher percentage of independent board members compared to the cooperatives. This might be explained by the fact that board members in the supervisory board of the cooperative firm are often farmer members of the cooperative. In sum, a majority of the results are contradicting the propositions. Only the trendlines in Figure 6, Figure 7 and Figure 8 suggest that corporate governance and CSR disclosure might be positively related.
Lastly, chapter three proposed ownership as a possible determinant for CSR disclosure. In order to investigate ownership, the concept was divided in ownership structure and ownership identity. Based on the literature, this study proposed that ownership structure, measured via ownership concentration, is positively related to CSR disclosure (Oh et al., 2011; Prado-Lorenzo et al., 2009). To put it differently, more concentrated firms are disclosing more information on CSR. The trendline in Figure 9 suggests that ownership concentration and the number of words disclosed on CSR might be positively related. However, this trend was only observed at the private firms and are in line with the reasoning proposed by Dam and Scholtens (2013). Secondly, the influence of ownership identity was investigated in the case of the European dairy industry. Based on the literature, this study proposed that cooperatives, due to their membership structure, are disclosing less information on CSR than private firms. Findings from this study suggest that private firms disclose on average more words on CSR than cooperatives, as is indicated in Table 17. Furthermore, Table 16 presents the relative frequencies of the codes between private firms and cooperatives. Observing this table, four remarkable results were identified. Cooperatives disclosed relatively more on animal welfare than private firms. On the contrary, private firms disclosed relatively more on supply chain, condition of employment and equality than cooperatives. The difference in animal welfare disclosure might be explained by the closeness of the cooperatives to the farmers. Possibly, supply chain is increasingly important for global dairy firms, since especially global dairy firms have to interact with a multitude of suppliers. However, with the results of this study, it is hard to conclude that private firms disclosed more on supply chain due to their global focus, since cooperatives such as FrieslandCampina and Arla Foods have a global focus as well. Remarkably, the results showed that all private firms (except for Royal A-ware) have a higher percentage of females in their boards. In line with these results is the observation that private firms disclosed more on the code equality than cooperatives. This might suggest that private firms are more engaged in issues related to equality. As said before, it is difficult to offer a detailed explanation why private firms and cooperatives differ on this aspect, but the differences might be explained by different organisational cultures. In sum, a majority of the results are contradicting the propositions of this study. The trendline, between ownership concentration and private firms, suggests a positive relationship.
Concluding this section, deviation of the results from the literature might be explained by the explanatory power of the three determinants. Since this study focussed solely on firm characteristic, it included only determinants which can be characterised as such. However, one could reason that in case of boundary-crossing research, other components such as national culture could impact firm’s CSR strategy. To illustrate, multiple researchers found that national culture influences CSR (Gjølberg, 2009; Halkos & Skouloudis, 2017; Ho, Wang, & Vitell, 2012; Ringov & Zollo, 2007). Furthermore, researchers found that the social, political and economic context in which firms have to act, could influence CSR (Gjølberg, 2009; Matten & Moon, 2008). For both national culture and context factors,

47
no empirical evidence was found within the study objects. The upcoming section elaborates on the limitations of this study.
6.2 Limitations
This study encounters a variety of limitations, which are related to the research design and sample size, the sample, data collection and analysis methods. Firstly, although multiple case studies are strong designs to investigate phenomena in depth, they are lacking external validity (de Vaus, 2013). Case studies lack external validity since the selected cases are not a representative overview of the population, thereby hindering the extrapolation of the results from case studies to the wider population. Although the lack of external validity is troublesome for this study, one must recall the objective of this study: broadening our understanding on the relationship between firm characteristics and CSR strategy. Therefore, this study does not aim to achieve statistical generalization, but theoretical generalization. The former is focussed on generalizing findings to a wider population, while the latter is focussed on unravelling how the case is related to the theory (de Vaus, 2013). To emphasize, this study aims to explore the relationship between firm characteristics and CSR strategy in the European dairy industry. In order to accomplish theoretical generalization, the number of selected cases should be sufficient. In qualitative studies, sufficiency is reached when the sample is saturated. Saturation is reached when the researcher is discovering no or very little new information from the respondents (Beech, 2015). In order to reach saturation, a wide of variety firms was included at first instance. This study tried, for example, to establish contact with four small dairy firms in the Netherlands. As these four firms did not disclose a corporate report, the firm’s CSR strategy could be obtained by interviewing relevant managers. Although these firms were approached to participate in this study, they rejected the invitation. Therefore, this study was restricted to include only firms which published corporate reports. To achieve a more divers sample, the top 25 Dutch dairy firms was consulted. Firms which were both European and published corporate reports were included. As a result, the sample was expanded with 3 extra firms. These firms are still considered large but are smaller than the firms obtained from the top 10 European dairy firms, resulting in a more divers sample. Although this study expanded its sample within the possibilities of this research, it is questionable that this study reached saturation. It is assumed that saturation was not reached due to the scattered results. From these scattered results one could expect that including more firms might reveal other results. Secondly, the sample is limited due to the way of sample selection. As stated above, this study chose to include 8 European dairy firms and 3 smaller dairy firms, in order to obtain a representative overview of the European dairy industry. Reflecting upon this choice, this study could have employed a strategic sampling method, by for example using extremes. To illustrate, firm A would be a large firm, with a large board, a high percentage of female, a high percentage of independent board members, high ownership concentration and ownership identity private. In order to explore the effect of for example firm size, a comparable firm should be selected. However, Firm B should be a small firm instead of a large firm. Employing such a strategic sampling method could have increased the variety within the sample. Besides, a high variety sample is more suitable than a representative sample, due to the exploratory of nature of this study. As a consequence of selecting such a sampling method, the number of dairy firms should be expanded in order to represent each extreme. This implies that the workload would increase significantly. Alternatively, instead of expanding the number of firms, the conceptual framework could be simplified. For example, measuring corporate governance and ownership via one metric instead of three and two respectively. However, as can be concluded from chapter three, it is desirable to use multiple metrics to describe these firm characteristics. Furthermore, decreasing the number of metrics might implicate a loss of valuable information.
Thirdly, the reliability and validity of this study may be troublesome due to the use of the content analysis. Reliability during a content analysis is often accomplished by the use of multiple researchers during the coding process (Guthrie et al., 2004). Preferably, multiple researchers are used during the content analysis since it reduces the subjectivity (Deegan and Rankin, 1996; Frost and Wilmshurst, 2000, as cited by Guthrie et al., 2004). However, analysing and coding the different

48
corporate reports in this study was done by one researcher. Only one researcher performed the content analysis since it was difficult to arrange multiple researchers who were willing to analyse the vast amount of corporate reports. Even though this lack of inter-rater reliability constitutes a major drawback in this study, especially as this study is focussed on content analysis, the need for multiple researcher is reduced by establishing well-defined coding tools (Guthrie et al., 2004), as presented in Appendix F. Furthermore, in order to reduce this limitation, the coding process was executed in two cycles, as described in the methodology.
Fourthly, this study heavily relies on corporate reports, as this is the primary source of data collection. One of the biggest implications of the use of this type of secondary data is that the researchers have no direct control over the quality of the data (Beech, 2015). Due to this limitation, it has been considered to apply triangulation, as obtaining data via multiple sources could have yielded a better understanding of the phenomenon under study (Beech, 2015), in this case CSR strategy. Triangulation concerning obtaining data regarding CSR strategy, could possibly have been achieved by obtaining the firm’s CSR strategy via primary sources. One of these primary sources could have constituted interviews with relevant managers in the investigated firms. It was assessed that arranging interviews with relevant managers of investigated firms in this study would however not have been attainable, given this study’s time constraints. Also, interviewing relevant managers of firms which published a corporate report, might not have offered different insights to those already provided by the corporate report as one could reason that the interviewee could disclose the same information as published in the corporate reports. Triangulation could also possibly have been obtained in this study by using media such as newspapers and webpages to reveal firm’s CSR strategy, as these types of media are seen as means of reflection and arbiter of legitimacy (Deephouse & Suchman 2008; King & Haveman 2008, as cited in Lyon & Montgomery, 2013). However, this only holds when media are strong and well-organised, and therefore not subjected to firm’s corporate power (Campbell, 2007, as cited in Lyon & Montgomery, 2013). One could argue that not all media are established in such manner that corporate power can be persuaded, due to which firms may only use media to position themselves advantageously (Carroll & McCombs, 2003, as cited in Lyon & Montgomery, 2013). As a consequence, drawing unbiased conclusions from these media expressions regarding the firm’s CSR strategy would be difficult. Given these reasons, it has been decided not to apply triangulation in this study. Also, as elaborated in chapter four, CSR reports have been selected as method of exploring CSR strategy as these reports are a useful source of information regarding the firms under study (Guthrie et al., 2004; Lu & Abeysekera, 2014). Adding to that, the majority of the corporate reports used to base these study’s findings on, were assessed by independent auditors which increases corporate report’s credibility. These lines of reasoning combined with the mainly exploratory nature of this study, led to the assessment to use merely corporate reports to reveal firm’s CSR strategy. However, for future studies in the domain of CSR strategy and CSR disclosure it might be worthwhile to apply triangulation as this could increase the study’s reliability.
49
7. Conclusion This chapter presents in section 7.1 the conclusions which can be drawn from this study. Section 7.2 elaborates on the contribution of the results while presenting the study’s implications in the same section. Moreover, section 7.2 explores the possibilities for future research as a consequence of this study.
7.1 Conclusion
This study aimed to explore the relationship between firm characteristics and CSR strategy. In order to answer the main research question, six sub-research questions were formulated which are related to a theoretical and empirical part of this study.
To answer the theoretical research questions, a literature study was conducted regarding CSR, CSR strategy and CSR disclosure. Firstly, this study tries to define CSR. The literature review revealed that researcher find it difficult to reach consensus on one universally accepted definition due to the complexity of this concept. The complexity is caused by the multifaceted nature of CSR, ambiguity of issues under consideration and the distinct agendas of the involved actors. As is indicated by literature, due to the complexity and industry related concerns, constructing a general definition of CSR may be undesirable. Although this might be the case, this study needed guidance on the domain of CSR. Therefore, this study chose to define CSR as the firm’s responsibility for their impact on society. In line with the definition of CSR, CSR strategy is defined as the long-term direction of firm’s responsibilities regarding their impact on society. CSR disclosure is defined as the process of providing information designed to discharge social accountability via annual reports, special publications or reports or even socially oriented advertising. This study proposes that CSR strategy and CSR disclosure are related to each to other, since CSR disclosure offers firms the possibility to publish CSR related information. However, the exact nature of this relationship remains unclear in this study. Literature was also used to find and select firm characteristics which are related to CSR strategy. Based on the rationale of the legitimacy and stakeholder theory, a multitude of determinants related to CSR were revealed. However, only three determinants were found suitable for this study, as this study only focusses on firm characteristics within one industry. These three firm characteristics are firm size, corporate governance and ownership.
Based on the selected firm characteristics three empirical research question were formulated and answered by conducting a content analysis of firms’ corporate reports. Although this study is limited in various ways, the content analysis revealed several differences between the European dairy firms’ CSR strategies. The results of this study might suggest that firm size is positively related to CSR strategy. This might imply that larger firms are likely to disclose more information on CSR than smaller firms. Corporate governance was measured via three metrics, namely number of board members, percentage of female board members and percentage of independent board members. Results might suggest that number of board members, percentage of female board members and percentage of independent board members are positively related to CSR strategy. This might imply that firms with larger boards, more female board members, or more independent board members are likely to disclose more information on CSR, compared to firms with smaller board, less female board members, or less independent board members. Lastly, ownership was measured via ownership structure and ownership identity. Ownership structure is only assessed for private firms as cooperatives are dispersed. Results regarding ownership structure might suggest that it is positively related to CSR strategy. This result implies that more concentrated private firms are likely to disclose more information on CSR compared to less concentrated firms. Furthermore, the results suggest that the number of words disclosed on CSR are related to the ownership identity of the firm. These results might indicate that private firms disclose more on average on CSR than cooperatives. All in all, the results of this study suggest that firm size, corporate governance and ownership are related to the CSR strategies of European dairy firms.
50
7.2 Contributions, future research and implications
This study might contribute to existing literature, by providing a detailed literature review on CSR, CSR strategy and CSR disclosure. This review might contribute to theory, as it revealed that current literature still is divided with respect to the definitional construct of CSR. It contributed by proposing that constructing one general CSR definition might be undesirable. Future research might be interested to formulate generally accepted guidelines on CSR, while empowering firms to construct industry specific CSR definitions. Moreover, by reviewing CSR disclosure literature, it was found that three firm characteristics -firm size, corporate governance, ownership- might influence CSR strategy, as in the case of this study the European dairy industry. These findings might inspire future studies in their exploration of the relationship between firm characteristics and CSR strategy in order to see whether these findings also hold for other industries. Besides exploration of this topic in other industries, future studies might focus on quantifying the findings presented in this study for the European diary industry. This could enable researchers to draw solid conclusions regarding the relationship between firm characteristics and CSR strategy in the European dairy industry. Furthermore, this study contributed to existing literature, by investigating the differences between private firms and cooperatives. The results of this study indicate remarkable differences between private firms and cooperatives in terms of female representation in governance bodies. These findings might inspire future research to explore in depth the differences between cooperatives and private firms regarding female representation in governance bodies. Adding to that, the results of this study revealed that there is a difference in the average number of words disclosed on CSR between private firms and cooperatives. Future research might be interested to quantify these results, in order to establish a relationship between ownership identity and CSR strategy. Lastly, as indicated in the literature review, the exact relationship between CSR disclosure and CSR strategy remains unclear in this study. Future research might be interest in investigating the discrepancy between what is disclosed and what is done by the firms. By identifying the discrepancy between those two concepts, researchers might be better able to investigate how CSR strategy is influenced.
The results of this study might have implications for firms in the European dairy industry. Firstly, the differences in terms of their disclosure, might be explained by the fact that cooperatives are less equipped in communicating their CSR strategy to stakeholders. If cooperatives fail to communicate their CSR strategy, it might have implications for their legitimacy in society and eventually their competitive position within the dairy industry. Therefore, it might be interesting for cooperatives’ managers to investigate how they could improve their CSR disclosure. Secondly, it might be interesting for both the private firms and cooperatives to reflect upon their corporate governance composition. As this study indicates that certain compositions might influence CSR disclosure and thus the ability of firms to legitimize their behaviour via CSR. To be more concrete, by appointing more female or independent board members firms might influence CSR disclosure. Lastly, the insights provided by this study might be interesting for European dairy managers in general as creates understanding on the complexity of CSR and how CSR strategy might be influenced.

51
References Adams, C. A. (2002). Internal organisational factors influencing corporate social and ethical reporting:
Beyond current theorising. Accounting, Auditing & Accountability Journal. https://doi.org/10.1108/09513570210418905
Adams, C. A., Hill, W. Y., & Roberts, C. B. (1998). Corporate social reporting practices in western europe: Legitimating corporate behaviour? British Accounting Review. https://doi.org/10.1006/bare.1997.0060
Ali, W., Frynas, J. G., & Mahmood, Z. (2017). Determinants of Corporate Social Responsibility (CSR) Disclosure in Developed and Developing Countries: A Literature Review. Corporate Social Responsibility and Environmental Management. https://doi.org/10.1002/csr.1410
Arla Foods. (2017). Consolidated Annual Report 2017, Driving innovation in dairy. Retrieved from http://docs.arla.com/annual-report/2017/EN/#/
Beech, J. (2015). Doing your business research project. Sage.
Bel Group. (2017). 2017 Registration Document including the Annual Financial report. Retrieved from https://www.groupe-bel.com/wp-content/uploads/2018/04/bel-2017-registration-document.pdf
Bhattacharya, C. B., & Sen, S. (2004). Doing Better at Doing Good: When, Why, and How Consumers Respond to Corporate Social Initiatives. California Management Review. https://doi.org/10.2307/41166284
Bijman, J., & Hanisch, M. (2018). Living apart together: How are member–cooperative relationships changing within European dairy cooperatives? Berlin Cooperative Papers, (71).
Bijman, J., Hanisch, M., & van der Sangen, G. (2014). Shifting control? The changes of internal governance in agricultural cooperatives in the EU. Annals of Public and Cooperative Economics. https://doi.org/10.1111/apce.12055
Branco, M. C., & Rodrigues, L. L. (2006). Communication of corporate social responsibility by Portuguese banks: A legitimacy theory perspective. Corporate Communications. https://doi.org/10.1108/13563280610680821
Bretos, I., & Marcuello, C. (2017). REVISITING GLOBALIZATION CHALLENGES AND OPPORTUNITIES IN THE DEVELOPMENT OF COOPERATIVES. Annals of Public and Cooperative Economics. https://doi.org/10.1111/apce.12145
Cambridge Dictionairy. (2019a). Characteristic. Retrieved from https://dictionary.cambridge.org/dictionary/english/characteristic#cald4-1-2-1
Cambridge Dictionairy. (2019b). Ownership.
Carroll, A. B. (1979). A Three-Dimensional Conceptual Model of Corporate Performance. Academy of Management Review. https://doi.org/10.5465/AMR.1979.4498296
Carroll, A. B. (1999). Corporate social responsibility: Evolution of a definitional construct. Business and Society. https://doi.org/10.1177/000765039903800303
Carroll, A. B., & Shabana, K. M. (2010). The business case for corporate social responsibility: A review of concepts, research and practice. International Journal of Management Reviews. https://doi.org/10.1111/j.1468-2370.2009.00275.x
Chan, M. C. C., Watson, J., & Woodliff, D. (2014). Corporate Governance Quality and CSR Disclosures. Journal of Business Ethics. https://doi.org/10.1007/s10551-013-1887-8
Cormier, D., Magnan, M., & Van Velthoven, B. (2005). Environmental disclosure quality in large
52
German companies: Economic incentives, public pressures or institutional conditions? European Accounting Review. https://doi.org/10.1080/0963818042000339617
Dahlsrud, A. (2008). How corporate social responsibility is defined: An analysis of 37 definitions. Corporate Social Responsibility and Environmental Management. https://doi.org/10.1002/csr.132
Dam, L., & Scholtens, B. (2012). Does Ownership Type Matter for Corporate Social Responsibility? Corporate Governance: An International Review. https://doi.org/10.1111/j.1467-8683.2011.00907.x
Dam, L., & Scholtens, B. (2013). Ownership Concentration and CSR Policy of European Multinational Enterprises. Journal of Business Ethics, 118(1), 117–126. https://doi.org/10.1007/s10551-012-1574-1
Danone. (2017). Danone ONE PLANET. ONE HEALTH. Retrieved from http://danone-danonecom-prod.s3.amazonaws.com/Danone-RA2017-EN-PDF-e-accessible_02.pdf
Danone. (2018a). 2017 Registration Document Annual Financial Report. Retrieved from http://danone-danonecom-prod.s3.amazonaws.com/Danone_-_Registration_Document_2017.pdf
Danone. (2018b). By Laws. Retrieved from https://www.danone.com/content/dam/danone-corp/investors/en_buy_laws/2018/bylaws/Statuts au 7 juin 2018 VA.pdf
de Vaus, D. (2013). Research Design in Social Research. Sage.
Delasalle, J., & Plume, A. (2016). Your metrics questions answered: Q&A from research impact metrics for librarians webinar. Retrieved from https://libraryconnect.elsevier.com/articles/your-metrics-questions-answered-qa-research-impact-metrics-librarians-webinar
DMK. (2017). Combined Annual Report and Sustainability Report 2016. Retrieved from https://www.dmk.de/fileadmin/redaktion/presse/publikationen/dmk/DMK_GROUP_Combined-annual-report-and-sustainability-report-2016.pdf
DMK. (2018). Finance Brochure. Retrieved from https://www.dmk.de/en/press/publications/?no_cache=1
DMK. (2019). Managing Bodies. Retrieved from https://www.dmk.de/en/dmk-group/managing-bodies/
DOC Kaas B.A. (2017). Jaarverslag 2017.
DOC Kaas B.A. (2019). Coöperatie. Retrieved from https://www.dockaas.nl/nl/doc-kaas/coperatie/
Donaldson, T., Preston, L. E., & Preston, L. E. E. E. (1995). Theory the Stakeholder of the Concepts , Evidence , Corporation : and Implications. Academy of Management. https://doi.org/10.2307/258887
EDA. (2017). Annual Report 2016/17.
EDA. (2018). Economic Report 2017/2018. Retrieved from http://eda.euromilk.org/fileadmin/user_upload/Public_Documents/Facts_and_Figures/EDA_Economic_Report_2017.pdf
Erlingsson, C., & Brysiewicz, P. (2017). A hands-on guide to doing content analysis. African Journal of Emergency Medicine. https://doi.org/10.1016/j.afjem.2017.08.001
European Commission. (2000). THE ENVIRONMENTAL IMPACT OF DAIRY PRODUCTION IN THE EU.
European Commission. (2005). Commission Recommendation of 15 February 2005 on the role of non-executive or supervisory directors of listed companies and on the committees of the

53
(supervisory) board.
European Commission. (2008). COMMUNICATION FROM THE COMMISSION on the European Competitiveness Report 2008. Retrieved from http://ec.europa.eu/transparency/regdoc/rep/1/2008/EN/1-2008-774-EN-F1-1.Pdf
European Commission. (2011). COMMUNICATION FROM THE COMMISSION TO THE EUROPEAN PARLIAMENT, THE COUNCIL, THE EUROPEAN ECONOMIC AND SOCIAL COMMITTEE AND THE COMMITTEE OF THE REGIONS A renewed EU strategy 2011-14 for Corporate Social Responsibility. Retrieved from https://www.employment.gov.sk/files/slovensky/ministerstvo/spolocenska-zodpovednost/new-communication-on-csr-2011-2014.pdf
European Commission. (2012). The Common Agricultural Policy: a story to be continued. Retrieved from http://ec.europa.eu/agriculture/50-years-of-cap/files/history/history_book_lr_en.pdf
European Commission. (2017). Managing risk in the dairy sector: how futures markets could help. Retrieved from https://ec.europa.eu/agriculture/sites/agriculture/files/markets-and-prices/market-briefs/pdf/11_en.pdf
European Commission. (2018). The Nitrates Directive. Retrieved from http://ec.europa.eu/environment/water/water-nitrates/index_en.html
European Commission. (2019). What is a SME? Retrieved from http://ec.europa.eu/growth/smes/business-friendly-environment/sme-definition_en
European Parliament. (2018). The EU’s organic food market: facts and rules (infographic).
Eurostat. (2017). Production and use of milk: EU-28. Retrieved from https://ec.europa.eu/eurostat/statistics-explained/index.php?title=File:Production_and_use_of_milk,_EU-28,_2017_(million_tonnes).png
Food and Agricultural Organization. (2017). Food Outlook 2017. Retrieved from http://www.fao.org/3/CA0239EN/ca0239en.pdf
FrieslandCampina. (2017). Annual Report 2017. Retrieved from https://www.frieslandcampina.com/app/uploads/sites/2/2018/02/FrieslandCampina-Annual-Report-2017.pdf
FrieslandCampina. (2019). Organogram. Retrieved from https://www.frieslandcampina.com/en/organogram/
Gjølberg, M. (2009). Measuring the immeasurable? Constructing an index of CSR practices and CSR performance in 20 countries. Scandinavian Journal of Management, 25(1), 10–22.
Global Reporting Initiative. (2019). About GRI. Retrieved from https://www.globalreporting.org/information/about-gri/Pages/default.aspx
Graafland, J., Van de Ven, B., & Stoffele, N. (2003). Strategies and Instruments for Organising CSR by Small and Large Businesses in the Netherlands. Journal of Business Ethics. https://doi.org/10.1023/A:1026240912016
Graves, S. B., & Waddock, S. A. (1994). Institutional owners and corporate social performance. Academy of Management Journal, 37(4).
Gray, R., Kouhy, R., & Lavers, S. (1995). Constructing a research database of social and environmental reporting by UK companies. Accounting, Auditing & Accountability Journal, 8(2), 78–101.
Guthrie, J., Petty, R., Yongvanich, K., & Ricceri, F. (2004). Using content analysis as a research method to inquire into intellectual capital reporting. Journal of Intellectual Capital.
54
https://doi.org/10.1108/14691930410533704
Halkos, G., & Skouloudis, A. (2017). Revisiting the relationship between corporate social responsibility and national culture: A quantitative assessment. Management Decision. https://doi.org/10.1108/MD-12-2016-0868
Haniffa, R. M., & Cooke, T. E. (2005). The impact of culture and governance on corporate social reporting. Journal of Accounting and Public Policy. https://doi.org/10.1016/j.jaccpubpol.2005.06.001
Hernández-Nicolás, C. M., Martín-Ugedo, J. F., & Mínguez-Vera, A. (2019). The effect of gender diversity on the board of Spanish agricultural cooperatives on returns and debt: An empirical analysis. Agribusiness. https://doi.org/10.1002/agr.21608
Ho, F. N., Wang, H. M. D., & Vitell, S. J. (2012). A Global Analysis of Corporate Social Performance: The Effects of Cultural and Geographic Environments. Journal of Business Ethics. https://doi.org/10.1007/s10551-011-1047-y
ICA. (2018). Cooperatives. Retrieved from https://www.ica.coop/en/cooperatives/cooperative-identity
Johnson, G., Whittington, R., & Scholes, K. (2012). Fundamentals of Strategy 2nd Edition.
Kamer van Koophandel. (2019). One-tier of two-tier als bestuursmodel (One-tier or two-tier as governance model). Retrieved from https://ondernemersplein.kvk.nl/one-tier-of-two-tier-board-als-bestuursmodel/
Kumar, R. (2012). Research Methodology: A Step-by-step Guide for Beginners. Nurse Education in Practice. https://doi.org/10.1016/j.nepr.2011.11.008
Lee, M., & Kim, H. (2017). Exploring the organizational culture’s moderating role of effects of corporate social responsibility (CSR) on firm performance: Focused on corporate contributions in Korea. Sustainability (Switzerland). https://doi.org/10.3390/su9101883
Lopatta, K., Jaeschke, R., Canitz, F., & Kaspereit, T. (2017). International Evidence on the Relationship between Insider and Bank Ownership and CSR Performance. Corporate Governance: An International Review. https://doi.org/10.1111/corg.12174
Loureiro, M. L., McCluskey, J. J., & Mittelhammer, R. C. (2001). Assessing Consumer Preferences for Organic, Eco-labeled, and Regular Apples. Journal of Agricultural and Resource Economics. https://doi.org/10.2307/40987117
Lu, Y., & Abeysekera, I. (2014). Stakeholders’ power, corporate characteristics, and social and environmental disclosure: Evidence from China. Journal of Cleaner Production. https://doi.org/10.1016/j.jclepro.2013.10.005
Lyon, T. P., & Montgomery, A. W. (2013). Tweetjacked: The Impact of Social Media on Corporate Greenwash. Journal of Business Ethics. https://doi.org/10.1007/s10551-013-1958-x
Maloni, M. J., & Brown, M. E. (2006). Corporate social responsibility in the supply chain: An application in the food industry. Journal of Business Ethics. https://doi.org/10.1007/s10551-006-9038-0
Marimon, F., Alonso-Almeida, M. D. M., Rodríguez, M. D. P., & Cortez Alejandro, K. A. (2012). The worldwide diffusion of the global reporting initiative: What is the point? Journal of Cleaner Production. https://doi.org/10.1016/j.jclepro.2012.04.017
Marín, L., Rubio, A., & de Maya, S. R. (2012). Competitiveness as a Strategic Outcome of Corporate Social Responsibility. Corporate Social Responsibility and Environmental Management. https://doi.org/10.1002/csr.1288

55
MarketScreener. (2019a). Nestlé (NESN).
MarketScreener. (2019b). Savencia (SAVE).
MarketScreener. (2019c). Unilever (NL) (UNA). Retrieved from https://www.marketscreener.com/UNILEVER-NL-6290/?type_recherche=rapide&mots=unilever
MarketScreener. (2019d). Unilever (ULVR).
MarketScreeners. (2019). Fromageries Bel (FBEL). Retrieved from https://www.marketscreener.com/FROMAGERIES-BEL-5424/company/
Marquis, C., & Lee, M. (2013). Who is governing whom? Executives, governance, and the structure of generosity in large U.S. firms. Strategic Management Journal. https://doi.org/10.1002/smj.2028
Matten, D., & Moon, J. (2008). “Implicit” and “explicit” CSR: A conceptual framework for a comparative understanding of corporate social responsibility. Academy of Management Review. https://doi.org/10.5465/AMR.2008.31193458
McWilliams, A., & Siegel, D. (2001). Corporate social responsibility: A theory of the firm perspective. Academy of Management Review. https://doi.org/10.5465/AMR.2001.4011987
Ministerie van Landbouw Natuur en Voedselkwaliteit. (2008). Convenant Schone en Zuinige Agrosectoren. Retrieved from https://www.rvo.nl/sites/default/files/bijlagen/Convenant Schone en Zuinige Agrosectoren Agroconvenant.pdf
Mohamed Adnan, S., Hay, D., & van Staden, C. J. (2018). The influence of culture and corporate governance on corporate social responsibility disclosure: A cross country analysis. Journal of Cleaner Production. https://doi.org/10.1016/j.jclepro.2018.07.057
Montecchia, A., Giordano, F., & Grieco, C. (2016). Communicating CSR: integrated approach or Selfie? Evidence from the Milan Stock Exchange. Journal of Cleaner Production. https://doi.org/10.1016/j.jclepro.2016.01.099
MSCI. (2019). ESG INTEGRATION. Retrieved from https://www.msci.com/esg-integration
myNewsDesk. (2019). Empowering Bangladeshi women to bike nutrition to their nation. Retrieved from http://www.mynewsdesk.com/arla-foods/pressreleases/empowering-bangladeshi-women-to-bike-nutrition-to-their-nation-2845321
Nestlé. (2017a). Annual Review 2017: Nestlé enhancing quality of life and contributing to a healthier future. Retrieved from https://www.nestle.com/asset-library/documents/library/documents/annual_reports/2017-annual-review-en.pdf
Nestlé. (2017b). Financial Statements 2017. Retrieved from https://www.nestle.com/asset-library/documents/library/documents/financial_statements/2017-financial-statements-en.pdf
Nestlé. (2018). Corporate Governance Report 2017 Compensation Report 2017 Articles of Association of Nestlé S.A. Retrieved from https://www.nestle.com/asset-library/documents/library/documents/corporate_governance/corp-governance-report-2017-en.pdf
NIBC. (n.d.). Front Page. Retrieved from https://www.nibc.com/about-nibc/sustainability/
Oh, W. Y., Chang, Y. K., & Martynov, A. (2011). The Effect of Ownership Structure on Corporate Social Responsibility: Empirical Evidence from Korea. Journal of Business Ethics. https://doi.org/10.1007/s10551-011-0912-z
Perrini, F., Russo, A., & Tencati, A. (2007). CSR strategies of SMEs and large firms. Evidence from Italy. Journal of Business Ethics. https://doi.org/10.1007/s10551-006-9235-x
Prado-Lorenzo, J. M., Gallego-Alvarez, I., & Garcia-Sanchez, I. M. (2009). Stakeholder engagement

56
and corporate social responsibility reporting: The ownership structure effect. Corporate Social Responsibility and Environmental Management. https://doi.org/10.1002/csr.189
Rabobank. (2016). Rabobank World Dairy Map. Retrieved from https://research.rabobank.com/far/en/sectors/dairy/World-Dairy-Map-2016.html
Rabobank. (2018). Global Dairy Top 20. Retrieved from https://www.rabobank.com/en/press/search/2018/20180726-global-dairy-top-20-a-shuffling-of-the-deck-chairs.html
Ringov, D., & Zollo, M. (2007). The impact of national culture on corporate social performance. Corporate Governance: The International Journal of Business in Society. https://doi.org/10.1108/14720700710820551
RobecoSAM. (2019). Benefit from an independent assessment of your company’s sustainability performance. Retrieved from https://www.robecosam.com/csa/csa-resources/how-to-get-assessed.html#1
Royal A-ware. (2017). ROYAL A-WARE BOEKT IN 2017 WEER EEN PRIMA RESULTAAT. Retrieved from https://www.royal-aware.com/nl/over-royal-a-ware/nieuws/royal-a-ware-boekt-in-2017-weer-een-prima-resultaat/115
Royal A-ware. (2019a). Organisatiestructuur. Retrieved from https://www.royal-aware.com/nl/over-royal-a-ware/organisatiestructuur
Royal A-ware. (2019b). Royal A-ware. Retrieved from https://www.royal-aware.com/nl/
Russo, A., & Perrini, F. (2010). Investigating stakeholder theory and social capital: CSR in large firms and SMEs. Journal of Business Ethics. https://doi.org/10.1007/s10551-009-0079-z
Saitone, T. L., & Sexton, R. J. (2017). Agri-food supply chain: evolution and performance with conflicting consumer and societal demands. European Review of Agricultural Economics. https://doi.org/10.1093/erae/jbx003
Salvioni, D. M., & Gennari, F. (2016). Corporate governance, ownership and sustainability. Corporate Ownership and Control. https://doi.org/10.22495/cocv13i2c3p8
Sarkar, S., & Searcy, C. (2016). Zeitgeist or chameleon? A quantitative analysis of CSR definitions. Journal of Cleaner Production. https://doi.org/10.1016/j.jclepro.2016.06.157
Savencia. (2017). 2017 Annual Report, Activity and Sustainable Development. Retrieved from http://www.savencia-fromagedairy.com/wp-content/uploads/2018/05/SAVENCIA_RA2017_GB_72Dpi_planche_digital.pdf
Savencia. (2019). Corporate Governance. Retrieved from http://www.savencia-fromagedairy.com/en/corporate-governance/
SER. (2019). IRBC Agreements - About this agreement.
Shaukat, A., Qiu, Y., & Trojanowski, G. (2016). Board Attributes, Corporate Social Responsibility Strategy, and Corporate Environmental and Social Performance. Journal of Business Ethics. https://doi.org/10.1007/s10551-014-2460-9
Sheehy, B. (2014). Defining CSR: Problems and Solutions. Journal of Business Ethics. https://doi.org/10.1007/s10551-014-2281-x
Soboh, R. A. M. E., Lansink, A. O., Giesen, G., & van Dijk, G. (2009). Performance measurement of the agricultural marketing cooperatives: The gap between theory and practice. Review of Agricultural Economics. https://doi.org/10.1111/j.1467-9353.2009.01448.x
Sodiaal. (2017). 2017 Activity Report. Retrieved from https://www.sodiaal.fr/sodiaalfr/CMS/Files/Rapport annuel/RED_ANGLAIS_RA-

57
2018_AG_48p_BD.pdf
Sprinkle, G. B., & Maines, L. A. (2010). The benefits and costs of corporate social responsibility. Business Horizons. https://doi.org/10.1016/j.bushor.2010.05.006
Stemler, S. (2001). An Overview of Content Analysis Practical Assessment, Research and Evaluation. The Marketing Review. https://doi.org/10.1016/B978-0-12-386931-9.00014-3
Sutantoputra, A. W. (2009). Social disclosure rating system for assessing firms’ CSR reports. Corporate Communications. https://doi.org/10.1108/13563280910931063
Tacken, G. M. L., Banse, M., Batowska, A., Gardebroek, C., Nesha Turi, K., Wijnands, J. H. M., & Poppe, K. J. (2009). Competitiveness of the EU dairy industry. LEI WageningenUR.
Tagesson, T., Blank, V., Broberg, P., & Collin, S. O. (2009). What explains the extent and content of social and environmental disclosures on corporate websites: A study of social and environmental reporting in Swedish listed corporations. Corporate Social Responsibility and Environmental Management. https://doi.org/10.1002/csr.194
Trudel, R., & Cotte, J. (2009). Does it pay to be good? MIT Sloan Management Review, 50(2).
Turker, D. (2009). Measuring corporate social responsibility: A scale development study. Journal of Business Ethics. https://doi.org/10.1007/s10551-008-9780-6
Udayasankar, K. (2008). Corporate social responsibility and firm size. Journal of Business Ethics. https://doi.org/10.1007/s10551-007-9609-8
Unilever. (2017). Annual Report and Accounts 2017, Making Sustainable Living a Commonplace. Retrieved from https://www.unilever.nl/Images/unilever-annual-report-and-accounts-2017_tcm1351-518724_nl.pdf
Van der Krogt, D., Nilsson, J., & Høst, V. (2007). The impact of cooperatives’ risk aversion and equity capital constraints on their inter-firm consolidation and collaboration strategies-with an empirical study of the European dairy industry. Agribusiness. https://doi.org/10.1002/agr.20140
Van Loo, E. J., Diem, M. N. H., Pieniak, Z., & Verbeke, W. (2013). Consumer attitudes, knowledge, and consumption of organic yogurt. Journal of Dairy Science. https://doi.org/10.3168/jds.2012-6262
Varadarajan, R. (2010). Strategic marketing and marketing strategy: Domain, definition, fundamental issues and foundational premises. Journal of the Academy of Marketing Science. https://doi.org/10.1007/s11747-009-0176-7
Vilanova, M., Lozano, J. M., & Arenas, D. (2009). Exploring the nature of the relationship between CSR and competitiveness. In Journal of Business Ethics. https://doi.org/10.1007/s10551-008-9812-2
Webb, E. (2004). An examination of socially responsible firms’ board structure. Journal of Management and Governance. https://doi.org/10.1007/s10997-004-1107-0
ZuivelNL. (2017). Zuivel in cijfers 2017.
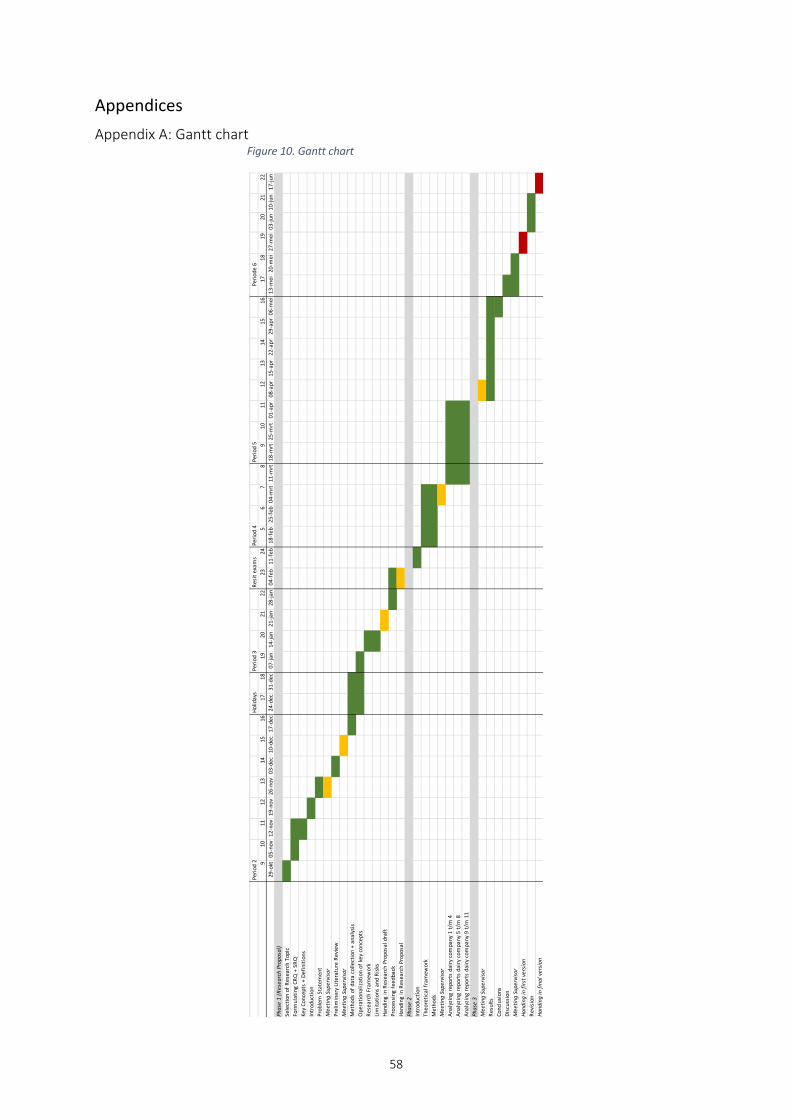
58
Appendices Appendix A: Gantt chart
Figure 10. Gantt chart
Perio
d 2
Holid
ays
Perio
d 3
Resi
t exa
ms
Perio
d 4
Perio
d 5
910
1112
1314
1516
1718
1920
2122
2324
56
78
910
1112
1314
1516
1718
1920
2122
29-o
kt05
-nov
12-n
ov19
-nov
26-n
ov03
-dec
10-d
ec17
-dec
24-d
ec31
-dec
07-ja
n14
-jan
21-ja
n28
-jan
04-f
eb11
-feb
18-f
eb25
-feb
04-m
rt11
-mrt
18-m
rt25
-mrt
01-a
pr08
-apr
15-a
pr22
-apr
29-a
pr06
-mei
13-m
ei20
-mei
27-m
ei03
-jun
10-ju
n17
-jun
Phas
e 1
(Res
earc
h Pr
opos
al)
Sele
ctio
n of
Res
earc
h To
pic
Form
ulat
ing
CRQ
+ S
RQKe
y Co
ncep
ts +
Def
initi
ons
Intr
oduc
tion
Prob
lem
Sta
tem
ent
Mee
ting
Supe
rvis
orPr
elim
inar
y Li
tera
ture
Rev
iew
Mee
ting
Supe
rvis
orM
etho
ds o
f dat
a co
llect
ion
+ an
alys
isO
pera
tiona
lizat
ion
of k
ey c
once
pts
Rese
arch
Fra
mew
ork
Lim
itatio
ns a
nd R
isks
Hand
ing
in R
esea
rch
Prop
osal
dra
ftPr
oces
sing
feed
back
Ha
ndin
g in
Res
earc
h Pr
opos
alPh
ase
2 In
trod
uctio
nTh
eore
tical
fram
ewor
kM
etho
ds
Mee
ting
Supe
rvis
orAn
alyz
ing
repo
rts
dairy
com
pany
1 t/
m 4
Anal
yzin
g re
port
s da
iry c
ompa
ny 5
t/m
8An
alyz
ing
repo
rts
dairy
com
pany
9 t/
m 1
1Ph
ase
3M
eetin
g Su
perv
isor
Resu
ltsCo
nclu
sion
sDi
scus
sion
Mee
ting
Supe
rvis
orHa
ndin
g in
firs
t ver
sion
Revi
sion
Hand
ing
in fi
nal v
ersi
on
Perio
de 6

59
Appendix B: key concepts and definitions • Characteristics can be defined as a typical or noticeable quality of someone or something
(Cambridge Dictionary, 2019). • Corporate social responsibility defined as “the responsibility of enterprises for their impacts
on society” (European Commission, 2011, p. 6) • Cooperatives can be defined as autonomous association of persons united to meet common
economic, social and cultural goals (ICA, 2018). The key characteristics of cooperatives is that it is an open and voluntary organisation, with equal voting rights for the members (European Commission, 2018a; ICA, 2018).
• Corporate governance is “concerned with the structures and systems of control by which managers are held accountable to those who have a legitimate stake in an organization” (Johnson et al., 2012, p. 82).
• Firm size can be defined as the scale of a firm in terms of employees and annual turnover or annual balance sheet (European Commission, 2019).
• Marketing strategy can be defined as “an organization’s integrated pattern of decisions that specify its crucial choices concerning products, markets, marketing activities and marketing resources in the creation, communication and/or delivery of products that offer value to customers in exchanges with the organization and thereby enables the organization to achieve specific objectives” (Varadarajan, 2010, p. 119).
• Strategy can be defined as “the long term direction of an organization” (Johnson et al., 2012, p. 2)
Appendix C: key words search strategy Table 18. Search strategy literature review
Research questions Search concepts Theoretical sub research questions What is a corporate social responsibility strategy? (CSR OR Corporate Social Responsibility), definition*, Which firm characteristics can influence the corporate social responsibility strategy?
(firm*) AND (company*) AND (characteristic*) AND (influence) AND (strategy*)
Empirical sub research questions What is the influence of ownership concentration on the corporate social responsibility strategy of European dairy firms?
(ownership) AND (dispersion) AND (strategy*) AND (CSR OR Corporate Social Responsibility) AND (Europe) AND (influenc*)
What is the influence of ownership identity on the corporate social responsibility strategy of European dairy firms?
(ownership) AND (identity) AND (strategy*) AND (CSR OR Corporate Social Responsibility) AND (Europe) AND (influenc*) AND (type)
What is the influence of marketing strategy on the corporate social responsibility strategy of European dairy firms?
(marketing) AND (strategy*) AND (CSR OR Corporate Social Responsibility) AND (Europe) AND (influenc*)
What is the influence of firm size on the corporate social responsibility strategy of European dairy companies?
(firm) AND (size) AND (strategy*) AND (CSR OR Corporate Social Responsibility) AND (Europe) AND (influenc*) (influence) AND (firm’) AND (size) AND (on) AND (CSR)
What is the influence of corporate governance on the corporate social responsibility strategy of European dairy firms?
(corporate) AND (governance) AND (strategy*) AND (CSR OR Corporate Social Responsibility) AND (Europe) AND (influenc*)
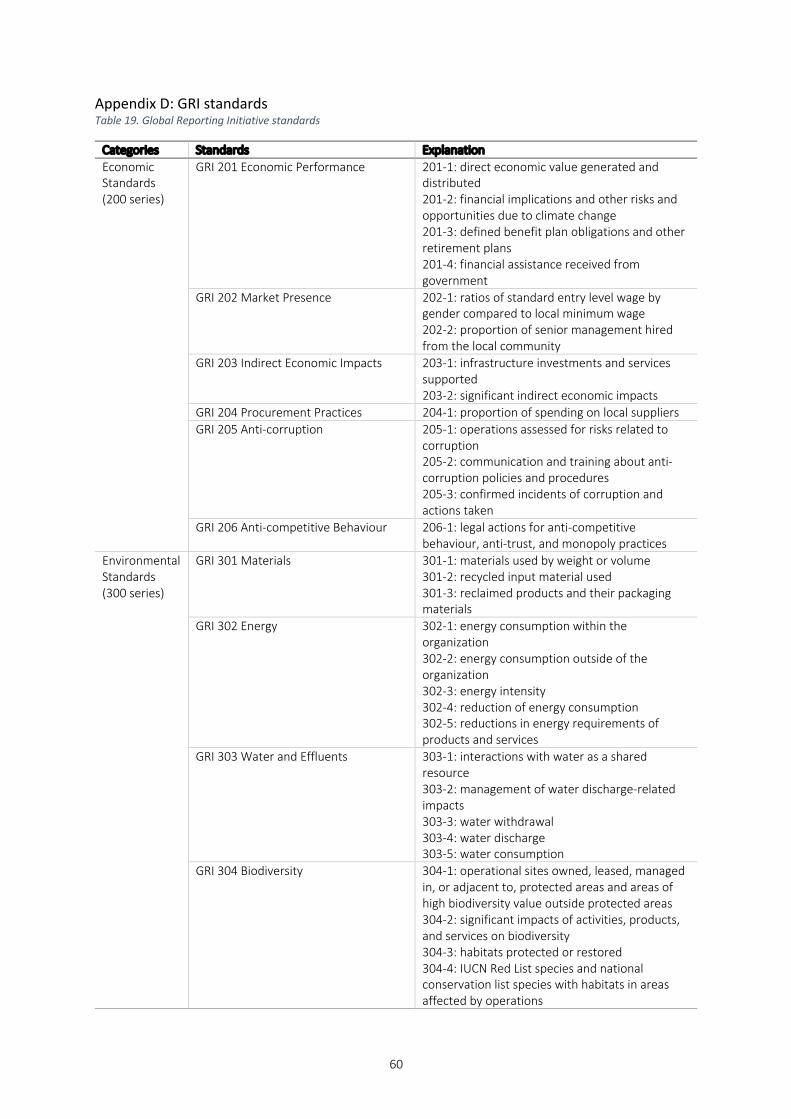
60
Appendix D: GRI standards Table 19. Global Reporting Initiative standards
Categories Standards Explanation Economic Standards (200 series)
GRI 201 Economic Performance 201-1: direct economic value generated and distributed 201-2: financial implications and other risks and opportunities due to climate change 201-3: defined benefit plan obligations and other retirement plans 201-4: financial assistance received from government
GRI 202 Market Presence 202-1: ratios of standard entry level wage by gender compared to local minimum wage 202-2: proportion of senior management hired from the local community
GRI 203 Indirect Economic Impacts 203-1: infrastructure investments and services supported 203-2: significant indirect economic impacts
GRI 204 Procurement Practices 204-1: proportion of spending on local suppliers GRI 205 Anti-corruption 205-1: operations assessed for risks related to
corruption 205-2: communication and training about anti-corruption policies and procedures 205-3: confirmed incidents of corruption and actions taken
GRI 206 Anti-competitive Behaviour 206-1: legal actions for anti-competitive behaviour, anti-trust, and monopoly practices
Environmental Standards (300 series)
GRI 301 Materials 301-1: materials used by weight or volume 301-2: recycled input material used 301-3: reclaimed products and their packaging materials
GRI 302 Energy 302-1: energy consumption within the organization 302-2: energy consumption outside of the organization 302-3: energy intensity 302-4: reduction of energy consumption 302-5: reductions in energy requirements of products and services
GRI 303 Water and Effluents 303-1: interactions with water as a shared resource 303-2: management of water discharge-related impacts 303-3: water withdrawal 303-4: water discharge 303-5: water consumption
GRI 304 Biodiversity 304-1: operational sites owned, leased, managed in, or adjacent to, protected areas and areas of high biodiversity value outside protected areas 304-2: significant impacts of activities, products, and services on biodiversity 304-3: habitats protected or restored 304-4: IUCN Red List species and national conservation list species with habitats in areas affected by operations

61
GRI 305 Emissions 305-1: direct (Scope 1) GHG emissions 7 305-2: energy indirect (Scope 2) GHG emissions 9 305-3: other indirect (Scope 3) GHG emissions 11 305-4: GHG emissions intensity 13 305-5: reduction of GHG emissions 14 305-6: emissions of ozone-depleting substances (ODS) 15 305-7: nitrogen oxides (NOX), sulphur oxides (SOX), and other significant air emissions
GRI 306 Effluents and Waste 306-1: water discharge by quality and destination 306-2: waste by type and disposal method 306-3: significant spills 306-4: transport of hazardous waste 306-5: water bodies affect by water discharges and/of runoff
GRI 307 Environmental Compliance 307-1: non-compliance with environmental laws and regulations
GRI 308 Supplier Environmental Assessment
308-1: new suppliers that were screened using environmental criteria 308-2: negative environmental impacts in the supply chain and actions taken
Social Standards (400 series)
GRI 401 Employment 401-1: new employee hires and employee turnover 401-2: benefits provided to full time employees that are not provided to temporary or part time employees 401-3: parental leave
GRI 402 Labour/ Management Relations 402-1: minimum notice periods regarding operational changes
GRI 403 Occupational Health and Safety 403-1: occupational health and safety management system 403-2: hazard identification, risk assessment, and incident investigation 403-3: occupational health services 403-4: worker participation, consultation, and communication on occupational health and safety 403-5: worker training on occupational health and safety 403-6: promotion of worker health 403-7: prevention and mitigation of occupational health and safety impacts directly linked by business relationships 403-8: workers covered by an occupational health and safety management system 403-9: work-related injuries 403-10: work-related ill health
GRI 404 Training and Education 404-1: average hours of training per year per employee 404-2: programs for upgrading employee skills and transition assistance programs 404-3: percentage of employees receiving regular performance and career development reviews
GRI 405 Diversity and Equal Opportunity 405-1: diversity of governance bodies and employees 405-2: ratio of basic salary and remuneration of women to men
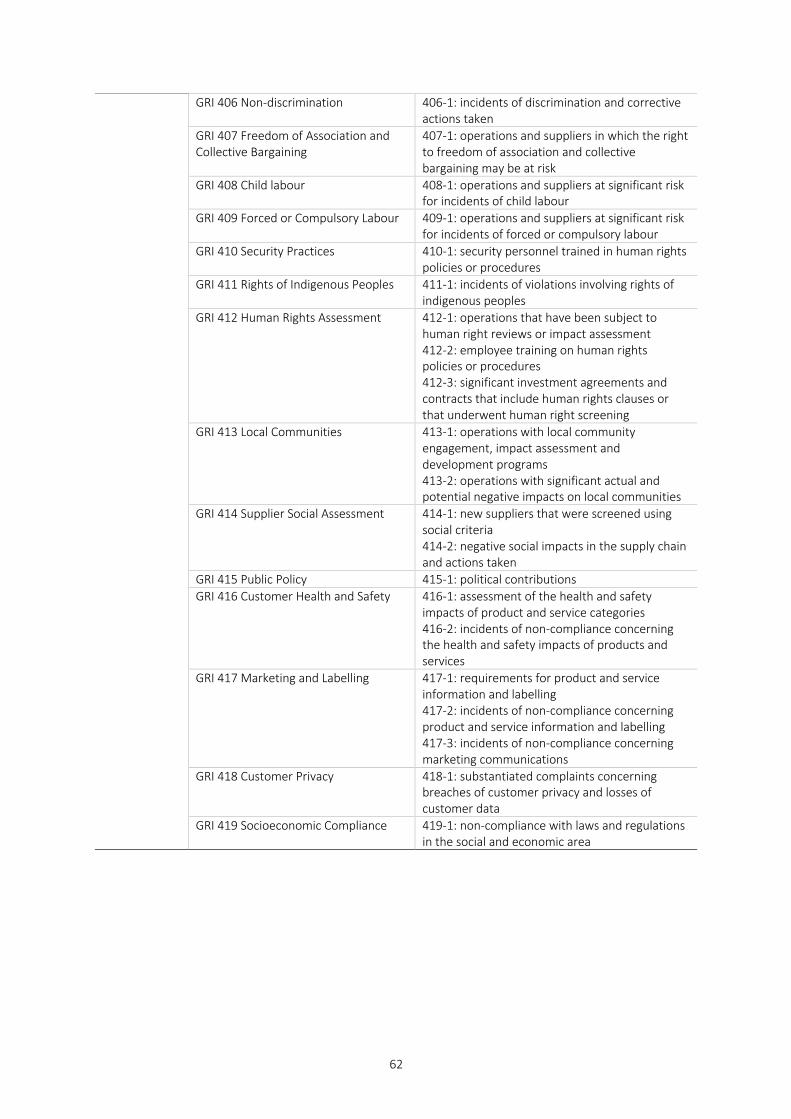
62
GRI 406 Non-discrimination 406-1: incidents of discrimination and corrective actions taken
GRI 407 Freedom of Association and Collective Bargaining
407-1: operations and suppliers in which the right to freedom of association and collective bargaining may be at risk
GRI 408 Child labour 408-1: operations and suppliers at significant risk for incidents of child labour
GRI 409 Forced or Compulsory Labour 409-1: operations and suppliers at significant risk for incidents of forced or compulsory labour
GRI 410 Security Practices 410-1: security personnel trained in human rights policies or procedures
GRI 411 Rights of Indigenous Peoples 411-1: incidents of violations involving rights of indigenous peoples
GRI 412 Human Rights Assessment 412-1: operations that have been subject to human right reviews or impact assessment 412-2: employee training on human rights policies or procedures 412-3: significant investment agreements and contracts that include human rights clauses or that underwent human right screening
GRI 413 Local Communities 413-1: operations with local community engagement, impact assessment and development programs 413-2: operations with significant actual and potential negative impacts on local communities
GRI 414 Supplier Social Assessment 414-1: new suppliers that were screened using social criteria 414-2: negative social impacts in the supply chain and actions taken
GRI 415 Public Policy 415-1: political contributions GRI 416 Customer Health and Safety 416-1: assessment of the health and safety
impacts of product and service categories 416-2: incidents of non-compliance concerning the health and safety impacts of products and services
GRI 417 Marketing and Labelling 417-1: requirements for product and service information and labelling 417-2: incidents of non-compliance concerning product and service information and labelling 417-3: incidents of non-compliance concerning marketing communications
GRI 418 Customer Privacy 418-1: substantiated complaints concerning breaches of customer privacy and losses of customer data
GRI 419 Socioeconomic Compliance 419-1: non-compliance with laws and regulations in the social and economic area

63
Appendix E: Tagesson’s coding scheme Table 20. Taggesson's coding scheme
Categories Environmental Ethical Human resource Issues Environmental policy Code of conduct Values
The corporation’s effect on the environment
Human rights Conditions of employment
Improvements - environment Charity and sponsoring Change in number of employees
Consumption Investors relations Education of employees Discharge Business Ethics Health and safety Environmental certification Safety and effect of the
product Equal opportunities
Environmental objectives Investment policy Follow-up of environmental objectives
Supply chain
Source: Tagesson et al. (2009)
Appendix F: coding scheme Atlas.ti f By the use of Atlas.ti Version 8, the following issues were obtained from the annual reports. In order to conduct a proper analysis, the issues are defined based on GRI standards and literature. Defining these issues, enabled this study to construct “key search words” to these issues. By using the Auto Coding function in Atlas.ti, all hits with respect to the “key search words” were marked as codes. To ensure that the codes are properly assigned, the context of the codes was assessed, to determine whether this would fit. But only after assessing the context of codes, the quotation was assigned to a specific code. Operators, such as “|” (implying or) and “*” (implying all words starting with), were used in order to obtain a full overview of the code. Using this analysis, the occurrence of the key search words in headers will be erased from the set. For the scope of this research, some of the codes and issues are adjusted or combined. This in order to reduce the workload, and it is expected that extra codes will not lead to better results regarding obtaining the CSR strategy. Table 21. Coding scheme for Atlas.ti
Code GRI Key Search Words
Operators Atlas.ti
The firm’s disclosure on
Environmental and Social policies
205-1 205-2 205-3 306-4 307-1 419-1
Non-compliance Compliance Action Environmental Law Regulation Prevent Degradation Policies Transport Waste Social Economic Corruption
non-complianc*|complianc* |action*| law*| |regulat*|prevent*|degrad*| polic*|transport| waste|corruption
- non-compliance or compliance of environmental laws and regulations/ social laws and regulations/ economic laws and regulations - prevention of environmental degradation/ improvement environment - policies towards transport and/ or treatments of hazardous waste - anti-corruption

64
The corporation’s effect on the environment
303-1 304-1 304-2 304-4 306-5
Water Resource Biodiversity Protected Impact Conservation Species List Effect Negative
water|resourc*|biodiversity| protect*|impact*| conserv*|specie*|list* |effect|negative
- interaction with water as shared resource - operational sites owned in protected areas - their operational sites owned in areas of high biodiversity value outside protected areas - impact of the product/ activities/services on biodiversity - inclusions of conservation species list - water bodies affect by water discharges.
Improvements environment
302-4 302-5 303-2 304-3 305-5
Improvement Efforts Reduction Requirements GHG Emissions Water Impacts Protected Restored Habitats Waste
improve*|effort*| |reduc*|require*| |GHG|emission*|water | impact*|protect*| restore*|habitat*
- efforts to improve the environment by reduction of energy consumption - energy requirements of products and services - water management - water discharge-related impacts - reduction of GHG emissions/ water usage alongside production change - protected or restored habitats
Consumption 301-1 301-2 301-3 302-1 302-2 302-3 303-5
Consumption Recycled Material Reclaimed Packaging Weight Volume Intensity
consum*| |recycl*|material*|reclaim* |packag*|weigh*| volume*|intensity
- consumption of water/ energy (within and outside the organisation)/ materials in weight or volume (both recycled and non-recycled) - reclaimed products - packaging materials. - impact of materials and - impact materials the environment - improvements energy and water usage
Discharge 303-3 303-4 305-1 305-2 305-3 305-4 305-6 305-7 306-1 306-2 306-3
Withdrawal Discharge GHG Intensity Emissions Ozone Depleting Substances Oxides Sulphur Disposal Spills Greenhouse gases
withdrawal|discharge| GHG|intensity| emission*|ozone|o-zone| deplet*|substance*|oxide*| sulphur|dispos* |spill*|greenhouse gases
- water withdrawal/ discharge - discharge of direct/indirect GHG - discharge of indirect energy GHG emissions/ o-zone depleting substances - GHG intensity - discharge of oxides/ sulphur oxides/ significant air emissions - discharge by quality/ type discharge - disposal methods - significant spills.
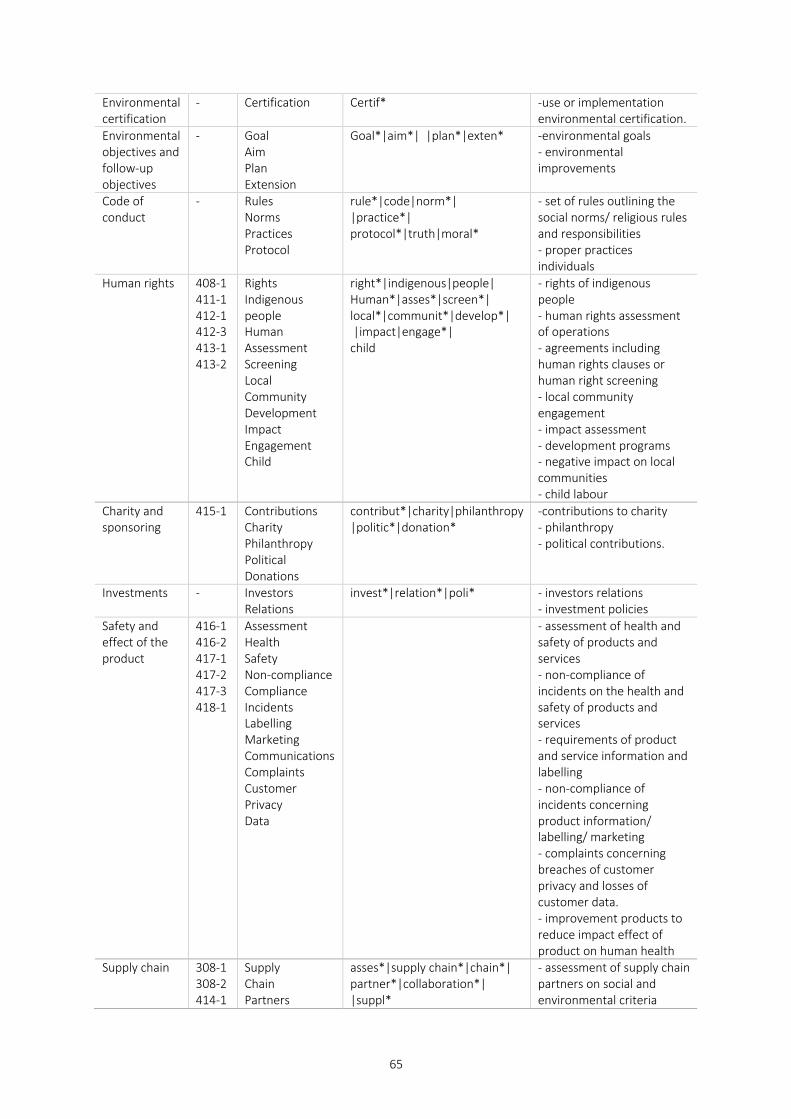
65
Environmental certification
- Certification Certif* -use or implementation environmental certification.
Environmental objectives and follow-up objectives
- Goal Aim Plan Extension
Goal*|aim*| |plan*|exten* -environmental goals - environmental improvements
Code of conduct
- Rules Norms Practices Protocol
rule*|code|norm*| |practice*| protocol*|truth|moral*
- set of rules outlining the social norms/ religious rules and responsibilities - proper practices individuals
Human rights 408-1 411-1 412-1 412-3 413-1 413-2
Rights Indigenous people Human Assessment Screening Local Community Development Impact Engagement Child
right*|indigenous|people| Human*|asses*|screen*| local*|communit*|develop*| |impact|engage*| child
- rights of indigenous people - human rights assessment of operations - agreements including human rights clauses or human right screening - local community engagement - impact assessment - development programs - negative impact on local communities - child labour
Charity and sponsoring
415-1 Contributions Charity Philanthropy Political Donations
contribut*|charity|philanthropy |politic*|donation*
-contributions to charity - philanthropy - political contributions.
Investments - Investors Relations
invest*|relation*|poli* - investors relations - investment policies
Safety and effect of the product
416-1 416-2 417-1 417-2 417-3 418-1
Assessment Health Safety Non-compliance Compliance Incidents Labelling Marketing Communications Complaints Customer Privacy Data
- assessment of health and safety of products and services - non-compliance of incidents on the health and safety of products and services - requirements of product and service information and labelling - non-compliance of incidents concerning product information/ labelling/ marketing - complaints concerning breaches of customer privacy and losses of customer data. - improvement products to reduce impact effect of product on human health
Supply chain 308-1 308-2 414-1
Supply Chain Partners
asses*|supply chain*|chain*| partner*|collaboration*| |suppl*
- assessment of supply chain partners on social and environmental criteria

66
414-2
Collaboration
- negative environmental and social impacts in the supply chain
Values - Values Believes
value*|belie* - corporate values
Conditions of employment
401-2 401-3 402-1 407-1 409-1
Parental Freedom Association Collective Incidents Forced Compulsory Labour Employees Employment Conditions
parent*|freedom| association|collective|incident* |force*|compulsory|labour| employ*|condition*
- benefits for full time employees - parental leave - minimum notice regarding operational changes - freedom of association - collective bargaining - risk for incidents of forced or compulsory labour - labour and management relations
Change in number of employees
401-1 Employment Figures Hires Employee turnover
employ*|hire*| employee turnover
- new employees hires - employee turnover
Education 404-1 404-2 404-3 405-3 410-1 412-2
Opportunities Training Education Human rights Skills Assistance Program Reviews
opportunit*|train*|education* |skill*|assistan*| program*|review*
- opportunities for both employees and non-employees to receive training and education - training on human rights and safety and health - the average hours of training per year - transition assistance program - career development reviews.
Health and safety of employees
403-1 403-2 403-3 403-4 403-6 403-7 403-8 403-9 403-10
Occupational Health Safety Hazard Assessment Risk Incident Investigation Participation Promotion Prevention Impacts Coverage Injuries Ill
cccupation*|health|safety| hazard|asses*|risk|incident*| investigat*|participat*| consultat*|promot*|prevent*| impact*|coverag*|injur*|ill*
- occupational health and safety issues - health and safety management systems, hazard identification - risk assessment - incident investigation - health services - worker participation - communication on safety and health - promotion of worker health - prevention and mitigation of occupational health - safety impacts, coverage by a health - safety management system - work-related injuries/ ill health
Equal opportunities
405-1 405-2
Diversity Governance Women
divers*|govern*|wom*| gender*|discrimination|action* |practice*|inclusivity
- diversity of governance bodies and employees

67
406-1 406-2
Gender Discrimination Actions Practices Inclusivity
- ratio basic salary and remuneration of women to men. - incidents of discrimination - inclusivity of employees and wider environment
Animal welfare
- Animal Welfare Health
animal*|welfare|well-being|health|
- animal welfare
Appendix G: Firm size Table 22. Firm size
Firm Number of employees Annual turnover in millions of euro
Annual balance sheet in millions of euro
Nestlé 323,0001 80,6901 117,1651 Danone 100,0002 24,7002 - FrieslandCampina 23,6753 12,1103 9,0463
Arla Foods 18,9734 10,3004 6,4224
Unilever 161,0005 53,7155 60,2855
DMK Group 5,8736 5,795.66 1,9226
Sodiaal 9,1007 5,17 2,305.77
Savencia 19,8458 4,8538 3,477.6828
Royal A-ware 2,4509 1,39 - DOC Kaas B.A. 1,50010 0.31499810 0.11789710 Bel Group 12,70011 3,34611 3,94259011
Sources: 1 Nestlé (2017a, 2017b); 2Danone (2017); 3 FrieslandCampina (2017); 4Arla Foods (2017); 5Unilever (2017); 6DMK (2017); 7Sodiaal (2017); 8Savencia (2017);9Royal A-ware (2017); 10DOC Kaas B.A. (2017);11Bel Group (2017)
Appendix H: calculations ownership structure Table 23. Ownership structure Nestlé
Nestlé Shareholders % of share capital1 Squared holdings2 BlackRock Fund Advisors 5.0 0,00250000 Nestlé SA 3.01 0,00090601 The Vanguard Group, Inc 2.72 0,00073984 Norges Bank Investment Management 2.43 0,00059049 UBS AG (Investment Management) 1.57 0,00024649 Capital Research & Management Co. (World Investors) 1.53 0,00023409 Capital Research & Management Co. (Global Investors) 1.42 0,00020164 Third Point LLC 1.31 0,00017161 Zürcher Kantonalbank (Investment Management) 0.99 0,00009801 Massachussets Financial Services Co. 0.97 0,00009409 Summed squared holdings 0,00578227
Source: 1MarketScreener (2019a); 2own calculations. Note: % of share capital retrieved on 3/21/19
Table 24. Ownership structure Danone
Danone Shareholders % of share capital1 Squared holdings2 MFC 8.9 0.007921 Blackrock 6.1 0.003721 Treasury Shares – the Company 4.8 0.002304 First Eagle Investment Management 2.4 0.000576 Amundi Asset Management 2.2 0.000484

68
Sofina Group 2.1 0.000441 Lyxor 1.9 0.000361 Norges Bank 1.8 0.000324 CDC Group 1.7 0.000289 Employee shareholdings “Fonds Danone” company investment fund
1.3 0.000169
Summed squared holdings 0.016590 Source: 1Danone (2018a); 2own calculations.
Table 25. Ownership structure Unilever UNA
Unilever (NL, UNA) Shareholders % of share capital1 Squared holdings2 Unilever NV 15.2 0.02310400 The Vanguard Group, Inc. 2.41 0.00058081 Norges Bank Investment Management 1.75 0.00030625 Wellington Management Co. LLP 1.38 0.00019044 BlackRock Fund Advisors 1.28 0.00016384 Amundi Asset Management SA (Investment Management) 1.18 0.00013924 DWS Investment GmbH 1.05 0.00011025 BlackRock Advisors (UK) Ltd. 0.68 0.00004489 Vontobel Asset Management, Inc. 0.67 0.00004489 Fidelity Management & Research Co. 0.63 0.00003969 Summed squared holdings 0,02472430
Source: 1MarketScreener (2019c); 2own calculations. Note: % of share capital retrieved on 3/21/19
Table 26. Ownership structure Unilever ULVR
Unilever (GB, ULVR) Shareholders % of share capital1 Squared holdings2 The Leverhulme Trust 4.19 0.00175561 BlackRock Investment Management (UK) Ltd. 2.96 0.00087616 The Vanguard Group Inc. 2.83 0.00080089 Norges Bank Investment Management 2.66 0.00070756 Lindsell Train Ltd. 2.62 0.00068644 BlackRock Fund Advisors 2.24 0.00050176 Legal & General Investment Management Ltd. 2.23 0.00049729 BlackRock Advisors (UK) Ltd. 1.76 0.00030976 Morgan Stanley Investment Management Ltd. 1.44 0.00020736 Threadneedle Asset Management Ltd. 1.25 0.00015625 Summed squared holdings 0.00649908
Source: 1MarketScreener (2019d);2own calculations. Note: % of share capital retrieved on 3/21/19
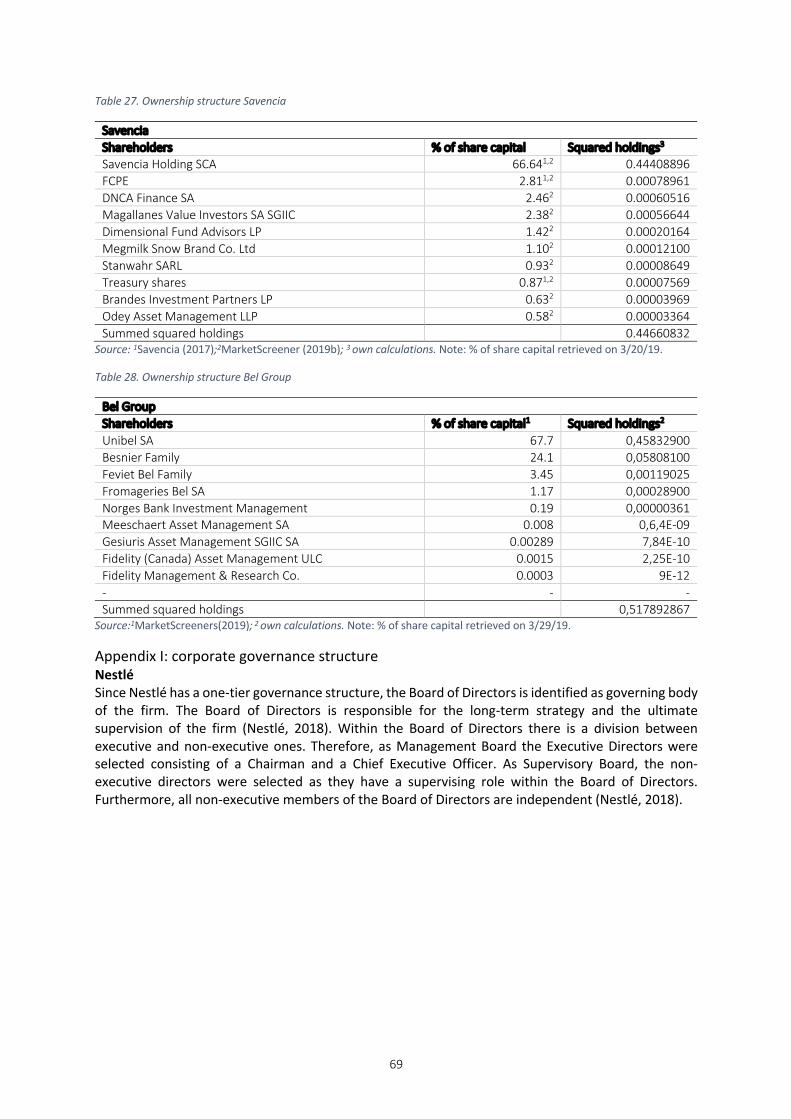
69
Table 27. Ownership structure Savencia
Savencia Shareholders % of share capital Squared holdings3 Savencia Holding SCA 66.641,2 0.44408896 FCPE 2.811,2 0.00078961 DNCA Finance SA 2.462 0.00060516 Magallanes Value Investors SA SGIIC 2.382 0.00056644 Dimensional Fund Advisors LP 1.422 0.00020164 Megmilk Snow Brand Co. Ltd 1.102 0.00012100 Stanwahr SARL 0.932 0.00008649 Treasury shares 0.871,2 0.00007569 Brandes Investment Partners LP 0.632 0.00003969 Odey Asset Management LLP 0.582 0.00003364 Summed squared holdings 0.44660832
Source: 1Savencia (2017);2MarketScreener (2019b); 3 own calculations. Note: % of share capital retrieved on 3/20/19.
Table 28. Ownership structure Bel Group
Bel Group Shareholders % of share capital1 Squared holdings2 Unibel SA 67.7 0,45832900 Besnier Family 24.1 0,05808100 Feviet Bel Family 3.45 0,00119025 Fromageries Bel SA 1.17 0,00028900 Norges Bank Investment Management 0.19 0,00000361 Meeschaert Asset Management SA 0.008 0,6,4E-09 Gesiuris Asset Management SGIIC SA 0.00289 7,84E-10 Fidelity (Canada) Asset Management ULC 0.0015 2,25E-10 Fidelity Management & Research Co. 0.0003 9E-12 - - - Summed squared holdings 0,517892867
Source:1MarketScreeners(2019); 2 own calculations. Note: % of share capital retrieved on 3/29/19.
Appendix I: corporate governance structure Nestlé Since Nestlé has a one-tier governance structure, the Board of Directors is identified as governing body of the firm. The Board of Directors is responsible for the long-term strategy and the ultimate supervision of the firm (Nestlé, 2018). Within the Board of Directors there is a division between executive and non-executive ones. Therefore, as Management Board the Executive Directors were selected consisting of a Chairman and a Chief Executive Officer. As Supervisory Board, the non-executive directors were selected as they have a supervising role within the Board of Directors. Furthermore, all non-executive members of the Board of Directors are independent (Nestlé, 2018).

70
Table 29. Corporate governance Nestlé
Nestlé Executive Directors (MB) Ind. Non-executive directors (SB) Ind. Paul Bulck (Chairman) M N Andreas Koopmann M Y
U. Mark Schneider (CEO) M N Henri de Castries M Y Beat Hess M Y
Renato Fassbind M Y
Steven G. Hoch M Y Naïna Lal Kidwai F Y
Jean-Pierre Roth M Y Ann M. Veneman F Y
Eva Cheng F Y Ruth K. Oniang’o F Y
Patrick Aebischer M Y
Ursuala M. Burns F Y Source: Nestlé (2018). Note: board structure of Nestlé at 31 December 2017
Danone As Management Board the General Management was selected consisting of the Chief Executive Officer (Danone, 2018b, p. 16). As Supervisory Board, the Board of Directors is selected since this board “determines the orientations of Danone’s activity and oversees their implementation”(Danone, 2018b, p. 25). Moreover “it rules on all decisions concerning Danone’s major strategic, economic, social, financial, environmental and technological orientations” (Danone, 2018b, p. 25). This is reinforced by the statement that “the Chairman or the Chief Executive Officer of the company is bound to send each Director all information necessary for the exercise of his duties” (Danone, 2018b, p. 25). Implying that the Board of Directors has a controlling function within Danone. Therefore, the Danone’s corporate governance can be characterised as follows: Table 30. Corporate governance Danone
Danone General Management (MB) Ind. Board of Directors (SB) Ind. Emmanuel Faber (CEO and Chairman)
M N Franck Riboud M N
Emmanuel Faber M N Clara Gaymard F Y
Jacques-Antoine Granjon M Y Jean Laurent M Y Gregg L. Engles M N Gaëlle Olivier F Y Benoît Potier M Y Isabelle Seillier F N Mouna Sepehri F Y Jean-Michel Severino M Y Virginia A. Stallings F Y Serpil Timuray F Y Lionel Zinsou-Derlin M Y Frédéric Boutebba M N* Bettina Theissing F N*
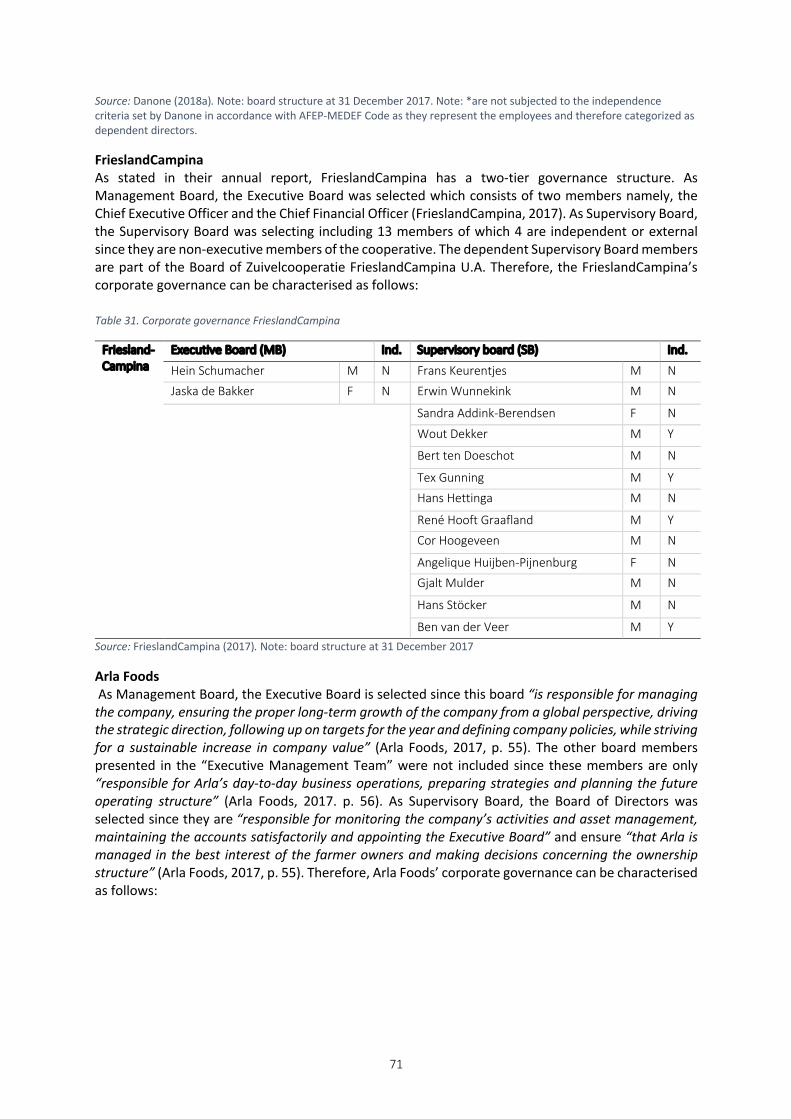
71
Source: Danone (2018a). Note: board structure at 31 December 2017. Note: *are not subjected to the independence criteria set by Danone in accordance with AFEP-MEDEF Code as they represent the employees and therefore categorized as dependent directors.
FrieslandCampina As stated in their annual report, FrieslandCampina has a two-tier governance structure. As Management Board, the Executive Board was selected which consists of two members namely, the Chief Executive Officer and the Chief Financial Officer (FrieslandCampina, 2017). As Supervisory Board, the Supervisory Board was selecting including 13 members of which 4 are independent or external since they are non-executive members of the cooperative. The dependent Supervisory Board members are part of the Board of Zuivelcooperatie FrieslandCampina U.A. Therefore, the FrieslandCampina’s corporate governance can be characterised as follows: Table 31. Corporate governance FrieslandCampina
Friesland-Campina
Executive Board (MB) Ind. Supervisory board (SB) Ind.
Hein Schumacher M N Frans Keurentjes M N Jaska de Bakker F N Erwin Wunnekink M N
Sandra Addink-Berendsen F N
Wout Dekker M Y
Bert ten Doeschot M N
Tex Gunning M Y Hans Hettinga M N
René Hooft Graafland M Y Cor Hoogeveen M N
Angelique Huijben-Pijnenburg F N Gjalt Mulder M N
Hans Stöcker M N
Ben van der Veer M Y Source: FrieslandCampina (2017). Note: board structure at 31 December 2017
Arla Foods As Management Board, the Executive Board is selected since this board “is responsible for managing the company, ensuring the proper long-term growth of the company from a global perspective, driving the strategic direction, following up on targets for the year and defining company policies, while striving for a sustainable increase in company value” (Arla Foods, 2017, p. 55). The other board members presented in the “Executive Management Team” were not included since these members are only “responsible for Arla’s day-to-day business operations, preparing strategies and planning the future operating structure” (Arla Foods, 2017. p. 56). As Supervisory Board, the Board of Directors was selected since they are “responsible for monitoring the company’s activities and asset management, maintaining the accounts satisfactorily and appointing the Executive Board” and ensure “that Arla is managed in the best interest of the farmer owners and making decisions concerning the ownership structure” (Arla Foods, 2017, p. 55). Therefore, Arla Foods’ corporate governance can be characterised as follows:

72
Table 32. Corporate governance Arla Foods
Source: Arla Foods (2017) Note: board structure at 31 December 2017.
Unilever As stated in their annual reports, Unilever has a one-tier governance structure (Unilever, 2017). Therefore, Unilever has one board existing of Executive Directors and Non-Executive directors. As Management Board, the Executive Board was selected, consisting of the Chief Executive Officer and the Chief Financial Officer. The majority of the board members are non-executive directors “who essentially have a supervisory role” (Unilever, 2017, p. 34). Furthermore, the board of directors stated that all the non-executive directors are considered to be independent (Unilever, 2017). Therefore, the Unilever’s corporate governance can be characterised as follows: Table 33. Corporate governance Unilever
Unilever Executive (MB) Ind. Non-Executive (SB) Ind.
Paul Polman (CEO) M N Marijn Dekkers M Y
Graeme Pitkethly (CFO) M N Ann Fudge F Y Nils Smedegaard M Y
Laura Cha F Y
Vittorio Colao M Y Judit Hartmann F Y Mary Ma F Y
Strive Masiyiwa M Y Youngme Moon F Y
John Rishton M Y Feike Sijbesma M Y
Source: Unilever (2017). Note: board structure at 31 December 2017
Arla Foods
Executive Board (MB) Ind. Board of Directors (SB) Ind.
Peter Tuborgh (CEO) M N Åke Hantoft M N Povl Krogsgaard (vice-CEO) M N Jan Toft Nørgaard M N
Manfred Sievers M N Harry Shaw M N
Heléne Gunnarson F N
Johnnie Russell M N Viggo Ø. Bloch M N
Markus Hübers M N Steen Nørgaard Madsen M N
Simon Simonsen M N Ib Bjerglund Nielsen M N
Bjørn Jepsen M N
Inger-Lise Sjöström F N Torben Myrup M N
Manfred Graff M N Håkan Gillström M N
Jonas Carlgren M N

73
DMK Group As Management Board, the Group Management is selected consisting of a Chief Executive Officer and a Chief Financial Officier (DMK, 2018). As Supervisory Board, the Supervisory Board is selected consisting of twelve members. Six out of 12 members are delegates from the Partners' Meeting of DMK Deutsches Milchkontor GmbH, while the rest are elected by DMK Deutsches Milchkontor GmbH employees (DMK, 2019). Therefore, the DMK’s corporate governance can be characterised as follows: Table 34. Corporate governance DMK Group
DMK Group
Group Management1 (MB) Ind. Supervisory board2 (SB) Ind. Ingo Müller (CEO) M N Heinz Korte M N
Volkmar Taucher (CFO) M N Hartmut Börger M N
Dr. Mechthild Frentrup M N
Benedikt Langemeyer M N
Frerk Osterndorff M N
Arjan Schimmel M N
Herbert Grimberg M N
Udo Eckhoff M N
Jens Klausen M N
Melanie Mörchen F N
Matthias Schrader M N
Meyk Wendekamm M N Source: 1DMK (2018); 2DMK (2019). Note: board structure Group Management at 31 December 2017 and board structure Supervisory Board at 4 April 2019 as no information was available for the Supervisory Board at 31 December 2017.
Sodiaal As Management Board, the Executive Committee is selected consisting of a Chief Executive Officer and Chief Operations Officer/ Chief Financial Officer. Note that the Executive Committee performs the strategic coordination and controlling role via the firm Sodiaal International which is held by the cooperative for 100%. Therefore, the Sodiaals’ corporate governance can be characterised as follows: Table 35. Corporate governance Sodiaal
Sodiaal Executive Committee Ind.
Jorge Bourcas (CEO) M N
Kees Gielen (COO/CFO) M N Source: Sodiaal (2017). Note: board structure at 31 December 2017
Savencia As Management Board, the General Management is selected consisting of a Chief Executive Officer, a deputy Chief Executive Officer and a Chief Financial Officer. As Supervisory Board, the Board of Directors is selected since its task is to assess both their operations and works (Savencia, 2019). Therefore, Savencia’s corporate governance can be characterised as follows:
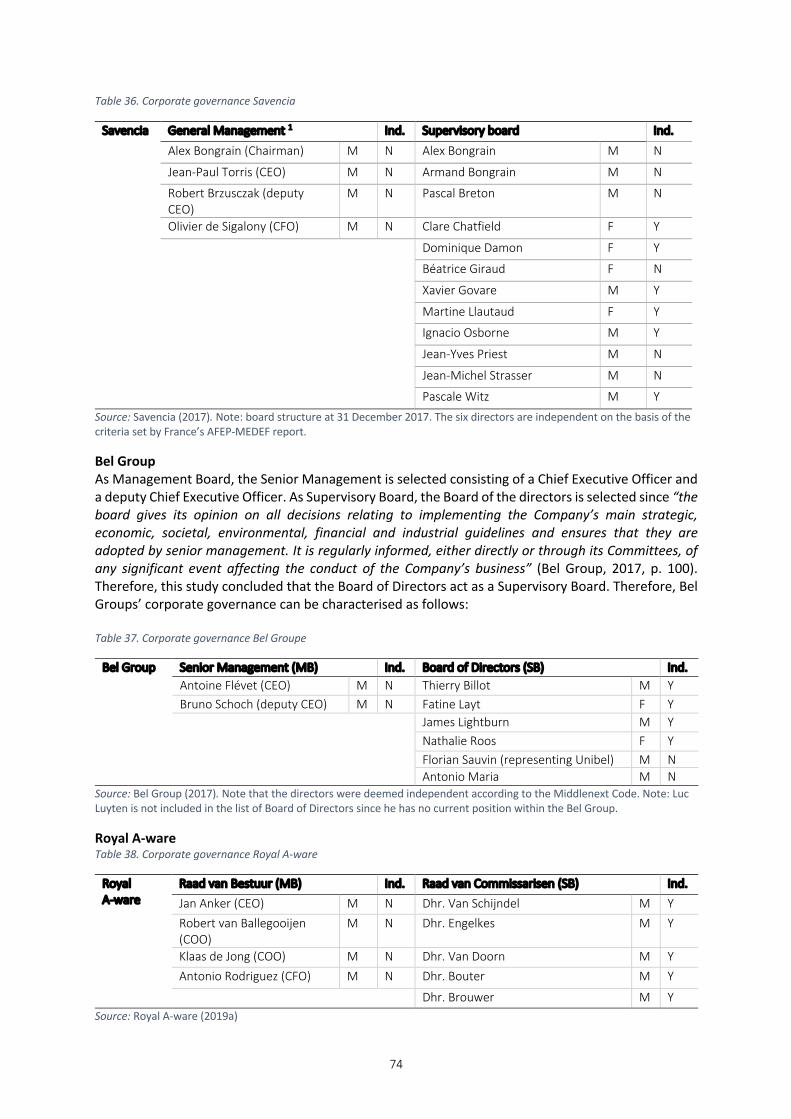
74
Table 36. Corporate governance Savencia
Savencia General Management 1 Ind. Supervisory board Ind.
Alex Bongrain (Chairman) M N Alex Bongrain M N
Jean-Paul Torris (CEO) M N Armand Bongrain M N
Robert Brzusczak (deputy CEO)
M N Pascal Breton M N
Olivier de Sigalony (CFO) M N Clare Chatfield F Y
Dominique Damon F Y
Béatrice Giraud F N
Xavier Govare M Y
Martine Llautaud F Y
Ignacio Osborne M Y
Jean-Yves Priest M N
Jean-Michel Strasser M N
Pascale Witz M Y Source: Savencia (2017). Note: board structure at 31 December 2017. The six directors are independent on the basis of the criteria set by France’s AFEP-MEDEF report.
Bel Group As Management Board, the Senior Management is selected consisting of a Chief Executive Officer and a deputy Chief Executive Officer. As Supervisory Board, the Board of the directors is selected since “the board gives its opinion on all decisions relating to implementing the Company’s main strategic, economic, societal, environmental, financial and industrial guidelines and ensures that they are adopted by senior management. It is regularly informed, either directly or through its Committees, of any significant event affecting the conduct of the Company’s business” (Bel Group, 2017, p. 100). Therefore, this study concluded that the Board of Directors act as a Supervisory Board. Therefore, Bel Groups’ corporate governance can be characterised as follows: Table 37. Corporate governance Bel Groupe
Bel Group Senior Management (MB) Ind. Board of Directors (SB) Ind. Antoine Flévet (CEO) M N Thierry Billot M Y Bruno Schoch (deputy CEO) M N Fatine Layt F Y James Lightburn M Y
Nathalie Roos F Y Florian Sauvin (representing Unibel) M N Antonio Maria M N
Source: Bel Group (2017). Note that the directors were deemed independent according to the Middlenext Code. Note: Luc Luyten is not included in the list of Board of Directors since he has no current position within the Bel Group.
Royal A-ware Table 38. Corporate governance Royal A-ware
Royal A-ware
Raad van Bestuur (MB) Ind. Raad van Commissarisen (SB) Ind. Jan Anker (CEO) M N Dhr. Van Schijndel M Y Robert van Ballegooijen (COO)
M N Dhr. Engelkes M Y
Klaas de Jong (COO) M N Dhr. Van Doorn M Y Antonio Rodriguez (CFO) M N Dhr. Bouter M Y
Dhr. Brouwer M Y Source: Royal A-ware (2019a)

75
DOC Kaas B.A. Table 39. Corporate governance DOC Kaas B.A.
DOC Kaas B.A.
Raad van Bestuur (MB) Ind. A.D. Schimmel M N B.J.M. Volker M N G.M. Mensink M N R.T. Koopmans- van Dalen F N P.J.B. Schut M N G.C. van ‘t Klooster M N
Source: DOC Kaas B.A. (2017)
Appendix J: overview corporate reports Table 40. Reports
Firm Corporate report Name report Nestlé CSR report Nestlé in society Danone Annual report Integrated Report 2017 FrieslandCampina CSR report Corporate Social Responsibility: Update 2017 Arla Foods CSR report 2017 Our Responsibility Unilever Annual report 2017 Annual Reports and Accounts DMK CSR report Sustainability Brochure Sodiaal Annual report Activity Report 2017 Savencia Annual report 2017 Annual Reports Bel Group CSR report Bel CSR Program Royal A-ware CSR report CSR Annual Report 2017 DOC Kaas B.A. Annual repor Jaarverslag 2017 (trans. Annual Report 2017_
Appendix K: results Atlas.ti The results of the analysis are digitally attachted due to the high number of pages.
Related Documents


