Exploring the Quality in Use of Web 2.0 Applications: The Case of Mind Mapping Services Tihomir Orehovački 1 , Andrina Granić 2 , Dragutin Kermek 1 1 University of Zagreb, Faculty of Organization and Informatics Pavlinska 2, 42000 Varaždin, Croatia {tihomir.orehovacki, dragutin.kermek}@foi.hr 2 University of Split, Faculty of Science Nikole Tesle 12, 21000 Split, Croatia [email protected] Abstract. Research in Web quality has addressed quality in use as the most important factor affecting the wide acceptance of software applications. It could be seen as comprised of two complementary concepts, usability and user experience, thus focusing on the employment of more user-centered evaluations. Nevertheless, in the context of Web 2.0 applications, this topic has still not attracted enough attention from the HCI community. This paper addresses quality in use of Web 2.0 applications on the case of mind mapping services. The evaluation methodology brings together three complementary methods. Estimated quality in use was measured by means of logging actual use method while the perceived quality in use was evaluated with both retrospective thinking aloud (RTA) method and questionnaire. The contribution of our work is twofold. Firstly, we provided empirical evidence that proposed methodology altogether with model, set of attributes and measuring instruments is appropriate for evaluating quality in use of Web 2.0 applications. Secondly, the analysis of qualitative data revealed that performance and effort based attributes considerably contribute to the success of mind mapping services. Keywords: Web 2.0, Quality in Use, Evaluation Methodology, Study Results 1 Introduction Usability evaluation plays an essential role in human-centred design process of interactive software applications. Usability, as a quality of use in context [4], is related to ease-of-use and ease-of-learning. More recently, a concept of user experience (UX) [9] gained in popularity and switched focus from a product-centred to more user-oriented evaluation. Furthermore, due to the emergence of Web 2.0 applications, the role of user experience in assessment process has become even more important. As a result of such progress, latest research in Web quality has addressed quality in use, considered to be one of the most important factors affecting the wide acceptance of software applications in general.

Welcome message from author
This document is posted to help you gain knowledge. Please leave a comment to let me know what you think about it! Share it to your friends and learn new things together.
Transcript
Exploring the Quality in Use of Web 2.0 Applications:
The Case of Mind Mapping Services
Tihomir Orehovački1, Andrina Granić
2, Dragutin Kermek
1
1 University of Zagreb, Faculty of Organization and Informatics
Pavlinska 2, 42000 Varaždin, Croatia
{tihomir.orehovacki, dragutin.kermek}@foi.hr
2 University of Split, Faculty of Science Nikole Tesle 12, 21000 Split, Croatia
Abstract. Research in Web quality has addressed quality in use as the most important factor affecting the wide acceptance of software applications. It could
be seen as comprised of two complementary concepts, usability and user experience, thus focusing on the employment of more user-centered
evaluations. Nevertheless, in the context of Web 2.0 applications, this topic has
still not attracted enough attention from the HCI community. This paper
addresses quality in use of Web 2.0 applications on the case of mind mapping services. The evaluation methodology brings together three complementary
methods. Estimated quality in use was measured by means of logging actual use
method while the perceived quality in use was evaluated with both retrospective
thinking aloud (RTA) method and questionnaire. The contribution of our work is twofold. Firstly, we provided empirical evidence that proposed methodology
altogether with model, set of attributes and measuring instruments is
appropriate for evaluating quality in use of Web 2.0 applications. Secondly, the
analysis of qualitative data revealed that performance and effort based attributes considerably contribute to the success of mind mapping services.
Keywords: Web 2.0, Quality in Use, Evaluation Methodology, Study Results
1 Introduction
Usability evaluation plays an essential role in human-centred design process of
interactive software applications. Usability, as a quality of use in context [4], is
related to ease-of-use and ease-of-learning. More recently, a concept of user
experience (UX) [9] gained in popularity and switched focus from a product-centred
to more user-oriented evaluation. Furthermore, due to the emergence of Web 2.0
applications, the role of user experience in assessment process has become even more
important. As a result of such progress, latest research in Web quality has addressed
quality in use, considered to be one of the most important factors affecting the wide
acceptance of software applications in general.

1.1 Background to the Research
Recent research in the field of usability, user experience and quality in use, e.g. [3],
[6], [11], [13] along with the latest quality standard [10], have still not agreed on
attributes which reflect the “real quality” of software application. Moreover, it is not
clear how the concept of the quality in use in the context of Web 2.0 applications
should be defined. According to the ISO standard on quality models [10], usability
(along with flexibility and safety) is one characteristic of the quality in use, with
effectiveness, efficiency and satisfaction as its sub-characteristics. In the light of ISO
25010, Bevan perceives usability as performance in use and satisfaction as it relates to user experience [3]. To encompass the overall user experience, satisfaction needs to
be concerned with both pragmatic and hedonic user goals. Lew et al. [11] propose
extending the ISO 25010 standard to incorporate new characteristics, specifically
information quality and learnability. They also argue for including usability and user
experience concepts into the modelling framework. In light of the above
considerations, quality in use could be seen as comprised of two complementary
concepts: (i) usability, which refers to the product-centred evaluation of pragmatic
attributes through the use of both subjective and objective measuring instruments as
well as (ii) user experience (UX), which concerns a use of subjective measuring
instruments for the assessment of hedonic attributes.
HCI literature offers many different models, methods, and standards aimed at
evaluating the quality and usability of software applications. However, research
related to the evaluation of Web 2.0 applications in general has been deficient. Recent
studies have shown that it could be because current approaches are not actually
appropriate for their evaluation. A research into usability assessment carried out by
Hart et al. [8], has revealed that popular social networking site Facebook complies
with only two of ten heuristics originally proposed by Nielsen [12]. They also reported that attributes such as ease of use, usefulness and playfulness have major
impact on users’ loyal behaviour. When subjected to conventional usability
evaluation, YouTube appears to fail as well, meeting just two traditional heuristics
[17]. Thompson and Kemp [18] have discussed that one of the main reasons why Web
2.0 applications such as Flickr, Wikipedia and YouTube have a large number of
active users is their focus on user experience. Moreover, they extended and modified
a set of Nielsen’s traditional heuristics with an objective to evaluate the usability of
Web 2.0 applications. However, a validity of the proposed set of heuristics was not
empirically confirmed. In addition, current research is usually focused on the
development of methods and models aimed for the evaluation of the particular quality
aspects (e.g. information quality [1]) or types of Web 2.0 applications (e.g. mashups
[5]). All the afore-mentioned motivated us to initiate a research on design of a
methodology that will enable the evaluation of quality in use of Web 2.0 applications,
regardless of their type and the context in which they are used [14].
1.2 Proposed Classification of Quality Attributes
An analysis of recent relevant research in the field of Web quality and usability
assessment resulted with a set of attributes that may have a significant role in the

evaluation of the quality in use of Web 2.0 applications [16]. The developed
conceptual model classifies quality attributes into six basic categories: system quality
(SYQ), service quality (SEQ), information quality (INQ), performance (PFM), effort
(EFO) and acceptability (ACP), see Figure 1.
Fig. 1. Proposed model for evaluating Quality in Use of Web 2.0 applications [16]
System Quality (SYQ) measures quality in use of Web 2.0 application at the level of its interface features. It is comprised of six attributes: navigability (NVG, degree to
which interface elements are well organized and offers alternative navigation
mechanisms), consistency (CNS, degree to which the same structure, design,
terminology and components are used throughout of a Web 2.0 application), aesthetic
(AES, degree of visual attractiveness of web interface), familiarity (FML, the degree
to which web interfae is similar to previously used applications), customizability
(CUS, degree to which interface elements can be adapted to the characteristics of the
task or user), and security (SCR, extent to which personal dana and files are protected
from unauthorized access). Service quality (SEQ) is an extent of quality of interaction
Quality in Use
System Quality
Navigability
Consistency
Aesthetic
Familiarity
Customizabililty
Security
Service Quality
Helpfulness
Availability
Interactivity
Error Prevention
Reliability
Recoverability
Responsiveness
Feedback
Information Quality
Correctness
Coverage
Credibility
Timeliness
Value-added
Performance
Efficiency
Usefulness
Effectiveness
Effort
Minimal Action
Minimal Memory Load
Accessibility
Controlability
Ease of Use
Learnability
Memorability
Understandability
Acceptability
Playfulness
Satisfaction
Loyalty

between user and Web 2.0 application. This category is further decomposed into eight
attributes: helpfulness (HLP, degree to which web aplikacija contains modules for
user's assistance), availability (AVL, degree to which inteface elements are
continuously accessed), interactivity (ITR, degree to which Web 2.0 aplication creates
a feeling of use of desktop application), error prevention (ERP, degree to which Web
application prevents the occurance of errors), reliability (RLB, degree to which Web
2.0 application works without errors or interruptions), recoverability (RCV, the extent
to which Web 2.0 application can recover from errors and interruptions in its
running), responsiveness (RSP, the extent of the speed of Web 2.0 application
response to users’ requests and actions), feedback (FDB, the extent to which Web 2.0
application displays its status or progress at any time). Information Quality (INQ)
captures the quality of content which is result of using a Web 2.0 application. This
category contains five different attributes: correctness (CRC, degree to which
information content is free of errors), coverage (CRG, degree to which information
content is appropriate, complete and compactly represented), credibility (CDB, degree
to which information content is unbiased, trustworthy and verifiable), timeliness
(TLS, degree to which information content is up to date) and value-added (VAD, degree to which information content is fresh and advantageous). Performance (PFM)
refers to the quality of performing assignments by means of Web 2.0 application
interface functionalities This category includes three attributes: effectiveness (EFE,
degree to which assignment can be achieved with accuracy and completeness),
usefulness (UFL, degree to which user perceives Web 2.0 application as most
appropriate solution for perfoming assignment) and efficiency (EFI, degree to which
goal can be achieved with minimal consumption of resources). Effort (EFO) is an
extent of perceived and estimated mental and physical energy when executing a task
with Web 2.0 applications. This category is subdivided into eight attributes: minimal
action (MAC, degree to which assignment solution can be achieved in a minimum
number of steps), minimal memory load (MEL, refers to a amount of information the
user needs to remember when carrying out the tasks), accessibility (ACS, extent to
which Web 2.0 application can be used by people with widest range of disabilites),
controllability (CTR, level of user’s freedom while completing the task), ease of use
(EOU, degree to which Web 2.0 application can be used without help), learnability
(LRN, measures how easily the user can learn to use Web interface functionalities),
memorability (MRB, measures how easy it is to memorize and remember how to use the Web 2.0 application), and understandability (UND, extent to which interface
elements are clear and unambiguous to the user). To facilitate data collection in this
study, two theoretically separated attributes, that is, minimal action and minimal
memory load, are logically combined into a single attribute that is named physical and
mental effort (PME). Acceptability (ACP) consists of attributes that directly
contribute to the success of a Web 2.0 application, including playfulness (PLY, extent
to which using a Web 2.0 application is fun and stimulating), satisfaction (STF, extent
to which Web 2.0 application can meet user's expectations) and loyalty (LOY, the
users’ intention to continue to use a Web application or to recommend it to their
colleagues). The main aim of this paper is to investigate to what extent the proposed
model and associated measuring instruments are appropriate for evaluating the quality
in use of Web 2.0 applications, particularly mind mapping services.
2 Methodology
Participants. We recruited 86 participants (70.9% male, 29.1% female), with an
average age of 20.31 years (SD = 1.868). Participants were students of Information
Science at local faculty. All of them used popular Web 2.0 applications (Facebook and YouTube) on a regular basis (71% and 77.9%, respectively do so twice a day or
more often). The study was conducted as a part of the Data Structures course. It
should be noted that students have not participated in similar studies before.
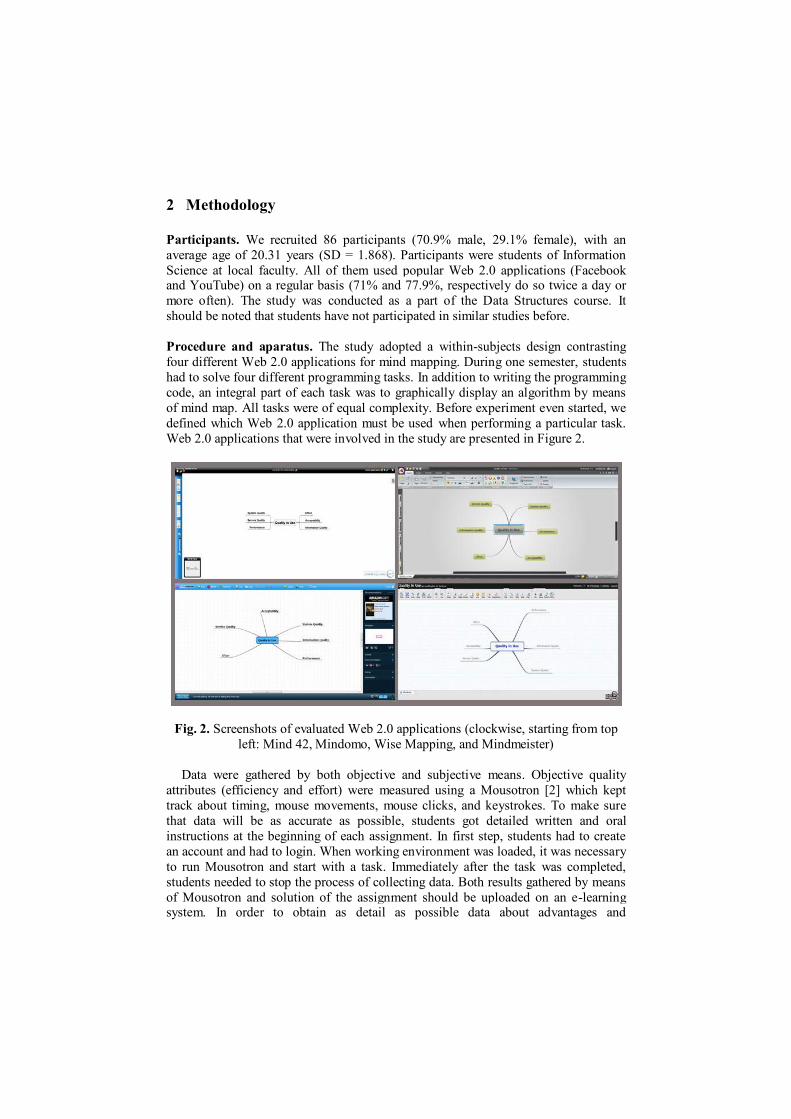
Procedure and aparatus. The study adopted a within-subjects design contrasting
four different Web 2.0 applications for mind mapping. During one semester, students
had to solve four different programming tasks. In addition to writing the programming
code, an integral part of each task was to graphically display an algorithm by means
of mind map. All tasks were of equal complexity. Before experiment even started, we
defined which Web 2.0 application must be used when performing a particular task.
Web 2.0 applications that were involved in the study are presented in Figure 2.
Fig. 2. Screenshots of evaluated Web 2.0 applications (clockwise, starting from top
left: Mind 42, Mindomo, Wise Mapping, and Mindmeister)
Data were gathered by both objective and subjective means. Objective quality
attributes (efficiency and effort) were measured using a Mousotron [2] which kept
track about timing, mouse movements, mouse clicks, and keystrokes. To make sure
that data will be as accurate as possible, students got detailed written and oral
instructions at the beginning of each assignment. In first step, students had to create
an account and had to login. When working environment was loaded, it was necessary
to run Mousotron and start with a task. Immediately after the task was completed,
students needed to stop the process of collecting data. Both results gathered by means
of Mousotron and solution of the assignment should be uploaded on an e-learning system. In order to obtain as detail as possible data about advantages and

disadvantages of the used mind mapping Web 2.0 applications, retrospective thinking
aloud (RTA) method was employed. RTA allowed students to complete the
assignment first, and then describe their experiences of working with a Web 2.0
application. Immediately after they had completed educational activity, students had
to make a critical review of the mind mapping application and deliver it in the form of
written report. One of the authors conducted a two-phase analysis of data collected
with RTA method. Firstly, positive and negative comments related to the particular
Web 2.0 applications were extracted from reports. Subsequently, each comment has
been attached to the quality attributes with which definition it had the greatest
similarity. At the end of the semester, perceived quality in use was evaluated by
means of post-use questionnaire.
Measures. Effort was measured by means of three metrics: distance traversed, mouse
clicks, and keystrokes. Distance refers to the number of milimeters traversed by user
while moving mouse between two points. Mouse clicks are the sum of all the mouse
clicks (left, right, middle) that were made when reaching the solution of the task.
Double clicks were not specifically analyzed, but were recorded as left clicks. Keystrokes denote the total number of keys on the keyboard that the user has clicked
while reaching the task solution. Other parameters that could affect the amount of
manual effort, such as the quantity of mouse wheel, are out of the scope of this study.
The sum of previous three metrics is denoted as estimated effort. Apart from manual
effort, efficiency in use was also measured. Time is the amount of time expressed in
seconds required to complete the task. Mouse moving speed (MMS) is ratio of
distance and time expressed in millimeters per minute (mm/min). Keyboard typing
speed (KTS) is ratio of keystrokes and time expressed in number of keystrokes per
minute (ks/min). Mouse clicking speed (MCS) is ratio of mouse clicks and time
expressed in number of mouse clicks per minute (mc/min). The sum of time, mouse
moving speed and mouse clicking speed is denoted as estimated efficiency. Given that
the execution of assignments was not time limited, objective assessment of the
effectiveness was out of scope of this study. The post-use questionnaire was used for
gathering data about perceived quality in use of the evaluated Web 2.0 applications.
Each quality attribute was measured with between three and eight items. Responses
were modulated on a five points Likert scale (1 – strongly agree, 5 – strongly
disagree). In addition, overall preferences were assessed directly by a 4-point semantic differential item (1 - best, 4 - worst) asking users to rank the quality in use
of mind mapping Web 2.0 applications. The Cronbach’s alpha values (presented in
Table 1) ranged from .701 to .896 thus indicating high reliability of scale.
Table 1. Internal reliability of scale
Mind 42 Mindmeister Mindomo Wise Mapping
System Quality .779 .767 .798 .794
Service Quality .720 .701 .732 .741
Data Quality .811 .789 .769 .788
Performance .816 .741 .774 .796 Effort .896 .868 .884 .885
Acceptability .855 .850 .863 .831
Combining three different methods (logging actual use, questionnaire and RTA),
complementary data of the estimated and perceived quality in use of the mind
mapping applications was gathered. In this way, the process of detection of problems
in Web 2.0 applications usage is accelerated while the identification of key quality
attributes is facilitated. The research results are presented in more detail in the
following section.
3 Results
Given that data were not normally distributed (K-S 1,2,3,4 > 0.05), an analysis was carried out by means of non-parametric tests. All reported results are in median.
3.1 Estimated Quality in Use
Effort. The analysis of data revealed statistically significant differences between the
four Web 2.0 interfaces in terms of mouse movements during the task
accomplishment (χ2(3) = 23.255, p < .001). The Wilcoxon Signed-Rank Tests with a
Bonferroni pairwise comparisons revealed that participants needed to make
significantly less mouse movements to reach the task solution using the Mind 42
rather than Mindmeister (Z = -3.585, p = .000, r = - .27) or Mindomo (Z = -4.433, p =
.000, r = - .34). Both effects were medium in size with significance level set at p <
.008. No significant differences were observed in other pairwise comparisons.
Type of used Web 2.0 application has significantly affected the amount of mouse
clicks made by users during the design of mind maps (χ2(3) = 11.102, p < .05). A
comparison of the number of mouse clicks among all four Web 2.0 applications
revealed that users made much less mouse clicks using Mind 42 or Mindmeister than
using Mindomo or Wise Mapping. Therefore, the number of required comparisons in post-hoc analysis was reduced and the significance level set at p < .0125. Difference
in number of mouse clicks was significant between Mindmeister and Wise Mapping
(Z = -2.995, p = .003, r = - .23), between Mind 42 and Wise Mapping (Z = -2.824, p =
.005, r = - .22), and between Mindmeister and Mindomo (Z = -2.556, p = .011, r = -
.19) while difference between Mindmeister and Mindomo was not significant (Z = -
1.955, p = .051). All effects were small in size. No significant difference between all
four Web 2.0 applications in terms of the amount of keystrokes made when reaching
the task solution was found (χ2(3) = 1.806, p = .614).
Table 2. Results of objective measure effort for the four selected mind mapping Web 2.0
applications (note that lower score means better result)
Mind 42 Mindmeister Mindomo Wise Mapping
Distance (mm) 30759 38049 41313 39411
Keystrokes 554 536 612 561
Mouse clicks 292 286 353 361
Effort 31610 38993 42693 40248
There was a significant difference in a amount of estimated effort among all four
Web 2.0 applications (χ2(3) = 22.858, p < .001). Pairwise comparison revealed a
significant difference between Mind 42 and Mindomo (Z = -4.407, p = .000, r = -
.37), and between Mind 42 and Mindmeister (Z = -3.563, p = .000, r = - .27).
Difference between Mind 42 and Wise Mapping was on the edge of significance level
(p < .0125). According to the summary of the results presented in Table 2, students
experienced less effort using Mind 42 than any of the three remaining Web 2.0
applications.
Efficiency. Friedman’s ANOVA revealed significant difference among four different
Web 2.0 applications in speed of moving mouse during the task solving (χ2(3) =
40.083, p < .001). To follow-up this finding, post-hoc analysis with significance level
set at p < 0.125 was applied. A significant difference in speed of mouse movements
was found between Mind 42 and Mindmeister (Z = -4.567, p = .000, r = - .35),
between Mind 42 and Mindomo (Z = -4.825, p = .000, r = - .37), between Wise
Mapping and Mindmeister (Z = -4.192, p = .000, r = - .32), and finally between Wise Mapping and Mindomo (Z = -3.718, p = .000, r = - .28). Both keyboard typing (χ2(3)
= 1.806, p = .614) and mouse clicking (χ2(3) = 6.402, p = .094) speeds were not
significantly different among all four evaluated Web 2.0 applications. A significant
difference in estimated efficiency of evaluated Web 2.0 applications was discovered
(χ2(3) = 41.829, p < .001). Post hoc analysis have shown significant difference in
overall efficiency between Mindomo and Mind 42 (Z = -4.851, p = .000, r = - .37),
Mindmeister and Mind 42 (Z = -4.549, p = .000, r = - .35), Wise Mapping and
Mindmeister (Z = -4.231, p = .000, r = - .35), and Wise Mapping and Mindomo (Z = -
3.757, p = .000, r = - .29). According to the results presented in Table 3, of all four
evaluated Web 2.0 applications, Mindmeister was the most efficient in reaching given
assignments.
Table 3. Results of objective measure efficiency for the four selected mind mapping Web 2.0 applications (note that higher score means better result)
Mind 42 Mindmeister Mindomo Wise Mapping
MMS (mm/min) 1952 2573 2550 2074
KTS (ks/min) 35 34 35 33 MCS (mc/min) 18 19 19 20
Efficiency 2013 2635 2604 2122
3.2 Perceived Quality in Use
Rank. A significant value of chi square (χ2(3) = 37.381, p < .001) indicates the
existence of differences in subjective ranking measure among evaluated Web 2.0
applications. Post-hoc procedure with significance level set at p < .0167 revealed differences between Wise Mapping and Mindmeister (Z = -4.800, p = .000, r = - .37),
Wise Mapping and Mindomo (Z = -4.668, p = .000, r = - .36), Mindomo and Mind 42
(Z = -2.864, p = .004, r = - .22), Mindmeister and Mind 42 (Z = -2.671, p = .008, r = -
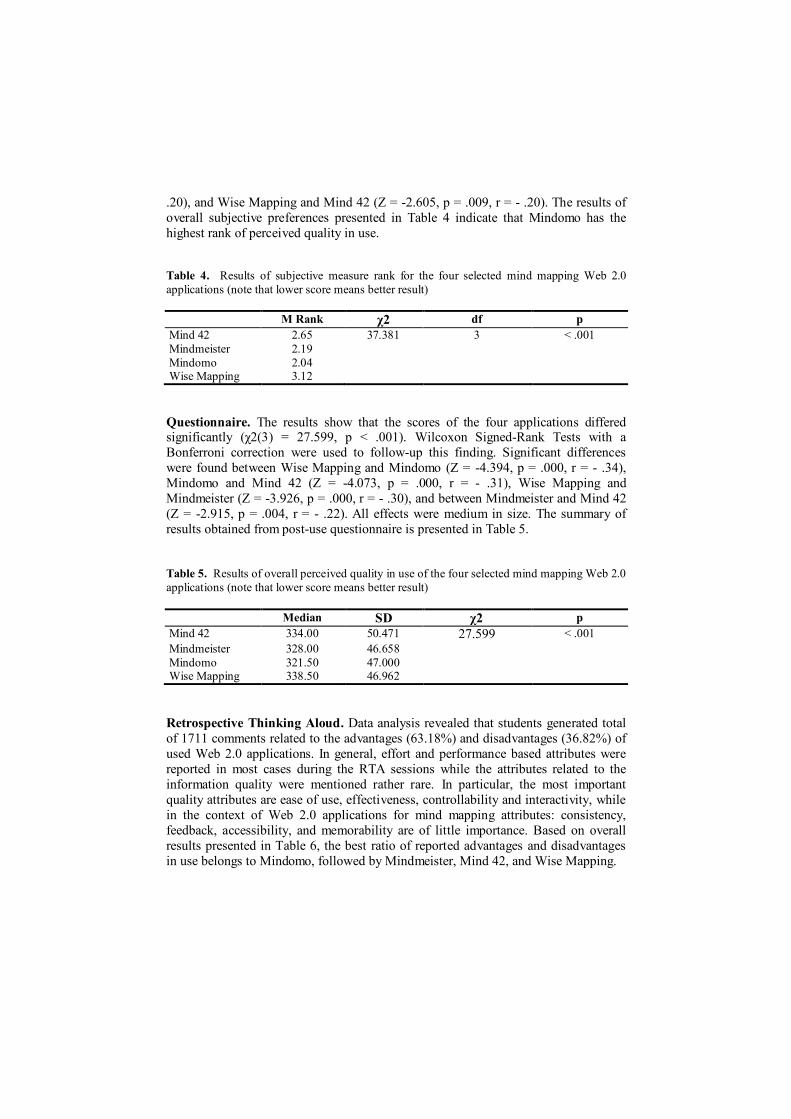
.20), and Wise Mapping and Mind 42 (Z = -2.605, p = .009, r = - .20). The results of
overall subjective preferences presented in Table 4 indicate that Mindomo has the
highest rank of perceived quality in use.
Table 4. Results of subjective measure rank for the four selected mind mapping Web 2.0
applications (note that lower score means better result)
M Rank χ2 df p
Mind 42 2.65 37.381 3 < .001
Mindmeister 2.19
Mindomo 2.04 Wise Mapping 3.12
Questionnaire. The results show that the scores of the four applications differed significantly (χ2(3) = 27.599, p < .001). Wilcoxon Signed-Rank Tests with a
Bonferroni correction were used to follow-up this finding. Significant differences
were found between Wise Mapping and Mindomo (Z = -4.394, p = .000, r = - .34),
Mindomo and Mind 42 (Z = -4.073, p = .000, r = - .31), Wise Mapping and
Mindmeister (Z = -3.926, p = .000, r = - .30), and between Mindmeister and Mind 42
(Z = -2.915, p = .004, r = - .22). All effects were medium in size. The summary of
results obtained from post-use questionnaire is presented in Table 5.
Table 5. Results of overall perceived quality in use of the four selected mind mapping Web 2.0
applications (note that lower score means better result)
Median SD χ2 p
Mind 42 334.00 50.471 27.599 < .001
Mindmeister 328.00 46.658
Mindomo 321.50 47.000 Wise Mapping 338.50 46.962
Retrospective Thinking Aloud. Data analysis revealed that students generated total
of 1711 comments related to the advantages (63.18%) and disadvantages (36.82%) of
used Web 2.0 applications. In general, effort and performance based attributes were
reported in most cases during the RTA sessions while the attributes related to the
information quality were mentioned rather rare. In particular, the most important
quality attributes are ease of use, effectiveness, controllability and interactivity, while
in the context of Web 2.0 applications for mind mapping attributes: consistency,
feedback, accessibility, and memorability are of little importance. Based on overall
results presented in Table 6, the best ratio of reported advantages and disadvantages
in use belongs to Mindomo, followed by Mindmeister, Mind 42, and Wise Mapping.
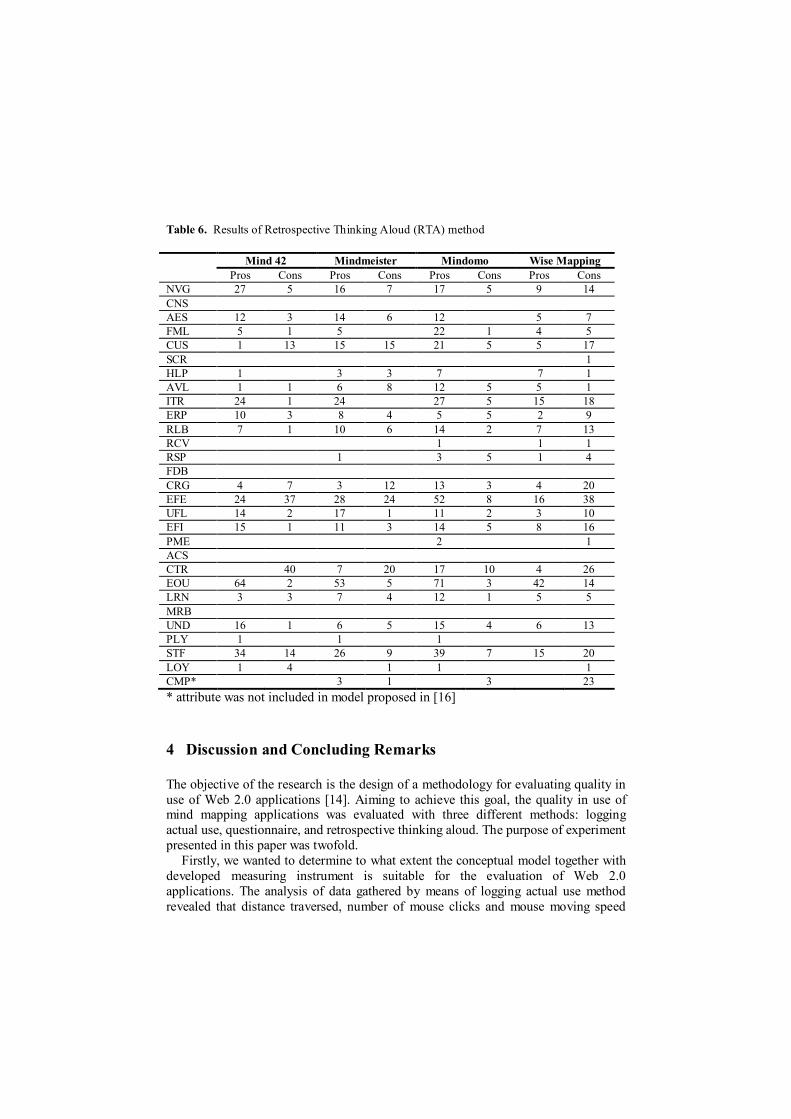
Table 6. Results of Retrospective Thinking Aloud (RTA) method
Mind 42 Mindmeister Mindomo Wise Mapping
Pros Cons Pros Cons Pros Cons Pros Cons
NVG 27 5 16 7 17 5 9 14
CNS
AES 12 3 14 6 12 5 7
FML 5 1 5 22 1 4 5
CUS 1 13 15 15 21 5 5 17
SCR 1
HLP 1 3 3 7 7 1
AVL 1 1 6 8 12 5 5 1
ITR 24 1 24 27 5 15 18
ERP 10 3 8 4 5 5 2 9
RLB 7 1 10 6 14 2 7 13
RCV 1 1 1
RSP 1 3 5 1 4
FDB
CRG 4 7 3 12 13 3 4 20
EFE 24 37 28 24 52 8 16 38
UFL 14 2 17 1 11 2 3 10
EFI 15 1 11 3 14 5 8 16
PME 2 1
ACS
CTR 40 7 20 17 10 4 26
EOU 64 2 53 5 71 3 42 14
LRN 3 3 7 4 12 1 5 5
MRB
UND 16 1 6 5 15 4 6 13
PLY 1 1 1
STF 34 14 26 9 39 7 15 20
LOY 1 4 1 1 1
CMP* 3 1 3 23
* attribute was not included in model proposed in [16]
4 Discussion and Concluding Remarks
The objective of the research is the design of a methodology for evaluating quality in
use of Web 2.0 applications [14]. Aiming to achieve this goal, the quality in use of mind mapping applications was evaluated with three different methods: logging
actual use, questionnaire, and retrospective thinking aloud. The purpose of experiment
presented in this paper was twofold.
Firstly, we wanted to determine to what extent the conceptual model together with
developed measuring instrument is suitable for the evaluation of Web 2.0
applications. The analysis of data gathered by means of logging actual use method
revealed that distance traversed, number of mouse clicks and mouse moving speed

can be used in analysis and comparison of Web 2.0 applications. Namely, through the
use of these objective metrics statistically significant difference between the evaluated
Web 2.0 applications can be determined. However, measures of numbers of
keystrokes, keyboard typing and mouse clicking speeds have not shown the
discriminant validity. We believe that this is because experiment was not time-
limited. Another possible reason may be narrow specialization of evaluated
applications. Accordingly, results obtained from post-use questionnaire have shown
statistically significant differences among all four evaluated Web 2.0 applications.
This suggests that Web 2.0 applications can be ranked by mean values.
Secondly, we wanted to identify the importance that users attach to certain
attributes of quality in use and to detect whether the set of most important attributes
depends on the type of Web 2.0 application. The results gathered by means of
retrospective thinking aloud (RTA) method have revealed the importance of effort
(28.99%) and performance (21.43%) based attributes of quality in use. In particular,
participants felt especially satisfied and comfortable working with Web 2.0
applications which have met following quality attributes: ease of use, effectiveness,
controllability, interactivity, navigability, customizability, efficiency, coverage, understandability, and reliability. In addition, analysis of data showed that some
attributes (consistency, feedback, accessibility, and memorability) were not
mentioned even once during the RTA session. Possible reasons may be: majority of
users do not have any kind of disability; memorability can be evaluated when the
application is re-used with a time lag, etc. On the other hand, compatibility (the
degree to which Web 2.0 application works equally well within different browsers,
operating systems, or devices) which was not included in the proposed model has
proven to be important indicator of problems in use of Web 2.0 applications. The
results were similar to findings presented in [15] which suggests that: (i) there is a
general set of attributes that needs to be measured independently of the type of Web
2.0 applications; (ii) the weight of an attribute depends on the type of evaluated Web
2.0 application; and (iii) there is a set of attributes aimed for measuring quality in use
of specific types of Web 2.0 applications. The results of estimated and perceived
quality in use do not match (which is coherent with findings presented in e.g. [7])
indicating that quality in use should be measured with both subjective and objective
instruments since they are aimed for evaluating different aspects of Web 2.0
applications. In addition, we must emphasize that homogeneous set of four evaluated applications is rather modest sample to extract sound conclusions on the importance
of each category on the quality in use of Web 2.0 applications. Therefore, our future
work will be focused on: (i) applying the proposed model to evaluate the quality in
use of various Web 2.0 applications in different context of use; (ii) revision of
attributes, model and measuring instruments; (iii) improvement of a proposed
methodology with an aim to facilitate analysis and comparison of evaluated Web 2.0
applications.

References
1. Almeida, J.M., Gonçalves, M.A., Figueiredo, F., Pinto, H., Belém, F.: On the Quality of
Information for Web 2.0 Services. IEEE Internet Computing, 14 (6), pp. 47--55 (2010)
2. Blacksun Software, http://www.blacksunsoftware.com/mousotron.html (2011)
3. Bevan, N.: Extending Quality in Use to Provide a Framework for Usability Measurement.
Lecture Notes in Computer Science. 5619, pp. 13--22 (2009) 4. Bevan, N., Macleod, M.: Usability measurement in context. Behaviour & Information
Technology. 13, pp. 132--145 (1994)
5. Cappiello, C., Daniel, F., Matera, M.: A Quality Model for Mashup Components. Lecture
Notes in Computer Science, 5648, pp. 236--250 (2009) 6. Chiou, W-C., Lin, C-C., Perng, C.: A strategic framework for website evaluation based on
a review of the literature from 1995–2006. Information & Management. 47, 282--290
(2010)
7. Frøkjær, E., Hertzum, M., Hornbæk, K.: Measuring usability: Are effectiveness, efficiency, and satisfaction really correlated? In: Proceedings of the ACM CHI Conference
on Human Factors in Computing Systems, pp 345--352. ACM, New York (2000)
8. Hart, J., Ridley, C., Taher, F., Sas, C., Dix, A.: Exploring the Facebook Experience: A
New Approach to Usability. In: 5th Nordic conference on Human-computer interaction: building bridges, pp. 471--474. ACM, Lund (2008)
9. Hassenzahl, M., Tractinsky, N.: User experience - a research agenda. Behaviour &
Information Technology, 25 (2), pp. 91--97 (2006)
10. ISO/IEC 25010:2011. Systems and software engineering -- Systems and software Quality Requirements and Evaluation (SQuaRE) -- System and software quality models (2011)
11. Lew, P., Olsina, L., Zhang, L.: Quality, Quality in Use, Actual Usability and User
Experience as Key Drivers for Web Application Evaluation. Lecture Notes in Computer
Science. 6189, pp. 218--232 (2010) 12. Nielsen, J.: Heuristic evaluation. In: Nielsen, J., Mack, R.L. (eds.) Usability Inspection
Methods. John Wiley & Sons, New York (1994)
13. Olsina, L., Sassano, R., Mich, L.: Specifying Quality Requirements for the Web 2.0
Applications. In: Proceedings of 7th International Workshop on Web-oriented Software Technology (IWWOST 2008), pp 56--62, CEUR, Bratislava (2008)
14. Orehovački, T.: Development of a Methodology for Evaluating the Quality in Use of Web
2.0 Applications. In: 13th IFIP TC13 Conference on Human-Computer Interaction –
INTERACT 2011 (accepted for publishing in Lecture Notes in Computer Science) 15. Orehovački, T.: Perceived Quality of Cloud Based Applications for Collaborative Writing.
In: Pokorny, J., et al. (eds.) Information Systems Development – Business Systems and
Services: Modeling and Development. Springer, Heidelberg (in press)
16. Orehovački, T.: Proposal for a Set of Quality Attributes Relevant for Web 2.0 Application Success. In: 32nd International Conference on Information Technology Interfaces, pp.
319--326. IEEE Press, Cavtat (2010)
17. Silva, P.A., Dix, A.: Usability - Not as we know it! In: 21st British HCI Group Annual
Conference on HCI 2007: People and Computers XXI: HCI...but not as we know it - Volume 2, pp. 103--106. ACM, University of Lancaster (2007)
18. Thompson, A-J., Kemp, E.A.: Web 2.0: extending the framework for heuristic evaluation.
In: 10th International Conference NZ Chapter of the ACM's Special Interest Group on
Human-Computer Interaction, pp. 29--36. ACM, New Zealand (2009)
Related Documents