South African Journal of Geomatics, Vol. 4, No. 3, August 2015 285 Exploring the potential for geographical knowledge systems in upgrading informal settlements in Cape Town Bosiu Lefulebe 1 , Kevin Musungu 2 , Siddique Motala 3 123 Department of Civil Engineering and Surveying, Cape Peninsula University of Technology Cape Town, South Africa, [email protected] DOI: http://dx.doi.org/10.4314/sajg.v4i3.9 Abstract Residents of informal settlements are often faced with lack of essential services. These include services such as water, sanitation and electricity. Authorities responsible for providing these services often use Geographical Information Systems (GIS) for analysis prior to proposing developments in these settlements. However, the information used in the GIS analysis is often based on the physical characteristics of the informal settlement being analysed. In contrast, there has been a growing call for the use of information collected from the actual residents of the settlements for analysis prior to the upgrading of the settlements. The work done in this study is conducted in partnership with a local NGO that uses baseline information in informal settlements to create strategies to lower incidences of crime. This paper specifically focuses on introducing GIS spatial analysis and mapping in relation to informal settlements upgrading based on information gathered from the residents of the informal settlement. Moreover the final produced maps will be interpreted together with VPUU, which represents residents of Monwabisi Park community, simply because they have indigenous knowledge of the area. This research outlines a methodology of GIS analysis for Informal settlements upgrading using GIS, making use of five different analysis methods: Buffer analysis, thematic mapping, Thiessen polygons, distance mapping and Multi Criteria Evaluation. The case study area is Monwabisi Park in Cape Town. The study has revealed that the use of indigenous knowledge in GIS analysis for upgrading could be very valuable in making scientific and alternate decisions during informal settlement upgrading process. Key words: Informal settlements, GIS participation, Buffer Analysis, Distance Matrix, Thiessen Polygons, Thematic Mapping, Multi-Criteria Evaluation (MCE) 1. Introduction 1.1 Background and Motivation Khayelitsha is Cape Town’s biggest township, which was created for the black population as a result of the South Africa’s apartheid legislation. It is located in the province of the Western Cape, on the south-east of Cape Town’s metropolitan area. The informal settlement of Monwabisi Park is the site of this study, and lies on the South-East side of Khayelitsha. The geographical boundaries of Monwabisi Park are defined by the following main roads; Mew way towards the North, Steve Biko towards the west and Oscar Mphetha towards the east, together with Wolfgat Nature Reserve. Figure 1 shows the geographical location of Monwabisi Park. Figure 1. Geographical location of Monwabisi Park

Welcome message from author
This document is posted to help you gain knowledge. Please leave a comment to let me know what you think about it! Share it to your friends and learn new things together.
Transcript

South African Journal of Geomatics, Vol. 4, No. 3, August 2015
285
Exploring the potential for geographical knowledge systems in upgrading informal settlements in Cape Town
Bosiu Lefulebe1, Kevin Musungu 2, Siddique Motala3 123 Department of Civil Engineering and Surveying, Cape Peninsula University of
Technology Cape Town, South Africa, [email protected]
DOI: http://dx.doi.org/10.4314/sajg.v4i3.9
Abstract
Residents of informal settlements are often faced with lack of essential services. These include services such as water, sanitation and electricity. Authorities responsible for providing these services often use Geographical Information Systems (GIS) for analysis prior to proposing developments in these settlements. However, the information used in the GIS analysis is often based on the physical characteristics of the informal settlement being analysed. In contrast, there has been a growing call for the use of information collected from the actual residents of the settlements for analysis prior to the upgrading of the settlements.
The work done in this study is conducted in partnership with a local NGO that uses baseline information in informal settlements to create strategies to lower incidences of crime. This paper specifically focuses on introducing GIS spatial analysis and mapping in relation to informal settlements upgrading based on information gathered from the residents of the informal settlement. Moreover the final produced maps will be interpreted together with VPUU, which represents residents of Monwabisi Park community, simply because they have indigenous knowledge of the area. This research outlines a methodology of GIS analysis for Informal settlements upgrading using GIS, making use of five different analysis methods: Buffer analysis, thematic mapping, Thiessen polygons, distance mapping and Multi Criteria Evaluation. The case study area is Monwabisi Park in Cape Town. The study has revealed that the use of indigenous knowledge in GIS analysis for upgrading could be very valuable in making scientific and alternate decisions during informal settlement upgrading process.
Key words: Informal settlements, GIS participation, Buffer Analysis, Distance Matrix, Thiessen Polygons, Thematic Mapping, Multi-Criteria Evaluation (MCE)
1. Introduction
1.1 Background and Motivation
Khayelitsha is Cape Town’s biggest township, which was created for the black population as a result of the South Africa’s apartheid legislation. It is located in the province of the Western Cape, on the south-east of Cape Town’s metropolitan area. The informal settlement of Monwabisi Park is the site of this study, and lies on the South-East side of Khayelitsha. The geographical boundaries of Monwabisi Park are defined by the following main roads; Mew way towards the North, Steve Biko towards the west and Oscar Mphetha towards the east, together with Wolfgat Nature Reserve. Figure 1 shows the geographical location of Monwabisi Park.
Figure 1. Geographical location of Monwabisi Park
South African Journal of Geomatics, Vol. 4, No. 3, August 2015
286
Initially Monwabisi Park was reserved for landfill purposes. It was occupied in 1997 by some residents from Harare, another suburb of Khayelitsha. The exact population of Monwabisi Park is unknown because of its dynamic nature as an informal settlement. At the time of this study, it had 6000 households. Like all informal settlements in South Africa, Monwabisi Park faces developmental challenges. This is because no proper town planning measures were taken into consideration during its establishment. These include the following:
a) The absence of a proper drainage systems: This is most evident during high levels of flooding especially in the winter. During heavy winter rains in Cape Town, there are insufficient drainage systems to channel the run-off water.
b) Lack of formal electricity: This results in a high rate of informal electrical connections to households.
c) Lack of essential services: Not all households have facilities like toilets, running water and proper refuse collection facilities.
d) A poor road network: existing paths were only designed for pedestrians. Cars were not catered for, making it difficult or impossible for vehicles to gain access. This is particularly detrimental when emergency service vehicles need access to properties.
e) Significant criminal activities include theft, domestic violence, sexual crimes and vandalism.
Monwabisi Park was identified as the study area by Violence Prevention through Urban Upgrading (VPUU), the research partners and initiators of this project. VPUU is a group based in the City of Cape Town, and it uses social engagement and town planning as tools in fighting crime in Khayelitsha, mainly to improve living conditions of residents. VPUU believes that getting communities to identify common problems and solutions could contribute the reduction of crime in the community. Having done the GIS mapping in previous projects, VPUU approached the authors to explore further GIS mapping and spatial analysis that could improve the extent of the information that could be derived from the data gathered from the community residents. VPUU, together with the community of Monwabisi Park, collected the demographic data used in this study through questionnaires and mapping each household structure. This more “democratic” application of GIS, which allowed the community to participate, was conducted based on prescriptions of the body of knowledge known as Participatory GIS (PGIS) or Geographical Knowledge Systems (GKS). The incorporation of indigenous knowledge of the area in the decision making process is emphasized so as to empower the community (Musungu et al. 2012). The following section gives a brief summary of Participatory GIS.
1.2 Participatory GIS (PGIS)
PGIS has been used mostly in informal settlement upgrading. Laituri (2003: 25) describes Participatory GIS as:
“A confluence of social activity such as grassroots organizations and government decision making with technology in specific places or grounded geographies”.
Quan et al. (2001) also describes PGIS as follows:
“Participatory GIS is the integration of local knowledge as well as stakeholders’ perspectives in a GIS”.
Definitions of PGIS do vary, however they all advance the development of a link between a locality and the sharing of information between stakeholders in that locality. Notably, there is often a vacuum of information on informal settlements. The spatial data bottleneck around informal settlements occurs more often because unlike formal settlements they are not acknowledged by the local municipalities, and hence this results in unavailable, out-dated or insufficient data (Abbott, 2001). Hence, indigenous knowledge often forms the main source of studies in informal settlements (Gonzalez, 2000, Livengood and Kunte, 2012. Musungu et al. 2012). Furthermore PGIS has the ability to empower communities in relation to solution of spatial planning problems, provided it is used adequately (McCall, 2003).
Rapid rural appraisal (RRA) / Participatory rural appraisal (PRA) methods of data collection in informal settlements include the use of questionnaires, aerial photos, participatory maps, remote sensing images, interviews and the use of ephemeral mapping, sketch mapping, and scale mapping (McCall, 2003). Musungu et al. 2012, Karanja, 2010 used questionnaires in South Africa for data collection and Raaijmakers et al. (2008) in Spain. Rambaldi et al. (2006) made use of ephemeral mapping, sketch mapping and scale mapping. These result in a sustainable technique of data capturing being established, and also a quick process of data collection, as residents are knowledgeable of problems affecting the community (Musungu et al., 2012). In return, the residents improve their knowledge concerning maps and GIS, as the goal behind developments in informal settlements is to improve living conditions of residents (Abbott, 2003). For instance at Monwabisi Park 20 members of the community volunteered in

South African Journal of Geomatics, Vol. 4, No. 3, August 2015
287
collection of spatial data, which involved the use of GPS and maps. As a result they were able to improve their knowledge concerning map reading skills and use of GPS.
Tran et al. (2009) conducted a study on suitable preparation and resource apportionment for disaster preparation in Thua Thien Hue, Vietnam, using GIS and local knowledge. Information collected from the community included demographic, socio-economic conditions and existing infrastructure, also information on the damage and loss caused by previous flood disasters. Furthermore elaborative study was carried out by Tripathi & Bhattarya (2004), focusing on the relevance of Indigenous Knowledge (IK) and inclinations in amalgamation of IK into GIS. IK can be defined as ‘‘the information base for a society, which facilitates communication and decision-making. Indigenous information systems are dynamic, and are continually influenced by internal creativity and experimentation as well as by contact with external systems’’ (Flavier et al., 1995, p. 479).
2. Literature on GIS analysis in relation to planning
2.1 Buffer Analysis
Buffer analysis has been used in modelling phases of urban planning, and upgrading (Toosi et al, 2005; Cheng & Masser, 2003). Buffer analysis is used for identifying areas surrounding geographic features. The process involves generating a buffer around existing geographic features and then identifying or selecting features based on whether they fall inside or outside the boundary of the buffer. Buffering usually creates two areas: one area that is within a specified distance to selected real world features and the other area that is beyond. The area that is within the specified distance is called the buffer zone. It is an analysis method which uses database information of a point, surface of entity and arc, to generate barrier zones of a certain width around selected features of interest. In order for a buffer analysis to be effective, the created buffer zone map has to be overlaid with other layers. These form part of the analysis used to determine the results. Buffer analysis maps are classified in three forms. These are: Surface buffer, Point buffer and arc buffer (Zunying et al, 2010).
A study carried out by Lin (2000) to examine the accessibility of settlement clusters on zoning maps, employed buffer analysis to define settlement clusters. This was done by creating 300m threshold buffers from the road system. Settlement clusters that were within the buffer zones were located within accessible distance, while settlement clusters that were outside the buffer zone boundaries were not located within an accessible distance. Resulting buffer maps were overlaid with class 3 land use layers, to achieve the required results.
2.2 Spatial Query
Spatial query is a statement or logical expression that selects geographic features based on location or spatial relationship. For example, a spatial query may find which points are contained within a polygon or set of polygons, find features within a specified distance of a feature, or find features that are adjacent to each other. One of the functions of GIS is data storage, which is stored in a database. Decision-makers make use of spatial query function to extract meaningful stored data. The ability of GIS to respond to questions of spatial patterns, queries on location and trends, is depended on spatial query function (Toosi et al, 2005; Pettit & Pullar, 1999). A query is only able to retrieve information which has already been stored in a database. GIS queries can be classified into query by attribute, and query by geometry (Jovanovic & Njegus, 2008). Spatial query plays a vital role in production of thematic maps. This can be seen in a study carried out by, Musungu et al (2012), where spatial query was used to extract households that experienced fire disaster, from a database that contained data about the whole settlement that the study was carried at. Furthermore in a study carried out by Maria et al (2010) a spatial query was used to retrieve points within a specific region of interest.
2.3 Multi Criteria Evaluation
Multi Criteria Evaluation (MCE) is a process of spatial resource allocation decisions in the context of multiple criteria (Voogd, 1983). Multi Criteria Evaluation is used to analyze a series of alternatives or objectives with a view to ranking them from the most preferable to the least preferable, using a structured approach. The Pairwise Comparison Method (PCM) is one way of executing MCE. PCM derives from the analytic hierarchy process (AHP) by Saaty (1980). Musungu et al (2012) conducted a study in informal settlements of Cape Town using Multi Criteria Evaluation and GIS for Flood Risk Analysis. Mapping of households that experienced disaster was done from data collected using questionnaires from the community. Variations used in evaluating disaster vulnerability included; the following exposure hazards; No disaster, Leaking roof, only fire, leaking roof, rising water and flood & fire.
Weights were calculated from pairwise comparison method for each alternative and were found to be 0.408, 2.243, 0.161, 0.097, 0.057 and 0.033 respectively. The worst case scenario was allocated the lowest weight, while the best case scenario was allocated the highest weight. The weights had a consistency ratio of 0.048 and were adopted as the value of 0.048 is below the threshold value of 0.1. Weights were then linked to shacks which were used in the

South African Journal of Geomatics, Vol. 4, No. 3, August 2015
288
GIS, and this made it possible for vulnerability maps to be created, and most vulnerable households were located in the settlement.
Similar methods have been used by Mahamba & Musungu (2014) for crime mapping in Cape Town as well as Yahaya & Abdalla (2010) in Hadejia-Jama’s River Basin in Nigeria where flood vulnerable areas were examined using MCE method. The latter study used rainfall; drainage network and land cover as the criteria whilst the previous study listed different types of crimes which included shootings and theft as criteria.
The reported studies show that MCE can be used in conjunction with GIS for vulnerability assessment and mapping.
2.4 Theissen polygons
Theissen polygons are generated from a set of sample points. Each Thiessen polygon defines an area of influence around its sample point, so that any location inside the polygon is closer to that point than any of the other sample points. Theissen polygons, also known as vonoroi polygons are often used in accessibility studies (Brabyn & Skelly, 2002; Kwan & Weber, 2008). The suitability of Theissen polygons in identifying closest service providers to specific locations has resulted in it being applied in educational services such as determining accessibility to libraries (Park, 2012; Hertel & Sprague, 2007; Kinikin, 2004).
Park (2012) carried out a study to assess physical accessibility of library. GIS was employed together with statistical analysis, road network for distance measuring purpose. Furthermore thiessen polygons defined areas within the library where registered users lived. Additionally thiessen polygons were used to investigate the effect of distance from registered users to the library. Findings from analysis of Theissen polygons indicated that 65.24% of the library registrants live within the area presented in each Theissen polygon, while the other 34.76% were not within the polygon. Moreover statistical analysis employed mean and median to analyze travelled distance from user’s homes to libraries. The reported study shows that thiessen polygons, network analysis, and statistical analysis, can be used in conjunction to assess accessibility of educational facilities, in this case being the library.
3. Approach and Methodology
The main aim of this study was to conduct additional analysis on the spatial data captured by a local Non-Governmental Organisation called Violence Protection through Urban Upgrading (VPUU). Moreover to use indigenous knowledge of residents for interpretation of final produced maps. VPUU wanted to optimize the use of GIS on the indigenous data that came out of the participatory mapping of Monwabisi Park. The existing analysis conducted by VPUU was largely restricted to thematic mapping of individual attributes which included gender and income. These will not be presented in this paper. After consultation with VPUU to understand their broad operational aims, data capture methods, and GIS methods they used, different types of spatial analysis metthods were identified that might be useful. The following section describes the data collection methods and the types of data that had been captured.
3.1 Enumeration and Mapping
For this project, the data was captured by field and office work. Some of the Monwabisi Park residents were involved in the data collection process. Before commencement of fieldwork, outlines of households were digitized, to create a polygon shape file. During the fieldwork, each team of four data collectors had the following responsibilities:
a) One person interviewing the respondents of the households;
b) One person painting the survey number on the shacks;
c) One person taking photographs of the households and interviewees; and
d) One person capturing the coordinates of the shacks with a hand held GPS
Table 1 shows a preliminary exploration of the types of data captured in the questionnaire:
South African Journal of Geomatics, Vol. 4, No. 3, August 2015
289
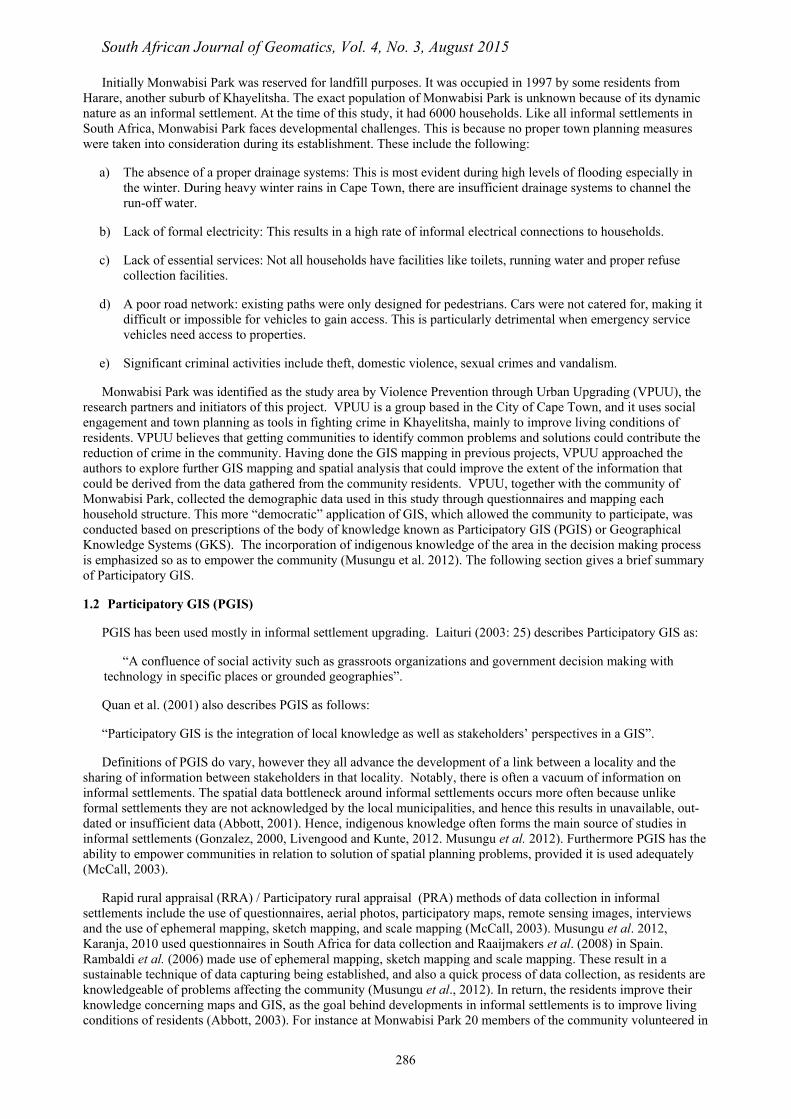
Table 1. Characteristics of data provided by VPUU
Data Data Type Content
Spatial location of households
Polygons Geographical location of households
Socio-economic demographic data
Text/attribute data Socio-economic and demographic information
Monwabisi Park sections Polygons Sections dividing Monwabisi Park
Contour line Line Elevation of Monwabisi Park terrain
The data had to be cleaned and the household shape file then had to be joined to the attribute data. Due to irregularities between the handwritten responses, the captured attribute data, and the numbering of the polygons in the shape-file, 1127 (18%) records (either lines in the attribute table, or polygons in the shape file) could not be used. This resulted in a shape file containing 5125 (82%) polygons with attribute data. This was deemed sufficiently representative of the community to be used for analysis.
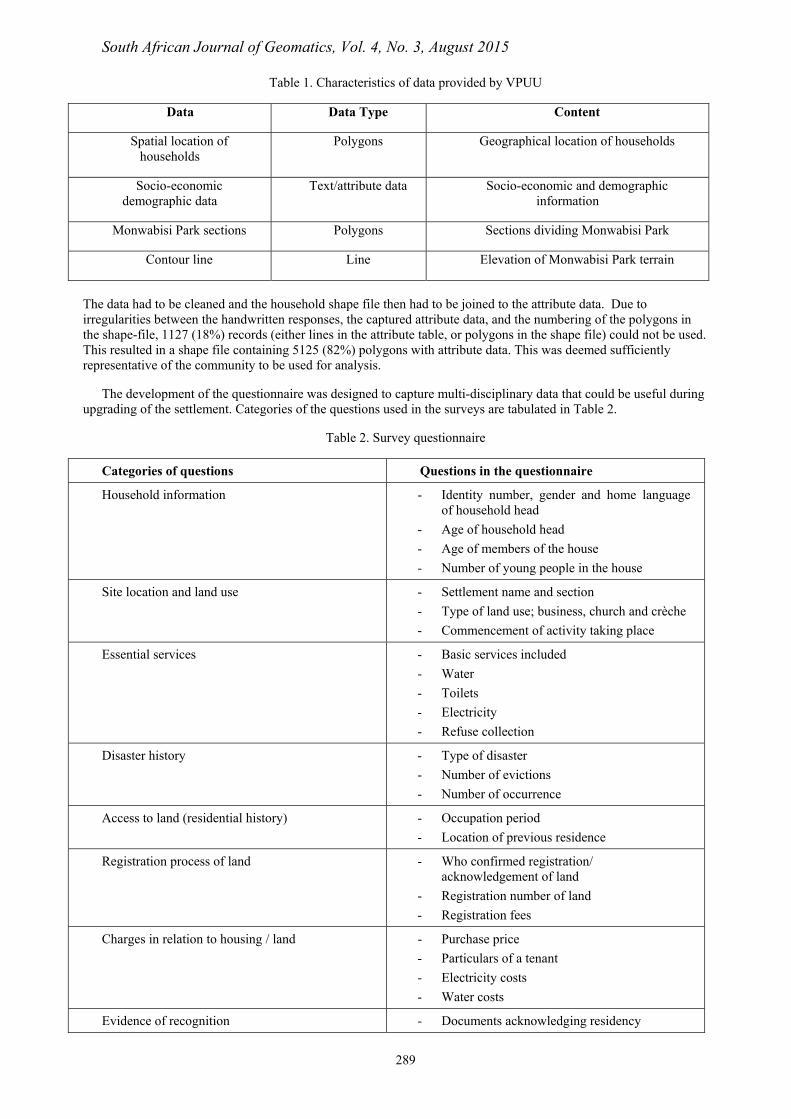
The development of the questionnaire was designed to capture multi-disciplinary data that could be useful during upgrading of the settlement. Categories of the questions used in the surveys are tabulated in Table 2.
Table 2. Survey questionnaire
Categories of questions Questions in the questionnaire
Household information - Identity number, gender and home language of household head
- Age of household head
- Age of members of the house
- Number of young people in the house
Site location and land use - Settlement name and section
- Type of land use; business, church and crèche
- Commencement of activity taking place
Essential services - Basic services included
- Water
- Toilets
- Electricity
- Refuse collection
Disaster history - Type of disaster
- Number of evictions
- Number of occurrence
Access to land (residential history) - Occupation period
- Location of previous residence
Registration process of land - Who confirmed registration/ acknowledgement of land
- Registration number of land
- Registration fees
Charges in relation to housing / land - Purchase price
- Particulars of a tenant
- Electricity costs
- Water costs
Evidence of recognition - Documents acknowledging residency
South African Journal of Geomatics, Vol. 4, No. 3, August 2015
290
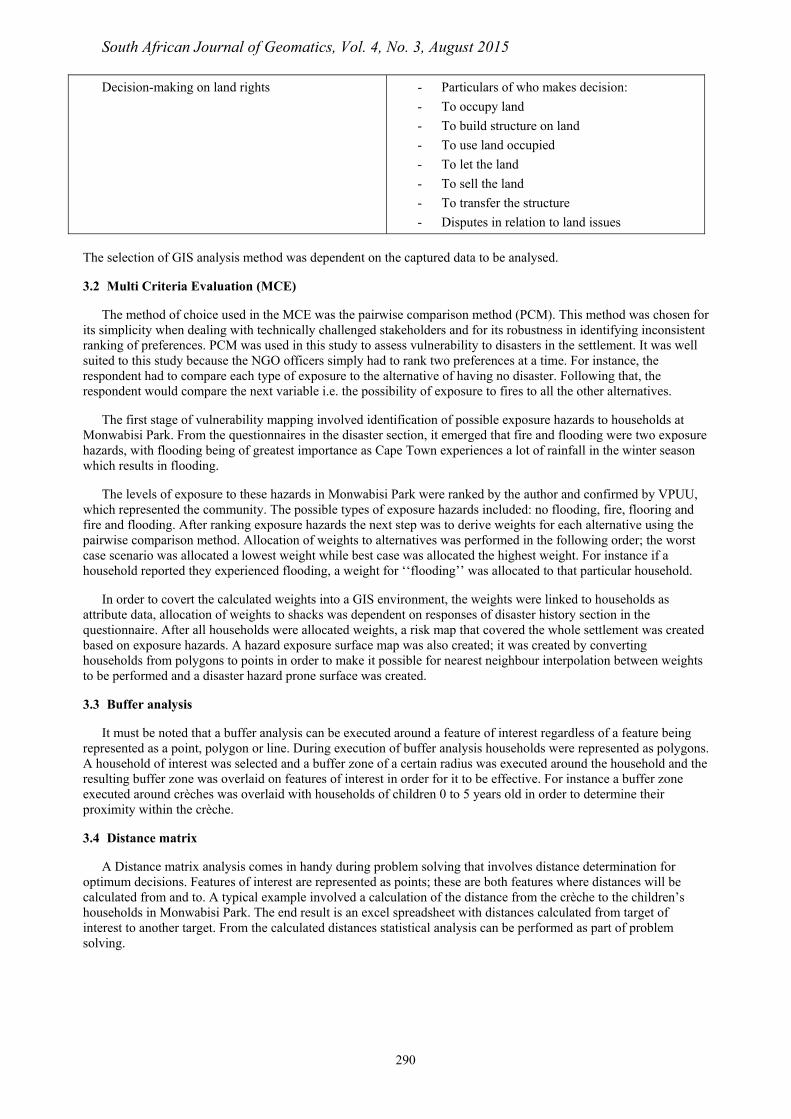
Decision-making on land rights - Particulars of who makes decision:
- To occupy land
- To build structure on land
- To use land occupied
- To let the land
- To sell the land
- To transfer the structure
- Disputes in relation to land issues
The selection of GIS analysis method was dependent on the captured data to be analysed.
3.2 Multi Criteria Evaluation (MCE)
The method of choice used in the MCE was the pairwise comparison method (PCM). This method was chosen for its simplicity when dealing with technically challenged stakeholders and for its robustness in identifying inconsistent ranking of preferences. PCM was used in this study to assess vulnerability to disasters in the settlement. It was well suited to this study because the NGO officers simply had to rank two preferences at a time. For instance, the respondent had to compare each type of exposure to the alternative of having no disaster. Following that, the respondent would compare the next variable i.e. the possibility of exposure to fires to all the other alternatives.
The first stage of vulnerability mapping involved identification of possible exposure hazards to households at Monwabisi Park. From the questionnaires in the disaster section, it emerged that fire and flooding were two exposure hazards, with flooding being of greatest importance as Cape Town experiences a lot of rainfall in the winter season which results in flooding.
The levels of exposure to these hazards in Monwabisi Park were ranked by the author and confirmed by VPUU, which represented the community. The possible types of exposure hazards included: no flooding, fire, flooring and fire and flooding. After ranking exposure hazards the next step was to derive weights for each alternative using the pairwise comparison method. Allocation of weights to alternatives was performed in the following order; the worst case scenario was allocated a lowest weight while best case was allocated the highest weight. For instance if a household reported they experienced flooding, a weight for ‘‘flooding’’ was allocated to that particular household.
In order to covert the calculated weights into a GIS environment, the weights were linked to households as attribute data, allocation of weights to shacks was dependent on responses of disaster history section in the questionnaire. After all households were allocated weights, a risk map that covered the whole settlement was created based on exposure hazards. A hazard exposure surface map was also created; it was created by converting households from polygons to points in order to make it possible for nearest neighbour interpolation between weights to be performed and a disaster hazard prone surface was created.
3.3 Buffer analysis
It must be noted that a buffer analysis can be executed around a feature of interest regardless of a feature being represented as a point, polygon or line. During execution of buffer analysis households were represented as polygons. A household of interest was selected and a buffer zone of a certain radius was executed around the household and the resulting buffer zone was overlaid on features of interest in order for it to be effective. For instance a buffer zone executed around crèches was overlaid with households of children 0 to 5 years old in order to determine their proximity within the crèche.
3.4 Distance matrix
A Distance matrix analysis comes in handy during problem solving that involves distance determination for optimum decisions. Features of interest are represented as points; these are both features where distances will be calculated from and to. A typical example involved a calculation of the distance from the crèche to the children’s households in Monwabisi Park. The end result is an excel spreadsheet with distances calculated from target of interest to another target. From the calculated distances statistical analysis can be performed as part of problem solving.

South African Journal of Geomatics, Vol. 4, No. 3, August 2015
291
3.5 Thiessen polygons
Thiessen polygons are useful when determining proximity of certain features relative to features of interest. Thus Thiessen polygons were used to indicate households that are close to a certain crèche relative to others. Households with children aged up to 5 years old were indicated by construction of Thiessen polygons around crèches and all households within the boundaries of the polygon were regarded to be closer to the crèche in that particular polygon relative to other crèches . It is important to note that Thiessen polygons are useful when overlaid with other dataset; they are not effective as stand-alone, in this case they were overlaid with crèches and households of children 0 to 5 years old. Furthermore a distance matrix was executed from crèche to households that were within a particular Thiessen polygon and statistical analysis were carried out, thus including the maximum, average and minimum distances that the children had to travel on a daily basis to their respective crèches.
The final maps created were discussed together with VPUU, some maps were found to be useful while in other cases they asked for additional maps to be created. Figure 2 shows summarized steps in the flowchart.
Figure 2. Flowchart of methodology
4. Results and Discussion
This section outlines the analysis and the results of the analysis on the data provided by the community. These include Multi-criteria Evaluations, Buffer analysis, Thiessen Polygons and Thematic mapping.
4.1 Multi-Criteria Evaluation (MCE) investigating disaster vulnerability
This section presents disaster risk at Monwabisi Park. Statistics from the questionnaire, response maps based on the questionnaire, weight calculations and risk maps form the overall results. Based on the responses from the questionnaire it was found that fire and flooding are two main factors contributing to disaster at Monwabisi Park, but with flooding being more serious as Cape Town experiences heavy rainfall in the winter season every year, while fire occurs once in a long term period. Types of alternatives for the types of exposure to hazards were generated based on the findings for flooding and fire. They consisted of:
a) No exposure to hazards
b) Exposure to fire only
c) Exposure to flooding only
d) Exposure to both flooding and fire
The generated alternatives were ranked through discussion with VPUU. If an alternative had less negative consequence than the other, it was ranked higher than the other. For instance ‘No exposure to hazards’ is ranked higher than ‘exposure to flooding and fire’. Preference weights were generated by carrying out a pairwise comparison between each of the alternatives. Ranking and Pairwise comparison matrix for the above listed alternatives is shown in Table 3. Comparisons between the alternatives based on Table 4 are presented by values on the right of the diagonal, while the inverses of those comparisons are presented by values on the left of the diagonal.

South African Journal of Geomatics, Vol. 4, No. 3, August 2015
292
Table 3. Pairwise comparison Matrix of exposure to disasters
Criteria ND FR FL FFL
No disaster 1.000 2.000 3.000 5.000
Only fire 0.500 1.000 2.000 4.000
Only flooding 0.333 0.500 1.000 3.000
Fire and flooding 0.200 0.250 0.333 1.000
Sum 2.033 3.750 6.333 13.000
Normalised Pairwise comparison matrix for the above listed alternatives is shown in Table 4, while ranks of alternatives are shown in the criteria column.
Table 4. Normalised pairwise comparison matrix of exposure to disasters
Criteria ND FR FL FFL
No disaster 0.492 0.533 0.385 0.385
Only fire 0.246 0.267 0.308 0.308
Only flooding 0.164 0.133 0.231 0.231
Fire and flooding 0.098 0.067 0.077 0.077
Sum 1.000 1.000 1.000 1.000
Final relative weights are represented in Table 5.
Table 5. Vulnerability weights for hazard exposure
Alternatives Weights
No disaster 0.492
Only fire 0.246
Only flooding 0.164
Fire and flooding 0.098
Sum 1.000
After the relative weights were calculated a consistency ratio of 0.0260 was found. This value was less than the threshold value of 0.1 as suggested by Malczewski (1999). This resulted in relative weights being adopted and being used in further analysis. Based on responses from the questionnaire the weights were allocated to individual households. If a household responded that they experienced fire a weight of 0.246 was allocated to that household. The weights were then imported into GIS by adding a weight as attribute data of the same corresponding household. After all households were allocated weights, geographical distribution of vulnerability was represented on a thematic map (Figure 3). Additionally Figure 4 represents section B of Monwabisi Park geographical distribution of vulnerability on a small scale.

South African Journal of Geomatics, Vol. 4, No. 3, August 2015
293
Figure 3. Thematic map representing vulnerability based on type of exposure to a hazard
Figure 4. Thematic map representing vulnerability based on type of exposure to a hazard Section B, Monwabisi Park
South African Journal of Geomatics, Vol. 4, No. 3, August 2015
294
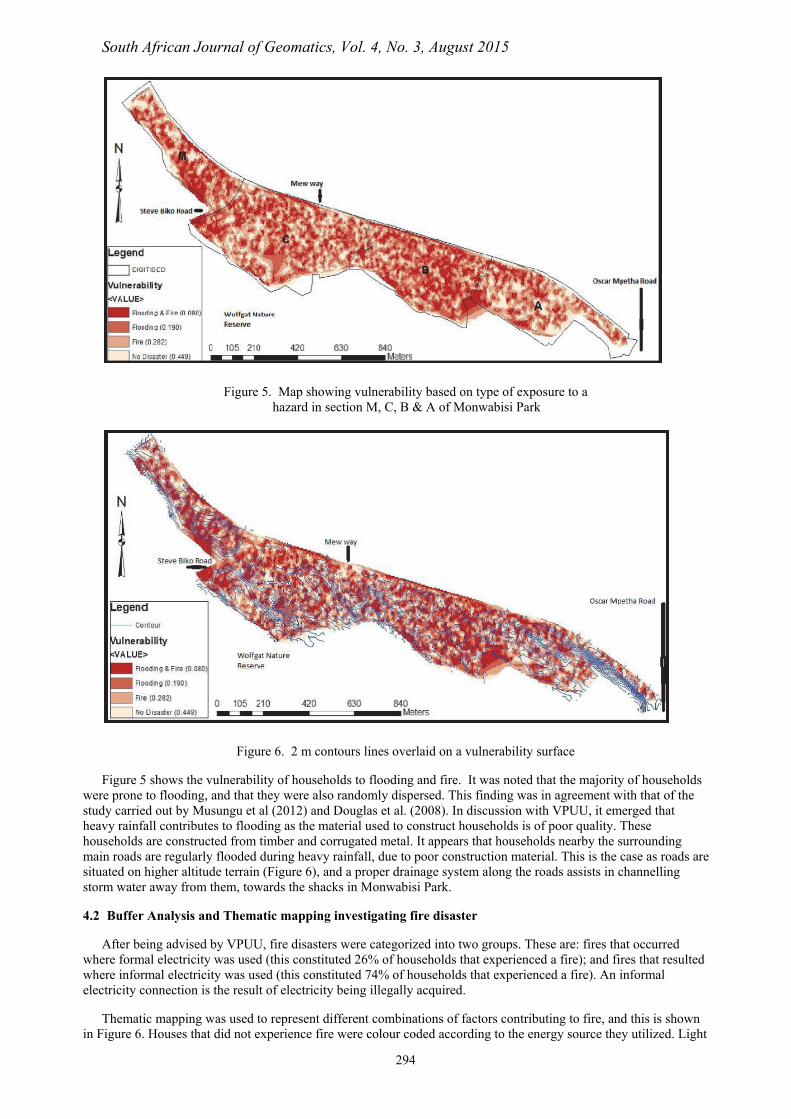
Figure 5. Map showing vulnerability based on type of exposure to a hazard in section M, C, B & A of Monwabisi Park
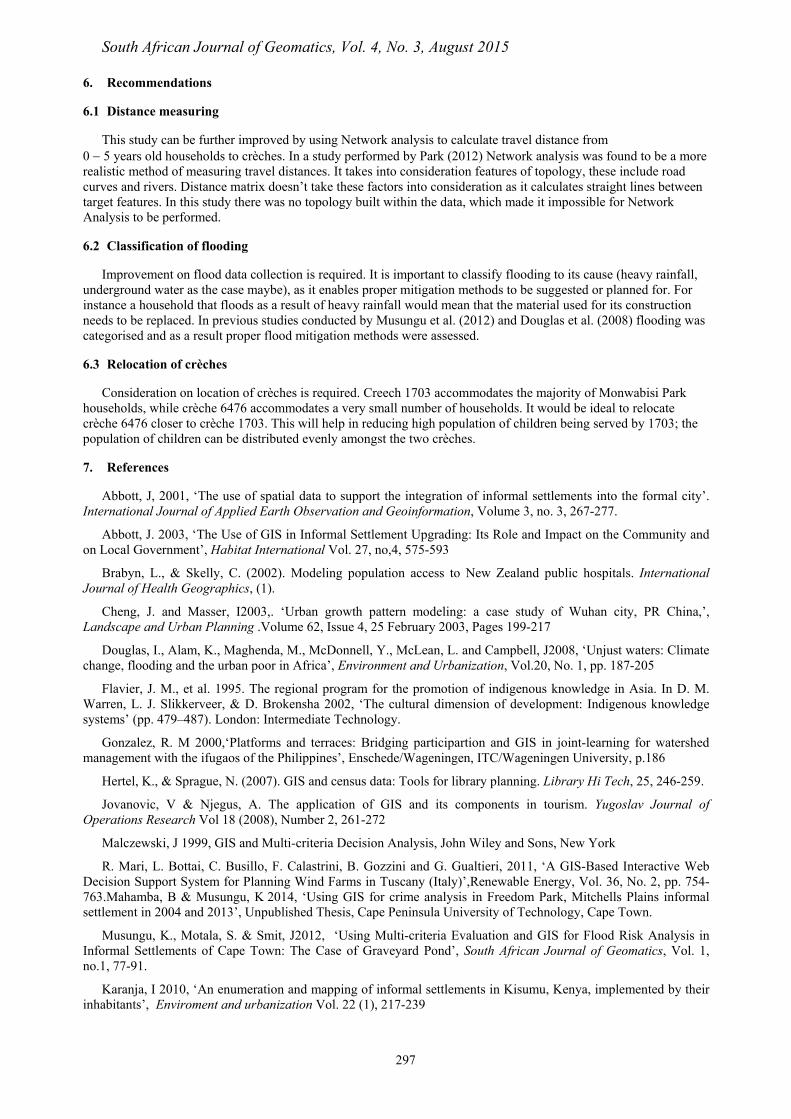
Figure 6. 2 m contours lines overlaid on a vulnerability surface
Figure 5 shows the vulnerability of households to flooding and fire. It was noted that the majority of households were prone to flooding, and that they were also randomly dispersed. This finding was in agreement with that of the study carried out by Musungu et al (2012) and Douglas et al. (2008). In discussion with VPUU, it emerged that heavy rainfall contributes to flooding as the material used to construct households is of poor quality. These households are constructed from timber and corrugated metal. It appears that households nearby the surrounding main roads are regularly flooded during heavy rainfall, due to poor construction material. This is the case as roads are situated on higher altitude terrain (Figure 6), and a proper drainage system along the roads assists in channelling storm water away from them, towards the shacks in Monwabisi Park.
4.2 Buffer Analysis and Thematic mapping investigating fire disaster
After being advised by VPUU, fire disasters were categorized into two groups. These are: fires that occurred where formal electricity was used (this constituted 26% of households that experienced a fire); and fires that resulted where informal electricity was used (this constituted 74% of households that experienced a fire). An informal electricity connection is the result of electricity being illegally acquired.
Thematic mapping was used to represent different combinations of factors contributing to fire, and this is shown in Figure 6. Houses that did not experience fire were colour coded according to the energy source they utilized. Light

South African Journal of Geomatics, Vol. 4, No. 3, August 2015
295
blue and dark blue polygons represented houses that did not have a formal electricity connection, whereas yellow polygons represented households that had formal electricity. Households that experienced fires were either coded as pink (with formal electricity) or red (with informal electricity or used flammable material such as paraffin, gas or candles for lighting or cooking). 50% of Monwabisi Park households used formal electricity, most of them being residents who arrived first at the settlement.
Figure 7. 100 m buffer, Fire disasters mapped to type energy source used. Section M, C, B & A of Monwabisi Park
A 100 m buffer zone was executed around a household that experienced fire, to check the number of households that would be affected if the spread of fire is within this range. There was a correlation between fire and flammable energy sources used at households, majority of households that used flammable material (paraffin, candles and gas) experienced fire (Figure 7).
4.3 Thiessen polygons, distance matrix and statistical analysis investigating crèche accessibility
Households were identified that had children between the ages of 0 to 5 (with an assumption that all these children went to the nearest crèche). A Thiessen polygon analysis was employed to identify the number of these households that could be accommodated by the nearest crèche. This analysis was combined with a distance matrix, showing the distances that these children would have to travel (by foot in the majority of cases) to get to their nearest crèche. The distance matrix results are presented in Table 6. It is evident from the mean distances that crèche 1316 has more households being located away from it, with an average distance of 327 m travelled, while crèche 6752 has more households closer to it, with an average travel distance of 102 m. Moreover an additional crèche is needed in the vicinity of crèche 1703 to reduce the large number of children being accommodated by it.
Table 6. Number of households in a Polygon and average distances travelled
Thiessen Polygons Distance Matrix
Crèche % of 0 to 5 years old households within Polygon Mean (metres)
1316 6% 327
1703 22% 216
2568 8% 149
2774 21% 141
5528 9% 121
6752 10% 107
5791 20% 267

South African Journal of Geomatics, Vol. 4, No. 3, August 2015
296
6476 4% 102
Figure 8. Thiessen Polygons, 0 to 5 years old children households and crèche
5. Conclusions
GIS technology has the ability to assist in improving the quality, and efficiency of informal settlements. It offers a broad range of benefits, which are realized from data collection processes to display of results as maps, graphs and tables. However, the data used in GIS analysis is often based on physical data and not perceptions and indigenous community’s knowledge. The findings of this paper show that the indigenous knowledge can provide insight into problems and potential solutions in informal settlements. Moreover the presented case studies show that the demonstrated GIS analysis can be applied to solve similar spatial problems situations.
Five different methods of GIS spatial analysis were applied on Monwabisi Park spatial data, in order to assist with decision making for urban upgrading. The different types of analysis were buffer analysis, Thiessen polygons, MCE, distance matrix and thematic mapping. The resultant maps produced different results, depending on the type of spatial analysis employed and the purpose of the resultant map. This also shows the robustness of indigenous knowledge (IK). The potential for increased analysis from IK should be further explored. Data lost during the project suggests that a more sustainable and reliable method of capturing data from the communities should be developed. This would prevent wastage in the form of unnecessary labour, potentially important information and generally boost the democratic approach to data capture and usage.
Discussions with VPUU assisted the principal author to get a clear understanding of the data captured, moreover the indigenous knowledge that the residents had about the study area assisted in the production and interpretation of maps. This study assisted VPUU in understanding the complexity of the participatory data collection process and its flaws. This could help them to create a more robust data collection process. The data analysis, on the other hand, showed VPUU and their community partners the power of GIS analysis. Being able to identify trends at different scales allows for a big picture understanding of various factors (such as vulnerability across the whole informal settlement), together with a finer understanding at an individual level (such as the feasibility of specific crèche locations). This study has confirmed that useful analysis can be achieved through interaction between GIS professionals and communities. The knowledge and participation of communities could be used to produce sophisticated mapping and analysis, and ultimately could assist in the upgrading of the community. Further, the method of mapping and analysis highlights a different approach to mapping since it encourages social mapping as opposed to physical mapping.
The following section highlights potential analysis and data capturing shortfalls that could be improved as well as local solutions.
South African Journal of Geomatics, Vol. 4, No. 3, August 2015
297
6. Recommendations
6.1 Distance measuring
This study can be further improved by using Network analysis to calculate travel distance from 0 5 years old households to crèches. In a study performed by Park (2012) Network analysis was found to be a more realistic method of measuring travel distances. It takes into consideration features of topology, these include road curves and rivers. Distance matrix doesn’t take these factors into consideration as it calculates straight lines between target features. In this study there was no topology built within the data, which made it impossible for Network Analysis to be performed.
6.2 Classification of flooding
Improvement on flood data collection is required. It is important to classify flooding to its cause (heavy rainfall, underground water as the case maybe), as it enables proper mitigation methods to be suggested or planned for. For instance a household that floods as a result of heavy rainfall would mean that the material used for its construction needs to be replaced. In previous studies conducted by Musungu et al. (2012) and Douglas et al. (2008) flooding was categorised and as a result proper flood mitigation methods were assessed.
6.3 Relocation of crèches
Consideration on location of crèches is required. Creech 1703 accommodates the majority of Monwabisi Park households, while crèche 6476 accommodates a very small number of households. It would be ideal to relocate crèche 6476 closer to crèche 1703. This will help in reducing high population of children being served by 1703; the population of children can be distributed evenly amongst the two crèches.
7. References
Abbott, J, 2001, ‘The use of spatial data to support the integration of informal settlements into the formal city’. International Journal of Applied Earth Observation and Geoinformation, Volume 3, no. 3, 267-277.
Abbott, J. 2003, ‘The Use of GIS in Informal Settlement Upgrading: Its Role and Impact on the Community and on Local Government’, Habitat International Vol. 27, no,4, 575-593
Brabyn, L., & Skelly, C. (2002). Modeling population access to New Zealand public hospitals. International Journal of Health Geographics, (1).
Cheng, J. and Masser, I2003,. ‘Urban growth pattern modeling: a case study of Wuhan city, PR China,’, Landscape and Urban Planning .Volume 62, Issue 4, 25 February 2003, Pages 199-217
Douglas, I., Alam, K., Maghenda, M., McDonnell, Y., McLean, L. and Campbell, J2008, ‘Unjust waters: Climate change, flooding and the urban poor in Africa’, Environment and Urbanization, Vol.20, No. 1, pp. 187-205
Flavier, J. M., et al. 1995. The regional program for the promotion of indigenous knowledge in Asia. In D. M. Warren, L. J. Slikkerveer, & D. Brokensha 2002, ‘The cultural dimension of development: Indigenous knowledge systems’ (pp. 479–487). London: Intermediate Technology.
Gonzalez, R. M 2000,‘Platforms and terraces: Bridging participartion and GIS in joint-learning for watershed management with the ifugaos of the Philippines’, Enschede/Wageningen, ITC/Wageningen University, p.186
Hertel, K., & Sprague, N. (2007). GIS and census data: Tools for library planning. Library Hi Tech, 25, 246-259.
Jovanovic, V & Njegus, A. The application of GIS and its components in tourism. Yugoslav Journal of Operations Research Vol 18 (2008), Number 2, 261-272
Malczewski, J 1999, GIS and Multi-criteria Decision Analysis, John Wiley and Sons, New York
R. Mari, L. Bottai, C. Busillo, F. Calastrini, B. Gozzini and G. Gualtieri, 2011, ‘A GIS-Based Interactive Web Decision Support System for Planning Wind Farms in Tuscany (Italy)’,Renewable Energy, Vol. 36, No. 2, pp. 754-763.Mahamba, B & Musungu, K 2014, ‘Using GIS for crime analysis in Freedom Park, Mitchells Plains informal settlement in 2004 and 2013’, Unpublished Thesis, Cape Peninsula University of Technology, Cape Town.
Musungu, K., Motala, S. & Smit, J2012, ‘Using Multi-criteria Evaluation and GIS for Flood Risk Analysis in Informal Settlements of Cape Town: The Case of Graveyard Pond’, South African Journal of Geomatics, Vol. 1, no.1, 77-91.
Karanja, I 2010, ‘An enumeration and mapping of informal settlements in Kisumu, Kenya, implemented by their inhabitants’, Enviroment and urbanization Vol. 22 (1), 217-239
South African Journal of Geomatics, Vol. 4, No. 3, August 2015
298
Kinikin, J 2004, ‘Applying geographic information systems to the Weber County Library system’, Information Technology and Libraries, Vol. 23, no.3, 102-107.
Kwan, M. & Weber, J 2008, ‘Scale and accessibility: Implications for the analysis of land use–travel interaction’, Applied Geography, Volume 28, Issue 2, April 2008, Pages 110-123
Laituri, M 2003, ‘The Issue of Access: An Assessment Guide for Evaluating Public Participation Geographic Information Science Case Studies.’ Journal of the Urban and Regional Information Systems Association, Vol. 15, APA. II, pp. 25-31.
Lin, F 2000, ‘GIS-base information flow in land-use zoning review process’, Landscape and Urban Planning, Vol.52, Issue 1, Pages 21-32
Livengood, A. and Kunte,K 2012, ‘Enabling participation planning with GIS: a case study of settlement mapping in Cuttack’, India. Enviroment and urbanization Vol. 24, no. 1, Pages 77-97
McCall, M. K 2003, ‘Seeking good governance in participatory-GIS: A review of processes and governance dimensions in applying GIS to participatory spatial planning’,Habitat International Vol. 27, no. 4, Pages 549-573.
Park, S. J2012, ‘Measuring public library accessibility: A case study using GIS’, Library & Information Science Research, Vol. 34, no. 1, Pages 13-21
Quan, J., Oudwater, N., Pender, J. and Martin, A 2001, ‘GIS and Participatory approaches in natural Resources Research’, Socio-Economic Methodologies for Natural Resources Research. Best Practice Guidelines. Natural Resources Institute: Chatham, UK.
Raaijmakers, R., Krywkow, J. & van der Veen, A. 2008. ‘Flood risk perceptions and spatial multi-criteria analysis: An exploratory research for hazard mitigation.’ Natural Hazards, Vol. 46, No.3, pp. 307-322.
Rambaldi, G., Kwaku Kyem, P., McCall, M. & Weiner, D. 2006. ‘Participatory Spatial Information Management and Communication in Developing Countries.’ The Electronic Journal of Information Systems in Developing Countries, Vol. 25, No. 1, pp. 1-9.
Saaty, T.L. 1980. The analytic hierarchy process. McGraw-Hill. New York.
Toosi, A., Delavar, M., Rezayan, H. 2005, ‘Spatial Development Infrastructure Linkages with urban planningand Infrastructure management’. April 16-21, 2005: FIG working week
Tran, P., Shaw, R., Chantry, G. & Norton, J. 2009. ‘GIS and Local Knowledge in Disaster Management: A Case Study of Flood Risk Mapping in Vietnam.’ Disasters, Vol. 33, No.1, pp. 152-169.
Tripathi, N. & Bhattarya, S. 2004. ‘Integrating indigenous knowledge and GIS for participatory natural resource management: State-of-the-practice.’ The Electronic Journal on Information Systems in Developing Countries Vol. 17, No. 3, pp. 1-13.
Voogd H 1983 Multi-criteria evaluation for urban and regional planning. London, Pion
Yahaya, S, Ahmad, N. & Abdalla, RF 2010,’Multi-criteria analysis for flood vulnerable areas in Hadejia-Jama’are River basin, Nigeria’, European Journal of Scientific Research, Vol. 42, No. 1, pp. 71-83.
Zunying, H., Fengxia, G., and Wenbao, L 2010, ‘The application of spatial analysis functions of GIS technology in urban planning’. Journal of Shandong University of science and technology.
Related Documents