Exploring the Education Profile and Pipeline for Puerto Ricans and Hispanics in Central Florida Hispanic Summit June 28-29, 2007 Anthony De Jesús Daniel W. Vasquez

Exploring the Education Profile and Pipeline for Puerto Ricans and Hispanics in Central Florida Hispanic Summit June 28-29, 2007 Anthony De Jesús Daniel.
Dec 26, 2015
Welcome message from author
This document is posted to help you gain knowledge. Please leave a comment to let me know what you think about it! Share it to your friends and learn new things together.
Transcript
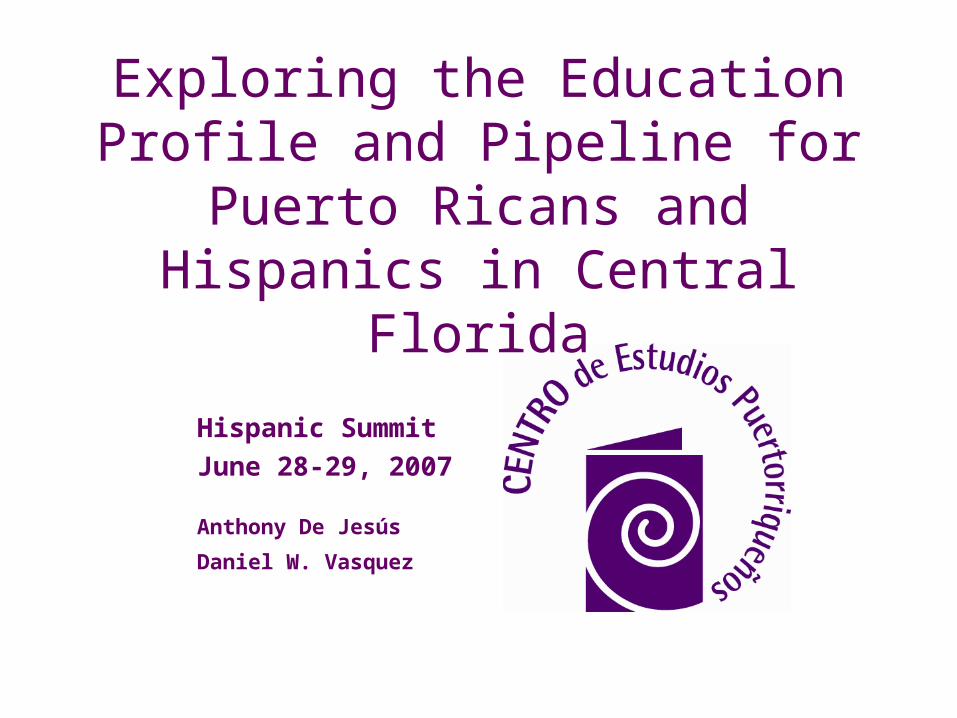
Exploring the Education Profile and Pipeline for Puerto Ricans and
Hispanics in Central Florida
Hispanic Summit
June 28-29, 2007
Anthony De Jesús Daniel W. Vasquez

Total Population Change by RaceCentral Florida & State of Florida, 1990 and 2000
Source: 1990 & 2000 US Census data (SF-3 release).
Level Percent Change inCentral Florida 2000 Percent 1990 Percent Change Change Percent
Total 1,644,561 100.0% 1,167,406 100.0% 477,155 40.9% -
White 1,234,451 75.1% 888,648 76.1% 345,803 38.9% -1.1%Black 225,415 13.7% 132,796 11.4% 92,619 69.7% 2.3%American Indian, Eskimo, or Aleut 5,599 0.3% 3,704 0.3% 1,895 51.2% 0.0%Asian or Pacific Islander 43,610 2.7% 20,332 1.7% 23,278 114.5% 0.9%Other race 82,662 5.0% 27,268 2.3% 55,394 203.1% 2.7%
Hispanic 271,425 16.5% 94,658 8.1% 176,767 186.7% 8.4%
Level Percent Change inState of Florida 2000 Percent 1990 Percent Change Change Percent
Total 15,982,378 100.0% 14,492,957 100.0% 1,489,421 10.3% -
White 12,463,302 78.0% 10,755,698 74.2% 1,707,604 15.9% 3.8%Black 2,312,105 14.5% 1,755,958 12.1% 556,147 31.7% 2.4%American Indian, Eskimo, or Aleut 54,428 0.3% 42,619 0.3% 11,809 27.7% 0.0%Asian or Pacific Islander 271,189 1.7% 150,200 1.0% 120,989 80.6% 0.7%Other race 472,333 3.0% 233,451 1.6% 238,882 102.3% 1.3%
Hispanic 2,680,314 16.8% 1,555,031 10.7% 1,125,283 72.4% 6.0%
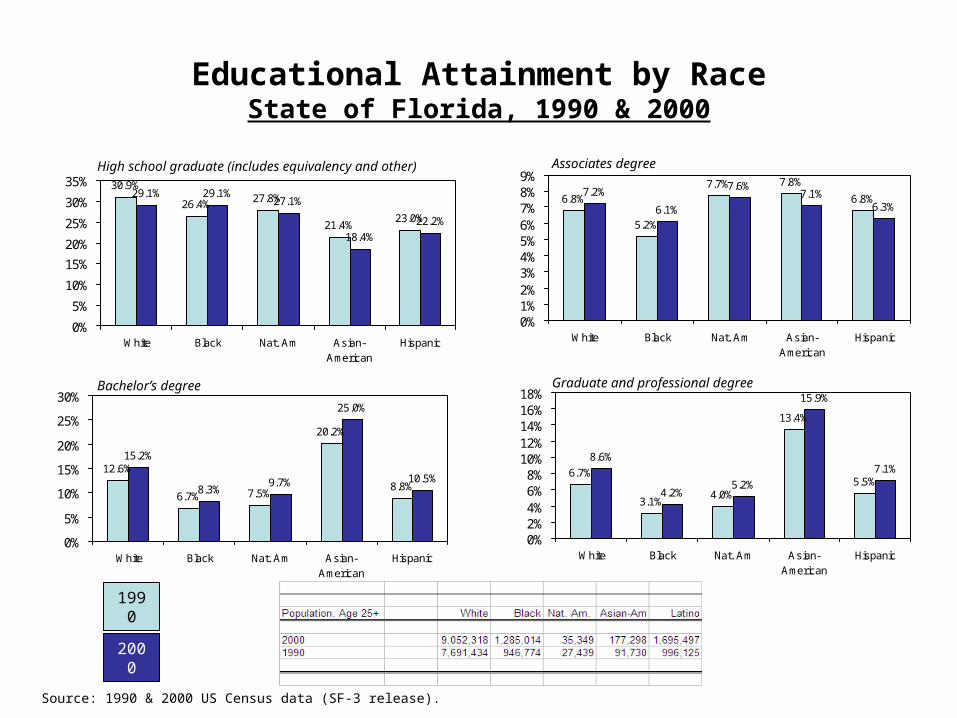
Educational Attainment by RaceState of Florida, 1990 & 2000
30.9%
26.4% 27.8%
21.4%23.0%
29.1% 29.1%27.1%
18.4%
22.2%
0%
5%
10%
15%
20%
25%
30%
35%
White Black Nat. Am Asian-American
Hispanic
12.6%
6.7% 7.5%
20.2%
8.8%
15.2%
8.3%9.7%
25.0%
10.5%
0%
5%
10%
15%
20%
25%
30%
White Black Nat. Am Asian-American
Hispanic
High school graduate (includes equivalency and other)
Bachelor’s degree
6.8%
5.2%
7.7% 7.8%
6.8%7.2%
6.1%
7.6%7.1%
6.3%
0%1%2%3%4%5%6%7%8%9%
White Black Nat. Am Asian-American
Hispanic
Associates degree
6.7%
3.1%4.0%
13.4%
5.5%
8.6%
4.2%5.2%
15.9%
7.1%
0%2%4%6%8%
10%12%14%16%18%
White Black Nat. Am Asian-American
Hispanic
Graduate and professional degree
Source: 1990 & 2000 US Census data (SF-3 release).
1990
2000
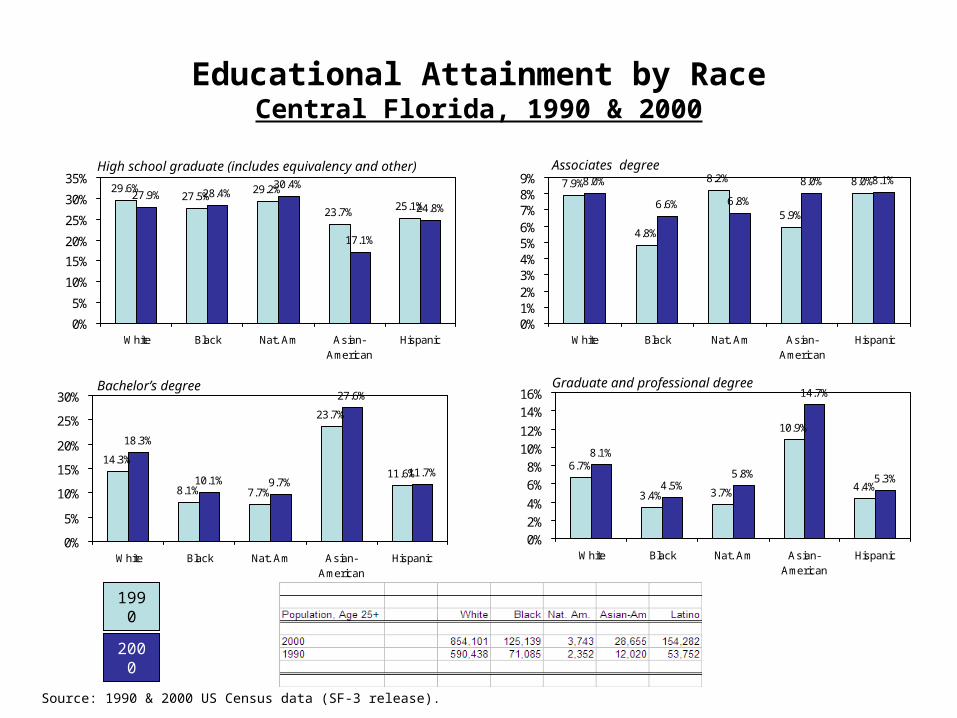
Educational Attainment by RaceCentral Florida, 1990 & 2000
29.6%27.5%
29.2%
23.7% 25.1%27.9% 28.4%
30.4%
17.1%
24.8%
0%
5%
10%
15%
20%
25%
30%
35%
White Black Nat. Am Asian-American
Hispanic
14.3%
8.1% 7.7%
23.7%
11.6%
18.3%
10.1% 9.7%
27.6%
11.7%
0%
5%
10%
15%
20%
25%
30%
White Black Nat. Am Asian-American
Hispanic
High school graduate (includes equivalency and other)
Bachelor’s degree
7.9%
4.8%
8.2%
5.9%
8.0%8.0%
6.6% 6.8%
8.0% 8.1%
0%1%2%3%4%5%6%7%8%9%
White Black Nat. Am Asian-American
Hispanic
Associates degree
6.7%
3.4% 3.7%
10.9%
4.4%
8.1%
4.5%5.8%
14.7%
5.3%
0%2%4%
6%8%
10%12%
14%16%
White Black Nat. Am Asian-American
Hispanic
Graduate and professional degree
Source: 1990 & 2000 US Census data (SF-3 release).
1990
2000

Hispanic Educational Attainment by National OriginCentral Florida, 2000
Central Florida Hispanic Puerto Rican Mexican Cuban Colombian Dominican Venezuelan
Total: 1,083,496 154,282 80,966 16,018 13,797 7,767 6,137 2,108
Less than 9th grade 55,316 18,896 7,361 5,357 1,644 562 743 1379th to 12th grade, no diploma 131,375 24,869 12,891 3,099 2,486 1,008 1,100 144High school graduate (includes equivalency) 298,161 38,269 21,181 3,319 2,991 2,082 1,608 423Some college, no degree 244,624 33,408 18,905 2,111 2,491 1,768 1,515 464Associate degree 85,293 12,562 7,573 531 940 622 433 241Bachelor's degree 185,614 18,048 9,874 1,094 1,927 1,001 475 461Graduate or professional degree 83,113 8,230 3,181 507 1,318 724 263 238
Percent: 100.0% 100.0% 100.0% 100.0% 100.0% 100.0% 100.0% 100.0%
Less than 9th grade 5.1% 12.2% 9.1% 33.4% 11.9% 7.2% 12.1% 6.5%9th to 12th grade, no diploma 12.1% 16.1% 15.9% 19.3% 18.0% 13.0% 17.9% 6.8%High school graduate (includes equivalency) 27.5% 24.8% 26.2% 20.7% 21.7% 26.8% 26.2% 20.1%Some college, no degree 22.6% 21.7% 23.3% 13.2% 18.1% 22.8% 24.7% 22.0%Associate degree 7.9% 8.1% 9.4% 3.3% 6.8% 8.0% 7.1% 11.4%Bachelor's degree 17.1% 11.7% 12.2% 6.8% 14.0% 12.9% 7.7% 21.9%Graduate or professional degree 7.7% 5.3% 3.9% 3.2% 9.6% 9.3% 4.3% 11.3%
Source: 2000 Census, SF-4 releaseUniverse: Population, age 25+
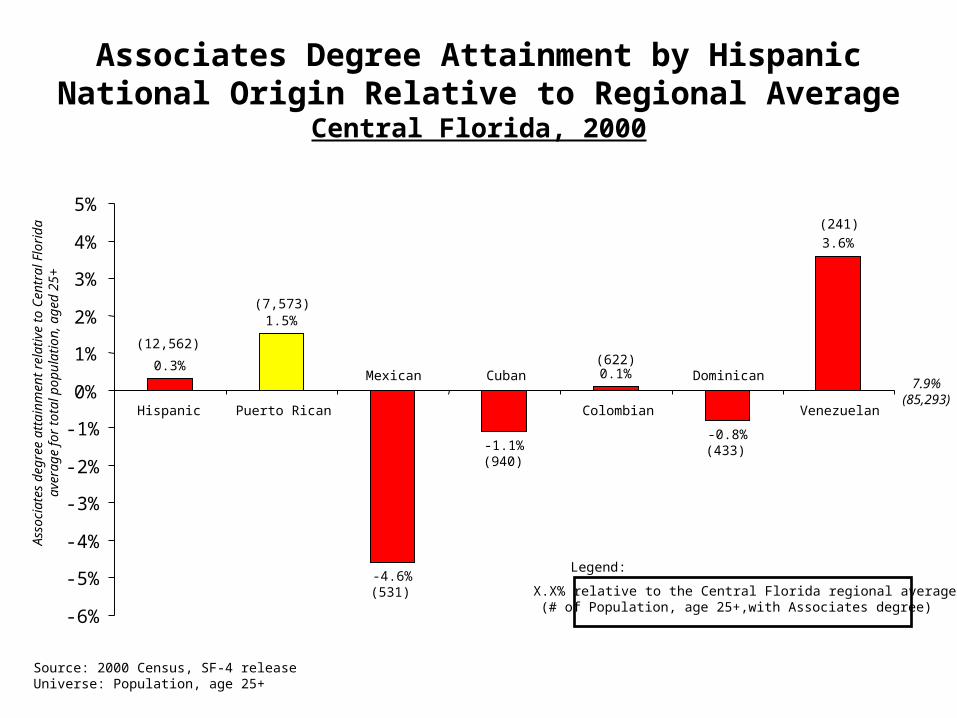
Associates Degree Attainment by Hispanic National Origin Relative to Regional Average
Central Florida, 2000
0.3%
1.5%
-4.6%
-1.1%
0.1%
-0.8%
3.6%
-6%
-5%
-4%
-3%
-2%
-1%
0%
1%
2%
3%
4%
5%
Hispanic Puerto Rican
Mexican Cuban
Colombian
Dominican
Venezuelan
(12,562)
(7,573)
(531)
(940)
(622)
(433)
(241)
7.9%(85,293)
Ass
ocia
tes
degr
ee a
ttain
men
t rel
ativ
e to
Cen
tral
Flo
rida
aver
age
for
tota
l pop
ulat
ion,
age
d 25
+
Source: 2000 Census, SF-4 releaseUniverse: Population, age 25+
X.X% relative to the Central Florida regional average(# of Population, age 25+,with Associates degree)
Legend:

Post-Secondary Education Attainment by Hispanic National Origin Relative to Regional Average
Central Florida, 2000
Source: 2000 Census, SF-4 releaseUniverse: Population, age 25+
Pos
t-se
cond
ary
educ
atio
nal a
ttain
men
t rel
ativ
e to
Cen
tral
F
lorid
a av
erag
e fo
r to
tal p
opul
atio
n, a
ged
25+
-0.9%
0.8%
-9.4%
-4.5%
0.2%
2.1%
-0.6%
0.3%
1.5%
-4.6%
-1.1%
0.1%
-0.8%
3.6%
-5.4%-4.9%
-10.3%
-3.2%
-4.2%
-9.4%
4.7%
-2.3%
-3.7%
-4.5%
1.9% 1.7%
-3.4%
3.6%
-12%
-10%
-8%
-6%
-4%
-2%
0%
2%
4%
6%Hispanic Puerto Rican Mexican Cuban Colombian Dominican Venezuelan
Some college, no degree Associate degree Bachelor's degree Graduate or professional degree
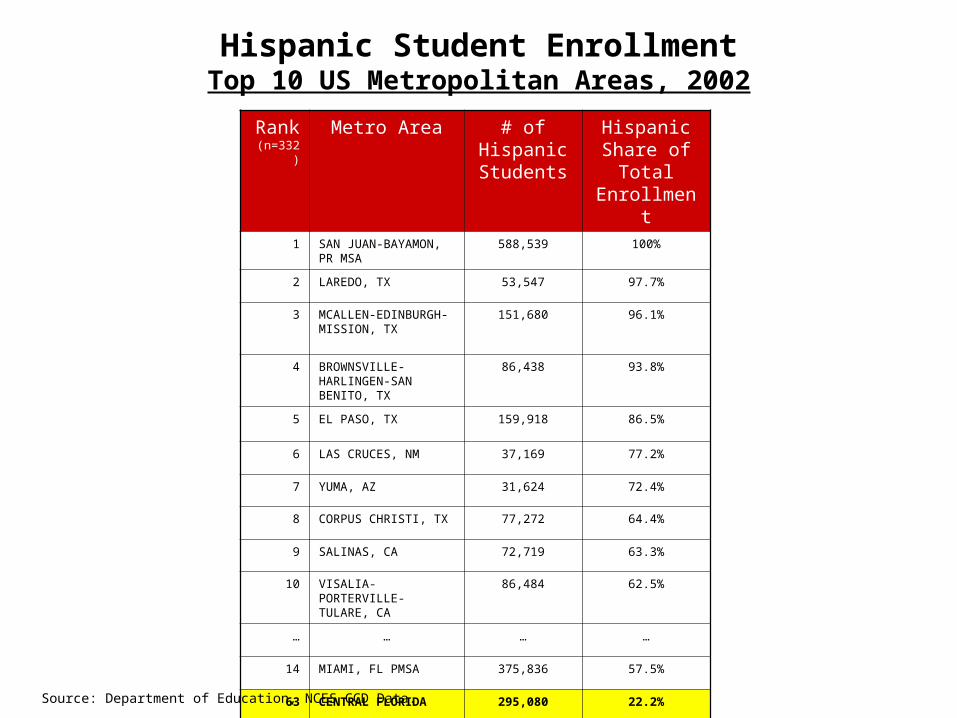
Rank (n=332)
Metro Area # of Hispanic Students
Hispanic Share of
Total Enrollment
1 SAN JUAN-BAYAMON, PR MSA
588,539 100%
2 LAREDO, TX 53,547 97.7%
3 MCALLEN-EDINBURGH-MISSION, TX
151,680 96.1%
4 BROWNSVILLE- HARLINGEN-SAN BENITO, TX
86,438 93.8%
5 EL PASO, TX 159,918 86.5%
6 LAS CRUCES, NM 37,169 77.2%
7 YUMA, AZ 31,624 72.4%
8 CORPUS CHRISTI, TX 77,272 64.4%
9 SALINAS, CA 72,719 63.3%
10 VISALIA-PORTERVILLE-TULARE, CA
86,484 62.5%
… … … …
14 MIAMI, FL PMSA 375,836 57.5%
63 CENTRAL FLORIDA 295,080 22.2%
Hispanic Student EnrollmentTop 10 US Metropolitan Areas, 2002
Source: Department of Education, NCES CCD Data.

11.3%
10.2%
9.8%9.6%
9.4%
8.8% 8.7% 8.6%
7.7% 7.6%
6%
7%
8%
9%
10%
11%
12%
AZ CA TX FL CO RI OR WY GA NM
Hispanic Student EnrollmentState of Florida, 1992-2004
10.0%
12.0%
14.0%
16.0%
18.0%
20.0%
22.0%
24.0%
1992
1994
1996
1998
2000
2002
2004
Top 10 Fastest Growing States, Hispanic Student EnrollmentHispanic Student Enrollment, State of Florida, 1992-2004
264,044
606,003
Per
cent
of T
otal
Stu
dent
Enr
ollm
ent
Cha
nge
in P
erce
nt,
1992
-200
4
53.3%
46.0% 44.7%
38.2%
26.2%23.0%
19.8% 18.3% 17.7% 16.8%
0%
10%
20%
30%
40%
50%
60%
NM CA TX AZ CO FL NY IL NJ RI
Top 10 States, Hispanic Student Enrollment in 2004
Latin
o S
hare
of
tota
l Stu
dent
Enr
ollm
ent
US average = 4.5%
US average = 10.7%
Source: Department of Education, NCES CCD Data.
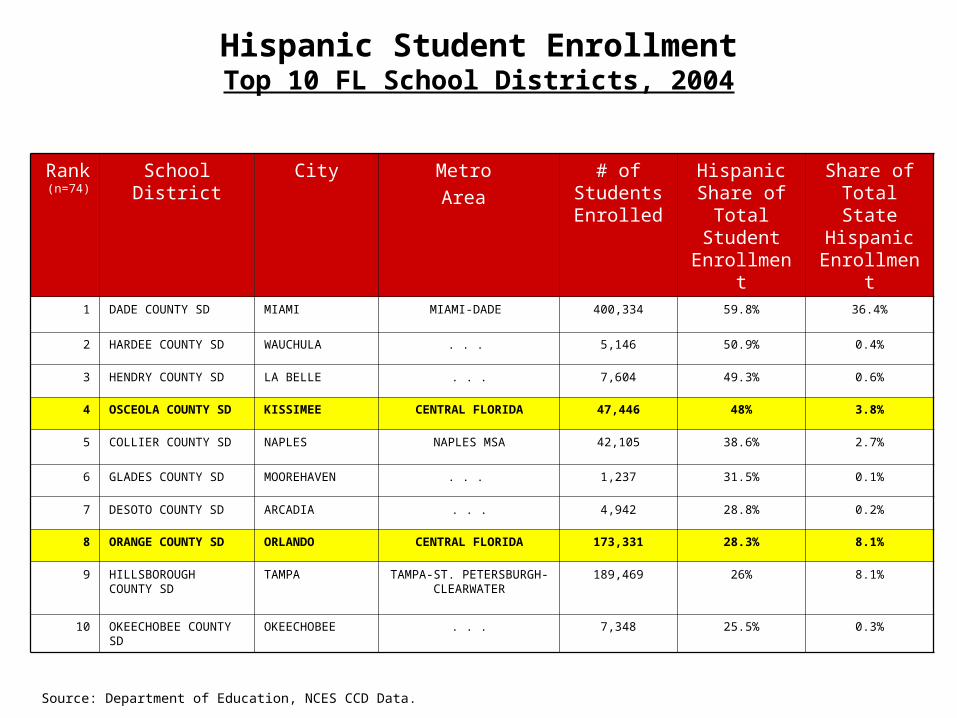
Rank (n=74)
School District City Metro
Area
# of Students Enrolled
Hispanic Share of
Total Student
Enrollment
Share of Total State Hispanic
Enrollment
1 DADE COUNTY SD MIAMI MIAMI-DADE 400,334 59.8% 36.4%
2 HARDEE COUNTY SD WAUCHULA . . . 5,146 50.9% 0.4%
3 HENDRY COUNTY SD LA BELLE . . . 7,604 49.3% 0.6%
4 OSCEOLA COUNTY SD KISSIMEE CENTRAL FLORIDA 47,446 48% 3.8%
5 COLLIER COUNTY SD NAPLES NAPLES MSA 42,105 38.6% 2.7%
6 GLADES COUNTY SD MOOREHAVEN . . . 1,237 31.5% 0.1%
7 DESOTO COUNTY SD ARCADIA . . . 4,942 28.8% 0.2%
8 ORANGE COUNTY SD ORLANDO CENTRAL FLORIDA 173,331 28.3% 8.1%
9 HILLSBOROUGH COUNTY SD
TAMPA TAMPA-ST. PETERSBURGH-CLEARWATER
189,469 26% 8.1%
10 OKEECHOBEE COUNTY SD
OKEECHOBEE . . . 7,348 25.5% 0.3%
Hispanic Student EnrollmentTop 10 FL School Districts, 2004
Source: Department of Education, NCES CCD Data.
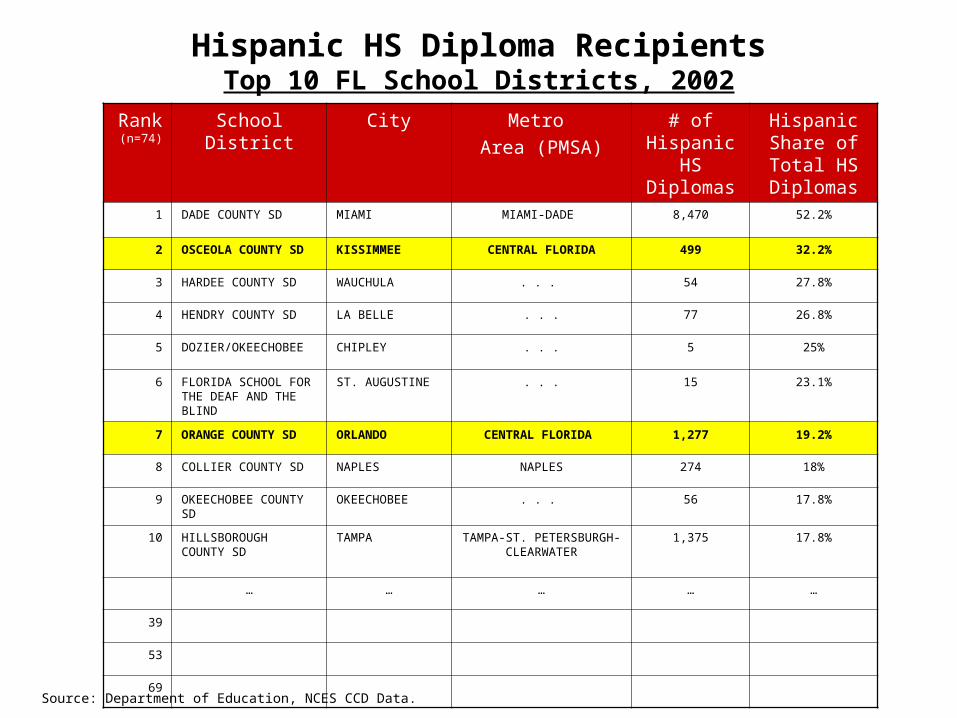
Rank (n=74)
School District City Metro
Area (PMSA)
# of Hispanic
HS Diplomas
Hispanic Share of Total HS Diplomas
1 DADE COUNTY SD MIAMI MIAMI-DADE 8,470 52.2%
2 OSCEOLA COUNTY SD KISSIMMEE CENTRAL FLORIDA 499 32.2%
3 HARDEE COUNTY SD WAUCHULA . . . 54 27.8%
4 HENDRY COUNTY SD LA BELLE . . . 77 26.8%
5 DOZIER/OKEECHOBEE CHIPLEY . . . 5 25%
6 FLORIDA SCHOOL FOR THE DEAF AND THE BLIND
ST. AUGUSTINE . . . 15 23.1%
7 ORANGE COUNTY SD ORLANDO CENTRAL FLORIDA 1,277 19.2%
8 COLLIER COUNTY SD NAPLES NAPLES 274 18%
9 OKEECHOBEE COUNTY SD
OKEECHOBEE . . . 56 17.8%
10 HILLSBOROUGH COUNTY SD
TAMPA TAMPA-ST. PETERSBURGH-CLEARWATER
1,375 17.8%
… … … … …
39
53
69
Hispanic HS Diploma RecipientsTop 10 FL School Districts, 2002
Source: Department of Education, NCES CCD Data.

School City Total Students Latino Students Percent
1 EXPRESSIONS KISSIMMEE 10 9 90.02 CYPRESS ELEMENTARY SCHOOL KISSIMMEE 970 778 80.23 CENTER FOR YOUTH APPRENTICESHIP KISSIMMEE 9 7 77.84 ENGELWOOD ELEMENTARY SCHOOL ORLANDO 568 432 76.15 BOGGY CREEK ELEMENTARY SCHOOL KISSIMMEE 784 589 75.16 OAKSHIRE ELEMENTARY SCHOOL ORLANDO 1367 1018 74.57 PARKWAY MIDDLE SCHOOL KISSIMMEE 1117 822 73.68 VENTURA ELEMENTARY SCHOOL KISSIMMEE 1138 834 73.39 VISION KISSIMMEE 32 23 71.9
10 KISSIMMEE ELEMENTARY SCHOOL KISSIMMEE 1281 898 70.111 PINAR ELEMENTARY SCHOOL ORLANDO 547 382 69.812 MCCOY ELEMENTARY SCHOOL ORLANDO 785 547 69.713 CENTRAL AVENUE ELEMENTARY SCHOOL KISSIMMEE 836 573 68.514 CHICKASAW ELEMENTARY SCHOOL ORLANDO 730 499 68.415 DEERWOOD ELEMENTARY SCHOOL KISSIMMEE 1520 1036 68.216 VENTURA ELEMENTARY SCHOOL ORLANDO 788 531 67.417 STONEWALL JACKSON MIDDLE SCHOOL ORLANDO 1163 782 67.218 AZALEA PARK ELEMENTARY SCHOOL ORLANDO 935 619 66.219 GATEWAY HIGH SCHOOL KISSIMMEE 2676 1765 66.020 MEADOW WOODS ELEMENTARY SCHOOL ORLANDO 861 564 65.521 KISSIMMEE MIDDLE SCHOOL KISSIMMEE 1224 800 65.422 LITTLE RIVER ELEMENTARY SCHOOL ORLANDO 1054 688 65.323 HIGHLANDS ELEMENTARY SCHOOL KISSIMMEE 890 564 63.424 THREE POINTS ELEMENTARY SCHOOL ORLANDO 802 508 63.325 P. M. WELLS CHARTER ACADEMY KISSIMMEE 491 306 62.326 DISCOVERY INTERMEDIATE SCHOOL KISSIMMEE 1486 916 61.627 APOPKA ELEMENTARY SCHOOL APOPKA 754 459 60.928 PROFESSIONAL & TECHNICAL HIGH KISSIMMEE 608 369 60.729 THACKER AVENUE ELEMENTARY SCHOOL KISSIMMEE 657 395 60.130 MEADOW WOODS MIDDLE SCHOOL ORLANDO 1938 1161 59.931 POINCIANA ELEMENTARY SCHOOL KISSIMMEE 1493 894 59.932 LANCASTER ELEMENTARY SCHOOL ORLANDO 864 516 59.733 DENN JOHN MIDDLE SCHOOL KISSIMMEE 1361 810 59.534 C.O.P.E. SAINT CLOUD 106 62 58.535 POINCIANA HIGH SCHOOL KISSIMMEE 2534 1467 57.936 COLONIAL HIGH SCHOOL ORLANDO 3843 2197 57.237 BELLALAGO CHARTER ACADEMY KISSIMMEE 676 384 56.838 LIBERTY MIDDLE SCHOOL ORLANDO 1282 725 56.639 UNION PARK ELEMENTARY SCHOOL ORLANDO 760 429 56.440 SADLER ELEMENTARY SCHOOL ORLANDO 948 535 56.441 FOUNDATION MIDDLE ACADEMY KISSIMMEE 240 132 55.042 LAWTON CHILES ELEMENTARY SCHOOL ORLANDO 814 445 54.743 WALKER MIDDLE SCHOOL ORLANDO 1137 613 53.944 CYPRESS CREEK SENIOR HIGH SCHOOL ORLANDO 2990 1610 53.845 ENDEAVOR KISSIMMEE 43 23 53.546 UNION PARK MIDDLE SCHOOL ORLANDO 1389 734 52.847 UCP OSCEOLA CHILD DEVELOPMENT KISSIMMEE 55 29 52.748 PARTIN SETTLEMENT ELEMENTARY SCHOOL KISSIMMEE 970 509 52.549 CHENEY ELEMENTARY SCHOOL ORLANDO 663 345 52.050 KISSIMMEE CHARTER ACADEMY KISSIMMEE 647 329 50.9
Hispanic Students in SchoolsTop 50 Central Florida Schools, 2002
Source: Department of Education, NCES CCD Data. Author’s calculations.
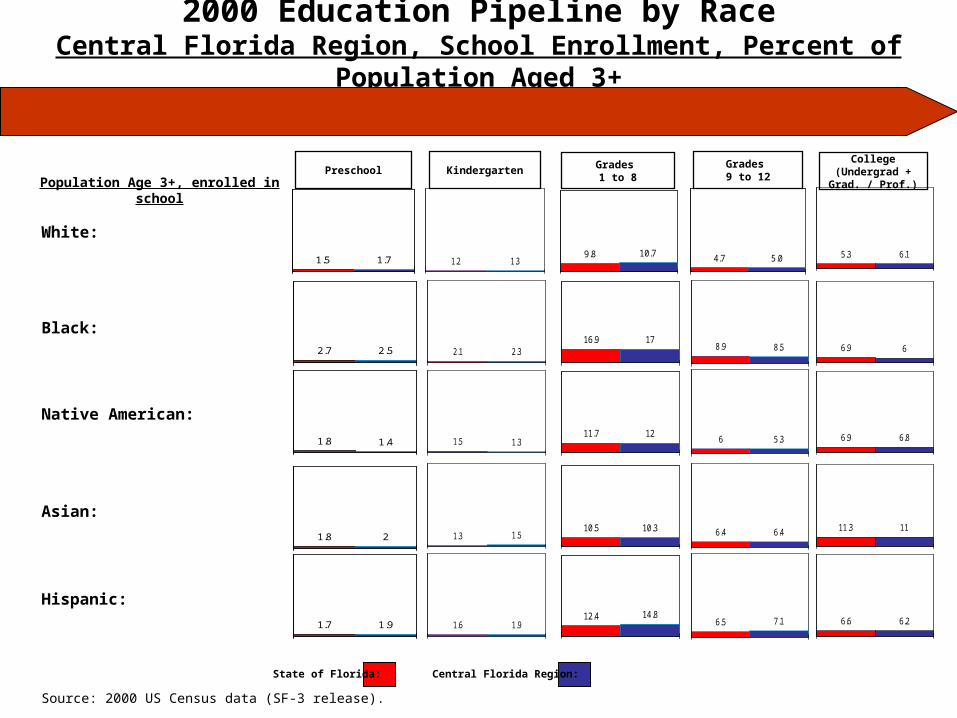
Source: 2000 US Census data (SF-3 release).
2000 Education Pipeline by RaceCentral Florida Region, School Enrollment, Percent of Population Aged 3+
College (Undergrad + Grad. / Prof.)
5.3 6.1
Grades 9 to 12
4.7 5.0
Grades 1 to 8
9.8 10.7
Kindergarten
1.2 1.3
Preschool
1.5 1.7
6.9 68.9 8.516.9 17
2.1 2.32.7 2.5
6.9 6.86 5.311.7 12
1.5 1.31.8 1.4
11.3 116.4 6.410.5 10.31.3 1.51.8 2
6.6 6.26.5 7.112.4 14.81.6 1.91.7 1.9
Population Age 3+, enrolled in school
White:
Black:
Native American:
Asian:
Hispanic:
State of Florida: Central Florida Region:
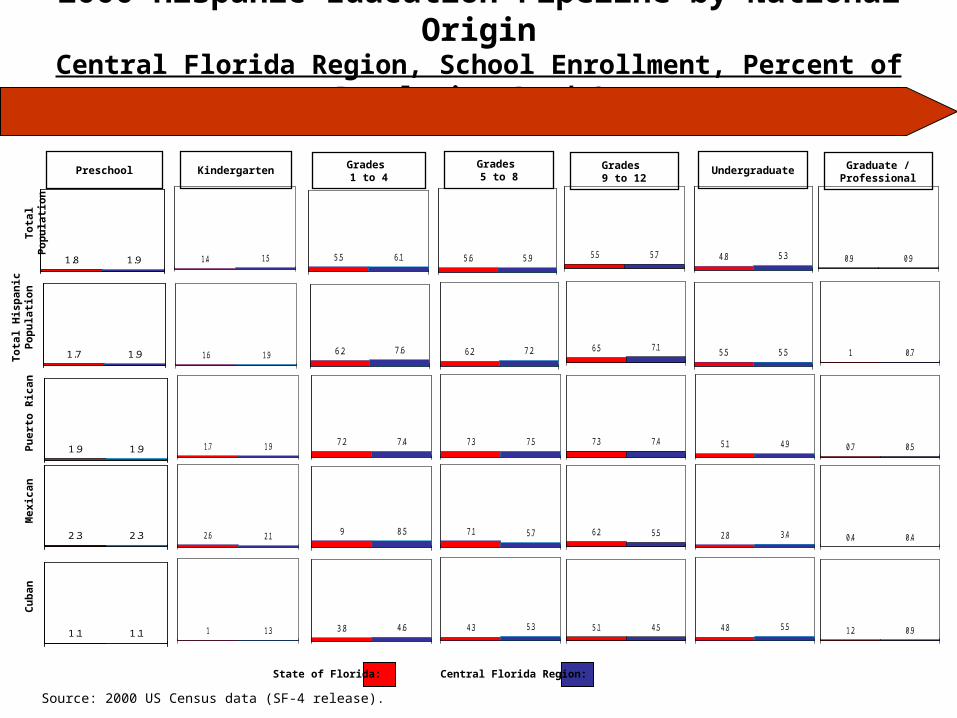
Source: 2000 US Census data (SF-4 release).
2000 Hispanic Education Pipeline by National OriginCentral Florida Region, School Enrollment, Percent of Population Aged 3+
Grades 9 to 12
6.5 7.1
Grades 5 to 8
6.2 7.2
Grades 1 to 4
6.2 7.6
Kindergarten
1.6 1.9
Preschool
1.7 1.9
7.3 7.47.3 7.57.2 7.41.7 1.91.9 1.9
6.2 5.57.1 5.79 8.52.6 2.12.3 2.3
5.1 4.54.3 5.33.8 4.61 1.31.1 1.1
State of Florida: Central Florida Region:
Graduate / Professional
1 0.7
Undergraduate
5.5 5.5
0.7 0.55.1 4.9
0.4 0.42.8 3.4
1.2 0.94.8 5.5
To
tal
His
pan
ic
Po
pu
lati
on
Pu
erto
Ric
anM
exic
anC
ub
an
5.5 5.75.6 5.95.5 6.11.4 1.51.8 1.9 0.9 0.94.8 5.3
To
tal
Po
pu
lati
on

Hispanic ESL and Free/Reduced Lunch StatusPercent of Total and Hispanic Enrollment in Central Florida, 2005
Non-Hispanic
Hispanic
•437,469 PK-12 enrollment, 78 percent
•123,384 PK-12 enrollment, 22 percent
ESL
•42,367 students, or 34% of Hispanic enrollment*
Free/Reduced Lunch
•83,914 students, or 68% of Hispanic enrollment*
Total PK-12 enrollment in Central Florida: 560,853
Source: State of Florida, Department of Education.
Note: * Numbers do no equal 100 percent due to overlapping categories of data: some Hispanic ESL students receive free or reduced lunches; conversely, some Hispanic students who receive free or reduced lunches are also enrolled in ESL.
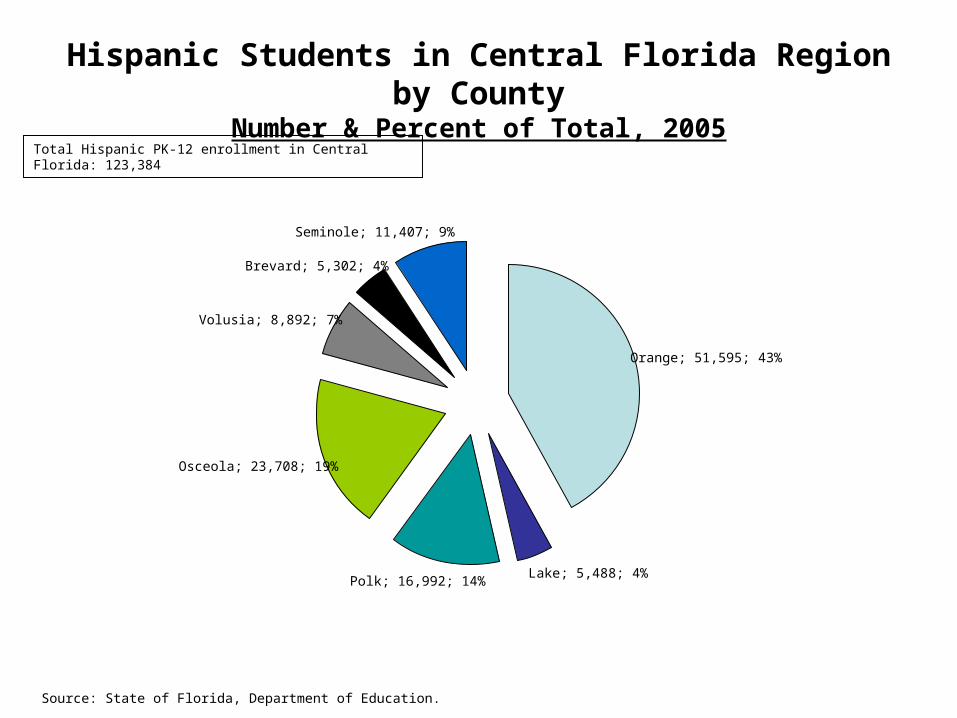
Hispanic Students in Central Florida Region by CountyNumber & Percent of Total, 2005
Total Hispanic PK-12 enrollment in Central Florida: 123,384
Source: State of Florida, Department of Education.
Orange; 51,595; 43%
Lake; 5,488; 4%Polk; 16,992; 14%
Osceola; 23,708; 19%
Volusia; 8,892; 7%
Brevard; 5,302; 4%
Seminole; 11,407; 9%
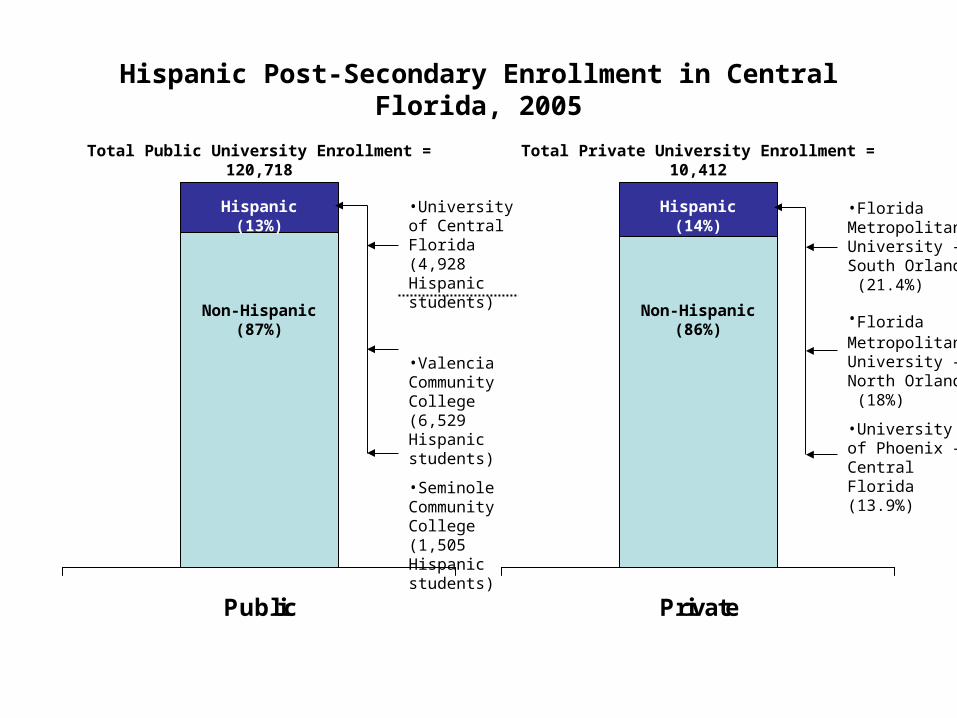
PrivatePublic
Hispanic Post-Secondary Enrollment in Central Florida, 2005
Hispanic (14%)
Non-Hispanic (86%)
Total Public University Enrollment = 120,718 Total Private University Enrollment = 10,412
•Florida Metropolitan University – South Orlando (21.4%)
•Florida Metropolitan University – North Orlando (18%)
•University of Phoenix – Central Florida (13.9%)
Hispanic (13%)
Non-Hispanic (87%)
•University of Central Florida (4,928 Hispanic students)
•Valencia Community College (6,529 Hispanic students)
•Seminole Community College (1,505 Hispanic students)
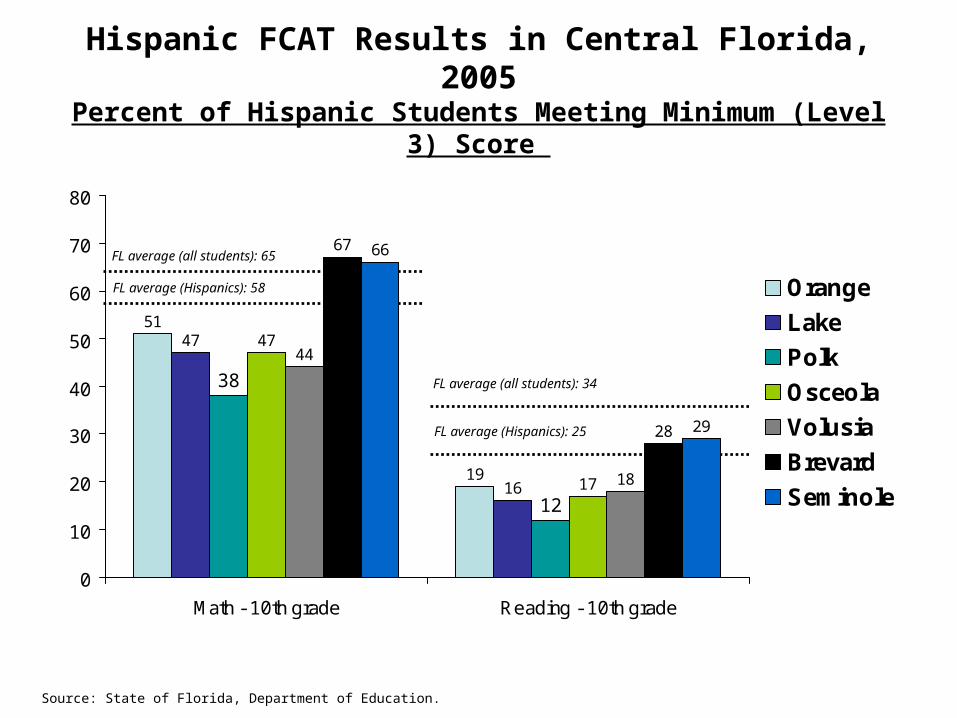
FL average (Hispanics): 25
Hispanic FCAT Results in Central Florida, 2005Percent of Hispanic Students Meeting Minimum (Level 3) Score
Source: State of Florida, Department of Education.
FL average (Hispanics): 58
FL average (all students): 34
FL average (all students): 65
51
19
47
16
38
12
47
17
44
18
67
28
66
29
0
10
20
30
40
50
60
70
80
Math - 10th grade Reading - 10th grade
Orange
Lake
Polk
Osceola
Volusia
Brevard
Seminole

y = 0.003x - 50.84
R2 = 0.7315
30
35
40
45
50
55
60
65
70
$30,000 $32,000 $34,000 $36,000 $38,000 $40,000 $42,000
“There is a positive and statistically significant relationship between Hispanic student performance in Central Florida and median household income for all seven school districts and counties.”
“There is a positive and statistically significant relationship between Hispanic student performance in Central Florida and median household income for all seven school districts and counties.”
His
pani
c F
CA
T s
core
s –
10th g
rade
Mat
h
Hispanic Median Household Income
Hispanic FCAT Scores and Hispanic Median IncomeCentral Florida School Districts, 2005
Polk
Osceola
Volusia
Orange
Lake
BrevardSeminole
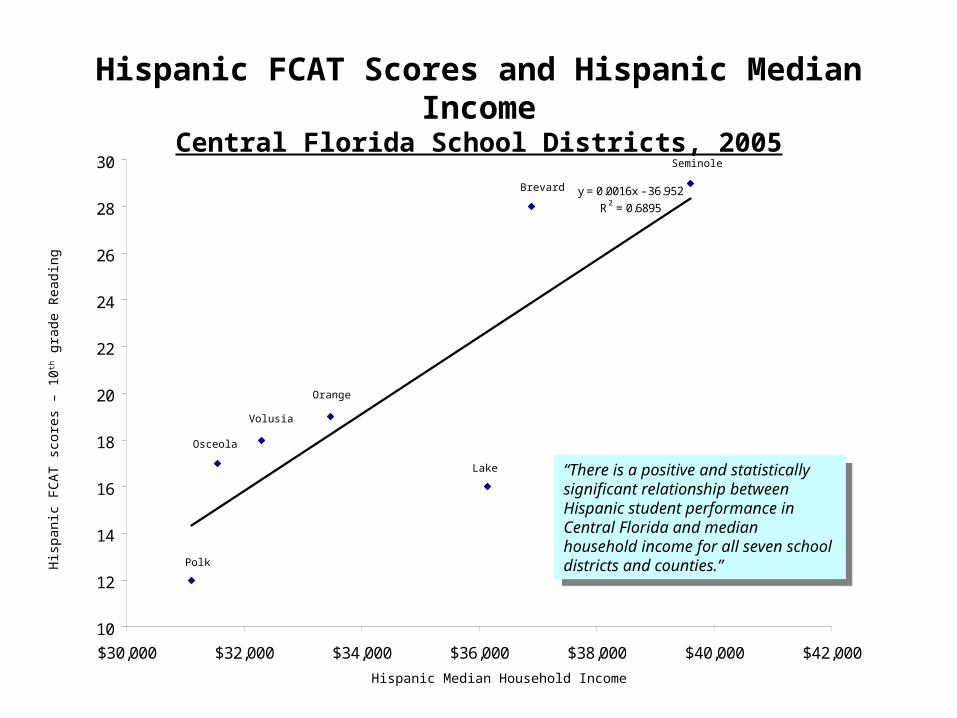
y = 0.0016x - 36.952
R2 = 0.6895
10
12
14
16
18
20
22
24
26
28
30
$30,000 $32,000 $34,000 $36,000 $38,000 $40,000 $42,000
“There is a positive and statistically significant relationship between Hispanic student performance in Central Florida and median household income for all seven school districts and counties.”
“There is a positive and statistically significant relationship between Hispanic student performance in Central Florida and median household income for all seven school districts and counties.”
His
pani
c F
CA
T s
core
s –
10th g
rade
Rea
ding
Hispanic Median Household Income
Hispanic FCAT Scores and Hispanic Median IncomeCentral Florida School Districts, 2005
Polk
Osceola
Volusia
Orange
Lake
Brevard
Seminole
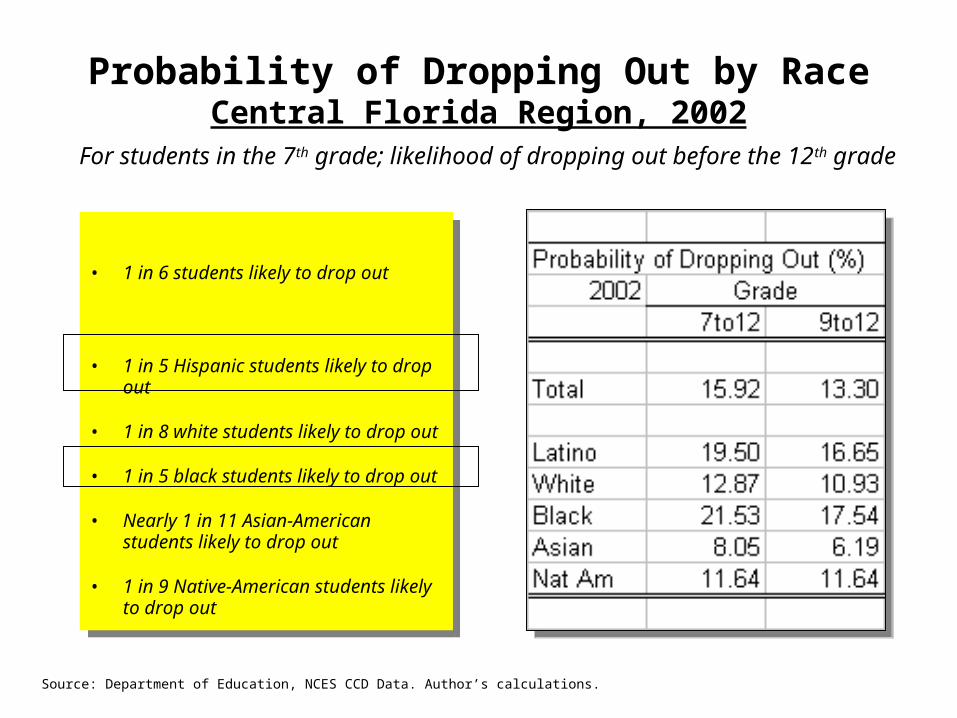
Probability of Dropping Out by RaceCentral Florida Region, 2002
Source: Department of Education, NCES CCD Data. Author’s calculations.
• 1 in 6 students likely to drop out
• 1 in 5 Hispanic students likely to drop out
• 1 in 8 white students likely to drop out
• 1 in 5 black students likely to drop out
• Nearly 1 in 11 Asian-American students likely to drop out
• 1 in 9 Native-American students likely to drop out
• 1 in 6 students likely to drop out
• 1 in 5 Hispanic students likely to drop out
• 1 in 8 white students likely to drop out
• 1 in 5 black students likely to drop out
• Nearly 1 in 11 Asian-American students likely to drop out
• 1 in 9 Native-American students likely to drop out
For students in the 7th grade; likelihood of dropping out before the 12th grade
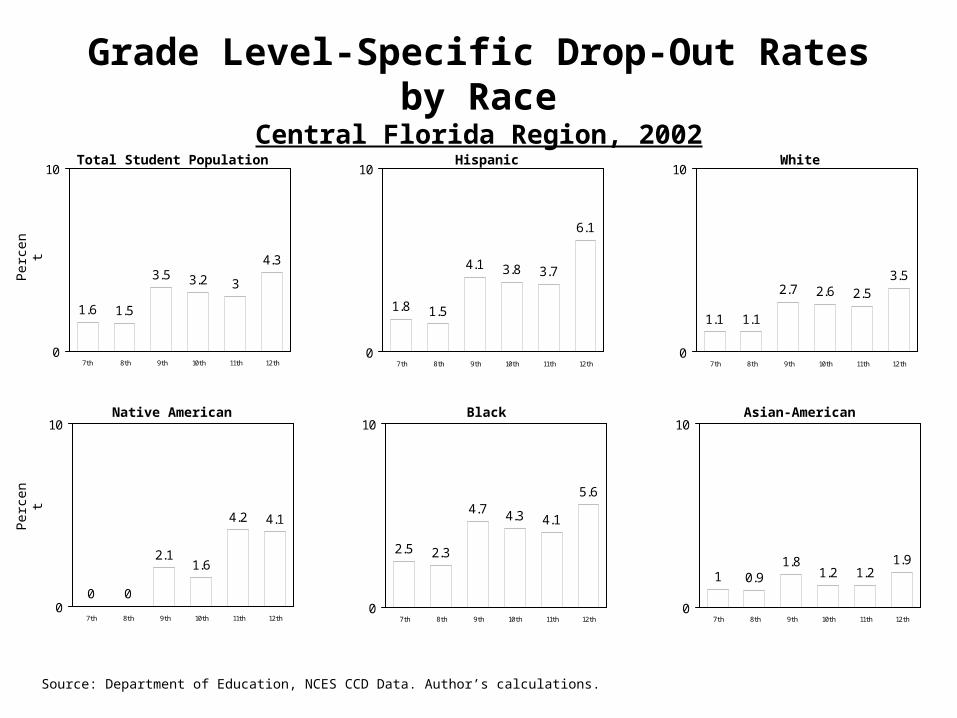
1.1 1.1
2.7 2.6 2.53.5
0
10
7th 8th 9th 10th 11th 12th
1.6 1.5
3.5 3.2 3
4.3
0
10
7th 8th 9th 10th 11th 12th
Grade Level-Specific Drop-Out Rates by RaceCentral Florida Region, 2002
1.8 1.5
4.1 3.8 3.7
6.1
0
10
7th 8th 9th 10th 11th 12th
Total Student Population
Per
cent
Hispanic White
Per
cent
0 0
2.11.6
4.2 4.1
0
10
7th 8th 9th 10th 11th 12th
2.5 2.3
4.7 4.3 4.1
5.6
0
10
7th 8th 9th 10th 11th 12th
1 0.91.8
1.2 1.21.9
0
10
7th 8th 9th 10th 11th 12th
Native American Black Asian-American
Source: Department of Education, NCES CCD Data. Author’s calculations.
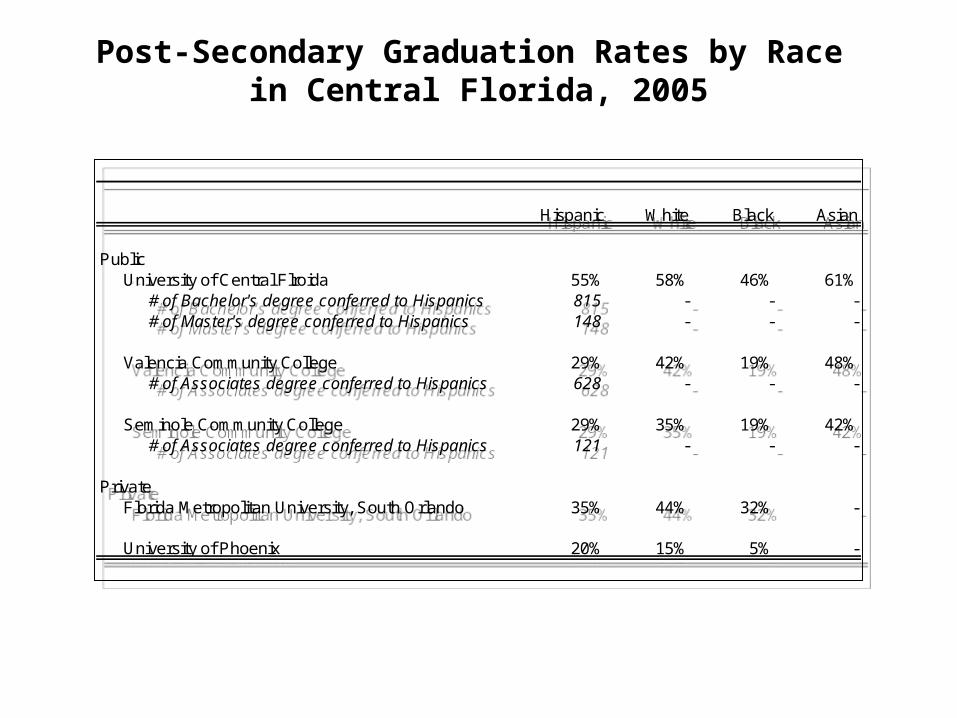
Post-Secondary Graduation Rates by Race in Central Florida, 2005
Hispanic White Black Asian
Public University of Central Flroida 55% 58% 46% 61%
# of Bachelor's degree conferred to Hispanics 815 - - -# of Master's degree conferred to Hispanics 148 - - -
Valencia Community College 29% 42% 19% 48%# of Associates degree conferred to Hispanics 628 - - -
Seminole Community College 29% 35% 19% 42%# of Associates degree conferred to Hispanics 121 - - -
PrivateFlorida Metropolitan University, South Orlando 35% 44% 32% -
University of Phoenix 20% 15% 5% -

2006
Verbal Math
Asian or Pacific Islander
499 545
African American or Black
433 430
White 524 534
Puerto Rican 463 454
Hispanic or Latino 472 472
UCF 75th Percentile590 640
UCF 25th Percentile 500 540
Orange County SAT Scores by Race/Ethnicity 2006
Source: OCPS 2005-2006 SAT Results, August 29, 2006
Related Documents