The Journal of Applied Business Research – May/June 2015 Volume 31, Number 3 Copyright by author(s); CC-BY 1023 The Clute Institute Exploring Technological Capabilities To Resuscitate The Zimbabwean Manufacturing Sector Ms. P. Siwadi, North-West University, South Africa Prof. T.G. Pelser, University of KwaZulu-Natal, South Africa ABSTRACT There is widespread agreement that manufacturing concerns require a level of technological capabilities to be able to compete in a globalized economy. This study sought to examine the technological capabilities necessary for the resuscitation of the Zimbabwean manufacturing sector. The sector has been under a lot of pressure mainly from cheaper and sometimes better quality products hailing from international players. With antiquated machinery and having been closed in during and after sanctions, the sector understands the need for up scaling their TCs. The study used data from a non-probability judgemental sample of 77 companies across 6 subsector who had capacity utilization of up to 80%. Return on Assets (ROA) was used to measure performance and was the dependent variable. A total of 14 independent variables were regressed using a bivariate and multivariate regression analysis. Five distinct technological factors proved to positively influence company performance. The significance for industry is that the 5 variables clearly hover around increase in technological capabilities and the support of human resources and information systems to go with it and directs strategists to what they need to recover in the Zimbabwean economy. Keywords: Performance; Technological Capabilities; Human Resources; ISO Certification; Patents; Return On Assets; Manufacturing Sector; Capacity Utilisation INTRODUCTION he advent of the knowledge based economy has made the acquisition of knowledge crucial and research has indicated a correlation between superior knowledge and competitive advantage as postulated by Teece et al. (1997) in their study of dynamic managerial capabilities. They advocate that competitive advantage is well determined by the organizational capabilities and core competences and their applications rather than the differences in industry characteristics. The idea then is to combine the specialized knowledge embedded in individuals otherwise known as human capital, with specific organizational activities to enable innovation. Thus technological capabilities (TCs) are now acknowledged as a resource necessary for superior performance. An assessment of science and technology in Africa ranked Zimbabwe 54th in the technology achievement index (TAI), which is very low considering that studies have shown that the TCs area key to economic growth and the benefits and penalties of global technological advances are increasing. The TAI reflects the levels of technological progress and capacity in terms of the creation of technological capabilities. This is the capacity to innovate, the diffusion of recent innovations, the diffusion of existing innovations and the human skills necessary for technology development. Little is known about the development of TCs since Zimbabwe’s economic woes began during the year 2000, which saw a number of companies close down. This study sought to empirically examine the relationship between technological capabilities and company performance in an effort to explore the level of preparedness of the manufacturing sector for recovery as far as TCs are concerned. TCs are influenced by a number of variables including ownership, company size, level of research and development, share of skilled workers, investment levels and age of the organisation. T

Welcome message from author
This document is posted to help you gain knowledge. Please leave a comment to let me know what you think about it! Share it to your friends and learn new things together.
Transcript
The Journal of Applied Business Research – May/June 2015 Volume 31, Number 3
Copyright by author(s); CC-BY 1023 The Clute Institute
Exploring Technological Capabilities
To Resuscitate The Zimbabwean
Manufacturing Sector Ms. P. Siwadi, North-West University, South Africa
Prof. T.G. Pelser, University of KwaZulu-Natal, South Africa
ABSTRACT
There is widespread agreement that manufacturing concerns require a level of technological
capabilities to be able to compete in a globalized economy. This study sought to examine the
technological capabilities necessary for the resuscitation of the Zimbabwean manufacturing
sector. The sector has been under a lot of pressure mainly from cheaper and sometimes better
quality products hailing from international players. With antiquated machinery and having been
closed in during and after sanctions, the sector understands the need for up scaling their TCs. The
study used data from a non-probability judgemental sample of 77 companies across 6 subsector
who had capacity utilization of up to 80%. Return on Assets (ROA) was used to measure
performance and was the dependent variable. A total of 14 independent variables were regressed
using a bivariate and multivariate regression analysis. Five distinct technological factors proved
to positively influence company performance. The significance for industry is that the 5 variables
clearly hover around increase in technological capabilities and the support of human resources
and information systems to go with it and directs strategists to what they need to recover in the
Zimbabwean economy.
Keywords: Performance; Technological Capabilities; Human Resources; ISO Certification; Patents; Return On
Assets; Manufacturing Sector; Capacity Utilisation
INTRODUCTION
he advent of the knowledge based economy has made the acquisition of knowledge crucial and
research has indicated a correlation between superior knowledge and competitive advantage as
postulated by Teece et al. (1997) in their study of dynamic managerial capabilities. They advocate
that competitive advantage is well determined by the organizational capabilities and core competences and their
applications rather than the differences in industry characteristics. The idea then is to combine the specialized
knowledge embedded in individuals otherwise known as human capital, with specific organizational activities to
enable innovation. Thus technological capabilities (TCs) are now acknowledged as a resource necessary for superior
performance. An assessment of science and technology in Africa ranked Zimbabwe 54th in the technology
achievement index (TAI), which is very low considering that studies have shown that the TCs area key to economic
growth and the benefits and penalties of global technological advances are increasing. The TAI reflects the levels of
technological progress and capacity in terms of the creation of technological capabilities. This is the capacity to
innovate, the diffusion of recent innovations, the diffusion of existing innovations and the human skills necessary for
technology development. Little is known about the development of TCs since Zimbabwe’s economic woes began
during the year 2000, which saw a number of companies close down. This study sought to empirically examine the
relationship between technological capabilities and company performance in an effort to explore the level of
preparedness of the manufacturing sector for recovery as far as TCs are concerned. TCs are influenced by a number
of variables including ownership, company size, level of research and development, share of skilled workers,
investment levels and age of the organisation.
T
The Journal of Applied Business Research – May/June 2015 Volume 31, Number 3
Copyright by author(s); CC-BY 1024 The Clute Institute
The study design is aimed at seeking to understand the existence and/or causal technological and
performance factors of observed common characteristics or practices in the research study area, specifically due to
its inherently multidisciplinary nature. The study area was Harare, as the majority of the manufacturers are located
there. The study population was all the manufacturing entities in the six subsectors who are operating above 80%
capacity. This paper contributes to the extant literature in the following ways. First, using a non-probability
judgemental sample of 77 companies both private and public from 2009 to 2012 across 6 subsector the researchers
provide evidence of the technological capabilities necessary for the Zimbabwean manufacturing sector in the face
of globalization. To the best of our knowledge, this paper presents a first attempt at modelling technological
capabilities- company performance association within the Sub-Saharan African context, with special reference to
Zimbabwe thus significantly increasing the body of knowledge for this developing economy. Secondly, contrary to
prior studies we use panel data because better results are obtained by pooling of cross-section and time-series
company data. Panel data sets give more data points, more degrees of freedom, reduce co linearity among variables
and therefore, produce more efficient estimates than pure cross-sectional or pure time-series data sets. Third, and
distinct from most prior studies, we use an econometric model that sufficiently addresses company heterogeneity
(i.e. company-specific variables) and time-specific variables which could bias estimates if omitted, as the case in
pure cross sectional and time series studies.
The rest of the paper is organised as follows. Section 2 provides an overview of the Zimbabwean
manufacturing sector; Section 3 reviews the prior literature on development of technological capabilities and their
relation to company performance. Section 4 describes the research methodology. Section 5 reports empirical
analyses, while section 6 concludes.
ZIMBABWE MANUFACTURING SECTOR
Overview Of The Manufacturing Sector
The manufacturing sector is one of the four wealth-generating sectors and is important to Zimbabwe’s
economy. At its peak in 1999, it was the major contributor to GDP at 22% (Zimbabwe Statistics Agency, 2010).
Although the sector’s contribution to the economy has fallen to the current level of about 14% of GDP, it is the
greatest single contributor to the country's GDP, accounting for more than a third of the country’s exports
(Zimbabwe Statistics Agency, 2010), and it remains an important sector that is critical for the economic
development of the country. Although the sector experienced a downturn from 2000 to 2009 during the years of
Zimbabwe’s worst economic woes, starting from 2000 it is still recognised by government as a key to economic
recovery. The sector is responsible for converting at least 60% of agricultural and mining output, and in turn at least
40% of its output is consumed by the aforementioned sectors (Ministry of Industry and Commerce, 2011). At
present, the manufacturing sector is characterised by high inefficiency as attested by low-capacity utilisation, which
averaged 44% in 2011. This was partly attributed to the high cost of foreign inputs, raw materials, plants and
machinery, and spare parts. This high dependence on foreign inputs reflects the low technological base of the sector
(Confederation of Zimbabwe Industries, 2011).
In the government’s industrial policy development framework (2011 to 2015), the government expresses
clear objectives for the manufacturing sector: to restore the sector’s contribution to Zimbabwe’s GDP from the
current 1.5% to 30%, and to increase its contribution to exports from 26% to 50% by 2015 (Confederation of
Zimbabwe Industries, 2011). An average real GDP growth of 15% is targeted under this framework. Table 1 shows
the manufacturing sector’s contribution to GDP from 2008 to 2013. The statistics show that the manufacturing
sector was a major contributor to GDP. According to the Confederation of Zimbabwe Industries (2011), the sector
has yet to restore its significance as its contribution is dwindling every year to very worrisome levels.
The Journal of Applied Business Research – May/June 2015 Volume 31, Number 3
Copyright by author(s); CC-BY 1025 The Clute Institute
Table 1. Manufacturing Sector GDP Growth/Decline
Year GDP Contribution to the Economy (%)
2008 13.3
2009 14
2010 14
2011 14.4
2012 2.3
2013 1.5
Source: Zimbabwe Statistics Agency (2013)
Zimbabwe Technological Capabilities Context
The following is empirical literature on the technological capabilities scenario in the Zimbabwe
manufacturing sector. The majority of the companies in the manufacturing sector are privately owned (89%) with
only 9 out of 78 companies listed on the Zimbabwean stock exchange being in the manufacturing sector. The
majority of the companies (67%) do not develop their own technologies though as expected, larger organizations are
better than smaller organizations. Further analysis indicates that there is a positive and significant relationship
between technology development and ownership as in tandem with Wignaraja (2007,) that foreign owned companies
have newer technology than local companies. Surprisingly it was noted that the majority of the companies that
imported technology were locally owned. It would be expected that foreign owned and those with mixed ownership
would be supported by their sister companies while locally owned companies would develop their own technology.
Companies in the developing world tend to benefit from technology from the developed countries with positive
results (Benedetto and Zhang 2003; Bilgin et al 2012; Hu et al 2003). In fact developing countries are known as net
recipients of technology (Hu et al. 2003, p.1).Even with this low technology development there is transfer of
technology to a fair extent.
As expected with little technology development there cannot be much registration and in the period 2009 to
2012, only 11 patents were registered. In line with the lack of technological development, at least 55% of the
respondents indicated that they have spent money on research and development. According to Teitel (2000) on a
study of Zimbabwean manufacturing companies, ‘Very little research and development (R&D) activity takes place,
and the results of such work in terms of patents and publications are quite meager, though not below African
regional standards.’ From 2000 to 2012 perhaps the expenditure on R&D has improved a little. Only a small number
(10%) of companies published something of a scientific nature. This is in tandem with the findings of Teitel (2000)
who noted that there were meagre contributions to scientific publications. Only half of the companies have some
kind of linkage. The manufacturing sector in Zimbabwe is highly heterogeneous producing in excess of 6000
different products (Chiripanhura (2010) and companies might not be able to have linkages and some may be
unwilling as linkages will mean sharing with the competition. At least half the companies indicated that they have
adequate internet for technical development. With the availability of internet providers and the price of data
manipulation and distribution going down every year this is a very plausible result. The role of ICTs in development
has been recognized by the Zimbabwean government through the creation of a Ministry of Information,
communication Technology, Postal and Courier services and such landmark measures as the e-Readiness Survey
(2004), and the National ICT Policy Framework (2005) are evidence of this. So companies seem to be following on
to the government’s initiatives. In terms of relationships with innovative institutions, at least 28% of the companies
have such relations with innovative institutions. Universities can also be roped into such relations and as suggested
by (Szogs 2010, p. 33) institutions of higher learning are critical participants in the creation and dissemination of
technological knowledge. The majority of the companies (91%) have some form of human resource development in
place. Zimbabwe has a deliberate mechanism for the training of apprentices where companies are compelled to
contribute 10% of their labour bill for the training of human resource at the aforementioned universities, polytechnic
colleges and vocational colleges.
PRIOR LITERATURE ON TCS
The Technological capabilities-company performance discourse requires interrogation of a wide variety of
literature to adequately address the multidimensional nature of TCs taxonomies. Progressing from Wang et al.
(2006) who postulated TCs as the ability to develop and design new products and processes and upgrade knowledge
The Journal of Applied Business Research – May/June 2015 Volume 31, Number 3
Copyright by author(s); CC-BY 1026 The Clute Institute
about the physical world in unique ways, thus transforming this knowledge into designs and instructions for the
creation of desired outcomes thus taking the mechanical view. Then Wignaraja (2002) posits to combine with the
human side of the argument that TCs involves the skills, knowledge and experience that enterprises need to operate
technology efficiently it can be concluded that TCs entail the amassed technological knowledge accumulated over a
period of time which a company can employ and deploy when developing new products or services and improving
existing ones (Kylaheiko et al., 2011).
The idea then is to combine the specialised knowledge embedded in individuals, otherwise known as
human capital, with specific organisational activities to enable innovation. Structured thus, TCs can be
acknowledged as a resource necessary for superior performance. They have a long-term impact on the growth and
performance of companies, especially in developing countries (Iammarino et al., 2008). The newly industrialised
economies of East Asia are a case in point where strong development of TCs has resulted in rapid export growth.
Hence it can be agreed that TCs have a positive connection with an innovation-based growth strategy (Kylaheiko et
al., 2011; Wignaraja, 2002).
As noted, TCs are not fly-by-night quick fixes but are a result of interactive learning and linkages between
a numbers of participants (Szogs, 2010). These participants are universities (which are centres of knowledge),
technical training institutions, the government (which is the custodian of national policy), research institutions
(which create and diffuse technology), and companies themselves. Szogs (2010) further points out that these strong
linkages culminate in skills knowledge and infrastructure conducive to the development of TCs. The development of
TCs in the manufacturing sector in Zimbabwe, for instance, would require the upgrading of all participants.
Technological Capabilities Dimensions
Researches have used a myriad of technological capabilities taxonomies depending on the research focus.
Technological capabilities is operationalization in this study by the use of three dimensions namely innovation,
infrastructure and human resources derived from prior studies which influenced the selection of the following 11
variables.
Technological Development
Coming up with innovative ways of doing things is critical for companies in the manufacturing sector as
some world renowned technologies may not work very well in the Zimbabwean context for instance plants for large
scale operations may not be conducive in an environment which has relatively small markets. It is therefore
imperative to develop appropriate technology which can be viewed in a positive light in terms of company
performance as it diminishes the need and cost of importing technology which might not work (Wignaraja, 2007).
Importation Of Technology
The diffusion of technology has become easier with the advent of the internet and when companies do not
develop their own technologies, importation becomes the one alternative. Conventional wisdom notes that with the
proliferation of technology, companies can benefit from importation of technology and in some cases it might be
cheaper and faster to purchase than to create your own. Companies in the developing world tend to benefit from
technology from the developed countries with positive results (Benedetto and Zhang, 2003; Bilgin et al., 2012; Hu
et al., 2003).
Patent Registration
The registration of patents is an indication of the development of technology in companies. It is evident that
an innovation of international acclaim has been discovered and the company is ready to publicly celebrate it (Lee,
Lee & Penning, 2001). Patent registration is an important milestone in building company technological capabilities
and understanding whether companies have registered patents or not is well within conventional wisdom. According
to Archiburgi and Coco (2005), registration of patents shows the level at which companies are creating their own
innovations.
The Journal of Applied Business Research – May/June 2015 Volume 31, Number 3
Copyright by author(s); CC-BY 1027 The Clute Institute
ISO Certification
This is an internationally recognized quality certification looking at various aspects of the organization. It is
not mandatory for companies in Zimbabwe to garner for this certification and it is companies with international
interests or those that want to use it for marketing that actively seek the certification. ISO certification has a positive
effect on some aspects of organizations operation and therefore on performance.
Research And Development
Research and development is the foundation of innovation and investment in it is an indication of a
company’s commitment to do things better or in a different way (O’Regan et al., 2006). Innovation can lead to
better products or more efficient production processes which have an impact on company performance
Contribution To Scientific Publications
Publications in scientific journals can be considered as an output variable. It is a platform to share results of
R&D and technology creation. This well justifies it as a variable of importance in the technological capabilities and
performance conversations (Archiburgi & Coco, 2005). An assessment of company technological capabilities is
therefore incomplete without examining whether companies contribute to scientific publications or not ( Archiburgi
and Coco 2005)
Presence Of Technological Linkages
Companies in the manufacturing sector who need technology capabilities utilize linkages for the diffusion
of knowledge and technology. The variable looked at the presence of such linkages as they have a bearing on levels
of technology as suggested by Lee, Lee and Penning (2001). Strong linkages provide tremendous opportunities for
companies to improve their technological capabilities and thus products.
ICT For Technological Developments
Technological development has prerequisite infrastructure and information technology has become a
critical variable in the creation and diffusion of technology and also in the development of other company
capabilities. Internet in Zimbabwe accessibility has improved considerably from the year 2000 to 2012 with the
11.5% of the population now having internet access according to the World Bank internet Statistics (2012).
According to the resource based view, information technology is considered a valuable organizational resource that
can enhance organizational capabilities and invariably lead to higher company performance. Early contentions by
researchers like Wernerfelt (1984) postulated that technological advancement allows the company higher returns and
later works (Tanriverdi 2005; Liang & Liu 2010) closely supports this view.
Relations With Innovative Institutions
Relations with innovative institutions has been noted in technological development literature as critical for
the quick transfer of knowledge and also for cooperation in research and development (Lee, Lee and Penning, 2001;
Lall, 1992; Szogs, 2010; Iammarino et al., 2008). Some countries have deliberately set up such institutions whose
mandate is to track technologies and adopt them for local companies.
Technology Transfer
One way developing countries can catch up with developed countries in productivity and technological
strength is through transfer of technology (Hu et al., 2003). This aspect is used to assess technological capabilities
because if a company is able to transfer technology, it is a developer of such technology though of course transfer
can also occur from an organization that has procured it. Companies benefit from technological transfer as it reduces
their R&D expenditure. Transfer can be in the form of direct diffusion from one company to another especially
The Journal of Applied Business Research – May/June 2015 Volume 31, Number 3
Copyright by author(s); CC-BY 1028 The Clute Institute
between sister companies, through licencing or through foreign direct investment. Technology transfers generally
flow from developed to developing countries (Palacios-Marque´s et al., 2013).
Human Resource Development
Human resource development was postulated to be critical for technological development (Palacios-
Marque´s et al., 2013). Human resource development for technological capabilities is a prerequisite for building
appropriate skills to handle innovations or acquired technology. Knowledge resides in people and enhancing them
would be critical to the processes, transactions and operations of the organization. Zimbabwe faced a serious skills
flight from 2000 to 2008 and skills development was one way organizations could improve performance. It was
critical to note the extent to which companies were involved in developing these skills.
METHODOLOGY
The study undertook a quantitative research design. A quantitative approach utilizes a post positivism
paradigm which employs enquiry that uses predetermined instruments that yield statistical data (Creswel, 2007).
The nature of the problem requires pooling of cross-section and time-series company data (panel data analysis). The
study involves data sets on multiple entities where each entity is observed at more than two points in time, a
situation which ogres well with panel data analysis. Panel data sets give more data points, more degrees of freedom,
reduce co linearity among variables and therefore, produce more efficient estimates than pure cross-sectional or pure
time-series data sets. Panel data methodology gave the researcher greater flexibility in controlling for the effects of
company heterogeneity (i.e. company-specific variables) and time-specific variables which could bias estimates if
omitted, as the case in pure cross sectional and time series studies (Ehikioya, 2009).
Using non-probability judgemental sampling, a total of 77 questionnaires were administered to companies
in 6 subsectors in the manufacturing sector, forming the sample from the population of all the registered
manufacturing entities in operating above 80% capacity utilization in Harare Zimbabwe. A total of 62 questionnaires
were usable giving a response rate of 80%. The respondents were wary of releasing data especially financial data
given the collection period’s proximity to the elections held in July 2013 and the indigenization policy drive which
was underway. The researcher used analytical software, STATA, for data analysis. Descriptive statistics concerning
the variables were looked at and the results of the regression model came up with critical technological capabilities
factors.
Variables
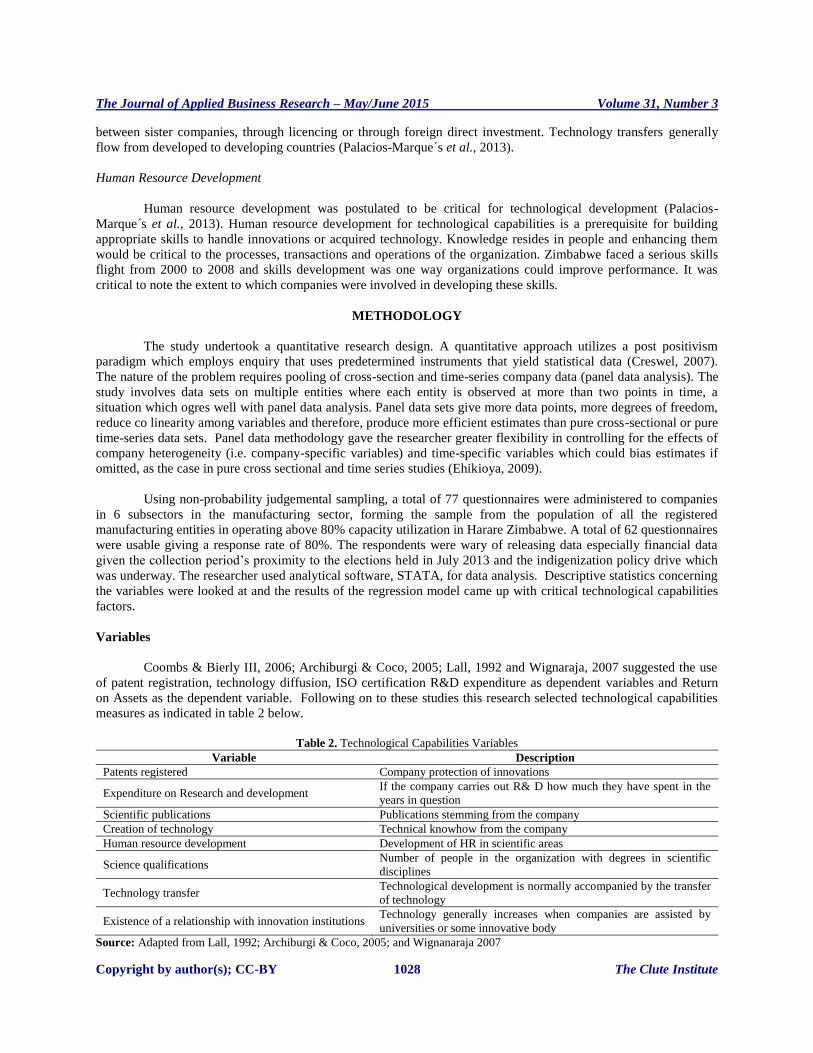
Coombs & Bierly III, 2006; Archiburgi & Coco, 2005; Lall, 1992 and Wignaraja, 2007 suggested the use
of patent registration, technology diffusion, ISO certification R&D expenditure as dependent variables and Return
on Assets as the dependent variable. Following on to these studies this research selected technological capabilities
measures as indicated in table 2 below.
Table 2. Technological Capabilities Variables
Variable Description
Patents registered Company protection of innovations
Expenditure on Research and development If the company carries out R& D how much they have spent in the
years in question
Scientific publications Publications stemming from the company
Creation of technology Technical knowhow from the company
Human resource development Development of HR in scientific areas
Science qualifications Number of people in the organization with degrees in scientific
disciplines
Technology transfer Technological development is normally accompanied by the transfer
of technology
Existence of a relationship with innovation institutions Technology generally increases when companies are assisted by
universities or some innovative body
Source: Adapted from Lall, 1992; Archiburgi & Coco, 2005; and Wignanaraja 2007
The Journal of Applied Business Research – May/June 2015 Volume 31, Number 3
Copyright by author(s); CC-BY 1029 The Clute Institute
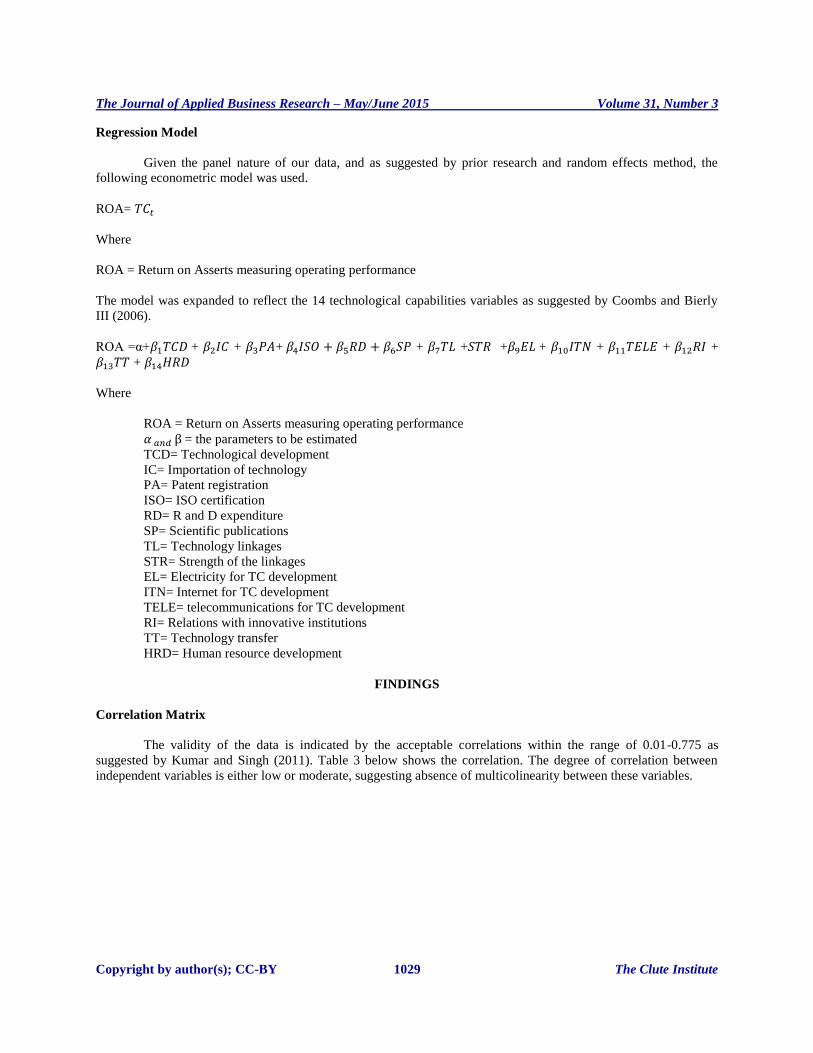
Regression Model
Given the panel nature of our data, and as suggested by prior research and random effects method, the
following econometric model was used.
ROA=
Where
ROA = Return on Asserts measuring operating performance
The model was expanded to reflect the 14 technological capabilities variables as suggested by Coombs and Bierly
III (2006).
ROA =α+ + + + + + + + + + +
+
Where
ROA = Return on Asserts measuring operating performance
= the parameters to be estimated
TCD= Technological development
IC= Importation of technology
PA= Patent registration
ISO= ISO certification
RD= R and D expenditure
SP= Scientific publications
TL= Technology linkages
STR= Strength of the linkages
EL= Electricity for TC development
ITN= Internet for TC development
TELE= telecommunications for TC development
RI= Relations with innovative institutions
TT= Technology transfer
HRD= Human resource development
FINDINGS
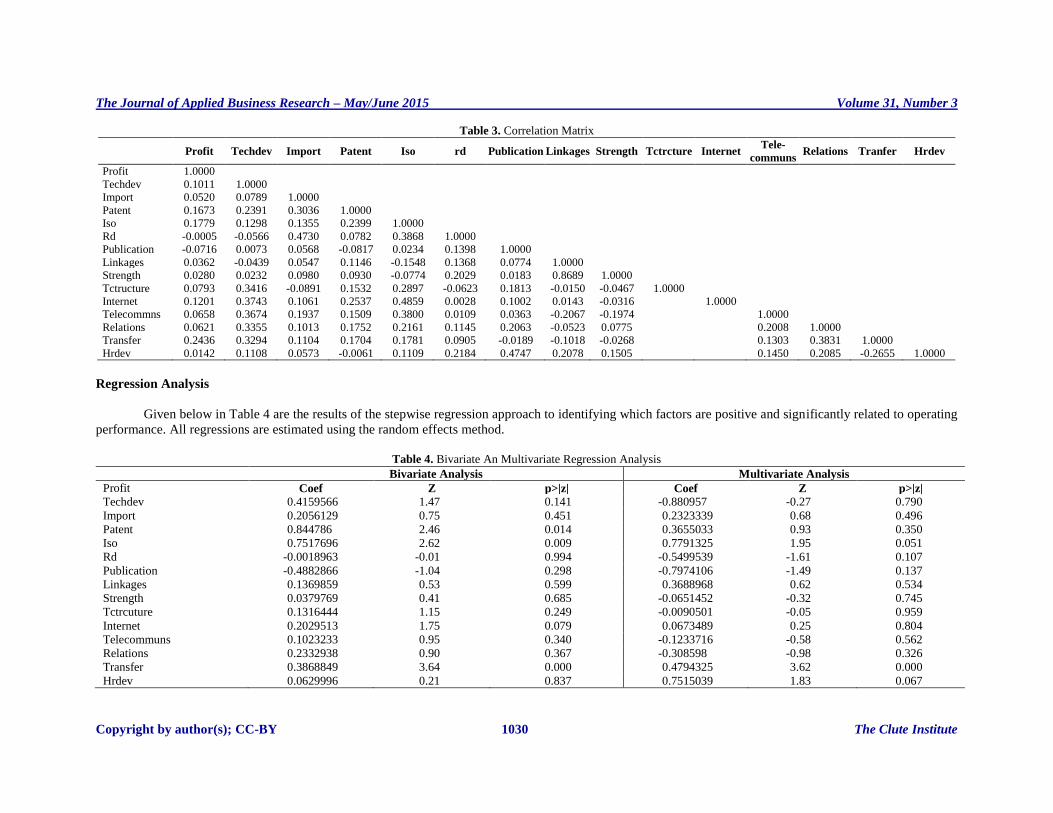
Correlation Matrix
The validity of the data is indicated by the acceptable correlations within the range of 0.01-0.775 as
suggested by Kumar and Singh (2011). Table 3 below shows the correlation. The degree of correlation between
independent variables is either low or moderate, suggesting absence of multicolinearity between these variables.
The Journal of Applied Business Research – May/June 2015 Volume 31, Number 3
Copyright by author(s); CC-BY 1030 The Clute Institute
Table 3. Correlation Matrix
Profit Techdev Import Patent Iso rd Publication Linkages Strength Tctrcture Internet Tele-
communs Relations Tranfer Hrdev
Profit 1.0000
Techdev 0.1011 1.0000
Import 0.0520 0.0789 1.0000
Patent 0.1673 0.2391 0.3036 1.0000
Iso 0.1779 0.1298 0.1355 0.2399 1.0000
Rd -0.0005 -0.0566 0.4730 0.0782 0.3868 1.0000
Publication -0.0716 0.0073 0.0568 -0.0817 0.0234 0.1398 1.0000
Linkages 0.0362 -0.0439 0.0547 0.1146 -0.1548 0.1368 0.0774 1.0000
Strength 0.0280 0.0232 0.0980 0.0930 -0.0774 0.2029 0.0183 0.8689 1.0000
Tctructure 0.0793 0.3416 -0.0891 0.1532 0.2897 -0.0623 0.1813 -0.0150 -0.0467 1.0000
Internet 0.1201 0.3743 0.1061 0.2537 0.4859 0.0028 0.1002 0.0143 -0.0316 1.0000
Telecommns 0.0658 0.3674 0.1937 0.1509 0.3800 0.0109 0.0363 -0.2067 -0.1974 1.0000
Relations 0.0621 0.3355 0.1013 0.1752 0.2161 0.1145 0.2063 -0.0523 0.0775 0.2008 1.0000
Transfer 0.2436 0.3294 0.1104 0.1704 0.1781 0.0905 -0.0189 -0.1018 -0.0268 0.1303 0.3831 1.0000
Hrdev 0.0142 0.1108 0.0573 -0.0061 0.1109 0.2184 0.4747 0.2078 0.1505 0.1450 0.2085 -0.2655 1.0000
Regression Analysis
Given below in Table 4 are the results of the stepwise regression approach to identifying which factors are positive and significantly related to operating
performance. All regressions are estimated using the random effects method.
Table 4. Bivariate An Multivariate Regression Analysis
Bivariate Analysis Multivariate Analysis
Profit Coef Z p>|z| Coef Z p>|z|
Techdev 0.4159566 1.47 0.141 -0.880957 -0.27 0.790
Import 0.2056129 0.75 0.451 0.2323339 0.68 0.496
Patent 0.844786 2.46 0.014 0.3655033 0.93 0.350
Iso 0.7517696 2.62 0.009 0.7791325 1.95 0.051
Rd -0.0018963 -0.01 0.994 -0.5499539 -1.61 0.107
Publication -0.4882866 -1.04 0.298 -0.7974106 -1.49 0.137
Linkages 0.1369859 0.53 0.599 0.3688968 0.62 0.534
Strength 0.0379769 0.41 0.685 -0.0651452 -0.32 0.745
Tctrcuture 0.1316444 1.15 0.249 -0.0090501 -0.05 0.959
Internet 0.2029513 1.75 0.079 0.0673489 0.25 0.804
Telecommuns 0.1023233 0.95 0.340 -0.1233716 -0.58 0.562
Relations 0.2332938 0.90 0.367 -0.308598 -0.98 0.326
Transfer 0.3868849 3.64 0.000 0.4794325 3.62 0.000
Hrdev 0.0629996 0.21 0.837 0.7515039 1.83 0.067
The Journal of Applied Business Research – May/June 2015 Volume 31, Number 3
Copyright by author(s); CC-BY 1031 The Clute Institute
Variable Findings And Discussion
This section highlights the situation gaining on the Zimbabwean manufacturing sector and the results of the
regression analysis are also discussed.
Technological Development
Technological development which has its backdrop in innovation has an impact on the company’s
performance but surprisingly the larger companies are not at the forefront of technology development resulting in
only 33% of the companies involved in some form of development. In the majority of cases, the more effective the
innovations, the more successful the business (O’Regan et al., 2006). The regression results indicate that innovation
is not positively related to company performance. Similar results were noted by (Hatzikian, 2012; Darroch, 2005 and
Choi & Williams, 2013). The studies were carried out across the developed and emerging economies namely
Greece, United States of America and Korea and China respectively so country effects may not influence
innovation. The results may be in line with the fact that very few companies (33%) in the sample developed their
own technology. In tandem with this (Shiferaw, 2007) in a study of Ethiopian manufacturing companies noted that
relatively few companies embark on innovative activities. On the contrary however (Atalay et al., 2013 and Li et al.,
2006) found that technological development was positive and significant to company performance. Since country
effects do not seem to matter, perhaps innovation significance and support differs from industry to industry.
Importation Of Technology
It was therefore important to establish whether companies’ imported technology as it can indicate levels of
technological capabilities in the company. In Zimbabwean manufacturing scenario, (69%) of the respondents mainly
locally owned companies indicated that they import technology. Regression results indicate no association between
importation of technology and company performance. Contrary to this, (Branstetter & Chen, 2006; Bilgin et al.,
2012 and Hu et al., 2003) noted that importation of technology was positive and significant to company
performance. This may be because the studies were conducted in the Far East where importation of technology was
instrumental in their huge leap into international trade arena.
Patent Registration
Accordingly the researcher sought to assess the level of technological capabilities for company
performance by measuring the establishing whether companies had registered patents. The results indicated a
positive association between patent registration and company performance. This is probably because since patents
are an indication of innovation, and innovation boosts the technological capabilities of the company and in many
cases performance. In agreement, (Simeth & Cincera, 2013) found patent registration positive and significant to
company performance. Contrary to this (Decarollis & Deeds, 1999; Choi and Williams, 2013; Coombs & Bierly,
2006) did not find a positive association between patent registration and company performance. In as much as total
number of patents is indicative of technological activity, some studies found patent registration negative and not
significant to company performance. The probable reason for these differences is that emerging economies are in
the throes of upgrading their technologies and patent registration is a critical indicator of technology development
whereas developed countries have reached a higher level of technological capabilities and patent registration is no
longer as revered and not all innovations directly affect company performance.
ISO Certification
Obtaining quality certification from the International Organization for Standardization (ISO) has gained
popularity the world over. It sends a positive signal that a company has specific quality targets in the making.
Zimbabwean companies are struggling for initial or re-registration as the country is recovering but the ISO
certification is far below international standards. The regression analysis found a positive and significant association
between ISO certification and company performance. This finding was in agreement with several studies across the
globe. In emerging economies, (Lafuente et al., 2009) analysed Spanish companies, (Al Refaie et al., 2012) studied
Jordanian companies, (Starke et al., 2012) looked at Brazilian companies and (Corbett et al., 2005) examined United
The Journal of Applied Business Research – May/June 2015 Volume 31, Number 3
Copyright by author(s); CC-BY 1032 The Clute Institute
States companies and noted a positive and significant association between ISO certification and company
performance. The reason for this result could be that ISO certification entails improvement in production processes,
cost, waste reduction, better management control and quality enhancement all which affect performance. A study
done by Simmons and White (1999) was an isolated example of a contrasting view that ISO certification was
positive but not significant to company performance. Since ISO certification was popularized in after 2000 this
results might make sense.
Research And Development
At least 55% of the respondents indicate that they have spent money on research and development.
Companies may intensify their internal R&D expenditure especially for new products or be financed by other
companies to carry out R&D. Research and development, however, had no positive significance to company
performance. This result is in agreement with Shiferaw (2007) who found R&D expenditure negative and not
significant to company performance. The reason is likely because it is not necessarily the expenditure on research
and development that matters but the effectiveness and relevance of the development that will affect company
performance. Other researchers have however found different results to the contrary. Some found out that
expenditure on research and development is positive but not significant to company performance (Coombs & Bierly
2006, Branstetter & Chen 2006 and Jam et al., 2011). Others noted that expenditure on R&D was positive and
significant to company performance (Decarolis & Deeds, 1999 and Hu et al., 2003). Worthy of note is the fact that
earlier studies have quite a different view to later studies. And that all these are researches carried outside Africa as
opposed to Shiferaw’s study of Ethiopian manufacturing companies in 2007.
Contribution To Scientific Publication
Very few companies (10%) have contributed to scientific publications a fact also noted by (Teitel, 2000).
The regression analysis found no significant relationship between contribution to scientific publications and
company performance. The probable reason is that there are costs associated with publications and the Zimbabwean
companies are not yet ready to bear the costs. Added to that, companies might think that they do not have much to
contribute as this is generally an area for academics and might not see the benefit of publishing. Added to that as
pointed out by (Simeth & Cincera, 2013), there are costs of producing the papers, costs associated with easier
imitation by the competition and costs of the loss of the scientist who in publishing have advertised themselves.
Other authors however found a positive and significant association between company publication of scientific
material and company performance (Simeth & Cincera, 2013 and Decarolis & Deeds, 1999).
Presence Of Technological Linkages
Linkages provide a forum for technological learning in companies and can add as much as 30% to a
company’s value addition efforts. Linkages stem from a variety of relationships ranging from customers to suppliers
and industry counterparts. These networks enhance a company’s ability to gather information and resources
pertinent to the development of the organization (Carmeli and Azeroual, 2009 and Chen and Branstetter, 2006). The
researchers inquired after the existence of such linkages. At least (45%) of the companies in the manufacturing
sector had technological linkages which were noted as being quite strong. The regression analysis found
technological linkages positive but not significant to company performance. A study of Korean companies in 2001
found technological linkages positive and significant to company performance (Lee et al., 2001) and similarly a
study of Mexican manufacturing companies later in 2008 also had the same result (Iammarinno et al., 2008). The
probable reason for the differences is that in Zimbabwe the culture of linkages is not popular as organizations strive
to shield their technologies from competitors. Added to that the Zimbabwean manufacturing sector is highly
heterogeneous at one point producing up to 6000 different products and linkages under such circumstances can be
difficult.
The Journal of Applied Business Research – May/June 2015 Volume 31, Number 3
Copyright by author(s); CC-BY 1033 The Clute Institute
Internet For Technological Developments
At least (37%) of the companies indicated that their information technology, electricity and
telecommunications were adequate for technological development. The regression analysis found a positive
association between information technology and company performance. But there was no positive association
between electricity resources and telecommunications with company performance. Similar results were noted by
Liang and Liu (2010). On the contrary, (Huang et al., 2009, p.15) noted that information technology was negative
and not significant to company performance. The reason cited in these studies at variance with the research study is
that information technology acts as a conduit for improvement of technological capabilities and directly relating it to
company performance might be difficult (Huang et al., 2009).
Relations With Innovative Institutions
Relationships with such institutions are important as they can lead to valuable technological breakthroughs
and it was in the researcher’s interest to determine the existence of the partnerships. It was noted that some (45%) of
the companies had fairly strong relationships with a technological facility. The regression analysis found the
relationship positive but not significant to company performance. A similar result was found by (Lee et al., 2001) in
a research on Korean companies. Iammarino et al., (2008) also noted the same result on a research on Mexican
companies. The probable reason for the lack of significance was that research institutions are generally involved in
basic research which might not be specific to the needs of the companies. In Zimbabwe for instance, a lot of
research is academic in nature and collaboration with companies is not prominent.
Transfer Of Technology
Technology transfer is taking place to some extent in the majority of companies indicating that even though
the companies are not net creators of their own technology they can still transfer that which they have. The
regression analysis found that transfer of technology is positively associated with company performance a result
shared by (Hu et al., 2003 and Palacios-Marque´s et al., 2013). This is probably because Zimbabwe being a
developing country benefits tremendously from transfer of technology especially for multinational companies.
Human Resource Development
Zimbabwe has a deliberate mechanism for the training of apprentices where companies are compelled to
contribute 10% of their labour bill for the training of human resource. This probably contributes to the high positive
response. The majority of companies (91%) are developing skills which is very high. The regression analysis shows
a positive association between human resource development and company performance. In tandem with this results
(Thang & Buyens, 2008) found training positive and significant to company performance. This is probably because
no amount of technological capabilities can function on its own, which necessitates the human resource element.
Contrary to this result, (Schwager et al., 2000) noted that skills development was positive but not significant to
company performance). This is probably a Zimbabwean phenomenon where capacity building is a key issue making
it very significant.
CONCLUSION
The Zimbabwean manufacturing sector has been in existence for over 60 years, which should be enough
experience to lay strong foundations for TC development. It can be concluded that the country has taken rather a
long time to set the TC development agenda, given the loose frameworks, the dependence on FDI (Foreign Direct
Investment) and company ownership structures. There has not been gradual, incremental development as in the
cases of Mauritius and the Asian ‘Tigers’, and in fact there has not been much TC development at all. It is apparent
that companies have been complacent, which is unacceptable against the backdrop of globalisation which is
affecting small economies such as Zimbabwe’s.
Technological capabilities afford a company the opportunity to use technology to create competitive
advantage as well postulated in the theory of dynamic managerial capabilities. The development and adoption of
The Journal of Applied Business Research – May/June 2015 Volume 31, Number 3
Copyright by author(s); CC-BY 1034 The Clute Institute
technological capabilities is a must for Zimbabwean companies as this critical stage of their history. These
capabilities differ very much between developed and developing countries, the former being largely the innovators
heavily involved in creation of technological solutions and the later adopting them to their needs. It can be
concluded that in line with the deficiency in Zimbabwe, the results noted that the significant technological
capabilities variables hovered around the development of technology. These being ISO certification, patent
registration, presence of adequate internet resources and human resource development.
Research has shown that companies that register patents invest heavily in research and development which
results in technological breakthroughs that require patent protection as it is a source of competitive advantage. ISO
certification is a step up from development where a company requires a stamp of quality by the international body.
Added to that are internet resources which are necessary for diffusion of technology. Since Zimbabwe is on the
receiving end of technological developments it is necessary to have the internet resources to search for and find
appropriate technological capabilities for competitiveness. Human resource development goes hand in hand with
acquiring new technologies. Knowledge resides in people and competent human resource is irreplaceable. This fits
very well in the Zimbabwean manufacturing sector where companies are recovering and these variables are
necessary for technological development.
There has not been empirical research to come up with a technological index for Zimbabwe but it can be
concluded that the antiquated manufacturing equipment has negative effects on the competitiveness of Zimbabwe
manufacturers. Thus technological development is right down the alley for the majority of companies in the
manufacturing sector to improve performance and to be able to offer goods on the international market.
AUTHOR INFORMATION
Patience Siwadi, Deputy Director, Graduate School of Business Leadership, Midlands State University, Gweru
Zimbabwe. She Lectures in Strategic management and business communication. She is a registered PhD student
with North West University Mafikeng Campus in her final year of study. Her study area is Dynamic managerial
capabilities looking at integration of social capital, corporate governance and technological capabilities for business
performance in the Zimbabwe manufacturing sector. She has research interests in strategy implementation, business
networking, social capital and technological capabilities for business performance. She is actively involved in
Zimbabwe’s economic recovery.
Prof. Theuns Pelser is the Dean and Head of School for the Graduate School of Business and Leadership at the
University of KwaZulu-Natal, South Africa. He holds a PhD in Strategic Management. His academic interest is
strategic management, within the fields of strategic marketing and small business development, especially within the
context of technology and innovation management. He holds a PhD in Strategic Management from the
Potchefstroom University. His research focuses on technology strategies, innovation strategies and technology
management processes and their relationship to company performance.
REFERENCES
Branstetter, L., Chen J.R. (2006). The impact of technology transfer and R&D on productivity growth in Taiwanese
industry: Micro-econometric analysis using plant and firm-level data. Japanese and International
Economies, 20:177–192.
Chipika, S. & Wilson, G. (2006). Enabling technological learning among light engineering SMEs in Zimbabwe
through networking. Technovation, 26 (8):969-979.
Confederation of Zimbabwe Industries. (2011). Manufacturing survey report. Harare.
Coombs, J.E., Bierly III, P.E. (2006). Measuring technological capability and performance. R&D Management,
36(4): 421–438.
Das, D.K. (2010). Another perspective of globalization. Journal of International Trade Law and Policy, 9(1):46-63.
Huang M., Ahn, J. and Lee, D. (2009). IT Capabilities and Firm Performance: The Moderating Role of Institutional
Pressures and the Mediating Role of IT. Americas Conference on Information Systems (AMCIS) 2009
Proceedings, Innovation Success AIS Electronic Library (AISeL) http://aisel.aisnet.org/amcis2009/653
The Journal of Applied Business Research – May/June 2015 Volume 31, Number 3
Copyright by author(s); CC-BY 1035 The Clute Institute
Iammarino, S., Padilla-Pérez, R. & von Tunzelmann, N. (2008). Technological capabilities and global-local
interactions: The electronics industry in two Mexican regions. World Development Review, 36(10):1980–
2003.
Kurfi, A.K. (2009). Leadership Styles: The Managerial Challenges in Emerging Economies. International Bulletin
of Business Administration, 14(2):55-79.
Kylaheiko, K., Jantunen, A., Puumalainen, K., Saarenketo, S. & Tuppura, A. (2011). Innovation and
internationalization as growth strategies: The role of TCs and appropriability. International Business
Review, 508-520.
Ministry of Industry and Commerce. (2011). State of the manufacturing sector report. Harare.
Ministry of Industry and Commerce. (2010). Zimbabwe industry development framework. Harare.
Palacios-Marque´s, D. Spain, V. Peris-Ortiz, M. & Merigo´ J.M. (2013). The effect of knowledge transfer on firm
performance: An empirical study in knowledge-intensive Industries. Management Decision, 51(5): 973-
985.
Sachikonye, L.M. (2002). Whither Zimbabwe? Crisis and democratization. Review of African Political Economy,
9(1):13-20.
Shi, Y. (2009). Technological capabilities and international production strategy of companies: the case of foreign
direct investment in China. Journal of World Business, 36(2):184–204.
Szogs, A. (2010). Technology transfer and technological capability building in informal companies in Tanzania.
Lund, Sweden: Lund University (Thesis - PhD).
Teece, D.J. (2010). Technological innovation and the theory of the company: The role of enterprise-level
knowledge, complementarities, and dynamic capabilities. London: Elsevier.
Teitel, S. (2001). Technological competence and company economic performance in Zimbabwe’s manufacturing
industry. Economics of Innovation and New Technology, 10(6):513-526.
Tödtling, F., Lehner, P. & Kaufmann, A. (2008). Do different types of innovation rely on specific kinds of
knowledge interactions? SRE - Discussion Papers, 2008/01. Vienna: University of Economics and
Business.
Van Kleef, J.A.G. & Roome, N.J. (2007). Developing capabilities and competence for sustainable business
management as innovation: a research agenda. Journal of Cleaner Production, 15(1):38-51.
Wang, Y., Zhang, Q. & Xue, Y. (2006). How technological capability influences business performance: an
integrated framework based on the contingency approach. Journal of Technology Management in China,
1(1):27-52.
Wignaraja, G. (2002). Company size, technological capabilities and market-oriented policies in Mauritius. Oxford
Development Studies, 30(1):87-104.
Wignaraja, G. (2007). Foreign ownership, technological capabilities, and clothing exports in Sri Lanka. ADB
Institute discussion paper no. 82.
Wu, H. (2008). When does internal governance make companies innovative? Journal of Business Research, 61:141–
153.
Zimbabwe Statistics Agency. (2011). National Accounts 2011. Harare.

The Journal of Applied Business Research – May/June 2015 Volume 31, Number 3
Copyright by author(s); CC-BY 1036 The Clute Institute
NOTES
Related Documents