Accepted Manuscript Exploring Stress Levels, Job Satisfaction and Quality of Life in a Sample of Police Officers in Greece Evangelos C. Alexopoulos, Vassiliki Palatsidi, Xanthi Tigani, PhD Christina Darviri PII: S2093-7911(14)00052-3 DOI: 10.1016/j.shaw.2014.07.004 Reference: SHAW 57 To appear in: Safety and Health at Work Received Date: 19 December 2013 Revised Date: 13 May 2014 Accepted Date: 14 July 2014 Please cite this article as: Alexopoulos EC, Palatsidi V, Tigani X, Darviri C, Exploring Stress Levels, Job Satisfaction and Quality of Life in a Sample of Police Officers in Greece, Safety and Health at Work (2014), doi: 10.1016/j.shaw.2014.07.004. This is a PDF file of an unedited manuscript that has been accepted for publication. As a service to our customers we are providing this early version of the manuscript. The manuscript will undergo copyediting, typesetting, and review of the resulting proof before it is published in its final form. Please note that during the production process errors may be discovered which could affect the content, and all legal disclaimers that apply to the journal pertain.

Welcome message from author
This document is posted to help you gain knowledge. Please leave a comment to let me know what you think about it! Share it to your friends and learn new things together.
Transcript

Accepted Manuscript
Exploring Stress Levels, Job Satisfaction and Quality of Life in a Sample of PoliceOfficers in Greece
Evangelos C. Alexopoulos, Vassiliki Palatsidi, Xanthi Tigani, PhD Christina Darviri
PII: S2093-7911(14)00052-3
DOI: 10.1016/j.shaw.2014.07.004
Reference: SHAW 57
To appear in: Safety and Health at Work
Received Date: 19 December 2013
Revised Date: 13 May 2014
Accepted Date: 14 July 2014
Please cite this article as: Alexopoulos EC, Palatsidi V, Tigani X, Darviri C, Exploring Stress Levels,Job Satisfaction and Quality of Life in a Sample of Police Officers in Greece, Safety and Health at Work(2014), doi: 10.1016/j.shaw.2014.07.004.
This is a PDF file of an unedited manuscript that has been accepted for publication. As a service toour customers we are providing this early version of the manuscript. The manuscript will undergocopyediting, typesetting, and review of the resulting proof before it is published in its final form. Pleasenote that during the production process errors may be discovered which could affect the content, and alllegal disclaimers that apply to the journal pertain.
MANUSCRIP
T
ACCEPTED
ACCEPTED MANUSCRIPT
Exploring Stress Levels, Job Satisfaction and Quality of Life in a Sample of
Police Officers in Greece
Evangelos C. Alexopoulos1, Vassiliki Palatsidi 2, Xanthi Tigani1,#, Christina Darviri1
1 Postgraduate Course Stress Management and Health Promotion, School of Medicine,
University of Athens, Soranou Ephessiou Str., 4, GR-115-27, Athens, Greece 2 Technological Educational Institution (TEI) of Athens, Department of Health
Visitors
# Corresponding Author: Tigani Xanthi, PhD
Biomedical Research Foundation, Academy of Athens
Soranou Ephessiou Str., 4, GR-115-27, Athens, Greece,
Tel-Fax (0030)210-6597644
Running title: Stress, job satisfaction, life quality of policemen
MANUSCRIP
T
ACCEPTED
ACCEPTED MANUSCRIPTAbstract
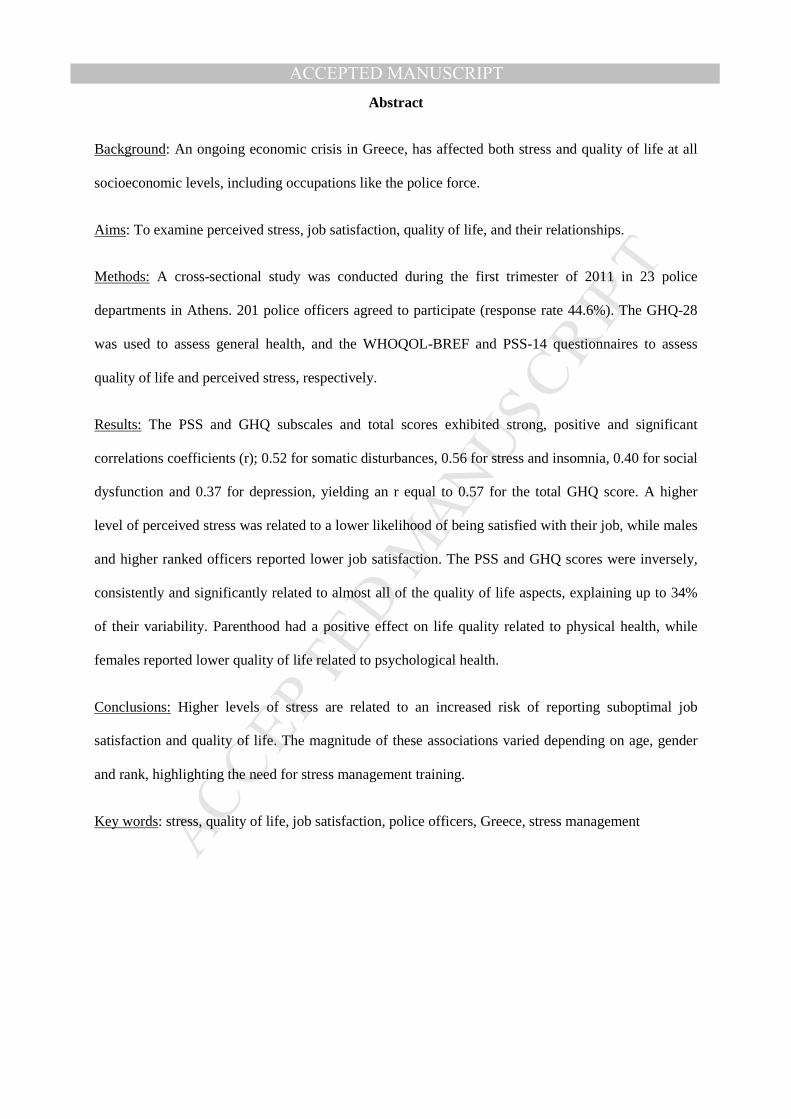
Background: An ongoing economic crisis in Greece, has affected both stress and quality of life at all
socioeconomic levels, including occupations like the police force.
Aims: To examine perceived stress, job satisfaction, quality of life, and their relationships.
Methods: A cross-sectional study was conducted during the first trimester of 2011 in 23 police
departments in Athens. 201 police officers agreed to participate (response rate 44.6%). The GHQ-28
was used to assess general health, and the WHOQOL-BREF and PSS-14 questionnaires to assess
quality of life and perceived stress, respectively.
Results: The PSS and GHQ subscales and total scores exhibited strong, positive and significant
correlations coefficients (r); 0.52 for somatic disturbances, 0.56 for stress and insomnia, 0.40 for social
dysfunction and 0.37 for depression, yielding an r equal to 0.57 for the total GHQ score. A higher
level of perceived stress was related to a lower likelihood of being satisfied with their job, while males
and higher ranked officers reported lower job satisfaction. The PSS and GHQ scores were inversely,
consistently and significantly related to almost all of the quality of life aspects, explaining up to 34%
of their variability. Parenthood had a positive effect on life quality related to physical health, while
females reported lower quality of life related to psychological health.
Conclusions: Higher levels of stress are related to an increased risk of reporting suboptimal job
satisfaction and quality of life. The magnitude of these associations varied depending on age, gender
and rank, highlighting the need for stress management training.
Key words: stress, quality of life, job satisfaction, police officers, Greece, stress management

MANUSCRIP
T
ACCEPTED
ACCEPTED MANUSCRIPTIntroduction
For several decades, the scientific community has studied workplace stress and its effects, both in
terms of physical and psychological health and in terms of individual behavior. The European Agency
for Safety and Health at Work (2005) reported that 22% of EU workers experience high levels of
stress. In a recent European survey, the highest stress levels were reported by Greek workers (55%)
[1]. Police officers also experience elevated levels of stress, anxiety and irritability [1]. Their work has
been described as one of the most stressful occupations in the world because the physical threats in
their operational field are enormous. Police officers are charged with the apprehension of criminals,
the prevention and investigation of crimes and the maintenance of public order [2]. At the same time,
they are nameless, faceless individuals whom citizens tend to separate from the rest of society.
However, organizational stressors, such as the administrative structure and working environment, are
considered to be more significant compared with the operational issues that police officers face [3-6].
Numerous reports state that police officers’ suicide rate is higher compared to other working groups,
and police officers have also been reported to experience stress-related morbidity, reduced
productivity, absenteeism due to illness and premature retirement [3, 7-10]. Increased alcohol
consumption, smoking and drug abuse are additional negative consequences that are relevant to the
police officers’ workplace stress [11- 14 ].
During the last three years, the economic crisis in Greece has affected nearly all professional groups
[15]. There have been riots, and public opinion has turned against police force officers, creating
preconceived notions about this particular profession and rendering it even more stressful [16].
Because this particular occupation is extremely important for social order and coherence and because
stress interferes with police officers’ performance, it would be very interesting to assess police
officers’ lives during these times and focus on possible actions that should be taken to prevent or
relieve the impact of stress on their quality of life.
The aim of this study was to assess police officers’ perceived stress levels, job satisfaction, quality of
life, and their relationships during these difficult times.

MANUSCRIP
T
ACCEPTED
ACCEPTED MANUSCRIPTMethods
The sample
A cross-sectional study was conducted during the first trimester of 2011 in twenty-three (23) police
stations at various district (regional) level departments of the greater Athens area. Based on dividing
the greater Athens area into four (prefectural) sampling zones, sample sizes of at least 20% of the
departments were considered to be adequate and feasibly obtained. The sampling zones included
central Athens (21 departments), northeast Attica (34), southeast Attica (15), and west Attica (15).
Convenience and judgment sampling (quota sampling) was utilized to fulfill the predefined sampling
criteria. Although quota sampling is a form of non-probability (non-random) sampling, it was found to
not introduce any bias in the study because it was unrelated to the specific research aims. After
obtaining each police station captain’s permission, all of the policemen were asked to participate in the
study. Of four hundred and fifty police officers, 201 agreed to participate (response rate, 44.6%). The
remaining 249 police officers either refused to participate or their captain did not give clearance and/or
consent to participate. The study was approved by the Technological Educational Institute of Athens
(A-TEI) thesis committee.
The instruments
The following instruments were used:
1. A questionnaire, which was used to collect demographic information.
2. The General Health Questionnaire-28, which is one of the most commonly, used tools to
assess mental well-being. Developed as a screening tool to detect subjects who are likely to
have or be at risk of developing psychiatric disorders, it measures the common mental health
problems/domains of depression, anxiety, somatic symptoms and social withdrawal. Although
it is available in a variety of versions comprising 12, 28, 30 or 60 items, the 28-item version is
the most widely used version because of time considerations and because the GHQ-28 has
been used most widely in other working populations, allowing for more valid comparisons
[17]. Currently, there are 4 scoring methods for the GHQ-28, but the most common are the

MANUSCRIP
T
ACCEPTED
ACCEPTED MANUSCRIPTLikert and the GHQ scoring methods. Generally, patients suffering from psychiatric problems
can be distinguished from subjects in good mental health if they have a score of 5 or more on
the Likert scale or 24 or more on the GHQ scale. Higher scores indicate a higher probability of
mental disorder. The GHQ-28 questionnaire has been translated and validated in Greek [18].
In addition, a question regarding perceived health status ("How would you rate your health
status overall?″) was included and scored on a 3-point scale: "Good or Worse,″ "Very good,″
and "Excellent.″
3. The World Health Organization Quality of Life Questionnaire (WHOQOL-BREF), which was
developed by the World Health Organization, assesses an individual’s quality of life. The
instrument is a self-report inventory of generic quality of life questions with 26 original items,
and it is divided into four sub-scales: physical health, mental health, social relationships and
social environment. Higher scores indicate a better quality of life [19]. Having been translated
and validated in Greek, the WHOQOL-BREF contains 4 additional questions [20] and seems
to be a well-developed instrument for assessing quality of life.
4. The Perceived Stress Scale-14 (PSS-14), which is a 14-item self-report instrument with a five-
point scale (0=never, 1=almost never, 2=sometimes, 3=fairly often, 4=very often). Stress is
commonly measured by using (i) the environmental approach i.e. the occurrence of
demanding events (stressors); (ii) the psychological approach i.e. the perceived by the
individual stressfulness of each stressor; or (iii) the biological approach that focuses on the
biological elements of the stress response. The Perceived Stress Scale (PSS) assess the
perception of stressful experiences (i.e. the psychological approach) by asking the respondent
to rate the frequency of his/her feelings and thoughts related to events and situations that
occurred over the previous month. Half of the items of PSS-14 represent the perceived
helplessness (“perceived distress”) and the other half the self-efficacy (“perceived coping”)
[22]. Higher levels of and longer-lasting self-perceived stress, indicated by a high score, are
considered a risk factor for a clinical psychiatric disorder. [21] The instrument has also been
translated and validated in Greek [22].

MANUSCRIP
T
ACCEPTED
ACCEPTED MANUSCRIPT5. Job satisfaction questionnaire, which we developed as a 5-item self-reporting tool whose scale
ranges from 2 to 3 points, depending on the question. This questionnaire qualitatively
measures job satisfaction, which is considered to be one of the most important determinants of
quality of life. The following questions were included: 1) ″How satisfied are you with your
job?" This question had a 4-point scale: ″Very satisfied," ″Somewhat dissatisfied," ″Very
dissatisfied" and ″Somewhat dissatisfied." The last two categories were combined in the
regression analysis, leading to a 3-level dependent variable. 2) "Would you recommend your
job to a friend?″ This question had a 3-point scale: "No, I’d discourage it,″ ″I doubt it," and ″I
would highly recommend it." 3) ″Would you choose the same job all over again?″ This
question had a 3-point scale: "Without a doubt,″ "It is likely,″ and "Definitely not.″ 4) "How
likely will you find a new job within the next year?″ This question had a 3-point scale:
"Likely,″ "Very likely,″ and "Unlikely.″ 5) "Are you satisfied with your salary?″ This question
was dichotomized into "yes″ and "no″ answers.
Statistical Analysis
The Pearson’s chi-squared test and the Kruskal-Wallis test were used to investigate possible
associations between police rank and other variables. The statistical analyses were based on regression
modeling techniques since we wanted to estimate the effect of stress on the various outcomes,
adjusting also for potential confounders. The self-reported job satisfaction as an ordinal variable was
assessed using the ordered logit model. When the proportional odds assumption was violated, different
effects for the different levels of job satisfaction were estimated. The non-parametric median
regression analysis with bootstrap standard error estimates, based on 100 replications, was used to
model the WHOQOL-BREF scales scores since the corresponding variables were quantitative but not
normally distributed. All statistical analyses were performed using Stata 9.2 SE for Windows.

MANUSCRIP
T
ACCEPTED
ACCEPTED MANUSCRIPTResults
Basic demographic data and job-related characteristics of the 201 police officers who agreed to
participate in the survey are presented in Table 1. The majority of the participants were male [n=156,
77.6%] and younger than 30 years old [28.1 (sd=8) and 28 (sd=6.7) for men and women, respectively].
The majority of the participants were single [68% of males and 53% of females] and worked the night
shift (Table 1). More than half of the participants (53%) were classified in the higher education level
(>14 years), and a significant proportion were highly ranked (Table 1). Significantly fewer women
belonged in the high rank classification and worked the night shift (49% vs. 71%), but the weekly
employment time did not differ between genders [a mean of 44 hours/week]. The employment
duration in the police force was 6.3 years [sd 6.4] for men and 5.1 years [sd 4.8] for women.
Seventy-five percent [75%] of the male police officers and eighty-four percent [84%] of the female
police officers stated that they were more or less satisfied with their job, but only 24% of the
participants would highly recommend their job to a friend. Four out of five [4/5] participants
considered it highly unlikely that they would change their occupation by finding another job within the
next year, but only 35.5% of the participants were satisfied with their salary.
As expected for mostly young police officers, 85% of the men and 78% of the women reported very
good to excellent health status (self-reported health status). However, 6.4% of the men [n=10] and
4.4% of the women [n=2] reported poor to fair health status.
Based on GHQ-28 scores (Likert scale (23/24)), the participants’ general health level results were
more than satisfactory; the female participants’ scores were lower (better) but did not differ
significantly from the men’s scores [20.1 (sd 10.4) vs. 18.5 (sd 13.4), respectively; p=0.59)]. In
subscale analysis, the female participants reported more somatic disturbances, higher stress levels and
more frequent insomnia, while men exhibited slightly higher scores for social dysfunction and
depression but none of these differences reached statistical significance.
On the WHOQOL-BREF questionnaire, both male and female police officers reported similar results
(not significantly different), although on most scales (physical health, psychological health and
MANUSCRIP
T
ACCEPTED
ACCEPTED MANUSCRIPTenvironment), the male participants scored higher (better) than the female participants [(27.17 (4.26)
vs. 26.55 (3.85); 22.79 (3.11) vs. 21.60 (3.22); 25.11 (5.03) vs. 24.95 (4.33); respectively; p>0.05],
while women had a slightly higher score in social relations than men [11.39 (2.36) vs. 11.16 (2.18);
p>0.05].
The PSS and GHQ subscales and total scores exhibited strong, positive and significant correlations
(Table 2). The correlation coefficient (r) was 0.52 for somatic disturbances (and PSS), 0.56 for stress
and insomnia, 0.40 for social dysfunction and 0.37 for depression, yielding an r equal to 0.57 for the
total GHQ score. As expected, the PSS and GHQ scores were negatively and significantly correlated
with the QoL scores (Table 2).
Table 3 shows the results of the univariate analysis of self-reported job satisfaction. There was
evidence that the proportional odds assumption was violated for the variables of age and parenthood;
thus, different effects were estimated for the different levels of job satisfaction. The multivariate
analysis results are also presented in Table 3. The variable of age did not seem to have a consistent
effect on satisfaction. Age seemed to increase the likelihood of being less satisfied with the job but not
the likelihood of being dissatisfied (somewhat/very). A higher level of perceived stress was related to
a lower likelihood of being more satisfied. Males and higher ranked officers reported lower
satisfaction with their job (Table 3). Specifically, police training officers (p=0.030) and special guards
(P=0.084, marginally non-significant difference) had a higher odds of being more satisfied with their
job compared to police captains. The interactions of police rank with gender and PSS were not
statistically significant with regard to job satisfaction (p=0.563).
As shown in Table 4 the WHOQOL-BREF scores were modeled and adjusted for age and gender. The
PSS and GHQ scores were inversely, consistently and significantly related to almost all of the scales,
and these factors explained up to 34% of the variability of the subscales. The variable of parenthood
also had a significant positive effect on the quality of life related to physical health scale, while female
participants reported lower quality of life scores in relation to psychological health. Possible
interactions were assessed for both models. Specifically the gender – PSS interaction was not

MANUSCRIP
T
ACCEPTED
ACCEPTED MANUSCRIPTstatistically significant neither for job satisfaction (p=0.752) nor for the WHOQOL-BREF four
subscales (p(1)=0.759; p(2)=0.876; p(3)=0.351; and p(4)=0.4, respectively). The parenthood – gender
interaction was not statistically significant neither for job satisfaction (p=0.347) nor for the
WHOQOL-BREF subscales (p(1)=0.322; p(2)=0.058; p(3)=0.6, p(4)=0.574). The overall effects of
police rank on the WHOQOL-BREF four subscales were not statistically significant (p(1)=0.503;
p(2)=0.644; p(3)=0.605; and p(4)=0.594, respectively). Also there was no evidence for interaction of
police rank with gender and PSS (p=0.395).

MANUSCRIP
T
ACCEPTED
ACCEPTED MANUSCRIPTDiscussion
This cross-sectional study of a sample of the Greek police force confirmed that there are significant
relationships between perceived stress, job satisfaction and quality of life. Our findings are consistent
with findings reported by previous studies [23-26]. Perceived stress levels are negatively associated
with general health and quality of life [25]. Although these measures include the dimension of mental
health, implying an inherent correlation, are distinct in nature. The GHQ-28 assesses the psychological
aspect of quality of life (psychological well-being) but mainly designed for detection and assessment
of individuals with an increased likelihood of current psychiatric disorder by comparing his/her recent
psychological state with the usual one [27,28]. The strong correlations between the subscales (somatic
symptoms, anxiety and insomnia, social dysfunction, and severe depression) and the total score
indicate the inter-relatedness of the subscales and the unidimensionality of the instrument. Its score
has been found to be influenced by gender but not by age, marital status and living situation [27,28].
The WHOQOL BREF assesses the individual's perceptions in the context of their culture and value
systems, in which they live and in relation to their goals, expectations, standards and concerns. This
constitutes a broad concept affected in a complex way by the person's physical health, psychological
state, level of independence, social relationships, personal beliefs and their relationship to salient
features of their environment. Under this concept the definition of health as "A state of complete
physical, mental, and social well-being not merely the absence of disease..." is fundamental and
differentiate the disease-centred approach of GHQ-28. So the questionnaires (concepts) are
complementary rather than competitive in quality of life research arena, implying the significance of
adjustment for in the multivariate analysis. PSS does not reach significance only in the “social
relations” scale although all scales under study were strongly related and the colinearity between them
may excuse such an effect. The reason seems to be the less strong association between PSS and social
relations compared with the other subscales. The loss in the multivariate modelling of social relations
is reflected in the lower pseudo-R2; It is possible that perceived stress (i.e. perceived helplessness and
self-efficacy) during the time of social distress and specifically in certain occupational groups is less
influenced by social relations and support. In our study, female officers seemed to be more prone to

MANUSCRIP
T
ACCEPTED
ACCEPTED MANUSCRIPTstress and less capable of acquiring a sufficient means of coping, but they also seemed to be more
satisfied. This discrepancy may be explained by a lighter work burden (lower ranks, less night shifts)
combined with a low rate of parenthood. Higher levels of somatization and depression, compared to
their male counterparts, have been reported in female officers [29]. Gender and perceived stress score
interactions did hold significant additional influence (relation) either in job satisfaction or in quality of
life, although there were few females in our setting. Having kids (parenthood) and gender possible
interactions did not show any significant relation with job satisfaction or quality of life. A borderline
effect in WHOQOL-BREF “psychological” subscale may indicate the positive effect might have in
female police officers women to have kids, but this may be attributed to organizational or other social
issues. Age was negatively correlated with job satisfaction levels but only to a certain extent. More
importantly, the lower-ranked officers had a significant higher probability of being satisfied with their
job. Perceived stress levels also had a profound effect both on job satisfaction and quality of life, as
other studies have shown [30, 31]. The current economic crisis most likely contributes to this finding.
Our study provides strong evidence on the vulnerability of specific groups among police force (i.e.
males and higher – ranked officers), in an era of social distress and the potential benefit in all from
stress management on quality of life. It became obvious from the current results that among the
complex interplay of the various aspects of quality of life and job satisfaction, especially where other
approaches to work-environment modification is not very easy to be implemented, stress management
might be a promising tool. Stress management and health promotion programs are completely lacking
in the Hellenic Police Force and may prove to be a useful strategy in this regard [32].
In general, our sample consisted of relatively young and healthy police officers and was relatively
small. However, studies of this type are rarely performed, and this is the first known study of its kind
in Greece. Other limitations may be related to the time constraints of the cross-sectional design.
Police force officers provide a valuable service to our society; however, they are not immune to stress,
and it must prioritize stress as an important issue that should be tackled with effective stress
prevention and management.
MANUSCRIP
T
ACCEPTED
ACCEPTED MANUSCRIPTKey Points
1. Perceived stress levels have a profound negative effect both on job satisfaction and quality of
life.
2. The higher-ranking officers had a significantly higher probability of being dissatisfied with
their job.
3. The relationships between perceived stress and general health and their combined effect on
quality of life further highlight the need for stress management training, especially in the
stressful socioeconomic environment that has arisen from the economic crisis in this country.
Acknowledgements
The authors acknowledge all of the policemen for their participation.
Funding
None
Conflicts of interest
The authors declare that there is no conflict of interests regarding the publication of this article.
MANUSCRIP
T
ACCEPTED
ACCEPTED MANUSCRIPTReferences
1. European Agency for Safety and Health at Work, European Risk Observatory Report, 2009
2. Deschamps F, Paganon-Badinier I, Marchand Annie-Claude, Merle Corinne. Sources and
Assessment of Occupational Stress in the Police Journal of Occupational Health,2003; 45:
358-364
3. Collins PA and Gibbs ACC. Stress in police officers: a study of the origins, prevalence and
severity of stress-related symptoms within a county police force. Occupational Medicine
2003; 53:256–264
4. Violanti JM, Aron F. Ranking police stressors. Psychol Rep, 1994; 75: 824–826.
5. Kirkcaldy B, Cooper CL, Ruffalo P. Work stress and health in a sample of U.S. police.
Psychol Rep 1995; 76: 700–702.
6. Brough P. Comparing the influence of traumatic and organisational stressors upon the
psychological health of police, fire and ambulance officers. International Journal of Stress
management 2004; 11: 227-244
7. Schmitdke A, Fricke S, Lester D. Suicide among German federal and state police officers.
Psychol Rep 1999; 84: 157–166.
8. McCafferty F, McCafferty E, McCafferty M. Stress and suicide in police officers: paradigm of
occupational stress. South Med J 1992; 85: 223–243.
9. Confederation of British Industry (CBI). Focus on Absence. Absence and Labour Turnover
Survey. London: CBI, 1999; 5–9
10. Her Majesty’s Inspectorate of Constabulary (HMIC). Lost Time. The Management of
Sickness Absence and Medical Retirement in the Police Service, Thematic Inspection Report.
HMIC, 1997; 59–75
11. Smith DR, Devine S, Leggat PA, Ishitake T. Alcohol and Tobacco Consumption among
Police Officers. Kurume Medical Journal 2005; 52: 63-65
12. Richmond RL, Wodak AK, Heather L. Research Report: How Healthy Are the Police? A
Survey of Lifestyle Factors. Addiction 1998; 93: 1729-1737

MANUSCRIP
T
ACCEPTED
ACCEPTED MANUSCRIPT13. Dunham RG, Lewis L, Alpert GP. Testing the Police for Drugs. Criminal Law Bulletin1998;
24: 155-166
14. Pinfold V, Huxley P, Thornicroft G, Farmer P, Toulmin H, Graham T. Reducing psychiatric
stigma and discrimination. Evaluating an educational intervention with the police force in
England. Society Psychiatry and Psychiatric Epidemiology 2003; 38: 337–44
15. Biggam FH, Power KG, MacDonald RR, Carcary WB, Moodie E. Self-perceived occupational
stress and distress in a Scottish police force. Work Stress 1997; 11:118-133.
16. Kirkcaldy B, Cooper CL, Ruffalo P. Work stress and health in a sample of U.S. police.
Psychol Rep 1995; 76: 700–702.
17. Jackson C. The General Health Questionnaire. Occupational Medicine 2007; 57: 79
18. Garyfallos G, Karastergiou A, Adamopoulou A, Moutzoukis C, Alagiozidou E, Mala D,
Garyfallos A. Greek version of the General Health Questionnaire: accuracy of translation and
validity. Acta Psychiatr Scand 1991; 84:371-8
19. Skevington SM, Lotfy M, O’Connell KA. The World Health Organization’s WHOQOL-
BREF quality of life assessment: Psychometric properties and results of the international field
trial, A Report from the WHOQOL Group. Quality of Life Research 2004; 13: 299–310
20. Tzinieri-Kokotsi M, Triantafyllou E, Antonopoulou B, Tomaras V, Soldatos C, Mavreas V,
Christodoulou GN. Psychometric properties of WHOQOL-BREF in clinical and healthy
Greek populations: Incorporating new culture-relevant items. Psychiatriki 2012; 23: 130-142.
21. Cohen S, Kamarck T, Mermelstein R. A global measure of perceived stress. J. Health Soc
Behav 1983; 24: 385-396.
22. Andreou E, Alexopoulos EC, Lionis C, Varvogli L, Gnardellis C, Chrousos GP, Darviri
C.Perceived Stress Scale: reliability and validity study in Greece. Int J Environ Res Public
Health 2011; 8:3287-98
23. Berg AM, Hem E, Lau B, Ekeberg O. An exploration of job stress and health in the
Norwegian police service: a cross sectional study. Journal of Occupational Medicine and
Toxicology 2006; 1:26
MANUSCRIP
T
ACCEPTED
ACCEPTED MANUSCRIPT24. Slottje P, Twisk JWR, Smidt N, Huizink AC, WitteveenAB, vanMechelen W, Smid T. Health-
related quality of life of firefighters and police officers 8.5 years after the air disaster in
Amsterdam. Qual Life Res 2007; 16:909
25. Novaes L. M. Stress and Quality of Life of Senior Brazilian Police Officers. The Spanish
Journal of Psychology 2009; 12: 593-603
26. Brown J, Cooper C, Kirkcaldy B. Occupational stress among senior police officers. British
Journal of Psychology 1996; 87: 31-41.
27. Golderberg D, Williams P. A user’s guide to the General Health questionnaire. Windsor:
NFER-Nelson; 1988.
28. Willmott SA, Boardman JA, Henshaw CA, Jones PW. Understanding General Health
Questionnaire (GHQ-28) score and its threshold. Soc Psychiatry Psychiatr Epidemiol. 2004
Aug;39(8):613-7.
29. He N., Zhao J., Archbold CA. Gender and Police Stress. International Journal of Police
stretegies & management 2002; 4: 687-708.
30. Collins PA, Gibbs ACC. Stress in police officers: a study of the origins, prevalence and
severity of stress-related symptoms within a county police force. Occup Med (Lond) 2003;
53:255–263.
31. Scanff C. Stress Management for Police Special Forces. Journal Of Applied Sport Psychology
2002; 14: 330-343
32. Cooper CL. Stress prevention in the police. Occupational Medicine 2003; 53:244–245

MANUSCRIP
T
ACCEPTED
ACCEPTED MANUSCRIPTTables
Table 1. Individual and job related characteristics of police force officers
Police rank
Police 1st and 2nd
captains
Police lieutenant/second lieutenant
Police constable
Police training officer
Special guard
n (%) n (%) n (%) n (%) n (%) p-value Males 26 (81.3) 25 (69.4) 64 (73.6) 23 (92.0) 11 (91.7) 0.148 Having kids (Parenthood)
13 (40.6) 16 (44.4) 8 (9.2) 0 (0.0) 1 (8.3) <0.001
Marital status <0.001 Singe/Divorced/Widowed
12 (37.5) 13 (36.1) 72 (82.8) 23 (95.8) 6 (50.0)
Married/Domestic partnership
20 (62.5) 23 (63.9) 15 (17.2) 1 (4.2) 6 (50.0)
Higher education (at least BSc)
0.617
No 14 (43.8) 21 (58.3) 42 (49.4) 10 (40.0) 5 (41.7)
Yes 18 (56.3) 15 (41.7) 43 (50.6) 15 (60.0) 7 (58.3)
Working shift <0.001
Any other 20 (62.5) 20 (55.6) 23 (26.4) 1 (4.0) 3 (25.0) Rotational including night shift
12 (37.5) 16 (44.4) 64 (73.6) 24 (96.0) 9 (75.0)
Job satisfaction 0.105 Somewhat/very dissatisfied
12 (37.5) 9 (25.0) 19 (21.8) 2 (8.0) 1 (8.3)
Somewhat satisfied 14 (43.8) 14 (38.9) 49 (56.3) 14 (56.0) 6 (50.0)
Very satisfied 6 (18.8) 13 (36.1) 19 (21.8) 9 (36.0) 5 (41.7)
Median (IQR) Median (IQR) Median
(IQR) Median (IQR)
Median (IQR) p-value
Age (years) 33.0 (31.0,
41.0) 33.0 (27.5, 41.5)
24.0 (22.0, 26.0)
21.0 (20.0, 21.0)
26.5 (25.0, 28.0)
<0.001
PSS total 23.0 (18.5,
26.0) 21.0 (16.0, 31.0)
23.0 (16.0, 27.0)
17.0 (14.0, 27.0)
19.0 (15.5, 25.0)
0.791
GHQ total (1) 18.0 (13.5,
21.5) 18.0 (12.0, 22.0)
15.0 (11.0, 26.0)
15.0 (11.5, 23.0)
13.0 (9.0, 18.5)
0.656
WHOQOL-BREF
Physical health 28.0 (26.0, 29.0)
27.0 (24.5, 29.5) 28.0 (24.0,
30.0) 29.0 (26.0,
31.0) 29.0 (24.5,
30.5) 0.431
Psychological health 23.0 (20.0, 24.0)
23.0 (20.0, 24.0) 23.0 (20.0,
25.0) 23.0 (22.0,
26.0) 24.0 (22.5,
24.0) 0.514
Social relations 12.0 (11.0, 13.0)
11.0 (10.5, 13.0) 11.0 (10.0,
13.0) 10.0 (9.0,
12.0) 12.0 (11.5,
12.5) 0.159
Environment 25.0 (22.0, 27.0)
24.0 (22.0, 28.0) 25.0 (22.0,
28.0) 25.0 (20.0,
28.0) 24.0 (20.5,
28.0) 0.854

MANUSCRIP
T
ACCEPTED
ACCEPTED MANUSCRIPTTable 2. Correlations among PSS, General Health Questionnaire (GHQ) and Quality of Life (QOL) subscales
GHQ1 GHQ2 GHQ3 GHQ4 GHQTotal QOL1 QOL2 QOL3 QOL4 *PSS TOTAL 0.523 0.562 0.397 0.365 0.567 -0.574 -0.695 -0.337 -0.522 †GHQ 1 0.687 0.613 0.574 0.869 -0.639 -0.474 -0.322 -0.383 GHQ 2 0.559 0.533 0.860 -0.554 -0.469 -0.386 -0.400
GHQ 3 0.634 0.814 -0.579 -0.387 -0.416 -0.398
GHQ 4 0.802 -0.519 -0.405 -0.416 -0.304
GHQ TOTAL -0.689 -0.538 -0.460 -0.443
QOL 1 0.631 0.512 0.514
QOL 2 0.532 0.430
QOL3 0.308 *PSS: perceived stress scale; GHQ1: physical complaints; GHQ2: stress and insomnia; GHQ3: social dysfunction; GHQ4: severe depression; QOL1: physical health, QOL2: mental (psychological) health; QOL3: social relationships; QOL4: social environment. All correlations were significant at 0,01 level.

MANUSCRIP
T
ACCEPTED
ACCEPTED MANUSCRIPTTable 3. Univariate and multivariate analysis of job satisfaction (ordered logit models)
Univariate Multivariate OR 95%CI OR 95%CI Age (years) Somewhat/very dissatisfied Somewhat satisfied
0.92 1.02
0.88 0.98
0.97 1.07
0.93 1.05
0.88 0.99
0.99 1.11
Gender Males Females
1
1.66
0.88
3.11
1
2.65
1.22
5.78 Having Kids Somewhat/very dissatisfied Somewhat satisfied
0.43 1.34
0.20 0.62
0.91 2.90
NS*
Marital status Singe/Divorced/Widowed Married/Domestic partnership
1
0.72
0.41
1.27
NS*
Education years <14 >=14
1
0.91
0.54
1.54
NS*
Working shift Any other Rotational including night shift
1
1.39
0.79
2.44
NS*
Police rank Police 1st and 2nd captain Police lieutenant/second lieutenant Police constable Police training officer Special guard
1
2.39 1.72 3.58 4.22
0.93 0.78 1.31 1.18
6.14 3.75 9.76 15.05
1
1.87 1.40 4.52 3.77
0.70 0.53 1.16 0.84
4.97 3.71 17.63 17.01
PSS total (per 5 units) 0.62 0.51 0.75 0.91 0.88 0.95 GHQ total (per 5 units) 0.78 0.68 0.89 NS*
*NS: non-significant; Proportional odds assumption is violated for age ( p <0.001), for kids (p =0.005); Odds ratio for age and kids corresponds to the odds ratio of being more satisfied than the corresponding satisfaction category; Odds ratio for the other covars to the odds ratio of being more satisfied in general, independently of satisfaction category.

MANUSCRIP
T
ACCEPTED
ACCEPTED MANUSCRIPT
Table 4. Multivariate analysis of WHOQOL-BREF scales* (median regression with bootstrap SEs)
Physical health Psychological health Social relations Environment Age (years) per unit
-0.05 (-0.17, 0.08)
-0.02 (-0.08, 0.03)
0.015 (-0.043, 0.073)
-0.01 (-0.14, 0.13)
Gender Males Females
0
-0.42 (-1.25, 0.41)
0
-1.06 (-2.03, -0.09)
0
0.244 (-0.902, 1.390)
0
1.45 (-0.85, 3.74) Having Kids No Yes
0
1.82 (0.11, 3.53)
NS†
NS†
NS†
PSS total (per unit)
-0.12 (-0.22, -0.02) -0.19 (-0.28, -0.11) NS† -0.25 (-0.35, -0.16)
GHQ total (per unit)
-0.21 (-0.30, -0.12) -0.07 (-0.13, -0.002) -0.085 (-0.144, -0.025) -0.12 (-0.19, -0.06)
Pseudo R2 0.32 0.34 0.09 0.20 *Age and gender were included in all four models irrespectively of the significance level; †NS: non-significant; in bold the significant relations.
Related Documents