Exploring Statistical Index Criteria for Transformer Frequency Response Interpretation Adilet Sultanbek, BSc in Electrical and Electronic Engineering Submitted in fulfilment of the requirements for the degree of Masters of Science in Electrical and Electronic Engineering School of Engineering Department of Electrical and Computer Engineering Nazarbayev University 53 Kabanbay Batyr Avenue, Astana, Kazakhstan, 010000 Supervisors: Mehdi Bagheri Co-Supervisor: Amin Zollanvari December 2018

Welcome message from author
This document is posted to help you gain knowledge. Please leave a comment to let me know what you think about it! Share it to your friends and learn new things together.
Transcript

Exploring Statistical Index Criteria for
Transformer Frequency Response
Interpretation
Adilet Sultanbek, BSc in Electrical and Electronic Engineering
Submitted in fulfilment of the requirements
for the degree of Masters of Science
in Electrical and Electronic Engineering
School of Engineering
Department of Electrical and Computer Engineering
Nazarbayev University
53 Kabanbay Batyr Avenue,
Astana, Kazakhstan, 010000
Supervisors: Mehdi Bagheri
Co-Supervisor: Amin Zollanvari
December 2018

1
DECLARATION
I hereby, declare that this manuscript, entitled “Exploring Statistical Index
Criteria for Transformer Frequency Response Interpretation”, is the result of my
own work except for quotations and citations, which have been duly
acknowledged. I also declare that, to the best of my knowledge and belief, it has
not been previously or concurrently submitted, in whole or in part, for any other
degree or diploma at Nazarbayev University or any other national or international
institution.
-------------------------------------------
Name: Adilet Sultanbek
Date: December 14, 2018

2
ABSTRACT
Large power transformers are considered as the most expensive assets in
power system network after hydro generators. Therefore, monitoring of such
equipment needs to take special attention. Frequency Response Analysis (FRA)
is one of the efficient methods to examine the mechanical condition of the
transformer without opening the transformer tank. FRA is a comparative method,
where the measured response is compared to the reference fingerprints. Therefore,
interpretation of the FRA results needs to be done by an expert in the field. To
overcome this problem, so that untrained personnel would be able to use FRA for
transformer condition monitoring the interpretation of the frequency response
should be based on standard or on some criteria. In this study, various statistical
indices for frequency response results interpretation will be introduced and
evaluated. Frequency responses of single-phase 0.4-1kVA transformers and three-
phase transformers up to 40kVA are interpreted by statistical indices. Outcome of
each indicator is discussed and the most reliable ones for FR interpretation are
suggested. The simulation of inter-disk short circuit was performed by the rheostat
connected in parallel with the winding of transformer. The voltage taps of the
transformers were used in order to have the access to different percentage of the
transformer winding. With the help of different voltage taps and different
resistances in parallel, the two levels of critical values were found and advised to
use.

3
ACKNOWLEDGEMENT
I would first like to thank my thesis advisor Dr. Mehdi Bagheri of the
School of Engineering at Nazarbayev University. The Prof. Bagheri always
provided me with valuable advises and was available for me 24/7. He allowed to
this paper to be my own work, but guided me whenever I had trouble with it.
I would also like to acknowledge Dr. Amin Zollanvari of the School of
Engineering at Nazarbayev University as the co-supervisor of this thesis, and I am
gratefully indebted to him for his very valuable comments on this thesis.
Finally, I must express my very profound gratitude to my parents and to my
partner for providing me with unfailing support and continuous encouragement
throughout my years of study and through the process of researching and writing
this thesis. This accomplishment would not have been possible without them.

4
PUBLICATION LIST
The Conference paper for this topic was submitted.
A. Sultanbek, A. Khassenov, Y. Kanapyanov, M. Kenzhegaliyeva, and M. Bagheri,
“Intelligent wireless charging station for electric vehicles.” In Control and Communications
(SIBCON), International Siberian Conference on IEEE, pp. 1-6, 2017
M. Bagheri, A.Sultanbek, O. Abedinia, M. S. Naderi and N. Ghadimi, “Multi-objective
Shark Smell Optimization for Solving the Reactive Power Dispatch Problem.” IEEE
International Conference on Environment and Electrical Engineering and IEEE Industrial and
Commercial Power Systems Europe (EEEIC/I&CPS Europe). pp. 1-6, 2018
V. Nurmanova, M. Bagheri, A. Sultanbek, A. Hekmati, H. Bevrani, "Feasibility Study
on Wind Energy Harvesting System Implementation in Moving Trains." Control and
Communications (SIBCON), International Siberian Conference on. IEEE, 2017.

5
Table of Contents ABSTRACT .............................................................................................................................. 2
Acknowledgement .................................................................................................................... 3
Publication list .......................................................................................................................... 4
List of Tables ............................................................................................................................. 6
List of Figures ........................................................................................................................... 7
Chapter 1 – Introduction ............................................................................................................ 8
1.1 Motivation and Objectives ................................................................................................ 8
1.2 Literature review ............................................................................................................. 11
Chapter 2 – Methodology and experimental setup ................................................................... 20
2.1 Methodology ................................................................................................................... 20
2.1.1 Euclidean Distance(ED) ......................................................................................... 21
2.1.2 Standard Deviation (SD) ........................................................................................ 21
2.1.3 Absolute Sum of Logarithmic Error (ASLE) ......................................................... 22
2.1.4 Absolute Difference (DABS) ................................................................................. 22
2.1.5 Root Mean Square Error (RMSE) .......................................................................... 23
2.1.6 Correlation Coefficient (CC) ................................................................................. 23
2.1.7 Sum Squared Error (SSE) ...................................................................................... 23
2.1.8 Complex Distance (CD) ......................................................................................... 24
2.1.9 Comparative Standard Deviation (CSD) ............................................................... 24
2.1.10 Cross-correlation coefficient (CCF) ...................................................................... 25
2.1.11 Maximum of Difference (MAX) ........................................................................... 25
2.1.12 Minimum-Maximum Ratio (MM) ......................................................................... 25
2.1.13 Normalized Correlation Coefficient (ρ) ................................................................. 26
2.1.14 Sum squared ratio error (SSRE) ............................................................................ 26
2.1.15 Sum squared max-min ratio error (SSMMRE) ...................................................... 27
2.2 Experimental Setup......................................................................................................... 27
2.3 The effect of the rheostat connected in parallel to the transformer winding .................. 29
Chapter 3 – Results and Discussion ......................................................................................... 32
3.1 Results of FR with calculated SIs ................................................................................... 32
3.2 Criteria for each SIs ........................................................................................................ 55
Chapter 4 – Conclusion ............................................................................................................ 64
References ............................................................................................................................... 66

6
LIST OF TABLES
Table 3.1. The CC results for all transformers ......................................................................... 37
Table 3.2. The SD results for all transformers ......................................................................... 38
Table 3.3. The SSE results for all transformers ....................................................................... 39
Table 3.4. The ASLE results for all transformers .................................................................... 41
Table 3.5. The DABS results for all transformers .................................................................... 42
Table 3.6. The RMSE results for all transformers ................................................................... 43
Table 3.7. The ED results for all transformers ......................................................................... 45
Table 3.8. The CD results for all transformers ......................................................................... 46
Table 3.9. The CSD results for all transformers ...................................................................... 47
Table 3.10. The CCF results for all transformers ..................................................................... 49
Table 11. The MAX results for all transformers ...................................................................... 50
Table 3.12. The MM results for all transformers ..................................................................... 51
Table 3.13. The SSRE results for all transformers ................................................................... 53
Table 3.14. The SSMMRE results for all transformers ............................................................ 54
Table 3.15. The ρ results for all transformers .......................................................................... 56
Table 3.16. The results of current flowing through the rheostat .............................................. 57
Table 3.17. The critical values of SIs for fault detection ......................................................... 58
Table 3.18. The results of CC during 0.005% of nominal current flow through the rheostat .. 61
Table 3.19. The SIs values for yellow border. ......................................................................... 61

7
LIST OF FIGURES Figure 2.1. Experimental setup ................................................................................................ 28
Figure 2.2. End-to-end open circuit FRA measurement. A) Open circuit. B) Partial short
circuit via rheostat. C) Short circuit. ........................................................................................ 29
Figure 2.3. The total impedance at different voltage taps of 1kVA transformer ..................... 31
Figure 3.1. Frequency response of 5 V tap with different resistances. .................................... 33
Figure 3.2. Frequency response of 12 V tap with different resistances ................................... 33
Figure 3.3. Frequency response of 24 V tap with different resistances ................................... 34
Figure 3.4. Frequency response of 36 V tap with different resistances ................................... 34
Figure 3.5. Frequency response of 110 V tap with different resistances ................................. 35
Figure 3.6 Frequency response of 220 V tap with different resistances .................................. 35
Figure 3.7. The criteria zone separation for 1kVA transformer ............................................... 62

8
CHAPTER 1 – INTRODUCTION
The maintenance of transformer in healthy condition is the motivation of
this research. The modern technique to evaluate the transformer condition is FRA.
Thus, to overcome the necessity in trained expert in order to interpret the
frequency response some evaluation criteria should be proposed. Based on the
literature review provided in this chapter it could be concluded that numerical
indices could be used for frequency response interpretation. The objective of this
work is to analyze the FRA results of several transformers under predefined fault,
and based on the results create the criteria for numerical indices, that could be
used during transformer maintenance.
1.1 Motivation and Objectives
One of the most important pieces of equipment in power systems, especially
in the field of transmission, distribution and generation, is the power transformer.
Power transformers operate under various environmental, electrical and
mechanical conditions, which expose them to different hazards during their
operation. Any kind of unexpected transformer failure may lead to electricity
shortages and significant economic losses. For this reason, proper transformer
operation and maintenance are required [1].
One of the main causes of transformer failure is mechanical defects.
Mechanical defects can occur due to short circuit currents, overvoltage,
inappropriate transportation, explosion of combustible gases generated in the

9
transformer oil or natural hazards such as an earthquake [2]. Mechanical defects
include axial and radial winding deformation, hoop buckling, overall bulk
movement, tilting, intermittent internal connections, broken clamping structures,
etc. Approximately 70-80% of all transformer failures are initiated by internal
winding defects [1]-[5]. Transformer aging is the main cause of these types of
failures. Hence, early detection of winding defects helps prevent continuous
degradation of transformers and unexpected failure [3]. Transformers can operate
with slight winding damage, but this damage may eventually worsen, leading to
the total breakdown of the equipment.
A short circuit current, which travels through the transformer winding, can
initiate a winding defect [4]. These large currents can be generated due to a single
line to ground fault, fault of the equipment at the station, turn-to-turn insulation
degradation, etc. and create a large electromagnetic force, consequently damaging
the structure of a winding [6]-[9].
Frequency response analysis (FRA) is a widely used method to evaluate the
mechanical condition of transformer active parts: the winding, core and leads [10],
[11]. The transform frequency response is usually evaluated in the range of 20 Hz
to 2 MHz. To determine the transformer condition, input reference and output
response signals are required. Any variation between the two responses means
that mechanical damage may exist in the equipment. The main challenge of using
the FRA test is to correctly interpret the results and determine the reason for the

10
deviation in the FRA spectra [12]. In many cases, the interpretation of the FRA
results is performed visually. Visual interpretation requires that a trained expert
review the FRA spectra to identify the faults and their tendencies and to carry out
a proper diagnosis [13]. Thus, the FRA interpretation depends on the experience
of the personnel interpreting the FRA data. CIGRE reported that some of the
reports based on FRA interpretation were not clear and that uncertainties existed
in the fault criteria [14]. Another interpretation method includes the calculation of
the transfer function (TF) of the transformer. A TF was obtained with the help of
frequency-partitioned mathematical models, and another TF was calculated from
measured data. Then, the two TFs were compared to predict the fault based on
the differences in the TFs. However, this method has high computational
complexity and uncertainties arising from the use of mathematical models for the
TF calculation, thus, can only identify severe faults [15].
Another method to interpret the FRA spectra is to use numerical or
statistical indicators (SIs). SIs allow the interpretation of the results even by
inexperienced personnel. However, to use SIs for the interpretation of FRA
results, some criteria for fault detection should be obtained. For different fault
types and their severity levels, the SIs have different values. This difference arises
because different faults distinctively affect the frequency response by increasing
the amplitudes of resonances or shifting them horizontally. These changes

11
differentially affect each SI. Therefore, to use SIs, the effect of faults on SI values
should be analyzed and some criteria proposed.
The first standard regarding FRA was issued in China in 2005, DL
911/2004; other international standards were later established by IET and IEEE
[16]-[18]. Statistical indices are used to analyze recorded signals; however, the
criteria for statistical indices are still a research topic [19]-[21].
In this research work, FRA measurements of various distribution
transformers with predetermined transformer faults are conducted, various types
of statistical indices are calculated and analyzed, and two levels of criteria are
suggested for each index. The first level is the critical value, which describes the
healthy condition of the transformer without any fault. The second level is the
boundary value, which indicates that the transformer can still operate but that
some faults are present.
1.2 Literature review
The idea that generated FRA arose from the concept that the transformer is
a gray box [22] and energized by high frequency electromagnetic waves. As FRA
should detect the faults, to observe the fault response, creating predefined faults
is important. For this reason, the modeling of the transformer is important;
however, modeling and simulating the transformer are very challenging tasks. To
address the frequency-dependent elements of the transformer and not increase the
complexity of the model calculation, the complex permeability approximation

12
should be used. Due to the macroscopic observation of the conductors, a sparse
mesh is obtained. Moreover, for the frequency-dependent elements for program
calculation, the rational approximation, passivity enforcement and state space
equations are used. The comparison of the proposed model and real transformer
results showed adequate similarity.
After modeling of the transformer, the next important step is to analyze the
performance of the system. The technique that can confirm the transformer
validity over the frequency range is FRA [23]. The FRA response is usually
presented in a Bode plot and can be analyzed in three different frequency ranges
[24], where the low band corresponds to the core, the midrange to the windings
and the high range to the connections of the equipment. For windings observation,
focusing on the midrange is necessary, where, with the help of traveling wave
theory and multiconductor line theory, the response of the windings can be
analyzed. Mathematical calculations can be used to clarify the resonance points
of the FRA trace; moreover, the trend of the dependency between the inductance
and shunt capacitance has been explored. Real transformers were used to
practically prove the calculations, as well as to practically derive the dependence
of the FRA response on parameters such as the initial voltage distribution
coefficient for windings [25], [26]. The theoretical and practical values agreed
with each other in the analysis.

13
FRA is not the only technique used for transformer maintenance; however,
it is the most recently developed. Different techniques that can be used for
transformer diagnosis were analyzed in [27]. The techniques used to analyze the
mechanical integrity of the transformer were no-load loss and no-load current,
insulation resistance, dielectric dissipation factor, short circuit and vibration
analysis [28], [29]. These techniques were all performed for a real 400 MVA
transformer and practically tested. For the mechanical defects considered, such as
buckling and tilting of windings, the conventional tests could not produce accurate
results when data for only a few parameters were available. If the transformer is
a black box with available output terminals, then the best possible analysis that
can produce accurate results is FRA.
FRA is an off-line technique; however, the ability to move to an on-line
mode is now a topic of research. The benefit that can be obtained from real-time
data analysis of a transformer and accurate and real-time fault diagnosis cannot
be ignored. Therefore, [30] conducted a study to move to an on-line FRA. The
paper discusses different on-line and off-line winding deformation analyses and
proposes a setup for on-line FRA. The main point of the FRA setup was to take
into account the bushing effects [31] of a terminal, as they have a capacitance that
affects the FRA response. Moreover, the power frequency penetration should be
filtered [32]. A practical test of the setup showed adequate results; however, these
results were not identical to those of off-line FRA.

14
FRA can be effectively used to identify a problem with the mechanical
integrity of a transformer. However, as the FRA equipment needs to be connected
to the transformer, the connection is also important. Samimi et al. [33] applied six
different connections for FRA and tried to determine the best terminating resistor
(TR) and measurement impedance (MI) in order to obtain the best sensitivity. All
connections were applied for three different types of deformation, such as radial
and axial, and for disk space variation of the transformer. To compare the obtained
results, SIs such as the correlation coefficient (CC) and Euclidean distance were
used. Moreover, to use them simultaneously, the change ratio was used, which
includes both the CC and ED. The results showed that the capacitive interwinding
connection had the best sensitivity to mechanical defects and that higher TR and
MI values provide better noise reduction but lead to larger amplitudes. A 1 MΩ
resistance provides more sensitivity, but at least a 50 Ω resistor should be used to
eliminate reflections.
FRA is a comparative method and requires a trained expert to interpret the
results. To make FRA more convenient for untrained personnel, scientists have
tried to set some standards that people can rely on, but this research is still in
progress. To help interpret the results, Nirgude et al. [34] tried to set a criteria with
which FRA users could identify faulty transformers. In their studies, they used
three reliable SIs, the CC, standard deviation (SD) and absolute sum of
logarithmic error (ASLE). Numerical methods were applied to the results obtained

15
from a transformer with a predefined axial displacement and to a transformer with
a known radial displacement. Additionally, the transformer of an operating
substation was tested. As the axial displacement of 1% is not in the tolerable range
according to Nirgude, it was used as a reference point, based on which a critical
point was found for the three SIs. People can thus use these critical points, which
are a CC greater than 0.9998, an SD less than 1 and an ASLE less than 0.4, to
identify whether a transformer is healthy. In addition, this approach does not
require special knowledge of FRA interpretation.
A transformer consists of many parts, several of which are active. Each of
them affect the FRA results. Murthy et al. [35] analyzed the effect of the winding
clamping structure on the frequency response. FRA was performed on
transformers with and without a clamping structure, and several numerical
methods were used to identify the difference. The results showed that the
clamping structure affects the response under 2 kHz and that Pearson’s, Kendall’s
and Spearman’s CCs and the cross-correlation coefficient are not sensitive to
small changes in the frequency response of the transformer under 2 kHz caused
by the clamping structure. However, the root mean square error (RMSE) is
sensitive to small changes, as is the hypothesis test (F-test).
Senobari et al. [36] applied FRA to a transformer and showed that FRA is
an effective tool for fault detection. However, they also showed that many
variables could affect the FRA. The connection type and the transformer structure

16
and type affect the FRA trace. A recommended frequency range for FRA was
proposed [37]. Moreover, the FRA interpretation was also problem, so they
proposed numerical methods as a solution. They claimed that different SIs could
be used but that the absolute average difference (DABS) provides more precise
results. The SD turned out to be more robust to different uncertainties. External
factors, such as humidity and temperature, also affect the frequency response. The
problem regarding the CC is that for data with the same shape but different
magnitudes, incorrect results are obtained, and for the SD, a horizontal shift of a
peak has a significant effect, while a large horizontal shift in a valley does not
have a proper effect. Thus, the sum squared max-min ratio error (SSMMRE)
should be used to overcome this problem.
The FRA technique has been used for the past fifteen years [38], and during
this time, several connection methods have been used almost as a standard. Picher
et al. [39] collected all information relevant to FRA and, with the CIGRE, tried to
provide a guide for the connection for FRA, such as an end-to-end open circuit,
an end-to-end short circuit, capacitive interwinding measurement or inductive
interwinding measurement. The FRA interpretation was also described, in which
the low frequency range below 2 kHz corresponds to the core, the frequency from
2 kHz-20 kHz to interactions between windings, the frequency from 20 kHz to 1
MHz to the winding structure and the frequency above 1 MHz to the setup or
connection of the FRA [41]. The appearance of resonances in each frequency

17
range was described. The phenomenon of residual magnetization was described,
based on which it was claimed that due to the residual magnetization of the core,
the results of the fingerprint and obtained data could be different even if no
problem is present. The difference between phases in the transformer was shown,
and the use of the same phases for reference during FRA was proposed. Even if a
sister transformer can be used for the FRA test, a slight difference still exists.
As stated before, the axial displacement of a transformer is one of the main
faults. Thus, to correctly identify this fault in the frequency response, Hashemnia
et al. [40] proposed a 3D finite element model. In this model, the axial
displacement and its effects on the transformer parameters and on the frequency
response were analyzed. The results showed that the finite element model has
better performance when it includes capacitance and inductance variation during
axial displacement, as this helps emulate the axial displacement of the lumped
model of the transformer more correctly. Additionally, the model showed that the
leakage flux increases near the faulty section of the winding and has an
asymmetrical distribution during axial displacement.
Hence, many scientists used SIs to interpret the frequency response, and
Samimi et al. [42] tried to understand their behavior during different faults. A
practical model of a transformer winding with a defined axial displacement, a
defined radial deformation and different interdisk variations was created. These
authors created 11 different cases of major faults and applied SIs to analyze the
18
results. The results showed that the SD and variance have a linear relationship
with mechanical faults. The SSE has a parabolic relationship with mechanical
faults. As the CC seems to produce false results for the situations in which the
response shapes are identical but have different amplitudes, the authors proposed
using the ASLE as the indicator, which overcomes all these issues. Moreover, due
to its linearity and robust to uncertainties, the variance is also recommended as an
SI for the detection of mechanical faults.
Wesley et al. [44] simulated an interturn winding short circuit on a 15 kVA
cast-resin transformer using its taps to change the short circuit percentage. Their
results showed that the ASLE is the most robust SI for FRA interpretation.
Moreover, the ARA and CC exhibit linearity in response to mechanical faults only
in the open circuit test, whereas they are not reliable in short circuit tests.
Samimi et al. [45] provided a review of the usage of numerical methods for
interpretation purposes. The relative factor (Rxy) was shown to be a standard used
by China for fault detection in transformers with the help of FRA. The ASLE
method is the most accurate and tends to have 90% accuracy in fault detection.
Additionally, the system based on neural networks and trained for FRA fault
detection using numerical methods was reported to have an accuracy of 95%. In
the end, the recommendation of numerical method usage was proposed. First, the
extraction of all the values of the indices from the results is required to observe
the linearity and basic trends. The same numbers of samples should be provided

19
for each method, a proper connection scheme for FRA should be selected,
uncertainties in indices should be taken into account if they exist, and more than
one index should be utilized.

20
CHAPTER 2 – METHODOLOGY AND
EXPERIMENTAL SETUP
This chapter provides numerical indices that was chosen out of many
available, based on the literature review and their sensitivity to our results. All
numerical indices were given with formulas and description. The setup for FRA
was shown and clearly descripted. The experiment required predefined fault on
each transformer, thus, the rheostat parallel to transformer winding was
connected. This fault emulated the inter-disk short circuit. With the help of
voltage taps on transformers and variable resistance on rheostat, different fault
values were obtained. Therefore, based on the results, which showed the linear
effect of the resistance on the Frequency Response of the transformers, criteria
identification could be obtained.
2.1 Methodology
In this section, various types of statistical indices, such as the correlation
coefficient (CC), standard deviation (SD), sum squared error (SSE), absolute sum
of logarithmic error (ASLE), absolute difference (DABS), root mean square error
(RMSE), Euclidean distance (ED), complex distance (CD), comparative standard
deviation (CSD), cross-correlation coefficient (CCF), maximum of difference
(MAX), minimum-maximum ratio (MM), sum squared max-min ratio error
(SSMMRE), sum squared ratio error (SSRE) and normalized correlation

21
coefficient (ρ), will be utilized. However, among all of these, the IEEE standard
recommends the CC method for FRA interpretation [1], [5], [46], [47].
For the calculation of all the SIs, X(i) and Y(i) stand for the i-th sample of the
reference and new measured data, respectively.
2.1.1 Euclidean Distance(ED)
The FRA response index was analyzed with the Euclidean distance (ED) in
[47], which is given as
where N is the number of samples in the FRA spectrum. In [47], this statistical
indicator was compared with other indicators: the CC, SSE, and maximum
difference (MAX); the ED had more regular and linear changes due to axial and
radial deformations [46].
2.1.2 Standard Deviation (SD)
In [34], the influence of changes in the moisture level and temperature on
the FRA spectrum was examined. To interpret the results, the CC and SD were
utilized in [33]. After several experiments that were done in [33], these indices
were found to not be sufficiently accurate to distinguish winding deformation
from temperature or moisture content variations. In [47], the axial displacement
of a transformer winding was examined, and the SD was found to be sensitive to
axial displacements. The SD can determine axial displacements of less than 1%.
2
1
N
i
ED X Y Y i X i
(1)

22
Criteria for axial displacements of more than 1% were defined in [42], and this
criterion of 1% was used as suggested in IEC 60076-5 [17]. The SD is given by
(2).
2
1
1
N
iY i X i
SDN
(2)
2.1.3 Absolute Sum of Logarithmic Error (ASLE)
In calculating the ASLE, the recorded spectra are compared on a
logarithmic scale. According to [48], the ASLE is a more pertinent statistical
indicator than the SSE or CC.
10 101
20log 20log N
iY i X i
ASLEN
(3)
2.1.4 Absolute Difference (DABS)
In [44], the DABS was found to be less sensitive to the magnitude variation of
FRA spectra. It is sensitive to new resonant frequencies and to shifts in resonant
frequencies. The DABS will be zero if the response overlays well with the
fingerprint [49].
1
N
iY i X i
DABSN
(4)

23
2.1.5 Root Mean Square Error (RMSE)
The quality of the frequency response approximation can be measured using the
RMSE, which is a rational function with minimal complexity for FRA trace
comparisons [50]:
2
1
1
1
1
N
Ni
i
Y i X iRMSE
NX i
N
(5)
2.1.6 Correlation Coefficient (CC)
The degree of similarity between two frequency responses can be obtained using
the CC [47], [49], [50]-[56]. If responses overlay well, then the result becomes
one; otherwise, it will be zero, thus yielding a result between 0 and 1. This
indicator is the normalization of the covariance; consequently, it is not sensitive
to constant changes between two frequency responses [57].
1
2 2
1 1
N
i
N N
i i
X i Y iCC
X i Y i
(6)
2.1.7 Sum Squared Error (SSE)
The SSE suppresses small errors and magnifies large errors. The SSE result will
be zero if the spectra are similar, and the variations less than one are compressed;
however, differences of greater than one are magnified [46], [48] and [54]. The
SSE result shows the difference between two spectra, and the SSE unnecessarily

24
enlarges or compresses the deviation. Considering the studies by [49] and [58],
the SSE is very sensitive to large differences and not sensitive to differences less
than 1.
2
1
N
iY i X i
SSEN
(7)
2.1.8 Complex Distance (CD)
The phases of the response change due to axial displacements, and transfer
functions are a combination of real and imaginary numbers [43]. The ED
calculates only variations in the magnitude of the frequency responses, and to also
consider phase variations, a new index, the CD, is developed. The CD can
determine phase and magnitude differences between two frequency responses. In
[9], the index was determined to be more accurate and to improve the performance
as it considers phase changes. The CD equation is given in (8).
2
21
NX Y
iX Y
X i cos i Y i cos iCD
X i sin i Y i sin i
(8)
2.1.9 Comparative Standard Deviation (CSD)
The CSD is a modified version of the SD [47]. In the CSD, the variation of each
sample with respect to its mean value is calculated, which is further used to obtain
the comparative deviation. In the interpretation, if the CSD result is 0, then the
two responses match well [47].

25
2
1 1
N
Y XiY i X i
CSDN
(9)
where, X and Y are average values of corresponding vectors.
2.1.10 Cross-correlation coefficient (CCF)
In [6], [55] and [58], for interpretation of transfer functions, the cross-correlation
coefficient (CCF) was used, and in [55] some criteria for CCF values is given.
1
2 2
1 1
( ( ) )( ( ) )
( ) ( )
N
X Yi
N N
X Yi i
X i Y iCCF
X i Y i
(10)
2.1.11 Maximum of Difference (MAX)
The maximum value of the variance between the baseline and new response is
calculated using the maximum difference (MAX) indicator [46], [52], given by
(11).
maxMAX Y i X i (11)
2.1.12 Minimum-Maximum Ratio (MM)
The MM is another statistical indicator that can be used to obtain the level of
similarity between two data sets. According to the study results of [25], the MM
is sensitive to frequency response shape changes caused by response amplitude
changes and shifts in resonant frequencies. The MM results will approach 1 if the
two compared results are similar [52].

26
1
1
min ,
max ,
N
i
N
i
Y i X iMM
Y i X i
(12)
2.1.13 Normalized Correlation Coefficient (ρ)
The normalized CC is used to measure the similarity between two response
progressions. For two frequency responses, the normalized CC is given by (13)
[8].
* *
1
2 2* *
1 1
( ) ( )
( ) ( )
N
i
N N
i i
X i Y i
X i Y i
(13)
where,
*
1
1( ) ( ) ( )
N
i
X i X i X iN
(14)
*
1
1( ) ( ) ( )
N
i
Y i Y i Y iN
(15)
2.1.14 Sum squared ratio error (SSRE)
In [45], [52] and [53] SSRE is used, which is developed to normalize the SSE
and the equation is as follows:
2
1
( )1
( )
N
i
Y i
X iSSRE
N
(16)

27
2.1.15 Sum squared max-min ratio error (SSMMRE)
SSMMRE is the modified version of SSRE used in [52], which is as following:
2
1
max( ( ), ( ))1
min( ( ), ( ))
N
i
Y i X i
Y i X iSSMMRE
N
(17)
2.2 Experimental Setup
To examine different statistical indicators, twelve single-phase and three-phase
distribution transformers were examined. The first single-phase transformer was
a 0.4 kVA, 220/5/12/24/36 V transformer, and the second and third were 0.4 kVA,
230/24 V sister transformers. The fourth single-phase transformer was a 0.63
kVA, 220/5/12/22/42/110/220 V transformer, and the fifth was a 0.63 kVA,
230/230 V transformer. The sixth was a 0.63 kVA, 230/220 V transformer, and
the seventh single-phase transformer was a 0.75 kVA transformer with
230/53/200/400 V secondary windings and a 230/115/230 V tertiary winding.
Finally, the eighth single-phase transformer was a 1 kVA,
230/5/12/24/36/110/220 V transformer. The three-phase transformers included
three 350 VA sister transformers with a 230/400-230 V voltage rating: a 1.2 kVA,
220-24/42 V transformer; a 5 kVA, 230/380-42 V transformer; and 20 kVA and
40 kVA, 10 kV/400 V transformers. All the transformers have different accessible
taps that assisted us in emulating disk-to-disk short circuit faults over the windings
using a rheostat between the taps. According to IEEE Std C57.149-2012 [59], we
used an end-to-end open circuit test for FRA measurements. The end-to-end short

28
circuit and capacitive and inductive connection tests were not performed in this
study. The equipment for FRA measurement was well-established
commercialized equipment, and only the low-voltage windings of the
transformers were examined [33]-[35]. The frequency range was from 20 Hz to 2
MHz, with 975 logarithmically spaced data collection points. The two outputs of
the FRANEO, the source and the reference, were connected together and input
into one end of the winding, whereas the third output, which is the response, was
connected to the other end of the winding. The connections were performed via
50 Ω wires, and the injection of 10 V VP-P was carried out [60]. The rheostat was
connected in parallel to each winding, and at each tap level, the resistance was set
to 15 kΩ, then to 5 kΩ and gradually reduced by 500 Ω to 200 Ω. Finally, it was
shorted (zero Ω) to emulate a real short circuit. Figure 1 shows the connection
setup.
50 Ohm
50 Ohm
50 OhmFRANEO
Laptop
Transformer with voltage
taps
Rheostat
Figure 2.1. Experimental setup

29
The 15kΩ resistance is significant and, for small transformers, could be
considered an open circuit when connected parallel to the winding; see Figure 2.2.
Furthermore, the 5kΩ resistance could also be considered an open circuit or could
pass some short circuit circulating current. The main idea of the experiment was
to find the tolerable resistance of the short circuit. Figure 2.2 shows three
experimental scenarios. In the first, the winding is an open circuit. In the second,
the resistance is not significant, and a short circuit current slightly passes through
the resistor. The last is a complete short circuit via the wire [61].
Vref
Vres
Vref
Vres
Vref
Vres
IscIsc
A B C
Figure 2.2. End-to-end open circuit FRA measurement. A) Open circuit. B) Partial short
circuit via rheostat. C) Short circuit.
2.3 The effect of the rheostat connected in parallel to the transformer winding
As we can see in Figure 2b, during our FRA measurement with the rheostat,
we have the resistance or rheostat parallel to the transformer. Thus, here, the
circuit can be analyzed as a simple circuit with two parallel resistances or

30
impedances. In our case, the rheostat has a significant resistance, and the
transformer has a significant impedance because the DC resistance of the
transformer is small; however, due to the winding, tank and core, we have a very
high impedance. Thus, when we perform the FRA test, our signal chooses the
easiest path or the path of least resistance. Therefore, when the rheostat resistance
is significant in comparison with the parallel impedance of the winding, the signal
will pass through the winding, and when the resistance is equal to or smaller than
the impedance, the signal will split between the two impedances or pass through
the rheostat, respectively. Based on this concept, the significant resistance of the
rheostat applied to a small portion of the winding in parallel, with the help of
voltage taps, should not affect the frequency response, as the entire signal should
bypass the rheostat. Despite the very large resistance, leakage of the signal could
occur; however, its effect should be negligible or in a tolerable range.
The voltage taps of the transformers are used in our experiment in order to
access different percentages of the winding. With the help of FRANEO,
measuring the total impedance of the winding was possible; thus, the behavior
under different resistances could be explained. To show that the voltage taps
provide different winding percentages, which lead to different impedances, Figure
3 is provided below. In the figure, the 1 kVA transformer’s impedance at different
voltage taps is shown. The voltage taps are 5/12/24/36/110/220 V.

31
T
Figure 2.3. The total impedance at different voltage taps of 1kVA transformer
As can be seen, the higher the voltage is, the more winding is used and thus
the higher the impedance. Moreover, the changing impedance value reveals the
dependence of the resistance on the frequency. The majority of the impedance is
contributed by the winding; thus, it is inductive, and at higher frequencies, the
capacitance starts to influence the impedance.

32
CHAPTER 3 – RESULTS AND DISCUSSION
This chapter provides graphs of FR of different voltage taps of the
transformer. At each voltage tap, the effect of different resistance values could be
seen. Moreover, based on the FRA results, the tables with calculated statistical
indices for each transformer under test were provided. Also, the transformers were
energized and current flowing through the rheostat was measured at specific
values. Based on figures, tables and current values two level of criteria for each
index were provided.
3.1 Results of FR with calculated SIs
To visualize the effect of different resistances on different voltage taps, the
frequency responses of the 1 kVA transformer are provided as an example below.
The same data are available for each transformer and were analyzed.

33
Figure43.1. Frequency response of 5 V tap with different resistances.
Figure53.2. Frequency response of 12 V tap with different resistances

34
Figure63.3. Frequency response of 24 V tap with different resistances
Figure73.4. Frequency response of 36 V tap with different resistances

35
Figure83.5. Frequency response of 110 V tap with different resistances
Figure93.6 Frequency response of 220 V tap with different resistances
As shown in Figures 3.1-3.6, the effect of the same resistance is different
for different voltage taps. The smaller the voltage tap level is, the smaller the
resistance needed to affect the frequency response. For example, the effect of 5

36
kΩ on the 220 V tap is already observed. However, for voltage tap levels below
110 V, the response almost matches the fingerprint. This phenomenon is easily
explained by our Figure 3, which shows that the 220 V tap has a 10 kΩ resistance,
which is greater than 5 kΩ, so the signal splits between the two impedances, and
a visible effect on the frequency response appears. The large effect of the rheostat
on higher frequencies above 1 MHz can be explained by the structure of the
rheostat. The rheostat consists of wire that winds in the form of a helix around
carbon pipe. Thus, at high frequencies, it can act as an inductor, and the wire
would also have a series capacitance.

37
Table 3.1. The CC results for all transformers
CC Wind.% 15kΩ 5kΩ 4.5kΩ 4kΩ 3.5kΩ 3kΩ 2.5kΩ 2kΩ 1.5kΩ 1kΩ 500 Ω 200Ω 1Ω
1 phase
400VA
T1 5V 13.89% 0.9998 0.9997 0.9998 0.9997 0.9997 0.9998 0.9999 0.9997 0.9998 0.9999 0.9998 0.9977 0.9045
T1 12V 33.33% 0.9998 0.9997 0.9997 0.9997 0.9998 0.9999 0.9997 0.9998 0.9997 0.9998 0.9997 0.9992 0.8983
T1 24V 66.67% 0.9997 0.9999 0.9999 0.9999 0.9999 0.9999 0.9999 0.9998 0.9998 0.9995 0.9985 0.9939 0.8985
T1 36V 100% 0.9997 0.9989 0.9985 0.9986 0.9989 0.9989 0.9989 0.9989 0.9987 0.9980 0.9949 0.9820 0.9008
T2 24V 100% 0.9999 1.0000 0.9999 0.9997 0.9998 0.9998 0.9999 0.9998 0.9997 0.9995 0.9984 0.9937 0.9385
T3 24V 100% 0.9986 0.9997 0.9999 0.9999 1.0000 0.9999 0.9999 0.9999 0.9998 0.9992 0.9981 0.9941 0.9454
630VA
T4 5V 2.27% 0.9998 0.9998 0.9997 0.9998 0.9997 0.9997 0.9997 0.9997 0.9997 0.9997 0.9997 0.9998 0.9449
T4 12V 5.4% 0.9998 1.0000 0.9999 0.9999 0.9998 0.9999 0.9999 1.0000 0.9999 1.0000 1.0000 0.9999 0.8950
T4 22V 10% 0.9998 1.0000 1.0000 0.9999 1.0000 1.0000 1.0000 1.0000 1.0000 1.0000 0.9998 0.9992 0.8296
T4 42V 19.1% 0.9998 1.0000 1.0000 0.9997 0.9999 0.9999 0.9999 0.9999 0.9998 0.9996 0.9987 0.9953 0.7701
T4 110V 50% 0.9997 0.9993 0.9992 0.9984 0.9988 0.9985 0.9980 0.9973 0.9960 0.9933 0.9856 0.9659 0.7181
T4 220V 100% 0.9989 0.9951 0.9946 0.9936 0.9925 0.9911 0.9891 0.9862 0.9819 0.9726 0.9501 0.9030 0.6842
T5 230V 100% 0.9995 0.9967 0.9962 0.9957 0.9947 0.9936 0.9920 0.9895 0.9856 0.9778 0.9562 0.9079 0.6788
T6 220V 100% 0.9989 0.9954 0.9950 0.9943 0.9932 0.9917 0.9897 0.9869 0.9824 0.9735 0.9509 0.9019 0.6649
750kVA
T7 53V 13.25% 1.0000 1.0000 0.9999 0.9998 0.9999 0.9999 0.9999 0.9998 0.9998 0.9996 0.9990 0.9967 0.8161
T7 200V 50% 0.9994 0.9983 0.9981 0.9976 0.9973 0.9967 0.9959 0.9947 0.9928 0.9893 0.9804 0.9611 0.7005
T7 400V 100% 0.9976 0.9912 0.9903 0.9890 0.9876 0.9858 0.9834 0.9800 0.9748 0.9659 0.9437 0.8947 0.6480
T7 115V 50% 0.9994 0.9996 0.9995 0.9992 0.9992 0.9990 0.9987 0.9982 0.9972 0.9953 0.9893 0.9739 0.7169
T7 230V 100% 0.9990 0.9965 0.9960 0.9952 0.9944 0.9933 0.9917 0.9893 0.9855 0.9783 0.9599 0.9186 0.7051
1kVA
T8 5V 2.27% 0.9997 0.9997 0.9997 0.9998 0.9998 0.9997 0.9997 0.9997 0.9997 0.9997 0.9997 0.9997 0.9433
T8 12V 5.45% 0.9997 1.0000 0.9999 0.9999 0.9999 0.9999 0.9999 0.9999 0.9999 0.9999 0.9999 0.9999 0.8978
T8 24V 10.9% 0.9997 1.0000 1.0000 1.0000 1.0000 1.0000 1.0000 1.0000 1.0000 1.0000 0.9999 0.9996 0.8472
T8 36V 16.36% 0.9997 1.0000 1.0000 0.9999 0.9999 0.9999 0.9999 0.9999 0.9999 0.9997 0.9992 0.9966 0.7446
T8 110V 50% 0.9997 0.9996 0.9995 0.9994 0.9992 0.9990 0.9987 0.9982 0.9972 0.9952 0.9888 0.9716 0.7103
T8 220V 100% 0.9993 0.9964 0.9959 0.9951 0.9942 0.9930 0.9913 0.9889 0.9847 0.9769 0.9566 0.9143 0.7003
3 phase
350VA
T9 230V 57.5% 0.9993 0.9987 0.9984 0.9981 0.9975 0.9973 0.9967 0.9957 0.9940 0.9906 0.9818 0.9610 0.7048
T9 400V 100% 0.9980 0.9925 0.9914 0.9906 0.9885 0.9873 0.9851 0.9816 0.9762 0.9660 0.9409 0.8860 0.6531

38
T9 230V 57.5% 0.9994 0.9982 0.9978 0.9975 0.9966 0.9964 0.9955 0.9943 0.9922 0.9882 0.9782 0.9547 0.7276
T9 400V 100% 0.9976 0.9908 0.9897 0.9891 0.9864 0.9851 0.9826 0.9790 0.9733 0.9623 0.9340 0.8740 0.6224
T9 230V 57.5% 0.9986 0.9984 0.9979 0.9973 0.9970 0.9966 0.9959 0.9948 0.9929 0.9894 0.9805 0.9585 0.7313
T9 400V 100% 0.9971 0.9917 0.9910 0.9899 0.9886 0.9866 0.9842 0.9807 0.9755 0.9649 0.9382 0.8796 0.6217
1.2kVA
T10 24V 57.1% 0.9993 0.9998 0.9998 0.9996 0.9997 0.9999 0.9999 0.9999 0.9999 0.9999 0.9999 0.9995 0.9650
T10 42V 100% 0.9993 0.9997 0.9996 0.9997 0.9998 0.9998 0.9998 0.9998 0.9998 0.9997 0.9993 0.9971 0.9655
5kVA
T11 100% 0.9997 0.9997 0.9998 0.9997 0.9998 0.9997 0.9999 0.9997 0.9998 0.9997 0.9997 0.9996 0.9926
20kVA
T12 100% 0.9998 0.9996 0.9995 0.9994 0.9992 0.9990 0.9985 0.9980 0.9969 0.9942 0.9854 0.9602 0.8029
40kVA
T13 100% 1.0000 0.9998 0.9997 0.9997 0.9996 0.9994 0.9992 0.9987 0.9977 0.9956 0.9869 0.9616 0.8518
Table 3.2. The SD results for all transformers
SD Wind.% 15kΩ 5kΩ 4.5kΩ 4kΩ 3.5kΩ 3kΩ 2.5kΩ 2kΩ 1.5kΩ 1kΩ 500 Ω 200Ω 1Ω
400VA
T1 5V 13.89% 1.9155 1.0909 1.2691 1.3889 1.2881 1.2656 1.2555 1.2389 1.2299 1.2231 1.2013 1.1510 7.3829
T1 12V 33.33% 1.5758 0.4347 0.4793 0.7436 0.5391 0.5172 0.5368 0.5693 0.5319 0.5522 0.5710 0.8413 7.9023
T1 24V 66.67% 1.7833 0.2358 0.2296 0.2329 0.2280 0.2688 0.3117 0.3658 0.4546 0.6295 1.1410 2.3066 8.0404
T1 36V 100% 1.8683 0.8045 0.9343 0.9120 0.8123 0.8457 0.8411 0.8725 0.9869 1.2890 2.1480 3.9604 8.1097
T2 24V 100% 1.0823 0.1486 0.2086 0.4132 0.3278 0.2893 0.2919 0.3269 0.4029 0.5467 0.9656 1.8679 5.5971
T3 24V 100% 0.9851 0.4013 0.2717 0.2805 0.1922 0.2057 0.2505 0.2996 0.3884 0.6904 1.0527 1.9316 5.7617
630VA
T4 5V 2.27% 1.5073 0.7353 0.8873 1.1266 1.0060 0.9403 0.9158 0.9182 0.9048 0.8908 0.8558 0.8155 13.4734
T4 12V 5.4% 0.9671 0.3009 0.4230 0.5836 0.6496 0.4962 0.4501 0.3779 0.4509 0.3938 0.3836 0.6671 17.6099
T4 22V 10% 0.6896 0.1531 0.1366 0.3957 0.1683 0.1744 0.1850 0.2282 0.2991 0.4425 0.8402 1.8462 21.5171
T4 42V 19.1% 0.8053 0.3275 0.3729 0.9581 0.5517 0.5625 0.6409 0.7823 0.9997 1.4217 2.4926 4.7789 24.3227
T4 110V 50% 1.1296 1.8060 1.9885 2.4665 2.4545 2.7461 3.1473 3.6806 4.5252 5.8298 8.6453 12.9662 26.5184
T4 220V 100% 2.3753 5.0946 5.4639 5.8977 6.3711 6.9895 7.7259 8.6937 10.0027 12.1303 15.7323 20.2274 27.9812
T5 230V 100% 1.5439 3.7722 4.0824 4.4456 4.8607 5.3891 6.0282 6.8715 8.0927 9.9603 13.3872 17.7117 25.4741
T6 220V 100% 2.7133 5.5370 5.9250 6.3823 6.8924 7.5535 8.4145 9.4550 10.9157 13.0983 16.8719 21.4771 29.4361
750kVA
T7 53V 13.25% 1.2284 0.3756 0.4701 0.7068 0.6220 0.6554 0.6875 0.7636 0.9066 1.2005 2.0247 3.8615 23.6702
T7 200V 50% 1.4821 2.6520 2.8759 3.1717 3.4525 3.8331 4.3066 4.9697 5.8976 7.3439 10.3054 14.6924 28.0370
T7 400V 100% 3.3147 6.5141 6.9078 7.3847 7.9138 8.5458 9.3296 10.3398 11.7478 13.7327 17.3651 21.8443 29.6568

39
T7 115V 50% 1.2613 1.0876 1.2149 1.4007 1.5155 1.6876 1.9395 2.2892 2.8397 3.7443 5.7848 9.1918 22.0984
T7 230V 100% 1.7778 3.2189 3.4703 3.7817 4.1122 4.5449 5.0851 5.8148 6.8071 8.4061 11.3634 15.3106 22.7032
1kVA
T8 5V 2.27% 1.6915 0.8001 0.9311 1.1314 1.0566 1.0270 0.9972 0.9969 0.9751 1.0096 0.9144 0.8958 12.1836
T8 12V 5.45% 0.8505 0.2705 0.3190 0.3866 0.3533 0.3341 0.3278 0.3217 0.3219 0.3262 0.3487 0.4691 15.3249
T8 24V 10.9% 0.8041 0.1589 0.2105 0.2621 0.2242 0.2067 0.2077 0.2158 0.2558 0.3167 0.5532 1.2126 18.2617
T8 36V 16.36% 0.8223 0.2705 0.3289 0.3905 0.3872 0.4085 0.4548 0.5337 0.6720 0.9466 1.7182 3.6340 22.5608
T8 110V 50% 0.9392 1.2121 1.3353 1.4864 1.6541 1.8647 2.1586 2.5938 3.2208 4.2863 6.6567 10.5490 23.8395
T8 220V 100% 1.7207 3.6678 3.9533 4.3025 4.7056 5.2044 5.8340 6.6358 7.8225 9.5934 12.9520 17.2109 24.6815
3 phase
350VA
T9 230V 57.5% 1.3588 2.0661 2.2899 2.5262 2.8270 3.0376 3.4139 3.9480 4.7573 6.0289 8.6177 12.5667 25.3161
T9 400V 100% 2.6345 5.3258 5.7085 6.1028 6.6009 7.1175 7.7878 8.6939 9.9266 11.7935 15.0269 19.1271 26.5609
T9 230V 57.5% 1.6583 3.3274 3.6302 3.9560 4.4189 4.7753 5.3703 6.1249 7.2640 9.0559 12.3979 17.1420 29.8035
T9 400V 100% 4.0382 8.0685 8.5223 9.0781 9.7669 10.4703 11.4089 12.5345 14.0434 16.3493 20.3257 25.0254 33.0743
T9 230V 57.5% 2.4682 3.2512 3.8008 4.2478 4.5161 4.8808 5.4448 6.2144 7.3297 9.0691 12.3490 17.1627 29.6813
T9 400V 100% 4.4731 8.0612 8.5321 9.1646 9.7741 10.4900 11.3559 12.5368 14.1339 16.3897 20.3054 25.0108 32.9953
1.2kVA
T10 24V 57.1% 0.6415 0.2872 0.3602 0.4427 0.4029 0.2827 0.2552 0.2379 0.2259 0.2275 0.2926 0.5453 4.1345
T10 42V 100% 0.6850 0.3784 0.4741 0.4539 0.3697 0.3571 0.3516 0.3689 0.3872 0.4755 0.6798 1.2844 4.1964
5kVA
T11 100% 1.0015 0.4527 0.5743 0.6792 0.6299 0.5799 0.6146 0.5222 0.4724 0.4434 0.4445 0.5237 1.7993
20kVA
T12 100% 0.4422 0.5629 0.7873 0.8604 0.9538 1.0757 1.2210 1.5135 1.7866 2.2320 3.0274 4.7851 7.6503
40kVA
T13 100% 0.1256 0.4326 0.4811 0.5329 0.6054 0.7047 0.8354 1.0373 1.3644 1.8979 3.2081 5.4009 10.5056
Table 3.3. The SSE results for all transformers
SSE Wind.% 15kΩ 5kΩ 4.5kΩ 4kΩ 3.5kΩ 3kΩ 2.5kΩ 2kΩ 1.5kΩ 1kΩ 500 Ω 200Ω 1Ω
400VA
T1 5V 13.89% 3.6654 1.1887 1.6090 1.9271 1.6574 1.6002 1.5748 1.5334 1.5110 1.4946 1.4417 1.3234 54.4520
T1 12V 33.33% 2.4806 0.1888 0.2295 0.5524 0.2903 0.2672 0.2878 0.3238 0.2826 0.3046 0.3257 0.7070 62.3822
T1 24V 66.67% 3.1767 0.0556 0.0527 0.0542 0.0519 0.0722 0.0970 0.1337 0.2064 0.3958 1.3006 5.3148 64.5812
T1 36V 100% 3.4868 0.6466 0.8721 0.8309 0.6591 0.7145 0.7066 0.7605 0.9729 1.6597 4.6094 15.6687 65.6998
T2 24V 100% 1.1702 0.0221 0.0434 0.1705 0.1073 0.0836 0.0851 0.1068 0.1622 0.2985 0.9315 3.4856 31.2951
T3 24V 100% 0.9693 0.1609 0.0738 0.0786 0.0369 0.0423 0.0627 0.0896 0.1507 0.4761 1.1070 3.7271 33.1633

40
630VA
T4 5V 2.27% 2.270 0.540 0.787 1.268 1.011 0.883 0.838 0.842 0.818 0.793 0.732 0.664 181.346
T4 12V 5.4% 0.934 0.090 0.179 0.340 0.422 0.246 0.202 0.143 0.203 0.155 0.147 0.445 309.791
T4 22V 10% 0.475 0.023 0.019 0.157 0.028 0.030 0.034 0.052 0.089 0.196 0.705 3.405 462.512
T4 42V 19.1% 0.648 0.107 0.139 0.917 0.304 0.316 0.410 0.611 0.998 2.019 6.207 22.814 590.987
T4 110V 50% 1.275 3.258 3.950 6.077 6.019 7.533 9.895 13.533 20.457 33.952 74.665 167.950 702.502
T4 220V 100% 5.636 25.928 29.824 34.747 40.550 48.803 59.629 75.502 99.951 146.995 247.252 408.727 782.144
T5 230V 100% 2.381 14.215 16.649 19.743 23.602 29.013 36.301 47.169 65.425 99.106 179.033 313.382 648.263
T6 220V 100% 7.354 30.627 35.070 40.692 47.456 56.997 70.731 89.305 119.029 171.390 284.370 460.791 865.598
750kVA
T7 53V 13.25% 1.5073 0.1409 0.2208 0.4991 0.3865 0.4292 0.4722 0.5824 0.8211 1.4398 4.0951 14.8961 559.7025
T7 200V 50% 2.1943 7.0257 8.2622 10.0496 11.9072 14.6774 18.5277 24.6721 34.7454 53.8769 106.0923 215.6455 785.2688
T7 400V 100% 10.976 42.390 47.669 54.479 62.565 72.957 86.952 106.802 137.868 188.395 301.236 476.684 878.625
T7 115V 50% 1.589 1.182 1.475 1.960 2.294 2.845 3.758 5.235 8.056 14.006 33.430 84.403 487.838
T7 230V 100% 3.157 10.351 12.031 14.287 16.893 20.635 25.832 33.778 46.290 70.590 128.995 234.173 514.905
1kVA
T8 5V 2.27% 2.8581 0.6395 0.8661 1.2788 1.1153 1.0536 0.9933 0.9928 0.9499 1.0183 0.8352 0.8017 148.2868
T8 12V 5.45% 0.7227 0.0731 0.1017 0.1493 0.1247 0.1115 0.1073 0.1034 0.1035 0.1063 0.1215 0.2198 234.6104
T8 24V 10.9% 0.6460 0.0252 0.0443 0.0686 0.0502 0.0427 0.0431 0.0465 0.0654 0.1002 0.3057 1.4690 333.1492
T8 36V 16.36% 0.6755 0.0731 0.1081 0.1524 0.1498 0.1667 0.2067 0.2845 0.4511 0.8951 2.9491 13.1923 508.4678
T8 110V 50% 0.8813 1.4678 1.7812 2.2072 2.7333 3.4736 4.6549 6.7210 10.3632 18.3531 44.2657 111.1672 567.7382
T8 220V 100% 2.9578 13.4389 15.6128 18.4925 22.1199 27.0582 34.0006 43.9883 61.1280 91.9388 167.5825 295.9126 608.5494
3 phase
350VA
T9 230V 57.5% 1.8443 4.2643 5.2384 6.3751 7.9837 9.2173 11.6431 15.5707 22.6089 36.3103 74.1889 157.7593 640.2470
T9 400V 100% 6.9333 28.335 32.554 37.207 43.527 50.608 60.587 75.506 98.437 138.94 225.58 365.47 704.76
T9 230V 57.5% 2.7472 11.060 13.165 15.634 19.507 22.780 28.810 37.476 52.712 81.93 153.55 293.55 887.34
T9 400V 100% 16.2902 65.035 72.556 82.328 95.294 109.514 130.030 156.953 197.016 267.02 412.71 625.63 1092.80
T9 230V 57.5% 6.0858 10.559 14.431 18.025 20.374 23.798 29.615 38.580 53.670 82.16 152.34 294.26 880.07
T9 400V 100% 19.9884 64.917 72.722 83.903 95.434 109.927 128.824 157.011 199.563 268.35 411.89 624.90 1087.60
1.2kVA
T10 24V 57.1% 0.4111 0.0824 0.1296 0.1958 0.1622 0.0799 0.0651 0.0565 0.0510 0.0517 0.0855 0.2971 17.076
T10 42V 100% 0.4687 0.1431 0.2245 0.2059 0.1365 0.1274 0.1235 0.1359 0.1498 0.2259 0.4617 1.6481 17.592
5kVA
T11 100% 1.0020 0.2047 0.3295 0.4609 0.3964 0.3359 0.3773 0.2724 0.2229 0.1964 0.1974 0.2740 3.234
20kVA
T12 100% 0.1953 0.6191 0.7395 0.9089 1.1559 1.4893 2.2883 3.1886 4.9768 9.1559 22.8740 58.4675 207.7306

41
40kVA
T13 100% 0.0158 0.1869 0.2313 0.2836 0.3661 0.4960 0.6971 1.0749 1.8598 3.5984 10.2812 29.1399 110.254
Table 3.4. The ASLE results for all transformers
ASLE Wind.% 15kΩ 5kΩ 4.5kΩ 4kΩ 3.5kΩ 3kΩ 2.5kΩ 2kΩ 1.5kΩ 1kΩ 500 Ω 200Ω 1Ω
400VA
T1 5V 13.89% 0.301 0.061 0.065 0.068 0.063 0.061 0.061 0.061 0.061 0.063 0.068 0.083 3.621
T1 12V 33.33% 0.283 0.034 0.036 0.047 0.041 0.041 0.045 0.049 0.053 0.065 0.098 0.194 4.263
T1 24V 66.67% 0.292 0.040 0.042 0.044 0.048 0.056 0.065 0.079 0.101 0.145 0.275 0.616 4.389
T1 36V 100% 0.3005 0.1035 0.1142 0.1179 0.1236 0.1384 0.1567 0.1836 0.2285 0.3206 0.5772 1.2323 4.4734
T2 24V 100% 0.2889 0.0535 0.0637 0.0796 0.0845 0.0915 0.1046 0.1255 0.1614 0.2284 0.4209 0.8805 4.1995
T3 24V 100% 0.0674 0.0652 0.0677 0.0760 0.0779 0.0888 0.1052 0.1273 0.1645 0.2454 0.4349 0.9050 4.2322
630VA
T4 5V 2.27% 0.1031 0.0580 0.0660 0.0750 0.0695 0.0658 0.0644 0.0644 0.0642 0.0635 0.0643 0.0674 3.0013
T4 12V 5.4% 0.0596 0.0276 0.0344 0.0396 0.0444 0.0353 0.0335 0.0307 0.0365 0.0367 0.0453 0.0803 4.7915
T4 22V 10% 0.0428 0.0183 0.0192 0.0290 0.0198 0.0208 0.0224 0.0255 0.0329 0.0470 0.0900 0.2103 6.8151
T4 42V 19.1% 0.0555 0.0419 0.0482 0.0639 0.0656 0.0664 0.0737 0.0888 0.1127 0.1584 0.2949 0.6477 8.6011
T4 110V 50% 0.1180 0.2122 0.2396 0.2787 0.3021 0.3418 0.4009 0.4817 0.6250 0.8652 1.4965 2.7445 10.6113
T4 220V 100% 0.3092 0.7314 0.8031 0.8960 0.9872 1.1260 1.2929 1.5354 1.8934 2.5348 3.8352 5.9227 12.2967
T5 230V 100% 0.2282 0.5891 0.6487 0.7179 0.8077 0.9242 1.0732 1.2840 1.6100 2.1721 3.4068 5.4073 11.7042
T6 220V 100% 0.4176 0.8720 0.9596 1.0616 1.1644 1.3033 1.5008 1.7547 2.1453 2.7889 4.1333 6.2260 12.5597
750kVA
T7 53V 13.25% 0.1254 0.0309 0.0364 0.0476 0.0459 0.0491 0.0524 0.0591 0.0712 0.0953 0.1680 0.3747 6.4439
T7 200V 50% 0.1777 0.2415 0.2677 0.3046 0.3379 0.3843 0.4474 0.5415 0.6870 0.9427 1.5828 2.8264 10.0690
T7 400V 100% 0.3823 0.7667 0.8401 0.9346 1.0332 1.1589 1.3271 1.5617 1.9233 2.5068 3.8310 5.9680 12.4449
T7 115V 50% 0.1575 0.1095 0.1251 0.1458 0.1599 0.1797 0.2113 0.2568 0.3353 0.4814 0.8865 1.8144 9.8277
T7 230V 100% 0.2457 0.3943 0.4387 0.4962 0.5533 0.6331 0.7411 0.8995 1.1396 1.5854 2.6200 4.4965 10.7810
1kVA
T8 5V 2.27% 0.236 0.044 0.049 0.056 0.054 0.053 0.052 0.052 0.051 0.053 0.051 0.054 3.057
T8 12V 5.45% 0.181 0.027 0.030 0.034 0.032 0.031 0.031 0.031 0.032 0.035 0.042 0.065 4.564
T8 24V 10.9% 0.177 0.018 0.022 0.025 0.023 0.023 0.024 0.026 0.031 0.040 0.070 0.154 6.226
T8 36V 16.36% 0.177 0.037 0.043 0.048 0.049 0.053 0.059 0.069 0.086 0.122 0.226 0.532 9.072
T8 110V 50% 0.204 0.158 0.175 0.196 0.218 0.246 0.289 0.356 0.459 0.654 1.170 2.279 10.432
T8 220V 100% 0.324 0.536 0.589 0.657 0.734 0.834 0.970 1.156 1.459 1.976 3.176 5.192 11.516
3 phase
350VA

42
T9 230V 57.5% 0.1020 0.1730 0.1984 0.2264 0.2539 0.2812 0.3248 0.3973 0.5153 0.7266 1.2536 2.3194 9.474
T9 400V 100% 0.2555 0.6158 0.6856 0.7579 0.8443 0.9473 1.0831 1.2824 1.5826 2.0955 3.1752 4.9813 10.930
T9 230V 57.5% 0.1749 0.3605 0.4043 0.4495 0.5027 0.5588 0.6493 0.7656 0.9569 1.2892 2.0253 3.3092 9.341
T9 400V 100% 0.4857 1.1279 1.2197 1.3430 1.4834 1.6419 1.8594 2.1377 2.5410 3.2297 4.6400 6.7619 13.145
T9 230V 57.5% 0.2377 0.3651 0.4547 0.5148 0.5504 0.6031 0.6884 0.8120 1.0030 1.3324 2.0556 3.3635 9.294
T9 400V 100% 0.5495 1.1520 1.2560 1.3933 1.5229 1.6734 1.8713 2.1649 2.6033 3.2713 4.6552 6.7727 13.061
1.2kVA
T10 24V 57.1% 0.0631 0.0365 0.0419 0.0490 0.0488 0.0391 0.0386 0.0408 0.0444 0.0552 0.0913 0.1928 2.708
T10 42V 100% 0.0710 0.0542 0.0629 0.0646 0.0637 0.0659 0.0715 0.0822 0.0976 0.1353 0.2276 0.4769 2.777
5kVA
T11 100% 0.0907 0.0467 0.0569 0.0619 0.0613 0.0572 0.0620 0.0564 0.0584 0.0654 0.0939 0.1694 1.256
20kVA
T12 100% 0.0858 0.1642 0.1826 0.1999 0.2318 0.2705 0.4075 0.4784 0.6125 0.8685 1.5419 2.9579 9.172
40kVA
T13 100% 0.0307 0.1010 0.1148 0.1279 0.1432 0.1663 0.1994 0.2509 0.3352 0.4798 0.8784 1.7367 6.386
Table 3.5. The DABS results for all transformers
DABS Wind.% 15kΩ 5kΩ 4.5kΩ 4kΩ 3.5kΩ 3kΩ 2.5kΩ 2kΩ 1.5kΩ 1kΩ 500 Ω 200Ω 1Ω
400VA
T1 5V 13.89% 0.6280 0.2293 0.2502 0.2619 0.2441 0.2390 0.2369 0.2345 0.2345 0.2377 0.2470 0.2759 4.8870
T1 12V 33.33% 0.5736 0.1161 0.1251 0.1703 0.1393 0.1388 0.1470 0.1602 0.1643 0.1905 0.2565 0.4501 5.3124
T1 24V 66.67% 0.6051 0.1037 0.1063 0.1089 0.1140 0.1332 0.1544 0.1825 0.2295 0.3190 0.5908 1.2599 5.4784
T1 36V 100% 0.6349 0.2986 0.3319 0.3302 0.3282 0.3599 0.3920 0.4408 0.5260 0.7047 1.1902 2.3275 5.5998
T2 24V 100% 0.4476 0.0928 0.1141 0.1569 0.1551 0.1593 0.1749 0.2042 0.2567 0.3522 0.6220 1.2245 4.3398
T3 24V 100% 0.2294 0.1429 0.1294 0.1448 0.1257 0.1386 0.1677 0.1982 0.2528 0.4067 0.6739 1.2854 4.3946
630VA
T4 5V 2.27% 0.4150 0.2234 0.2577 0.3000 0.2740 0.2588 0.2535 0.2539 0.2536 0.2530 0.2590 0.2794 9.8658
T4 12V 5.4% 0.2459 0.1065 0.1362 0.1620 0.1807 0.1454 0.1388 0.1285 0.1554 0.1614 0.2104 0.3917 13.2379
T4 22V 10% 0.1767 0.0820 0.0834 0.1325 0.0920 0.0990 0.1069 0.1263 0.1647 0.2378 0.4564 1.0357 16.8557
T4 42V 19.1% 0.2383 0.1964 0.2269 0.3129 0.3122 0.3234 0.3644 0.4422 0.5651 0.7962 1.4389 2.9666 19.4608
T4 110V 50% 0.5493 1.0447 1.1725 1.3676 1.4658 1.6473 1.9112 2.2649 2.8690 3.8281 6.1194 9.9553 22.4322
T4 220V 100% 1.4501 3.2995 3.5913 3.9527 4.2965 4.8159 5.4149 6.2536 7.4337 9.3707 12.7978 17.1467 24.3385
T5 230V 100% 0.9783 2.4586 2.6864 2.9380 3.2674 3.6768 4.1917 4.8905 5.9207 7.5661 10.7425 14.8505 21.9115
T6 220V 100% 1.8889 3.9243 4.2743 4.6735 5.0692 5.5937 6.3161 7.2081 8.5088 10.4854 14.0649 18.4375 25.5776
750kVA
T7 53V 13.25% 0.3851 0.1471 0.1721 0.2183 0.2177 0.2376 0.2614 0.3030 0.3759 0.5161 0.9218 1.9644 17.9490

43
T7 200V 50% 0.6915 1.2846 1.4139 1.5890 1.7540 1.9808 2.2787 2.7110 3.3516 4.4126 6.7933 10.6565 22.5893
T7 400V 100% 1.8046 3.7217 4.0249 4.4047 4.7966 5.2812 5.9069 6.7406 7.9492 9.7282 13.1885 17.5729 25.0576
T7 115V 50% 0.5284 0.4955 0.5610 0.6465 0.7094 0.7958 0.9292 1.1177 1.4311 1.9864 3.3885 6.1082 18.1382
T7 230V 100% 0.9421 1.6564 1.8238 2.0369 2.2439 2.5270 2.8989 3.4242 4.1798 5.4771 8.0828 11.8344 19.0058
1kVA
T8 5V 2.27% 0.7294 0.1584 0.1781 0.2048 0.1931 0.1882 0.1836 0.1838 0.1813 0.1894 0.1846 0.2037 9.0657
T8 12V 5.45% 0.5344 0.0884 0.1000 0.1150 0.1101 0.1053 0.1067 0.1085 0.1131 0.1269 0.1633 0.2684 11.4946
T8 24V 10.9% 0.5138 0.0679 0.0816 0.0951 0.0902 0.0902 0.0967 0.1082 0.1337 0.1757 0.3132 0.6858 14.1035
T8 36V 16.36% 0.5248 0.1507 0.1752 0.1987 0.2075 0.2256 0.2550 0.3024 0.3828 0.5411 0.9946 2.2280 18.5204
T8 110V 50% 0.6770 0.6996 0.7740 0.8651 0.9603 1.0829 1.2631 1.5383 1.9491 2.6894 4.4845 7.7862 20.3332
T8 220V 100% 1.2378 2.2523 2.4551 2.7095 2.9934 3.3565 3.8312 4.4591 5.4262 6.9533 10.0429 14.1643 21.3515
3 phase
350VA
T9 230V 57.5% 0.5142 0.9001 1.0310 1.1679 1.3067 1.4251 1.6222 1.9456 2.4494 3.3007 5.2048 8.4217 19.710
T9 400V 100% 1.2789 2.8609 3.1579 3.4435 3.7869 4.1545 4.6369 5.3221 6.3008 7.8334 10.6070 14.2458 20.720
T9 230V 57.5% 0.9285 1.9736 2.2021 2.4290 2.7077 2.9720 3.4061 3.9433 4.7976 6.1959 8.9911 13.1024 23.635
T9 400V 100% 2.5588 5.5091 5.9013 6.4045 6.9828 7.5786 8.3811 9.3689 10.7237 12.8528 16.6136 21.0461 28.167
T9 230V 57.5% 1.1625 1.9673 2.3871 2.6682 2.8620 3.1293 3.5440 4.1200 4.9738 6.3603 9.1070 13.2996 23.572
T9 400V 100% 2.8308 5.5933 6.0274 6.5861 7.0978 7.6766 8.4112 9.4561 10.9335 12.9776 16.6586 21.0940 28.071
1.2kVA
T10 24V 57.1% 0.1968 0.1026 0.1204 0.1434 0.1373 0.1024 0.0955 0.0943 0.0965 0.1093 0.1606 0.3024 2.692
T10 42V 100% 0.2176 0.1399 0.1623 0.1673 0.1540 0.1501 0.1548 0.1693 0.1884 0.2459 0.3626 0.6935 2.779
5kVA
T11 100% 0.2883 0.1404 0.1744 0.1933 0.1846 0.1663 0.1773 0.1530 0.1447 0.1478 0.1783 0.2583 1.063
20kVA
T12 100% 0.2545 0.4616 0.5112 0.5581 0.6396 0.7377 1.0571 1.2380 1.5567 2.1448 3.5520 6.0422 12.401
40kVA
T13 100% 0.0743 0.2439 0.2743 0.3046 0.3420 0.3958 0.4700 0.5865 0.7745 1.0877 1.8997 3.4207 8.130
Table 3.6. The RMSE results for all transformers
RMSE Wind.% 15kΩ 5kΩ 4.5kΩ 4kΩ 3.5kΩ 3kΩ 2.5kΩ 2kΩ 1.5kΩ 1kΩ 500 Ω 200Ω 1Ω
400VA
T1 5V 13.89% 0.1282 0.0730 0.0850 0.0930 0.0862 0.0847 0.0840 0.0829 0.0823 0.0819 0.0804 0.0770 0.4942
T1 12V 33.33% 0.1051 0.0290 0.0320 0.0496 0.0359 0.0345 0.0358 0.0380 0.0355 0.0368 0.0381 0.0561 0.5269
T1 24V 66.67% 0.1191 0.0157 0.0153 0.0156 0.0152 0.0179 0.0208 0.0244 0.0304 0.0420 0.0762 0.1540 0.5370
T1 36V 100% 0.1245 0.0536 0.0623 0.0608 0.0541 0.0564 0.0560 0.0581 0.0658 0.0859 0.1431 0.2639 0.5404

44
T2 24V 100% 0.0815 0.0112 0.0157 0.0311 0.0247 0.0218 0.0220 0.0246 0.0303 0.0412 0.0727 0.1407 0.4215
T3 24V 100% 0.0675 0.0275 0.0186 0.0192 0.0132 0.0141 0.0172 0.0205 0.0266 0.0473 0.0721 0.1323 0.3947
630VA
T4 5V 2.27% 0.0439 0.0214 0.0258 0.0328 0.0293 0.0274 0.0266 0.0267 0.0263 0.0259 0.0249 0.0237 0.3921
T4 12V 5.4% 0.0282 0.0088 0.0124 0.0170 0.0190 0.0145 0.0131 0.0110 0.0132 0.0115 0.0112 0.0195 0.5143
T4 22V 10% 0.0202 0.0045 0.0040 0.0116 0.0049 0.0051 0.0054 0.0067 0.0088 0.0129 0.0246 0.0540 0.6296
T4 42V 19.1% 0.0235 0.0096 0.0109 0.0280 0.0161 0.0164 0.0187 0.0228 0.0292 0.0415 0.0728 0.1396 0.7104
T4 110V 50% 0.0329 0.0527 0.0580 0.0719 0.0716 0.0801 0.0918 0.1073 0.1320 0.1700 0.2521 0.3781 0.7734
T4 220V 100% 0.0693 0.1487 0.1595 0.1722 0.1860 0.2040 0.2255 0.2538 0.2920 0.3541 0.4592 0.5905 0.8168
T5 230V 100% 0.0490 0.1198 0.1296 0.1412 0.1543 0.1711 0.1914 0.2182 0.2570 0.3163 0.4251 0.5624 0.8088
T6 220V 100% 0.0760 0.1550 0.1659 0.1787 0.1929 0.2114 0.2356 0.2647 0.3056 0.3667 0.4723 0.6012 0.8240
750kVA
T7 53V 13.25% 0.0364 0.0111 0.0139 0.0210 0.0184 0.0194 0.0204 0.0226 0.0269 0.0356 0.0600 0.1145 0.7019
T7 200V 50% 0.0439 0.0786 0.0852 0.0940 0.1023 0.1136 0.1276 0.1473 0.1748 0.2177 0.3054 0.4355 0.8310
T7 400V 100% 0.0984 0.1933 0.2050 0.2192 0.2349 0.2536 0.2769 0.3069 0.3487 0.4076 0.5154 0.6483 0.8802
T7 115V 50% 0.0453 0.0390 0.0436 0.0503 0.0544 0.0606 0.0696 0.0822 0.1019 0.1344 0.2077 0.3300 0.7933
T7 230V 100% 0.0638 0.1156 0.1246 0.1358 0.1476 0.1632 0.1826 0.2088 0.2444 0.3018 0.4080 0.5497 0.8151
1kVA
T8 5V 2.27% 0.0554 0.0262 0.0305 0.0371 0.0346 0.0337 0.0327 0.0327 0.0320 0.0331 0.0300 0.0294 0.3992
T8 12V 5.45% 0.0282 0.0090 0.0106 0.0128 0.0117 0.0111 0.0109 0.0107 0.0107 0.0108 0.0116 0.0156 0.5082
T8 24V 10.9% 0.0267 0.0053 0.0070 0.0087 0.0074 0.0069 0.0069 0.0072 0.0085 0.0105 0.0183 0.0402 0.6057
T8 36V 16.36% 0.0273 0.0090 0.0109 0.0130 0.0128 0.0136 0.0151 0.0177 0.0223 0.0314 0.0570 0.1206 0.7485
T8 110V 50% 0.0312 0.0402 0.0443 0.0493 0.0549 0.0619 0.0716 0.0860 0.1068 0.1422 0.2208 0.3499 0.7908
T8 220V 100% 0.0571 0.1218 0.1313 0.1429 0.1563 0.1728 0.1938 0.2204 0.2598 0.3186 0.4302 0.5716 0.8197
3 phase
350VA
T9 230V 57.5% 0.0438 0.0665 0.0737 0.0813 0.0910 0.0978 0.1099 0.1271 0.1532 0.1941 0.2775 0.4046 0.8152
T9 400V 100% 0.0847 0.1713 0.1836 0.1963 0.2123 0.2290 0.2505 0.2797 0.3193 0.3794 0.4834 0.6153 0.8549
T9 230V 57.5% 0.0434 0.0870 0.0949 0.1035 0.1156 0.1249 0.1405 0.1602 0.1900 0.2368 0.3243 0.4483 0.7807
T9 400V 100% 0.1055 0.2109 0.2227 0.2372 0.2552 0.2736 0.2982 0.3276 0.3670 0.4273 0.5312 0.6540 0.8645
T9 230V 57.5% 0.0645 0.0849 0.0993 0.1110 0.1180 0.1275 0.1422 0.1623 0.1915 0.2369 0.3226 0.4483 0.7753
T9 400V 100% 0.1169 0.2107 0.2230 0.2396 0.2555 0.2742 0.2968 0.3277 0.3695 0.4284 0.5308 0.6538 0.8625
1.2kVA
T10 24V 57.1% 0.0486 0.0218 0.0273 0.0335 0.0305 0.0214 0.0193 0.0180 0.0171 0.0172 0.0222 0.0413 0.3133
T10 42V 100% 0.0519 0.0287 0.0359 0.0344 0.0280 0.0271 0.0266 0.0280 0.0293 0.0360 0.0515 0.0973 0.3180
5kVA
T11 100% 0.0865 0.0391 0.0496 0.0586 0.0544 0.0501 0.0531 0.0451 0.0408 0.0383 0.0384 0.0452 0.1553

45
20kVA
T12 100% 0.0217 0.0386 0.0422 0.0468 0.0528 0.0599 0.0743 0.0877 0.1095 0.1486 0.2348 0.3755 0.708
40kVA
T13 100% 0.0080 0.0276 0.0307 0.0340 0.0386 0.0450 0.0533 0.0662 0.0871 0.1211 0.2048 0.3447 0.6706
Table 3.7. The ED results for all transformers
ED Wind.% 15kΩ 5kΩ 4.5kΩ 4kΩ 3.5kΩ 3kΩ 2.5kΩ 2kΩ 1.5kΩ 1kΩ 500 Ω 200Ω 1Ω
400VA
T1 5V 13.89% 59.781 34.044 39.608 43.347 40.199 39.499 39.184 38.666 38.383 38.173 37.492 35.921 230.414
T1 12V 33.33% 49.179 13.567 14.957 23.207 16.824 16.140 16.753 17.769 16.600 17.234 17.819 26.255 246.622
T1 24V 66.67% 55.654 7.360 7.165 7.268 7.116 8.388 9.727 11.418 14.187 19.645 35.610 71.986 250.932
T1 36V 100% 58.307 25.109 29.159 28.463 25.350 26.395 26.248 27.231 30.799 40.227 67.038 123.600 253.095
T2 24V 100% 33.779 4.637 6.509 12.895 10.229 9.030 9.110 10.203 12.574 17.061 30.136 58.296 174.679
T3 24V 100% 30.743 12.524 8.480 8.754 5.997 6.421 7.817 9.349 12.123 21.546 32.853 60.282 179.817
630VA
T4 5V 2.27% 47.042 22.949 27.692 35.159 31.397 29.346 28.580 28.656 28.237 27.801 26.708 25.451 420.490
T4 12V 5.4% 30.183 9.390 13.201 18.213 20.272 15.487 14.047 11.793 14.073 12.292 11.970 20.820 549.587
T4 22V 10% 21.521 4.779 4.263 12.351 5.252 5.443 5.775 7.120 9.334 13.810 26.222 57.619 671.527
T4 42V 19.1% 25.131 10.220 11.637 29.902 17.217 17.554 20.003 24.415 31.199 44.369 77.792 149.144 759.086
T4 110V 50% 35.252 56.363 62.061 76.977 76.603 85.701 98.225 114.869 141.228 181.942 269.812 404.662 827.611
T4 220V 100% 74.130 158.997 170.523 184.060 198.836 218.136 241.119 271.321 312.173 378.576 490.990 631.275 873.264
T5 230V 100% 48.185 117.727 127.409 138.743 151.697 168.189 188.133 214.451 252.566 310.851 417.801 552.763 795.020
T6 220V 100% 84.679 172.805 184.914 199.186 215.104 235.737 262.608 295.080 340.667 408.785 526.556 670.277 918.672
750kVA
T7 53V 13.25% 38.336 11.723 14.673 22.059 19.413 20.456 21.457 23.830 28.295 37.467 63.188 120.514 738.722
T7 200V 50% 46.254 82.765 89.753 98.987 107.748 119.626 134.404 155.098 184.057 229.194 321.621 458.535 875.007
T7 400V 100% 103.450 203.299 215.586 230.470 246.983 266.707 291.167 322.695 366.636 428.585 541.946 681.738 925.559
T7 115V 50% 39.364 33.943 37.917 43.714 47.296 52.667 60.530 71.442 88.624 116.857 180.539 286.868 689.668
T7 230V 100% 55.484 100.459 108.306 118.023 128.336 141.843 158.702 181.475 212.444 262.346 354.641 477.827 708.542
1kVA
T8 5V 2.27% 52.7891 24.9702 29.0594 35.3110 32.9758 32.0507 31.1202 31.1126 30.4330 31.5090 28.5363 27.9585 380.2363
T8 12V 5.45% 26.5440 8.4422 9.9553 12.0666 11.0275 10.4265 10.2289 10.0407 10.0447 10.1801 10.8831 14.6396 478.2731
T8 24V 10.9% 25.096 4.959 6.571 8.179 6.998 6.451 6.481 6.736 7.983 9.885 17.263 37.845 569.930
T8 36V 16.36% 25.663 8.441 10.265 12.188 12.084 12.749 14.195 16.655 20.972 29.541 53.622 113.413 704.100
T8 110V 50% 29.313 37.829 41.674 46.390 51.623 58.196 67.369 80.951 100.519 133.770 207.748 329.223 744.006
T8 220V 100% 123.3945 122.922 131.318 141.783 153.747 168.736 187.533 212.028 248.340 302.890 406.938 540.111 774.7858

46
3 phase
350VA
T9 230V 57.5% 42.405 64.480 71.466 78.840 88.228 94.799 106.55 123.21 148.47 188.16 268.95 392.19 790.09
T9 400V 100% 82.219 166.21 178.16 190.46 206.01 222.13 243.05 271.33 309.80 368.06 468.97 596.94 828.94
T9 230V 57.5% 51.755 103.85 113.29 123.46 137.91 149.03 167.60 191.15 226.70 282.63 386.93 534.99 930.14
T9 400V 100% 126.03 251.81 265.97 283.32 304.81 326.77 356.06 391.19 438.28 510.24 634.34 781.02 1032.2
T9 230V 57.5% 77.030 101.47 118.62 132.57 140.94 152.33 169.93 193.95 228.75 283.04 385.40 535.63 926.32
T9 400V 100% 139.60 251.58 266.28 286.02 305.04 327.38 354.41 391.26 441.11 511.51 633.71 780.56 1029.7
1.2kVA
T10 24V 57.1% 20.020 8.9636 11.241 13.815 12.575 8.8236 7.9657 7.4232 7.0515 7.0996 9.1307 17.019 129.03
T10 42V 100% 21.378 11.811 14.796 14.167 11.537 11.146 10.972 11.513 12.086 14.840 21.216 40.086 130.97
5kVA
T11 100% 31.257 14.129 17.925 21.198 19.659 18.097 19.180 16.297 14.743 13.838 13.872 16.345 56.155
20kVA
T12 100% 13.799 24.570 26.853 29.769 33.572 38.107 47.235 55.758 69.659 94.483 149.34 238.76 450.04
40kVA
T13 100% 3.9209 13.500 15.016 16.630 18.894 21.991 26.071 32.374 42.583 59.232 100.12 168.56 327.87
Table 3.8. The CD results for all transformers
CD Wind.% 15kΩ 5kΩ 4.5kΩ 4kΩ 3.5kΩ 3kΩ 2.5kΩ 2kΩ 1.5kΩ 1kΩ 500 Ω 200Ω 1Ω
400VA
T1 5V 13.89% 480.71 440.88 411.67 413.71 417.52 407.90 404.13 396.55 384.00 389.36 442.29 567.36 693.38
T1 12V 33.33% 467.66 411.61 424.34 432.71 412.82 432.67 430.97 474.21 517.21 609.32 704.34 633.11 711.75
T1 24V 66.67% 484.66 569.90 562.97 579.12 599.91 619.49 666.61 676.75 628.59 588.18 639.27 632.09 716.29
T1 36V 100% 571.88 720.07 720.81 680.70 663.05 620.83 615.16 630.02 628.96 613.83 580.50 617.54 686.31
T2 24V 100% 421.26 400.17 380.15 389.85 402.90 410.77 429.44 436.06 439.18 507.10 531.85 449.78 469.28
T3 24V 100% 482.96 493.52 420.55 452.48 494.49 424.16 429.82 367.75 354.34 576.04 572.51 535.25 588.45
630VA
T4 5V 2.27% 761.22 572.50 584.94 595.81 644.27 614.02 582.30 577.34 590.39 596.30 665.53 951.73 1336.70
T4 12V 5.4% 667.47 476.74 494.47 506.16 545.77 522.07 539.48 587.44 701.13 943.92 1440.20 1469.40 1299.60
T4 22V 10% 594.56 754.70 751.22 849.25 918.43 997.15 1146.90 1294.70 1484.00 1550.70 1421.20 1445.90 1234.50
T4 42V 19.1% 895.90 1574.40 1581.40 1591.80 1578.30 1510.90 1449.90 1409.70 1369.90 1544.10 1441.10 1373.90 1247.30
T4 110V 50% 1602.80 1453.90 1563.30 1577.10 1474.10 1487.00 1521.30 1420.30 1510.70 1442.70 1407.50 1350.60 1176.20
T4 220V 100% 1635.70 1422.80 1521.20 1462.30 1398.40 1493.20 1389.60 1422.50 1389.40 1353.20 1289.70 1208.50 1165.50
T5 230V 100% 1374.10 1242.60 1262.70 1398.80 1318.80 1279.10 1359.20 1287.00 1252.50 1265.00 1179.40 1156.80 1092.40
T6 220V 100% 1506.00 1380.80 1404.20 1502.90 1639.20 1552.10 1349.40 1494.40 1394.70 1376.30 1288.90 1288.70 1189.60

47
750kVA
T7 53V 13.25% 894.63 1553.50 1562.00 1542.00 1485.10 1414.30 1376.70 1518.00 1591.20 1565.60 1526.90 1464.80 1231.80
T7 200V 50% 1624.30 1550.60 1490.30 1515.20 1529.70 1488.40 1505.60 1477.50 1472.70 1449.00 1329.50 1354.30 1188.30
T7 400V 100% 1573.30 1426.90 1413.50 1437.60 1417.50 1389.40 1447.90 1321.80 1417.60 1238.10 1222.40 1244.30 1167.50
T7 115V 50% 1266.10 1204.00 1281.70 1297.00 1216.20 1216.80 1259.40 1169.60 1174.40 1182.10 1180.10 1127.40 987.74
T7 230V 100% 1357.70 1227.30 1217.70 1192.90 1209.20 1205.40 1171.00 1181.90 1118.30 1077.30 1059.80 1057.30 1011.20
1kVA
T8 5V 2.27% 588.86 374.15 354.33 348.98 353.86 350.48 337.56 338.37 345.29 379.97 374.9 546.21 1300
T8 12V 5.45% 575.22 460.34 464.3 451.27 488.05 501.04 499.5 506.49 541.09 624.32 948.74 1450.2 1219.5
T8 24V 10.9% 543.58 513.79 539.45 569.66 635.43 690.86 762.95 887.84 1087.6 1340.7 1393.2 1419 1176.3
T8 36V 16.36% 619.90 1182.3 1239.8 1317.8 1399 1451.1 1473 1433.3 1357.6 1306 1232.2 1285.6 1135.2
T8 110V 50% 1460.8 1391.9 1444.9 1394 1256.3 1302.2 1407.3 1289.7 1365.5 1362.9 1273.6 1204.1 1089.1
T8 220V 100% 1392.8 1262.3 1262 1366.9 1278.9 1302.7 1292.9 1278.7 1249.2 1234.8 1176.5 1138.3 1053.1
3 phase
350VA
T9 230V 57.5% 1436.3 1420.6 1437.0 1380.9 1433.2 1402.5 1350.6 1354.3 1359.9 1306.6 1293.3 1205.2 1119.6
T9 400V 100% 1444.3 1386.0 1353.6 1321.2 1380.1 1359.3 1276.9 1350.4 1235.3 1308.0 1218.7 1081.5 1117.3
T9 230V 57.5% 1722.8 1730.1 1734.1 1659.2 1715.1 1685.1 1650.9 1678.2 1653.2 1558.6 1572.9 1436.8 1334.0
T9 400V 100% 1720.5 1629.1 1572.8 1564.8 1629.8 1588.1 1539.5 1568.1 1464.5 1480.5 1435.8 1340.6 1299.0
T9 230V 57.5% 1665.9 1738.0 1731.9 1676.2 1705.8 1700.9 1656.9 1725.4 1669.2 1575.4 1601.1 1446.8 1282.0
T9 400V 100% 1658.0 1600.3 1578.0 1594.6 1606.0 1574.9 1590.0 1571.3 1514.1 1482.8 1459.0 1343.6 1291.5
1.2kVA
T10 24V 57.1% 452.76 437.53 384.64 427.17 420.63 490.97 427.86 411.31 409.77 409.25 496.73 441.33 533.22
T10 42V 100% 454.03 443.43 417.29 410.04 453.16 491.17 429.33 456.39 499.53 469.28 433.15 471.49 522.83
5kVA
T11 100% 441.03 409.92 389.03 392.47 381.65 476.48 441.73 373.49 379.36 366.99 408.21 469.87 378.81
20kVA
T12 100% 987.16 908.01 921.87 949.04 947.38 971.50 986.65 884.78 908.67 873.93 890.79 853.09 732.50
40kVA
T13 100% 527.70 788.37 777.46 761.17 735.49 666.38 609.65 616.32 691.94 637.93 624.49 733.05 617.28
Table 3.9. The CSD results for all transformers
CSD Wind.% 15kΩ 5kΩ 4.5kΩ 4kΩ 3.5kΩ 3kΩ 2.5kΩ 2kΩ 1.5kΩ 1kΩ 500 Ω 200Ω 1Ω
400VA
T1 5V 13.89% 1.8973 1.0908 1.2691 1.3889 1.2880 1.2656 1.2555 1.2388 1.2297 1.2230 1.2009 1.1494 6.5474
T1 12V 33.33% 1.5640 0.4322 0.4764 0.7410 0.5352 0.5128 0.5319 0.5638 0.5244 0.5411 0.5449 0.7648 6.2932

48
T1 24V 66.67% 1.7719 0.2316 0.2220 0.2212 0.2136 0.2522 0.2914 0.3401 0.4191 0.5753 1.0334 2.0509 6.1523
T1 36V 100% 1.8604 0.7978 0.9254 0.8995 0.7950 0.8228 0.8073 0.8223 0.9111 1.1642 1.8937 3.3885 6.0690
T2 24V 100% 1.0522 0.1346 0.1955 0.4059 0.3139 0.2672 0.2615 0.2880 0.3516 0.4741 0.8296 1.5722 4.2368
T3 24V 100% 0.9604 0.4009 0.2673 0.2536 0.1674 0.1799 0.2264 0.2585 0.3379 0.6576 0.9603 1.6680 4.0972
630VA
T4 5V 2.27% 1.4533 0.7108 0.8581 1.1004 0.9746 0.9110 0.8871 0.8891 0.8757 0.8625 0.8256 0.7760 10.113
T4 12V 5.4% 0.9358 0.2830 0.4020 0.5671 0.6252 0.4757 0.4296 0.3570 0.4250 0.3617 0.3247 0.5475 12.609
T4 22V 10% 0.6687 0.1481 0.1126 0.3821 0.1482 0.1475 0.1604 0.1963 0.2564 0.3860 0.7160 1.5743 14.745
T4 42V 19.1% 0.7765 0.2752 0.3057 0.9347 0.4646 0.4701 0.5377 0.6568 0.8385 1.1962 2.0739 3.8423 15.673
T4 110V 50% 1.0380 1.5058 1.6470 2.1480 2.0173 2.2480 2.5636 2.9796 3.6109 4.5708 6.4590 9.0404 15.810
T4 220V 100% 1.9448 3.9683 4.2042 4.5167 4.8507 5.2572 5.7482 6.3652 7.1449 8.3738 10.204 12.015 14.925
T5 230V 100% 1.2498 2.9955 3.2237 3.4547 3.7669 4.1340 4.5758 5.1448 5.9195 7.0502 8.9891 11.093 14.451
T6 220V 100% 1.9857 4.0199 4.2297 4.5021 4.8448 5.2805 5.8076 6.4263 7.2444 8.4269 10.264 12.161 15.611
750kVA
T7 53V 13.25% 1.2284 0.3553 0.4486 0.6902 0.5977 0.6263 0.6493 0.7137 0.8383 1.0999 1.8166 3.3494 16.468
T7 200V 50% 1.4493 2.3541 2.5448 2.8049 3.0304 3.3382 3.7178 4.2388 4.9451 5.9958 7.9592 10.505 17.713
T7 400V 100% 3.0060 5.4219 5.7039 6.0540 6.4167 6.8445 7.3630 8.0088 8.8664 10.004 11.889 13.935 17.223
T7 115V 50% 1.2572 0.9838 1.0993 1.2799 1.3702 1.5161 1.7318 2.0296 2.4944 3.2355 4.8007 7.1085 14.042
T7 230V 100% 1.6925 2.8051 3.0069 3.2667 3.5229 3.8574 4.2693 4.8108 5.5181 6.5876 8.3638 10.351 13.449
1kVA
T8 5V 2.27% 0.6399 0.7888 0.9202 0.8237 0.9472 0.8162 0.9859 0.9855 0.9638 0.998 0.9011 0.8781 9.31
T8 12V 5.45% 0.8487 0.2705 0.319 0.3866 0.3533 0.3339 0.3274 0.321 0.3207 0.3236 0.3402 0.4316 11.400
T8 24V 10.9% 0.8027 0.1577 0.2093 0.2611 0.2222 0.2028 0.2013 0.2056 0.2407 0.289 0.489 1.0441 13.001
T8 36V 16.36% 0.8204 0.2583 0.316 0.3778 0.3682 0.3816 0.4185 0.4837 0.6011 0.8343 1.4796 3.0127 14.767
T8 110V 50% 0.911 1.0618 1.1676 1.2994 1.4351 1.6068 1.8469 2.1993 2.6991 3.5247 5.2494 7.7887 14.705
T8 220V 100% 1.4854 3.0432 3.2633 3.534 3.8336 4.2001 4.6534 5.2161 6.019 7.1487 9.0646 10.992 13.778
3 phase
350VA
T9 230V 57.5% 1.3039 1.8936 2.1067 2.2975 2.5982 2.7436 3.0564 3.4988 4.1540 5.1479 7.0324 9.6381 17.017
T9 400V 100% 2.3784 4.5997 4.9141 5.1790 5.6160 5.9574 6.4371 7.0778 7.9239 9.1579 11.162 13.5209 17.334
T9 230V 57.5% 1.4736 2.7641 3.0195 3.2265 3.6845 3.8775 4.3131 4.8365 5.6244 6.8097 8.8586 11.542 18.745
T9 400V 100% 3.2411 6.1019 6.4079 6.6855 7.2317 7.6032 8.1498 8.8027 9.6552 10.913 12.939 15.110 18.656
T9 230V 57.5% 2.1958 2.6333 3.0130 3.3656 3.5612 3.8230 4.2234 4.7609 5.5185 6.6397 8.6219 11.324 18.670
T9 400V 100% 3.4898 5.9587 6.2138 6.5752 6.9527 7.4232 7.9550 8.6393 9.4995 10.759 12.764 14.947 18.731
1.2kVA
T10 24V 57.1% 0.6198 0.2817 0.3516 0.4354 0.3895 0.2717 0.2430 0.2252 0.2133 0.2100 0.2671 0.4978 3.4025
T10 42V 100% 0.6509 0.3657 0.4532 0.4275 0.3412 0.3303 0.3231 0.3375 0.3517 0.4270 0.6097 1.1490 3.2154

49
5kVA
T11 100% 0.9595 0.4313 0.5480 0.6526 0.6032 0.5565 0.5897 0.5008 0.4527 0.4225 0.4165 0.4783 1.4902
20kVA
T12 100% 0.4039 0.6875 0.7539 0.8367 0.9325 1.0462 1.2692 1.4895 1.8327 2.4450 3.6945 5.4299 7.8475
40kVA
T13 100% 0.1217 0.4035 0.4504 0.4971 0.5640 0.6564 0.7766 0.9656 1.2643 1.7498 2.9264 4.7362 6.9818
Table 3.10. The CCF results for all transformers
CCF Wind.% 15kΩ 5kΩ 4.5kΩ 4kΩ 3.5kΩ 3kΩ 2.5kΩ 2kΩ 1.5kΩ 1kΩ 500 Ω 200Ω 1Ω
400VA
T1 5V 13.89% 0.9725 0.9911 0.9880 0.9856 0.9876 0.9881 0.9882 0.9886 0.9887 0.9888 0.9892 0.9900 0.6697
T1 12V 33.33% 0.9813 0.9986 0.9983 0.9958 0.9978 0.9980 0.9979 0.9976 0.9980 0.9979 0.9980 0.9967 0.6864
T1 24V 66.67% 0.9760 0.9996 0.9997 0.9997 0.9997 0.9996 0.9995 0.9993 0.9990 0.9981 0.9939 0.9737 0.6952
T1 36V 100% 0.9742 0.9953 0.9937 0.9940 0.9953 0.9950 0.9953 0.9953 0.9946 0.9917 0.9786 0.9197 0.7045
T2 24V 100% 0.9998 0.9998 0.9995 0.9980 0.9988 0.9992 0.9992 0.9991 0.9986 0.9973 0.9915 0.9685 0.7519
T3 24V 100% 0.9954 0.9990 0.9995 0.9997 0.9998 0.9998 0.9996 0.9995 0.9991 0.9970 0.9932 0.9791 0.8895
630VA
T4 5V 2.27% 0.9889 0.9974 0.9961 0.9937 0.9950 0.9957 0.9959 0.9959 0.9960 0.9961 0.9964 0.9969 0.4351
T4 12V 5.4% 0.9997 0.9996 0.9992 0.9983 0.9980 0.9988 0.9990 0.9994 0.9991 0.9994 0.9996 0.9993 0.2115
T4 22V 10% 0.9976 0.9999 1.0000 0.9992 0.9999 0.9999 0.9999 0.9999 0.9999 0.9996 0.9989 0.9938 -0.090
T4 42V 19.1% 0.9969 0.9998 0.9998 0.9955 0.9993 0.9995 0.9993 0.9990 0.9984 0.9968 0.9896 0.9571 -0.229
T4 110V 50% 0.9954 0.9947 0.9937 0.9823 0.9906 0.9884 0.9845 0.9780 0.9660 0.9359 0.8166 0.3815 -0.312
T4 220V 100% 0.9905 0.9562 0.9508 0.9391 0.9266 0.9105 0.8798 0.8319 0.7486 0.5280 0.1195 -0.120 -0.250
T5 230V 100% 0.9965 0.9697 0.9635 0.9600 0.9480 0.9345 0.9124 0.8756 0.8059 0.6419 0.2058 -0.142 -0.317
T6 220V 100% 0.9863 0.9554 0.9522 0.9459 0.9306 0.9075 0.8731 0.8142 0.6910 0.3762 -0.157 -0.363 -0.478
750kVA
T7 53V 13.25% 0.9998 0.9997 0.9994 0.9986 0.9990 0.9989 0.9989 0.9988 0.9984 0.9975 0.9940 0.9801 -0.472
T7 200V 50% 0.9975 0.9903 0.9886 0.9858 0.9837 0.9803 0.9757 0.9686 0.9571 0.9355 0.8710 0.6393 -0.482
T7 400V 100% 0.9925 0.9479 0.9423 0.9339 0.9248 0.9126 0.8954 0.8692 0.8221 0.7183 0.3426 -0.161 -0.462
T7 115V 50% 0.9994 0.9975 0.9968 0.9951 0.9948 0.9938 0.9921 0.9892 0.9835 0.9714 0.9277 0.7512 -0.297
T7 230V 100% 0.9958 0.9786 0.9754 0.9702 0.9650 0.9571 0.9454 0.9261 0.8922 0.8100 0.5258 0.0874 -0.216
1kVA
T8 5V 2.27% 0.9980 0.9975 0.9987 0.9991 0.9984 0.9993 0.9987 0.9985 0.9984 0.9987 0.9981 0.9977 0.4907
T8 12V 5.45% 0.9994 0.9996 0.9995 0.9992 0.9993 0.9994 0.9994 0.9995 0.9995 0.9995 0.9994 0.9993 0.3002
T8 24V 10.9% 0.9989 0.9999 0.9998 0.9996 0.9997 0.9998 0.9998 0.9998 0.9998 0.9997 0.9993 0.9973 0.0779
T8 36V 16.36% 0.9997 0.9997 0.9996 0.9994 0.9994 0.9995 0.9994 0.9993 0.999 0.9982 0.9946 0.9767 -0.293

50
T8 110V 50% 0.9975 0.9971 0.9964 0.9955 0.9946 0.9934 0.9913 0.9876 0.9809 0.9655 0.907 0.6491 -0.345
T8 220V 100% 0.9927 0.9747 0.9701 0.9636 0.9561 0.9455 0.9296 0.9045 0.8545 0.7403 0.3567 -0.085 -0.275
3 phase
350VA
T9 230V 57.5% 0.9957 0.9930 0.9908 0.9896 0.9854 0.9853 0.9821 0.9764 0.9662 0.9456 0.8839 0.7108 -0.078
T9 400V 100% 0.9890 0.9570 0.9488 0.9461 0.9297 0.9233 0.9083 0.8831 0.8406 0.7542 0.5443 0.2409 -0.068
T9 230V 57.5% 0.9948 0.9854 0.9814 0.9807 0.9695 0.9702 0.9625 0.9529 0.9328 0.8892 0.7523 0.3830 -0.403
T9 400V 100% 0.9825 0.9173 0.9042 0.9038 0.8636 0.8516 0.8193 0.7676 0.6775 0.4941 0.1344 -0.142 -0.340
T9 230V 57.5% 0.9845 0.9879 0.9829 0.9765 0.9756 0.9733 0.9684 0.9599 0.9447 0.9131 0.8009 0.3567 -0.485
T9 400V 100% 0.9745 0.9346 0.9313 0.9229 0.9101 0.8888 0.8592 0.8106 0.7286 0.4994 0.0231 -0.277 -0.423
1.2kVA
T10 24V 57.1% 0.9976 0.9994 0.9991 0.9986 0.9990 0.9995 0.9997 0.9997 0.9997 0.9997 0.9995 0.9981 0.9172
T10 42V 100% 0.9979 0.9991 0.9988 0.9991 0.9995 0.9995 0.9995 0.9994 0.9993 0.9989 0.9972 0.9891 0.9248
5kVA
T11 100% 0.9958 0.9992 0.9988 0.9981 0.9984 0.9985 0.9983 0.9988 0.9990 0.9992 0.9992 0.9988 0.9852
20kVA
T12 100% 0.9986 0.9964 0.9956 0.9946 0.9933 0.9917 0.9870 0.9817 0.9714 0.9445 0.8516 0.6410 0.3500
40kVA
T13 100% 0.9999 0.9989 0.9986 0.9983 0.9978 0.9970 0.9959 0.9935 0.9886 0.9774 0.9293 0.7800 0.4655
Table 3.11. The MAX results for all transformers
MAX Wind.% 15kΩ 5kΩ 4.5kΩ 4kΩ 3.5kΩ 3kΩ 2.5kΩ 2kΩ 1.5kΩ 1kΩ 500 Ω 200Ω 1Ω
400VA
T1 5V 13.89% 5.3204 12.071 15.770 19.382 19.120 18.820 18.352 17.967 18.187 17.833 16.932 15.626 8.3403
T1 12V 33.33% 5.0514 4.7699 5.2724 10.166 7.1520 6.5987 6.8928 7.5221 6.6361 6.7617 5.7491 3.3797 2.0212
T1 24V 66.67% 4.7957 1.8511 1.5830 2.4367 1.9370 2.2359 2.2179 2.0910 1.7137 0.7652 0.4241 0.8112 0.0612
T1 36V 100% 5.1675 9.4418 10.198 11.866 10.600 11.308 9.9822 8.2777 6.6603 4.5597 0.7425 1.1819 -0.025
T2 24V 100% 0.8691 0.8385 1.4942 3.6328 2.517 1.6638 1.1868 1.0146 0.9921 0.8883 0.7996 1.4568 1.0497
T3 24V 100% 0.0668 6.3115 3.5395 0.1874 0.2124 0.2466 1.1541 0.3534 0.4585 8.4954 7.4047 3.2599 2.2415
630VA
T4 5V 2.27% 0.0593 3.4458 3.5635 11.167 2.9682 1.9032 1.8403 1.8091 2.0323 3.0457 3.0485 3.0113 7.3078
T4 12V 5.4% 0.0438 0.0351 0.0372 6.9242 0.0322 0.0331 0.0332 0.0353 0.0347 0.0321 0.0484 0.1021 6.7166
T4 22V 10% 0.0621 0.9001 0.5136 7.4513 2.2410 0.0522 0.0955 0.0642 0.0538 0.4932 0.1206 0.7302 5.6654
T4 42V 19.1% 0.0626 0.2161 0.1988 22.215 0.2049 0.0719 0.0816 0.0963 0.1215 0.1714 0.2950 0.8113 6.2747
T4 110V 50% 0.9219 1.0596 2.4451 31.230 3.2485 0.8230 0.5268 0.7032 1.0712 1.8077 3.9623 8.3798 15.375
T4 220V 100% 0.9139 0.7507 0.7380 5.3806 1.2449 1.6802 2.1680 3.0827 4.4046 7.0630 11.703 11.388 9.3348

51
T5 230V 100% 0.6268 1.9986 2.6922 2.4215 1.7639 1.9848 2.3980 3.1335 4.1816 6.2530 10.399 11.307 9.2225
T6 220V 100% 0.9900 1.0510 1.1894 1.5239 1.8187 2.2509 2.8715 3.7541 5.2211 7.9192 12.0781 11.1968 9.299
750kVA
T7 53V 13.25% 1.2063 1.8054 2.760 5.642 4.177 3.244 2.6751 2.4830 2.4134 2.5048 1.9686 1.7945 6.328
T7 200V 50% 1.1897 2.6508 3.565 6.145 5.076 3.989 3.7169 3.4998 3.5777 3.5894 3.2952 3.1326 4.749
T7 400V 100% 1.2661 0.7819 1.707 4.205 2.962 1.876 1.4547 1.5027 2.0591 3.0915 5.7699 8.5194 6.129
T7 115V 50% 1.2386 1.5370 2.521 4.815 3.610 2.519 1.9984 1.4445 1.4893 1.6508 1.2305 2.9286 9.202
T7 230V 100% 1.0703 0.8249 1.729 4.247 3.019 1.880 1.3955 1.2286 1.6678 2.5209 4.7937 7.0276 4.863
1kVA
T8 5V 2.27% 1.4452 4.1247 5.2328 7.6806 6.4969 5.3106 4.717 4.5969 4.5014 4.8316 4.0704 3.9889 6.5478
T8 12V 5.45% 1.4714 1.6971 2.0194 2.5155 2.2226 2.016 1.9188 1.8484 1.8295 1.841 1.8518 1.7217 6.1745
T8 24V 10.9% 1.5147 1.0986 1.429 1.6209 1.3068 1.1006 1.016 0.9393 1.0152 0.9578 1.0489 0.9654 5.4127
T8 36V 16.36% 1.5977 1.2873 1.6568 1.9289 1.6185 1.42 1.3129 1.2526 1.2437 1.2767 1.2832 1.3166 11.509
T8 110V 50% 1.8595 1.4334 1.7036 1.8935 1.5441 1.3399 1.2476 1.1939 1.173 1.5747 3.4585 8.0413 14.639
T8 220V 100% 1.2206 1.1393 1.2795 1.824 1.5841 1.8312 2.1599 2.6364 3.4894 5.429 10.367 12.279 9.3006
3 phase
350VA
T9 230V 57.5% 15.3697 2.1877 6.5973 8.1025 11.1985 4.7789 2.9919 3.3134 2.9987 3.1578 2.5460 1.8714 7.003
T9 400V 100% 13.5699 4.2701 9.3174 8.2218 13.8546 7.0008 5.0505 4.3171 4.5132 5.1159 5.2330 4.3049 4.356
T9 230V 57.5% 11.7572 3.5960 7.9878 6.4594 16.0637 6.4685 7.4545 4.5625 4.0254 3.6884 4.2593 3.2538 3.016
T9 400V 100% 7.4651 3.7522 6.5874 5.2886 16.5490 8.7758 6.3588 5.5259 5.1580 5.7409 8.4551 9.5399 7.572
T9 230V 57.5% 0.1392 0.2865 0.3231 0.3473 0.3861 0.4554 0.5538 0.7155 0.9782 1.4773 2.6314 3.9497 3.924
T9 400V 100% 0.2851 1.1213 1.2554 1.4364 1.6511 1.9762 2.3740 2.9983 4.0145 5.8024 9.1991 10.1982 8.321
1.2kVA
T10 24V 57.1% 1.5467 1.4442 1.6545 1.9070 1.3745 0.8798 0.5452 0.3986 0.5093 0.3292 0.4704 0.6058 3.7584
T10 42V 100% 0.3362 2.0026 1.3140 1.3162 0.0494 0.0573 0.0698 0.0863 0.1115 0.1644 0.3013 1.6403 1.4812
5kVA
T11 100% 0.0042 0.0146 0.0155 0.8448 0.0189 0.0216 0.0269 0.0349 0.0487 0.0714 0.1371 0.2922 0.5528
20kVA
T12 100% 1.3172 0.9521 0.9897 0.7245 0.9022 0.8865 1.5032 2.0821 2.4548 3.1976 4.8560 5.5320 4.749
40kVA
T13 100% 0.4006 0.7872 0.8778 0.8823 1.0924 1.3258 1.4977 1.9562 2.4317 3.1935 5.8325 10.1589 5.8615
Table 3.12. The MM results for all transformers
MM Wind.% 15kΩ 5kΩ 4.5kΩ 4kΩ 3.5kΩ 3kΩ 2.5kΩ 2kΩ 1.5kΩ 1kΩ 500 Ω 200Ω 1Ω
400VA

52
T1 5V 13.89% 1.0146 1.0155 1.0169 1.0177 1.0165 1.0161 1.0160 1.0158 1.0158 1.0161 1.0167 1.0187 1.410
T1 12V 33.33% 1.0140 1.0078 1.0084 1.0114 1.0094 1.0093 1.0099 1.0108 1.0111 1.0128 1.0174 1.0308 1.506
T1 24V 66.67% 1.0139 1.0070 1.0071 1.0073 1.0077 1.0090 1.0104 1.0123 1.0155 1.0217 1.0409 1.0912 1.550
T1 36V 100% 1.0147 1.0202 1.0225 1.0224 1.0222 1.0245 1.0267 1.0301 1.0362 1.0490 1.0856 1.1817 1.577
T2 24V 100% 1.0043 1.0070 1.0087 1.0119 1.0118 1.0121 1.0133 1.0156 1.0197 1.0272 1.0489 1.1007 1.428
T3 24V 100% 1.0160 1.0098 1.0089 1.0100 1.0087 1.0096 1.0116 1.0137 1.0176 1.0285 1.0480 1.0955 1.4239
630VA
T4 5V 2.27% 1.0122 1.0065 1.0076 1.0088 1.0080 1.0076 1.0074 1.0074 1.0074 1.0074 1.0076 1.0082 1.3952
T4 12V 5.4% 1.0072 1.0031 1.0040 1.0048 1.0053 1.0043 1.0041 1.0038 1.0046 1.0047 1.0062 1.0116 1.6169
T4 22V 10% 1.0052 1.0024 1.0024 1.0039 1.0027 1.0029 1.0031 1.0037 1.0048 1.0070 1.0135 1.0312 1.9417
T4 42V 19.1% 1.0070 1.0058 1.0067 1.0092 1.0092 1.0095 1.0108 1.0131 1.0168 1.0238 1.0439 1.0947 2.2808
T4 110V 50% 1.0163 1.0314 1.0354 1.0415 1.0446 1.0504 1.0590 1.0706 1.0912 1.1253 1.2159 1.4039 2.8068
T4 220V 100% 1.0442 1.1065 1.1170 1.1302 1.1431 1.1631 1.1870 1.2221 1.2751 1.3723 1.5855 1.9779 3.3763
T5 230V 100% 1.0320 1.0845 1.0930 1.1027 1.1154 1.1317 1.1529 1.1828 1.2298 1.3129 1.5079 1.8657 3.1826
T6 220V 100% 1.0558 1.1233 1.1357 1.1502 1.1650 1.1852 1.2141 1.2517 1.3109 1.4120 1.6399 2.0453 3.4490
750kVA
T7 53V 13.25% 1.0030 1.0044 1.0051 1.0065 1.0065 1.0071 1.0078 1.0091 1.0113 1.0155 1.0281 1.0618 2.0739
T7 200V 50% 1.0115 1.0396 1.0437 1.0494 1.0548 1.0623 1.0723 1.0873 1.1101 1.1501 1.2511 1.4581 2.8936
T7 400V 100% 1.0475 1.1240 1.1354 1.1500 1.1656 1.1855 1.2120 1.2493 1.3075 1.4035 1.6354 2.0662 3.6778
T7 115V 50% 1.0073 1.0181 1.0205 1.0237 1.0261 1.0294 1.0345 1.0418 1.0541 1.0767 1.1381 1.2792 2.7145
T7 230V 100% 1.0233 1.0632 1.0700 1.0787 1.0875 1.0996 1.1159 1.1398 1.1759 1.2435 1.4051 1.7268 3.0033
1kVA
T8 5V 2.27% 1.0203 1.0052 1.0059 1.0067 1.0064 1.0062 1.0061 1.0061 1.006 1.0062 1.0061 1.0067 1.4113
T8 12V 5.45% 1.0179 1.0029 1.0033 1.0038 1.0037 1.0035 1.0035 1.0036 1.0038 1.0042 1.0054 1.009 1.5963
T8 24V 10.9% 1.0172 1.0023 1.0027 1.0032 1.003 1.003 1.0032 1.0036 1.0045 1.0059 1.0105 1.0235 1.8459
T8 36V 16.36% 1.0176 1.005 1.0058 1.0066 1.0069 1.0075 1.0085 1.0101 1.0129 1.0183 1.0341 1.0796 2.5007
T8 110V 50% 1.0228 1.0237 1.0263 1.0295 1.0328 1.0372 1.0436 1.0536 1.0689 1.0976 1.1735 1.3433 2.9208
T8 220V 100% 1.0426 1.0806 1.0885 1.0985 1.1099 1.1249 1.145 1.1727 1.2181 1.2969 1.4911 1.864 3.3246
3 phase
350VA
T9 230V 57.5% 1.0168 1.0298 1.0343 1.0390 1.0438 1.0480 1.0550 1.0667 1.0855 1.1186 1.2006 1.3694 2.6676
T9 400V 100% 1.0428 1.1011 1.1126 1.1242 1.1380 1.1536 1.1746 1.2056 1.2527 1.3342 1.5114 1.8289 2.9449
T9 230V 57.5% 1.0248 1.0544 1.0610 1.0677 1.0760 1.0841 1.0976 1.1147 1.1431 1.1928 1.3060 1.5173 2.5949
T9 400V 100% 1.0716 1.1677 1.1817 1.2003 1.2219 1.2456 1.2788 1.3219 1.3859 1.4994 1.7516 2.1855 3.6791
T9 230V 57.5% 1.0313 1.0542 1.0665 1.0749 1.0807 1.0889 1.1019 1.1204 1.1491 1.1988 1.3109 1.5284 2.5770
T9 400V 100% 1.0799 1.1709 1.1866 1.2074 1.2271 1.2501 1.2806 1.3264 1.3970 1.5076 1.7567 2.1939 3.6417
1.2kVA

53
T10 24V 57.1% 1.0151 1.0078 1.0092 1.0110 1.0105 1.0078 1.0073 1.0072 1.0074 1.0084 1.0123 1.0234 1.2523
T10 42V 100% 1.0168 1.0107 1.0125 1.0128 1.0118 1.0115 1.0119 1.0130 1.0145 1.0190 1.0282 1.0552 1.2659
5kVA
T11 100% 1.0255 1.0123 1.0153 1.0170 1.0162 1.0146 1.0155 1.0134 1.0127 1.0129 1.0156 1.0228 1.1008
20kVA
T12 100% 1.0126 1.0231 1.0257 1.0281 1.0323 1.0375 1.0544 1.0643 1.0822 1.1166 1.2081 1.4124 2.5275
40kVA
T13 100% 1.0048 1.0158 1.0178 1.0198 1.0222 1.0258 1.0308 1.0386 1.0516 1.0738 1.1352 1.2704 2.0599
Table 3.13. The SSRE results for all transformers
SSRE Wind.% 15kΩ 5kΩ 4.5kΩ 4kΩ 3.5kΩ 3kΩ 2.5kΩ 2kΩ 1.5kΩ 1kΩ 500 Ω 200Ω 1Ω
400VA
T1 5V 13.89% 0.0005 0.0010 0.0014 0.0016 0.0013 0.0012 0.0012 0.0012 0.0011 0.0011 0.0011 0.0010 0.1586
T1 12V 33.33% 0.0005 0.0001 0.0002 0.0004 0.0002 0.0002 0.0002 0.0002 0.0002 0.0002 0.0003 0.0012 0.1734
T1 24V 66.67% 0.0004 0.0001 0.0001 0.0001 0.0001 0.0001 0.0002 0.0002 0.0004 0.0008 0.0026 0.0105 0.1804
T1 36V 100% 0.0004 0.0005 0.0007 0.0007 0.0006 0.0007 0.0009 0.0011 0.0017 0.0031 0.0092 0.0320 0.1844
T2 24V 100% 0.0000 0.0001 0.0001 0.0003 0.0002 0.0002 0.0003 0.0004 0.0007 0.0014 0.0044 0.0171 0.1656
T3 24V 100% 0.0005 0.0001 0.0001 0.0001 0.0002 0.0002 0.0003 0.0004 0.0007 0.0016 0.0048 0.0184 0.1754
630VA
T4 5V 2.27% 0.0012 0.0003 0.0004 0.0007 0.0005 0.0005 0.0004 0.0005 0.0004 0.0004 0.0004 0.0004 0.1154
T4 12V 5.4% 0.0005 0.0001 0.0001 0.0002 0.0002 0.0001 0.0001 0.0001 0.0001 0.0001 0.0001 0.0002 0.2097
T4 22V 10% 0.0003 0.0000 0.0000 0.0001 0.0000 0.0000 0.0000 0.0000 0.0000 0.0001 0.0003 0.0015 0.3036
T4 42V 19.1% 0.0004 0.0001 0.0001 0.0004 0.0001 0.0001 0.0002 0.0003 0.0004 0.0009 0.0027 0.0105 0.3797
T4 110V 50% 0.0006 0.0014 0.0018 0.0028 0.0027 0.0034 0.0045 0.0061 0.0094 0.0161 0.0381 0.0959 0.4805
T4 220V 100% 0.0027 0.0121 0.0140 0.0165 0.0194 0.0237 0.0295 0.0383 0.0527 0.0827 0.1539 0.2639 0.5369
T5 230V 100% 0.0014 0.0081 0.0095 0.0114 0.0137 0.0171 0.0218 0.0291 0.0418 0.0673 0.1355 0.2453 0.5179
T6 220V 100% 0.0041 0.0147 0.0170 0.0199 0.0234 0.0284 0.0357 0.0459 0.0629 0.0945 0.1672 0.2777 0.5386
750kVA
T7 53V 13.25% 0.0001 0.0001 0.0001 0.0004 0.0003 0.0003 0.0003 0.0003 0.0004 0.0006 0.0014 0.0052 0.2845
T7 200V 50% 0.0003 0.0025 0.0029 0.0037 0.0043 0.0053 0.0067 0.0090 0.0128 0.0206 0.0436 0.0987 0.4307
T7 400V 100% 0.0033 0.0157 0.0178 0.0207 0.0241 0.0285 0.0347 0.0438 0.0588 0.0853 0.1533 0.2739 0.5328
T7 115V 50% 0.0001 0.0006 0.0008 0.0011 0.0012 0.0014 0.0019 0.0026 0.0041 0.0073 0.0187 0.0534 0.4343
T7 230V 100% 0.0001 0.0053 0.0062 0.0076 0.0090 0.0111 0.0142 0.0190 0.0270 0.0437 0.0895 0.1852 0.4343
1kVA
T8 5V 2.27% 0.0007 0.0005 0.0006 0.0007 0.0006 0.0006 0.0007 0.0007 0.0007 0.0007 0.0006 0.0006 0.1148
T8 12V 5.45% 0.0007 0.0001 0.0001 0.0002 0.0001 0.0001 0.0001 0.0001 0.0001 0.0001 0.0001 0.0002 0.1958

54
T8 24V 10.9% 0.0006 0.0000 0.0000 0.0001 0.0001 0.0000 0.0000 0.0000 0.0001 0.0001 0.0002 0.0008 0.274
T8 36V 16.36% 0.0005 0.0001 0.0001 0.0001 0.0001 0.0001 0.0001 0.0002 0.0003 0.0005 0.0016 0.0073 0.4106
T8 110V 50% 0.0007 0.0008 0.0010 0.0012 0.0015 0.0019 0.0025 0.0036 0.0057 0.0103 0.0268 0.0772 0.4811
T8 220V 100% 0.0021 0.0074 0.0087 0.0103 0.0125 0.0154 0.0197 0.026 0.0375 0.0599 0.1243 0.234 0.5124
3 phase
350VA
T9 230V 57.5% 0.0008 0.0015 0.0019 0.0023 0.0029 0.0034 0.0043 0.0058 0.0087 0.0146 0.0325 0.0786 0.4434
T9 400V 100% 0.0026 0.0111 0.0129 0.0150 0.0178 0.0211 0.0258 0.0332 0.0450 0.0676 0.1217 0.2220 0.4734
T9 230V 57.5% 0.0011 0.0038 0.0045 0.0054 0.0069 0.0080 0.0102 0.0134 0.0192 0.0308 0.0611 0.1241 0.4022
T9 400V 100% 0.0058 0.0242 0.0273 0.0313 0.0367 0.0427 0.0517 0.0638 0.0827 0.1180 0.1990 0.3156 0.5595
T9 230V 57.5% 0.0030 0.0037 0.0054 0.0069 0.0075 0.0087 0.0108 0.0141 0.0199 0.0313 0.0612 0.1255 0.4003
T9 400V 100% 0.0077 0.0243 0.0276 0.0324 0.0372 0.0432 0.0515 0.0643 0.0847 0.1200 0.2009 0.3169 0.5571
1.2kVA
T10 24V 57.1% 0.0004 0.0001 0.0001 0.0002 0.0002 0.0001 0.0001 0.0001 0.0001 0.0001 0.0003 0.0013 0.1056
T10 42V 100% 0.0005 0.0002 0.0003 0.0002 0.0002 0.0002 0.0002 0.0003 0.0003 0.0006 0.0019 0.0074 0.1062
5kVA
T11 100% 0.0011 0.0002 0.0004 0.0004 0.0004 0.0004 0.0004 0.0003 0.0003 0.0003 0.0004 0.0011 0.0377
20kVA
T12 100% 0.0002 0.0008 0.0009 0.0011 0.0015 0.0019 0.0032 0.0044 0.0071 0.0136 0.0378 0.1124 0.4241
40kVA
T13 100% 0.0000 0.0003 0.0004 0.0005 0.0006 0.0008 0.0012 0.0019 0.0033 0.0068 0.0223 0.0684 0.2763
Table 3.14. The SSMMRE results for all transformers
SSMMRE Wind.% 15kΩ 5kΩ 4.5kΩ 4kΩ 3.5kΩ 3kΩ 2.5kΩ 2kΩ 1.5kΩ 1kΩ 500 Ω 200Ω 1Ω
400VA
T1 5V 13.89% 0.0005 0.0007 0.0009 0.0009 0.0008 0.0008 0.0007 0.0007 0.0007 0.0007 0.0007 0.0007 0.1422
T1 12V 33.33% 0.0004 0.0001 0.0001 0.0003 0.0002 0.0002 0.0002 0.0002 0.0002 0.0002 0.0003 0.0012 0.1729
T1 24V 66.67% 0.0004 0.0001 0.0001 0.0001 0.0001 0.0001 0.0002 0.0002 0.0004 0.0008 0.0025 0.0105 0.1804
T1 36V 100% 0.0004 0.0005 0.0006 0.0006 0.0006 0.0007 0.0008 0.0011 0.0016 0.0031 0.0091 0.0317 0.1844
T2 24V 100% 0.0000 0.0001 0.0001 0.0002 0.0002 0.0002 0.0003 0.0004 0.0007 0.0013 0.0043 0.0165 0.1654
T3 24V 100% 0.0005 0.0001 0.0001 0.0001 0.0002 0.0002 0.0003 0.0004 0.0007 0.0015 0.0046 0.0174 0.1741
630VA
T4 5V 2.27% 0.0012 0.0003 0.0004 0.0007 0.0005 0.0005 0.0004 0.0005 0.0004 0.0004 0.0004 0.0004 0.1150
T4 12V 5.4% 0.0005 0.0001 0.0001 0.0002 0.0002 0.0001 0.0001 0.0001 0.0001 0.0001 0.0001 0.0002 0.2093
T4 22V 10% 0.0003 0.0000 0.0000 0.0001 0.0000 0.0000 0.0000 0.0000 0.0000 0.0001 0.0003 0.0015 0.3019
T4 42V 19.1% 0.0004 0.0001 0.0001 0.0003 0.0001 0.0001 0.0002 0.0003 0.0004 0.0009 0.0027 0.0105 0.3781

55
T4 110V 50% 0.0006 0.0014 0.0018 0.0024 0.0027 0.0034 0.0045 0.0061 0.0094 0.0161 0.0375 0.0915 0.4594
T4 220V 100% 0.0026 0.0121 0.0140 0.0164 0.0194 0.0236 0.0293 0.0380 0.0518 0.0798 0.1434 0.2536 0.5310
T5 230V 100% 0.0014 0.0080 0.0095 0.0113 0.0136 0.0170 0.0215 0.0286 0.0407 0.0640 0.1228 0.2279 0.5076
T6 220V 100% 0.0041 0.0147 0.0170 0.0199 0.0234 0.0283 0.0356 0.0456 0.0621 0.0922 0.1602 0.2716 0.5350
750kVA
T7 53V 13.25% 0.0001 0.0001 0.0001 0.0003 0.0003 0.0003 0.0003 0.0003 0.0004 0.0006 0.0014 0.0052 0.2838
T7 200V 50% 0.0003 0.0024 0.0029 0.0036 0.0043 0.0052 0.0067 0.0089 0.0128 0.0205 0.0435 0.0982 0.4297
T7 400V 100% 0.0033 0.0157 0.0178 0.0207 0.0240 0.0285 0.0346 0.0437 0.0585 0.0843 0.1480 0.2586 0.5270
T7 115V 50% 0.0001 0.0006 0.0007 0.0010 0.0012 0.0014 0.0019 0.0026 0.0041 0.0073 0.0187 0.0530 0.4261
T7 230V 100% 0.0009 0.0053 0.0062 0.0075 0.0090 0.0111 0.0141 0.0190 0.0269 0.0434 0.0880 0.1807 0.4688
1kVA
T8 5V 2.27% 0.0007 0.0005 0.0006 0.0005 0.0004 0.0005 0.0006 0.0006 0.0007 0.0007 0.0006 0.0006 0.1138
T8 12V 5.45% 0.0006 0.0001 0.0001 0.0001 0.0001 0.0001 0.0001 0.0001 0.0001 0.0001 0.0001 0.0002 0.1953
T8 24V 10.9% 0.0007 0.0000 0.0000 0.0001 0.0000 0.0000 0.0000 0.0000 0.0001 0.0001 0.0002 0.0008 0.2732
T8 36V 16.36% 0.0007 0.0001 0.0001 0.0001 0.0001 0.0001 0.0001 0.0002 0.0003 0.0005 0.0016 0.0073 0.3973
T8 110V 50% 0.0007 0.0008 0.0010 0.0012 0.0015 0.0019 0.0025 0.0036 0.0057 0.0103 0.0262 0.0713 0.4534
T8 220V 100% 0.002 0.0074 0.0086 0.0103 0.0124 0.0153 0.0195 0.0257 0.0368 0.0576 0.1129 0.2155 0.5027
3 phase
350VA
T9 230V 57.5% 0.0007 0.0015 0.0019 0.0023 0.0028 0.0033 0.0043 0.0058 0.0087 0.0146 0.0324 0.0778 0.4183
T9 400V 100% 0.0025 0.0111 0.0129 0.0149 0.0177 0.0210 0.0258 0.0331 0.0448 0.0670 0.1191 0.2129 0.4669
T9 230V 57.5% 0.0010 0.0038 0.0045 0.0054 0.0067 0.0079 0.0101 0.0134 0.0192 0.0308 0.0608 0.1233 0.4015
T9 400V 100% 0.0057 0.0242 0.0272 0.0312 0.0364 0.0425 0.0514 0.0633 0.0816 0.1150 0.1886 0.3008 0.5515
T9 230V 57.5% 0.0030 0.0037 0.0054 0.0069 0.0075 0.0087 0.0108 0.0141 0.0199 0.0312 0.0608 0.1243 0.3990
T9 400V 100% 0.0077 0.0243 0.0275 0.0323 0.0371 0.0431 0.0512 0.0637 0.0833 0.1163 0.1889 0.3009 0.5479
1.2kVA
T10 24V 57.1% 0.0004 0.0001 0.0001 0.0002 0.0002 0.0001 0.0001 0.0001 0.0001 0.0001 0.0003 0.0013 0.1030
T10 42V 100% 0.0005 0.0002 0.0003 0.0002 0.0002 0.0002 0.0002 0.0003 0.0003 0.0006 0.0019 0.0074 0.1062
5kVA
T11 100% 0.0011 0.0002 0.0004 0.0004 0.0004 0.0004 0.0004 0.0003 0.0003 0.0003 0.0004 0.0011 0.0377
20kVA
T12 100% 0.0002 0.0008 0.0009 0.0011 0.0015 0.0019 0.0032 0.0044 0.0069 0.0132 0.0350 0.0974 0.4132
40kVA
T13 100% 0.0000 0.0003 0.0004 0.0005 0.0006 0.0008 0.0012 0.0018 0.0032 0.0063 0.0183 0.0525 0.2727

56
Table 3.15. The ρ results for all transformers
ρ Wind.% 15kΩ 5kΩ 4.5kΩ 4kΩ 3.5kΩ 3kΩ 2.5kΩ 2kΩ 1.5kΩ 1kΩ 500 Ω 200Ω 1Ω
400VA
T1 5V 13.89% 0.9998 0.9994 0.9992 0.9990 0.9991 0.9992 0.9992 0.9992 0.9992 0.9992 0.9992 0.9993 0.9717
T1 12V 33.33% 0.9998 0.9999 0.9999 0.9997 0.9999 0.9999 0.9999 0.9998 0.9999 0.9999 0.9999 0.9998 0.9672
T1 24V 66.67% 0.9998 1.0000 1.0000 1.0000 1.0000 1.0000 1.0000 0.9999 0.9999 0.9999 0.9995 0.9982 0.9672
T1 36V 100% 0.9998 0.9997 0.9996 0.9996 0.9997 0.9997 0.9997 0.9997 0.9996 0.9994 0.9985 0.9946 0.9673
T2 24V 100% 1.0000 1.0000 1.0000 0.9999 0.9999 1.0000 1.0000 0.9999 0.9999 0.9999 0.9995 0.9981 0.9785
T3 24V 100% 0.9996 0.9999 1.0000 1.0000 1.0000 1.0000 1.0000 1.0000 0.9999 0.9997 0.9994 0.9981 0.9797
630VA
T4 5V 2.27% 0.9998 0.9999 0.9999 0.9999 0.9999 0.9999 0.9999 0.9999 0.9999 0.9999 0.9999 0.9999 0.9851
T4 12V 5.4% 0.9999 1.0000 1.0000 1.0000 1.0000 1.0000 1.0000 1.0000 1.0000 1.0000 1.0000 1.0000 0.9706
T4 22V 10% 1.0000 1.0000 1.0000 1.0000 1.0000 1.0000 1.0000 1.0000 1.0000 1.0000 1.0000 0.9998 0.9508
T4 42V 19.1% 0.9999 1.0000 1.0000 0.9999 1.0000 1.0000 1.0000 1.0000 0.9999 0.9999 0.9996 0.9988 0.9308
T4 110V 50% 0.9999 0.9998 0.9998 0.9996 0.9997 0.9996 0.9995 0.9993 0.9989 0.9982 0.9962 0.9911 0.9115
T4 220V 100% 0.9997 0.9987 0.9985 0.9983 0.9980 0.9976 0.9971 0.9964 0.9952 0.9928 0.9869 0.9740 0.8954
T5 230V 100% 0.9999 0.9991 0.9990 0.9988 0.9986 0.9983 0.9979 0.9972 0.9962 0.9942 0.9885 0.9755 0.8946
T6 220V 100% 0.9997 0.9988 0.9987 0.9985 0.9982 0.9978 0.9973 0.9966 0.9954 0.9931 0.9873 0.9741 0.8906
750kVA
T7 53V 13.25% 1.0000 1.0000 1.0000 1.0000 1.0000 1.0000 1.0000 1.0000 0.9999 0.9999 0.9997 0.9991 0.9488
T7 200V 50% 0.9999 0.9995 0.9995 0.9993 0.9992 0.9991 0.9988 0.9985 0.9980 0.9970 0.9946 0.9894 0.9109
T7 400V 100% 0.9994 0.9976 0.9973 0.9969 0.9966 0.9961 0.9954 0.9945 0.9931 0.9907 0.9848 0.9716 0.8881
T7 115V 50% 1.0000 0.9999 0.9998 0.9998 0.9998 0.9997 0.9996 0.9995 0.9992 0.9987 0.9971 0.9930 0.9126
T7 230V 100% 0.9998 0.9990 0.9989 0.9987 0.9985 0.9981 0.9977 0.9971 0.9960 0.9941 0.9892 0.9782 0.9060
1kVA
T8 5V 2.27% 1 0.9999 0.9999 0.9998 0.9999 0.9999 0.9999 0.9999 0.9999 0.9999 0.9999 0.9999 0.9849
T8 12V 5.45% 1 1 1 1 1 1 1 1 1 1 1 1 0.9727
T8 24V 10.9% 1 1 1 1 1 1 1 1 1 1 1 0.9999 0.9576
T8 36V 16.36% 1 1 1 1 1 1 1 1 1 0.9999 0.9998 0.9991 0.9252
T8 110V 50% 1 0.9999 0.9998 0.9998 0.9998 0.9997 0.9996 0.9995 0.9992 0.9987 0.997 0.9924 0.9128
T8 220V 100% 0.9998 0.999 0.9989 0.9987 0.9984 0.9981 0.9976 0.997 0.9959 0.9938 0.9885 0.9772 0.9072
3 phase
350VA
T9 230V 57.5% 0.9998 0.9996 0.9995 0.9995 0.9993 0.9992 0.9991 0.9988 0.9983 0.9973 0.9949 0.9891 0.9046
T9 400V 100% 0.9994 0.9979 0.9975 0.9973 0.9967 0.9964 0.9958 0.9948 0.9933 0.9905 0.9836 0.9679 0.8797
T9 230V 57.5% 0.9998 0.9995 0.9994 0.9993 0.9991 0.9990 0.9988 0.9985 0.9979 0.9968 0.9942 0.9880 0.9180

57
T9 400V 100% 0.9993 0.9975 0.9972 0.9971 0.9963 0.9960 0.9953 0.9944 0.9929 0.9900 0.9825 0.9656 0.8709
T9 230V 57.5% 0.9996 0.9996 0.9994 0.9993 0.9992 0.9991 0.9989 0.9986 0.9981 0.9971 0.9948 0.9890 0.9203
T9 400V 100% 0.9992 0.9977 0.9976 0.9973 0.9969 0.9964 0.9958 0.9948 0.9935 0.9907 0.9837 0.9676 0.8729
1.2kVA
T10 24V 57.1% 0.9998 1.0000 0.9999 0.9999 0.9999 1.0000 1.0000 1.0000 1.0000 1.0000 1.0000 0.9998 0.9875
T10 42V 100% 0.9998 0.9999 0.9999 0.9999 0.9999 0.9999 0.9999 0.9999 0.9999 0.9999 0.9998 0.9991 0.9874
5kVA
T11 100% 0.9994 0.9999 0.9998 0.9997 0.9998 0.9998 0.9998 0.9998 0.9999 0.9999 0.9999 0.9999 0.9972
20kVA
T12 100% 1.0000 0.9999 0.9999 0.9998 0.9998 0.9997 0.9996 0.9994 0.9992 0.9984 0.9961 0.9892 0.9341
40kVA
T13 100% 1.0000 0.9999 0.9999 0.9999 0.9999 0.9998 0.9998 0.9996 0.9993 0.9987 0.9962 0.9889 0.9527
Table 3.16. The results of current flowing through the rheostat
Wind.% 15kΩ 5kΩ 4.5kΩ 4kΩ 3.5kΩ 3kΩ 2.5kΩ 2kΩ 1.5kΩ 1kΩ 500Ω 200Ω 1Ω
T8 5V 2.27% 0 0 0 0 0 0 0 0 0 0 0 0 -
T8 12V 5.45% 0 0 0 0 0 0 0 0 0 0 0 0 -
T8 24V 10.90% 0 0 0 0 0 0 0 0 0 0 0 0.022 -
T8 36V 16.36% 0 0 0 0 0 0 0 0 0 0 0.027 0.215 -
T8 110V 50% 0 0.021 0.022 0.025 0.029 0.035 0.042 - - - - - -
T8 220V 100% 0.025 0.048 0.057 0.064 0.085 - - - - - - - -
T7 5V 2.27% 0 0 0 0 0 0 0 0 0 0 0 0 -
T7 12V 5.45% 0 0 0 0 0 0 0 0 0 0 0 0 -
T7 22V 10% 0 0 0 0 0 0 0 0 0 0 0 0.022 -
T7 42V 19.1% 0 0 0 0 0 0 0 0 0 0.027 0.041 0.218 -
T7 110V 50% 0 0.024 0.027 0.029 0.035 0.043 0.055 - - - - - -

58
T7 220V 100% 0.025 0.048 0.057 0.064 0.085 - - - - - - - -
T1 5V 13.89% 0 0 0 0 0 0 0 0 0 0 0 0.029 -
T1 12V 33.33% 0 0 0 0 0 0 0 0 0 0 0 0.034 -
T1 24V 66.67% 0 0 0 0 0 0 0 0 0 0.024 0.031 0.054 -
T1 36V 100% 0 0.029 0.035 0.051 - - - - - - - - -

55
3.2 Criteria for each SIs
The results of the CC method for all transformers can be found in Table
3.1. Among the transformers, the 1 kVA transformer test results for all statistical
indices were analyzed as an example. However, the results for the other
transformers were taken into account when proposing the criteria. This
transformer had different voltage taps; thus, different percentages of the winding
could be evaluated. If the tap with the 5 V rating is used, then, based on the total
value of 220 V, the 5 V tap would be 2.2% of the entire winding or 2.2% of the
entire winding turns. With this ratio in mind, the 5/12/24/36/110/220 V winding
taps were examined. These taps are 2.2%/5.4%/11%/16%/50%/100% of the
winding, respectively.
Table 3.1 shows the calculated values for the CCs of all transformers. For
each voltage rating, the test was conducted with each resistance value; finding the
critical value for the CC was possible. Then, using this value as a reference, the
critical values for the other methods were found. Tables 3.1-3.15 show all the
statistical indices for the transformers. Although the results of the 1 kVA
transformer were taken as an example, the results of the other transformers were
taken into account.
Based on Table 3.1, the CC method results and the FRA traces, for a
winding percentage below 10%, all the rheostat values act as an open circuit. Only
the total winding short circuit had a significant effect on the FRA trace and on the

56
CC value, which means that a total short circuit of even 2.2% of the winding is
not tolerable. It was said before that FRA interpretation is visually interpreted by
an experts. Thus, to overcome this the current that flows through the rheostat was
measured. In emulation of disk-to-disk fault with the help of rheostat, the current
values that will pass through the rheostat will create the trace difference in
Frequency Response. That happens, because only current value is changing when
resistance is varying, not the structure or winding position. Therefore, the current
is the only thing that affects the Frequency Response. In that case, in order to find
criteria for interpretation the current that flows through the resistor should be
analyzed. Based on Table 3.16, where current values are presented we could see
that at different voltage levels the current appears at different resistances. The
higher the voltage level at higher resistances current starts to flow. It could be
seen that for 1kVA transformer the current appears at 200Ω at 24 V, at 500 Ω of
36 V, at 5 kΩ of 110 V and flows from 15 kΩ of 220 V. Using this information
as a reference for criteria the next step was to check these values at different SIs.
Thus, looking at the table of CC at the voltage and resistance levels of 1 kVA
transformer that told before. It could be seen that the values of CC before the
200Ω of 24 V, 500 Ω of 36 V, and 5 kΩ of 110 V all greater or equal to 0.9997.
Moreover, all that values of resistance at their voltage level were analyzed visually
also. And the Frequency Responses of the resistances mentioned above deviates
from the fingerprints more significantly than the rest of the Responses. Thus, it
could be said that proposed criteria was found with the help of current value,

57
proven by SIs and checked on FR. To find the critical value for the CC, the 36 V
and 110 V ratings of the 1 kVA transformer were used, as they have a definite
declining trend based on the decreasing resistance and this was the largest
transformer under test that would be energized. However, the proposed critical
values were also tested for the other transformers. In Figure 3.4, starting from 500
Ω, a significant deviation of the traces from the fingerprint can be observed. The
same significant deviation can be seen on Figure 3.5 starting from the 5 kΩ trace.
Thus, the values of the CC at these resistances were used as a boundary for the
critical value, which is 0.9996. Moreover, to verify this value, the other resistances
and their CC values were used.
Based on the fact that 15 kΩ is a significant resistance for 5.4% of the
winding of the 1 kVA transformer, it would act as an open circuit, and hence, the
value of the CC at this resistance is definitely in the range of the critical value.
Thus, the CC value of 0.9997 is in the range. Moreover, to prove this, the setup
shown in Figure 2.1 was used. The short circuit current that should flow through
the rheostat during resistance variation was measured. The Isc for 15 kΩ at this
voltage level was zero. At 500 Ω for 36 V and 5 kΩ for 110 V, the Isc started to
change from zero to 0.022 A, and thus, these circuits were not open circuits. The
short circuit current values of several transformer can be found in Table 3.16.
With the help of this testing of all the transformers and Table 3.1, for all CC values
above 0.9997, Isc was found to be zero. This result means that our critical value

58
for the CC is 0.9997. Moreover, based on a comparison with the critical value for
the CC from Nirgude et al. [34], which is 0.9998, it can be concluded that the
proposed value is reliable. Thus, for our case, the critical value for the CC was
chosen as 0.9997, which is close to Nirgude’s value. This critical value was
chosen as a reference for the detection of the critical values of other SIs. The same
resistance values at 36 V and 110 V for the 1 kVA transformer were also used for
the other methods. The results of these methods enable us to propose the
boundaries for the critical value range, and short circuit monitoring during
resistance variation helps us clearly find the boundary for an open circuit. Table
3.17 provides all the statistical indices critical for examining faults in
transformers. They can be used to determine whether the transformer is healthy.
Table 3.17. The critical values of SIs for fault detection
Index CC SD SSE ASLE DABS RMSE ED ρ
Value <0.9997 >1 >1 >0.125 >0.6 >0.04 >30 <0.9999
Index CD CSD CCF MAX MM SSRE SSMMRE
Value invalid >1 <0.9975 invalid >1.0233 >0.0007 >0.0007
Based on the above table, the CD and MAX cannot act as criteria because
their behavior is not linear and cannot be described by certain trends. Therefore,
these two indices should not be used for our fault detection criteria. The other
indicators had a linear behavior and followed a certain trend, so we can relate
them to each other and, based on the CC value as the reference, create criteria for
them.

59
These values help us identify whether a fault is present, which is why they
should be called critical values. Moreover, all values in the critical value ranges
are in the safe zone or green zone. However, sometimes, the transformer continues
to operate with some small fault, and in this situation, the term yellow zone should
be used. This is the zone in which the transformer can be used even with a fault
because the fault is not severe; however, for better exploitation, the fault should
be fixed. Otherwise, a severe fault or even damage that would take the transformer
out of service could occur.
To find the boundary values for the yellow zone, we used the idea that some
level of fault should be accepted and that the SI value for this level should then
be calculated as a reference for the yellow zone boundary. If for the critical value
or the green zone, we do not allow any current to flow through the resistor, then
the main contributor to changes in the frequency response is the short circuit
current. For the yellow zone, current flow or leakage should be allowed to some
extent. To identify this value, we refer to the differential relay used for
transformers. The differential relay compares the input and output currents of the
transformer and monitors the difference them because it should be in a specific
range at all times. A change in the current value indicates that some fault has
occurred that resulted in an increase of current that could further damage the
transformer. Thus, to prevent damage of equipment, differential relay trips and
transformers should be checked and repaired. As the differential relay usually

60
trips during severe faults, its current values cannot be used for our yellow
boundary case. However, if we make an analogy with the differential relay but for
smaller current values, then the principle for yellow boundary identification can
be found. The ABB company advises [62] to use for their differential relay 5% of
the nominal current as the tolerable range of current values during input/output
current monitoring. This means that even if the values of the currents should be
the same, some uncertainties or processes that affect the current could occur.
However, if the current variation is below 5%, it could be tolerated by the
differential relay. For our yellow boundary case, 10% of the suggested 5% percent
is taken for the current value; 5% of the nominal current is for severe faults, so if
we use 10% of this 5%, we reduce the severity of the fault significantly. At this
rate, which is 0.5% of the nominal current, the clear identification of the fault
would occur; however, due to its low value, the severity of the fault is not
significant, which describes our yellow zone. The fault is present, but the
transformer can operate in normal conditions; however, check-up is advised.
For the 630 VA transformer, the nominal current was 2.86 A, and for the 1
kVA transformer, it was 4.54 A. Therefore, the values of 0.0143 A and 0.0227 A
were used. Both of these current values were tested on the full winding percentage
of 220 V. Now, the current value was known, but the resistor value at which the
needed current flows through the rheostat was unknown. With the help of an
ammeter connected in series to the rheostat, we adjusted the current and measured

61
the rheostat value at this current. Therefore, for the FRA test, the needed
resistance was known.
During leakage or flow through the resistor of 0.005% of the nominal
current, the following CC values for this case were obtained.
Table23.18. The results of CC during 0.005% of nominal current flow through the rheostat
Transformer Current value Resistor Value CC
400VA 0.055A 4.6kΩ 0.9990
630VA 0.0143A 15.4kΩ 0.9991
1kVA 0.0227A 10.5kΩ 0.9989
Using Table 3.18 for CC analysis, we could state that a CC value of 0.9990
can be taken as a boundary for the yellow zone. This small difference can occur
due to uncertainties in the ammeter or ohmmeter or even small connection
deviations.
Using the frequency response results used for Table 18 for the other SI
value calculations, the obtained results for the yellow boundary values are
presented below.
Table 3.19. The SIs values for yellow border.
Index CC SD SSE ASLE DABS RMSE ED ρ
Value <0.9990 >2.1 >4.4 >0.245 >1.12 >0.07 >67 <0.9995
Index CD CSD CCF MAX MM SSRE SSMMRE
Value invalid >1.3 <0.9968 invalid >1.0354 >0.0009 >0.0009

62
Again, the MAX and CD were not used, as their values were not even
considered in determining the critical value for the green zone. The obtained
results suggest that, considering the two levels of critical values, which describe
the no-fault zone and the operation with a small fault zone, the SI values below
the yellow zone should be considered in the red zone and an indicator of a severe
fault that would lead to equipment failure.
Figure103.7. The criteria zone separation for 1kVA transformer
Figure 3.7 represents the outcomes of the research, where three zones
could be seen. For further use of these criteria shown by zones, it is needed to
obtain the frequency response of the equipment under test and compare its
numerical index with the tables given above. Based on the value, it will lie in
range of green zone, yellow or red. Based on the zone the current equipment
status would be defined. Using Figure 3.7, it could be said that all FR that would
lie in green zone, would have CC more than 0.9997 and would represent healthy
transformer. The FRs that have CC between 0.9997 and 0.9990 would lie in
yellow zone and signal that transformer has some sort of damage or improper
operation. Everything above the yellow zone considered as unhealthy
transformer, and requires in proper inspection. Figure 3.7 is given only for

63
visual understanding of the research outcome, however if the fault occurs in the
higher range of frequency, from 1-2MHz, the criteria will still be applicable.

64
CHAPTER 4 – CONCLUSION
It can be concluded that FRA analysis is a convenient way to identify the
mechanical defects of the transformer without opening transformer tank. It gives
an opportunity to determine the transformer condition in fast and convenient way.
The interpretation of healthy and unhealthy transformer frequency responses
could be done with the help of SIs. From this study, it is summarized that if
statistical indices would be standardized and their threshold values for comparison
is determined, the FRA spectra can be interpreted more accurately. This study
collected fifteen statistical indices and after practical measurement on different
transformers, the criteria for CC, ASLE, SD, SSE, DABS, RMSE, ED, CSD,
CCF, MM, SSRE, SSMMRE and ρ was obtained. Unfortunately, there are no
criteria for CD and MM, hence it could not be used for interpretations. These
critical values will be useful for unexperienced personnel to interpret the
frequency response of a transformer. The two level of critical values or zone
separation would allow to monitor the transformer life more accurately. The
criteria was made only based on the emulated disk-to-disk short circuit, which
leads to the weakness such as credibility of the criteria during other faults. The
strong point for the first criteria based on the current appearance is that it clearly
measures the factor that affects the FR, however, the ability of sensing only
current higher than 0.022 A is a drawback. Also the percentage chosen for the
second level is subjective.

65
For the future work, the different faults should be simulated, axial and radial
displacement, real turn-to-turn and disk-to-disk faults. And for those cases the
criteria should be tested, moreover, the transformers higher than 1kVA power
should be energized.

66
References
[1] M. Bagheri, M. Salay Naderi, T. Blackburn, and T. Phung, “Frequency Response
Analysis and Short-Circuit Impedance Measurement in Detection of Winding
Deformation Within Power Transformers,” IEEE Electical Insulation Magazine, vol. 29,
no. 3, pp. 33-40, 2013.
[2] V. Behjat and M. Mahvi, “Statistical approach for interpretation of power transformers
frequency response analysis results,” IET Science, Measurement & Technology, vol. 9,
no. 3, pp. 367-375, 2015.
[3] N. Wesley, S. Bhandari et. al “Evaluation of Statistical Interpretation Methods for
Frequency Response Analysis based Winding Fault Detection of Transformers,” IEEE
ICSET, pp. 36-41, 2016.
[4] Gomez-Luna, E., Aponte Mayor, G., Gonzalez-Garcia, C., et al.: ‘Current status and
future trends in frequency-response analysis with a transformer in service’, IEEE Trans.
Power Deliv., 2013, 28, (2), pp. 1024–1031
[5] M. Bagheri, M. S. Naderi, and T. Blackburn, “Advanced transformer winding
deformation diagnosis: moving from off-line to on-line,” IEEE Transactions on
Dielectrics and Electrical Insulation, vol. 19, no. 6, pp. 1860-1870, 2012.
[6] G. M. Kennedy, A. J. McGrail, and J.A. Lapworth, “Transformer sweep frequency
response analysis (SFRA),” Energize, pp. 28-33, 2007
[7] E. Rahimpour and S. Tenbohlen, "Experimental and theoretical investigation of disc
space variation in real high-voltage windings using transfer function method," IET
Electric Power Applications, vol. 4, no. 6, pp. 451-461, 2010.
[8] E. Rahimpour, M. Jabbari, and S. Tenbohlen, “Mathematical comparison methods to
assess transfer functions of transformers to detect different types of mechanical faults,”
IEEE Transactions on Power Delivery, vol. 25, no. 4, pp. 2544-2555, 2010.
[9] M. Samimi and S. Tenbohlen, “FRA interpretation using numerical indices: State-of-the-
art,” Elsevier EPES, pp. 115-125, 2017.
[10] A. Kraetge, M. Kruger, and P. Fong, "Frequency Response Analysis - Status of the
worldwide standardization activities," IEEE International Conference on Condition
Monitoring and Diagnosis, Beijing, China, pp. 651-654, 2008.
[11] E. P. Dick and C. C. Erven, "Transformer diagnostic testing by frequency response
analysis," IEEE Transactions on Power Apparatus and Systems, vol. PAS-97, pp. 2144-
2153, 1978.
[12] M. Gutten, M. Brandt, R. Polansky, and P. Prosr, “SFRA Method – Frequency Analysis
of Transformers”, MEASUREMENT International Conference, 2009.
[13] C. Sweetser and T. McGrail, “Sweep Frequency Response Analysis Transformer
Applications”, Doble Engineering, 2003.
[14] CIGRE SC 12 Transformer Colloquium: Summary on behalf of Study Committee 12,
Budapest, 1999

67
[15] S. Birlasekaran, Y Xingzhou., F. Fetherstone, ‘Diagnosis and identification of
transformer faults from frequency response data’, IEEE Power Eng. Rev., vol. 3, pp.
2251–2253, 2000.
[16] A. Kraetge, M. Kruger, J. Velasquez, H. Viljoen, and A. Dierks, “Aspects of the Practical
Application of Sweep Frequency Response Analysis (SFRA) on Power Transformers”,
CIGRE, 2009.
[17] IEEE C 57.149, “Guide for the Application and Interpretation of Frequency Response
Analysis for Oil Immersed Transformer”, 2013.
[18] IEC Standard 60076-18, “Measurement of Frequency Response”, Edition 1.0, 2012.
[19] Bagheri, Mehdi, et al. "FRA vs. short circuit impedance measurement in detection of
mechanical defects within large power transformer." Electrical Insulation (ISEI),
Conference Record of the 2012 IEEE International Symposium on. IEEE, 2012.
[20] S. V. Kulkarni and S. A. Khaparde, “Transformer Engineering Design and Practice,”
Marcel Dekker Inc., USA, 2004.
[21] G. Bertagnolli, “The ABB Approach to Short-circuit Duty of Power Transformers”, 3rd
ed., ABB Ltd., Switzerland, 1996.
[22] Jurisic, Bruno, et al. "High frequency transformer model derived from limited information
about the transformer geometry." International Journal of Electrical Power & Energy
Systems 94 (2018): 300-310.
[23] Ryder, Simon A. "Diagnosing transformer faults using frequency response
analysis." IEEE Electrical Insulation Magazine 19.2 (2003): 16-22.
[24] Bagheri, Mehdi, B. T. Phung, and Trevor Blackburn. "Transformer frequency response
analysis: mathematical and practical approach to interpret mid-frequency
oscillations." IEEE transactions on Dielectrics and Electrical Insulation 20.6 (2013):
1962-1970.
[25] Wang, Zhongdong, Jie Li, and Dahlina M. Sofian. "Interpretation of transformer FRA
responses—Part I: Influence of winding structure." IEEE Transactions on power
delivery 24.2 (2009): 703-710.
[26] Wang, M., Vandermaar, A.J. and Srivastava, K.D., 2004. “Transformer winding
movement monitoring in service-key factors affecting FRA measurements.” IEEE
Electrical Insulation Magazine, 20(5), pp.5-12.
[27] Bagheri, Mehdi, et al. "Case study on FRA capability in detection of mechanical defects
within a 400MVA transformer." CIGRE, Paris, France. 2012.
[28] Marks, J., Vitolina, S. and Liepniece, R., 2017, October. Modelling of vibrations caused
by magnetostriction in magnetic core of large power transformers. In Power and
Electrical Engineering of Riga Technical University (RTUCON), 2017 IEEE 58th
International Scientific Conference on (pp. 1-5). IEEE.
[29] Bagheri, M., Zollanvari, A. and Nezhivenko, S., 2018. Transformer Fault Condition
Prognosis Using Vibration Signals over Cloud Environment. IEEE Access.

68
[30] Bagheri, Mehdi, et al. "Bushing characteristic impacts on on-line frequency response
analysis of transformer winding." Power and Energy (PECon), 2012 IEEE International
Conference on. IEEE, 2012.
[31] Setayeshmehr, A., Akbari, A., Borsi, H., Gockenbach, E. and Fofana, I., 2007, August.
Winding Diagnostic by On-line Transfer Function Determination via Power Transformer
Bushing Tap. In 15th International Symposium on High Voltage Engineering, Ljubljana,
Slovenia.
[32] Bhardwaj, M., Choudhury, S., Xue, V. and Akin, B., 2014, March. Online LCL filter
compensation using embedded FRA. In Applied Power Electronics Conference and
Exposition (APEC), 2014 Twenty-Ninth Annual IEEE (pp. 3186-3191). IEEE.
[33] M.H. Samimi, et al. "Effect of different connection schemes, terminating resistors and
measurement impedances on the sensitivity of the FRA method." IEEE Transactions on
Power Delivery, vol 32, no. 4, pp. 1713-1720, 2017
[34] P. Nirgude, D. Ashokraju, A. Rajkumar, and B. Singh, “Application of numerical
evaluation techniques for interpreting frequency response measurements in power
transformers”, IET Science, Measurement & Technology, vol. 2, no. 5, pp. 275-285, 2008
[35] A.S. Murthy et al. "Investigation of the Effect of Winding Clamping Structure on
Frequency Response Signature of 11 kV Distribution Transformer." Energies, vol. 11,
no. 9, pp. 1-13, 2018
[36] R. K. Senobari and H. B. Javad Sadeh, "Frequency response analysis (FRA) of
transformers as a tool for fault detection and location: A review." Electric Power Systems
Research, vol. 155, pp. 172-183, 2018
[37] J. A. S. B. Jayasinghe, Z. D. Wang, P. N. Jarman, and A. W. Darwin, “Winding movement
in power transformers: a comparison of FRA measurement connection methods," IEEE
Trans. Dielectr. Electr. Insul., Vol. 13, pp. 1342-1349, 2006.
[38] Y. Liu, S. Ji, F. Yang, Y. Cui, L. Zhu, Z. Rao, C. Ke, and X. Yang, “A study of the sweep
frequency impedance method and its application in the detection of internal winding short
circuit faults in power transformers," IEEE Trans. Dielectr. Electr. Insul., Vol. 22, pp.
2046-2056, 2015
[39] P. Picher, et al., “Current state of transformer FRA interpretation: On behalf of CIGRE
WG A2.53.” Procedia engineering, vol. 202, pp. 3-12, 2017
[40] N. Hashemnia, A. Abu-Siada, and S. Islam, “Improved power transformer winding fault
detection using FRA diagnostics–part 1: axial displacement simulation.” IEEE
transactions on dielectrics and Electrical insulation, vol. 22, no. 1, pp. 556-563, 2015.
[41] A. Abu-Siada, N. Hashemnia, S. Islam, and M. A. S. Masoum, “Understanding power
transformer frequency response analysis signatures," IEEE Electr. Insul. Mag., Vol. 29,
pp. 48-56, 2013.
[42] M. H. Samimi, S. Tenbohlen, A. A. S. Akmal, and H. Mohseni, “Evaluation of numerical
indices for the assessment of transformer frequency response." IET Generation,
Transmission & Distribution, vol.11 no.1, pp. 218-227, 2017.
69
[43] Samimi, M.H., Tenbohlen, S., Shayegani-Akmal, A.A., et al.: ‘Using the complex values
of the frequency response to improve power transformer diagnostics’. 24th Iranian Conf.
on Electrical Engineering (ICEE2016), Shiraz, Iran, May 2016
[44] N. K. Wesley, S. Bhandari, A. Subramaniam, M. Bagheri, and S. K. Panda, “Evaluation
of statistical interpretation methods for frequency response analysis based winding fault
detection of transformers”. Sustainable Energy Technologies (ICSET), 2016 IEEE
International Conference, pp. 36-41, 2016.
[45] M. H. Samimi, and S. Tenbohlen, “The Numerical Indices Proposed for the Interpretation
of the FRA Results: a Review.” VDE High Voltage Technology 2016, ETG-Symposium,
pp. 1-7, 2016.
[46] M. Bagheri, B. Phung, and T. Blackburn, “Influence of temperature and moisture content
on frequency response analysis of transformer winding”, IEEE Transactions on
Dielectrics and Electrical Insulation, vol 21, no. 3, pp. 1393-1404, 2014.
[47] K. P. Badgujar, M. Maoyafikuddin, and S. Kulkarni, “Alternative statistical techniques
for aiding SFRA diagnostics in transformers”, IET Generation, Transmission &
Distribution, vol. 6, pp. 189-198, 2012.
[48] J. Secue and E. Mombello, “Sweep frequency response analysis (SFRA) for the
assessment of winding displacements and deformation in power transformers’, Electric
Power Systems Research, vol. 78, no. 6, pp. 1119-1128, 2008.
[49] M. Heindl, S. Tenbohlen, A. Kraetge, M. Kruger, and J. Velasquez, “Algorithmic
determination of pole-zero representations of power transformers transfer functions for
interpretation of FRA data”, 16th International Symposium on High Voltage Engineering,
2009.
[50] E. Rahimpour, and D. Gorzin, “A new method for comparing the transfer function of
transformers in order to detect the location and amount of winding faults’, Electrical
Engineering, vol. 88, no. 5, pp. 411-416, 2006.
[51] A. J. Ghanizadeh and G. B. Gharehpetian, “ANN and cross-correlation based features for
discrimination between electrical and mechanical defects and their localization in
transformer winding”, IEEE Trans.on Dielectrics and Electrical Insulation, vol. 21, no.
5, pp. 2374-2382, 2014
[52] J. W. Kim, B. Park, S. C. Jeong, S. W. Kim, and P. Park, “Fault diagnosis of a power
transformer using an improved frequency-response analysis”, IEEE Transactions on
Power Delivery, vol. 20, no. 1, pp. 169-178, 2005.
[53] R. Wimmer , S. Tenbohlen, M. Heindl, A. Kraetge, M. Kruger, and J. Christian,
“Development of algorithms to assess the FRA”, 15th International Symposium on High
Voltage Engineering, 2007.
[54] W. Tang, A. Shintemirov, and Q. Wu, “Detection of minor winding deformation fault in
high frequency range for power transformer", IEEE PES general meeting, pp. 1-6, 2010.
[55] T. Ji, W. Tang, Q. Wu, “Detection of power transformer winding deformation and
variation of measurement connections using a hybrid winding model”, Electric Power
Systems Research, vol. 87, pp. 39-46, 2012.

70
[56] J. Bak-Jensen, B. Bak-Jensen, and S. Mikkelsen, “Detection of faults and ageing
phenomena in transformers by transfer functions”, IEEE Transactions on Power
Delivery, vol. 10, no. 1, pp. 308-314, 1995.
[57] A. Islam, S. I. Khan, and A. Hoque, "Detection of mechanical deformation in old aged
power transformer using cross correlation co-efficient analysis method”, Scientific
Research EPE, pp. 585-591, 2011.
[58] G. M. Kennedy, A. J. McGrail, and J.A. Lapworth, “Using cross-correlation coefficients
to analyze transformer sweep frequency response analysis (SFRA) traces”, IEEE Power
Engineering Society Conference and Exposition in Africa - PowerAfrica, 2007.
[59] IEEE Guide for the Application and Interpretation of Frequency Response Analysis for
Oil-Immersed Transformers, IEEE Std. C57.149-2012, pp. 1–72, 2013
[60] Wimmer, R., Tenbohlen, S., Feser, K., et al.: ‘The influence of connection and grounding
technique on the repeatability of FRA-results’. Proc. 15th Int. Symp. on High Voltage
Engineering, Ljubljana, Slovenia, August 2007, T7-522
[61] V. Behjat, M. Mahvi and E. Rahimpour, "New statistical approach to interpret power
transformer frequency response analysis: non-parametric statistical methods." IET
Science, Measurement & Technology, vol. 10, no. 4, pp. 364-369, 2016
[62] ABB 1MRS 755916, “Differential Protection RET 54_/Diff6T function”, Application
and Setting Guide, ver. A/17.08.2005, 2005

71
Appendix
Figure 1A. Transformer 0.4kVA 5 V
Figure 2A. Transformer 0.4kVA 12 V

72
Figure 3A. Transformer 0.4kVA 24 V
Figure 4A. Transformer 0.4kVA 36 V

73
Figure 5A. Transformer 0.4kVA 24 V
Figure 6A. Transformer 0.75kVA 53 V

74
Figure 7A. Transformer 0.75kVA 200 V
Figure 8A. Transformer 0.75kVA 400 V
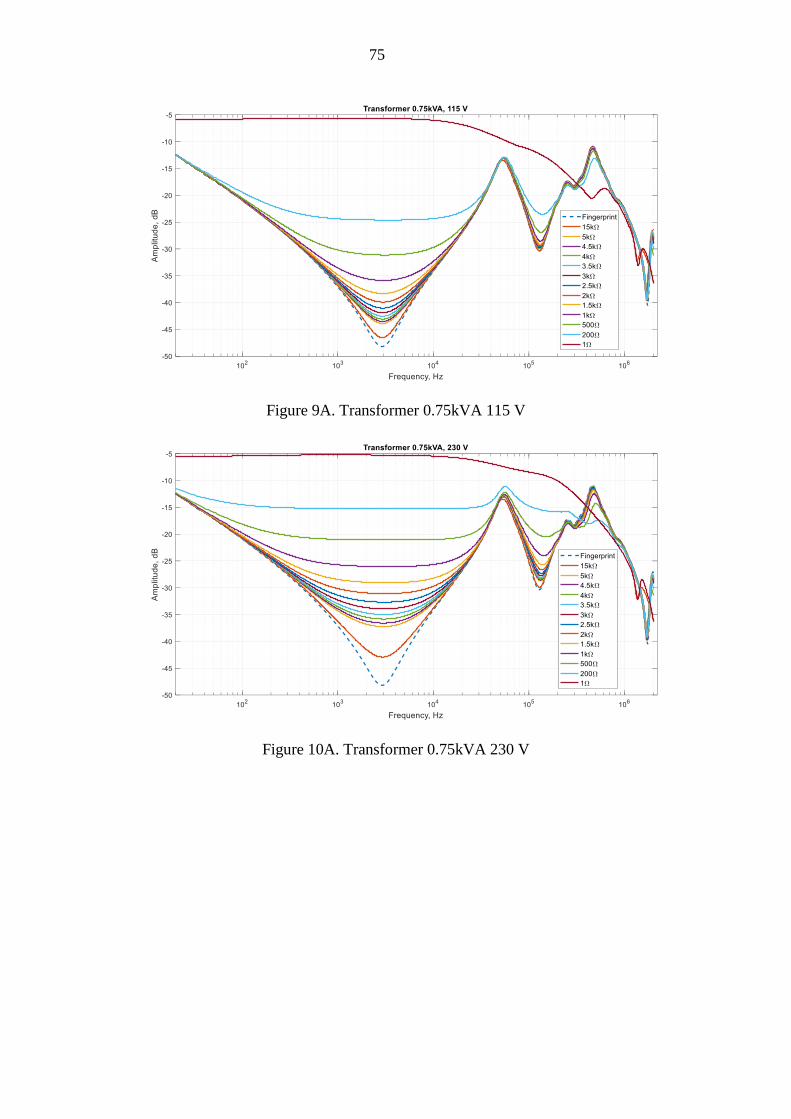
75
Figure 9A. Transformer 0.75kVA 115 V
Figure 10A. Transformer 0.75kVA 230 V

76
Figure 11A. Transformer 20kVA
Figure 12A. Transformer 0.4kVA 24 V

77
Figure 13A. Transformer 0.63kVA 5 V
Figure 14A. Transformer 0.63kVA 12 V

78
Figure 15A. Transformer 0.63kVA 22 V
Figure 16A. Transformer 0.63kVA 42 V

79
Figure 17A. Transformer 0.63kVA 110 V
Figure 18A. Transformer 0.63kVA 220 V

80
Figure 19A. Transformer 0.63kVA 230 V
Figure 20A. Transformer 0.63kVA 220 V

81
Figure 21A. Transformer 0.35kVA 230 V
Figure 22A. Transformer 0.35kVA 400 V

82
Figure 23A. Transformer 0.35kVA 230 V
Figure 24A. Transformer 0.35kVA 400 V

83
Figure 25A. Transformer 5kVA
Figure 26A. Transformer 40kVA
Related Documents