Exploring relationships between oral reading fluency and reading comprehension amongst English second language readers in South Africa Elizabeth J. Pretorius 1 • Nic Spaull 2 Ó Springer Science+Business Media Dordrecht 2016 Abstract Most analyses of oral reading fluency (ORF) are based on L1 reading, and the norms that have been developed in English are based on first language reading data. This is problematic for developing countries where many children are learning in English as a second language. The aim of the present study is to model the relationship between English reading fluency and comprehension among rural English-second-language learners (ESL) in South Africa. We use data collected in 2013 by the National Education and Evaluation Development Unit in South Africa. This survey tested 4697 Grade 5 students from 214 schools across rural areas in South Africa. A sub-sample—1772 students—were selected for an ORF test. For these students there exist data on both reading comprehension and reading fluency. Although a number of studies have analyzed the relationship between fluency and comprehension, none have been conducted on a large-scale for ESL learners in a developing country such as South Africa. The present research contributes to the literature by analysing the size, significance and uniformity of this relationship for ESL learners in South Africa. Preliminary findings indicate a threshold at 70 words- read-correct-per-minute which is lower than the typically used threshold of 90 words-read-correct-per-minute of English first language readers. Keywords Decoding Oral reading fluency Reading comprehension English second language readers Grade 5 readers & Elizabeth J. Pretorius [email protected] Nic Spaull [email protected] 1 Department of Linguistics and Modern Languages, University of South Africa, PO Box 392, Pretoria, South Africa 2 SARChI Chair in Integrated Studies of Learning Language, Mathematics and Science in the Primary School, University of Johannesburg, Johannesburg, South Africa 123 Read Writ DOI 10.1007/s11145-016-9645-9 Author's personal copy

Welcome message from author
This document is posted to help you gain knowledge. Please leave a comment to let me know what you think about it! Share it to your friends and learn new things together.
Transcript

Exploring relationships between oral reading fluencyand reading comprehension amongst English secondlanguage readers in South Africa
Elizabeth J. Pretorius1 • Nic Spaull2
! Springer Science+Business Media Dordrecht 2016
Abstract Most analyses of oral reading fluency (ORF) are based on L1 reading,and the norms that have been developed in English are based on first languagereading data. This is problematic for developing countries where many children arelearning in English as a second language. The aim of the present study is to modelthe relationship between English reading fluency and comprehension among ruralEnglish-second-language learners (ESL) in South Africa. We use data collected in2013 by the National Education and Evaluation Development Unit in South Africa.This survey tested 4697 Grade 5 students from 214 schools across rural areas inSouth Africa. A sub-sample—1772 students—were selected for an ORF test. Forthese students there exist data on both reading comprehension and reading fluency.Although a number of studies have analyzed the relationship between fluency andcomprehension, none have been conducted on a large-scale for ESL learners in adeveloping country such as South Africa. The present research contributes to theliterature by analysing the size, significance and uniformity of this relationship forESL learners in South Africa. Preliminary findings indicate a threshold at 70 words-read-correct-per-minute which is lower than the typically used threshold of 90words-read-correct-per-minute of English first language readers.
Keywords Decoding ! Oral reading fluency ! Reading comprehension ! Englishsecond language readers ! Grade 5 readers
& Elizabeth J. [email protected]
1 Department of Linguistics and Modern Languages, University of South Africa,PO Box 392, Pretoria, South Africa
2 SARChI Chair in Integrated Studies of Learning Language, Mathematics and Science in thePrimary School, University of Johannesburg, Johannesburg, South Africa
123
Read WritDOI 10.1007/s11145-016-9645-9
Author's personal copy

Introduction
In South Africa approximately 15 % of total government expenditure is spent oneducation, making it the largest single line-item in the budget. Yet despite thecountry’s generous investment in education, it is by now well documented thatSouth Africa is producing learners with very low literacy and numeracy levels(Fleish, 2008; Howie, Van Staden, Tshele, Dowse, & Zimmerman 2012; Spaull,2013). Learner performance in numeracy and literacy, specifically reading literacy,is typically used as an index of how well an education system is performing. YetSouth African learners perform abysmally poorly regardless of whether reading isassessed in African home languages, English or Afrikaans.
Results from large scale national systemic literacy assessments in the first decadeof this century first alerted the public to the literacy crisis in South African schools(Department of Education, 2005). Further converging international and national largescale evidence of poor literacy performance comes from South Africa’s participationin the Progress in International Reading Literacy Study (PIRLS) which assessesreading comprehension at Grade 4/5 level (2006 and 2011), the Southern and EastAfrican Consortium for Monitoring Educational Quality (SACMEQ) which assessednumeracy and literacy at Grade 6 in 2000 and 2007, and the National SchoolEffectiveness Study (NSES), which looked at Grades 3–5 from 2007 to 2009.
South Africa has 11 official languages. The majority of learners do the first3 years of schooling (the Foundation Phase) in the first or home language (L1) aslanguage of learning and teaching (LoLT). Besides English and Afrikaans, there arenine African languages that serve as LoLT in the Foundation Phase. In theseschools, English is introduced as a First Additional Language (or L2) in Grade 1 andthe transition to English as LoLT occurs in Grade 4. This is shown graphically inFig. 1 below which uses national assessment data to show the language of learning,teaching and assessment and how this changes over the grades in South Africa.
For the majority of black learners, their African home language continues to betaught as a school subject until the end of schooling, Grade 12, while English serves
6% 5% 5% 8% 8% 8%
0% 0% 0% 0%
9% 8% 8%
9% 9% 9% 8%
9% 8% 8%
0%
13% 22% 20%
1% 0% 0%
23% 19% 19%
0% 0% 0% 0%
23% 23% 24%
90% 90% 90% 91%
0%10%20%30%40%50%60%70%80%90%
100%
Gr1 Gr2 Gr3 Gr4 Gr5 Gr6 Gr9
EnglishisiZuluisiXhosaSepediAfrikaansSetswanaSesothoXitsongasiSwatiVenda
Fig. 1 Breakdown of the language of learning, teaching and assessment by grade—Annual NationalAssessment (ANA) 2013 various grades (n = 7,630,240)
E. J. Pretorius, N. Spaull
123
Author's personal copy

as the LoLT. Despite having an early-exit model, South Africa at least uses anAfrican home language as LoLT for the first 3 years of school. Even so, thepromised benefits of home language schooling are not fully realised, since literacylevels remain low in whatever language literacy is tested. For example, Spaull(2015) found that in a matched sample of 3402 Grade 3 learners from the Systemicand the National School Effectiveness Study assessments administered a monthapart in 2007, the learners achieved a mean score of 23 % in Grade 3 Englishreading, and 34 % in their African home language on the same test. The PIRLSassessments in both 2006 and 2011 show extremely low reading levels in Grade 4,especially in the African languages (Venter, van Staden, & Du Toit 2008; Howieet al., 2012). In 2011 Grade 4 learners (n = 15,744) participated across all theprovinces. This time the prePIRLS assessment was used in all 11 languages, whereshorter, easier texts are used. One out of three South African learners (29 %) couldnot reach the Low International benchmark; the majority (58 %) could not reach theIntermediate International Benchmark. Those tested in the African languagesperformed very poorly, with a high percentage of learners not able to read at themost basic level (e.g., 57 % in Northern Sotho and 53 % in Venda, Howie et al.,2012: 27–29).
The large scale evidence of poor literacy performance in South Africa fromPIRLS naturally evoked no small measure of national self reflection, and anacknowledgement of the glaring fact that comprehension is a much neglected area.There is plenty of anecdotal evidence of teachers focusing primarily on code-basedreading activities in the classroom and neglecting meaningful literacy practices. Afew small studies of teachers in Grade 1–3 classrooms (e.g., Gains, 2010; Verbeek,2010) showed links between the early literacy experiences of teachers, theirconceptualisations of literacy and their consequent practices of literacy as anarrowly constrained code-based activity with little attention to meaning. Thetendency of teachers to rely on whole class oral chorusing of reading, the lack ofreading resources, especially in African languages, the lack of reading homework,lack of individual reading assessment, and minimal reading of extended texts in theearly grades have also been identified as instructional practices that contribute topoor reading development (Pretorius & Mokhwesana, 2009; Zimmerman & Smit,2014; Pretorius, 2015).
While local research has identified numerous contributory variables to our poorlyfunctioning educational system at the macro level (e.g., the deleterious historicallegacy of apartheid education, socioeconomic factors, poorly qualified teachers) andat school level (e.g., poorly resourced and poorly managed schools, teacherabsenteeism, inadequate time on task, inadequate lesson planning), there has notbeen a great deal of research on early reading instruction in South Africanclassrooms, and how literacy is enacted in such spaces. Many educationstakeholders in South Africa might argue that ‘‘too much time’’ is spent ondecoding and ‘‘too little time’’ is spent on meaning and comprehension. However,time spent on an activity in the classroom does not necessarily equate with effectiveinstruction. The relationship between the development of decoding and compre-hension abilities of children in a bilingual education system needs to be moreclosely investigated, especially when most of the children do their schooling after
Exploring relationships between oral reading fluency and…
123
Author's personal copy

Grade 4 in a language which is not their L1. The large scale PIRLS results certainlyreveal poor comprehension abilities in both L1 and L2 readers, but at the same time,poor comprehension inevitably also raises questions about basic reading abilities. Ifchildren struggle even with literal comprehension in the L1 or L2, then maybe it isbecause they can barely decode the texts that they are expected to read.
There is a need to better understand L2 reading in developing countrymultilingual education contexts, especially when the larger socioeconomic,community and school milieus differ substantially from those of more affluentand highly literate educational contexts of the North. This paper examines therelationship between oral reading fluency and comprehension abilities of Englishsecond language (ESL) Grade 5 rural learners in South Africa. Since fluency isregarded as the bridge between decoding and comprehension, it can potentially shedlight on the what, where and how aspects of ESL reading development within oureducation system.
Literature overview
Fluency in general refers to the ability to read texts ‘‘with freedom from wordidentification problems that might hinder comprehension’’ (Harris & Hodges 1985,in Chard, Pikulski, & McDonough 2006, p. 40). It applies to both oral and silentreading and is a marker of skilled reading-with-comprehension. Fluency is typicallymeasured by asking a reader to read a selected passage for comprehension andnoting how many words are read within a specified time. Although fluency is afairly stable trait in skilled readers, reading rate can be affected by factors such astopic familiarity, text coherence and the density or abstract nature of the informationin the text.
Much of the focus of fluency research has been on oral reading fluency (ORF),specifically during the primary school years. ORF refers to the ability to read aloudwith accuracy and speed and with meaningful oral expression, with the reader’svoice reflecting the prosody and intonation of spoken language. In contrast,nonfluent readers read slowly and laboriously, in a stilted and monotonous tone,often stopping to stare at words or sound them out (Fuchs, Fuchs, Hosp, & Jenkins2001; Spear-Swerling, 2006; Rasinski & Mraz, 2008). They have difficultychunking the stream of written text into appropriate syntactic phrases. Somenonfluent readers may read words correctly, but do so slowly and without muchexpression.
ORF is measured in different ways, for example, (1) timed reading of a list ofwords of increasing length and complexity; (2) timed reading of a list of nonwords(to assess decoding without lexical access); and/or (3) timed reading of a text (i.e.reading in context). In each case, words erroneously read are noted and subtractedfrom the total number of words read in a minute. This gives a score of words correctper minute (WCPM), thereby reflecting both accuracy and speed. Although prosodyis an integral part of ORF when reading a text, it is more difficult to assess and soORF measures tend to reflect only speed and accuracy.
E. J. Pretorius, N. Spaull
123
Author's personal copy

In the early stages of reading, young children in Grade 1 start off by reading textslowly and haltingly. Factors such as age, reading skill and text difficulty can affectORF. The nature of a language (e.g., analytic or agglutinating) and its orthographicsystem (transparent or opaque spelling) can also affect reading rates.
The ORF norms referred to in this article refer to English ORF norms and are nottransferrable to other languages. According to English L1 fluency norms, by the endof Grade 1 children at the 50th percentile read at about 53 WCPM, increasing to 89WCPM at the end of Grade 2, 107 WCPM by the end of Grade 3, and 139 by theend of Grade 5 (Hasbrouck & Tindal, 2006). There is considerable variation, withORF differing by 80-100 WCPM within a grade. Mathson, Allington, and Solic(2006) found that accuracy first emerges, then children read with increasingautomaticity, and prosodic features of intonation, pitch, stress and observance ofpunctuation cues occur.
Many studies have investigated the precursors to early reading skills that in turnlead to fluency. Phonological awareness in general and phonemic awareness inparticular, knowledge of letters and letter-sound relations, and word recognitionskills are all subskills on which fluency is based. Preschool children with greatersensitivity to the sound structure of words learn to read more easily than childrenwho lag behind in phonological awareness (Adams, 1990; Chiappe & Siegel, 1999;Bus & van Ijzendoorn, 1999; National Reading Panel, 2000; Silven, Poskiparta, &Niemi 2004). The link between phonological awareness and reading ability has beenshown in languages such as English, Dutch, French, Finnish and German, andlocally, too, in Northern Sotho (Wilsenach, 2015) as well as Zulu (Pretorius, 2015).Phonological awareness also seems to transfer across languages (Muter & Diethelm,2001; Geva & Zadeh, 2006).
Oral language skills, including expressive vocabulary knowledge and under-standing syntactic and morphological forms, have also been shown to predict earlyreading (Hart & Risley, 2003; Snow, Burns, & Griffin 1998; Wilsenach, 2015).However, fluency involves more than recognising words quickly and effortlessly; italso includes chunking units of words in text into meaningful phrases, taking note ofmorphology and punctuation while reading, as well as processing meaningfulconnections within and between sentences. Through exposure and repeated practice,readers learn to integrate intonational patterns that help to mark syntactic phrasingwithin and across sentence boundaries. This in turn further enables comprehension.It is for such reasons that fluency is considered to be the ‘bridge’ to readingcomprehension. If the multiple components of reading are not well developed, thenthe overall efficiency of the reading process is compromised. While phonologicalawareness and knowledge of letter-sound relationships are important predictors ofearly reading development, by Grade 3 their influence diminishes as other skills atthe lexical and text level exert greater influence.
Explanations of the way in which complex behaviour comprising differentsubcomponents is orchestrated efficiently and seamlessly rely on notions ofautomaticity and the extent to which cognitive processes demand attention (e.g.,LaBerge & Samuels, 1974; Perfetti, 1988; Stanovich, 1986). When readers spendtoo much time and attention trying to figure out the lower levels of reading, thencomprehension is compromised. The notion of ‘freeing up resources’ is a useful
Exploring relationships between oral reading fluency and…
123
Author's personal copy

metaphor for describing the rapid and effortless way that fluent readers readconnected text, with little apparent conscious attention to the mechanics of reading.
Fluency and comprehension
There is a strong empirical basis attesting to a relationship between fluency andreading comprehension. ORF in particular, defined in terms of accuracy and speedin reading connected text, has been found to be a reliable indicator of readingcomprehension (e.g., Pinnel et al., 1995; Spear-Swerling, 2006). Fuchs et al. (2001)report high correlations between ORF and various kinds of reading comprehensionmeasures such as high stakes state-mandated comprehension tests, as well as avariety of comprehension tests using different formats (e.g., multiple choice, openquestions, cloze procedures or story recall protocols). The relationship obtainsacross schools serving children from different socioeconomic backgrounds orinstructional programmes, and can be found in children without reading difficultiesas well as those with learning disabilities (Deno, Fuchs, Marston, & Shin 2001;Wolf & Katzir-Cohen, 2001).
Developmentally, the greatest growth in ORF typically occurs in the early schoolyears, between Grades 1–4. The strong correlation between ORF and readingcomprehension levels off as children get older, with a ‘‘negatively acceleratingcurve’’ during the later primary school and early high school years (Fuchs et al.,2001; Spear-Swerling, 2006). The levelling-off effect in the later grades is attributedto the changing nature of reading development. Once basic reading skills have beenautomated and reading is relatively fast and accurate, other variables account fordifferences in reading comprehension. As they get older, learners are expected toread longer, more complex texts, and higher-order reading skills such as makinginferences, integrating text information and breadth and depth of vocabularyknowledge become increasingly important in reading expertise. Fluency in readingconnected text thus relies not only on decoding skills, but also on multi-levelprocesses beyond decoding (Fuchs et al., 2001; Jeon, 2012).
Reading in a second language and ORF
Much of the research on fluency in reading is based on L1 reading, and the normsthat have been developed for English reading rates are based on L1 reading data. Forexample, Good, Simmons, Kame’enui, Kaminski, and Wallin (2002) found thatEnglish Grade 1 readers who, by the end of the grade year, read below 40 WCPMwere at risk of reading failure, and children reading below 20 WCPM were at highrisk of failure. Would such scores similarly signal L2 children in the same grade atrisk of reading failure? What would an ORF developmental trajectory look like forL2 readers, especially those in developing countries where schooling is charac-terised by poverty (a risk factor for reading) and where the L2 is also typically theLoLT? Answers to such questions are vital for policy makers and teachers fordetermining what can ‘normally’ be expected and what constitutes a warning lightand hence requiring intervention and remediation. Surprisingly, although there has
E. J. Pretorius, N. Spaull
123
Author's personal copy

been an increase in L2 reading research focusing on fluency, this has yielded only asmall body of empirical research to date, with varied and inconclusive findings.
As a starting point, the main difference between L1 and L2 children is that theformer bring a lot of L1 knowledge with them when learning to read, whereas in L2children the L2 knowledge is developing in parallel to their L2 readingdevelopment. It is common sense to assume that having lowered languageproficiency will cause L2 students to read text less efficiently. However, there is astrong empirical base that shows that although L1 and L2 learners may differ in oralproficiency, they can perform at the same level of accuracy in basic reading skillssuch as word recognition and word attack skills (Lesaux & Siegal, 2003; Geva &Zadeh, 2006; Lipka & Siegel, 2007), provided that there is systematic instruction inreading. When the language in the text matches the language level of the learner,then L2 oral proficiency is found not to be a determining factor. When the languageof the text is more demanding than the learner’s oral proficiency, then thecontribution of oral language proficiency might increase. We look now to researchthat has focussed specifically on L2 English ORF.
Two studies from Florida (United States)—a state with a large L2 Latinopopulation—have provided some insight into the levels and growth of English ORFin the early years of schooling. Al Otaiba et al. (2009) examine the developmentaltrajectories of early reading fluency among 5004 Grade 2 Latino students from highpoverty schools, all of which followed an explicit and systematic readingprogramme. ORF scores ranged from 53 WCPM (Grade 2) to 75 WCPM (Grade3) for typical L2 Latino students, while ORF scores were lower for those withlanguage delays (44 WCPM in Grade 2 and 64 at the start of Grade 3) and lowest forthose with learning difficulties (24 WCPM at the start of Grade 2 and 35 WCPM inGrade 3). The authors conclude that ORF is a useful tool for screening andmonitoring the progress of L2 readers, and for identifying learners who need readingsupport before they fall too far behind.
The second study from Florida is that of Jimerson, Hong, Stage, and Gerber(2013) who examined developmental trajectories in ORF from Grade 1 to Grade 4amongst monolingual English students with low socioeconomic status (SES) andESL Latino students with low SES. This was used to determine whether growth inORF predicted achievement in the high stakes Stanford Achievement Test in Grade4. For both groups of children, ORF in Grade 1 strongly predicted readingperformance in Grade 4, while growth in ORF had a moderate effect on readingperformance in Grade 4. What is of interest in this study is that the average ORFreading scores for the English L1:L2 children from Grade 1–4 were 64:40, 101:74,90:63, 146:119 WCPM respectively (ORF averages were inexplicably higher inGrade 2 than Grade 3). The averages of the L1 and L2 English readers differed byabout 25 WCPM at each grade level.
Coming closer to home, we turn to a Kenyan study. Like South Africa, Kenyaalso faces challenges in developing children’s literacy skills. In Kenya only 32 % ofGrade 3 children were found to be able to read Grade 2 level texts, irrespective ofthe language in which reading was assessed—English or Kiswahili (Uwezo, 2012,in Piper & Zuilkowski, 2015). In their assessment of reading fluency amongst Grade2 learners in Kiswahili (L1) and English (L2) in Kenya, Piper and Zuilkowski
Exploring relationships between oral reading fluency and…
123
Author's personal copy

(2015) found that while reading comprehension levels were low in English L2, theywere only marginally better (but not statistically significantly different) inKiswahali, pointing to reading challenges within the Kenyan education systemgenerally. The Grade 2 learners were averaging 30 WCPM in L2 English reading,indicating a very slow reading rate. The authors conclude that in Kenya andcountries with similar language and learning contexts, ORF is a useful tool forliteracy assessment. In their study of 1772 Grade 5 English L2 learners in SouthAfrica, Draper and Spaull (2015)—using the same data employed in this study—found that 41 % of the sample were non-readers, reading slower than 40 WCPM.
All these studies show some variation within L2 fluency norms in the earlygrades, especially in schools in more developed as opposed to developing countries.In the Florida schools, reading instruction was explicit and systematic, and eventhough the school served low SES communities, such schools tend to be betterresourced and more functional than schools in developing countries (Abadzi, 2006).In these richer contexts, the ESL learners seem to read about 25 WCPM slower thantheir L1 grade peers (Jimerson et al., 2013). However, at 30 WCPM, the KenyanGrade 2 ESL students were reading more slowly than their Grade 1 Latino L2counterparts in Florida who were averaging 40 WCPM (Jimerson et al., 2013) andwhere the typical Grade 2 L2 child was averaging 53 WCPM (Al Otaiba et al.,2009). The large number of Grade 5 ESL non-readers in Draper and Spaull’s study(2015) reading at less than 40WCPM suggests that instructional and resource factorscan play a significant role in ESL fluency rates.
Present study
The preceding overview has shown that there is relatively scant quantitativeresearch on oral reading fluency for L2 learners, especially learners in developingcountries. The aim of the present study is to help ameliorate this lack by furtheranalysing the results from the large oral reading fluency study in rural South Africaconducted in 2013. The two research questions animating our research are asfollows:
1. How strong is the relationship between ORF and comprehension for rural SouthAfrican Grade 5 ESL learners?
2. In relation to comprehension, are there differential returns to additional fluencyat different points in the ORF continuum?
The research presented in this article can be considered as the second componentof a two-tier research project focusing on oral reading fluency among ESL studentsin South Africa. Where the focus of the first paper was largely descriptive, thecurrent paper extends that analysis by providing a multivariate perspective on therelationship between fluency and comprehension. While a full account of theinstruments, sampling procedures and test administration processes is available inthe first paper (Draper & Spaull, 2015), we include the most pertinent informationfor the present study below.
E. J. Pretorius, N. Spaull
123
Author's personal copy

Method and data collection
The data for this study was collected in 2013 by the National Education andEvaluation and Development Unit (NEEDU), an independent institution in SouthAfrica similar in nature to OFSTED in the United Kingdom. In response to thefindings emerging from the 2012 NEEDU evaluation cycle—which found very poorreading levels among Grade 2 learners with poor letter and word recognition in thehome language of learners—it was decided that reading was a critical factorinhibiting improvement in the sector. It is for this reason that in the 2013 evaluationcycle NEEDU chose to assess Grade 5 learners’ reading according to their ORF andreading comprehension.
The data used in this study comes from a non-random sample of 4667 Grade 5learners in 213 rural schools across all nine provinces of South Africa who weretested for reading comprehension. Although 4667 students were included in theevaluation, only a sub-sample of 1772 students was selected for the ORFassessment. These latter students form the basis of the present analysis since thisis the group for whom we have both ORF scores and comprehension scores.
Within each school one Grade 5 class was randomly selected. All learners in theclass were tested on a 40-min written reading comprehension test. The test consistedof a narrative and an information text and included a combination of 13 literal andinferential questions. The overall Flesch readability ease of the comprehension testwas 82.3, equivalent to 4.9 on the Flesch–Kincaid grade level.
Based on the results of the comprehension test, 10 learners from each class wereselected (3 top, 4 middle and 3 bottom achievers in the reading comprehension test)to participate in an Oral Reading Fluency test administered a day later. Thiscomprised two narrative texts of just over 200 words each, with a Flesch readabilityease score of 84.7 and 83.3 respectively (equivalent to the Flesch–Kincaid levels ofGrade 3.8 and 4.3). Further details about the measures and procedures can be foundin Draper and Spaull (2015).
In schools with less than 15 learners in the Grade 5 class, all learners wereselected for the ORF test so as not to make anyone feel excluded. The total samplefor the ORF passage was 1772 learners and it is this data that we analyse here.
Results
Table 1 below provides basic descriptive statistics on the two outcomes measuressubsequently used in the multivariate analyses. The results clearly show that,overall, the 1772 students performed extremely poorly on the silent readingcomprehension test, scoring an average of 23 % on the Reading comprehensionassessment despite the fact that the text used in the comprehension test wasequivalent to Grade 4 texts in terms of ease of readability (cf. Draper & Spaull,2015). The learners performed equally poorly on the ORF assessment, reading at 46words correct per minute (WCPM) on a narrative text appropriate for Grade 4 level.When considering differential performance by sub-group, girls performed statisti-cally significantly better than boys on both the comprehension test and the ORF test,while the 346 students learning ESL in the Afrikaans-medium schools performed
Exploring relationships between oral reading fluency and…
123
Author's personal copy

statistically significantly better in reading comprehension in English than their 1357peers who were in English-medium schools. The reasons for this have beenelaborated on in previous work (Draper & Spaull, 2015), and may relate tosociopolitical factors associated with South Africa’s apartheid past, and to the factthat most students with Afrikaans as their LOLT were also home-languageAfrikaans speakers, while those in English-LOLT schools typically do not speakEnglish as a home-language. There was no statistically significant differencebetween multigrade and monograde schools in either reading comprehension scoresor ORF scores.
Benchmarking ORF scores for ESL students in South Africa
While not the explicit aim of this paper, it is helpful to place the achievement ofSouth African rural Grade 5 ESL students in an international context, largelybecause the level of ORF achievement may influence the relationship between ORFand comprehension, as will be seen in the multivariate analysis. Figure 2 belowshows the cumulative density function (CDF) of ORF scores for the 1772 students.One can see that approximately 40 % of the sample are reading at less than 40WCPM. It is especially disconcerting that 11 % of the sample could not read asingle word correctly in English, despite 5 years of formal full-time schooling.
A previous analysis (Draper & Spaull, 2015) showed that the ORF distribution ofGrade 5 ESL students in rural schools in South Africa approximates the distributionof Grade 1 or Grade 2 American ESL students that have been earmarked forremedial instruction. Using ESL benchmarks developed by Broward County in
Table 1 Descriptive statistics for silent reading comprehension and oral reading fluency scores
Obs Mean SE mean Min Max SD
Grade 5 silent reading comprehension scores (%)
Girls 844 25.3 0.9 0 100 19.5
Boys 918 21.8 0.9 0 95 18.1
Afrikaans LOLT 346 30.8 2.6 0 100 23.1
English LOLT 1357 21.6 0.6 0 95 17.2
Monograde 964 24.0 1.1 0 95 19.9
Multigrade 808 22.7 1.1 0 100 17.5
National 1772 23.4 0.75 0 100 18.9
Grade 5 oral reading fluency scores (words read correct per minute)
Girls 844 52.4 1.35 0 163 30.7
Boys 918 40.3 1.42 0 182 30.4
Afrikaans LOLT 346 56.5 3.48 0 182 36.0
English LOLT 1357 43.5 1.12 0 167 29.3
Monograde 964 46.3 1.67 0 167 32.8
Multigrade 808 45.9 1.64 0 182 28.9
National 1772 46.1 1.17 0 182 31.1
E. J. Pretorius, N. Spaull
123
Author's personal copy

Florida, we showed that our South African rural Grade 5 sample fits the ‘‘Non-English speaker (A1)’’ Grade 2 classification, or alternatively the IntermediateEnglish Speaker (B1) Grade 1 classification. That is to say that South African ruralGrade 5 ESLs are achieving at the same level as the lowest performing (A1) Grade 2ESLs in Broward County (Florida, U.S.). These students ‘‘cannot communicatemeaning orally in English’’ and demonstrate very little understanding of English.They would be ‘‘unable to participate in regular classroom instruction’’ in America(Broward County, 2009: 1).
Further analysis showed that while the American Hasbrouck and Tindal (2006)norms were inappropriate for the South African context, there is a case to be madethat the Broward County B1 ESL ORF schema could operate as a tentativebenchmarking system for ESL students in Grades 1–5 in South Africa, at least untilmore data becomes available on ORF benchmarks in South Africa. This conclusionis based on the fact that the small number of South African Grade 5 ESL studentswith acceptable levels of comprehension (60 %? on the comprehension test) have avery similar ORF distribution to Grade 3 B1 ESL students in Broward County(Draper & Spaull, 2015). This is shown visually in Fig. 3 below. The middle kerneldensity function approximates the Grade 3 B1 distribution as well as that of SouthAfrican grade 5 learners with acceptable levels of comprehension.
In addition to a large body of literature attesting to the strong relationshipbetween ORF and reading comprehension our preliminary descriptive analysis alsosuggests that there is a strong relationship between these two variables. Figure 4below shows the distribution of ORF scores (WCPM) by categories of compre-hension scores (0–10 %; 11–25 %; 26–59 %; 60 %?). One can clearly see that atthe lowest level of comprehension the vast majority of students (70 %) are readingat less than 40 WCPM. This is in stark comparison to those at the highest level ofcomprehension where the majority of students (60 %) are reading at 80 WCPM or
Fig. 2 Cumulative distribution function (CDF) of oral reading fluency scores (in words correct perminute) (n = 1772)
Exploring relationships between oral reading fluency and…
123
Author's personal copy

higher. As one might expect, there are almost no students in the highestcomprehension category who are reading at 40 WCPM or less.
While these results are suggestive and confirm our a priori expectations about therelationship between ORF and comprehension, one cannot make causal claimsabout this relationship given the descriptive nature of the analysis. Consequently,we now turn to the multivariate analysis to determine whether this relationship holds
Fig. 3 Distribution of oral reading fluency scores (WCPM) for rural South African ESL learners relativeto Broward County ESL learners, Florida (Broward County, 2012) (Source: Draper & Spaull, 2015)
0
10
20
30
40
50
60
70
80
0-->10% (n=564) 11-->25% (n=656) 26-->59% (n=445) 60% + (n=107)
Comprehension
0-->40 WCPM 41-->60 WCPM 61-->80 WCPM 80+ WCPM
Fig. 4 Distribution of ORF scores by comprehension category
E. J. Pretorius, N. Spaull
123
Author's personal copy

after controlling for school-level factors, as well as looking at the strength anduniformity of the relationship.
Multivariate analysis
Table 2 below presents the results of the initial multivariate analysis in the form offive regressions. In all five regressions the outcome variable is the comprehensionscore of the child which has been standardised to have a mean of zero and a standarddeviation (SD) of one. Similarly, the variables WCPM, ‘Words read incorrectly’,and ‘Words skipped’ have all been standardised to have a mean of zero and a SD ofone. In each case the mean and SD of the original variable are included in squarebrackets for intuitive interpretation.
Before controlling for any variables, Regression 1 shows that a 1 SD increase inWCPM is associated with a 0.7 SD increase in reading comprehension score. Oralternatively that an increase of 31 WCPM (1 SD) is associated with a 14 % pointincrease in comprehension score (0.7347 9 19 % = 14). This is an extremelystrong association. However, given that this first regression has not controlled for
Table 2 School fixed-effects regressions predicting standardised comprehension scores using stan-dardised ORF variables (WCPM)
Regression 1 Regression 2 Regression 3 Regression 4 Regression 5
WCPM (standardised) 0.7347*** 0.6682*** 0.6949*** 0.6989*** 0.6947***
[Mean: 46 WCPM; SD:31 WCPM]
0.04 0.03 0.03 0.04 0.04
Words read incorrectly(standardised)
-0.215*** -0.212*** -0.211***
[Mean: 9WRI; SD:6WRI]
0.03 0.03 0.03
Words skipped(standardised)
-0.0260 -0.0259 -0.0243
[Mean: 1WS; SD: 3WS] 0.02 0.02 0.02
Female (Ref: male) -0.0400 -0.0464
0.05 0.05
Age 12 or 13 (Ref\12) -0.0680
0.06
Age 14? -0.0340
0.10
School fixed effects No Yes Yes Yes Yes
Constant 0.189 -0.550*** -0.593*** -0.584*** -0.575***
0.03 0.05 0.06 0.05 0.05
N 1772 1772 1677 1677 1677
R2 0.3799 0.53769 0.56091 0.56115 0.56156
Outcome variable is reading comprehension score (standardised) with standard errors included belowcoefficients [mean: 23 %; SD: 19 %]
Significance levels * 0.1; ** 0.05; *** 0.01
Exploring relationships between oral reading fluency and…
123
Author's personal copy

any individual or school level characteristics, it is possible that higher WCPMscores are simply proxies for school level factors such as quality of instruction,grade arrangement (multigrade or monograde) or resources at school. Consequently,for Regressions 2–5 we include school-level fixed effects to control for all schoollevel factors. Thus, the coefficients in Regressions 2–5 reflect only intra-schoolvariation in the variables. Regressions 3–5 systematically add additional individualcontrol variables relating to the child’s ORF test (words read incorrectly and wordsskipped), as well as the age and gender of the child. After controlling for school-level factors, the coefficients on age, gender and words skipped are not statisticallysignificantly different from zero; i.e. there is no observable relationship betweenthese variables and comprehension.
The relationship between WCPM and comprehension is largely unaffected byadding school fixed-effects or child covariates, with the coefficient remainingapproximately 0.7. This indicates that the impact of WCPM on comprehension isclearly not just proxying for school-level factors (or between-school variation) andthat the impact of additional fluency is independent of school-level factors. This addsfurther weight to the argument that oral reading fluency is an effective predictor ofreading comprehension, as has been found in a number of other studies (Pinnel et al.,1995; Fuchs et al., 2001; Spear-Swerling, 2006). The coefficient on ‘Words readincorrectly’ is stable at 0.21 and statistically significant at the 1 % level. This meansthat for a 1 SD increase in Words read incorrectly there is a 0.21 decrease instandardised comprehension score. Or, interpreted intuitively, for every 6Words ReadIncorrectly, a child’s comprehension score decreases by 4 % points (0.21 9 19 %).
The results presented here show that there is a strong relationship between ORFand comprehension for rural South African Grade 5 ESL learners. Raising oralreading fluency by 31 WCPM is associated with a 14 % point increase incomprehension score after controlling for all school-level and some individual levelvariables. The evidence presented here provides considerable empirical support tothe arguments made by National Education Evaluation and Development Unit(2013) that improving the ORF of ESL students is likely to improve comprehensionfor these students, and furthermore that focusing on individual reading, and readingaloud in particular, is justified using local evidence. While we are not advocating amyopic focus on fluency, we do believe that this is an underdeveloped and under-appreciated sub-component of reading in the South African context and thuswarrants additional time and attention.
Differential returns to additional oral reading fluency
With reference to the second research question—to explore the possibility that thereturns to additional ORF are different at different points of the fluencydistribution—we employ a spline modelling regression technique which allowsthe slope coefficient on ORF to differ before and after a specified cut-point. Byrunning a series of regressions, each with different cut-points we can compare thesize of the coefficients before and after the cut-points and, using marginal effects,determine if these coefficients are statistically significantly different from eachother. Table 3 below shows the results from this analysis.
E. J. Pretorius, N. Spaull
123
Author's personal copy

Tab
le3
Spline
regressionspredictingcomprehensionscore
(in%)usingwordscorrectper
minute
(WCPM)
Non-spline
40WCPM
50WCPM
60WCPM
70WCPM
80WCPM
90WCPM
100WCPM
110WCPM
120WCPM
Fem
ale
-0.7471
-0.7378
-0.7393
-0.7398
-0.7494
-0.7651
-0.7878
-0.8216
-0.8556
-0.8542
Age12–13
(Ref
\12)
-1.0954
-1.0583
-1.0041
-0.9279
-0.8972
-0.9283
-0.9829
-1.0388
-1.0647
-1.0775
Age14?
-0.5475
-0.4659
-0.3505
-0.2131
-0.1781
-0.2285
-0.3205
-0.4234
-0.4903
-0.5130
Wordsread
incorrectly
-0.5558***
-0.5636***
-0.5732***
-0.5874***
-0.5959***
-0.5932***
-0.5880***
-0.5823***
-0.5764***
-0.5711***
Wordsskipped
-0.1414
-0.1416
-0.1392
-0.1314
-0.1272
-0.1239
-0.1215
-0.1220
-0.1251
-0.1270
WCPM
ORF1
0.3539***
Upto
40WCPM
0.3648***
40?
WCPM
0.3485***
Upto
50WCPM
0.3740***
50?
WCPM
0.3370***
Upto
60WCPM
0.3846***
60?
WCPM
0.3114***
Upto
70WCPM
0.3876***
70?
WCPM
0.2779***
Upto
80WCPM
0.3839***
80?
WCPM
0.2439***
Upto
90WCPM
0.3788***
90?
WCPM
0.2032***
Upto
100WCPM
0.3739***
100?
WCPM
0.1601**
Upto
110WCPM
0.3691***
110?
WCPM
0.1188
Upto
120WCPM
0.3654***
Exploring relationships between oral reading fluency and…
123
Author's personal copy
Tab
le3continued
Non-spline
40WCPM
50WCPM
60WCPM
70WCPM
80WCPM
90WCPM
100WCPM
110WCPM
120WCPM
120?
WCPM
0.0658
Marginal
effects
NA
-0.0163
-0.0370
-0.0732
-0.1097**
-0.1401**
-0.1756***
-0.2137***
-0.2503***
-0.2996***
Schoolfixed
effects
Yes
Yes
Yes
Yes
Yes
Yes
Yes
Yes
Yes
Yes
Constant
-0.3235
-0.3803
-0.3578
-0.2560
-0.1688
-0.2017
-0.3340
-0.6441
-0.9773
-1.1309
Observations
1677.00000
1677.00000
1677.00000
1677.00000
1677.00000
1677.00000
1677.00000
1677.00000
1677.00000
1677.00000
R2
0.56156
0.56160
0.56179
0.56246
0.56332
0.56381
0.56418
0.56416
0.56382
0.56352
Significance
levels*0.1;**0.05;
***0.01
E. J. Pretorius, N. Spaull
123
Author's personal copy

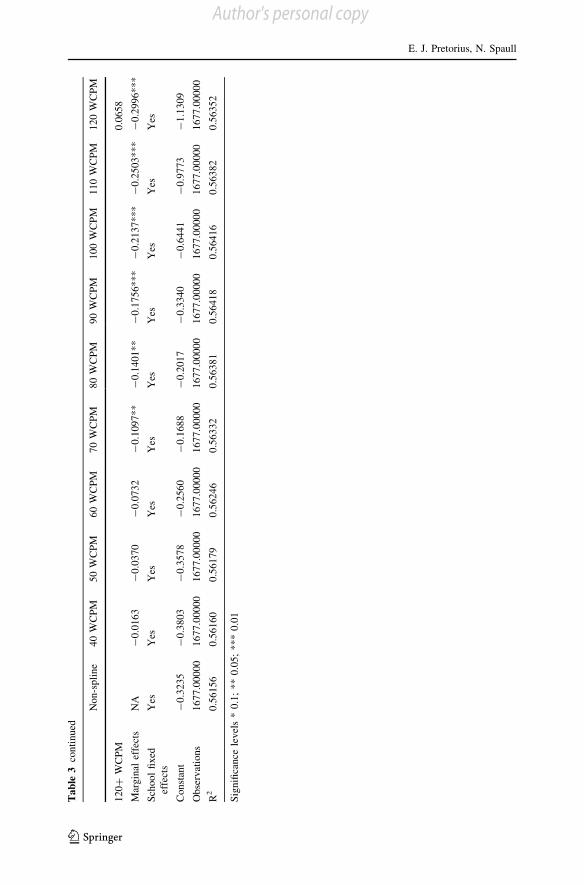
Where previously we used standardised ORF measures (Table 2), here we usethe variables in their original format. This was because there is no intuitiveexplanation of ‘breaks’ in a standardised distribution. Knowing that a breakoccurs at 0.65 of the standardised distribution is not particularly useful, especiallyin comparison to specifying breaks in traditional WCPM measures. Table 3reports the results of 10 regressions, nine of which employ spline modelling withdifferent breaks. As in previous regressions we include school-level fixed effectsin all regressions as well as age, gender, words read incorrectly and wordsskipped. Given the different functional form specification it is helpful to interpretthe non-spline regression before proceeding to the interpretation of the splinemodelling.
In the non-spline regression, the coefficient on WCPM of 0.35 can be interpretedas showing that for a one word increase in WCPM there is a 0.35 % point increasein comprehension score, holding all other factors constant. As earlier, thisrelationship is strong and statistically significant at the 1 % level. The splineregressions each report the slope coefficient on WCPM both before the ‘‘break’’ andafter the ‘‘break’’. Based on the distribution of WCPM we institute breaks at 40WCPM and raise the break-point by 10 WCPM in each regression all the way up to120 WCPM. The marginal effects coefficient shows the difference in the slopecoefficient before and after the break, and whether the difference is statisticallysignificantly different from zero. For the first spline regression (40 WCPM), theslope coefficient for additional WCPM up to 40 WCPM is 0.3648 and after 40WCPM is 0.3485. This difference (-0.0163) is reported in the marginal effects rowbut is not statistically significantly different from zero.
If one observes the regression outputs of all the spline regressions rangingfrom breaks at 40 WCPM all the way to 120 WCPM (in conjunction with themarginal effects coefficient for each regression), it becomes clear that the returnsto additional fluency are relatively uniform and large up to 70 WCPM, butthereafter they decline. This is shown by the statistically significant marginaleffect in the 70 WCPM spline. In this regression an additional 10 WCPM adds3.876 % points to comprehension up to 70 WCPM, but after 70 WCPM anadditional 10 WCPM only adds 2.779 % points to comprehension. Thisdifference is statistically significant, as can be seen in the marginal effectsrow. Furthermore, the returns to additional fluency after 70 WCPM continue todecline as one moves to higher and higher levels of WCPM—as can be seen bythe increasing difference in the marginal effects row. In fact, after 110 WCPMthere do not appear to be additional comprehension benefits to increased fluency,at least none that are statistically significant for this sample. This may bebecause so few students in the sample actually scored at 110 WCPM or above(only 3 % of the sample).
What this analysis seems to suggest is that, unlike L1 English speakers wherereturns to additional fluency are highest up to 90 WCPM (Fuchs et al., 2001; Spear-Swerling, 2006), for L2/ESL speakers the returns to additional fluency are highestup to 70 WCPM, where after they are still positive but decline as WCPM increase.
Exploring relationships between oral reading fluency and…
123
Author's personal copy

Discussion
While this study confirms at Grade 5 level the comprehension problems that PIRLS2006 and 2011 identified amongst Grade 4 and 5 learners, it also identifies very poorreading fluency skills, which index basic reading skills. The low ORF and readingcomprehension scores in this study point to what we believe are severe readinginstructional deficiencies in our primary schools. Although anecdotally the commonperception is that teachers spend too much time on the mechanical aspects ofreading to the detriment of comprehension, these results suggest that whatever timeis being spent on the mechanics of reading, it is ineffective and inadequate.McGuiness (2004) argues that ‘‘reading is a learned skill. Ignorance or incompe-tence in teaching this skill can produce a large number of children with severereading problems’’ (2004, p. 217). The South African evidence would seem tosupport this.
It could be argued that ORF and reading comprehension measures in L2 readingmay not correlate as strongly as in L1, because L2 learners with low proficiency inthe L2 may learn to decode texts without necessarily understanding what they read.This is often referred to as ‘barking at print’ (Samuels, 2002). Two points can bemade here: if 41 % of the sample of our 1772 learners is reading at less than 40WCPM after five years of schooling, then they cannot even ‘bark at print’. Theyclearly have not yet developed even elementary word recognition or word attackskills. Furthermore, fluency is an outcome of learned skills. Exposure to print andpractice in reading extended texts is critical for developing fast and accurate reading(Adams, 1990; Nathan & Stanovich, 1991; Blachowicz et al., 2006). The fact thatthe Grade 5 learners in this study were performing at ORF levels similar to remedialGrade 2 L2 learners in Florida State, USA, suggests that, unlike the Florida schools,systematic reading is not being taught in South African rural primary schools andthere is little exposure and practice. Spear-Swerling (2006) argues that fluency inthe early years only increases if children are familiar with letter-sound relationships,and have acquired fairly accurate decoding skills for common words.
Much of local qualitative literature stands in firm support of the above. There isevidence that much of the activity that passes for teaching and learning in SouthAfrican classrooms involves whole class oral chorusing of information with littleattention to meaning, with a strong emphasis on oral group teaching, to thedetriment of reading and writing, especially the reading and writing of extendedtexts, individualised reading and individualised assessment of reading (Hoadley,2012; Zimmerman & Smit, 2014; Pretorius, 2015). Lack of attention to reading andits assessment not only has detrimental consequences for the development of skilledreading but also for improvements in L2 proficiency. Given that English is also theLoLT, this lack of proficiency has dire consequences for learning across thecurriculum and is arguably a binding constraint for progress in all subjects.
The research literature indicates that fluency develops most quickly in the earlygrades, with the growth curve tapering off as children move up through the grades.The fact that the Grade 5 children in this study still have exceptionally low ORFscores suggests, we believe, instructional deficiencies in the earlier grades with
E. J. Pretorius, N. Spaull
123
Author's personal copy

regard to early reading as well as ESL development. The fluency growth that shouldhave happened earlier under sound instructional practices in Grades 1–3 clearlynever happened, and learners are lagging behind. The research by Mathson et al.(2006) shows that accuracy is an important first step in fluency development. Theconcomitant drop in comprehension with inaccurate reading found in this NEEDUstudy confirms the importance of accuracy in skilled reading. The fairly strongeffects still found amongst the Grade 5 learners is also suggestive of their immaturereading skills. Slow and inaccurate decoding is typical of the early stages of readingbut by Grade 5 these effects should start tapering off. We would argue that SouthAfrican teachers need to do individual reading assessments in the early grades inorder to monitor reading trajectories and identify and remediate reading problemsearly.
The levelling-off effect between the higher ORF scores and comprehension inthis data set is not unexpected. This is attributed to the changing nature of readingdevelopment and different constraints kicking in at different levels. As mentionedpreviously, once reading becomes faster and more accurate, other processes criticalfor reading comprehension come to the fore, including ESL knowledge. L2 readersdevelop language proficiency at the same time as their L2 reading develops. Iflearners have difficulty decoding new words or recognising familiar words incontext, then the chances of learning their meanings and making sense of the textdiminish. This also diminishes ESL learning in general. As they get older, learnersare expected to read longer, more complex texts, and higher-order reading skillssuch as making inferences, integrating textual information and breadth and depth ofvocabulary knowledge become increasingly important in reading expertise. Theleveling-off trend among the Grade 5 learners in this study also points to the needfor good reading interventions that target vocabulary development and the subskillsof reading for ESL readers. As the literature suggests (e.g., Silven et al., 2004;Jimerson et al., 2013), the development of reading subskills may be better markersof reading development than ESL or low SES. ESL reading also promotes ESLdevelopment.
Practical implications
In South Africa, as in most developing countries, there is a convergence of riskfactors that impact on reading development. These include widespread low SES,limited access to print resources, and a lack of good reading instructionalprogrammes in the early years for African languages and English. While educationsystems do not have control over parental SES, they can effect changes in schoolswith regard to classroom practices. The appallingly low literacy levels of SouthAfrican learners across the grades strongly suggest that effective reading instructionis a serious challenge for teachers. As this Grade 5 study shows, by not acquiringbasic reading skills in the Foundation Phase, learners who depend on ESL readingfor their studies from Grade 4 onwards are ‘silently excluded’ from learning sincethey struggle to engage with the curriculum in higher grades and fall further andfurther behind.
Exploring relationships between oral reading fluency and…
123
Author's personal copy

Many of the students in this study battled with even basic reading skills, whichraises questions about the type of reading instruction to which these learners havebeen exposed. In his research on initial teacher education, Taylor (2014) found thatin six universities across South Africa, courses on literacy development andinstruction only constitute about 6 % of the curriculum for teacher training anddevelopment. This suggests that teachers are not being taught much about reading orhow best to teach it. We recommend that urgent attention be given to the type ofliteracy interventions that would best serve bilingual education systems indeveloping countries, especially in contexts where teachers are faced with largeclasses and large numbers of children from high poverty, print poor communities,and where literacy is often perceived in narrow and mainly functional terms. This isespecially important for Foundation Phase (Grade 1–3) teachers on whom theresponsibility of establishing sound basic reading skills falls. A myopic view offluency where instruction focuses mechanically on getting children to read faster isnot what is being advocated here. What is called for instead is an approach thatdevelops decoding and comprehension skills in tandem, builds learners’ vocabulary,and provides them with plenty of opportunities to practice reading connected text inmeaningful ways in both home language and ESL, thereby forming bridges betweenreading fluently in African languages and in English, in preparation for thetransition to English in Grade 4 and the reading of more challenging English textswhen reading to learn.
In addition, given the converging evidence, internationally and locally, that ORFscores reliably predict reading comprehension and reading ability in general in bothL1 and L2, it is important to set up ORF benchmarks for ESL reading in the localcontext. Even if these norms are later adapted in the light of new L2 readingresearch evidence, benchmarks serve an important purpose in making teachersaware of fluency developmental trends, of what is possible in reading development,and of raising expectations of what children can achieve, even if they are L2readers. Awareness of ORF scores can serve as a powerful preventative practice,with higher chances of early identification of reading problems and interventionrather than later attempts at remediation.
Conclusion
Using a large sample of schools (213 schools) and students (1772 students) we haveshown that the relationship between oral reading fluency and reading comprehen-sion is large and robust for Grade 5 ESL students in rural South Africa. Our analysisshowed that an additional 31 words correct per minute (1 SD) was associated with a14 % point increase in comprehension score (0.7 SDs) after controlling for allschool-level variables and certain student-level variables (age and gender).
Secondly we showed that the returns to additional fluency are not uniform acrossthe ORF distribution. In a similar finding to the L1 research base, we found thatcomprehension returns to additional fluency are higher at lower levels of fluency,and decrease once a certain threshold is reached. However, unlike the L1 researchbase, our data suggests that for rural ESL students in South Africa, this threshold is
E. J. Pretorius, N. Spaull
123
Author's personal copy

at approximately 70 WCPM, rather than the 90 WCPM found in the L1 literature.Both of these findings further our current understanding of ESL reading in adeveloping country context, as well as add empirical evidence where it has beensorely lacking.
Acknowledgments The authors would like to thank the National Education and EvaluationDevelopment Unit (NEEDU) for providing access to the data used in the analysis and to Dr. NickTaylor for his comments and suggestions. The views expressed in this paper are not necessarily those ofthe organisation. Thanks are also extended to all the field workers who crisscrossed the provinces tocollect the data in 2013. Nic Spaull would like to acknowledge financial support provided by the ZenexFoundation for ongoing reading research, including this research.
References
Abadzi, H. (2006). Efficient learning for the poor. Washington, DC: The World Bank.Adams, M. J. (1990). Beginning to read: Thinking and learning about print. Cambridge, MA: MIT Press.Al Otaiba, S. A., Petscher, Y., Williams, R. S., Pappamihiel, N. E., Dyrlund, A. K., & Connor, C. (2009).
Modelling oral reading fluency development in Latino students: A longitudinal study across secondand third grade. Journal of Educational Psychology, 101(2), 315–329.
Blachowicz, C. L. Z., Moskal, M. K., Massarelli, J. R., Obrochta, C. M., Fogelberg, E., & Fisher, P.(2006). ‘‘Everybody reads’’: Fluency as a focus for staff development. In T. Rasinksi, C.Blachowicz, & K. Lems (Eds.), Fluency instruction: Research-based practices (pp. 141–154). NewYork, NY: The Guilford Press.
Broward County. (2009). Guidelines for Exceptional Student Education (ESE) and English LanguageLearner (ELL) Students Pre-Kindergarten (Pre-K)-12. Broward County Public Schools. Available:http://www.broward.k12.fl.us/esol/Eng/ESOL/PDF/ESE%20Guidelines/ESE%20Guidelines%20and%20Q.A%20Rev%202-02-09.pdf. Accessed 15 Feb 2016
Broward County. 2012. Oral Reading Fluency Data for English Language Learners (ELL). BrowardCounty Public Schools. Retrieved from http://www.broward.k12.fl.us/STUDENTSUPPORT/psychologicalservices/pdf/ellchart.pdf. Accessed 10 June 2015.
Bus, A. G., & van Ijzendoorn, M. H. (1999). Phonological awareness and early reading: A meta-analysisof experimental training studies. Journal of Educational Psychology, 91, 403–414.
Chard, D. J., Pikulski, J. J., & McDonough, S. H. (2006). Fluency: The link between decoding andcomprehension for struggling readers. In T. Rasinksi, C. Blachowicz, & K. Lems (Eds.), Fluencyinstruction: Research-based practices (pp. 39–61). New York, NY: The Guilford Press.
Chiappe, P., & Siegel, L. S. (1999). Phonological awareness and reading acquisition in English- andPunjabi-speaking Canadian children. Journal of Educational Psychology, 91, 20–28.
Deno, S. L., Fuchs, L. S., Marston, D., & Shin, J. (2001). Using curriculum-based measurement toestablish growth standards for students with learning disabilities. School Psychology Review, 30(4),507–524.
Department of Education. (2005). Grade 6 Intermediate Phase systemic evaluation report. Department ofEducation. http://www.education.gov.za/LinkClick.aspx?fileticket=XmlJMoUwT78%3D&tabid=452&mid=1035. Accessed 9 Apr 2016.
Draper, K., & Spaull, N. (2015). Examining oral reading fluency among Grade 5 rural ESL learners inSouth Africa: An analysis of NEEDU 2013. South African Journal of Childhood Education, 5(2),44–77.
Fleisch, B. (2008). Primary education in crisis. Cape Town: Juta & Co.Fuchs, L. S., Fuchs, D., Hosp, M. K., & Jenkins, J. R. (2001). Oral reading fluency as an indicator of
reading competence: A theoretical, empirical, and historical analysis. Scientific Studies of Reading,5(3), 239–256.
Gains, P. (2010). Learning about literacy: Teachers’ conceptualisations and enactments of early literacypedagogy in South African Grade One classrooms (unpublished doctoral thesis), University of theWitwatersrand, Johannesburg.
Exploring relationships between oral reading fluency and…
123
Author's personal copy

Geva, E., & Zadeh, Z. Y. (2006). Reading efficiency in native English-speaking and English-as-a-second-language children: The role of oral proficiency and underlying cognitive-linguistic processes.Scientific Studies of Reading, 10(1), 31–57.
Good, R. H., Simmons, D.S., Kame’enui, E. J., Kaminski, R.A., & Wallin, J. (2002). Summary of decisionrules for intensive, strategic, and benchmark instructional recommendations in kindergartenthrough third grade. (Tech Report No 11). Oregon, Eugene: University of Oregon.
Hart, B., & Risley, T. (2003). The early catastrophe. The 30 million word gap by age 3. AmericanEducator, 22, 4–9.
Hasbrouck, J., & Tindal, G. A. (2006). Oral reading fluency norms: A valuable assessment tool forreading teachers. The Reading Teacher, 59(7), 636–644.
Hoadley, U. (2012). What do we know about teaching and learning in South African primary schools?Education as Change, 16(2), 187–202.
Howie, S., Van Staden, S., Tshele, M., Dowse, C., & Zimmerman, L. (2012). PIRLS 2011: South Africanchildren’s reading literacy achievement Summary Report. Pretoria: Centre for Evaluation andAssessment, University of Pretoria.
Jeon, E. H. (2012). Oral reading fluency in second language reading. Reading in a Foreign Language,24(2), 186–208.
Jimerson, S. R., Hong, S., Stage, S., & Gerber, M. (2013). Examining oral reading fluency trajectoriesamong English language learners and English speaking students. New Approaches in EducationalResearch, 2(1), 3–11.
LaBerge, D., & Samuels, S. (1974). Toward a theory of automatic information processing in reading.Cognitive Psychology, 6, 293–323.
Lesaux, N. K., & Siegel, L. A. (2003). The development of reading in children who speak English as asecond language. Developmental Psychology, 39(6), 1005–1019.
Lipka, O., & Siegel, L. S. (2007). The development of reading skills in children with English as a secondlanguage. Scientific Studies of Reading, 11(2), 105–131.
Mathson, D. V., Allington, R. L., & Solic, K. L. (2006). Hijacking fluency and instructionally informativeassessments. In T. Rasinksi, C. Blachowicz, & K. Lems (Eds.), Fluency instruction: Research-basedpractices (pp. 106–119). New York, NY: The Guilford Press.
McGuiness, D. (2004). Early reading instruction. Cambridge, MA: MIT Press.Muter, V., & Diethelm, K. (2001). The contribution of phonological skills and letter knowledge to early
reading development in a multilingual population. Language Learning, 51(2), 187–219.Nathan, R. G., & Stanovich, K. E. (1991). The causes and consequences of differences in reading fluency.
Theory into Practice, 15, 176–184.National Education Evaluation and Development Unit. (2013). National report 2012: The state of
teaching and learning in the foundation phase. Pretoria: NEEDU.National Reading Panel. (2000). Teaching children to read: An evidence-based assessment of the
scientific literature on reading and its implications for reading instruction. Washington, DC: USGovernment Printing Office.
Perfetti, C. A. (1988). Verbal efficiency in reading ability. In M. Daneman, G. E. Mackinnon, & T.G. Waller (Eds.), Reading research: Advances in theory and practice (Vol. 6). New York, NY:Academic Press.
Pinnel, G. S., Pikulski, J. J., Wixson, K. K., Campbell, J. R., Gough, P. B., & Beatty, A. S. (1995).Listening to children read aloud. Washington, DC: US Department of Education.
Piper, B., & Zuilkowski, S. S. (2015). Assessing reading fluency in Kenya: Oral or silent assessment?International Review of Education, 61(2), 153–171.
Pretorius, E. J. (2015). Failure to launch: Matching language policy with literacy accomplishment inSouth African schools. International Journal for the Sociology of Language, 234, 47–76.
Pretorius, E. J., & Mokhwesana, M. M. (2009). Putting reading in Northern Sotho on track in the earlyyears: Changing resources, expectations and practices in a high poverty school. South AfricanJournal of African Languages, 29(1), 54–73.
Rasinski, T., & Mraz, M. (2008). Fluency: Traversing a rocky road of research and practice. In M.J. Fresch (Ed.), An essential history of current reading practices (pp. 106–119). Newark:International Reading Association Inc.
Samuels, S. J. (2002). Reading fluency: Its development and assessment. In A. E. Farstrup & S.J. Samuels (Eds.), What research has to say about reading instruction (pp. 166–183). Newark, DE:International Reading Association.
E. J. Pretorius, N. Spaull
123
Author's personal copy

Silven, M., Poskiparta, E., & Niemi, P. (2004). The odds of becoming a precocious reader of Finnish.Journal of Educational Psychology, 96(1), 152–164.
Snow, C. E., Burns, M. S., & Griffin, P. (1998). Preventing reading difficulties in young children.Washington, DC: National Academy Press.
Spaull, N. (2013). Poverty and privilege: Primary school inequality in South Africa. International Journalof Educational Development, 33, 436–447.
Spaull, N. (2015). Education quality in South Africa and Sub-Saharan Africa: An economic approach(unpublished doctoral thesis). Stellenbosch University, South Africa.
Spear-Swerling, L. (2006). Children’s reading comprehension and oral reading fluency in easy text.Reading and Writing: An Interdisciplinary Journal, 19, 199–220.
Stanovich, K. E. (1986). Matthew effects in reading: Some consequences of individual differences in theacquisition of literacy. Reading Research Quarterly, 21, 360–406.
Taylor, N. (2014). Thinking, language and learning in Initial Teacher Education. Presentation to theseminar Academic depth and rigor in ITE, Johannesburg: University of the Witwatersrand.
Uwezo. (2012). Are our children learning? Literacy and numeracy across East Africa. Uwezo. http://www.uwezo.net/wp-content/uploads/2012/08/2013-Annual-Report-Final-Web-version.pdf. Acces-sed 9 Apr 2016.
Venter, E., Van Staden, S., & Du Toit, C. (2008). South Africa’s performance on internationalbenchmarks. In S. Howie, E. Venter, S. Van Staden, L. Zimmerman, C. Long, C. Du Toit, V.Scherman, & E. Archer (Eds.), PIRLS 2006 summary report: South African children’s readingachievement. Pretoria: Centre for Evaluation and Assessment.
Verbeek, D. C. (2010). Teaching reading for meaning? A case study of the initial teaching of reading in amainstream South African school (doctoral dissertation), University of KwaZulu-Natal, SouthAfrica, Pietermaritsburg.
Wilsenach, C. (2015). Receptive vocabulary and early literacy skills in emergent bilingual NorthernSotho-English children. Reading and Writing, 6(1), 1–11. doi:10.4102/rw.v6i1.77.
Wolf, M., & Katzir-Cohen, T. (2001). Reading fluency and its intervention. Scientific Studies of Reading,5(3), 211–239.
Zimmerman, L., & Smit, B. (2014). Profiling classroom reading comprehension development practicesfrom the PIRLS 2006 in South Africa. South African Journal of Education, 34(3), 1–9.
Exploring relationships between oral reading fluency and…
123
Author's personal copy
Related Documents