Top Banner
1 Copyright © 2011 Pearson Education, Inc. Publishing as Prentice Hall. Exploring Microsoft Office Excel 2010 by Robert Grauer, Keith Mulbery, and Mary Anne Poatsy Chapter 3 Excel Charts
37

Exploring Microsoft Office Excel 2010 - New Paltzliush/BDSS/exp2010_e03_ppts.pdfExploring Microsoft Office Excel 2010 by Robert Grauer, Keith Mulbery, and Mary Anne Poatsy Chapter

May 10, 2018

Download

Documents

votruc
Welcome message from author
This document is posted to help you gain knowledge. Please leave a comment to let me know what you think about it! Share it to your friends and learn new things together.
Transcript
Page 1: Exploring Microsoft Office Excel 2010 - New Paltzliush/BDSS/exp2010_e03_ppts.pdfExploring Microsoft Office Excel 2010 by Robert Grauer, Keith Mulbery, and Mary Anne Poatsy Chapter

1Copyright © 2011 Pearson Education, Inc. Publishing as Prentice Hall.

Exploring Microsoft OfficeExcel 2010by Robert Grauer, Keith Mulbery, and Mary Anne Poatsy

Chapter 3Excel Charts

Page 2: Exploring Microsoft Office Excel 2010 - New Paltzliush/BDSS/exp2010_e03_ppts.pdfExploring Microsoft Office Excel 2010 by Robert Grauer, Keith Mulbery, and Mary Anne Poatsy Chapter

Objectives

• Decide which chart type to create• Create a chart• Change the chart type• Change the data source and structure• Apply a chart layout and style• Move a chart

Copyright © 2011 Pearson Education, Inc. Publishing as Prentice Hall. 2

Page 3: Exploring Microsoft Office Excel 2010 - New Paltzliush/BDSS/exp2010_e03_ppts.pdfExploring Microsoft Office Excel 2010 by Robert Grauer, Keith Mulbery, and Mary Anne Poatsy Chapter

Objectives (continued)

• Print charts• Insert and customize a sparkline• Select and format chart elements• Customize chart labels• Format axes and gridlines• Add a trendline

Copyright © 2011 Pearson Education, Inc. Publishing as Prentice Hall. 3

Page 4: Exploring Microsoft Office Excel 2010 - New Paltzliush/BDSS/exp2010_e03_ppts.pdfExploring Microsoft Office Excel 2010 by Robert Grauer, Keith Mulbery, and Mary Anne Poatsy Chapter

Copyright © 2011 Pearson Education, Inc. Publishing as Prentice Hall. 4
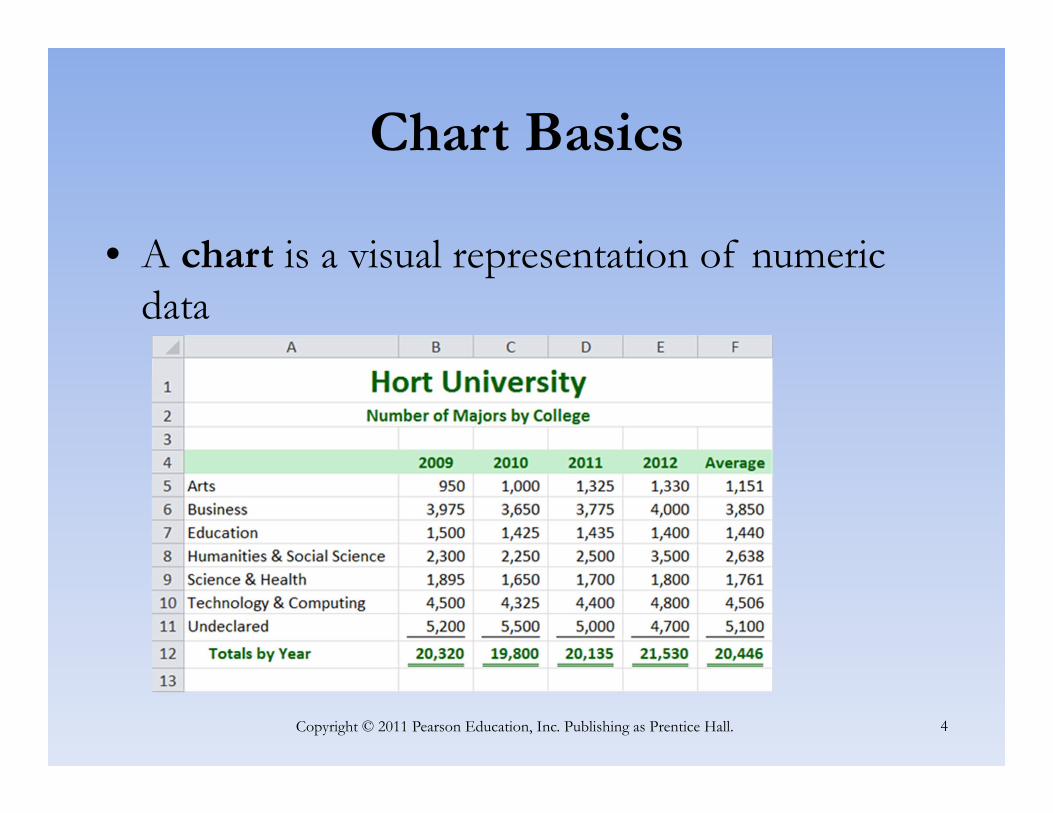
Chart Basics

• A chart is a visual representation of numeric data

Page 5: Exploring Microsoft Office Excel 2010 - New Paltzliush/BDSS/exp2010_e03_ppts.pdfExploring Microsoft Office Excel 2010 by Robert Grauer, Keith Mulbery, and Mary Anne Poatsy Chapter

Copyright © 2011 Pearson Education, Inc. Publishing as Prentice Hall. 5

Chart Basics

• Chart components include:– Data Points

– Data Series

– Category Labels

Page 6: Exploring Microsoft Office Excel 2010 - New Paltzliush/BDSS/exp2010_e03_ppts.pdfExploring Microsoft Office Excel 2010 by Robert Grauer, Keith Mulbery, and Mary Anne Poatsy Chapter

Column Charts

• A column chart displays data vertically, with each data series forming a column

Copyright © 2011 Pearson Education, Inc. Publishing as Prentice Hall. 6

Page 7: Exploring Microsoft Office Excel 2010 - New Paltzliush/BDSS/exp2010_e03_ppts.pdfExploring Microsoft Office Excel 2010 by Robert Grauer, Keith Mulbery, and Mary Anne Poatsy Chapter

Clustered Column Chart

Copyright © 2011 Pearson Education, Inc. Publishing as Prentice Hall. 7

Page 8: Exploring Microsoft Office Excel 2010 - New Paltzliush/BDSS/exp2010_e03_ppts.pdfExploring Microsoft Office Excel 2010 by Robert Grauer, Keith Mulbery, and Mary Anne Poatsy Chapter

Reversing Categories and Data Series

Copyright © 2011 Pearson Education, Inc. Publishing as Prentice Hall. 8

Page 9: Exploring Microsoft Office Excel 2010 - New Paltzliush/BDSS/exp2010_e03_ppts.pdfExploring Microsoft Office Excel 2010 by Robert Grauer, Keith Mulbery, and Mary Anne Poatsy Chapter

Stacked Column Chart

Copyright © 2011 Pearson Education, Inc. Publishing as Prentice Hall. 9

Page 10: Exploring Microsoft Office Excel 2010 - New Paltzliush/BDSS/exp2010_e03_ppts.pdfExploring Microsoft Office Excel 2010 by Robert Grauer, Keith Mulbery, and Mary Anne Poatsy Chapter

100% Stacked Column Chart

Copyright © 2011 Pearson Education, Inc. Publishing as Prentice Hall. 10

Page 11: Exploring Microsoft Office Excel 2010 - New Paltzliush/BDSS/exp2010_e03_ppts.pdfExploring Microsoft Office Excel 2010 by Robert Grauer, Keith Mulbery, and Mary Anne Poatsy Chapter

3-D Column Chart

Copyright © 2011 Pearson Education, Inc. Publishing as Prentice Hall. 11

Page 12: Exploring Microsoft Office Excel 2010 - New Paltzliush/BDSS/exp2010_e03_ppts.pdfExploring Microsoft Office Excel 2010 by Robert Grauer, Keith Mulbery, and Mary Anne Poatsy Chapter

Bar Chart

Copyright © 2011 Pearson Education, Inc. Publishing as Prentice Hall. 12

Page 13: Exploring Microsoft Office Excel 2010 - New Paltzliush/BDSS/exp2010_e03_ppts.pdfExploring Microsoft Office Excel 2010 by Robert Grauer, Keith Mulbery, and Mary Anne Poatsy Chapter

Line Chart

Copyright © 2011 Pearson Education, Inc. Publishing as Prentice Hall. 13

Page 14: Exploring Microsoft Office Excel 2010 - New Paltzliush/BDSS/exp2010_e03_ppts.pdfExploring Microsoft Office Excel 2010 by Robert Grauer, Keith Mulbery, and Mary Anne Poatsy Chapter

Pie Chart

Copyright © 2011 Pearson Education, Inc. Publishing as Prentice Hall. 14

Page 15: Exploring Microsoft Office Excel 2010 - New Paltzliush/BDSS/exp2010_e03_ppts.pdfExploring Microsoft Office Excel 2010 by Robert Grauer, Keith Mulbery, and Mary Anne Poatsy Chapter

Area Chart

Copyright © 2011 Pearson Education, Inc. Publishing as Prentice Hall. 15

Page 16: Exploring Microsoft Office Excel 2010 - New Paltzliush/BDSS/exp2010_e03_ppts.pdfExploring Microsoft Office Excel 2010 by Robert Grauer, Keith Mulbery, and Mary Anne Poatsy Chapter

X Y (Scatter) Chart

Copyright © 2011 Pearson Education, Inc. Publishing as Prentice Hall. 16

Page 17: Exploring Microsoft Office Excel 2010 - New Paltzliush/BDSS/exp2010_e03_ppts.pdfExploring Microsoft Office Excel 2010 by Robert Grauer, Keith Mulbery, and Mary Anne Poatsy Chapter

Stock Chart

Copyright © 2011 Pearson Education, Inc. Publishing as Prentice Hall. 17

Page 18: Exploring Microsoft Office Excel 2010 - New Paltzliush/BDSS/exp2010_e03_ppts.pdfExploring Microsoft Office Excel 2010 by Robert Grauer, Keith Mulbery, and Mary Anne Poatsy Chapter

Surface Chart

Copyright © 2011 Pearson Education, Inc. Publishing as Prentice Hall. 18

Page 19: Exploring Microsoft Office Excel 2010 - New Paltzliush/BDSS/exp2010_e03_ppts.pdfExploring Microsoft Office Excel 2010 by Robert Grauer, Keith Mulbery, and Mary Anne Poatsy Chapter

Doughnut Chart

Copyright © 2011 Pearson Education, Inc. Publishing as Prentice Hall. 19

Page 20: Exploring Microsoft Office Excel 2010 - New Paltzliush/BDSS/exp2010_e03_ppts.pdfExploring Microsoft Office Excel 2010 by Robert Grauer, Keith Mulbery, and Mary Anne Poatsy Chapter

Bubble Chart

Copyright © 2011 Pearson Education, Inc. Publishing as Prentice Hall. 20

Page 21: Exploring Microsoft Office Excel 2010 - New Paltzliush/BDSS/exp2010_e03_ppts.pdfExploring Microsoft Office Excel 2010 by Robert Grauer, Keith Mulbery, and Mary Anne Poatsy Chapter

Radar Chart

Copyright © 2011 Pearson Education, Inc. Publishing as Prentice Hall. 21

Page 22: Exploring Microsoft Office Excel 2010 - New Paltzliush/BDSS/exp2010_e03_ppts.pdfExploring Microsoft Office Excel 2010 by Robert Grauer, Keith Mulbery, and Mary Anne Poatsy Chapter

Creating a Chart

• Select the data source

• Select the chart type

• Position and size the chart

Copyright © 2011 Pearson Education, Inc. Publishing as Prentice Hall. 22

Page 23: Exploring Microsoft Office Excel 2010 - New Paltzliush/BDSS/exp2010_e03_ppts.pdfExploring Microsoft Office Excel 2010 by Robert Grauer, Keith Mulbery, and Mary Anne Poatsy Chapter

Changing the Chart Type

• Using the Chart Tools contextual tab:– Click the Design tab– Click Change Chart Type

– Select the desired chart type

Copyright © 2011 Pearson Education, Inc. Publishing as Prentice Hall. 23

Page 24: Exploring Microsoft Office Excel 2010 - New Paltzliush/BDSS/exp2010_e03_ppts.pdfExploring Microsoft Office Excel 2010 by Robert Grauer, Keith Mulbery, and Mary Anne Poatsy Chapter

Changing the Data Source

• To modify the chart data source:– Click the Design tab– Click Select Data under the Data group

Copyright © 2011 Pearson Education, Inc. Publishing as Prentice Hall. 24

Page 25: Exploring Microsoft Office Excel 2010 - New Paltzliush/BDSS/exp2010_e03_ppts.pdfExploring Microsoft Office Excel 2010 by Robert Grauer, Keith Mulbery, and Mary Anne Poatsy Chapter

Moving a Chart

• To move a chart:– Click the Design tab– Click Move Chart under the Location group

Copyright © 2011 Pearson Education, Inc. Publishing as Prentice Hall. 25

Page 26: Exploring Microsoft Office Excel 2010 - New Paltzliush/BDSS/exp2010_e03_ppts.pdfExploring Microsoft Office Excel 2010 by Robert Grauer, Keith Mulbery, and Mary Anne Poatsy Chapter

Printing a Chart

• To print an embedded chart:– Select the chart– Click the File tab– Click Print to display the Backstage view– Use the Print Selected Chart option

• To print a chart sheet:– Use the Print Active Sheet option

Copyright © 2011 Pearson Education, Inc. Publishing as Prentice Hall. 26

Page 27: Exploring Microsoft Office Excel 2010 - New Paltzliush/BDSS/exp2010_e03_ppts.pdfExploring Microsoft Office Excel 2010 by Robert Grauer, Keith Mulbery, and Mary Anne Poatsy Chapter

Creating a Sparkline

• A sparkline is a miniature chart displayed in a single cell

Copyright © 2011 Pearson Education, Inc. Publishing as Prentice Hall. 27

Page 28: Exploring Microsoft Office Excel 2010 - New Paltzliush/BDSS/exp2010_e03_ppts.pdfExploring Microsoft Office Excel 2010 by Robert Grauer, Keith Mulbery, and Mary Anne Poatsy Chapter

Chart Layout

• The Layout tab offers many ways to enhance a chart visually

Copyright © 2011 Pearson Education, Inc. Publishing as Prentice Hall. 28

Page 29: Exploring Microsoft Office Excel 2010 - New Paltzliush/BDSS/exp2010_e03_ppts.pdfExploring Microsoft Office Excel 2010 by Robert Grauer, Keith Mulbery, and Mary Anne Poatsy Chapter

Selecting and Formatting Chart Elements

• Formatting a chart element:– Right-click the element

and select the Format element command

– The element portion will change depending on the selection (ex. Format Data Series)

Copyright © 2011 Pearson Education, Inc. Publishing as Prentice Hall. 29

Page 30: Exploring Microsoft Office Excel 2010 - New Paltzliush/BDSS/exp2010_e03_ppts.pdfExploring Microsoft Office Excel 2010 by Robert Grauer, Keith Mulbery, and Mary Anne Poatsy Chapter

Customizing Chart Labels

Copyright © 2011 Pearson Education, Inc. Publishing as Prentice Hall. 30

Page 31: Exploring Microsoft Office Excel 2010 - New Paltzliush/BDSS/exp2010_e03_ppts.pdfExploring Microsoft Office Excel 2010 by Robert Grauer, Keith Mulbery, and Mary Anne Poatsy Chapter

Chart Titles and Legend

• A chart title is the label that describes the entire chart

• An axis title is a label that describes either the category or value axis

• A legend is used to distinguish data points in a pie chart or data series in a multiple series chart

Copyright © 2011 Pearson Education, Inc. Publishing as Prentice Hall. 31

Page 32: Exploring Microsoft Office Excel 2010 - New Paltzliush/BDSS/exp2010_e03_ppts.pdfExploring Microsoft Office Excel 2010 by Robert Grauer, Keith Mulbery, and Mary Anne Poatsy Chapter

Data Labels

• A data label is the value or name of a data point

Copyright © 2011 Pearson Education, Inc. Publishing as Prentice Hall. 32

Page 33: Exploring Microsoft Office Excel 2010 - New Paltzliush/BDSS/exp2010_e03_ppts.pdfExploring Microsoft Office Excel 2010 by Robert Grauer, Keith Mulbery, and Mary Anne Poatsy Chapter

Axes and Gridlines

• Excel computes starting, ending, and incremental values for display on the value axis

• A gridline is a horizontal or vertical line through the plot area

Copyright © 2011 Pearson Education, Inc. Publishing as Prentice Hall. 33

Page 34: Exploring Microsoft Office Excel 2010 - New Paltzliush/BDSS/exp2010_e03_ppts.pdfExploring Microsoft Office Excel 2010 by Robert Grauer, Keith Mulbery, and Mary Anne Poatsy Chapter

Adding a Trendline

• A trendline is a line used to depict trends and forecast future data

Copyright © 2011 Pearson Education, Inc. Publishing as Prentice Hall. 34

Page 35: Exploring Microsoft Office Excel 2010 - New Paltzliush/BDSS/exp2010_e03_ppts.pdfExploring Microsoft Office Excel 2010 by Robert Grauer, Keith Mulbery, and Mary Anne Poatsy Chapter

Summary

• In this chapter, you have learned to create charts such as column, bar, pie and line charts.

• You can modify an existing chart by changing the chart type, location or data source.

• You can insert, remove, and format chart elements such as titles, labels, and the legend.

Copyright © 2011 Pearson Education, Inc. Publishing as Prentice Hall. 35

Page 36: Exploring Microsoft Office Excel 2010 - New Paltzliush/BDSS/exp2010_e03_ppts.pdfExploring Microsoft Office Excel 2010 by Robert Grauer, Keith Mulbery, and Mary Anne Poatsy Chapter

Questions

Copyright © 2011 Pearson Education, Inc. Publishing as Prentice Hall. 36

Page 37: Exploring Microsoft Office Excel 2010 - New Paltzliush/BDSS/exp2010_e03_ppts.pdfExploring Microsoft Office Excel 2010 by Robert Grauer, Keith Mulbery, and Mary Anne Poatsy Chapter

Copyright

Copyright © 2011 Pearson Education, Inc. Publishing as Prentice Hall. 37

All rights reserved. No part of this publication may be reproduced, stored in a retrieval system, or transmitted, in any form or by any means, electronic, mechanical, photocopying, recording, or otherwise, without the prior written permission of the publisher. Printed in the United States of America.