[image courtesy NASA] 7th Grade Earth Science Immersion Unit Exploring Earth’s Landforms March 2006 Draft Version 1 This draft document is the result of several months of writing and discussion as part of the SCALE Math and Science Partnership. It is a living document open to change based on feedback from pilot testing and input. It is intended to be circulated for consultation to the SCALE community and other interested parties. A final version will be made available near the end of the SCALE project in 2007.

Welcome message from author
This document is posted to help you gain knowledge. Please leave a comment to let me know what you think about it! Share it to your friends and learn new things together.
Transcript
[image courtesy NASA]
7th Grade Earth Science Immersion Unit
Exploring Earth’s Landforms
March 2006Draft Version 1
This draft document is the result of several months of writing and discussion as part of the SCALE Math and Science Partnership. It is a living document open to change based on feedback from pilot testing and input. It is intended to be circulated for consultation to the SCALE community and other interested parties. A final version will be made available near the end of the SCALE project in 2007.
Exploring Earth’s Landforms
This Grade 7 Immersion Unit is being developed in partnership with the Madison Metropolitan School District and is being tested and revised by teachers, scientists, and curriculum developers associated with the NSF-funded Math/Science Partnership, System-wide Change for All Learners and Educators (SCALE) at the University of Wisconsin--Madison.
Development of this Unit is a collaborative effort involving educators from partner universities and K-12 school districts. Numerous administrators, professors, teachers, and students were involved in rigorous content review, field-testing, and focus groups that provided valuable insight for development and subsequent revisions of the Immersion Unit version presented here.
The preparation of this report was supported by a grant from the National Science Foundation to the University of Wisconsin–Madison (EHR 0227016). At UW–Madison, the SCALE project is housed at the Wisconsin Center for Education Research. The other partners are the University of Pittsburgh, where the SCALE project is housed within the Learning Research and Development Center’s Institute for Learning; California State University at Dominguez Hills and Northridge; Los Angeles Unified School District; Denver Public School District; Providence Public School District; and Madison Metropolitan School District. Any opinions, findings, or conclusions are those of the author and do not necessarily reflect the view of the supporting agency.
Draft Version 1 March 2006 Navigating the Unit 3
This Immersion Unit provides a coherent series of lessons designed to guide students in developing deep conceptual understanding that is aligned with the standards, key science concepts and the essential features of classroom inquiry (as defined by the National Science Education Standards). In Immersion Units, students learn academic content by working like scientists: making observations, asking questions, doing further investigations to explore and explain natural phenomena, and communicating results based on evidence. Immersion Units are intended to support teachers in building a learning culture in their classrooms to sustain students’ enthusiasm for engaging in scientific habits of thinking while learning rigorous science content. Each Immersion Unit begins with the Unit Overview including key concepts, evidence for student understanding, assessment strategies and other relevant implementation information. The Unit Overview outlines the conceptual flow and rationale for the structure of the unit.The remainder of the unit is designed as follows with descriptions for each of the sections.
• Step Pages• Snapshot Pages• Lesson Pages• Student Pages• Teacher Pages• Extension Activities
Step Pages consist of an overview of one or more related lessons supporting the conceptual flow within the lessons. The Step Pages provide a brief description of each lesson within the step and an overview of the step including its relationship to the previous and following steps. The title and approximate length of time needed for each lesson is also included on the Step Pages.Snapshot Pages are printed on a single page and provide key information for implementing the lesson. Each lesson has a Snapshot Page that includes the key concept(s), evidence of student understanding, materials, procedures for lesson
implementation, and REAPS—a strategy for assessing student learning. This page is designed to be helpful for the teacher to have on hand while implementing the lesson. Lesson Pages provide learning experiences such as investigations, reading research, or other engaging supporting strategies designed to teach a specific concept(s). They include instructions for any advance preparation required, a detailed implementation guide that explains the design of the lesson, strategies for assessing student learning, and teacher background information on relevant science content. Teaching methodology is addressed in the Implementation Guide for each lesson including specific examples and information related to effective teacher implementation. If research identifies common misconceptions related to the content, a detailed explanation of common misconceptions is provided with suggestions for addressing them. Student Pages may include readings, guides, handouts, maps or instructions to engage students during the lesson. These pages assist in guiding students through the lesson, and are intended to be readily adapted to suit a variety of classrooms with diverse student populations.Teacher Pages may include overheads, maps, data charts and other materials provided to assist with implementation of the lesson.Extension Activities within or at the end of the unit provide opportunities to reinforce student learning or to provide students with additional situations for applying their knowledge. They can also provide the teacher with information to modify and differentiate instruction. The development team for this Immersion Unit intends there to be a variety of opportunities throughout the unit for modifying content and methodology based on your students’ needs and your classroom situation. The basic structure of the unit is designed to support you in anticipating the particular needs of your students to foster understanding of inquiry, nurture classroom communities of science learners, and engage students in learning key science concepts.
Navigating the Unit
4 Exploring Earth’s Landforms Draft Version 1 March 2006
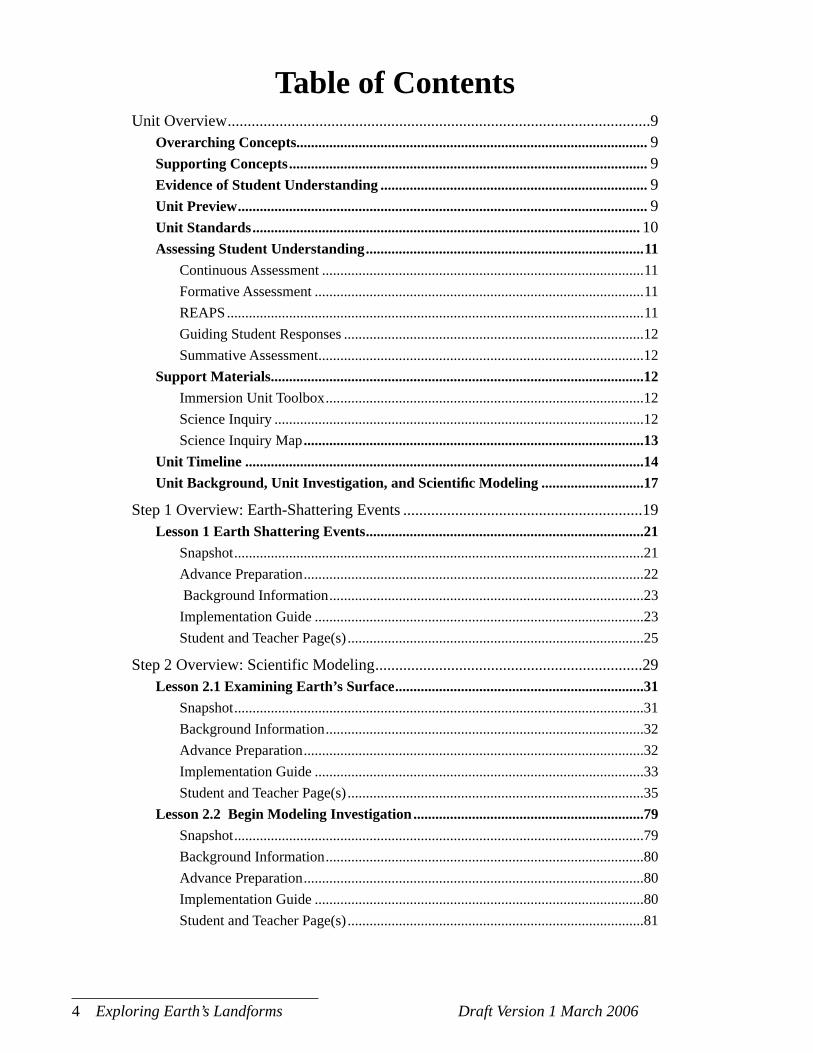
Table of ContentsUnit Overview ..........................................................................................................9
Overarching Concepts................................................................................................ 9Supporting Concepts .................................................................................................. 9Evidence of Student Understanding ......................................................................... 9Unit Preview ................................................................................................................ 9Unit Standards .......................................................................................................... 10Assessing Student Understanding ............................................................................11 Continuous Assessment ........................................................................................11 Formative Assessment ..........................................................................................11 REAPS ..................................................................................................................11 Guiding Student Responses ..................................................................................12 Summative Assessment .........................................................................................12Support Materials ......................................................................................................12 Immersion Unit Toolbox .......................................................................................12 Science Inquiry .....................................................................................................12 Science Inquiry Map .............................................................................................13Unit Timeline .............................................................................................................14Unit Background, Unit Investigation, and Scientifi c Modeling ............................17
Step 1 Overview: Earth-Shattering Events ............................................................19Lesson 1 Earth Shattering Events ............................................................................21
Snapshot ................................................................................................................21Advance Preparation .............................................................................................22 Background Information ......................................................................................23Implementation Guide ..........................................................................................23Student and Teacher Page(s) .................................................................................25
Step 2 Overview: Scientific Modeling ...................................................................29Lesson 2.1 Examining Earth’s Surface ....................................................................31
Snapshot ................................................................................................................31Background Information .......................................................................................32Advance Preparation .............................................................................................32Implementation Guide ..........................................................................................33Student and Teacher Page(s) .................................................................................35
Lesson 2.2 Begin Modeling Investigation ...............................................................79Snapshot ................................................................................................................79Background Information .......................................................................................80Advance Preparation .............................................................................................80Implementation Guide ..........................................................................................80Student and Teacher Page(s) .................................................................................81
Draft Version 1 March 2006 Table of Contents 5
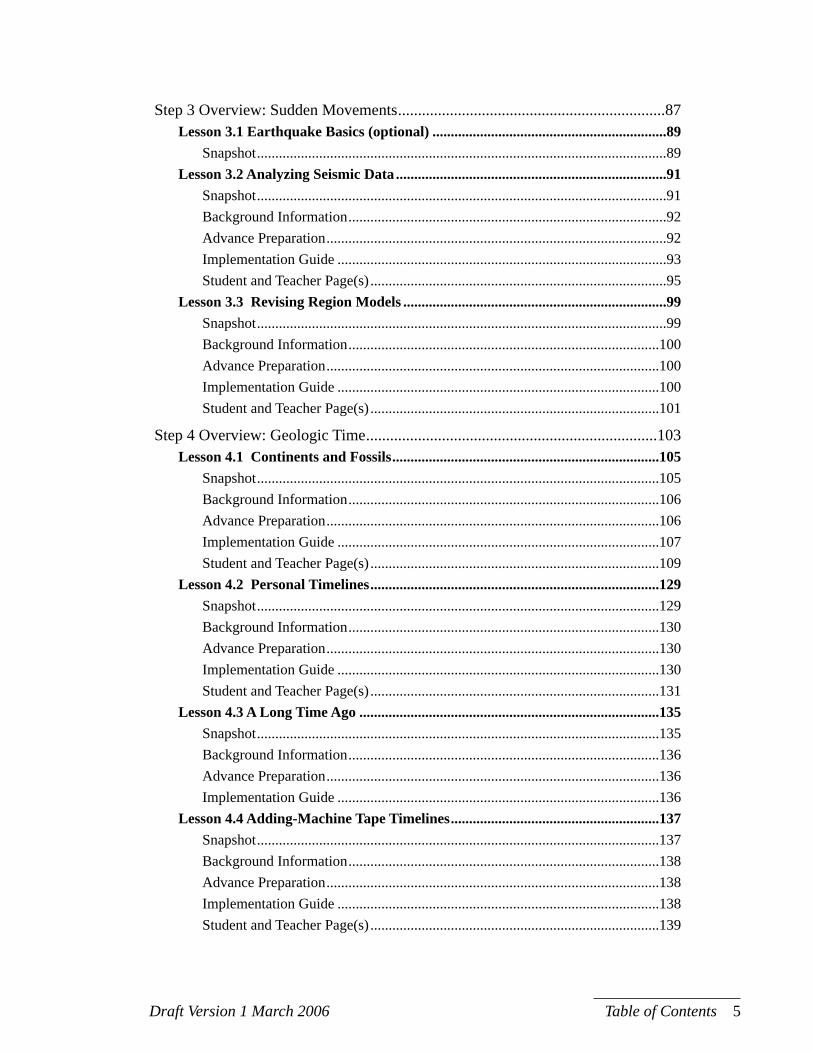
Step 3 Overview: Sudden Movements ...................................................................87Lesson 3.1 Earthquake Basics (optional) ................................................................89
Snapshot ................................................................................................................89Lesson 3.2 Analyzing Seismic Data ..........................................................................91
Snapshot ................................................................................................................91Background Information .......................................................................................92Advance Preparation .............................................................................................92Implementation Guide ..........................................................................................93Student and Teacher Page(s) .................................................................................95
Lesson 3.3 Revising Region Models ........................................................................99Snapshot ................................................................................................................99Background Information .....................................................................................100Advance Preparation ...........................................................................................100Implementation Guide ........................................................................................100Student and Teacher Page(s) ...............................................................................101
Step 4 Overview: Geologic Time .........................................................................103Lesson 4.1 Continents and Fossils .........................................................................105
Snapshot ..............................................................................................................105Background Information .....................................................................................106Advance Preparation ...........................................................................................106Implementation Guide ........................................................................................107Student and Teacher Page(s) ...............................................................................109
Lesson 4.2 Personal Timelines ...............................................................................129Snapshot ..............................................................................................................129Background Information .....................................................................................130Advance Preparation ...........................................................................................130Implementation Guide ........................................................................................130Student and Teacher Page(s) ...............................................................................131
Lesson 4.3 A Long Time Ago ..................................................................................135 Snapshot ..............................................................................................................135
Background Information .....................................................................................136Advance Preparation ...........................................................................................136Implementation Guide ........................................................................................136
Lesson 4.4 Adding-Machine Tape Timelines .........................................................137 Snapshot ..............................................................................................................137
Background Information .....................................................................................138Advance Preparation ...........................................................................................138Implementation Guide ........................................................................................138Student and Teacher Page(s) ...............................................................................139
6 Exploring Earth’s Landforms Draft Version 1 March 2006
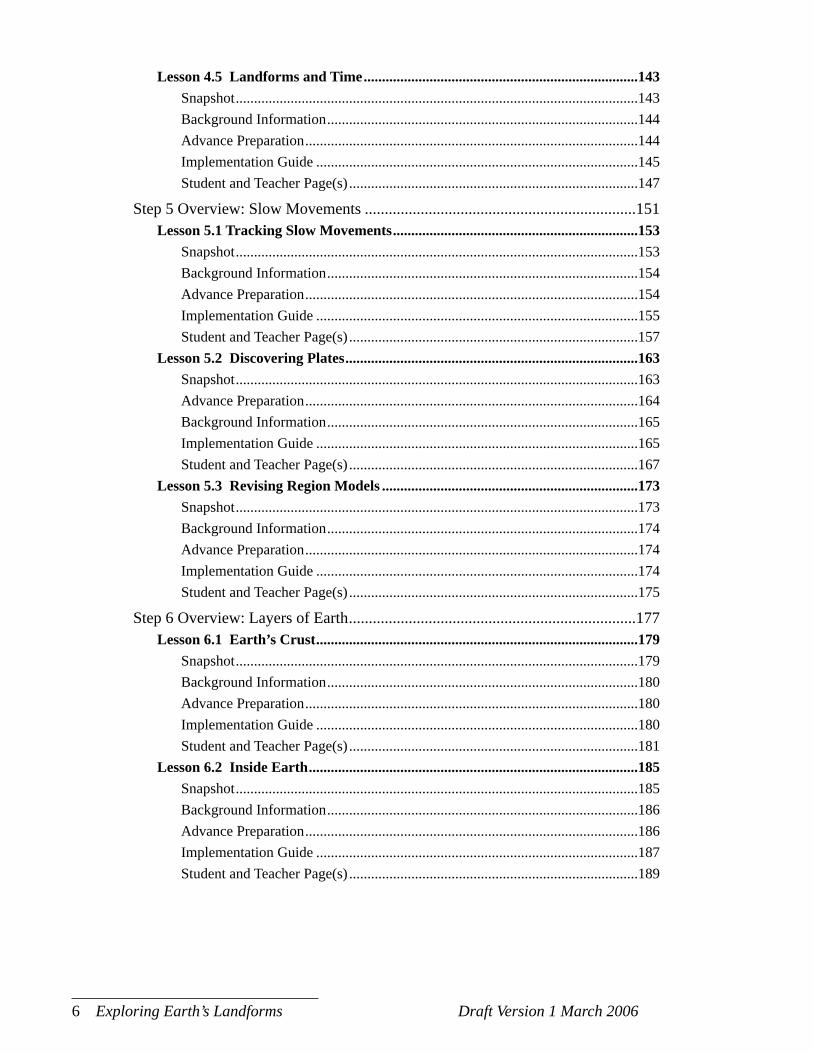
Lesson 4.5 Landforms and Time ...........................................................................143 Snapshot ..............................................................................................................143
Background Information .....................................................................................144Advance Preparation ...........................................................................................144Implementation Guide ........................................................................................145Student and Teacher Page(s) ...............................................................................147
Step 5 Overview: Slow Movements ....................................................................151Lesson 5.1 Tracking Slow Movements ...................................................................153 Snapshot ..............................................................................................................153
Background Information .....................................................................................154Advance Preparation ...........................................................................................154Implementation Guide ........................................................................................155Student and Teacher Page(s) ...............................................................................157
Lesson 5.2 Discovering Plates ................................................................................163 Snapshot ..............................................................................................................163
Advance Preparation ...........................................................................................164Background Information .....................................................................................165Implementation Guide ........................................................................................165Student and Teacher Page(s) ...............................................................................167
Lesson 5.3 Revising Region Models ......................................................................173 Snapshot ..............................................................................................................173
Background Information .....................................................................................174Advance Preparation ...........................................................................................174Implementation Guide ........................................................................................174Student and Teacher Page(s) ...............................................................................175
Step 6 Overview: Layers of Earth ........................................................................177Lesson 6.1 Earth’s Crust ........................................................................................179
Snapshot ..............................................................................................................179Background Information .....................................................................................180Advance Preparation ...........................................................................................180Implementation Guide ........................................................................................180Student and Teacher Page(s) ...............................................................................181
Lesson 6.2 Inside Earth ..........................................................................................185Snapshot ..............................................................................................................185Background Information .....................................................................................186Advance Preparation ...........................................................................................186Implementation Guide ........................................................................................187Student and Teacher Page(s) ...............................................................................189
Draft Version 1 March 2006 Table of Contents 7
Lesson 6.3 Revising Region Models ......................................................................197Snapshot ..............................................................................................................197Background Information .....................................................................................198Advance Preparation ...........................................................................................198Implementation Guide ........................................................................................198Student and Teacher Page(s) ...............................................................................199
Step 7 Overview: Cycle of Rocks ........................................................................201Lesson 7.1 Divergent Plate Boundaries ................................................................203
Snapshot ..............................................................................................................203Background Information .....................................................................................204Advance Preparation ...........................................................................................204Implementation Guide ........................................................................................204Student and Teacher Page(s) ...............................................................................205
Lesson 7.2 Evidence of Subduction .......................................................................209Snapshot ..............................................................................................................209Background Information .....................................................................................210Implementation Guide ........................................................................................210Student and Teacher Page(s) ...............................................................................211
Lesson 7.3 Revising Region Models ......................................................................219Snapshot ..............................................................................................................219Background Information .....................................................................................220Advance Preparation ...........................................................................................220Implementation Guide ........................................................................................220Student and Teacher Page(s) ...............................................................................221
Step 8 Overview: Showcasing and Explaining Earth’s Landforms .....................223Lesson 8.1 Model Showcase ...................................................................................225
Snapshot ..............................................................................................................225Background Information .....................................................................................226Advance Preparation ...........................................................................................227Implementation Guide ........................................................................................227
Lesson 8.2 Exploring Mountains ...........................................................................229Snapshot ..............................................................................................................229Background Information .....................................................................................230Advance Preparation ...........................................................................................230Implementation Guide ........................................................................................231Student and Teacher Page(s) ...............................................................................233
Lesson 8.3 Comparing World Regions .................................................................239Snapshot ..............................................................................................................239Background Information .....................................................................................240Advance Preparation ...........................................................................................240Implementation Guide ........................................................................................241Student and Teacher Page(s) ...............................................................................243
8 Exploring Earth’s Landforms Draft Version 1 March 2006
Step 9 Overview: Rocks, Landforms, and Erosion Processes .............................253Lesson 9.1 Sedimentary Rocks ...............................................................................255
Snapshot ..............................................................................................................255Background Information .....................................................................................256Advance Preparation ...........................................................................................256Implementation Guide ........................................................................................256
Lesson 9.2 Correlating Rocks .................................................................................257Snapshot ..............................................................................................................257Background Information .....................................................................................258Advance Preparation ...........................................................................................258Implementation Guide ........................................................................................258Student and Teacher Page(s) ...............................................................................259
Lesson 9.3 Igneous and Metamorphic Rocks ........................................................269Snapshot ..............................................................................................................269Background Information .....................................................................................270Advance Preparation ...........................................................................................270Implementation Guide ........................................................................................270
Lesson 9.4 Salol Crystals ........................................................................................271Snapshot ..............................................................................................................271Background Information .....................................................................................272Advance Preparation ...........................................................................................272Implementation Guide ........................................................................................272
Lesson 9.5 Landforms and Glaciers .....................................................................273Snapshot ..............................................................................................................273Background Information .....................................................................................274Advance Preparation ...........................................................................................274Implementation Guide ........................................................................................274
Step 10 Overview: Wisconsin Landforms ...........................................................275Lesson 10.1 What About Wisconsin? ....................................................................277
Snapshot ..............................................................................................................277Background Information .....................................................................................278Implementation Guide ........................................................................................278
Lesson 10.2 Exploring Wisconsin Landforms ......................................................279Snapshot ..............................................................................................................279Background Information .....................................................................................280Advance Preparation ...........................................................................................280Implementation Guide ........................................................................................280
Lesson 10.3 Develop-a-Region ...............................................................................281Snapshot ..............................................................................................................281Implementation Guide ........................................................................................282Student and Teacher Page(s) ...............................................................................283
Draft Version 1 March 2006 Unit Overview 9
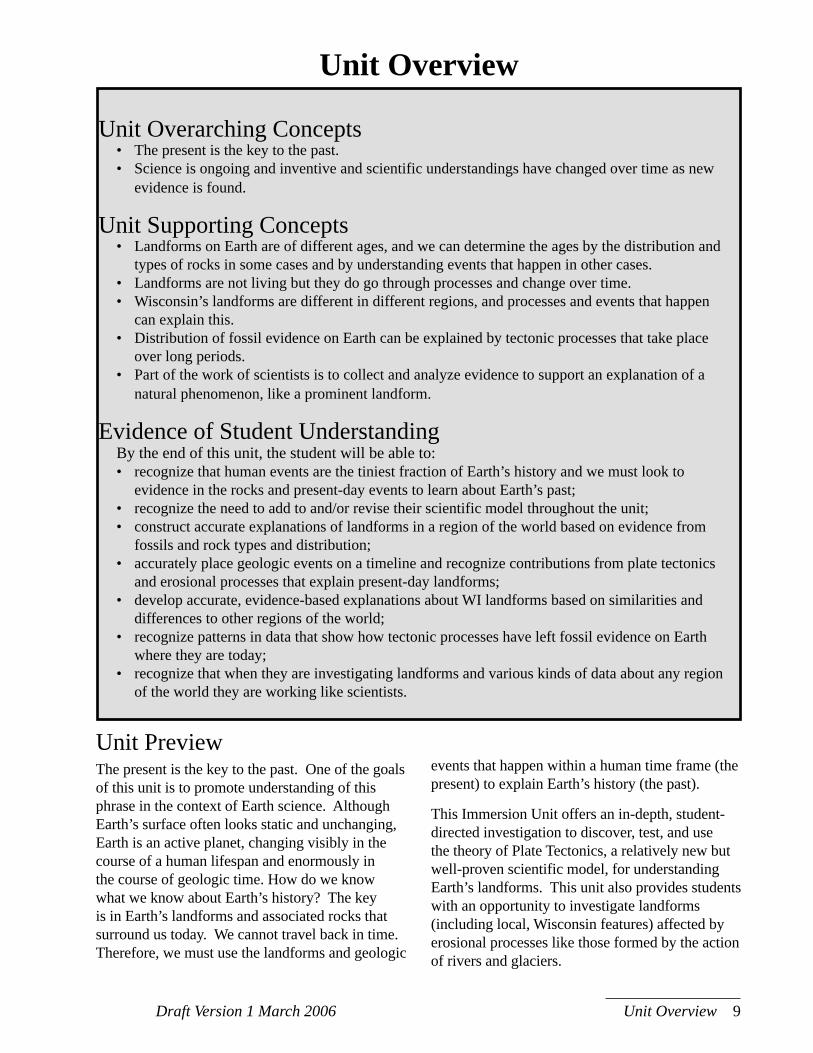
Unit PreviewThe present is the key to the past. One of the goals of this unit is to promote understanding of this phrase in the context of Earth science. Although Earth’s surface often looks static and unchanging, Earth is an active planet, changing visibly in the course of a human lifespan and enormously in the course of geologic time. How do we know what we know about Earth’s history? The key is in Earth’s landforms and associated rocks that surround us today. We cannot travel back in time. Therefore, we must use the landforms and geologic
Unit Overview
events that happen within a human time frame (the present) to explain Earth’s history (the past).
This Immersion Unit offers an in-depth, student-directed investigation to discover, test, and use the theory of Plate Tectonics, a relatively new but well-proven scientific model, for understanding Earth’s landforms. This unit also provides students with an opportunity to investigate landforms (including local, Wisconsin features) affected by erosional processes like those formed by the action of rivers and glaciers.
Unit Overarching Concepts• The present is the key to the past.• Science is ongoing and inventive and scientific understandings have changed over time as new
evidence is found.
Unit Supporting Concepts• Landforms on Earth are of different ages, and we can determine the ages by the distribution and
types of rocks in some cases and by understanding events that happen in other cases.• Landforms are not living but they do go through processes and change over time. • Wisconsin’s landforms are different in different regions, and processes and events that happen
can explain this. • Distribution of fossil evidence on Earth can be explained by tectonic processes that take place
over long periods.• Part of the work of scientists is to collect and analyze evidence to support an explanation of a
natural phenomenon, like a prominent landform.
Evidence of Student UnderstandingBy the end of this unit, the student will be able to:• recognize that human events are the tiniest fraction of Earth’s history and we must look to
evidence in the rocks and present-day events to learn about Earth’s past;• recognize the need to add to and/or revise their scientific model throughout the unit;• construct accurate explanations of landforms in a region of the world based on evidence from
fossils and rock types and distribution;• accurately place geologic events on a timeline and recognize contributions from plate tectonics
and erosional processes that explain present-day landforms;• develop accurate, evidence-based explanations about WI landforms based on similarities and
differences to other regions of the world;• recognize patterns in data that show how tectonic processes have left fossil evidence on Earth
where they are today;• recognize that when they are investigating landforms and various kinds of data about any region
of the world they are working like scientists.
10 Exploring Earth’s Landforms Draft Version 1 March 2006
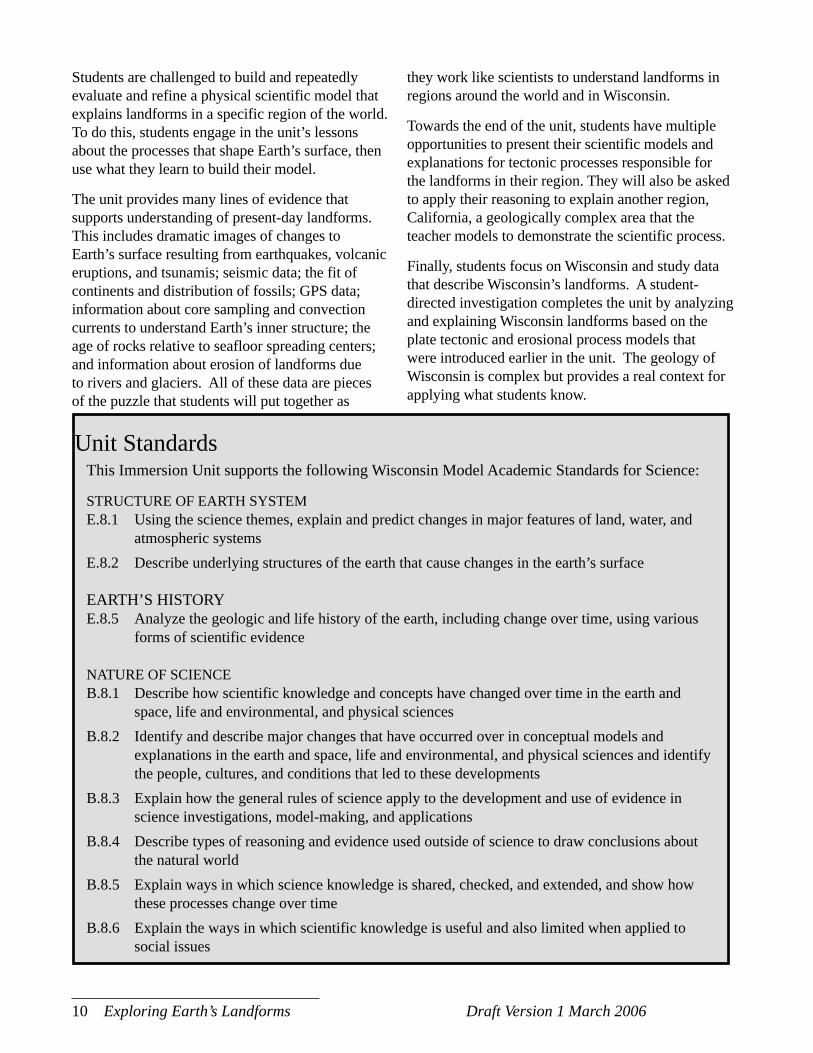
Unit StandardsThis Immersion Unit supports the following Wisconsin Model Academic Standards for Science:
STRUCTURE OF EARTH SYSTEME.8.1 Using the science themes, explain and predict changes in major features of land, water, and
atmospheric systemsE.8.2 Describe underlying structures of the earth that cause changes in the earth’s surface
EARTH’S HISTORYE.8.5 Analyze the geologic and life history of the earth, including change over time, using various
forms of scientific evidence
NATURE OF SCIENCEB.8.1 Describe how scientific knowledge and concepts have changed over time in the earth and
space, life and environmental, and physical sciencesB.8.2 Identify and describe major changes that have occurred over in conceptual models and
explanations in the earth and space, life and environmental, and physical sciences and identify the people, cultures, and conditions that led to these developments
B.8.3 Explain how the general rules of science apply to the development and use of evidence in science investigations, model-making, and applications
B.8.4 Describe types of reasoning and evidence used outside of science to draw conclusions about the natural world
B.8.5 Explain ways in which science knowledge is shared, checked, and extended, and show how these processes change over time
B.8.6 Explain the ways in which scientific knowledge is useful and also limited when applied to social issues
Students are challenged to build and repeatedly evaluate and refine a physical scientific model that explains landforms in a specific region of the world. To do this, students engage in the unit’s lessons about the processes that shape Earth’s surface, then use what they learn to build their model.
The unit provides many lines of evidence that supports understanding of present-day landforms. This includes dramatic images of changes to Earth’s surface resulting from earthquakes, volcanic eruptions, and tsunamis; seismic data; the fit of continents and distribution of fossils; GPS data; information about core sampling and convection currents to understand Earth’s inner structure; the age of rocks relative to seafloor spreading centers; and information about erosion of landforms due to rivers and glaciers. All of these data are pieces of the puzzle that students will put together as
they work like scientists to understand landforms in regions around the world and in Wisconsin.
Towards the end of the unit, students have multiple opportunities to present their scientific models and explanations for tectonic processes responsible for the landforms in their region. They will also be asked to apply their reasoning to explain another region, California, a geologically complex area that the teacher models to demonstrate the scientific process.
Finally, students focus on Wisconsin and study data that describe Wisconsin’s landforms. A student-directed investigation completes the unit by analyzing and explaining Wisconsin landforms based on the plate tectonic and erosional process models that were introduced earlier in the unit. The geology of Wisconsin is complex but provides a real context for applying what students know.
Draft Version 1 March 2006 Unit Overview 11
Assessing Student UnderstandingContinuous AssessmentThe focus for this unit will be on continuous assessment—the day-to-day observation/documentation of student work for the purpose of moving them forward in their understanding and practice of science. Continuous assessment is an inquiry into what students know and are able to do.The following section contains ideas for teachers to assess and document student learning throughout the unit for the purpose of modifying instruction and ensuring student learning using a variety of assessment techniques.
Formative AssessmentFormative assessments provide information to students and teachers that is used to improve teaching and learning. These are often informal and ongoing.
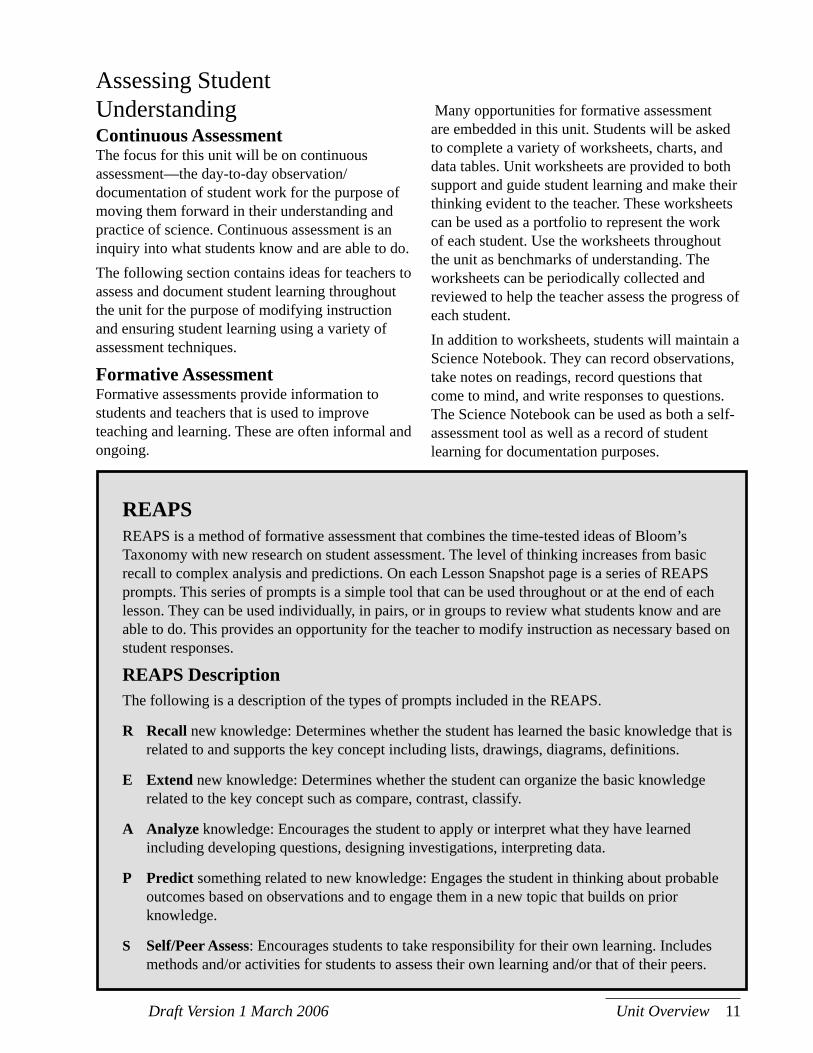
REAPSREAPS is a method of formative assessment that combines the time-tested ideas of Bloom’s Taxonomy with new research on student assessment. The level of thinking increases from basic recall to complex analysis and predictions. On each Lesson Snapshot page is a series of REAPS prompts. This series of prompts is a simple tool that can be used throughout or at the end of each lesson. They can be used individually, in pairs, or in groups to review what students know and are able to do. This provides an opportunity for the teacher to modify instruction as necessary based on student responses.
REAPS DescriptionThe following is a description of the types of prompts included in the REAPS.
R Recall new knowledge: Determines whether the student has learned the basic knowledge that is related to and supports the key concept including lists, drawings, diagrams, definitions.
E Extend new knowledge: Determines whether the student can organize the basic knowledge related to the key concept such as compare, contrast, classify.
A Analyze knowledge: Encourages the student to apply or interpret what they have learned including developing questions, designing investigations, interpreting data.
P Predict something related to new knowledge: Engages the student in thinking about probable outcomes based on observations and to engage them in a new topic that builds on prior knowledge.
S Self/Peer Assess: Encourages students to take responsibility for their own learning. Includes methods and/or activities for students to assess their own learning and/or that of their peers.
Many opportunities for formative assessment are embedded in this unit. Students will be asked to complete a variety of worksheets, charts, and data tables. Unit worksheets are provided to both support and guide student learning and make their thinking evident to the teacher. These worksheets can be used as a portfolio to represent the work of each student. Use the worksheets throughout the unit as benchmarks of understanding. The worksheets can be periodically collected and reviewed to help the teacher assess the progress of each student. In addition to worksheets, students will maintain a Science Notebook. They can record observations, take notes on readings, record questions that come to mind, and write responses to questions. The Science Notebook can be used as both a self-assessment tool as well as a record of student learning for documentation purposes.
12 Exploring Earth’s Landforms Draft Version 1 March 2006
Guiding Student ResponsesThe REAPS prompts increase in cognitive difficulty with Recall as the easiest and Predict as usually the most advanced. Students will most likely demonstrate confidence and ability when responding to the first few prompts, while demonstrating continuous improvement in responding to the Analyze and Predict prompts. Students are not expected to master all of the skills, but are encouraged to extend their thinking. Where appropriate, suggested responses are included after the prompts. While these are good responses, other responses may be valid with supportive evidence and reasoning.
Summative AssessmentSummative assessment refers to the cumulative assessments that capture what a student has learned and is able to do. They also can assess student performance based on standards. Summative assessments are often thought of as traditional objective tests but this need not be the case. For example, summative assessments can be an accumulation of evidence collected over time, as in a collection of student work or a Science Notebook. Summative assessments are often performance-based requiring students to actively engage in activities such as writing, presenting, demonstrating, manipulating materials, and applying their learning in multiple ways.Within this unit are several opportunities for formal documentation of student progress. These techniques provide the teacher with information about student learning for instructional decision-making as well as a tool for formal reporting of student progress.
Support MaterialsImmersion Unit Toolbox and CDThe Immersion Unit Toolbox provides practical suggestions and multiple tools for teaching scientific content through inquiry. The Immersion Unit Toolbox provides additional explanations
for how to use and learn more about a variety of key strategies that Immersion Units incorporate to support student engagement in scientific inquiry based on the Five Essential Features of Classroom Inquiry. This unit refers to the Toolbox when suggesting a particular strategy that is further explained in that resource. This Immersion Unit comes with a data CD containing several multimedia files for use in various points throughout the unit. A CD icon highlights the points where these materials are referenced in the lessons.
Science Inquiry The Science Inquiry Map illustrates the Five Essential Features of Inquiry. The inquiry process is dynamic and does not necessarily follow a linear order. For example, a student may develop an explanation that leads to a new scientific question or revisit evidence in light of alternative explanations. There may also be occasions when multiple features overlap or, depending on the type of lesson, some features may have more emphasis than others. These variations allow learners the freedom to inquire, experience, and understand scientific knowledge. The Five Essential Features of Inquiry describe how engaging in science inquiry unfolds in the classroom.
Looks Like/Sounds LikeIn this unit, students will often be asked to reflect on what they have been doing that “Looks Like” something a scientist would do or “Sounds Like” something a scientist would do. If students struggle with this, they can be prompted by asking, “What would a visitor see and hear us doing during science time?” In field studies, students were often unaware of how what they were doing in the classroom was like what scientists do. Using a Looks Like/Sounds Like strategy assisted students in recognizing their participation in the process of science inquiry. It also allowed teachers to assess student growth in science inquiry skills more concretely, as opposed to solely relying on observations of student performance.

Draft Version 1 March 2006 Unit Overview 13
Learner formulates explanationsfrom evidence
Learner formulates explanationsfrom evidence
Learner gives priority to evidencein responding to questions
Learner engages in scientificallyoriented questions
Learner communicates andjustifies explanations
Learner connects explanationsto scientific knowledge
Learner connects explanationsto scientific knowledge
Adapted from the National Research Council. 2000: Inquiry and the National Science Education Standards. Washington D.C.: National Academy Press
My Results:
SCIENCE INQUIRY MAPSCIENCE INQUIRY MAP
SC LESYSTEM-WIDE CHANGE FOR ALL LEARNERS AND EDUCATORS
14 Exploring Earth’s Landforms Draft Version 1 March 2006
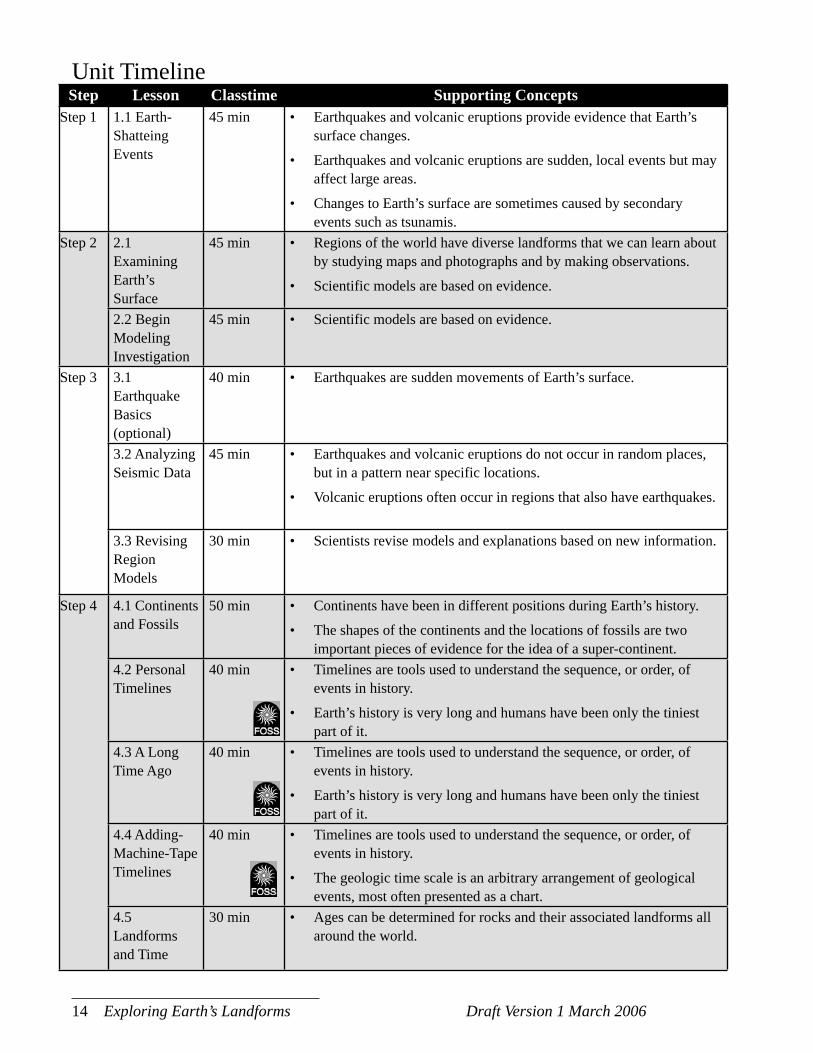
Step Lesson Classtime Supporting ConceptsStep 1 1.1 Earth-
Shatteing Events
45 min Earthquakes and volcanic eruptions provide evidence that Earth’s surface changes.
Earthquakes and volcanic eruptions are sudden, local events but may affect large areas.
Changes to Earth’s surface are sometimes caused by secondary events such as tsunamis.
•
•
•
Step 2 2.1 Examining Earth’s Surface
45 min Regions of the world have diverse landforms that we can learn about by studying maps and photographs and by making observations.
Scientific models are based on evidence.
•
•
2.2 Begin Modeling Investigation
45 min Scientific models are based on evidence.•
Step 3 3.1 Earthquake Basics (optional)
40 min Earthquakes are sudden movements of Earth’s surface.•
3.2 Analyzing Seismic Data
45 min Earthquakes and volcanic eruptions do not occur in random places, but in a pattern near specific locations.
Volcanic eruptions often occur in regions that also have earthquakes.
•
•
3.3 Revising Region Models
30 min Scientists revise models and explanations based on new information.•
Step 4 4.1 Continents and Fossils
50 min Continents have been in different positions during Earth’s history.
The shapes of the continents and the locations of fossils are two important pieces of evidence for the idea of a super-continent.
•
•
4.2 Personal Timelines
40 min Timelines are tools used to understand the sequence, or order, of events in history.
Earth’s history is very long and humans have been only the tiniest part of it.
•
•
4.3 A Long Time Ago
40 min Timelines are tools used to understand the sequence, or order, of events in history.
Earth’s history is very long and humans have been only the tiniest part of it.
•
•
4.4 Adding-Machine-Tape Timelines
40 min Timelines are tools used to understand the sequence, or order, of events in history.
The geologic time scale is an arbitrary arrangement of geological events, most often presented as a chart.
•
•
4.5 Landforms and Time
30 min Ages can be determined for rocks and their associated landforms all around the world.
•
Unit Timeline
Draft Version 1 March 2006 Unit Overview 15
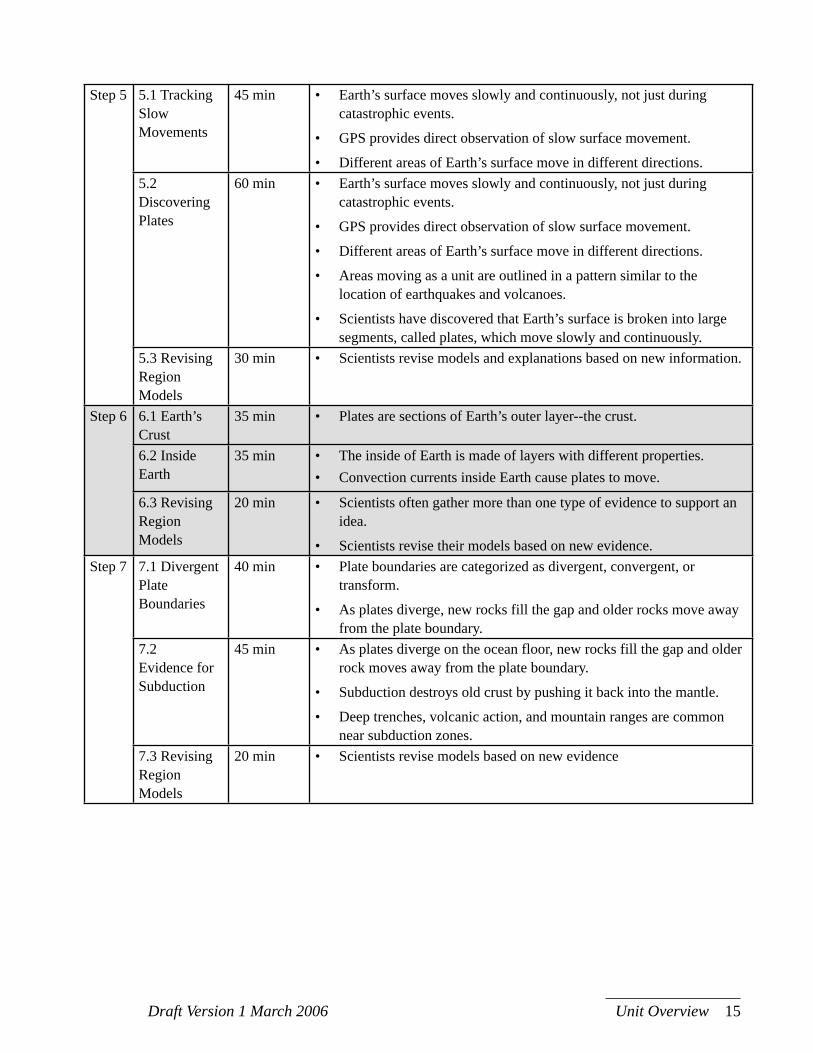
Step 5 5.1 Tracking Slow Movements
45 min Earth’s surface moves slowly and continuously, not just during catastrophic events.
GPS provides direct observation of slow surface movement.
Different areas of Earth’s surface move in different directions.
•
•
•5.2 Discovering Plates
60 min Earth’s surface moves slowly and continuously, not just during catastrophic events.
GPS provides direct observation of slow surface movement.
Different areas of Earth’s surface move in different directions.
Areas moving as a unit are outlined in a pattern similar to the location of earthquakes and volcanoes.
Scientists have discovered that Earth’s surface is broken into large segments, called plates, which move slowly and continuously.
•
•
•
•
•
5.3 Revising Region Models
30 min Scientists revise models and explanations based on new information.•
Step 6 6.1 Earth’s Crust
35 min Plates are sections of Earth’s outer layer--the crust.•
6.2 Inside Earth
35 min The inside of Earth is made of layers with different properties.Convection currents inside Earth cause plates to move.
••
6.3 Revising Region Models
20 min Scientists often gather more than one type of evidence to support an idea.
Scientists revise their models based on new evidence.
•
•Step 7 7.1 Divergent
Plate Boundaries
40 min Plate boundaries are categorized as divergent, convergent, or transform.
As plates diverge, new rocks fill the gap and older rocks move away from the plate boundary.
•
•
7.2 Evidence for Subduction
45 min As plates diverge on the ocean floor, new rocks fill the gap and older rock moves away from the plate boundary.
Subduction destroys old crust by pushing it back into the mantle.
Deep trenches, volcanic action, and mountain ranges are common near subduction zones.
•
•
•
7.3 Revising Region Models
20 min Scientists revise models based on new evidence•
16 Exploring Earth’s Landforms Draft Version 1 March 2006
Step 8 8.1 Model Showcase
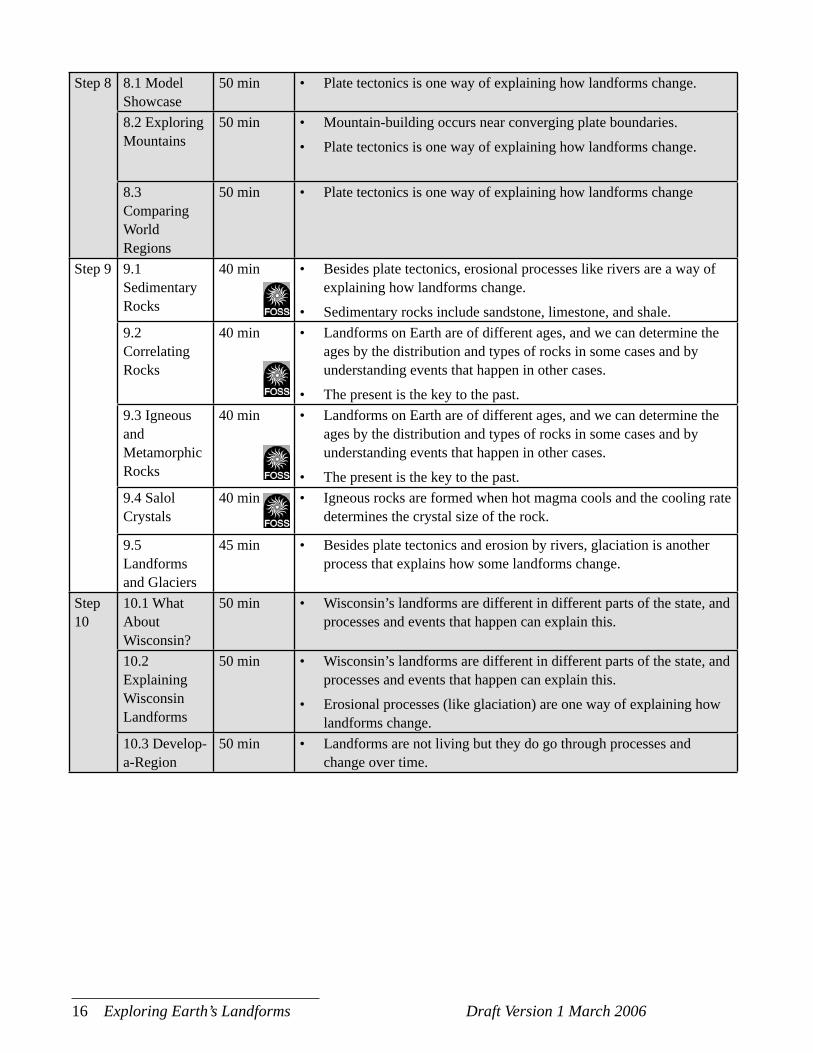
50 min Plate tectonics is one way of explaining how landforms change.•
8.2 Exploring Mountains
50 min Mountain-building occurs near converging plate boundaries.
Plate tectonics is one way of explaining how landforms change.
•
•
8.3 Comparing World Regions
50 min Plate tectonics is one way of explaining how landforms change•
Step 9 9.1 Sedimentary Rocks
40 min Besides plate tectonics, erosional processes like rivers are a way of explaining how landforms change.
Sedimentary rocks include sandstone, limestone, and shale.
•
•9.2 Correlating Rocks
40 min Landforms on Earth are of different ages, and we can determine the ages by the distribution and types of rocks in some cases and by understanding events that happen in other cases.
The present is the key to the past.
•
•9.3 Igneous and Metamorphic Rocks
40 min Landforms on Earth are of different ages, and we can determine the ages by the distribution and types of rocks in some cases and by understanding events that happen in other cases.
The present is the key to the past.
•
•9.4 Salol Crystals
40 min Igneous rocks are formed when hot magma cools and the cooling rate determines the crystal size of the rock.
•
9.5 Landforms and Glaciers
45 min Besides plate tectonics and erosion by rivers, glaciation is another process that explains how some landforms change.
•
Step 10
10.1 What About Wisconsin?
50 min Wisconsin’s landforms are different in different parts of the state, and processes and events that happen can explain this.
•
10.2 Explaining Wisconsin Landforms
50 min Wisconsin’s landforms are different in different parts of the state, and processes and events that happen can explain this.
Erosional processes (like glaciation) are one way of explaining how landforms change.
•
•
10.3 Develop-a-Region
50 min Landforms are not living but they do go through processes and change over time.
•
Draft Version 1 March 2006 Unit Overview 17
Unit Content BackgroundThis Unit teaches students the science of plate tectonics and erosion processes due to rivers and glaciers. These are three of the major processes that shape Earth’s landforms. Plate tectonics is a scientific theory describing how major landforms and events (including mountain ranges, deep ocean trenches, volcanoes, and earthquakes) affect Earth’s surface. Note that in science a “theory” is not “just an idea”. In science, a “theory” is a well-proven set of ideas that accurately explains one or more natural phenomena. Theories are well-entrenched in scientific thought. While plate tectonics is a relatively new theory (developed in the mid-20th century), it accurately describes many features of Earth’s surface. Landforms are also influenced by rivers and glaciers over long periods of time and these processes are also taught in this Unit.
Unit Investigation and Scientific ModelingThe Unit Investigation is a student-directed inquiry to meet this challenge: How can you explain land formations and processes that formed them in a region of the world using a physical scientific model? Students develop a model for the surface structures, plates, plate interactions, and Earth’s layers in a particular region of the world. They develop the model in cycles, changing it as lessons in the unit reveal evidence for new concepts. For each version of the model, students report their rationale, the ideas they want to convey, and their evidence. In the end, the class shares the models as students collect observations and look for global patterns. However, what students build in this investigation is more than a display. A physical scientific model is a tool in the scientific process of asking questions, using evidence to test ideas, and modifying explanations. Students will go through several cycles of collecting evidence, forming ideas, and building a model to communicate their ideas.
The initial model will be simple, mostly showing only surface features. As students gain knowledge about plate tectonics, they re-evaluate their model, add to and modify it to reflect how those features came about. The model progresses from representing concrete ideas to more abstract ideas. The design plan and the legend displayed with each version of the model are things to check for conceptual understanding. The student’s ability to state the strengths and limitations of a model are as important as the model itself.What is a scientific model and why use one in teaching?Models are often thought of as static, prefabricated, physical representations of some structure, such as the human heart or the solar system. Indeed, these are one kind of model, often referred to as scale replicas. However, there are many other types of models, and in science models are important tools. Scientists use evidence to design and use models for specific processes. Models provide a way to work out relationships that may not be feasible through direct observations. In fact, making accurate predictions about a natural phenomenon is one of the main goals of scientific work. Models can be static or dynamic, physical or mathematical, concrete or abstract. As students learn how scientists think and work, it is useful for them to share the experience of model design and construction. In this unit, the model’s development is used to support students in developing an understanding of the abstract concepts associated with tectonic processes and Earth’s structure. As students have the chance to use evidence to evaluate and modify their models, they interact with these concepts by applying them to a real region of the world.Students are guided in this unit to include a legend and written explanation with each model revision to show their understanding of the dynamic processes. In this way, the model provides a concrete example for students to interact with and apply their understanding of new evidence to as it is introduced throughout the unit.
18 Exploring Earth’s Landforms Draft Version 1 March 2006
How will you help students achieve success with the investigation?The key to success with the model inquiry in this unit is to allow the model to begin simple and change over time to become more complex. The first model will likely show only surface features like mountain ranges and valleys. (This is the only evidence students have uncovered from a reading about their region and a physical map at this time.) Then, as students learn about areas of seismic activity and plate boundaries, they can revise the models to include where those are located in their region. Similarly, when they learn about Earth’s structure, they can include cross-section information that explains how convection currents cause the plates in their region to move.Allow students to make choices in model construction that may require significant revision when additional evidence is learned. Continually inform the students that real scientific models, like the ones they are building, change as new evidence is brought to bear on a problem or question. Keeping students from being attached to a “pretty” model will make it easier for them to change the model over time. Also, prompt students to ask questions of their model: Does it accurately explain the evidence for Earth’s surface features and processes in that region? If so, how? If not, what are some limitations to the model?The cycle of learning about new evidence for landform development and then inquiring if the model accounts for the new evidence is repeated as students develop a rich understanding of plate tectonics, Earth’s history, and erosion processes.
This continues in parallel with the guided inquiry. Eventually, students develop scientific explanations for the landforms in various regions around the world. In this way, students have time to acquire and use this content knowledge in-depth as they improve their critical thinking skills.
To clearly demonstrate what scientific modeling is all about, the teacher has an opportunity to “model the modeling process” by studying the region of California. This is done along with the students so that, as new evidence is learned, the model of California can be an example for how to revise and improve models of the other regions. California is a region that provides clear examples of most of the concepts discussed in this unit. It is therefore a great way for students to see how they should be working like scientists on their own region model.
Landforms Evidence ChartSince there are many lines of evidence that together explain Earth’s landforms, this Unit includes a graphic organizer called the Landforms Evidence Chart that will help you and your students keep track of it all. A sample is shown on the CD. Throughout the unit, referring to this Chart will help students see the evidence or data, patterns in that data, and understand how it applies to particular present-day landforms. The Chart also provides an opportunity for students to learn how landforms change over time. At the end of the Unit, in the investigation of Wisconsin landforms, students will be able to refer to the Chart to develop their own evidence-based explanations for local landforms.
S T E P
1
Overview: Earth-Shattering Events
The drama of Earth-shattering events such as volcanic eruptions, earthquakes and tsunamis introduces this unit. This step should be fast-paced and engaging. showing students some unusual pictures that are evidence that Earth’s surface does change. The goal is to grab students’ attention and let them begin to ask questions about the earth’s sudden movements, wonder why they occur, and understand how they are evidence that Earth’s surface changes.
Students view still images and/or videos, read an essay, and imagine themselves near these events. Students individually will develop a list of questions they have about these dramatic events to more fully engage in learning. Students will read and discuss an article called Wall of Water about the 2004 Indian Ocean earthquake and tsunami and answer reflection questions on the Student Pages. Students are then guided to think about how local events are related to global processes that change Earth’s surface.
Lesson 1.1
Earth-Shattering Events (45 min)

Draft Version 1 March 2006 Step 1: Earth-Shattering Events 21
Key Concepts• Earthquakes and volcanic
eruptions provide evidence that Earth’s surface changes.
• Earthquakes and volcanic eruptions are sudden, local events but may affect large areas.
• Changes to Earth’s surface are sometimes caused by secondary events such as tsunamis.
Evidence of Student UnderstandingThe student will be able to: • identify one or more sudden events
such as earthquakes, volcanic eruptions, or tsunamis that are evidence of Earth’s changing surface.
Time Needed45 minutesMaterialsFor the class• CD slide show of natural
hazards images (or printed slides on transparency film)
• data projector (if using CD) or overhead projector (if using transparencies)
• (optional) TV and VHS or DVD player (if using video)
• (optional) natural hazards video (from list of recommended videos – see teacher preparation section)
For each student• copies of Student Page 1.1: Wall of
Water• Science Notebook (to be used
throughout unit)Provided on this Unit’s CD. Use “Step 1 – Earth-Shattering Events slide show.ppt” file.
Earth-Shattering Events1. Inform students that they will be keeping a science
notebook throughout this unit. Discuss guidelines for this. Have students record observations and questions about the earth’s sudden movements in their notebooks.
2. Show students images of earthquakes, volcanoes, and related damage and changes to landforms. Use a combination of small-group and whole-class discussion to share student observations, inferences, and questions about the scenes. Highlight the difference between an observation and an inference as students comment on the images.
Step 1 - Lesson 1 Snapshot
REAPSR Are earthquakes and volcanic eruptions sudden
or slow events? Earthquakes and volcanic eruptions are typically
sudden events.E Describe an experience you have had with an
earthquake or volcanic eruption. Answers will vary with students’ experiences. Use
this statement to learn more about students’ prior knowledge about these events if they did not share their own experiences already.
A Write down one question you have about earthquakes, volcanoes, or tsunamis.
Answers will vary. Inform students that they will have an opportunity to answer some of these questions, where appropriate, in this unit.
P Given what you know about how Earth’s surface changes, how do you think Earth’s surface might change in the future?
Use this question to assess prior conceptions students have about processes that influence Earth’s landforms.
S Imagine yourself in a situation like the people in Thailand and Sumatra on December 26, 2004. Describe to a classmate how this experience might change your thinking about whether Earth’s surface is fixed and unchanging.
(continued on following page)
22 Exploring Earth’s Landforms Draft Version 1 March 2006
Advance Preparation
Arrange for students to see images of earthquake damage and evidence of volcanic eruptions provided on this Unit’s CD or a short video of earth-shattering events. Some options include:•using a data projector to display the slide show directly from the CD to the whole class•printing the slides on transparencies to project for the whole class•printing the slides on paper and providing groups of students with a few pictures each•loading the slide show onto individual computers and letting students view them individually or in small groups•displaying a few minutes of a video of natural hazards (from list of recommended videos)
List of recommended videos:•Forces of Nature—National Geographic (DVD/VHS)•Nature’s Fury—National Geographic (DVD/VHS)•Several good documentaries on Earth Science are available through the PBS programs NOVA and Nature.
The goal for the image display is to pique student interest in the subject, elicit prior knowledge, and highlight observations and inferences, not teach facts about earthquakes, volcanoes, and plate tectonics. Just a few minutes of captivating images with a guided discussion about what students think the underlying causes of the events are is sufficient. Particularly try to avoid showing videos with discussions of plate tectonics theory as this unit will guide students’ own inquiry on the subject and lead them to develop an understanding of plate tectonics and other processes that shape Earth’s landforms. Students should come away with the idea of using evidence to recognize that Earth’s surface is dynamic.
3. Use a classroom reading strategy or have students individually read Student Page 1.1: Wall of Water. Ask for reactions to the story. Discuss the Think and Write topics at the end of the article.
4. To emphasize how earthquakes are sudden events, stop the whole class for 200 seconds,
(continued from previous page)the length of the earthquake that preceded the tsunami in the reading. Gather student reactions. Emphasize how we usually tend to think of Earth’s surface as solid and unchanging, yet earthquakes and volcanoes provide strong evidence that it is not.
5. Use the REAPS throughout and after the lesson as appropriate.
Draft Version 1 March 2006 Step 1: Earth-Shattering Events 23
Background Information“Earth-shattering events” in this unit refer to sudden, natural hazards like volcanic eruptions, earthquakes, and tsunamis. These events usually happen quickly, often with little or no warning, and can dramatically change Earth’s surface.
Volcanoes are mountains formed by one or more eruptions of molten rock that comes from deep beneath the surface. Scientists have classified several types of volcanoes and volcanic eruptions, but all involve certain kinds of rock and hot gases. Aside from lava flows or explosions of gas and hot rocks, volcanoes can also cause mudflows. These originate from the combination of ash and rain or melted snow and ice from the peak of a volcano. The term “volcano” does not only refer to an active, erupting mountain. Volcanoes may be inactive for many years between eruptions. Volcanic activity can produce sudden changes like spewing lava or the collapse of a peak. However, much volcanic activity takes place over many years. Some volcanic islands, like those in Hawaii for example, grow slowly over thousands of years.
Earthquakes are sudden shifts in large pieces of Earth’s crust. Cracking or displacement in the earth occurs but there are no gaping holes as sometimes depicted in science fiction movies. The earth may shift laterally and/or vertically and the release of energy during an earthquake causes the ground to shake.
Tsunamis are sometimes caused by large earthquakes, but are also caused by landslides or other events that rapidly displace large amounts of water. A large earthquake beneath the ocean floor generated the 2004 Indian Ocean tsunami. However, not all earthquakes produce a tsunami. The word “tsunami” is often interchanged with the phrase “tidal wave.” “Tidal wave” is a misnomer for this event since tectonic forces (not tidal forces) cause tsunamis. Tsunami, meaning “harbor wave” in Japanese, is the proper term for a very large ocean wave resulting from a large displacement of water. Tsunamis usually only appear large near shallow coastlines, perhaps just moments before landfall.
Implementation Guide1. Explain that students will use a Science
Notebook throughout this unit. Discuss the guidelines and purpose for this. Have students record observations and questions they have after viewing the earth-shattering events slide show and reading Wall of Water. Explain to students that this notebook will be a record of their experiences for this entire unit and they will often refer to notes or drawings that they make in this notebook. If this is the students’ first experience with recording scientific notes, spend some time discussing a protocol for the writing. Encourage students to use as many descriptive terms as possible in their written observations and to use colors, labels, and an appropriate scale in any scientific illustrations. Sometimes students have a hard time differentiating between artistic drawing and scientific illustration. Remind them that when drawing something scientifically, the goal is to draw only what they see and to do so as accurately as possible.
Good written notes and illustrations will help students assess their own progress and provide evidence for developing scientific explanations for what they are learning. Encourage students to ask many questions as they arise and to record both questions and ideas about possible answers in their Science Notebooks.
2. Show still images (or video) of earthquakes, volcanoes, and related damage and changes to landforms. The PowerPoint™ file “Step 1 – Earth-Shattering Events Slide Show” is provided on this Unit’s CD for this purpose. Resist the temptation to explain these events. Prompt students to observe interesting aspects of these events and think about what may have caused them. Ask questions like, “What do you think caused that building to collapse?” or “What do you think caused that flood?” After viewing, discuss student ideas about the images. What do they think about the images? Do the pictures seem believable? Have they ever experienced anything like
24 Exploring Earth’s Landforms Draft Version 1 March 2006
them? Most importantly, ask for thoughts on Earth and its surface. Do students think of Earth’s surface as solid and unchanging? What other evidence do we have that Earth’s surface changes? This could be a think-pair-share activity or a large group discussion. Throughout the discussion note when students are acting like scientists in making observations and inferences (explanations based on observations and existing conceptions).
3. Have students read Student Page 1.1: Wall of Water. Ask for students’ reaction to the story. What have they heard about this event in the news? Discuss the Think and Write topics at the end of the article. You may wish to use a classroom reading strategy or other method to help students understand the reading.
4. Ask students if they can imagine how it must have felt during the earthquake that led to the 2004 Indian Ocean tsunami. How long did the earthquake last? To simulate the length of the earthquake, have students stay quiet while they watch the second hand of a clock for 200 seconds. This would be the time for a very long earthquake like that in the reading. Use this example to emphasize how earthquakes and volcanoes are sudden events; students will later be introduced to long-term geologic processes that shape the earth less dramatically. Ask for students’ reactions to such an event and whether or not events like these make them change their thinking about Earth’s surface. What evidence do we have that Earth’s surface changes?
5. Use the REAPS throughout and after the lesson as appropriate.
Think and WriteHow would you know that a tsunami was coming? Could people have been warned about thetsunami before it came? There is not much warning for a tsunami. They move fast. One indicator for people on
shore that the article mentions is a fast drop in the water level near land, but this does not always happen. Other indicators are changes in the water level in the ocean. Someone in a boat on the water may not notice when the tsunami wave passes. Tsunamis will only form a tall wave when they reach shallow water. The biggest threat from a tsunami is when the wave hits the shore.
There are tsunami warning systems in some parts of the world’s oceans. Your students may have heard of these. Tsunami warning systems work by placing buoys in the ocean and monitoring them with GPS (global positioning system). When there is a significant rise in the buoys, scientists know that a tsunami is passing. There is no warning system in the Indian Ocean where this tsunami took place. Ask students what they think might have happened if there was a tsunami warning system in the area. How would people have protected themselves from the wave?
Where did the earthquake cause damage? In the area near the epicenter or over a large area? The earthquake itself caused damage near the epicenter, the point on Earth’s surface
directly above where the earthquake began. It also triggered a tsunami that affected a much larger area. There were also secondary effects, like the destruction of communication lines, ports, and clean water supplies.
Draft Version 1 March 2006 Step 1: Earth-Shattering Events 25
9:00 AM, December 26, 2004The beautiful waters of the Andaman Sea near Phuket, Thailand were waiting for two American tourists. They were planning to go snorkeling that morning. These tourists also happened to be research scientists. Here is their story.
They left the shore in a boat with other tourists at 9:00 AM. As they approached the island where they planned to snorkel, something seemed strange. The water level had fallen very low. The spot where they planned to go snorkeling was not under water. People who lived on the island were very worried.
Then the news came. The tourists heard that a huge earthquake had struck far away near the island of Sumatra.
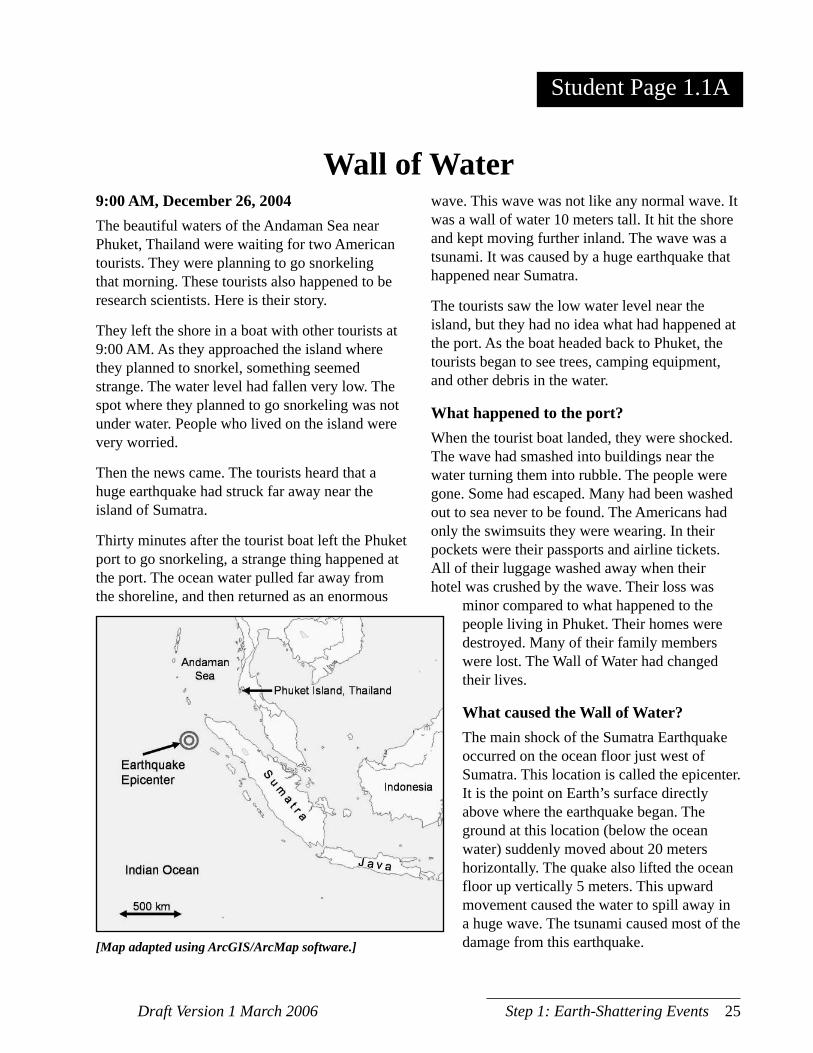
Thirty minutes after the tourist boat left the Phuket port to go snorkeling, a strange thing happened at the port. The ocean water pulled far away from the shoreline, and then returned as an enormous
STUDENT PAGE
Wall of Waterwave. This wave was not like any normal wave. It was a wall of water 10 meters tall. It hit the shore and kept moving further inland. The wave was a tsunami. It was caused by a huge earthquake that happened near Sumatra.
The tourists saw the low water level near the island, but they had no idea what had happened at the port. As the boat headed back to Phuket, the tourists began to see trees, camping equipment, and other debris in the water.
What happened to the port?When the tourist boat landed, they were shocked. The wave had smashed into buildings near the water turning them into rubble. The people were gone. Some had escaped. Many had been washed out to sea never to be found. The Americans had only the swimsuits they were wearing. In their pockets were their passports and airline tickets. All of their luggage washed away when their hotel was crushed by the wave. Their loss was
minor compared to what happened to the people living in Phuket. Their homes were destroyed. Many of their family members were lost. The Wall of Water had changed their lives.
What caused the Wall of Water?The main shock of the Sumatra Earthquake occurred on the ocean floor just west of Sumatra. This location is called the epicenter. It is the point on Earth’s surface directly above where the earthquake began. The ground at this location (below the ocean water) suddenly moved about 20 meters horizontally. The quake also lifted the ocean floor up vertically 5 meters. This upward movement caused the water to spill away in a huge wave. The tsunami caused most of the damage from this earthquake.[Map adapted using ArcGIS/ArcMap software.]
Student Page 1.1A

Draft Version 1 March 2006 Step 1: Earth-Shattering Events 27
How long did the quake last? The Sumatra Earthquake lasted for 200 seconds. That may seem like a short time, but watch the second hand of a clock for 200 seconds. How long is 200 seconds? Imagine what it would be like to experience a large earthquake for that
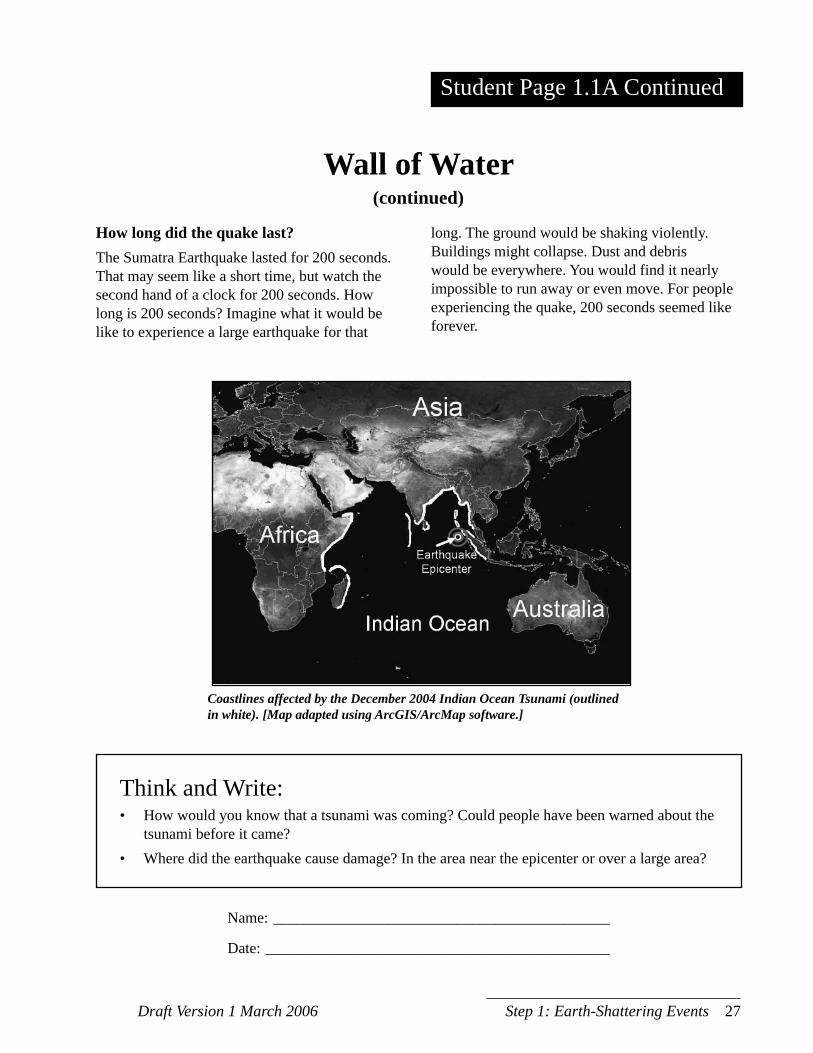
Coastlines affected by the December 2004 Indian Ocean Tsunami (outlined in white). [Map adapted using ArcGIS/ArcMap software.]
long. The ground would be shaking violently. Buildings might collapse. Dust and debris would be everywhere. You would find it nearly impossible to run away or even move. For people experiencing the quake, 200 seconds seemed like forever.
Think and Write:• How would you know that a tsunami was coming? Could people have been warned about the
tsunami before it came?• Where did the earthquake cause damage? In the area near the epicenter or over a large area?
STUDENT PAGE
Wall of Water (continued)
Name: ____________________________________________
Date: _____________________________________________
Student Page 1.1A Continued

S T E P
2
Scientific ModelingIn Step 2, students begin to investigate the processes that cause catastrophic events and influence Earth’s landforms. The class (students and teacher) will explore different regions of the world and determine the important landforms in these regions. This information will inform the design of a physical scientific model of the region. The models will be used to demonstrate how plate tectonics and, later, erosional processes help shape Earth’s surface. They are employed as a concrete tool to support students’ understanding of abstract ideas. To help students succeed in this unit-long modeling process, the teacher will use California as a region to demonstrate the modeling. All of the region models are used in the culminating lessons when students are asked to apply their understanding of plate tectonics to other regions, including the teacher’s region, California, and Wisconsin.
Lesson 2.1Examining Earth’s Surface (45 min)
Lesson 2.2 Begin Scientific Modeling Investigation (45 min)

Draft Version 1 March 2006 Step 2: Scientifi c Modeling 31
Key Concepts• Regions of the world have
diverse landforms that we can learn about by studying maps and photographs and by making observations.
• Scientific models are based on evidence.
Evidence of StudentUnderstandingThe students will be able to:• distinguish between evidence
for Earth’s landforms and other interesting facts in a written description of a region of the world.
Time Needed45 minutes
MaterialsFor each region group of 2-4 students• region coordinates slip from
Teacher Page 2.1: Region Coordinate Slips
• color copy (preferred) of reading for the group’s specific region of the world
For each student• black and white copy (color, if
possible) of reading for their group’s specific region of the world
• copy of Student Page 2.1A: World Political Map
• copy of Student Page 2.1B: Evidence Separation Chart
• copy of Student Page 2.1C: Landforms Vocabulary (FOSS Earth History Resources book, page 36)
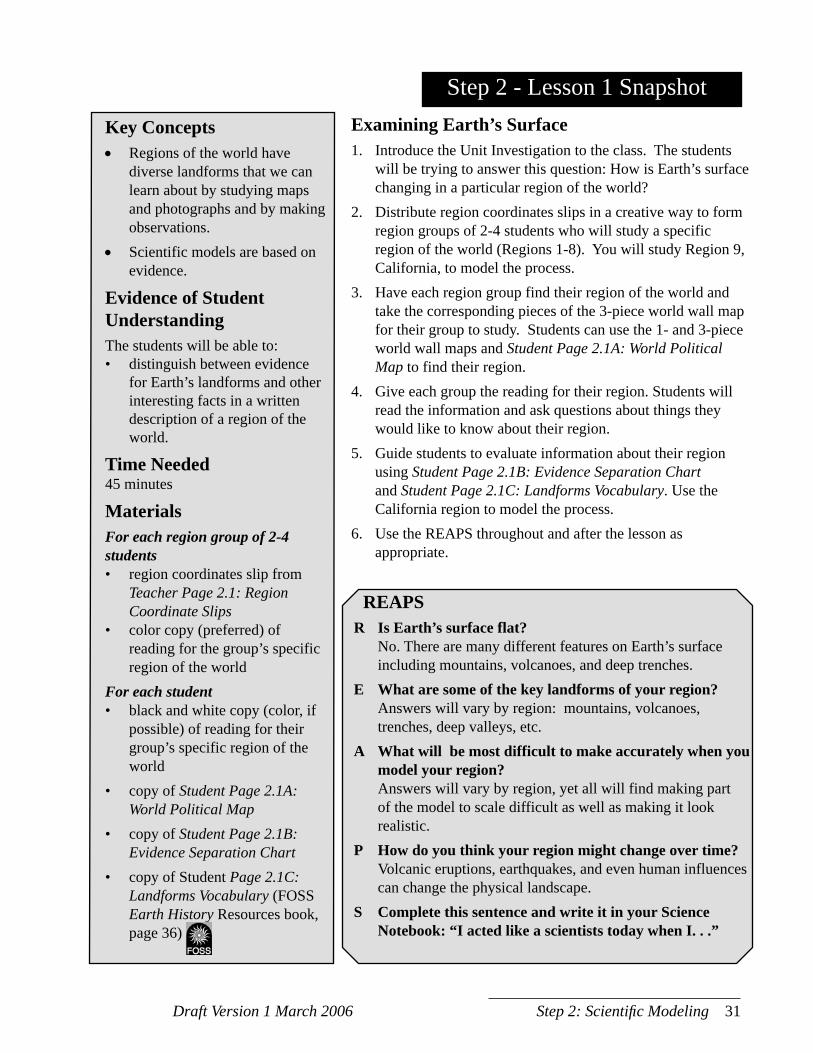
Examining Earth’s Surface1. Introduce the Unit Investigation to the class. The students
will be trying to answer this question: How is Earth’s surface changing in a particular region of the world?
2. Distribute region coordinates slips in a creative way to form region groups of 2-4 students who will study a specific region of the world (Regions 1-8). You will study Region 9, California, to model the process.
3. Have each region group find their region of the world and take the corresponding pieces of the 3-piece world wall map for their group to study. Students can use the 1- and 3-piece world wall maps and Student Page 2.1A: World Political Map to find their region.
4. Give each group the reading for their region. Students will read the information and ask questions about things they would like to know about their region.
5. Guide students to evaluate information about their region using Student Page 2.1B: Evidence Separation Chart and Student Page 2.1C: Landforms Vocabulary. Use the California region to model the process.
6. Use the REAPS throughout and after the lesson as appropriate.
Step 2 - Lesson 1 Snapshot
REAPSR Is Earth’s surface flat? No. There are many different features on Earth’s surface
including mountains, volcanoes, and deep trenches.E What are some of the key landforms of your region? Answers will vary by region: mountains, volcanoes,
trenches, deep valleys, etc.A What will be most difficult to make accurately when you
model your region? Answers will vary by region, yet all will find making part
of the model to scale difficult as well as making it look realistic.
P How do you think your region might change over time? Volcanic eruptions, earthquakes, and even human influences
can change the physical landscape.S Complete this sentence and write it in your Science
Notebook: “I acted like a scientists today when I. . .”
32 Exploring Earth’s Landforms Draft Version 1 March 2006
Background InformationThis unit-long investigation assigns one of eight regions of the world to a group of students. The eight regions represent a range of plate interactions. In some cases, more than one region serves as an example of a particular landform, event, or process. Students do not yet need to know what the regions feature in terms of plate tectonics or erosional processes. They will discover this information later in the unit. The region essays provide students with background information about landforms, catastrophic events, and other features/facts or human-interest stories. This information serves as initial evidence for students. They must choose from the information presented to determine what provides evidence for landforms when building their scientific model. The focus of the models should be on the landforms of the region. Since there is other interesting information in the essays, students will work through a table, separating the two types of information: evidence for landforms and other interesting facts. For example, if the region is Japan students will read about ancient pottery, trains, and electronics companies. These are interesting topics but the model should focus on the mountains, volcanoes like Mt. Fuji and Unzen, the chain of islands, earthquakes, or the deep ocean trench.
You can “model the modeling” and help students through the entire scientific modeling process by working with a ninth region, California. You can actively participate along with the students as you study California since all of the same kinds of information are provided for California as with the other eight regions. California is a geologically very interesting and complex area and is among the few tectonically active regions of the United States at present.
Advance PreparationCoordinates SlipsPrepare region coordinates slips (one for each student) from Teacher Page 2.1: Coordinates Slips. Make enough copies so that each student receives one slip and all eight regions are represented in groups of 2-4 students
World Wall MapCut the 3-piece world wall map into pieces based on the nine regions you and the students will study. One example of how to cut the map appears on the unit CD. The map should be mounted prominently in the classroom. Ideally, laminated map pieces can be mounted on a wall with the pieces held in place by tape or Velcro. Laminated pieces can be studied by students during their investigation and reused with other classes with less wear and tear.
Mount the 1-piece world map prominently in the classroom. Use this map throughout the investigation to refer to all regions of the world (without pieces missing). Laminating this map will also preserve it for many classes.
Draft Version 1 March 2006 Step 2: Scientifi c Modeling 33
Implementation Guide1. Show students a satellite picture of Earth
(like that on the cover of this unit) or have them observe a globe. Have students share their initial observations. Ask, “Does Earth’s surface look flat?” From a distance, Earth’s surface looks almost flat. When you get closer, however, you discover something very different. It is not flat at all. Some areas are rather flat while some are very mountainous. There are many different landforms on Earth’s surface. How can you explain the features that you see in different parts of the world? What makes these landforms? Explain that during this unit students will be investigating how the Earth’s surface is changing in a particular region of the world. For their investigation, students will work in groups to create a physical scientific model that explains the major landforms in a region of the world.
2. Depending on how you choose to assign groups, distribute coordinates slips so that each student has a slip of paper that contains coordinates for one of eight specific regions of the world (#1-8).
3. Students can use Student Page 2.1A: World Political Map to locate their region. Once students have located their region, ask them to locate the other students who have the same region, take the corresponding piece(s) of the world wall map containing that region for their group, and form their group. If necessary, support map skills at this point with additional activities about maps and/or latitude and longitude. You can model this whole process by taking your piece of the map, California (#9).
4. Distribute the region essays to each group. Explain that these readings are specific for their region. They provide background information about landforms, catastrophic events, unusual features and human-interest stories. Instruct students to read their region’s essay as a group. After reading, they should individually write down any questions the reading raises in their Science Notebook. Questions might look something like, “What makes this region special or different?” “Do catastrophic events happen here?” “I want to know more about X in this region.” Encourage students to share their initial questions with their group and record any other questions that come up during the discussion.
5. Guide students to evaluate their region’s information. Distribute Student Page 2.1B: Evidence Separation Chart and Student Page 2.1C: Landforms Vocabulary. As students continue working in groups, instruct them to fill out the Evidence Separation Chart by listing evidence related to landforms and other interesting facts from the reading in the respective columns. Review some of the groups’ charts as a class to make sure students select the proper information for each column. As an example, if a student were studying Alaska they would have read about an oil pipeline. This is interesting, but not a piece of evidence related to a landform. “Oil pipeline” would go in the right column and they could list the mountain ranges or Aleutian Islands in the landform evidence column. Ask students to tape or paste these charts into their Science Notebooks – they will need them for Lesson 2.2. Again, use the California region and its reading to explicitly model this process for your students when needed.
6. Use the REAPS throughout and after the lesson as appropriate.

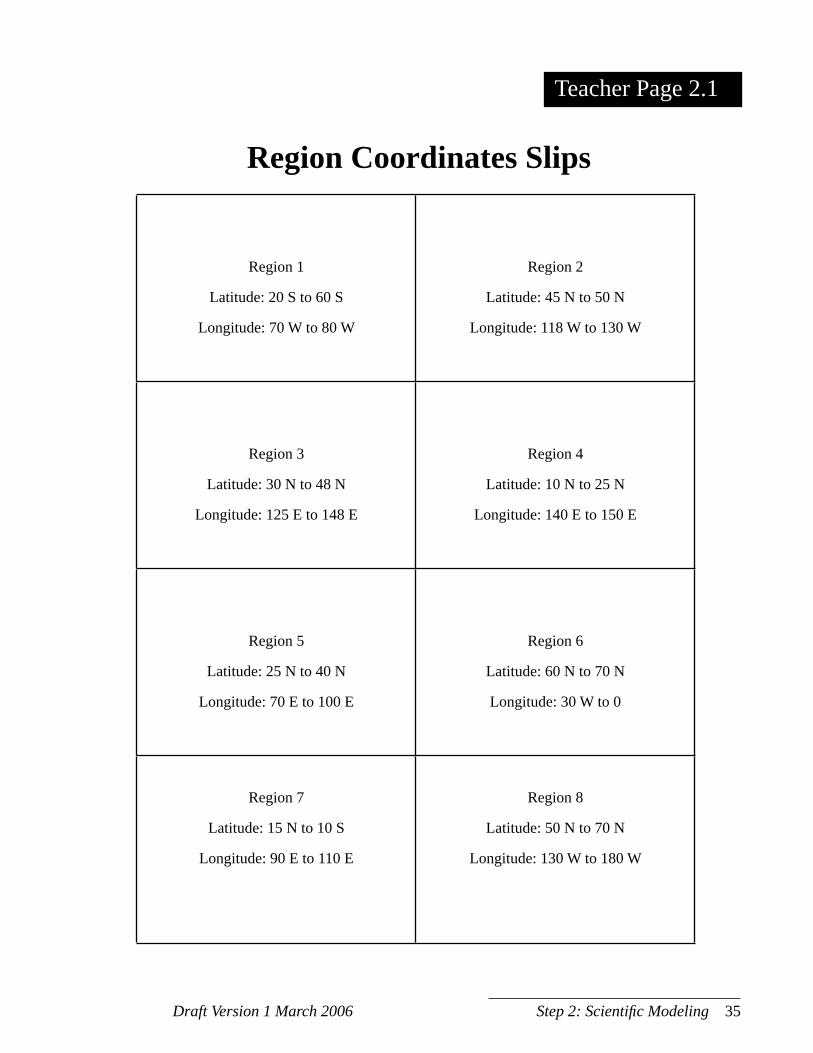
Draft Version 1 March 2006 Step 2: Scientifi c Modeling 35
Region 1
Latitude: 20 S to 60 S
Longitude: 70 W to 80 W
Region 2
Latitude: 45 N to 50 N
Longitude: 118 W to 130 W
Region 3
Latitude: 30 N to 48 N
Longitude: 125 E to 148 E
Region 4
Latitude: 10 N to 25 N
Longitude: 140 E to 150 E
Region 5
Latitude: 25 N to 40 N
Longitude: 70 E to 100 E
Region 6
Latitude: 60 N to 70 N
Longitude: 30 W to 0
Region 7
Latitude: 15 N to 10 S
Longitude: 90 E to 110 E
Region 8
Latitude: 50 N to 70 N
Longitude: 130 W to 180 W
Region Coordinates Slips
Teacher Page 2.1

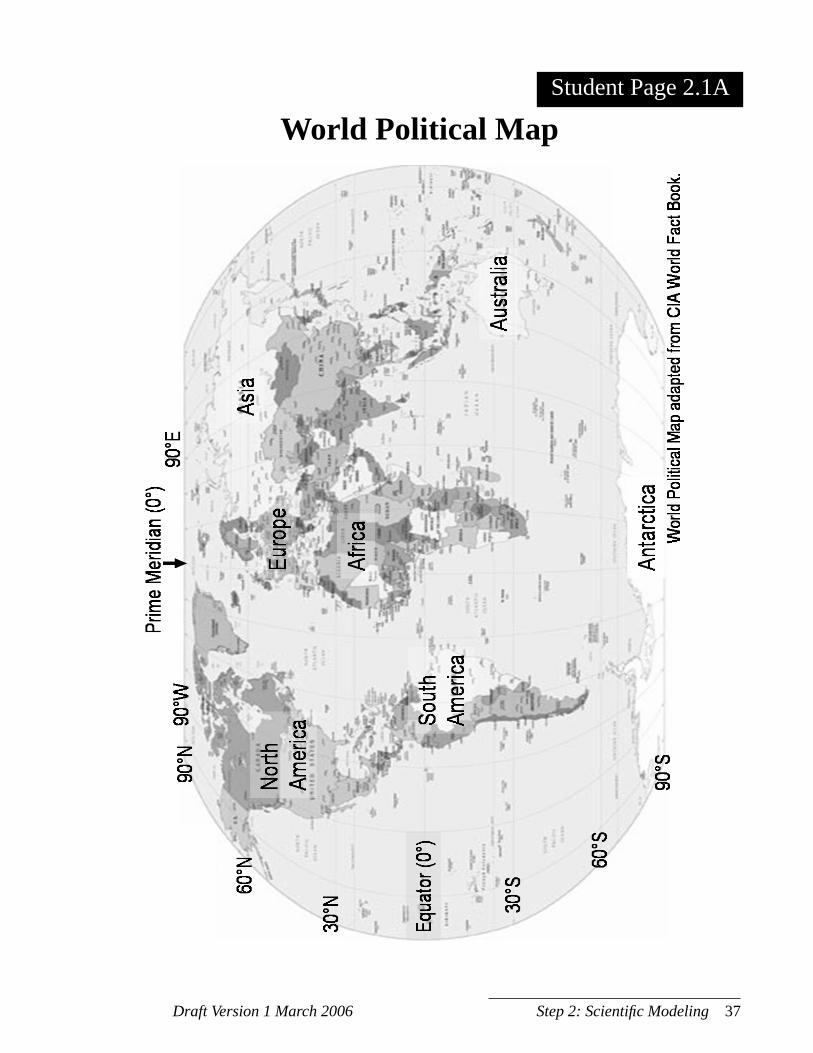
Draft Version 1 March 2006 Step 2: Scientifi c Modeling 37
STUDENT PAGEWorld Political Map
Student Page 2.1A

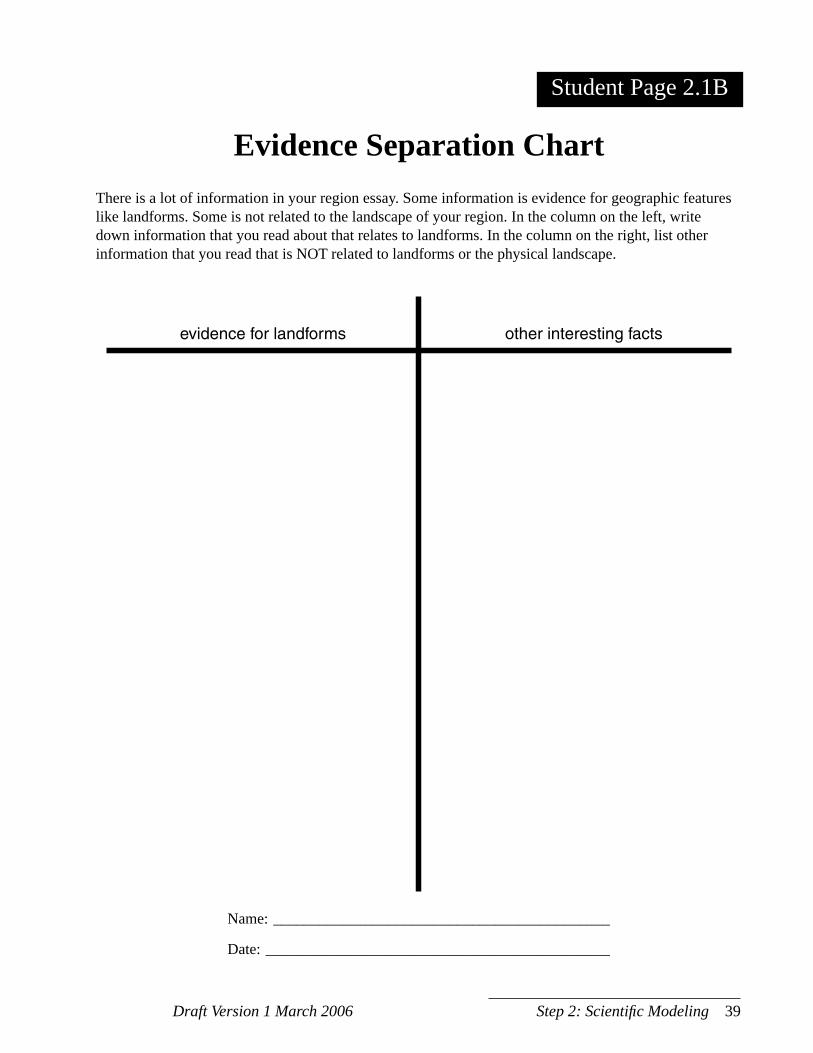
Draft Version 1 March 2006 Step 2: Scientifi c Modeling 39
Name: ____________________________________________
Date: _____________________________________________
Evidence Separation ChartThere is a lot of information in your region essay. Some information is evidence for geographic features like landforms. Some is not related to the landscape of your region. In the column on the left, write down information that you read about that relates to landforms. In the column on the right, list other information that you read that is NOT related to landforms or the physical landscape.
Student Page 2.1B

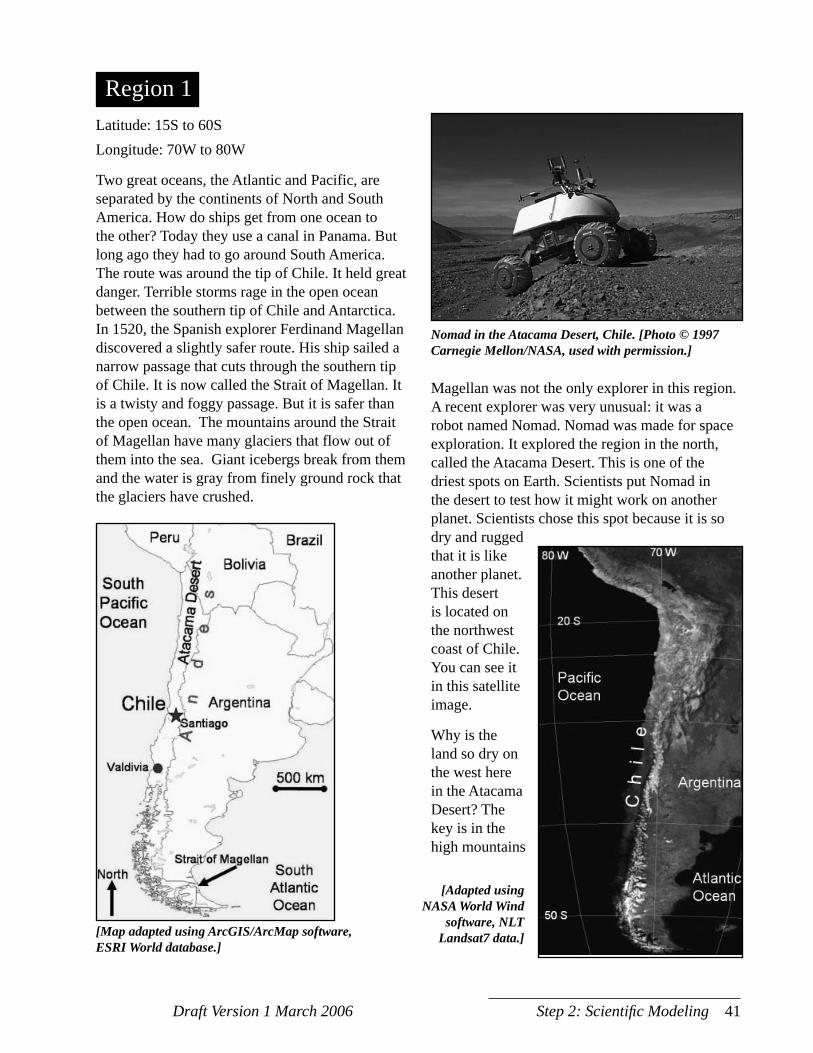
Draft Version 1 March 2006 Step 2: Scientifi c Modeling 41
Latitude: 15S to 60SLongitude: 70W to 80W
Two great oceans, the Atlantic and Pacific, are separated by the continents of North and South America. How do ships get from one ocean to the other? Today they use a canal in Panama. But long ago they had to go around South America. The route was around the tip of Chile. It held great danger. Terrible storms rage in the open ocean between the southern tip of Chile and Antarctica. In 1520, the Spanish explorer Ferdinand Magellan discovered a slightly safer route. His ship sailed a narrow passage that cuts through the southern tip of Chile. It is now called the Strait of Magellan. It is a twisty and foggy passage. But it is safer than the open ocean. The mountains around the Strait of Magellan have many glaciers that flow out of them into the sea. Giant icebergs break from them and the water is gray from finely ground rock that the glaciers have crushed.
Region 1
[Map adapted using ArcGIS/ArcMap software, ESRI World database.]
Nomad in the Atacama Desert, Chile. [Photo © 1997 Carnegie Mellon/NASA, used with permission.]
Magellan was not the only explorer in this region. A recent explorer was very unusual: it was a robot named Nomad. Nomad was made for space exploration. It explored the region in the north, called the Atacama Desert. This is one of the driest spots on Earth. Scientists put Nomad in the desert to test how it might work on another planet. Scientists chose this spot because it is so dry and rugged that it is like another planet. This desert is located on the northwest coast of Chile. You can see it in this satellite image.
Why is the land so dry on the west here in the Atacama Desert? The key is in the high mountains
[Adapted using NASA World Wind
software, NLT Landsat7 data.]

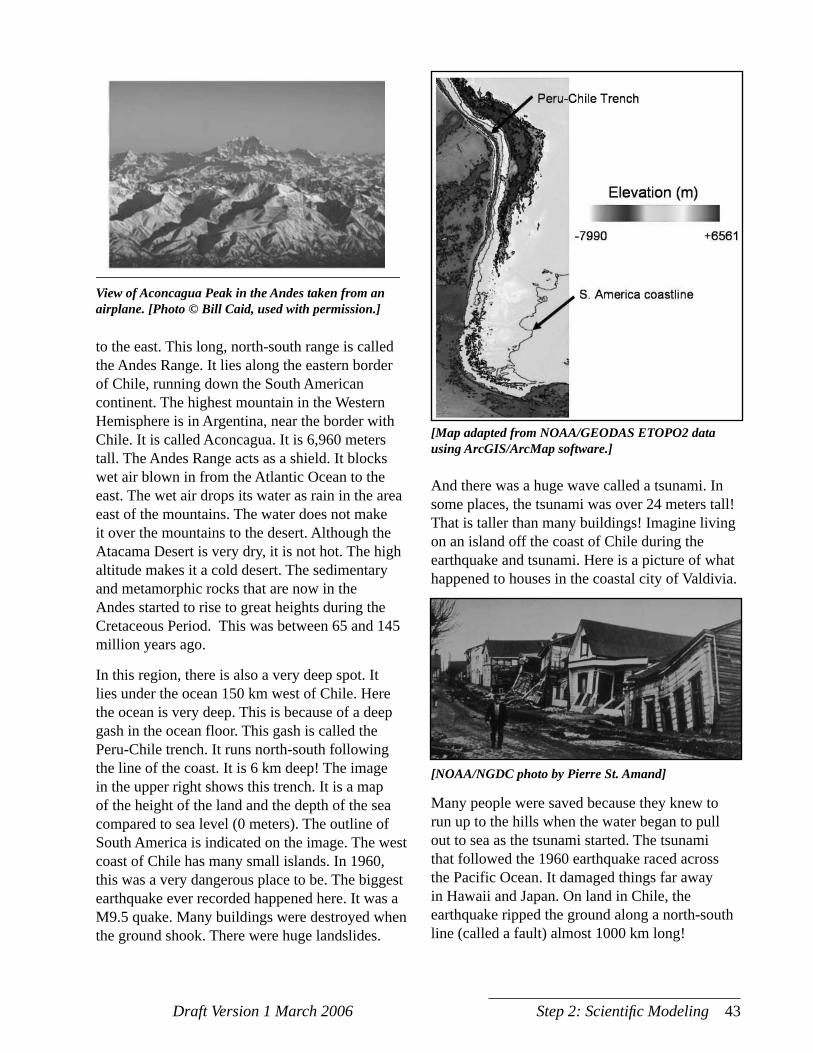
Draft Version 1 March 2006 Step 2: Scientifi c Modeling 43
to the east. This long, north-south range is called the Andes Range. It lies along the eastern border of Chile, running down the South American continent. The highest mountain in the Western Hemisphere is in Argentina, near the border with Chile. It is called Aconcagua. It is 6,960 meters tall. The Andes Range acts as a shield. It blocks wet air blown in from the Atlantic Ocean to the east. The wet air drops its water as rain in the area east of the mountains. The water does not make it over the mountains to the desert. Although the Atacama Desert is very dry, it is not hot. The high altitude makes it a cold desert. The sedimentary and metamorphic rocks that are now in the Andes started to rise to great heights during the Cretaceous Period. This was between 65 and 145 million years ago.
In this region, there is also a very deep spot. It lies under the ocean 150 km west of Chile. Here the ocean is very deep. This is because of a deep gash in the ocean floor. This gash is called the Peru-Chile trench. It runs north-south following the line of the coast. It is 6 km deep! The image in the upper right shows this trench. It is a map of the height of the land and the depth of the sea compared to sea level (0 meters). The outline of South America is indicated on the image. The west coast of Chile has many small islands. In 1960, this was a very dangerous place to be. The biggest earthquake ever recorded happened here. It was a M9.5 quake. Many buildings were destroyed when the ground shook. There were huge landslides.
And there was a huge wave called a tsunami. In some places, the tsunami was over 24 meters tall! That is taller than many buildings! Imagine living on an island off the coast of Chile during the earthquake and tsunami. Here is a picture of what happened to houses in the coastal city of Valdivia.
View of Aconcagua Peak in the Andes taken from an airplane. [Photo © Bill Caid, used with permission.]
[Map adapted from NOAA/GEODAS ETOPO2 data using ArcGIS/ArcMap software.]
[NOAA/NGDC photo by Pierre St. Amand]
Many people were saved because they knew to run up to the hills when the water began to pull out to sea as the tsunami started. The tsunami that followed the 1960 earthquake raced across the Pacific Ocean. It damaged things far away in Hawaii and Japan. On land in Chile, the earthquake ripped the ground along a north-south line (called a fault) almost 1000 km long!

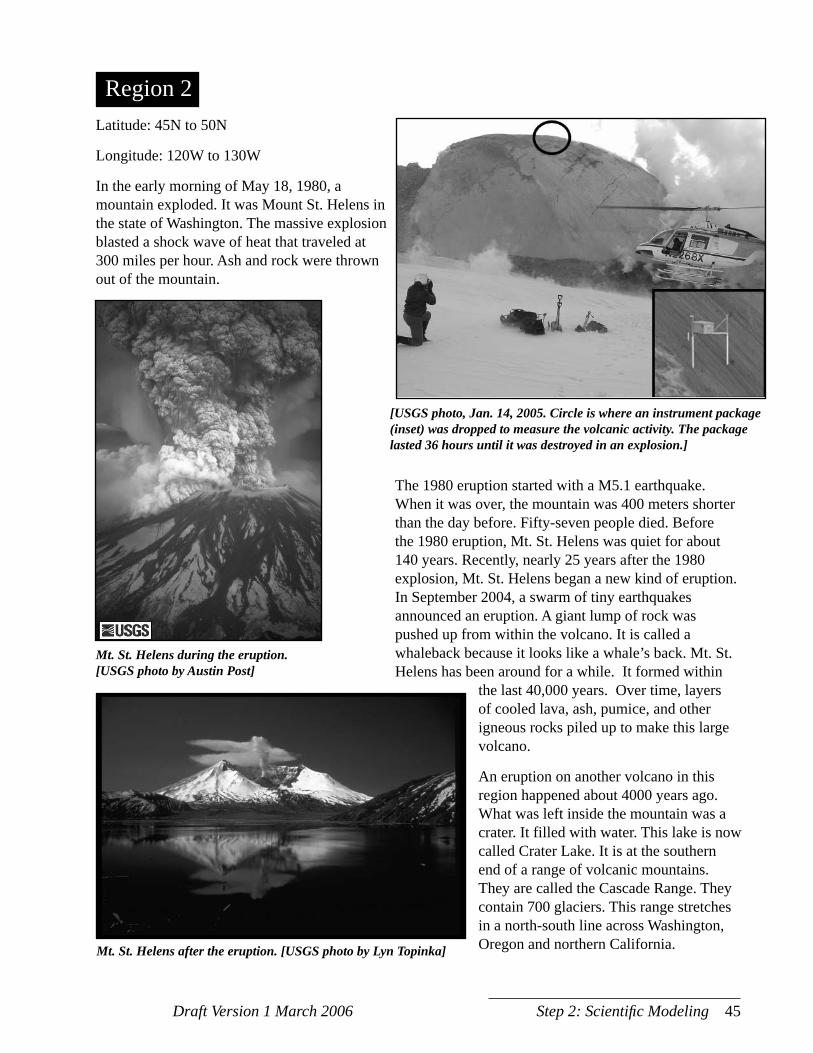
Draft Version 1 March 2006 Step 2: Scientifi c Modeling 45
Latitude: 45N to 50N
Longitude: 120W to 130W
In the early morning of May 18, 1980, a mountain exploded. It was Mount St. Helens in the state of Washington. The massive explosion blasted a shock wave of heat that traveled at 300 miles per hour. Ash and rock were thrown out of the mountain.
Region 2
Mt. St. Helens after the eruption. [USGS photo by Lyn Topinka]
Mt. St. Helens during the eruption. [USGS photo by Austin Post]
[USGS photo, Jan. 14, 2005. Circle is where an instrument package (inset) was dropped to measure the volcanic activity. The package lasted 36 hours until it was destroyed in an explosion.]
The 1980 eruption started with a M5.1 earthquake. When it was over, the mountain was 400 meters shorter than the day before. Fifty-seven people died. Before the 1980 eruption, Mt. St. Helens was quiet for about 140 years. Recently, nearly 25 years after the 1980 explosion, Mt. St. Helens began a new kind of eruption. In September 2004, a swarm of tiny earthquakes announced an eruption. A giant lump of rock was pushed up from within the volcano. It is called a whaleback because it looks like a whale’s back. Mt. St. Helens has been around for a while. It formed within
the last 40,000 years. Over time, layers of cooled lava, ash, pumice, and other igneous rocks piled up to make this large volcano.
An eruption on another volcano in this region happened about 4000 years ago. What was left inside the mountain was a crater. It filled with water. This lake is now called Crater Lake. It is at the southern end of a range of volcanic mountains. They are called the Cascade Range. They contain 700 glaciers. This range stretches in a north-south line across Washington, Oregon and northern California.

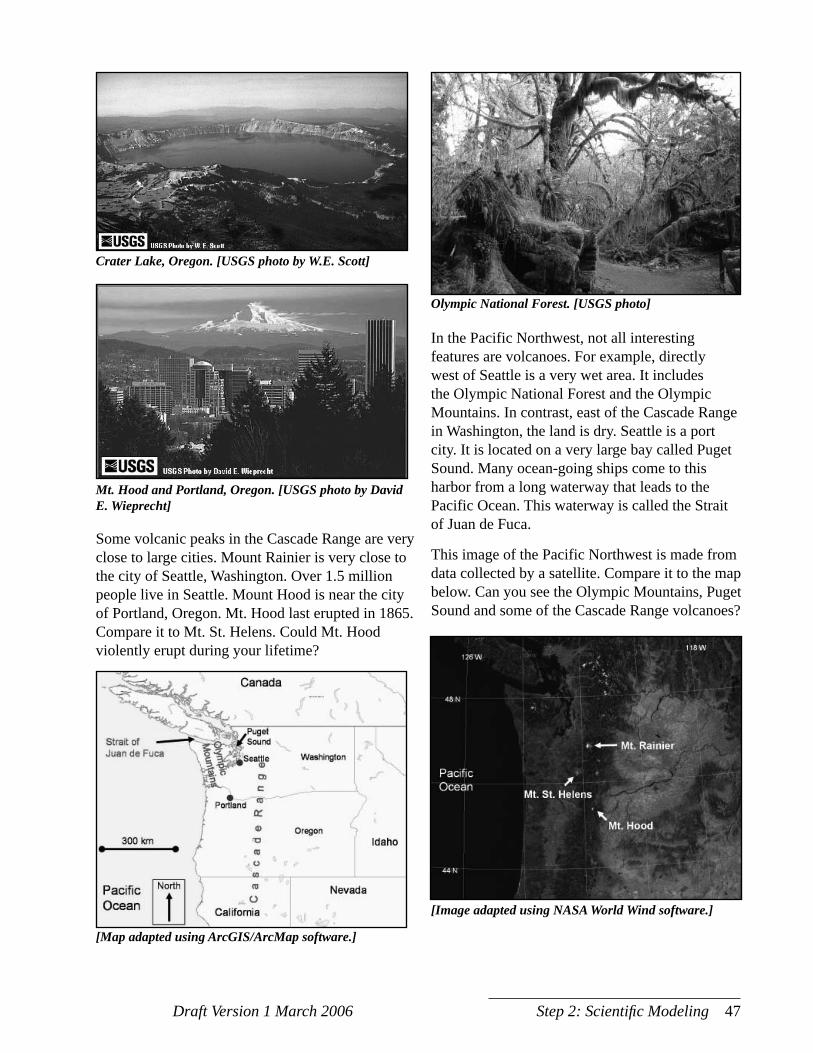
Draft Version 1 March 2006 Step 2: Scientifi c Modeling 47
Crater Lake, Oregon. [USGS photo by W.E. Scott]
Mt. Hood and Portland, Oregon. [USGS photo by David E. Wieprecht]
Some volcanic peaks in the Cascade Range are very close to large cities. Mount Rainier is very close to the city of Seattle, Washington. Over 1.5 million people live in Seattle. Mount Hood is near the city of Portland, Oregon. Mt. Hood last erupted in 1865. Compare it to Mt. St. Helens. Could Mt. Hood violently erupt during your lifetime?
Olympic National Forest. [USGS photo]
[Image adapted using NASA World Wind software.]
In the Pacific Northwest, not all interesting features are volcanoes. For example, directly west of Seattle is a very wet area. It includes the Olympic National Forest and the Olympic Mountains. In contrast, east of the Cascade Range in Washington, the land is dry. Seattle is a port city. It is located on a very large bay called Puget Sound. Many ocean-going ships come to this harbor from a long waterway that leads to the Pacific Ocean. This waterway is called the Strait of Juan de Fuca.
This image of the Pacific Northwest is made from data collected by a satellite. Compare it to the map below. Can you see the Olympic Mountains, Puget Sound and some of the Cascade Range volcanoes?
[Map adapted using ArcGIS/ArcMap software.]

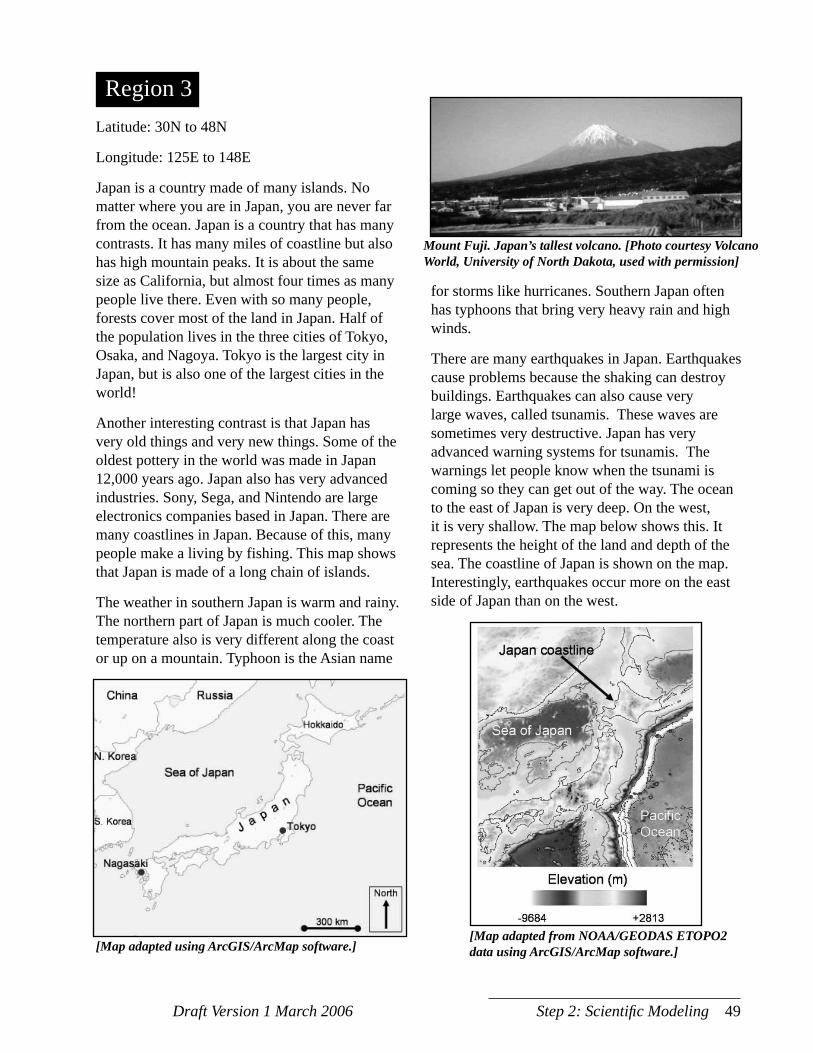
Draft Version 1 March 2006 Step 2: Scientifi c Modeling 49
Region 3
Mount Fuji. Japan’s tallest volcano. [Photo courtesy Volcano World, University of North Dakota, used with permission]
[Map adapted using ArcGIS/ArcMap software.][Map adapted from NOAA/GEODAS ETOPO2 data using ArcGIS/ArcMap software.]
Latitude: 30N to 48N
Longitude: 125E to 148E
Japan is a country made of many islands. No matter where you are in Japan, you are never far from the ocean. Japan is a country that has many contrasts. It has many miles of coastline but also has high mountain peaks. It is about the same size as California, but almost four times as many people live there. Even with so many people, forests cover most of the land in Japan. Half of the population lives in the three cities of Tokyo, Osaka, and Nagoya. Tokyo is the largest city in Japan, but is also one of the largest cities in the world!
Another interesting contrast is that Japan has very old things and very new things. Some of the oldest pottery in the world was made in Japan 12,000 years ago. Japan also has very advanced industries. Sony, Sega, and Nintendo are large electronics companies based in Japan. There are many coastlines in Japan. Because of this, many people make a living by fishing. This map shows that Japan is made of a long chain of islands.
The weather in southern Japan is warm and rainy. The northern part of Japan is much cooler. The temperature also is very different along the coast or up on a mountain. Typhoon is the Asian name
for storms like hurricanes. Southern Japan often has typhoons that bring very heavy rain and high winds.
There are many earthquakes in Japan. Earthquakes cause problems because the shaking can destroy buildings. Earthquakes can also cause very large waves, called tsunamis. These waves are sometimes very destructive. Japan has very advanced warning systems for tsunamis. The warnings let people know when the tsunami is coming so they can get out of the way. The ocean to the east of Japan is very deep. On the west, it is very shallow. The map below shows this. It represents the height of the land and depth of the sea. The coastline of Japan is shown on the map. Interestingly, earthquakes occur more on the east side of Japan than on the west.

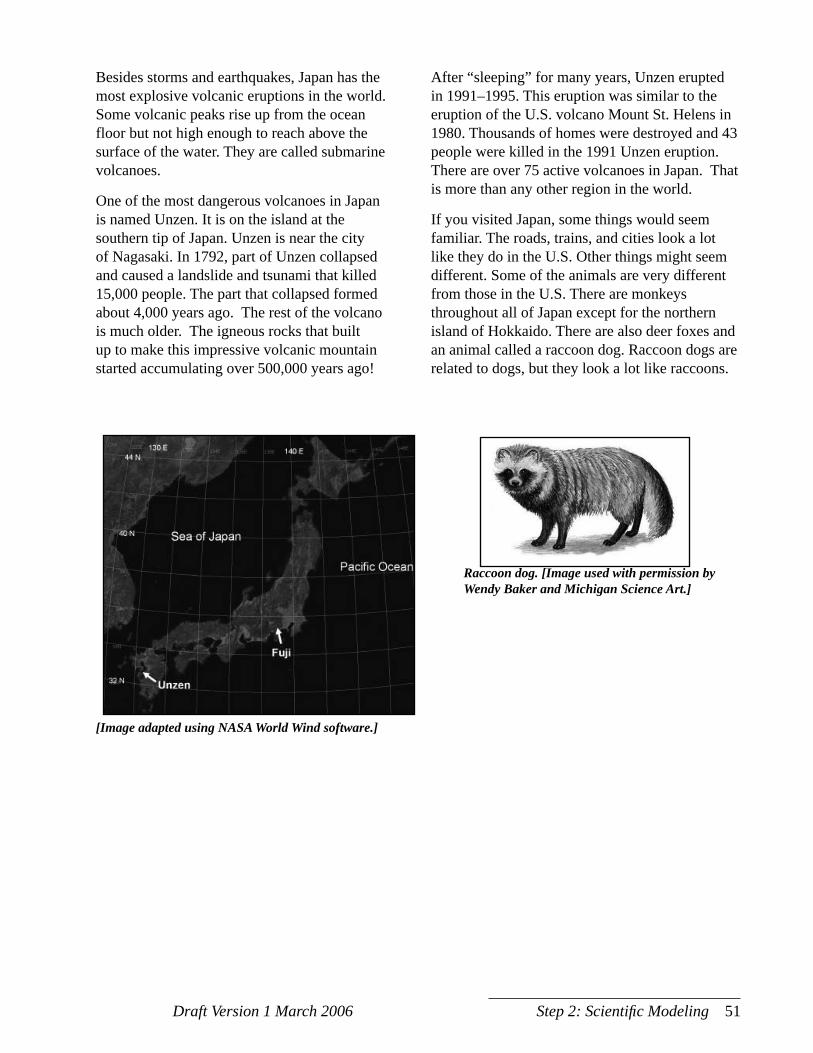
Draft Version 1 March 2006 Step 2: Scientifi c Modeling 51
Raccoon dog. [Image used with permission by Wendy Baker and Michigan Science Art.]
[Image adapted using NASA World Wind software.]
Besides storms and earthquakes, Japan has the most explosive volcanic eruptions in the world. Some volcanic peaks rise up from the ocean floor but not high enough to reach above the surface of the water. They are called submarine volcanoes.
One of the most dangerous volcanoes in Japan is named Unzen. It is on the island at the southern tip of Japan. Unzen is near the city of Nagasaki. In 1792, part of Unzen collapsed and caused a landslide and tsunami that killed 15,000 people. The part that collapsed formed about 4,000 years ago. The rest of the volcano is much older. The igneous rocks that built up to make this impressive volcanic mountain started accumulating over 500,000 years ago!
After “sleeping” for many years, Unzen erupted in 1991–1995. This eruption was similar to the eruption of the U.S. volcano Mount St. Helens in 1980. Thousands of homes were destroyed and 43 people were killed in the 1991 Unzen eruption. There are over 75 active volcanoes in Japan. That is more than any other region in the world.
If you visited Japan, some things would seem familiar. The roads, trains, and cities look a lot like they do in the U.S. Other things might seem different. Some of the animals are very different from those in the U.S. There are monkeys throughout all of Japan except for the northern island of Hokkaido. There are also deer foxes and an animal called a raccoon dog. Raccoon dogs are related to dogs, but they look a lot like raccoons.

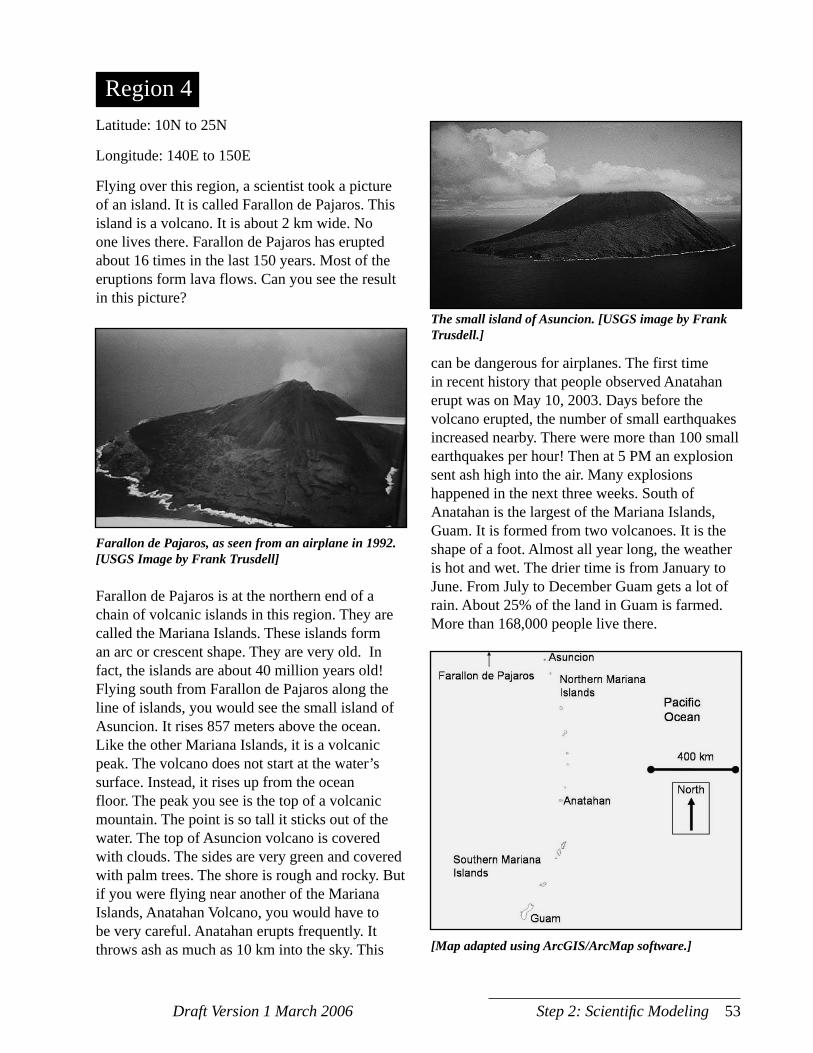
Draft Version 1 March 2006 Step 2: Scientifi c Modeling 53
Latitude: 10N to 25N
Longitude: 140E to 150E
Flying over this region, a scientist took a picture of an island. It is called Farallon de Pajaros. This island is a volcano. It is about 2 km wide. No one lives there. Farallon de Pajaros has erupted about 16 times in the last 150 years. Most of the eruptions form lava flows. Can you see the result in this picture?
can be dangerous for airplanes. The first time in recent history that people observed Anatahan erupt was on May 10, 2003. Days before the volcano erupted, the number of small earthquakes increased nearby. There were more than 100 small earthquakes per hour! Then at 5 PM an explosion sent ash high into the air. Many explosions happened in the next three weeks. South of Anatahan is the largest of the Mariana Islands, Guam. It is formed from two volcanoes. It is the shape of a foot. Almost all year long, the weather is hot and wet. The drier time is from January to June. From July to December Guam gets a lot of rain. About 25% of the land in Guam is farmed. More than 168,000 people live there.
Region 4
Farallon de Pajaros, as seen from an airplane in 1992.[USGS Image by Frank Trusdell]
Farallon de Pajaros is at the northern end of a chain of volcanic islands in this region. They are called the Mariana Islands. These islands form an arc or crescent shape. They are very old. In fact, the islands are about 40 million years old! Flying south from Farallon de Pajaros along the line of islands, you would see the small island of Asuncion. It rises 857 meters above the ocean. Like the other Mariana Islands, it is a volcanic peak. The volcano does not start at the water’s surface. Instead, it rises up from the ocean floor. The peak you see is the top of a volcanic mountain. The point is so tall it sticks out of the water. The top of Asuncion volcano is covered with clouds. The sides are very green and covered with palm trees. The shore is rough and rocky. But if you were flying near another of the Mariana Islands, Anatahan Volcano, you would have to be very careful. Anatahan erupts frequently. It throws ash as much as 10 km into the sky. This
The small island of Asuncion. [USGS image by Frank Trusdell.]
[Map adapted using ArcGIS/ArcMap software.]

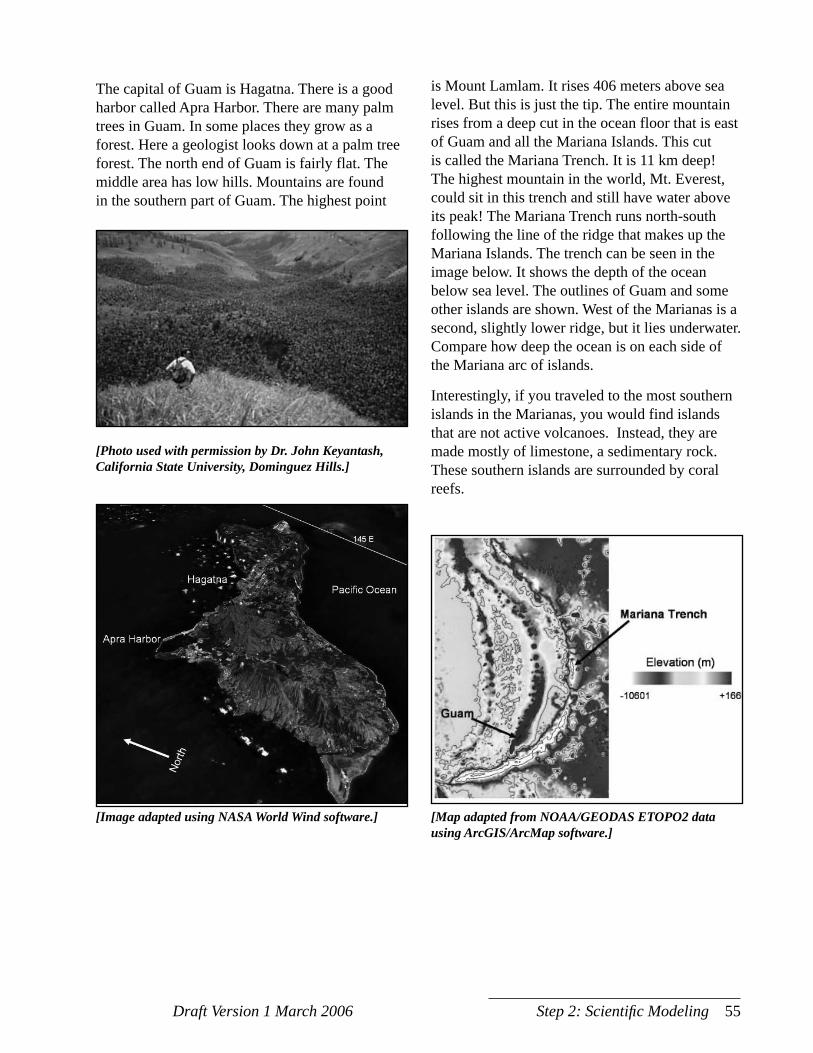
Draft Version 1 March 2006 Step 2: Scientifi c Modeling 55
The capital of Guam is Hagatna. There is a good harbor called Apra Harbor. There are many palm trees in Guam. In some places they grow as a forest. Here a geologist looks down at a palm tree forest. The north end of Guam is fairly flat. The middle area has low hills. Mountains are found in the southern part of Guam. The highest point
is Mount Lamlam. It rises 406 meters above sea level. But this is just the tip. The entire mountain rises from a deep cut in the ocean floor that is east of Guam and all the Mariana Islands. This cut is called the Mariana Trench. It is 11 km deep! The highest mountain in the world, Mt. Everest, could sit in this trench and still have water above its peak! The Mariana Trench runs north-south following the line of the ridge that makes up the Mariana Islands. The trench can be seen in the image below. It shows the depth of the ocean below sea level. The outlines of Guam and some other islands are shown. West of the Marianas is a second, slightly lower ridge, but it lies underwater. Compare how deep the ocean is on each side of the Mariana arc of islands.
Interestingly, if you traveled to the most southern islands in the Marianas, you would find islands that are not active volcanoes. Instead, they are made mostly of limestone, a sedimentary rock. These southern islands are surrounded by coral reefs.
[Image adapted using NASA World Wind software.]
[Photo used with permission by Dr. John Keyantash, California State University, Dominguez Hills.]
[Map adapted from NOAA/GEODAS ETOPO2 data using ArcGIS/ArcMap software.]

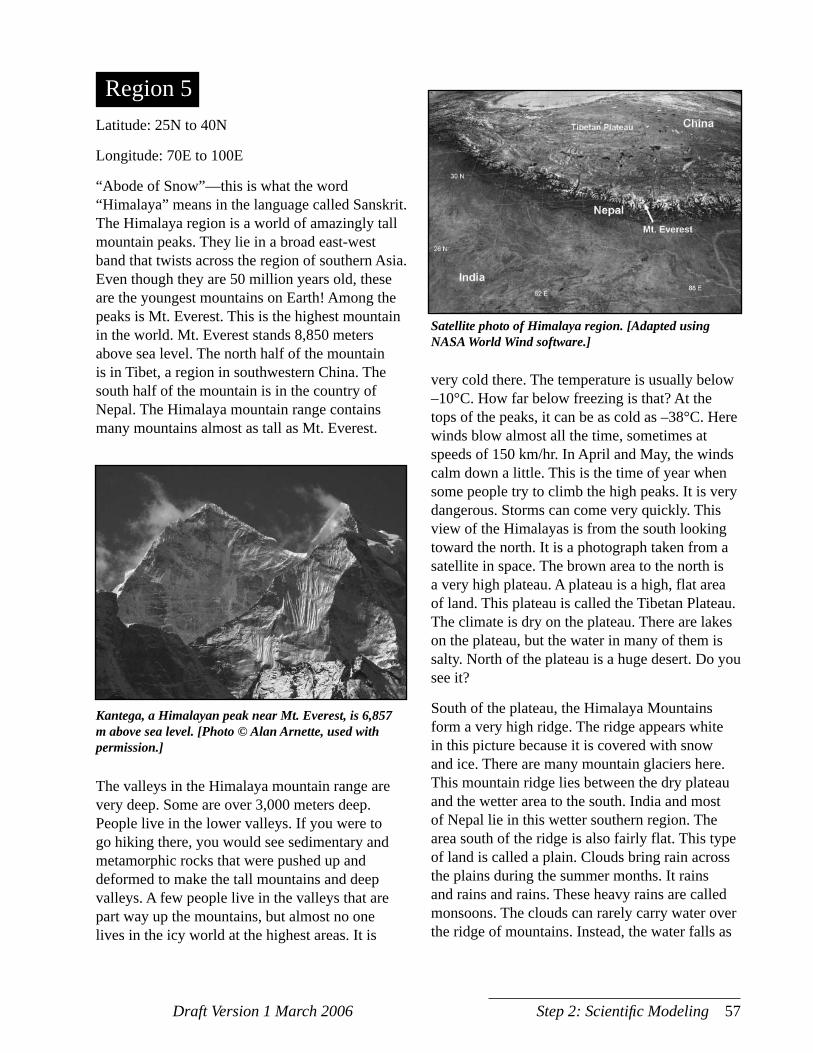
Draft Version 1 March 2006 Step 2: Scientifi c Modeling 57
Latitude: 25N to 40N
Longitude: 70E to 100E
“Abode of Snow”—this is what the word “Himalaya” means in the language called Sanskrit. The Himalaya region is a world of amazingly tall mountain peaks. They lie in a broad east-west band that twists across the region of southern Asia. Even though they are 50 million years old, these are the youngest mountains on Earth! Among the peaks is Mt. Everest. This is the highest mountain in the world. Mt. Everest stands 8,850 meters above sea level. The north half of the mountain is in Tibet, a region in southwestern China. The south half of the mountain is in the country of Nepal. The Himalaya mountain range contains many mountains almost as tall as Mt. Everest.
very cold there. The temperature is usually below –10°C. How far below freezing is that? At the tops of the peaks, it can be as cold as –38°C. Here winds blow almost all the time, sometimes at speeds of 150 km/hr. In April and May, the winds calm down a little. This is the time of year when some people try to climb the high peaks. It is very dangerous. Storms can come very quickly. This view of the Himalayas is from the south looking toward the north. It is a photograph taken from a satellite in space. The brown area to the north is a very high plateau. A plateau is a high, flat area of land. This plateau is called the Tibetan Plateau. The climate is dry on the plateau. There are lakes on the plateau, but the water in many of them is salty. North of the plateau is a huge desert. Do you see it?
South of the plateau, the Himalaya Mountains form a very high ridge. The ridge appears white in this picture because it is covered with snow and ice. There are many mountain glaciers here. This mountain ridge lies between the dry plateau and the wetter area to the south. India and most of Nepal lie in this wetter southern region. The area south of the ridge is also fairly flat. This type of land is called a plain. Clouds bring rain across the plains during the summer months. It rains and rains and rains. These heavy rains are called monsoons. The clouds can rarely carry water over the ridge of mountains. Instead, the water falls as
Region 5
Satellite photo of Himalaya region. [Adapted using NASA World Wind software.]
Kantega, a Himalayan peak near Mt. Everest, is 6,857 m above sea level. [Photo © Alan Arnette, used with permission.]
The valleys in the Himalaya mountain range are very deep. Some are over 3,000 meters deep. People live in the lower valleys. If you were to go hiking there, you would see sedimentary and metamorphic rocks that were pushed up and deformed to make the tall mountains and deep valleys. A few people live in the valleys that are part way up the mountains, but almost no one lives in the icy world at the highest areas. It is

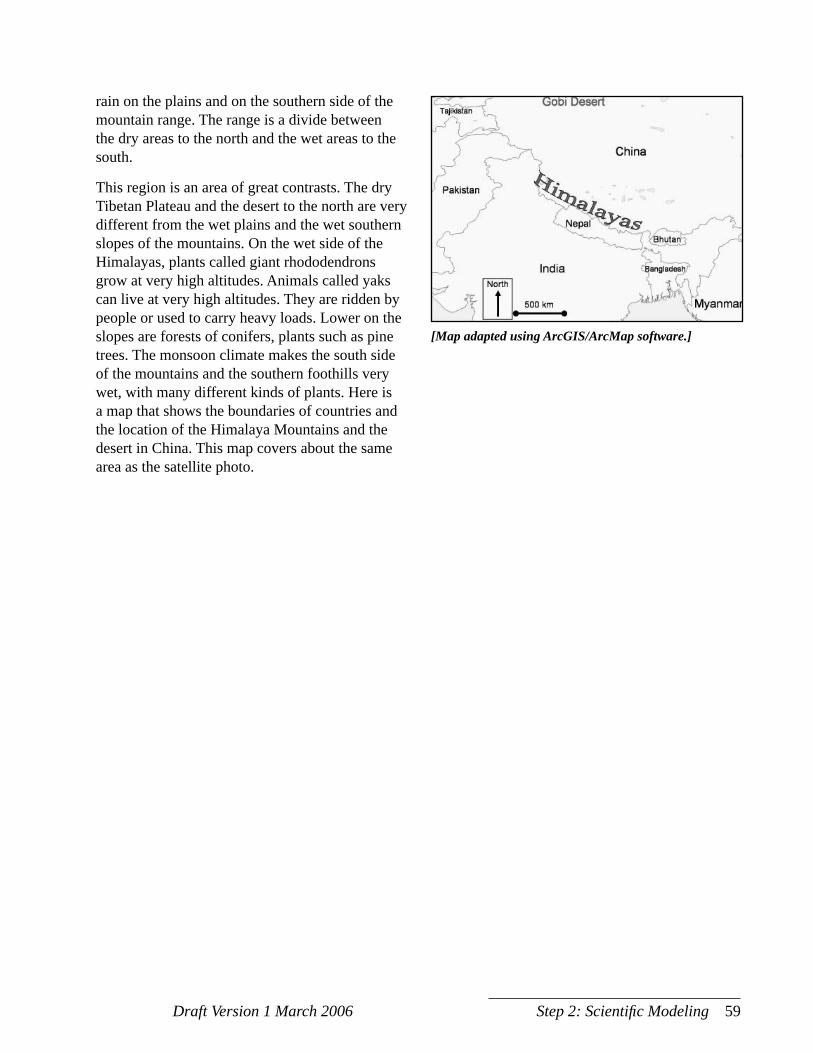
Draft Version 1 March 2006 Step 2: Scientifi c Modeling 59
rain on the plains and on the southern side of the mountain range. The range is a divide between the dry areas to the north and the wet areas to the south.
This region is an area of great contrasts. The dry Tibetan Plateau and the desert to the north are very different from the wet plains and the wet southern slopes of the mountains. On the wet side of the Himalayas, plants called giant rhododendrons grow at very high altitudes. Animals called yaks can live at very high altitudes. They are ridden by people or used to carry heavy loads. Lower on the slopes are forests of conifers, plants such as pine trees. The monsoon climate makes the south side of the mountains and the southern foothills very wet, with many different kinds of plants. Here is a map that shows the boundaries of countries and the location of the Himalaya Mountains and the desert in China. This map covers about the same area as the satellite photo.
[Map adapted using ArcGIS/ArcMap software.]

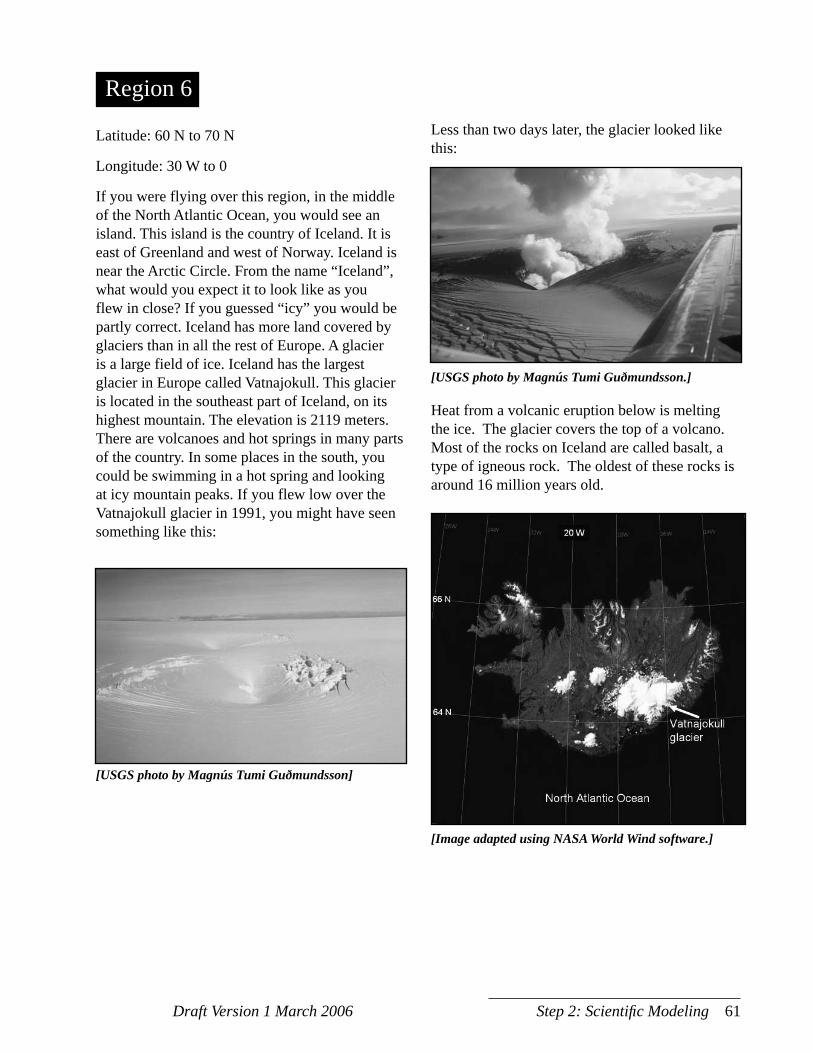
Draft Version 1 March 2006 Step 2: Scientifi c Modeling 61
Latitude: 60 N to 70 N
Longitude: 30 W to 0
If you were flying over this region, in the middle of the North Atlantic Ocean, you would see an island. This island is the country of Iceland. It is east of Greenland and west of Norway. Iceland is near the Arctic Circle. From the name “Iceland”, what would you expect it to look like as you flew in close? If you guessed “icy” you would be partly correct. Iceland has more land covered by glaciers than in all the rest of Europe. A glacier is a large field of ice. Iceland has the largest glacier in Europe called Vatnajokull. This glacier is located in the southeast part of Iceland, on its highest mountain. The elevation is 2119 meters. There are volcanoes and hot springs in many parts of the country. In some places in the south, you could be swimming in a hot spring and looking at icy mountain peaks. If you flew low over the Vatnajokull glacier in 1991, you might have seen something like this:
Region 6
[USGS photo by Magnús Tumi Guðmundsson]
Less than two days later, the glacier looked like this:
[USGS photo by Magnús Tumi Guðmundsson.]
Heat from a volcanic eruption below is melting the ice. The glacier covers the top of a volcano. Most of the rocks on Iceland are called basalt, a type of igneous rock. The oldest of these rocks is around 16 million years old.
[Image adapted using NASA World Wind software.]

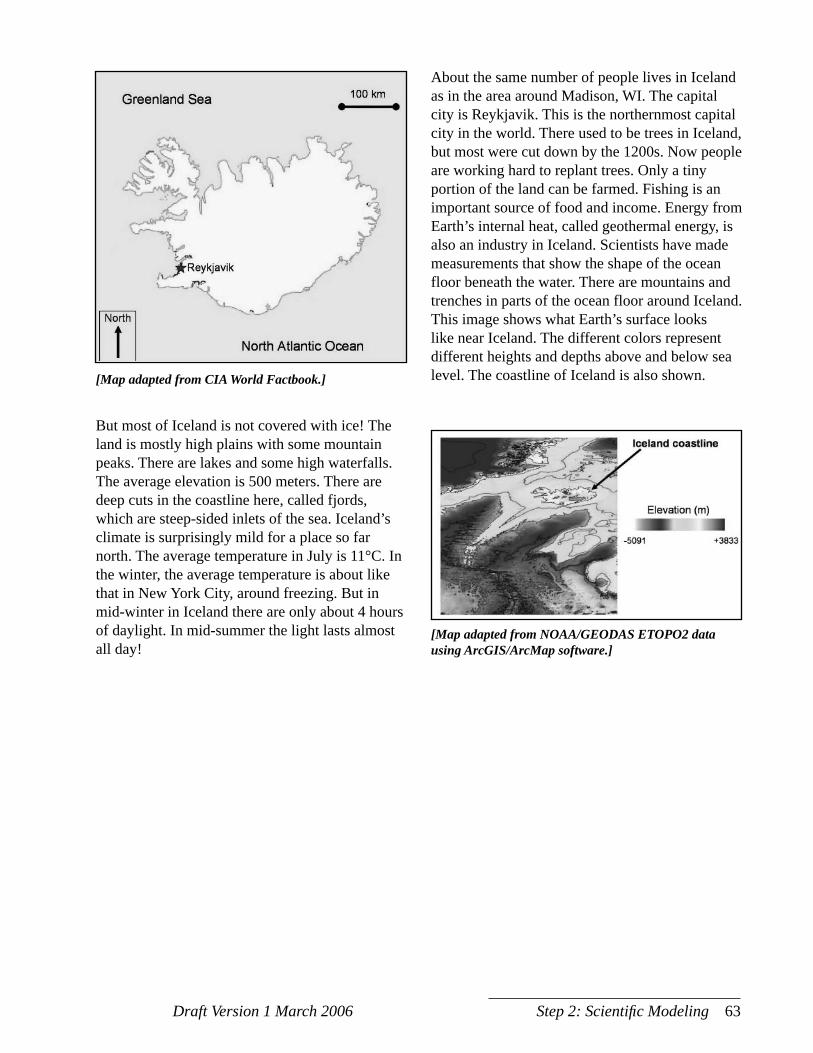
Draft Version 1 March 2006 Step 2: Scientifi c Modeling 63
But most of Iceland is not covered with ice! The land is mostly high plains with some mountain peaks. There are lakes and some high waterfalls. The average elevation is 500 meters. There are deep cuts in the coastline here, called fjords, which are steep-sided inlets of the sea. Iceland’s climate is surprisingly mild for a place so far north. The average temperature in July is 11°C. In the winter, the average temperature is about like that in New York City, around freezing. But in mid-winter in Iceland there are only about 4 hours of daylight. In mid-summer the light lasts almost all day!
[Map adapted from CIA World Factbook.]
[Map adapted from NOAA/GEODAS ETOPO2 data using ArcGIS/ArcMap software.]
About the same number of people lives in Iceland as in the area around Madison, WI. The capital city is Reykjavik. This is the northernmost capital city in the world. There used to be trees in Iceland, but most were cut down by the 1200s. Now people are working hard to replant trees. Only a tiny portion of the land can be farmed. Fishing is an important source of food and income. Energy from Earth’s internal heat, called geothermal energy, is also an industry in Iceland. Scientists have made measurements that show the shape of the ocean floor beneath the water. There are mountains and trenches in parts of the ocean floor around Iceland. This image shows what Earth’s surface looks like near Iceland. The different colors represent different heights and depths above and below sea level. The coastline of Iceland is also shown.

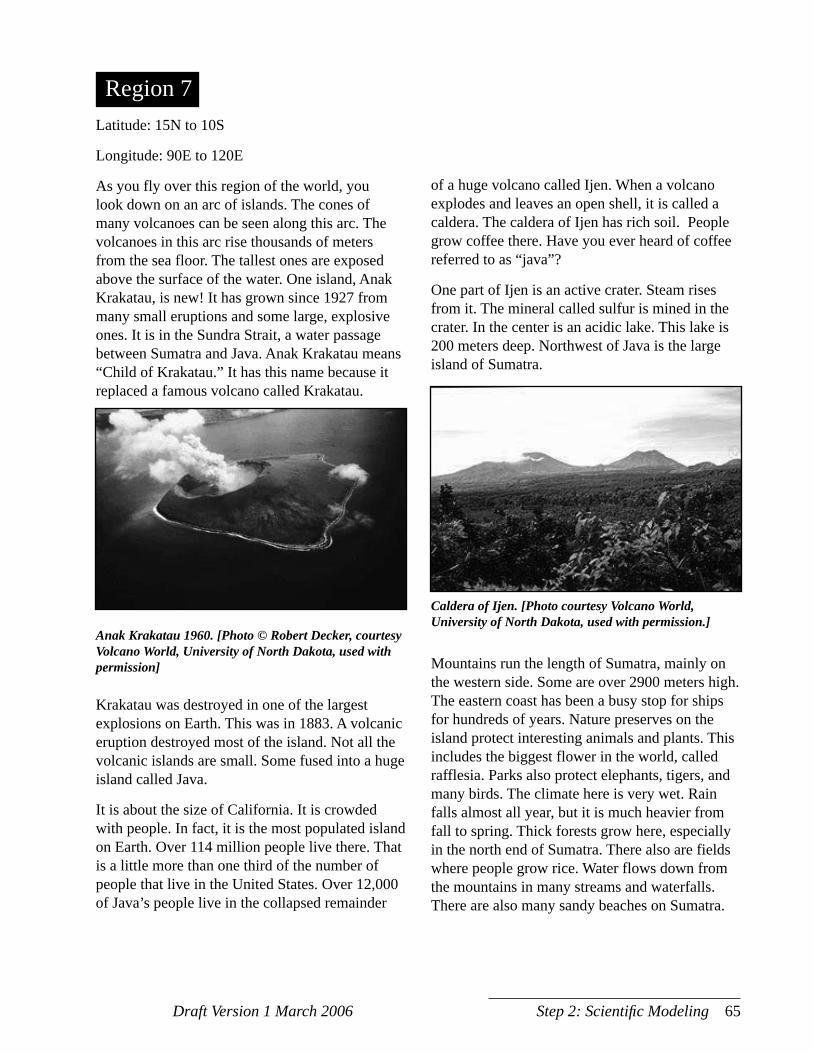
Draft Version 1 March 2006 Step 2: Scientifi c Modeling 65
Latitude: 15N to 10S
Longitude: 90E to 120E
As you fly over this region of the world, you look down on an arc of islands. The cones of many volcanoes can be seen along this arc. The volcanoes in this arc rise thousands of meters from the sea floor. The tallest ones are exposed above the surface of the water. One island, Anak Krakatau, is new! It has grown since 1927 from many small eruptions and some large, explosive ones. It is in the Sundra Strait, a water passage between Sumatra and Java. Anak Krakatau means “Child of Krakatau.” It has this name because it replaced a famous volcano called Krakatau.
of a huge volcano called Ijen. When a volcano explodes and leaves an open shell, it is called a caldera. The caldera of Ijen has rich soil. People grow coffee there. Have you ever heard of coffee referred to as “java”?
One part of Ijen is an active crater. Steam rises from it. The mineral called sulfur is mined in the crater. In the center is an acidic lake. This lake is 200 meters deep. Northwest of Java is the large island of Sumatra.
Region 7
Anak Krakatau 1960. [Photo © Robert Decker, courtesy Volcano World, University of North Dakota, used with permission]
Krakatau was destroyed in one of the largest explosions on Earth. This was in 1883. A volcanic eruption destroyed most of the island. Not all the volcanic islands are small. Some fused into a huge island called Java.
It is about the size of California. It is crowded with people. In fact, it is the most populated island on Earth. Over 114 million people live there. That is a little more than one third of the number of people that live in the United States. Over 12,000 of Java’s people live in the collapsed remainder
Caldera of Ijen. [Photo courtesy Volcano World, University of North Dakota, used with permission.]
Mountains run the length of Sumatra, mainly on the western side. Some are over 2900 meters high. The eastern coast has been a busy stop for ships for hundreds of years. Nature preserves on the island protect interesting animals and plants. This includes the biggest flower in the world, called rafflesia. Parks also protect elephants, tigers, and many birds. The climate here is very wet. Rain falls almost all year, but it is much heavier from fall to spring. Thick forests grow here, especially in the north end of Sumatra. There also are fields where people grow rice. Water flows down from the mountains in many streams and waterfalls. There are also many sandy beaches on Sumatra.

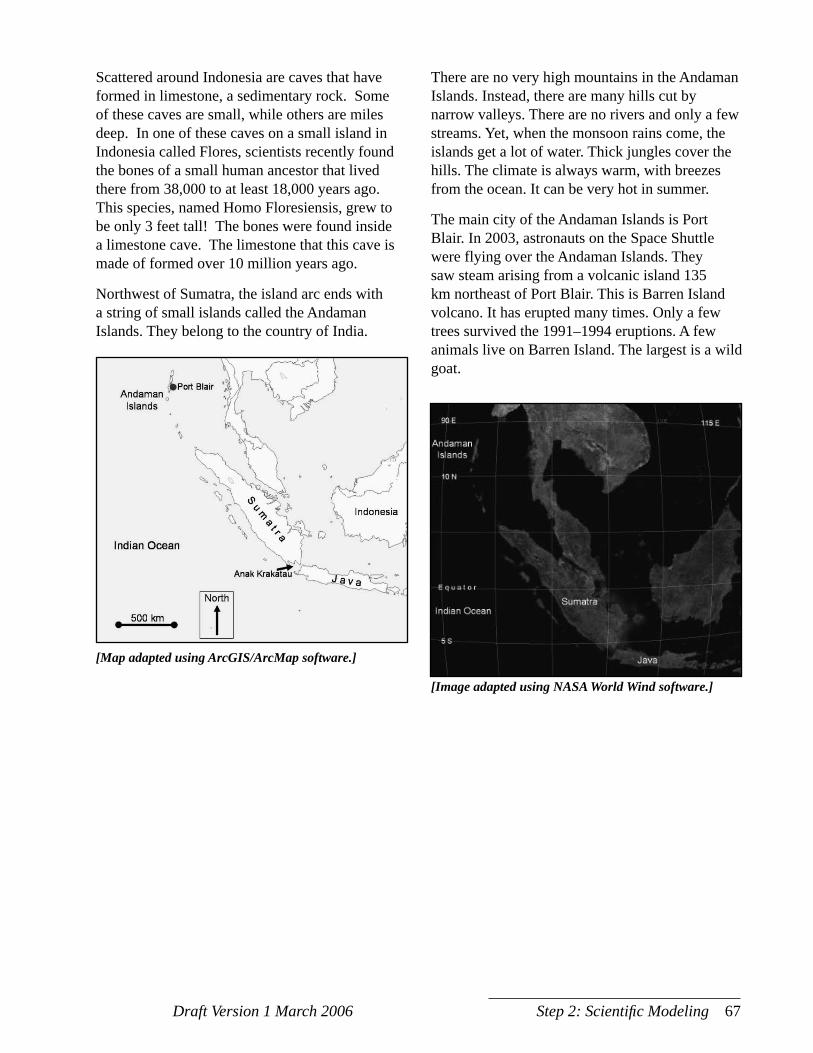
Draft Version 1 March 2006 Step 2: Scientifi c Modeling 67
Scattered around Indonesia are caves that have formed in limestone, a sedimentary rock. Some of these caves are small, while others are miles deep. In one of these caves on a small island in Indonesia called Flores, scientists recently found the bones of a small human ancestor that lived there from 38,000 to at least 18,000 years ago. This species, named Homo Floresiensis, grew to be only 3 feet tall! The bones were found inside a limestone cave. The limestone that this cave is made of formed over 10 million years ago.
Northwest of Sumatra, the island arc ends with a string of small islands called the Andaman Islands. They belong to the country of India.
[Map adapted using ArcGIS/ArcMap software.]
[Image adapted using NASA World Wind software.]
There are no very high mountains in the Andaman Islands. Instead, there are many hills cut by narrow valleys. There are no rivers and only a few streams. Yet, when the monsoon rains come, the islands get a lot of water. Thick jungles cover the hills. The climate is always warm, with breezes from the ocean. It can be very hot in summer.
The main city of the Andaman Islands is Port Blair. In 2003, astronauts on the Space Shuttle were flying over the Andaman Islands. They saw steam arising from a volcanic island 135 km northeast of Port Blair. This is Barren Island volcano. It has erupted many times. Only a few trees survived the 1991–1994 eruptions. A few animals live on Barren Island. The largest is a wild goat.

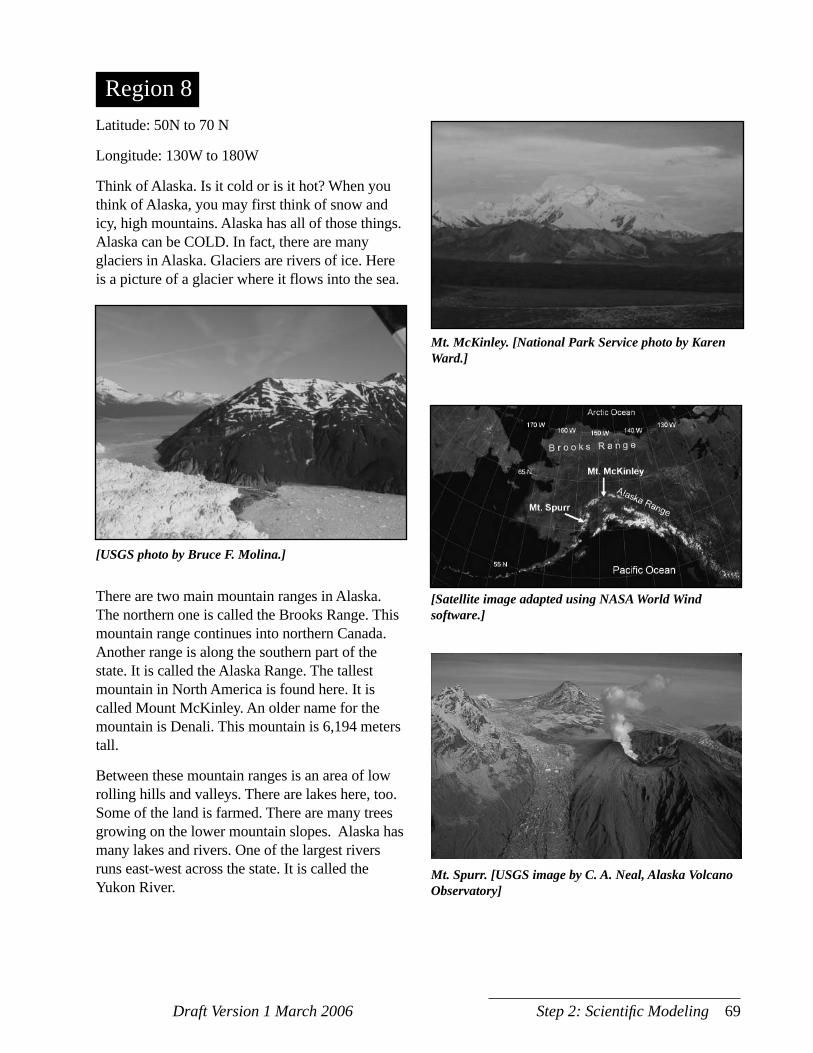
Draft Version 1 March 2006 Step 2: Scientifi c Modeling 69
Latitude: 50N to 70 N
Longitude: 130W to 180W
Think of Alaska. Is it cold or is it hot? When you think of Alaska, you may first think of snow and icy, high mountains. Alaska has all of those things. Alaska can be COLD. In fact, there are many glaciers in Alaska. Glaciers are rivers of ice. Here is a picture of a glacier where it flows into the sea.
Region 8
[USGS photo by Bruce F. Molina.]
There are two main mountain ranges in Alaska. The northern one is called the Brooks Range. This mountain range continues into northern Canada. Another range is along the southern part of the state. It is called the Alaska Range. The tallest mountain in North America is found here. It is called Mount McKinley. An older name for the mountain is Denali. This mountain is 6,194 meters tall.
Between these mountain ranges is an area of low rolling hills and valleys. There are lakes here, too. Some of the land is farmed. There are many trees growing on the lower mountain slopes. Alaska has many lakes and rivers. One of the largest rivers runs east-west across the state. It is called the Yukon River.
Mt. McKinley. [National Park Service photo by Karen Ward.]
[Satellite image adapted using NASA World Wind software.]
Mt. Spurr. [USGS image by C. A. Neal, Alaska Volcano Observatory]

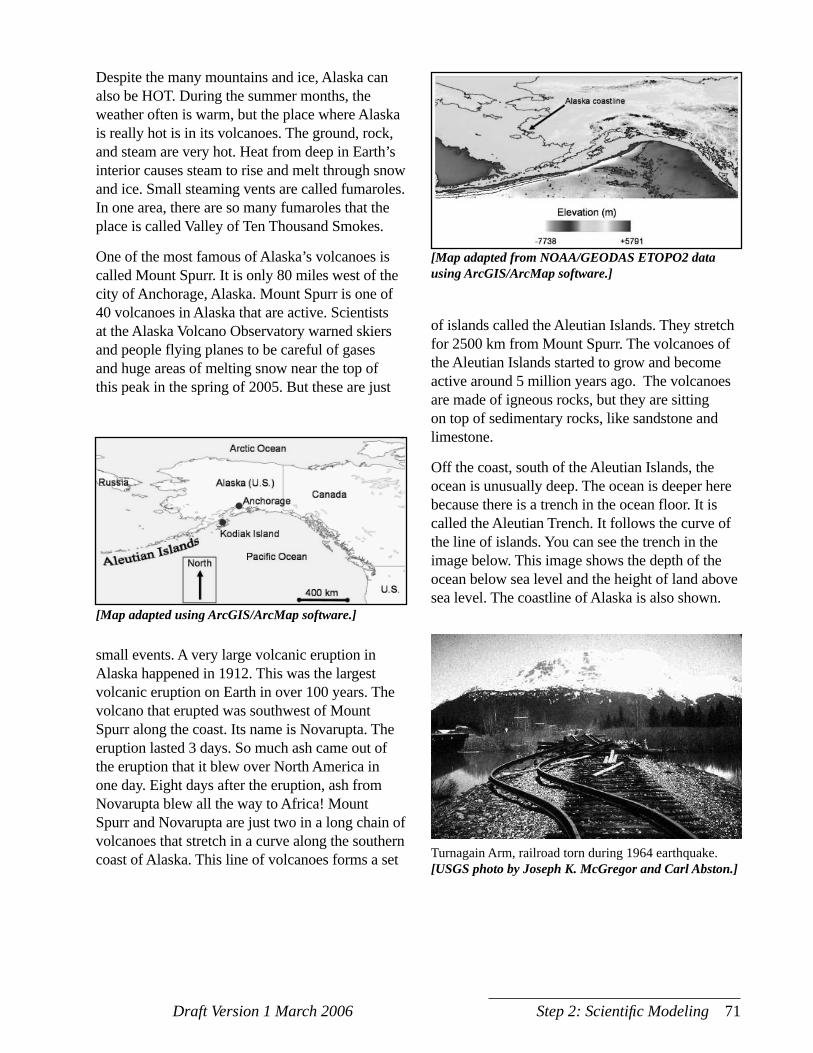
Draft Version 1 March 2006 Step 2: Scientifi c Modeling 71
Despite the many mountains and ice, Alaska can also be HOT. During the summer months, the weather often is warm, but the place where Alaska is really hot is in its volcanoes. The ground, rock, and steam are very hot. Heat from deep in Earth’s interior causes steam to rise and melt through snow and ice. Small steaming vents are called fumaroles. In one area, there are so many fumaroles that the place is called Valley of Ten Thousand Smokes.
One of the most famous of Alaska’s volcanoes is called Mount Spurr. It is only 80 miles west of the city of Anchorage, Alaska. Mount Spurr is one of 40 volcanoes in Alaska that are active. Scientists at the Alaska Volcano Observatory warned skiers and people flying planes to be careful of gases and huge areas of melting snow near the top of this peak in the spring of 2005. But these are just
[Map adapted using ArcGIS/ArcMap software.]
small events. A very large volcanic eruption in Alaska happened in 1912. This was the largest volcanic eruption on Earth in over 100 years. The volcano that erupted was southwest of Mount Spurr along the coast. Its name is Novarupta. The eruption lasted 3 days. So much ash came out of the eruption that it blew over North America in one day. Eight days after the eruption, ash from Novarupta blew all the way to Africa! Mount Spurr and Novarupta are just two in a long chain of volcanoes that stretch in a curve along the southern coast of Alaska. This line of volcanoes forms a set
[Map adapted from NOAA/GEODAS ETOPO2 data using ArcGIS/ArcMap software.]
of islands called the Aleutian Islands. They stretch for 2500 km from Mount Spurr. The volcanoes of the Aleutian Islands started to grow and become active around 5 million years ago. The volcanoes are made of igneous rocks, but they are sitting on top of sedimentary rocks, like sandstone and limestone.
Off the coast, south of the Aleutian Islands, the ocean is unusually deep. The ocean is deeper here because there is a trench in the ocean floor. It is called the Aleutian Trench. It follows the curve of the line of islands. You can see the trench in the image below. This image shows the depth of the ocean below sea level and the height of land above sea level. The coastline of Alaska is also shown.
Turnagain Arm, railroad torn during 1964 earthquake. [USGS photo by Joseph K. McGregor and Carl Abston.]

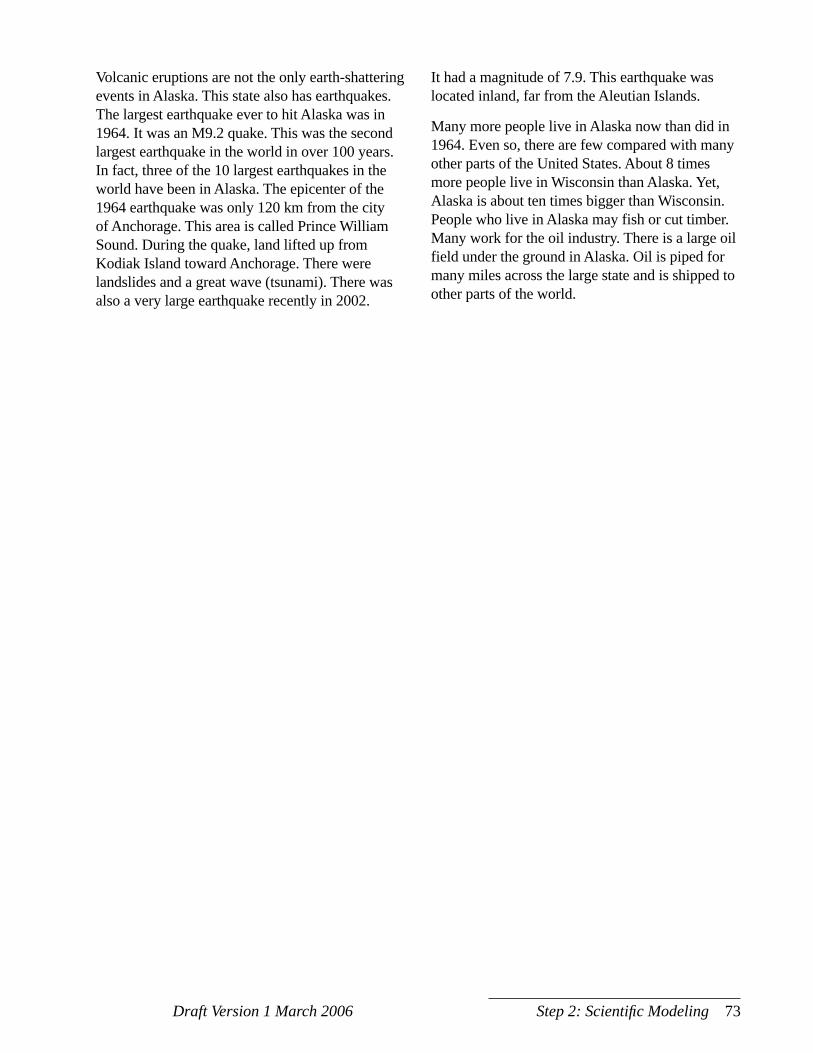
Draft Version 1 March 2006 Step 2: Scientifi c Modeling 73
Volcanic eruptions are not the only earth-shattering events in Alaska. This state also has earthquakes. The largest earthquake ever to hit Alaska was in 1964. It was an M9.2 quake. This was the second largest earthquake in the world in over 100 years. In fact, three of the 10 largest earthquakes in the world have been in Alaska. The epicenter of the 1964 earthquake was only 120 km from the city of Anchorage. This area is called Prince William Sound. During the quake, land lifted up from Kodiak Island toward Anchorage. There were landslides and a great wave (tsunami). There was also a very large earthquake recently in 2002.
It had a magnitude of 7.9. This earthquake was located inland, far from the Aleutian Islands.
Many more people live in Alaska now than did in 1964. Even so, there are few compared with many other parts of the United States. About 8 times more people live in Wisconsin than Alaska. Yet, Alaska is about ten times bigger than Wisconsin. People who live in Alaska may fish or cut timber. Many work for the oil industry. There is a large oil field under the ground in Alaska. Oil is piped for many miles across the large state and is shipped to other parts of the world.

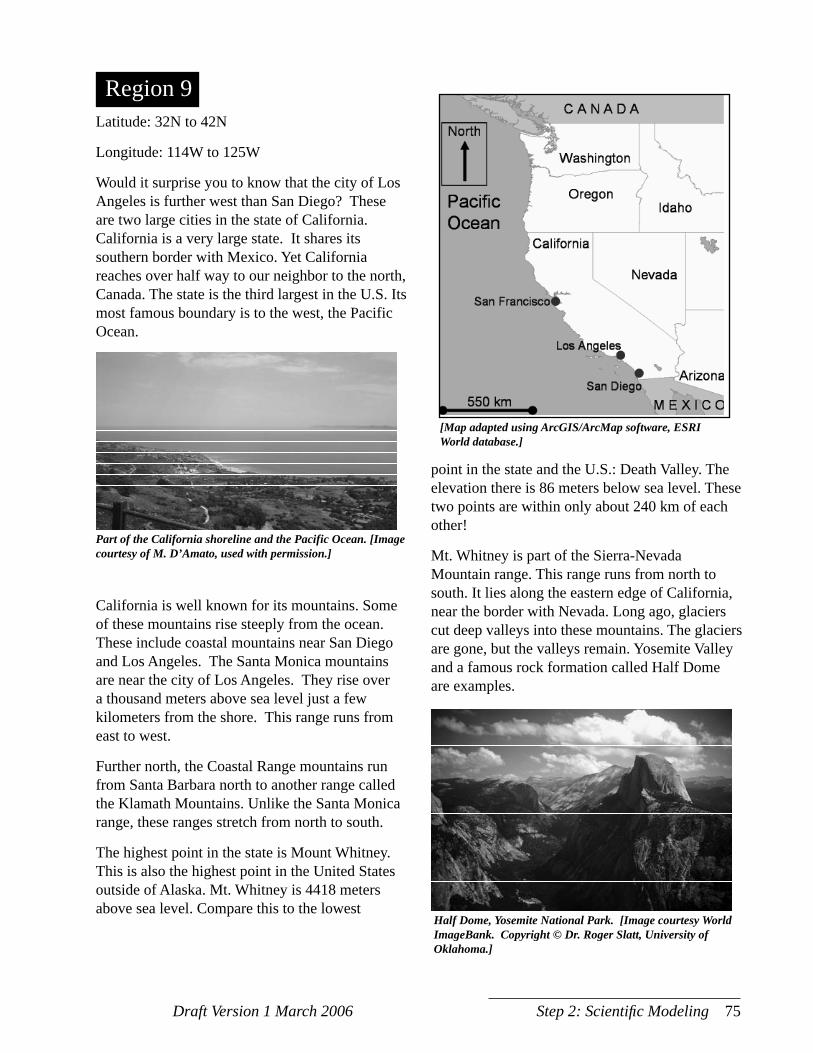
Draft Version 1 March 2006 Step 2: Scientifi c Modeling 75
Latitude: 32N to 42N
Longitude: 114W to 125W
Would it surprise you to know that the city of Los Angeles is further west than San Diego? These are two large cities in the state of California. California is a very large state. It shares its southern border with Mexico. Yet California reaches over half way to our neighbor to the north, Canada. The state is the third largest in the U.S. Its most famous boundary is to the west, the Pacific Ocean.
California is well known for its mountains. Some of these mountains rise steeply from the ocean. These include coastal mountains near San Diego and Los Angeles. The Santa Monica mountains are near the city of Los Angeles. They rise over a thousand meters above sea level just a few kilometers from the shore. This range runs from east to west.
Further north, the Coastal Range mountains run from Santa Barbara north to another range called the Klamath Mountains. Unlike the Santa Monica range, these ranges stretch from north to south.
The highest point in the state is Mount Whitney. This is also the highest point in the United States outside of Alaska. Mt. Whitney is 4418 meters above sea level. Compare this to the lowest
point in the state and the U.S.: Death Valley. The elevation there is 86 meters below sea level. These two points are within only about 240 km of each other!
Mt. Whitney is part of the Sierra-Nevada Mountain range. This range runs from north to south. It lies along the eastern edge of California, near the border with Nevada. Long ago, glaciers cut deep valleys into these mountains. The glaciers are gone, but the valleys remain. Yosemite Valley and a famous rock formation called Half Dome are examples.
Region 9
Part of the California shoreline and the Pacific Ocean. [Image courtesy of M. D’Amato, used with permission.]
Half Dome, Yosemite National Park. [Image courtesy World ImageBank. Copyright © Dr. Roger Slatt, University of Oklahoma.]
[Map adapted using ArcGIS/ArcMap software, ESRI World database.]

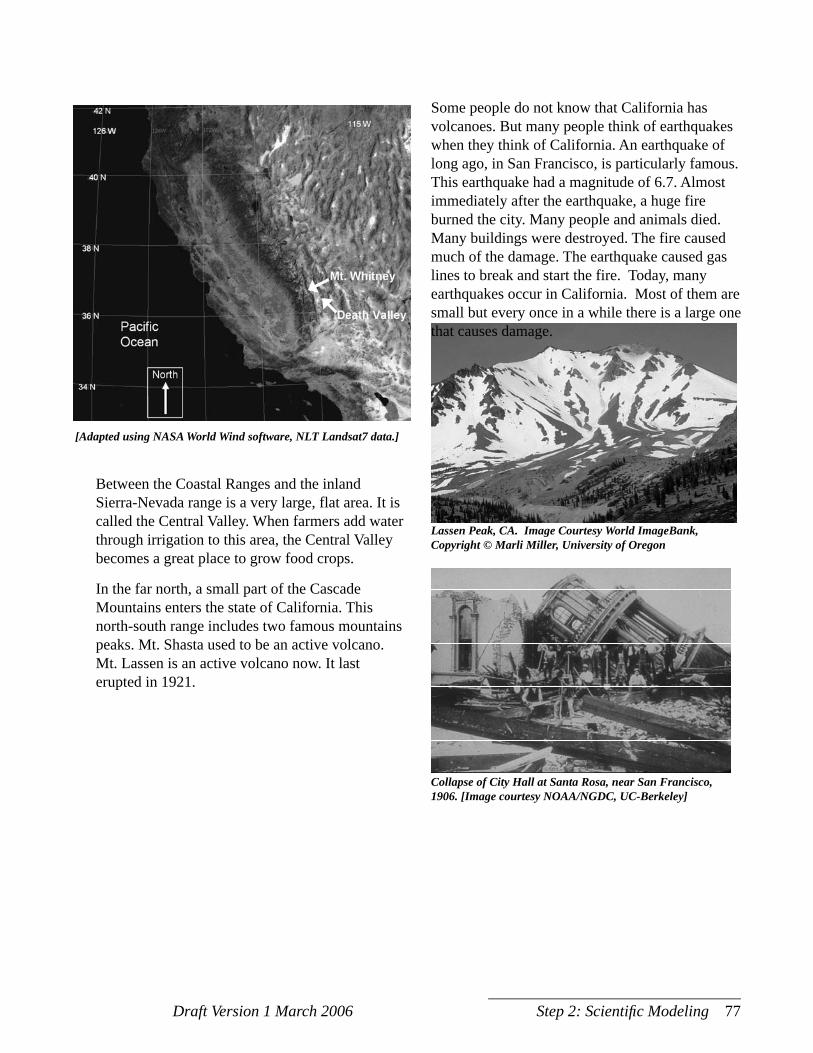
Draft Version 1 March 2006 Step 2: Scientifi c Modeling 77
Between the Coastal Ranges and the inland Sierra-Nevada range is a very large, flat area. It is called the Central Valley. When farmers add water through irrigation to this area, the Central Valley becomes a great place to grow food crops.
In the far north, a small part of the Cascade Mountains enters the state of California. This north-south range includes two famous mountains peaks. Mt. Shasta used to be an active volcano. Mt. Lassen is an active volcano now. It last erupted in 1921.
Collapse of City Hall at Santa Rosa, near San Francisco, 1906. [Image courtesy NOAA/NGDC, UC-Berkeley]
Lassen Peak, CA. Image Courtesy World ImageBank, Copyright © Marli Miller, University of Oregon
Some people do not know that California has volcanoes. But many people think of earthquakes when they think of California. An earthquake of long ago, in San Francisco, is particularly famous. This earthquake had a magnitude of 6.7. Almost immediately after the earthquake, a huge fire burned the city. Many people and animals died. Many buildings were destroyed. The fire caused much of the damage. The earthquake caused gas lines to break and start the fire. Today, many earthquakes occur in California. Most of them are small but every once in a while there is a large one that causes damage.
[Adapted using NASA World Wind software, NLT Landsat7 data.]

Draft Version 1 March 2006 Step 2: Scientifi c Modeling 79
Step 2 - Lesson 2 Snapshot
Key Concept• Scientific models are based on evidence.Evidence of Student UnderstandingThe student will be able to: • build a physical scientific model of a region of
the world that describes that region’s landforms;
• describe what a scientific model is and how scientists use them.
Time Needed45 minutes
MaterialsFor each region group of 2-4 students• modeling materials (can
include modeling clay, paper, cardboard, popsicle sticks, tape, toothpicks, straws, paper cups, cotton balls, or other common materials that students will use to build physical models of the regions)
For each student• copy of Student Page
2.2A: What is a Scientific Model?
• copy of Student Page 2.2B: Investigation Worksheet
Begin Modeling Investigation 1. Give students an opportunity to review their questions and
evidence for landforms from the previous lesson in their region groups.
2. Use a classroom reading strategy or have students individually read Student Page 2.2A: What is a Scientific Model?
3. Instruct students to build a physical scientific model of their region (one model per region). Have each student use Student Page 2.2B: Investigation Worksheet to first plan the model building, before construction.
4. Provide modeling materials for students to begin constructing physical models of their regions once you have approved their design. Begin constructing a model of the California region at the same time to show students how to model the landforms.
5. Use the REAPS throughout and after the lesson as appropriate.
REAPSR What features are you modeling in your region? Answers will vary by region, but should focus on
landforms.E What initial evidence are you using to model those
features? Answers will vary by region, but evidence should come
from the region essays.A What are the limitations to your model? Answers will vary by region. Example: “Mountains in this
region are depicted by paper cups, which have a smooth surface. Real mountains are rough with rocks and trees.”
P How could you change your model so it represents more geographical details of the region?
Answers will vary by region. Example: “I could draw something that represents trees on the cups so it is more accurate and then include this new symbol in my legend so people know what it stands for.”
S Complete this sentence and write it in your Science Notebook: “I acted like a scientist today when I…”
80 Exploring Earth’s Landforms Draft Version 1 March 2006
Background InformationFor information on scientific modeling, refer to the Unit Overview.
Implementation Guide1. Direct students to gather in their region
groups. Instruct them to review questions they have about their region along with the evidence for landforms they synthesized from the readings and maps in the last lesson. Remind students that they will investigate the geologic features of their region and related catastrophic events. To begin this investigation they will construct an initial model of their region’s landforms.
2. Distribute Student Page 2.2A: What is a Scientific Model? and either use a classroom reading strategy or have students individually read the article.
3. Introduce the question: How can you make a model that will illustrate your region and describe the scientific ideas that explain what is going on with your region’s landforms? Have students in their region groups design a first version of their model together. Each student should complete Student Page 2.2B: Investigation Worksheet so everyone knows what they will build.
4. Provide students with some initial instructions on how they should approach the construction of their model. They will be working in groups to design and construct one model per group that illustrates the main geologic features of their region. Remind students that they will be using this model and changing it throughout this unit to illustrate how their region’s landforms developed and are changing. Introduce the available modeling materials so students can think about construction. Approve each group’s sketch and description before they begin construction of the model. Once they are finished building their model they
should place it in a designated area and put Student Page 2.2B: Investigation Worksheet in their Science Notebook. They will fill out a new Model Investigation Worksheet each time they revise their model. However, all of these worksheets can be compiled in their Science Notebooks to create a record of the progression of the model.
5. Use the REAPS throughout and after the lesson as appropriate.
Advance PreparationGather common materials from the classroom for making physical scientific models. This first model deals primarily with surface features and evidence for landforms (primarily from the reading in Lesson 2.1). Therefore, try to keep this first experience simple and quick. Limit time and materials.
Use modeling clay and other common items to build the first 3-dimensional model of the regions, including California. Items can include paper or cardboard products (cups, construction paper, etc.) and some soft materials (pieces of fabric, cotton balls, etc.) However, students should draw a sketch of their model as a group before they begin construction.
Think about where the region models can be stored and displayed once they are constructed. Students will be working with these models throughout the unit so they should be in a place that is easy to access and highly visible.
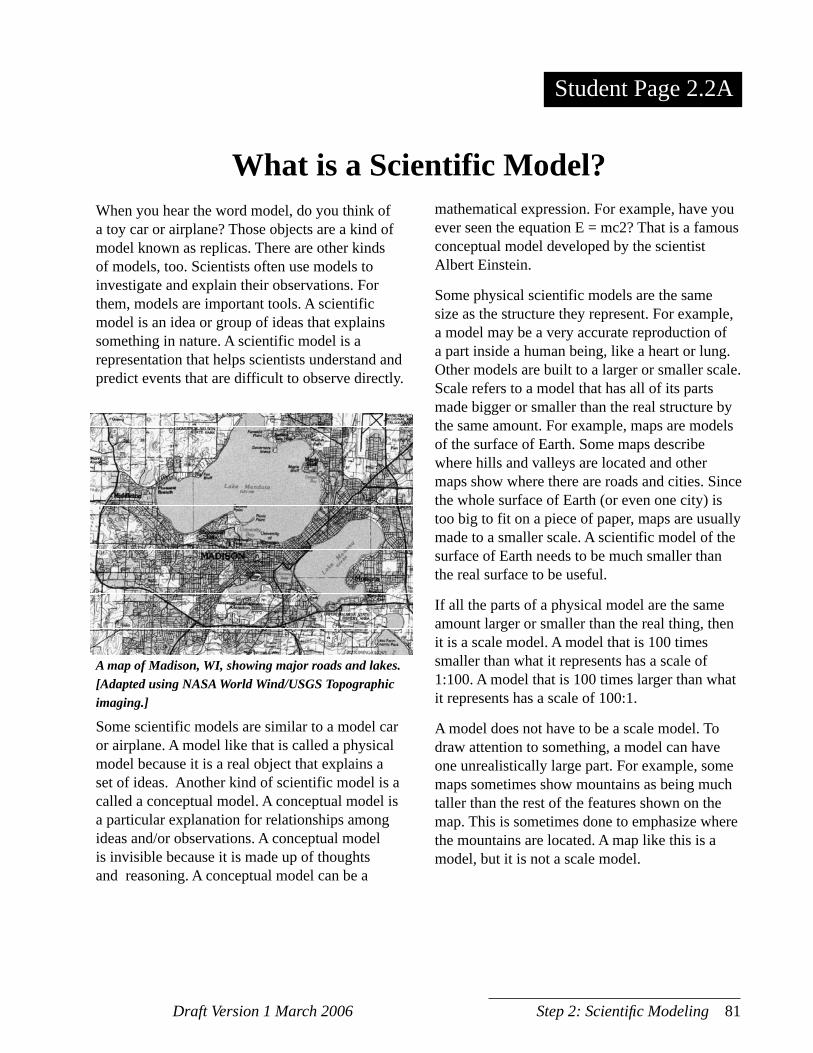
Draft Version 1 March 2006 Step 2: Scientifi c Modeling 81
mathematical expression. For example, have you ever seen the equation E = mc2? That is a famous conceptual model developed by the scientist Albert Einstein.
Some physical scientific models are the same size as the structure they represent. For example, a model may be a very accurate reproduction of a part inside a human being, like a heart or lung. Other models are built to a larger or smaller scale. Scale refers to a model that has all of its parts made bigger or smaller than the real structure by the same amount. For example, maps are models of the surface of Earth. Some maps describe where hills and valleys are located and other maps show where there are roads and cities. Since the whole surface of Earth (or even one city) is too big to fit on a piece of paper, maps are usually made to a smaller scale. A scientific model of the surface of Earth needs to be much smaller than the real surface to be useful.
If all the parts of a physical model are the same amount larger or smaller than the real thing, then it is a scale model. A model that is 100 times smaller than what it represents has a scale of 1:100. A model that is 100 times larger than what it represents has a scale of 100:1.
A model does not have to be a scale model. To draw attention to something, a model can have one unrealistically large part. For example, some maps sometimes show mountains as being much taller than the rest of the features shown on the map. This is sometimes done to emphasize where the mountains are located. A map like this is a model, but it is not a scale model.
When you hear the word model, do you think of a toy car or airplane? Those objects are a kind of model known as replicas. There are other kinds of models, too. Scientists often use models to investigate and explain their observations. For them, models are important tools. A scientific model is an idea or group of ideas that explains something in nature. A scientific model is a representation that helps scientists understand and predict events that are difficult to observe directly.
A map of Madison, WI, showing major roads and lakes. [Adapted using NASA World Wind/USGS Topographic imaging.]
Some scientific models are similar to a model car or airplane. A model like that is called a physical model because it is a real object that explains a set of ideas. Another kind of scientific model is a called a conceptual model. A conceptual model is a particular explanation for relationships among ideas and/or observations. A conceptual model is invisible because it is made up of thoughts and reasoning. A conceptual model can be a
STUDENT PAGE
What is a Scientific Model?
Student Page 2.2A

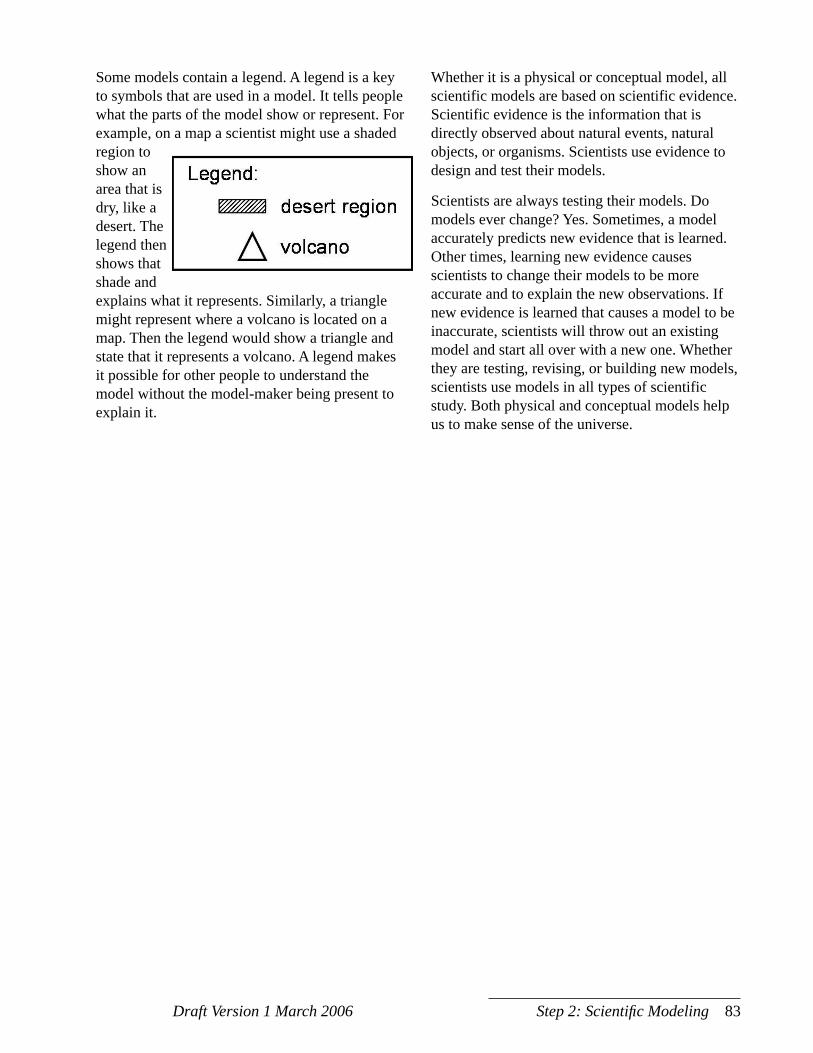
Draft Version 1 March 2006 Step 2: Scientifi c Modeling 83
Some models contain a legend. A legend is a key to symbols that are used in a model. It tells people what the parts of the model show or represent. For example, on a map a scientist might use a shaded region to show an area that is dry, like a desert. The legend then shows that shade and explains what it represents. Similarly, a triangle might represent where a volcano is located on a map. Then the legend would show a triangle and state that it represents a volcano. A legend makes it possible for other people to understand the model without the model-maker being present to explain it.
Whether it is a physical or conceptual model, all scientific models are based on scientific evidence. Scientific evidence is the information that is directly observed about natural events, natural objects, or organisms. Scientists use evidence to design and test their models.
Scientists are always testing their models. Do models ever change? Yes. Sometimes, a model accurately predicts new evidence that is learned. Other times, learning new evidence causes scientists to change their models to be more accurate and to explain the new observations. If new evidence is learned that causes a model to be inaccurate, scientists will throw out an existing model and start all over with a new one. Whether they are testing, revising, or building new models, scientists use models in all types of scientific study. Both physical and conceptual models help us to make sense of the universe.

Draft Version 1 March 2006 Step 2: Scientifi c Modeling 85
Legend
Student Page 2.2B
Model Investigation Worksheet
Name: _____________________________________________________________________
Date: ______________________________________________________________________
Region: ____________________________________________________________________
Description:What evidence are you basing your model on?What materials are you going to use?What ideas or features are you modeling and why?
_____________________________________________________________________________________
_____________________________________________________________________________________
_____________________________________________________________________________________
_____________________________________________________________________________________
_____________________________________________________________________________________
_____________________________________________________________________________________
_____________________________________________________________________________________

S T E P
3
Overview: Sudden Movements
In Step 3, students explore the concept of seismic waves (vibrations of the earth). They first study the types of waves that carry energy released by earthquakes and the tools that scientists use to study them. Then, students begin to think about how often and where earthquakes and volcanic eruptions take place. To do this, students study real scientific data for where and when earthquakes and volcanic eruptions occur. They discover that small earthquakes happen frequently but large ones are rare. They also make a key observation that will help them learn that Earth’s crust is segmented into plates: earthquakes and volcanoes do not occur in random locations but in a specific pattern. In a later step, students will make the association between this pattern and tectonic plate boundaries.
Lesson 3.1Earthquake Basics (40 min)
Lesson 3.2 Analyzing Seismic Data (45 min)
Lesson 3.3 Revising Region Models (30 min)

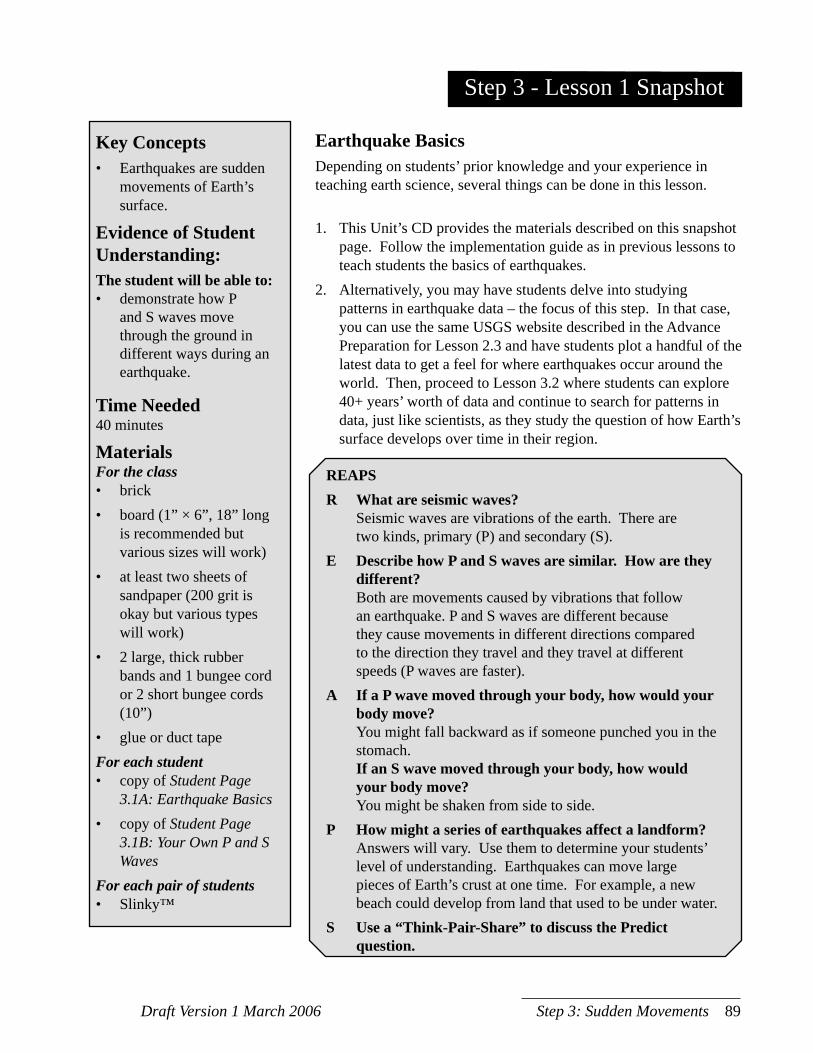
Draft Version 1 March 2006 Step 3: Sudden Movements 89
Key Concepts• Earthquakes are sudden
movements of Earth’s surface.
Evidence of StudentUnderstanding:The student will be able to: • demonstrate how P
and S waves move through the ground in different ways during an earthquake.
Time Needed40 minutes
MaterialsFor the class• brick• board (1” × 6”, 18” long
is recommended but various sizes will work)
• at least two sheets of sandpaper (200 grit is okay but various types will work)
• 2 large, thick rubber bands and 1 bungee cord or 2 short bungee cords (10”)
• glue or duct tapeFor each student• copy of Student Page
3.1A: Earthquake Basics• copy of Student Page
3.1B: Your Own P and S Waves
For each pair of students• Slinky™
Step 3 - Lesson 1 Snapshot
Earthquake BasicsDepending on students’ prior knowledge and your experience inteaching earth science, several things can be done in this lesson.
1. This Unit’s CD provides the materials described on this snapshot page. Follow the implementation guide as in previous lessons to teach students the basics of earthquakes.
2. Alternatively, you may have students delve into studying patterns in earthquake data – the focus of this step. In that case, you can use the same USGS website described in the Advance Preparation for Lesson 2.3 and have students plot a handful of the latest data to get a feel for where earthquakes occur around the world. Then, proceed to Lesson 3.2 where students can explore 40+ years’ worth of data and continue to search for patterns in data, just like scientists, as they study the question of how Earth’s surface develops over time in their region.
REAPS R What are seismic waves? Seismic waves are vibrations of the earth. There are two kinds, primary (P) and secondary (S).E Describe how P and S waves are similar. How are they different? Both are movements caused by vibrations that follow an earthquake. P and S waves are different because they cause movements in different directions compared to the direction they travel and they travel at different speeds (P waves are faster).A If a P wave moved through your body, how would your body move? You might fall backward as if someone punched you in the stomach. If an S wave moved through your body, how would your body move? You might be shaken from side to side.P How might a series of earthquakes affect a landform? Answers will vary. Use them to determine your students’ level of understanding. Earthquakes can move large pieces of Earth’s crust at one time. For example, a new beach could develop from land that used to be under water.S Use a “Think-Pair-Share” to discuss the Predict question.

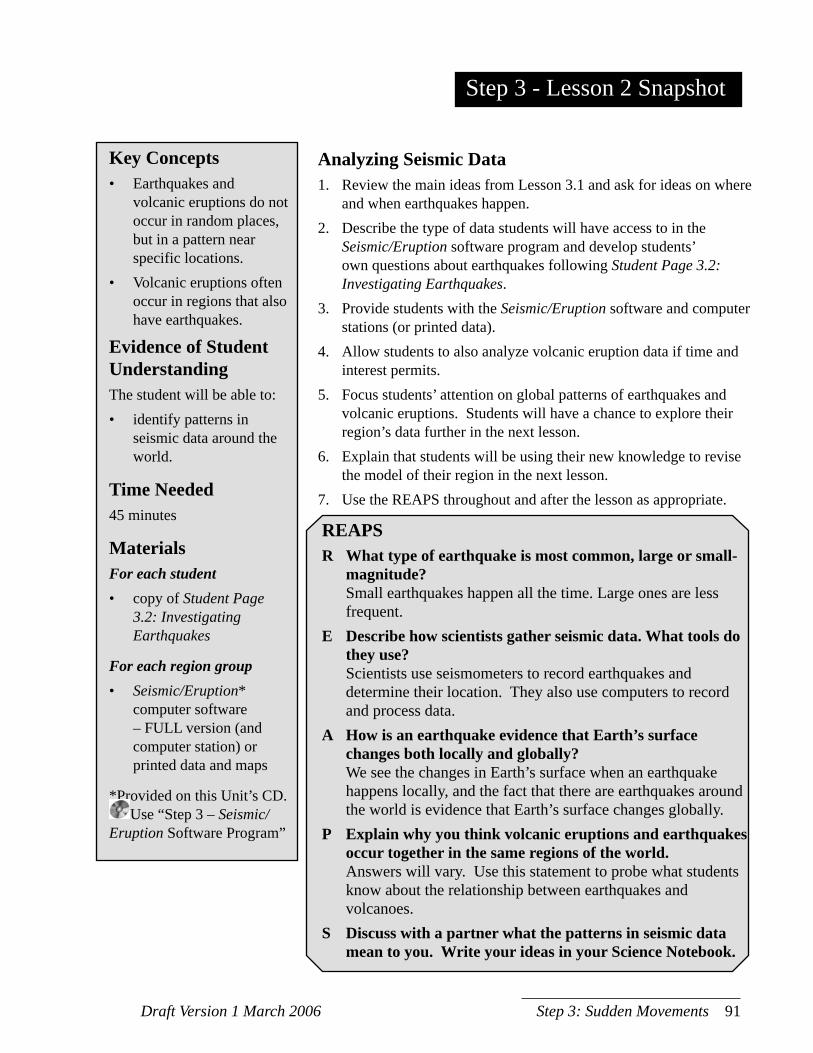
Draft Version 1 March 2006 Step 3: Sudden Movements 91
Step 3 - Lesson 2 Snapshot
Key Concepts• Earthquakes and
volcanic eruptions do not occur in random places, but in a pattern near specific locations.
• Volcanic eruptions often occur in regions that also have earthquakes.
Evidence of Student UnderstandingThe student will be able to: • identify patterns in
seismic data around the world.
Time Needed45 minutes
MaterialsFor each student• copy of Student Page
3.2: Investigating Earthquakes
For each region group• Seismic/Eruption*
computer software – FULL version (and computer station) or printed data and maps
*Provided on this Unit’s CD. Use “Step 3 – Seismic/
Eruption Software Program”
Analyzing Seismic Data1. Review the main ideas from Lesson 3.1 and ask for ideas on where
and when earthquakes happen.2. Describe the type of data students will have access to in the
Seismic/Eruption software program and develop students’ own questions about earthquakes following Student Page 3.2: Investigating Earthquakes.
3. Provide students with the Seismic/Eruption software and computer stations (or printed data).
4. Allow students to also analyze volcanic eruption data if time and interest permits.
5. Focus students’ attention on global patterns of earthquakes and volcanic eruptions. Students will have a chance to explore their region’s data further in the next lesson.
6. Explain that students will be using their new knowledge to revise the model of their region in the next lesson.
7. Use the REAPS throughout and after the lesson as appropriate.
REAPSR What type of earthquake is most common, large or small-
magnitude? Small earthquakes happen all the time. Large ones are less
frequent.E Describe how scientists gather seismic data. What tools do
they use? Scientists use seismometers to record earthquakes and
determine their location. They also use computers to record and process data.
A How is an earthquake evidence that Earth’s surface changes both locally and globally?
We see the changes in Earth’s surface when an earthquake happens locally, and the fact that there are earthquakes around the world is evidence that Earth’s surface changes globally.
P Explain why you think volcanic eruptions and earthquakes occur together in the same regions of the world.
Answers will vary. Use this statement to probe what students know about the relationship between earthquakes and volcanoes.
S Discuss with a partner what the patterns in seismic data mean to you. Write your ideas in your Science Notebook.
92 Exploring Earth’s Landforms Draft Version 1 March 2006
Background InformationSince Earth’s surface is made of tectonic plates that are constantly grinding past each other in various ways, earthquakes happen all the time. Most are small and only sensitive seismometers detect them. Large ones are rarer. Earthquakes happen along fractures in Earth’s crust called faults. Some earthquakes happen far away from plate boundaries, but are still located on faults.Volcanoes typically form in regions where earthquakes are most prevalent (along plate boundaries) because of other tectonic processes
in the region (like subduction). An exception would be, for example, the volcanoes in Hawaii. These occur because there is a “hot spot” under the middle of the Pacific plate and magma comes through the crust there. No matter where volcanoes are, they often generate earthquakes, too, before and during eruptions.Data displayed in the Seismic/Eruption software program are locations and information (magnitude and depth) for real earthquakes from a worldwide database.
Advance PreparationFor part 1, you will need to know the most recent earthquake data. The day before you teach this lesson, go to the United States Geologic Survey (USGS) Earthquake Hazards website to get the latest earthquake data:
http://earthquake.usgs.gov/eqcenter/recenteqsww/Quakes/quakes_all.php
On this page, you will see a list of earthquakes. The first row contains data for the latest earthquake. Clicking on an item gives you more information about what happened.
Draft Version 1 March 2006 Step 3: Sudden Movements 93
Implementation Guide1. Review the main ideas from Lesson 3.1.
Then, ask students when they think the last earthquake occurred. How often do they think earthquakes happen? Now ask students where they think earthquakes happen. Does every part of the world experience earthquakes? Share the latest earthquake data with students from the USGS website. Discuss their reactions. Does this information support their ideas or tell them something different?
2. Ask students what questions they have about where and when earthquakes occur. Record their thoughts on the board. Explain the type of data they have to work with – the locations, magnitude, and depth of earthquakes worldwide since 1960 displayed in the Seismic/Eruption software program. Which questions can be answered with the data they have? Allow students to get into pairs and choose a question that they could answer with the data they have. Have them complete Steps 1–3 of Student Page 3.2: Investigating Earthquakes before you allow them to study the data. Step 1 focuses on what question they hope to answer. Travel around the room to make sure students are planning to investigate good questions.
In general, questions should be answerable with the kind of data that is available. Several of the program’s settings can be varied to display information about earthquakes. These include the range of dates, size of earthquakes, and regions of the world. Here are some example questions that students could answer using the data:• Where do earthquakes occur?• Do big earthquakes and small earthquakes
happen in the same or different locations?
Avoid questions that focus on single details rather than comparisons. For example, “Where was the biggest/smallest earthquake ever?” or “How many earthquakes happened in Japan last year?” While these questions are interesting, they do not lead students to develop an understanding of the underlying causes of earthquakes and the patterns in which they occur. Work with students to revise these questions into comparison questions like, “Do small and large earthquakes happen in the same places?” Also, avoid “why” questions like, “Why do earthquakes happen in California?” The software simply shows data. It does not explain why the data is the way it is. Work with students to revise “why” questions into “where” or “what” questions such as, “Where in California do earthquakes happen?” or “What size earthquakes occur most frequently in Japan?” “How” questions can also work: “How many of the earthquakes that happened last year were in Pakistan?” After seeing the data, students will begin to notice patterns. These patterns will generate additional questions. As the students progress through the activity, encourage them to write down new questions they develop in their Science Notebooks. This is a natural part of scientific inquiry. While students are gathering information to answer one question, they make observations that cause them to ask another question. You can either have them record their observations informally or complete Steps 1–3 of another copy of Student Page 3.2: Investigating Earthquakes as if they would do another investigation on that question. If time permits, allow them to investigate further.
94 Exploring Earth’s Landforms Draft Version 1 March 2006
3. Provide students with the Seismic/Eruption software program (or printed data charts and maps) and ask them to plot data they are interested in about earthquakes in order to answer their questions. Allow students to work with the data and complete Student Page 3.2: Investigating Earthquakes.
4. As students finish working, explain that there is also volcano data available. Ask what they could learn if they also studied data on volcanic eruptions. What questions could they answer?
Encourage them to do another investigation. You may even want them to fill out another Student Page to help guide them through the process. Good volcano questions could be related to their first question about earthquakes. For example, if they first asked where most earthquakes occurred last year, they could ask the same question about volcanoes and then compare the answers. Not all groups may get to this step. However, for groups that ask simpler questions or for those students who finish faster, this extension draws the connection between earthquakes and volcanoes. Be sure to have these students share their findings on volcanoes for the whole class so that students who did not see the volcano data begin to grasp the relationship in patterns of earthquake and volcanic activity.
5. Throughout this lesson, focus students’ attention on global patterns in the data, for both earthquakes and volcanic eruptions. Students will have a chance in the next
lesson to study their specific regions, but it is important to highlight the global patterns that students can see in the Seismic Eruption software program. Also, although it can be turned off, there is a feature in the software that automatically displays plate names and boundaries once the data is displayed. If students notice this, ask them what it could mean. The lines and names are not physically marked on Earth’s surface, they were drawn by scientists. Why are those patterns significant?
6. Ask a few student groups to share their questions, the data they used to answer them, and what they learned. Encourage them to use the Student Page for reference. Be sure to include students that also studied volcano data. As a class, discuss what other questions the students have. What did they observe that makes them ask these questions? What does the class think are the big ideas that they learned today? What patterns did they notice in the data and in the group reports? Your students may identify that:• Earthquakes happen in specific patterns.• Small earthquakes are more common than
large ones.• Volcanoes and earthquakes happen in
similar places. Allow them to record their observations in
their Science Notebooks.7. Use the REAPS throughout and after the
lesson as appropriate.
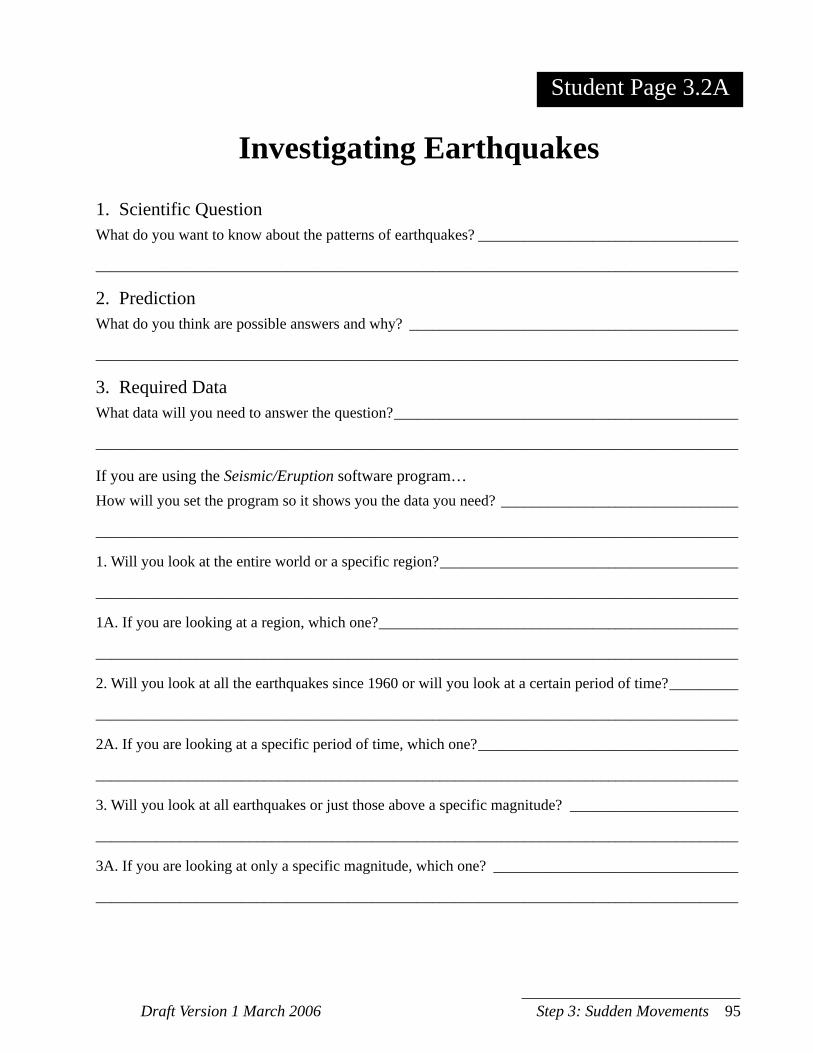
Draft Version 1 March 2006 Step 3: Sudden Movements 95
STUDENT PA
Investigating Earthquakes
1. Scientific Question What do you want to know about the patterns of earthquakes? __________________________________
____________________________________________________________________________________
2. PredictionWhat do you think are possible answers and why? ___________________________________________
____________________________________________________________________________________
3. Required DataWhat data will you need to answer the question? _____________________________________________
____________________________________________________________________________________
If you are using the Seismic/Eruption software program…How will you set the program so it shows you the data you need? _______________________________
____________________________________________________________________________________
1. Will you look at the entire world or a specific region? _______________________________________
____________________________________________________________________________________
1A. If you are looking at a region, which one? _______________________________________________
____________________________________________________________________________________
2. Will you look at all the earthquakes since 1960 or will you look at a certain period of time? _________
____________________________________________________________________________________
2A. If you are looking at a specific period of time, which one? __________________________________
____________________________________________________________________________________
3. Will you look at all earthquakes or just those above a specific magnitude? ______________________
____________________________________________________________________________________
3A. If you are looking at only a specific magnitude, which one? ________________________________
____________________________________________________________________________________
Student Page 3.2A

Draft Version 1 March 2006 Step 3: Sudden Movements 97
4. Describing the DataWhat did the data tell you? ______________________________________________________________
____________________________________________________________________________________
____________________________________________________________________________________
____________________________________________________________________________________
____________________________________________________________________________________
5. Developing ExplanationsWhat do you think is the answer to your question? Explain what you learned that helped you answer your question. ____________________________________________________________________________
____________________________________________________________________________________
____________________________________________________________________________________
____________________________________________________________________________________
____________________________________________________________________________________
____________________________________________________________________________________
____________________________________________________________________________________
6. New Questions?What new questions do you have after seeing the data? _______________________________________
____________________________________________________________________________________
____________________________________________________________________________________
____________________________________________________________________________________
____________________________________________________________________________________
____________________________________________________________________________________
____________________________________________________________________________________
STUDENT PAGE
Investigating Earthquakes (continued)
Name: ____________________________________________
Date: _____________________________________________
Student Page 3.2A Continued

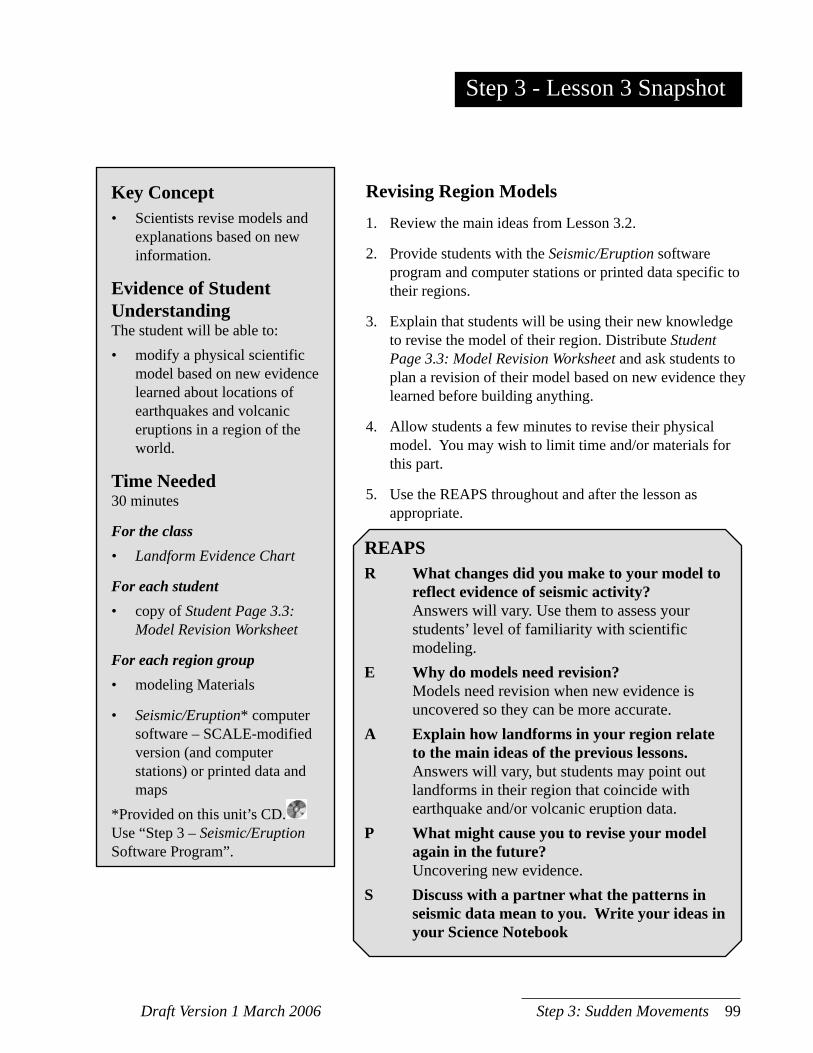
Draft Version 1 March 2006 Step 3: Sudden Movements 99
Step 3 - Lesson 3 Snapshot
Key Concept• Scientists revise models and
explanations based on new information.
Evidence of Student UnderstandingThe student will be able to:• modify a physical scientific
model based on new evidence learned about locations of earthquakes and volcanic eruptions in a region of the world.
Time Needed30 minutes
For the class• Landform Evidence Chart
For each student• copy of Student Page 3.3:
Model Revision Worksheet
For each region group• modeling Materials
• Seismic/Eruption* computer software – SCALE-modified version (and computer stations) or printed data and maps
*Provided on this unit’s CD. Use “Step 3 – Seismic/Eruption Software Program”.
Revising Region Models1. Review the main ideas from Lesson 3.2.
2. Provide students with the Seismic/Eruption software program and computer stations or printed data specific to their regions.
3. Explain that students will be using their new knowledge to revise the model of their region. Distribute Student Page 3.3: Model Revision Worksheet and ask students to plan a revision of their model based on new evidence they learned before building anything.
4. Allow students a few minutes to revise their physical model. You may wish to limit time and/or materials for this part.
5. Use the REAPS throughout and after the lesson as appropriate.
REAPSR What changes did you make to your model to
reflect evidence of seismic activity? Answers will vary. Use them to assess your
students’ level of familiarity with scientific modeling.
E Why do models need revision? Models need revision when new evidence is
uncovered so they can be more accurate.A Explain how landforms in your region relate
to the main ideas of the previous lessons. Answers will vary, but students may point out landforms in their region that coincide with earthquake and/or volcanic eruption data.P What might cause you to revise your model
again in the future? Uncovering new evidence.S Discuss with a partner what the patterns in
seismic data mean to you. Write your ideas in your Science Notebook
100 Exploring Earth’s Landforms Draft Version 1 March 2006
Background InformationIn this lesson, students revise their region models using information they have learned from previous lessons in this step. Scientists often develop a model based on some evidence but realize, after more research, they can improve their model and make it more accurate based on new information. Students can experience this same process by revising their models after several steps throughout this unit. Changes should be made solely on new evidence they learned about the development of Earth’s landforms in their region. The number of changes made may vary from region to region, but all students should think about the implications of what they just learned on their region’s model.
Implementation Guide1. Review the main ideas and questions students
studied from the previous lesson and discuss how they obtained answers to their questions from the data. What did they see in the data that made them realize earthquakes and volcanoes occur in specific places?
2. Provide students with the Seismic/Eruption software program -- SCALE-modified version
(or printed data specific to their regions). Ask them to think about the locations of earthquakes and volcanoes with respect to their region. Is their region one that has earthquakes, volcanoes, or both? Does their model reflect this? Is their region one that has small earthquakes, large earthquakes, or both? Does their model reflect this?
3. What would students need to change about their model so that it more accurately reflects data on volcanoes and earthquakes? Explain that students will be using their new knowledge about earthquakes and volcanic eruptions to revise the model of their region.
Briefly discuss why scientists revise models. Encourage students to think about their new evidence. Hand out Student Page 3.3: Model Revision Worksheet to each student. In their region groups, students should discuss and agree upon the revisions they will make to their model. Each student within the group needs to sketch and describe the newly revised model on their worksheet before the group begins to reconstruct their model.
4. Remind students they are not building a new model or completely rebuilding the model but instead should make changes or additions to their existing model based on new evidence. Ask them to think about what their model shows effectively. What are the limitations of their model? What key features or ideas would they like to change? Allow students time to complete their model revisions. You may wish to limit time and/or materials.
5. Use the REAPS throughout and after the lesson as appropriate.
Advance PreparationPrepare modeling materials. Make sure you have adequate supplies for the students’ models. During this revision, students will most likely add different materials to their models to indicate places where volcanoes and earthquakes occur in their region.
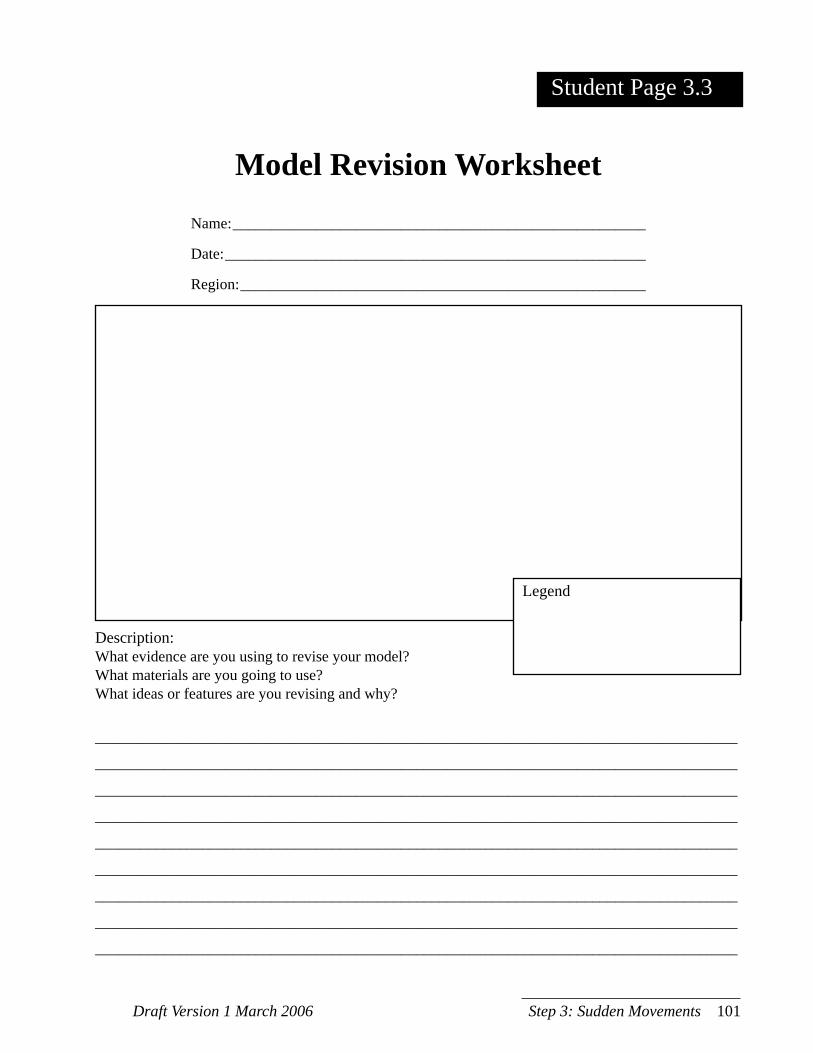
Draft Version 1 March 2006 Step 3: Sudden Movements 101
Description:What evidence are you using to revise your model?What materials are you going to use?What ideas or features are you revising and why?
____________________________________________________________________________________
____________________________________________________________________________________
____________________________________________________________________________________
____________________________________________________________________________________
____________________________________________________________________________________
____________________________________________________________________________________
____________________________________________________________________________________
____________________________________________________________________________________
____________________________________________________________________________________
STUDENT PAGE
Model Revision Worksheet
Name: ______________________________________________________
Date: _______________________________________________________
Region: _____________________________________________________
Legend
STUDENT PAGE Student Page 3.3

S T E P
4Overview:
Geologic TimeIf Earth’s surface can move (as during earthquakes and volcanic eruptions), how might it have looked in the past? And just how long ago was “the past” when we speak of Earth’s history? In other words, how long has Earth’s surface been changing? In Step 4, these intriguing questions extend what students have learned in previous steps and introduces them to the geologic time scale. This step presents two lines of evidence that scientists have used to understand Earth’s history: The fit of continents and the distribution of fossils. This step also provides a bridge between present-day observations and the history of how the ideas of plate tectonics developed.Students build relative and absolute timelines of events that happened during Earth’s long history. After looking at some of the major events in Earth’s history, students look at geologic events that happened in their regions and again improve the scientific model explaining their region’s landforms.
Lesson 4.1Continents and Fossils (50 min)
Lesson 4.2Personal Timelines (40 min)
Lesson 4.3
A Long Time Ago (40 min)
Lesson 4.4Adding-Machine Tape Timelines (40 min)
Lesson 4.5Landforms and Time (30 min)

Draft Version 1 March 2006 Step 4 Geologic Time 105
Step 4 - Lesson 1 SnapshotKey Concepts• Continents have been in different
positions during Earth’s history.• The shapes of the continents and
the locations of fossils are two important pieces of evidence for the idea of a super-continent.
Evidence of Student UnderstandingThe student will be able to:• identify the scientifically accepted
arrangement of the continents in the past and the two major lines of evidence supporting that arrangement.
Time Needed50 minutes
MaterialsFor the class• computer animation of breakup of
Pangaea*• computer equipment and projector
for showing Pangaea animationFor each student• copy of Student Page 4.1A: Fossil
Distribution• copy of one continent from
Student Pages 4.1B-G: Region Outline Maps
• copy of Student Page 4.1H: Fossil Strips
• copy of Student Page 4.1J: Shapes of the Continents
• copy of Student Page 4.1K: The History of Plate Tectonics*
• scissors• tape or glueFor each group• copy of Student Pages 4.1B-G:
Region Outline Maps (a full set)• Copy of Student Page 2.1A: World
Political Map*Provided on this Unit’s CD
Continents and Fossils1. Review the main ideas from earlier steps. Introduce the idea
that fossils can tell us about Earth’s history from long ago, well beyond the 50 or so years of earthquake data that was studied.
2. Divide students into groups to study fossil data using Student Pages 4.1A-H.
3. Discuss groups’ findings from fossil data. What patterns did students notice?
4. Allow students to continue to study the outlines of continents using Student Pages 4.1B-G and Student Page 4.1J and match this evidence with fossil data from before.
5. Discuss main ideas from this lesson as a whole class.6. Show scientists’ animation for the breakup of Pangaea.7. Read Student Page 4.1K: The History of Plate Tectonics.
How have students worked like scientists today?8. Use the REAPS throughout and after the lesson as
appropriate.
REAPSR What evidence did your group use to arrange the
continents? Shapes of the continent coastlines. Distribution of fossils.E How does this evidence inform scientists about the
position of continents in the past? The same kinds of fossils (and rocks) found in what are
now widely different locations mean that those organisms used to live in areas that were closer together. The shapes of coastlines (and continental shelves) correlate well with each other in many regions, providing evidence that continents were once in different positions.
A Explain why scientists need multiple pieces of evidence to form explanations.
Often, one piece of evidence could lead to several explanations for the same phenomenon. Multiple pieces of evidence narrow down the possible explanations and provide a better model.
P How do you think Earth’s surface might change in the next 200 million years?
Answers may vary. Accept all that are based on the evidence uncovered in this lesson.
S Tell your neighbor one thing you did in this lesson that Looks Like/Sounds Like something a scientist would do.
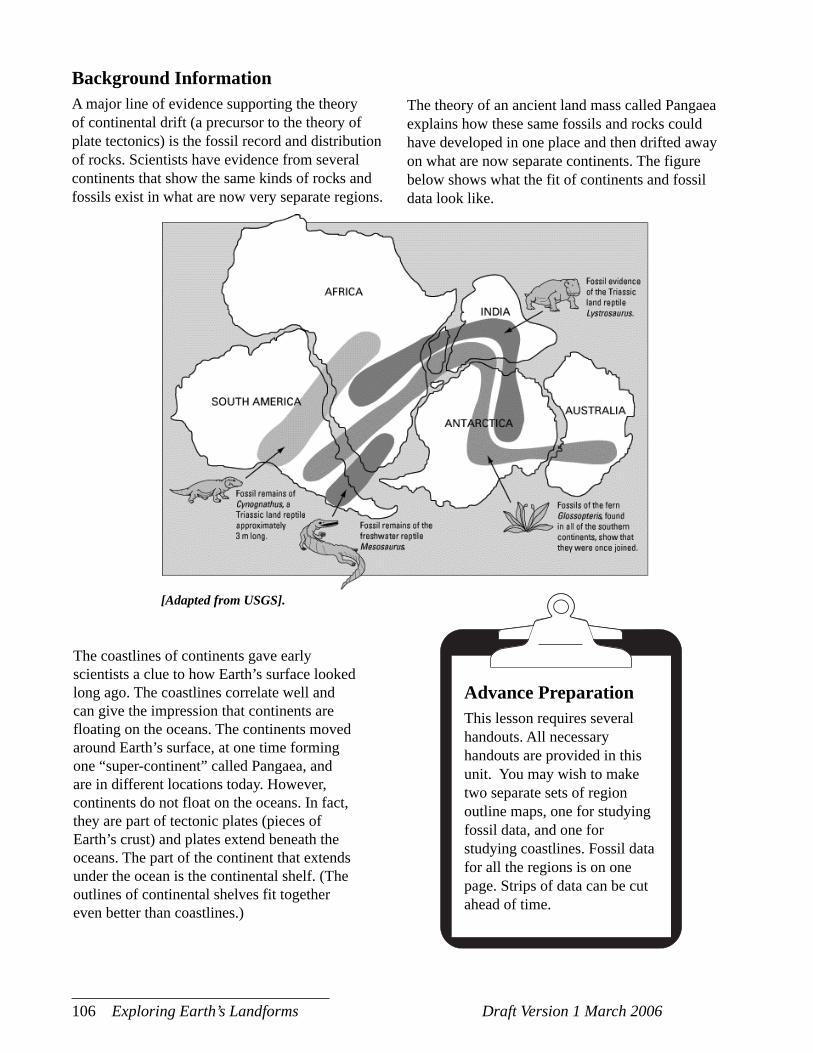
106 Exploring Earth’s Landforms Draft Version 1 March 2006
Background InformationA major line of evidence supporting the theory of continental drift (a precursor to the theory of plate tectonics) is the fossil record and distribution of rocks. Scientists have evidence from several continents that show the same kinds of rocks and fossils exist in what are now very separate regions.
Advance PreparationThis lesson requires several handouts. All necessary handouts are provided in this unit. You may wish to make two separate sets of region outline maps, one for studying fossil data, and one for studying coastlines. Fossil data for all the regions is on one page. Strips of data can be cut ahead of time.
The coastlines of continents gave early scientists a clue to how Earth’s surface looked long ago. The coastlines correlate well and can give the impression that continents are floating on the oceans. The continents moved around Earth’s surface, at one time forming one “super-continent” called Pangaea, and are in different locations today. However, continents do not float on the oceans. In fact, they are part of tectonic plates (pieces of Earth’s crust) and plates extend beneath the oceans. The part of the continent that extends under the ocean is the continental shelf. (The outlines of continental shelves fit together even better than coastlines.)
The theory of an ancient land mass called Pangaea explains how these same fossils and rocks could have developed in one place and then drifted away on what are now separate continents. The figure below shows what the fit of continents and fossil data look like.
[Adapted from USGS].
Draft Version 1 March 2006 Step 4 Geologic Time 107
Implementation Guide1. Review the main ideas from earlier steps.
Remind students of how they studied data that shows how Earth’s surface moves suddenly (as during earthquakes and volcanic eruptions). However, that data only takes us about 50 years into the past. If the present is the key to the past, ask students what other kinds of data might tell us what happened more than 50 years ago. In other words, what can we study today that gives us a clue about the distant past? Introduce the idea that fossils, remains of extinct organisms found in rocks, provide clues of what happened millions of years ago.
2. Divide students into 6 groups. Decide which group will study which regions for looking at fossil data. The six regions are:• Eastern Africa and Madagascar• Western Africa• Antarctica• Australia• India• South America
Each student will need Student Page 4.1A: Fossil Distribution. As students read the beginning of the article, distribute to each student their specific region’s outline maps from Student Pages 4.1B-G: Region Outline Maps and a strip of Fossil Data from Student Page 4.1H: Fossil Strips for their region. Provide the main instructions for this activity. Each student will place the fossils on the correct location on their map. Then, the group will make sure everyone’s fossils are in the correct places. When finished, each group will give their maps to you. (This completes parts 1-3 on Student Page 4.1A: Fossil Distribution.) Divide the maps so that each group gets one of their own maps and one of everyone else’s. Once students have a full set of regions marked with fossils, they can continue with parts 4–9 of Student Page 4.1A: Fossil Distribution (Continued). As they work, travel around the room and question students on their evidence and explanations.
3. When the groups have finished studying fossil data, ask each group what patterns
they discovered. Guide students towards understanding that the plants and animals that are now fossilized did not travel long distances across oceans. Instead, they were spread out over land and shorter distances, but the locations have changed over time. Ask if students were able to find a pattern that showed how the land could have fit together in the past that agrees with the fossil data.
4. Provide each student with Student Page 4.1J: Shapes of the Continents. Have students read the beginning of this article individually or use a classroom reading strategy. While students read, provide each group with the full set of Student Pages 4.1B-G: Region Outline Maps and Student Page 2.1A: World Political Map. Review the directions provided at the bottom of Student Page 4.1J. Students will need to cut out the regions somewhat carefully. As students begin to arrange their continents, travel around the room and ask students what evidence they have for the way they are placing the continents together. Make sure students do not flip their continents upside down. Continents may move around Earth’s surface laterally, but they don’t do back flips!
5. When everyone is finished, come together as a class. What did students learn from this lesson? Remember these main ideas could be content-related like “Fossils help scientists learn about the distant past”. Or they could be process-related like “Scientists use many different kinds of evidence to explain things.”
6. Show animation of how scientists believe Pangaea, the ancient “super-continent”, broke apart over millions of years and turned into the present-day continents. This animation is provided on the Unit’s CD.
7. Read Student Page 4.1K: The History of Plate Tectonics, provided on this Unit’s CD, if time permits. Discuss how the process that scientists used to figure out plate tectonics is similar to what the students did today.
8. Use the REAPS throughout and after the lesson as appropriate.

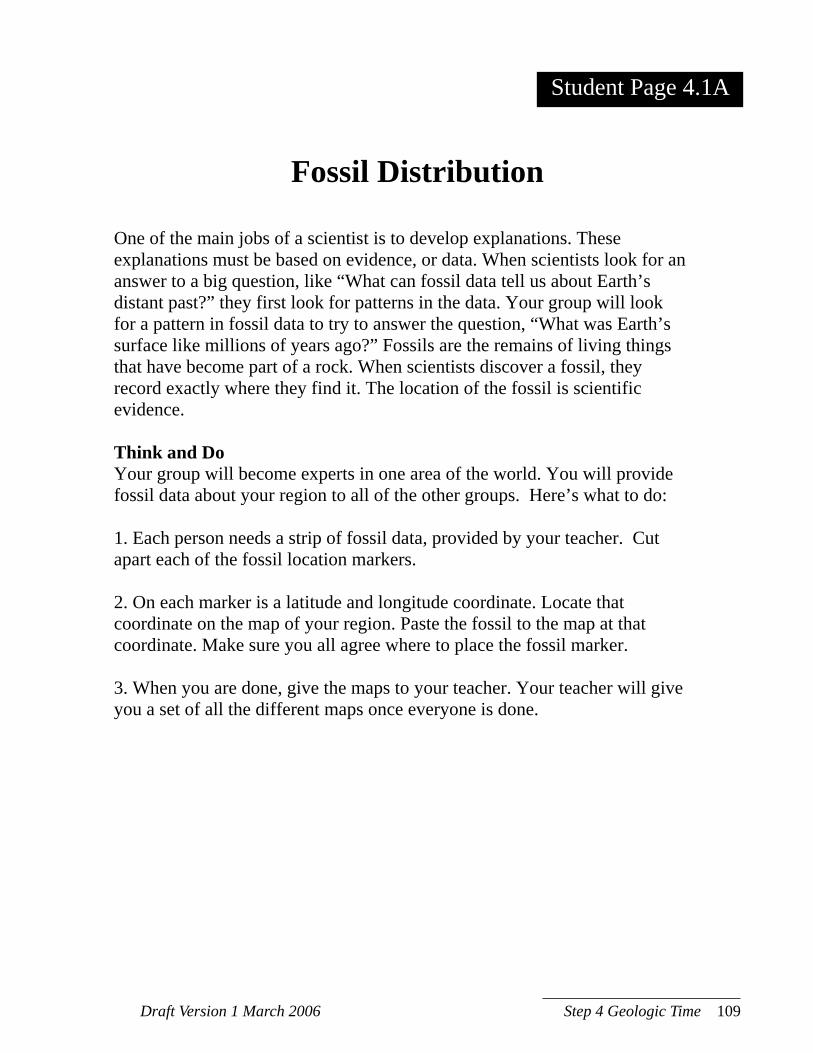
Draft Version 1 March 2006 Step 4 Geologic Time 109
STUDENT PAGE
STUDENT PAGEFossil Distribution
Student Page 4.1A
One of the main jobs of a scientist is to develop explanations. These explanations must be based on evidence, or data. When scientists look for an answer to a big question, like “What can fossil data tell us about Earth’s distant past?” they first look for patterns in the data. Your group will look for a pattern in fossil data to try to answer the question, “What was Earth’s surface like millions of years ago?” Fossils are the remains of living things that have become part of a rock. When scientists discover a fossil, they record exactly where they find it. The location of the fossil is scientific evidence.
Think and Do Your group will become experts in one area of the world. You will provide fossil data about your region to all of the other groups. Here’s what to do:
1. Each person needs a strip of fossil data, provided by your teacher. Cut apart each of the fossil location markers.
2. On each marker is a latitude and longitude coordinate. Locate that coordinate on the map of your region. Paste the fossil to the map at that coordinate. Make sure you all agree where to place the fossil marker.
3. When you are done, give the maps to your teacher. Your teacher will give you a set of all the different maps once everyone is done.

Draft Version 1 March 2006 Step 4 Geologic Time 111
Student Page 4.1A continued
Fossil Distribution(continued)
4. Study where the fossils are located in each region. What patterns do you see?
5. Work with your group to arrange the regions to fit the pattern you see. Talk with your group about what you observe. Record your observations below.
6. What idea does the fossil evidence provide about how Earth’s surface might have looked long ago? Write down or draw some of the ideas your group comes up with in the space below.
Name: ____________________________________________
Date: _____________________________________________

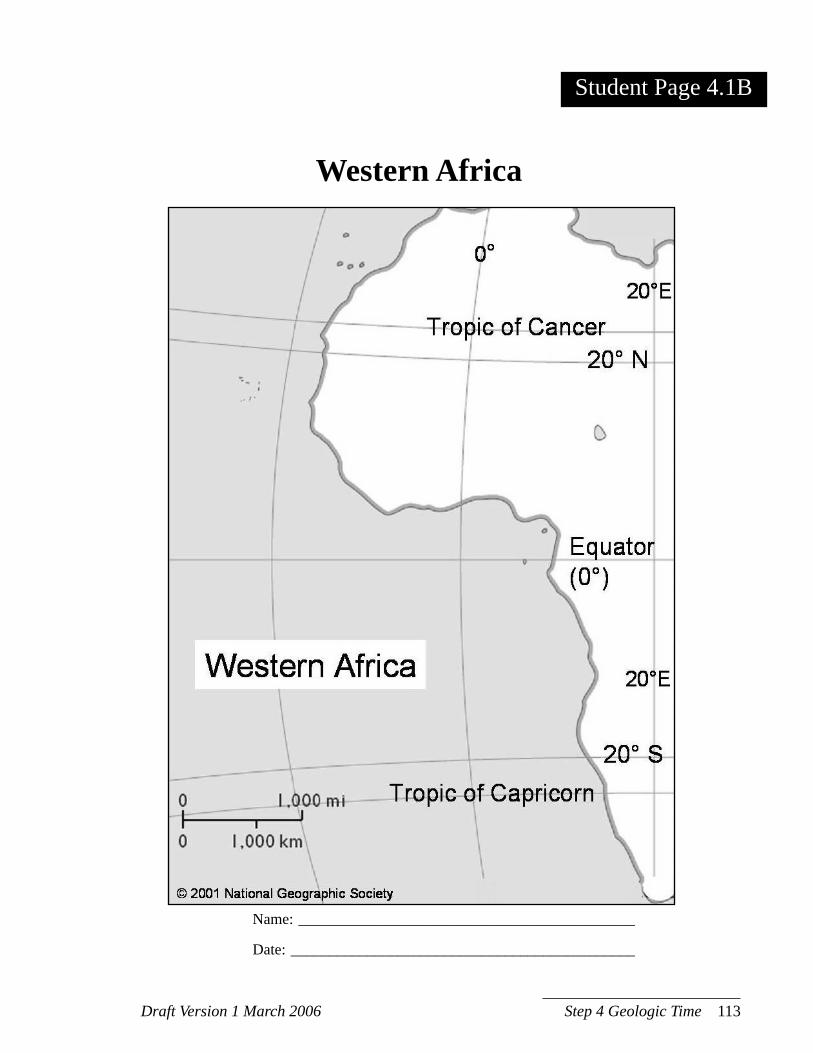
Draft Version 1 March 2006 Step 4 Geologic Time 113
Name: ____________________________________________
Date: _____________________________________________
Western Africa
Student Page 4.1B

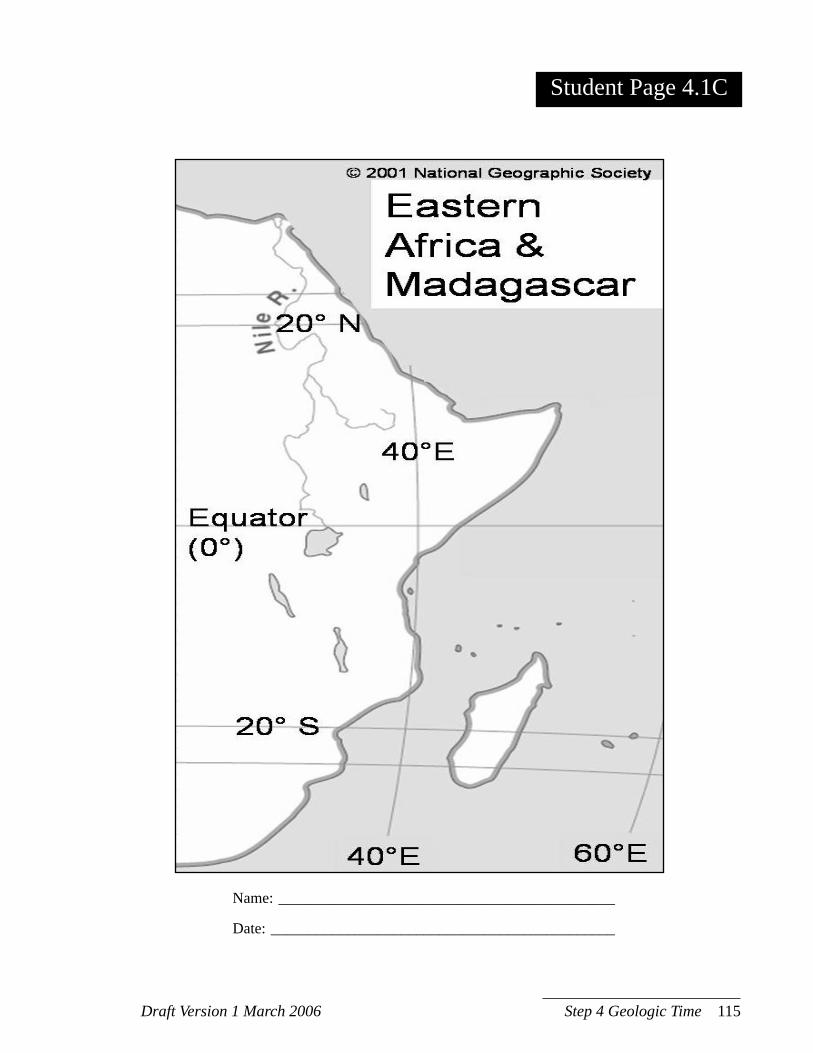
Draft Version 1 March 2006 Step 4 Geologic Time 115
Name: ____________________________________________
Date: _____________________________________________
Student Page 4.1C

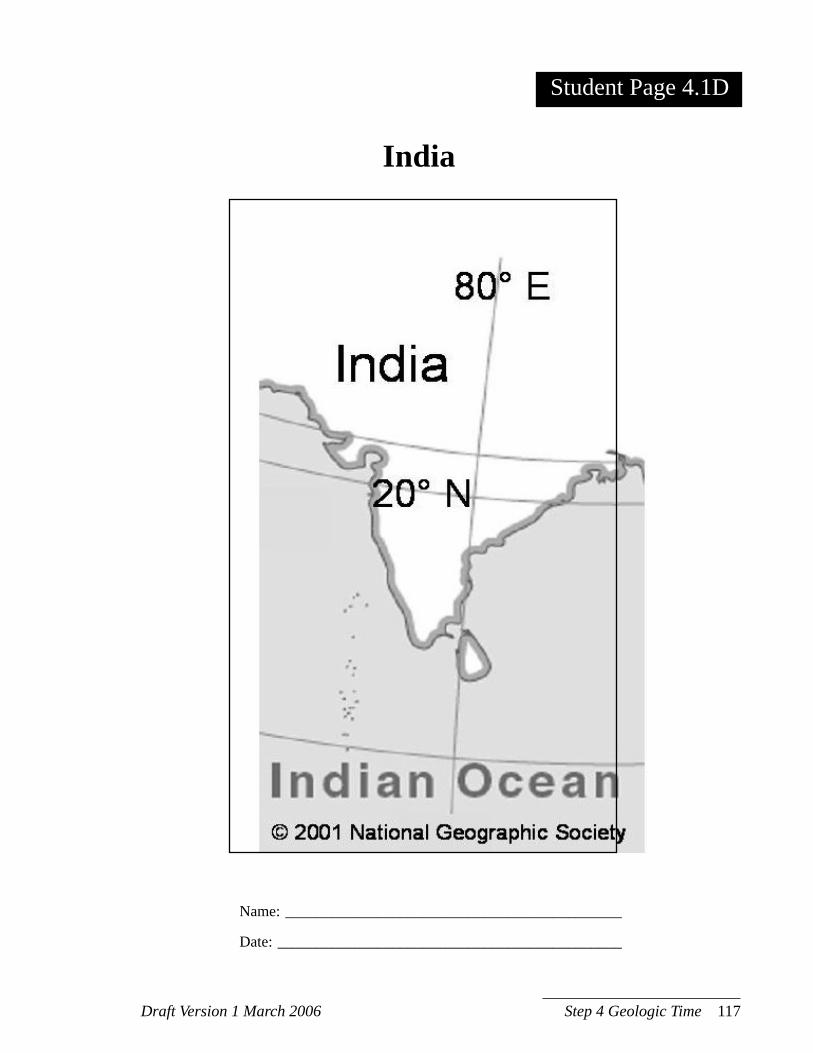
Draft Version 1 March 2006 Step 4 Geologic Time 117
Name: ____________________________________________
Date: _____________________________________________
India
Student Page 4.1D

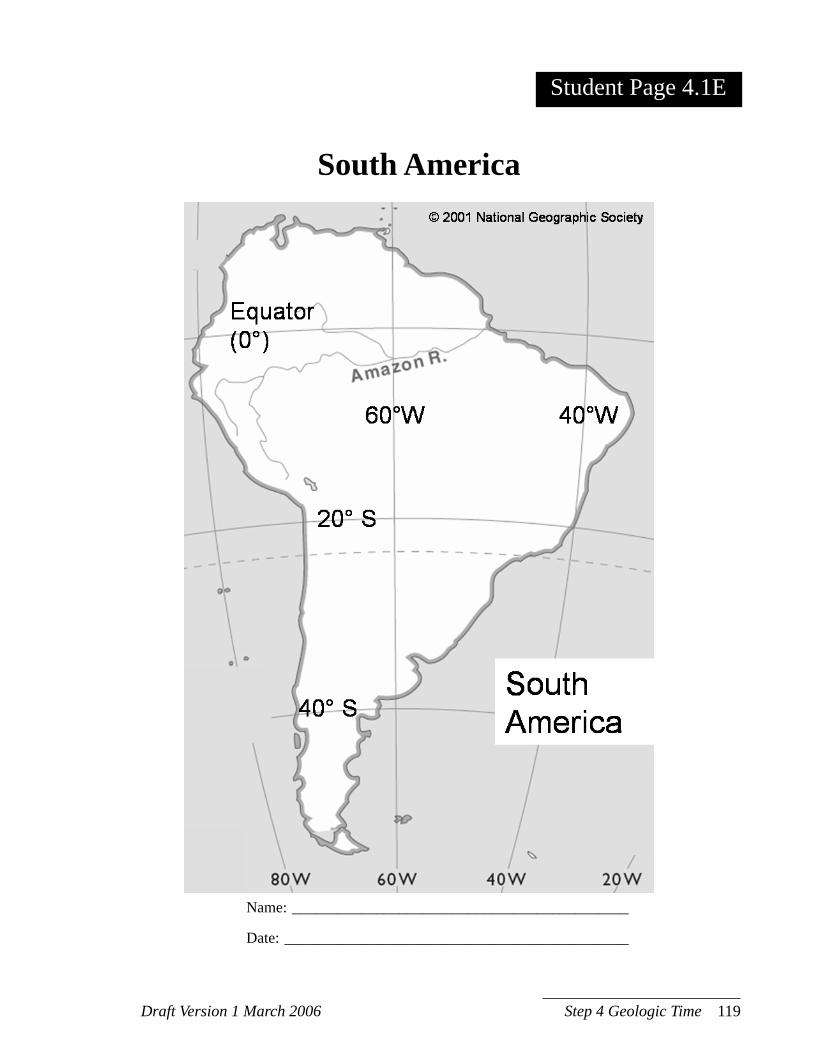
Draft Version 1 March 2006 Step 4 Geologic Time 119
South America
Name: ____________________________________________
Date: _____________________________________________
Student Page 4.1E

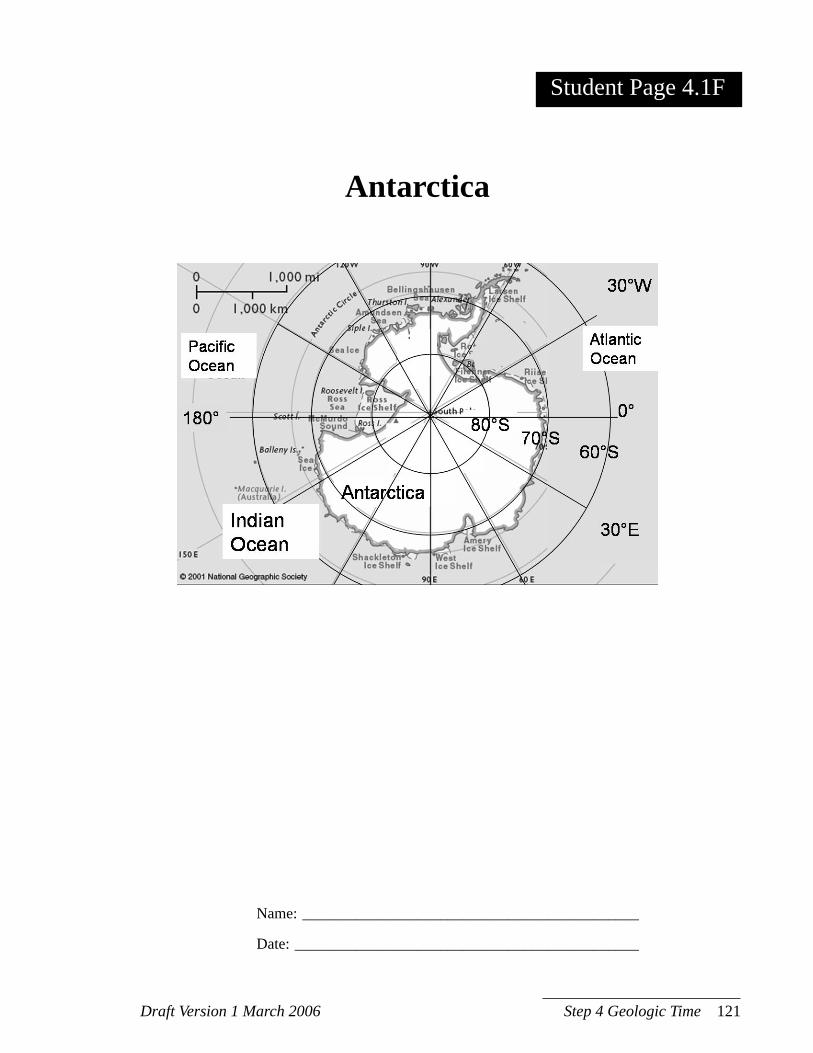
Draft Version 1 March 2006 Step 4 Geologic Time 121
Name: ____________________________________________
Date: _____________________________________________
Antarctica
STUDENT PAGEStudent Page 4.1F

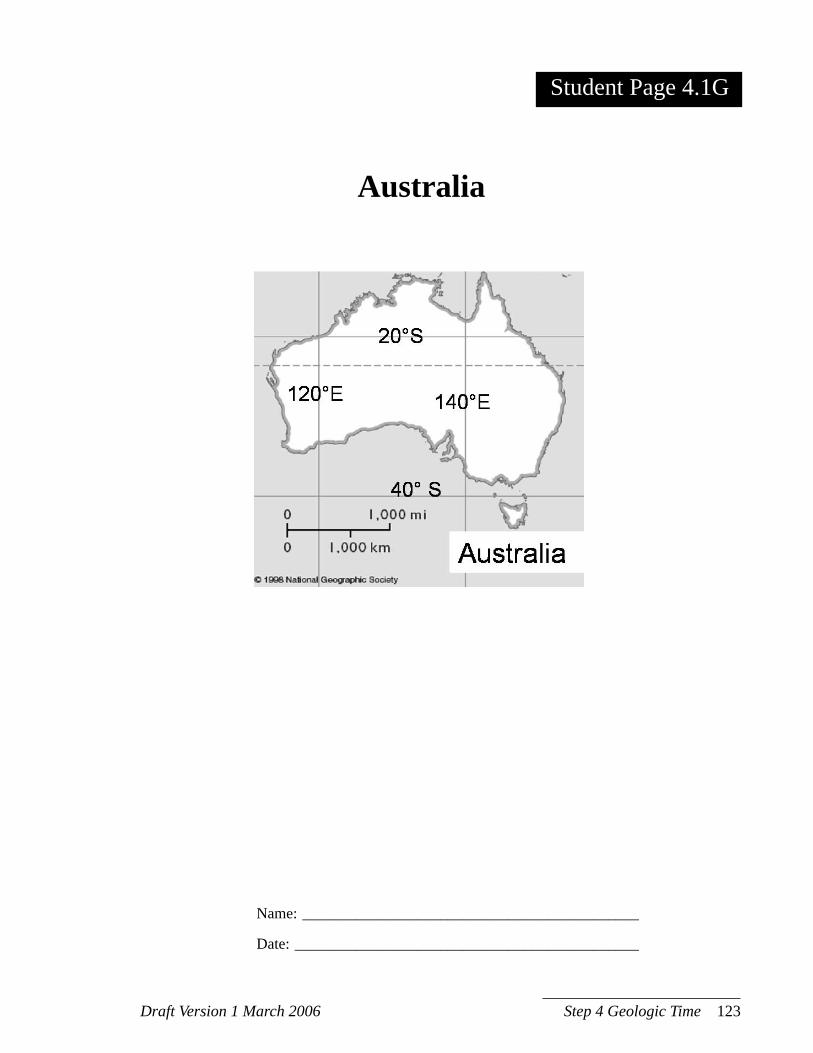
Draft Version 1 March 2006 Step 4 Geologic Time 123
Student Page 4.1G
Australia
Name: ____________________________________________
Date: _____________________________________________

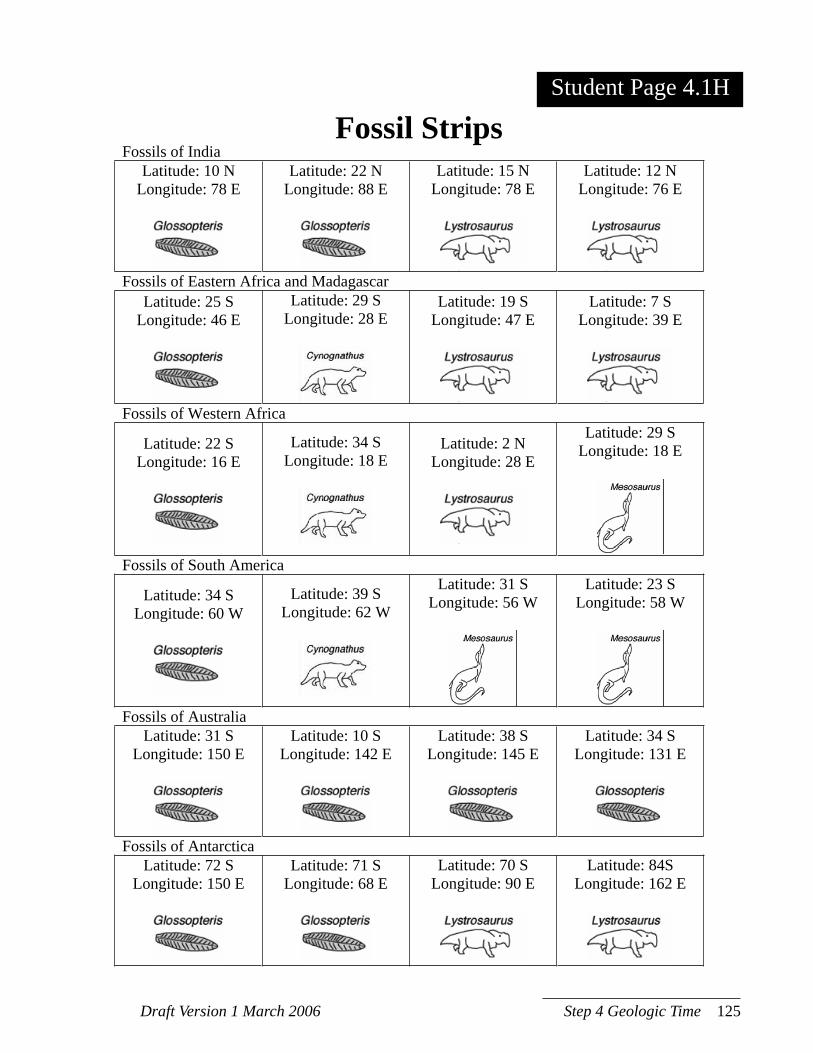
Draft Version 1 March 2006 Step 4 Geologic Time 125
Student Page 4.1H
Fossil StripsFossils of India
Latitude: 10 N Longitude: 78 E
Latitude: 22 N Longitude: 88 E
Latitude: 15 N Longitude: 78 E
Latitude: 12 N Longitude: 76 E
Fossils of Eastern Africa and Madagascar Latitude: 25 S
Longitude: 46 E Latitude: 29 S
Longitude: 28 E Latitude: 19 S
Longitude: 47 E Latitude: 7 S
Longitude: 39 E
Fossils of Western Africa
Latitude: 22 S Longitude: 16 E
Latitude: 34 S Longitude: 18 E
Latitude: 2 N Longitude: 28 E
Latitude: 29 S Longitude: 18 E
Fossils of South America
Latitude: 34 S Longitude: 60 W
Latitude: 39 S Longitude: 62 W
Latitude: 31 S Longitude: 56 W
Latitude: 23 S Longitude: 58 W
Fossils of Australia Latitude: 31 S
Longitude: 150 E Latitude: 10 S
Longitude: 142 E Latitude: 38 S
Longitude: 145 E Latitude: 34 S
Longitude: 131 E
Fossils of Antarctica Latitude: 72 S
Longitude: 150 E Latitude: 71 S
Longitude: 68 E Latitude: 70 S
Longitude: 90 E Latitude: 84S
Longitude: 162 E

Draft Version 1 March 2006 Step 4 Geologic Time 127
SHAYou saw that Earth’s surface moves suddenly during an earthquake. In a matter of minutes roads and bridges may break. The damage to property and lives can be devastating. The landscape can change quickly. Earthquakes move Earth’s surface suddenly. However, Earth’s surface also moves slowly. Fossil data shows that plants and animals used to live in places that are now widely separated. There is more evidence for this that you will uncover in the next Step of this unit.Sudden movements and slow movements have been happening on Earth’s surface for millions of years. Earth’s surface is continually changing. The continents must be moving! What did Earth’s surface look like hundreds of millions of years ago?
Think and Do
1. Carefully cut out each of the regions.
2. Place your group’s regions on a flat surface. Arrange them so they are in the same location as on the present-day world map. What do you notice about the shapes of the continents?
3. Try to fit your continent pieces together like a puzzle. Tape them together the way you think they fit best.
4. Make a quick drawing below of how you put them together.
5. If you take the fossil data and combine it with the shapes of the regions’ coastlines, do they fit together?
Student Page 4.1J
Name: ____________________________________________
Date: _____________________________________________
Shapes of the Continents

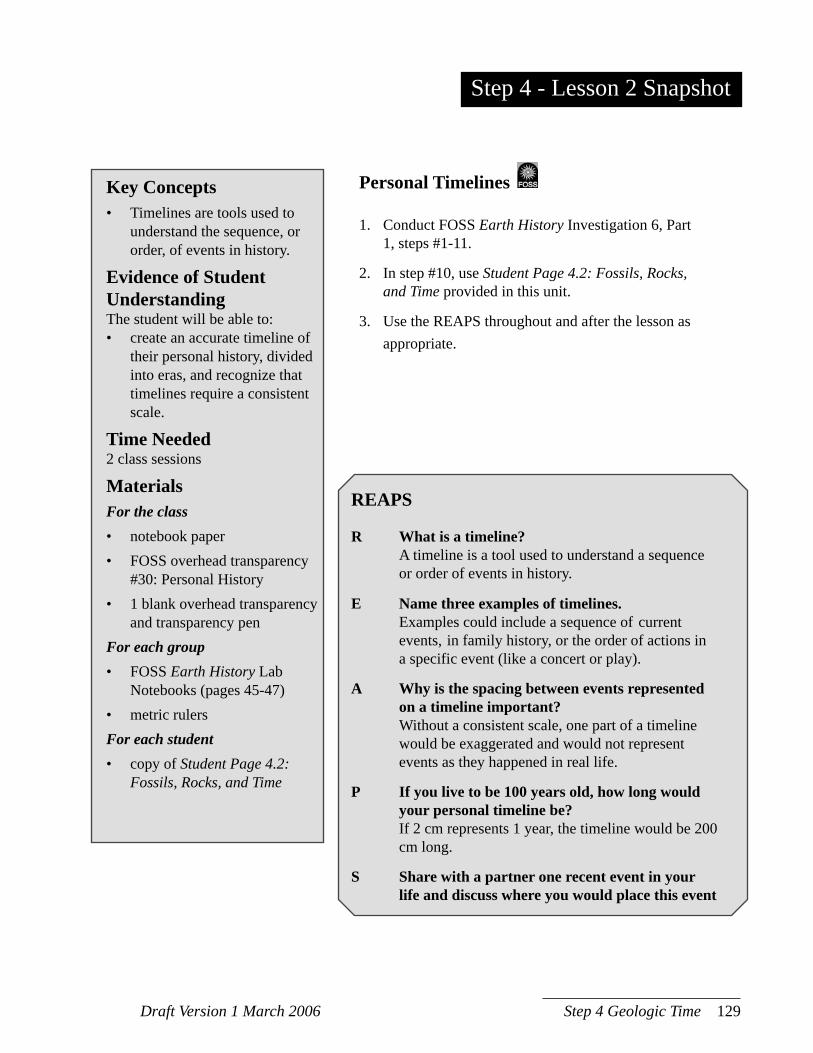
Draft Version 1 March 2006 Step 4 Geologic Time 129
Step 4 - Lesson 2 Snapshot
Key Concepts• Timelines are tools used to
understand the sequence, or order, of events in history.
Evidence of Student UnderstandingThe student will be able to:• create an accurate timeline of
their personal history, divided into eras, and recognize that timelines require a consistent scale.
Time Needed2 class sessions
MaterialsFor the class• notebook paper• FOSS overhead transparency
#30: Personal History• 1 blank overhead transparency
and transparency penFor each group• FOSS Earth History Lab
Notebooks (pages 45-47)• metric rulersFor each student• copy of Student Page 4.2:
Fossils, Rocks, and Time
Personal Timelines
1. Conduct FOSS Earth History Investigation 6, Part 1, steps #1-11.
2. In step #10, use Student Page 4.2: Fossils, Rocks, and Time provided in this unit.
3. Use the REAPS throughout and after the lesson as appropriate.
REAPS
R What is a timeline? A timeline is a tool used to understand a sequence or order of events in history.
E Name three examples of timelines. Examples could include a sequence of current events, in family history, or the order of actions in a specific event (like a concert or play).
A Why is the spacing between events represented on a timeline important? Without a consistent scale, one part of a timeline would be exaggerated and would not represent events as they happened in real life.
P If you live to be 100 years old, how long would your personal timeline be? If 2 cm represents 1 year, the timeline would be 200 cm long.
S Share with a partner one recent event in your life and discuss where you would place this event
130 Exploring Earth’s Landforms Draft Version 1 March 2006
Background InformationFor background information on geologic time, refer to the FOSS Earth History Teacher’s Guide, pages 198-204.
Implementation Guide1. Follow the instructions in the FOSS Earth
History Teacher’s Guide, pages 205-208, for this lesson (Investigation 6, Part 1), steps #1-11.
2. In step #10, use Student Page 4.2: Fossils, Rocks, and Time provided in this unit. The FOSS reading centers on the Grand Canyon while Student Page 4.2 discusses the same ideas in a context customized for this unit.
3. Use the REAPS throughout and after the lesson as appropriate.
Advance PreparationSee FOSS Earth History Teacher’s Guide page 206.
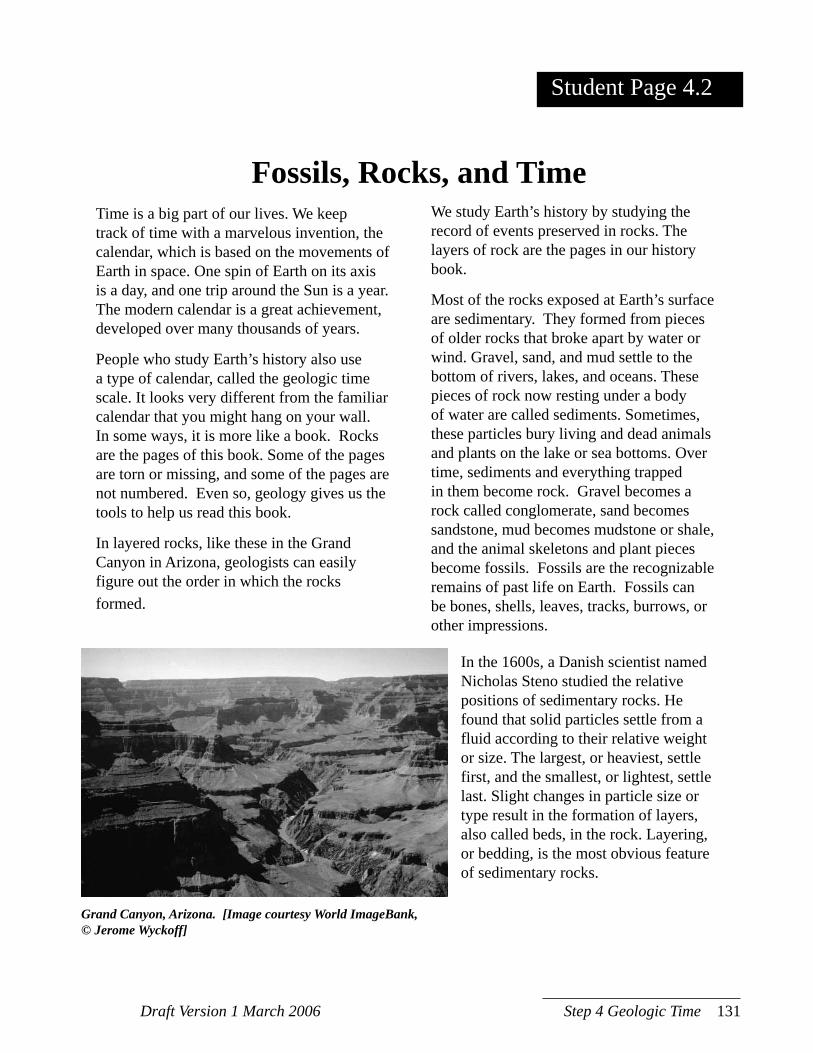
Draft Version 1 March 2006 Step 4 Geologic Time 131
Time is a big part of our lives. We keep track of time with a marvelous invention, the calendar, which is based on the movements of Earth in space. One spin of Earth on its axis is a day, and one trip around the Sun is a year. The modern calendar is a great achievement, developed over many thousands of years.
People who study Earth’s history also use a type of calendar, called the geologic time scale. It looks very different from the familiar calendar that you might hang on your wall. In some ways, it is more like a book. Rocks are the pages of this book. Some of the pages are torn or missing, and some of the pages are not numbered. Even so, geology gives us the tools to help us read this book.
In layered rocks, like these in the Grand Canyon in Arizona, geologists can easily figure out the order in which the rocks formed.
Student Page 4.2
Fossils, Rocks, and Time
Grand Canyon, Arizona. [Image courtesy World ImageBank, © Jerome Wyckoff]
We study Earth’s history by studying the record of events preserved in rocks. The layers of rock are the pages in our history book.
Most of the rocks exposed at Earth’s surface are sedimentary. They formed from pieces of older rocks that broke apart by water or wind. Gravel, sand, and mud settle to the bottom of rivers, lakes, and oceans. These pieces of rock now resting under a body of water are called sediments. Sometimes, these particles bury living and dead animals and plants on the lake or sea bottoms. Over time, sediments and everything trapped in them become rock. Gravel becomes a rock called conglomerate, sand becomes sandstone, mud becomes mudstone or shale, and the animal skeletons and plant pieces become fossils. Fossils are the recognizable remains of past life on Earth. Fossils can be bones, shells, leaves, tracks, burrows, or other impressions.
In the 1600s, a Danish scientist named Nicholas Steno studied the relative positions of sedimentary rocks. He found that solid particles settle from a fluid according to their relative weight or size. The largest, or heaviest, settle first, and the smallest, or lightest, settle last. Slight changes in particle size or type result in the formation of layers, also called beds, in the rock. Layering, or bedding, is the most obvious feature of sedimentary rocks.
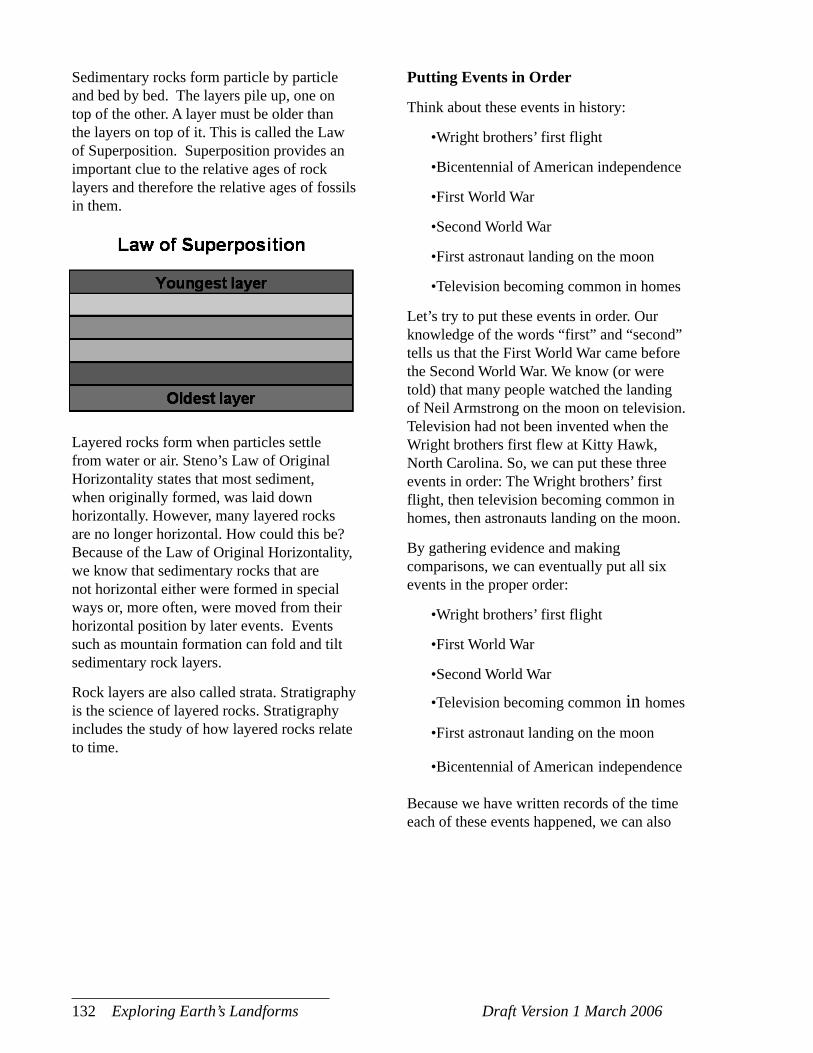
132 Exploring Earth’s Landforms Draft Version 1 March 2006
Sedimentary rocks form particle by particle and bed by bed. The layers pile up, one on top of the other. A layer must be older than the layers on top of it. This is called the Law of Superposition. Superposition provides an important clue to the relative ages of rock layers and therefore the relative ages of fossils in them.
Layered rocks form when particles settle from water or air. Steno’s Law of Original Horizontality states that most sediment, when originally formed, was laid down horizontally. However, many layered rocks are no longer horizontal. How could this be? Because of the Law of Original Horizontality, we know that sedimentary rocks that are not horizontal either were formed in special ways or, more often, were moved from their horizontal position by later events. Events such as mountain formation can fold and tilt sedimentary rock layers.
Rock layers are also called strata. Stratigraphy is the science of layered rocks. Stratigraphy includes the study of how layered rocks relate to time.
Putting Events in Order
Think about these events in history:
•Wright brothers’ first flight
•Bicentennial of American independence
•First World War
•Second World War
•First astronaut landing on the moon
•Television becoming common in homes
Let’s try to put these events in order. Our knowledge of the words “first” and “second” tells us that the First World War came before the Second World War. We know (or were told) that many people watched the landing of Neil Armstrong on the moon on television. Television had not been invented when the Wright brothers first flew at Kitty Hawk, North Carolina. So, we can put these three events in order: The Wright brothers’ first flight, then television becoming common in homes, then astronauts landing on the moon.
By gathering evidence and making comparisons, we can eventually put all six events in the proper order:
•Wright brothers’ first flight
•First World War
•Second World War
•Television becoming common in homes
•First astronaut landing on the moon
•Bicentennial of American independence
Because we have written records of the time each of these events happened, we can also
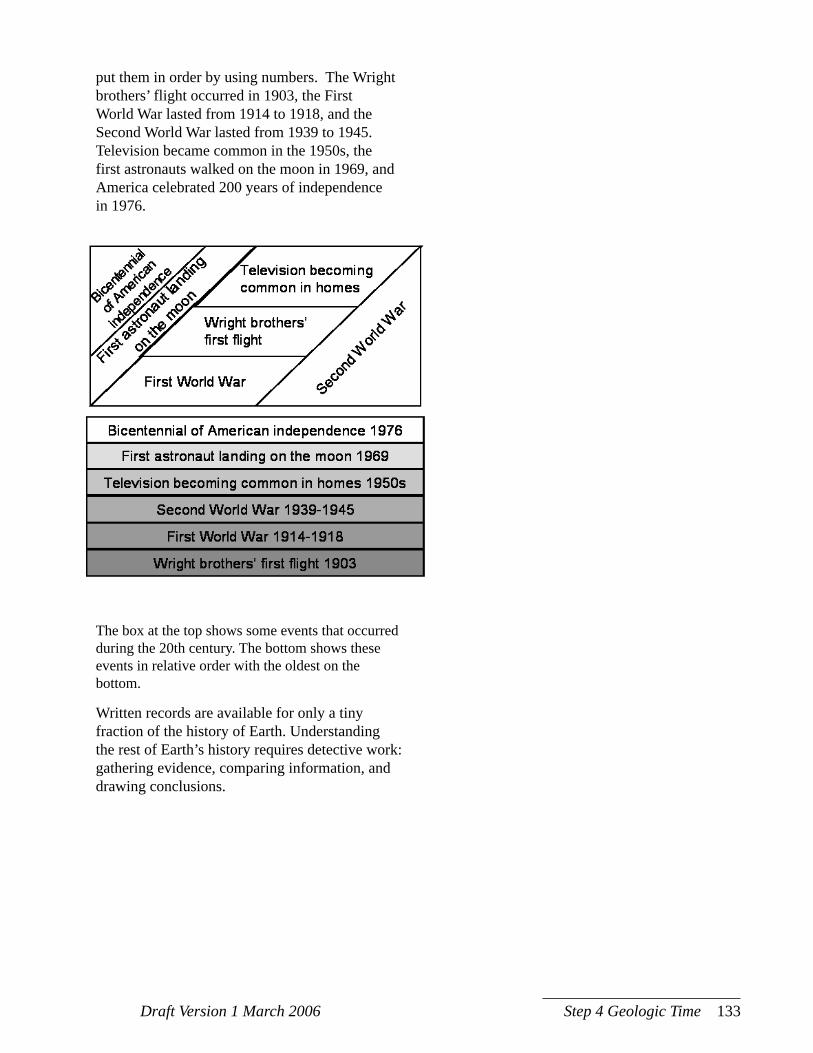
Draft Version 1 March 2006 Step 4 Geologic Time 133
put them in order by using numbers. The Wright brothers’ flight occurred in 1903, the First World War lasted from 1914 to 1918, and the Second World War lasted from 1939 to 1945. Television became common in the 1950s, the first astronauts walked on the moon in 1969, and America celebrated 200 years of independence in 1976.
The box at the top shows some events that occurred during the 20th century. The bottom shows these events in relative order with the oldest on the bottom.
Written records are available for only a tiny fraction of the history of Earth. Understanding the rest of Earth’s history requires detective work: gathering evidence, comparing information, and drawing conclusions.

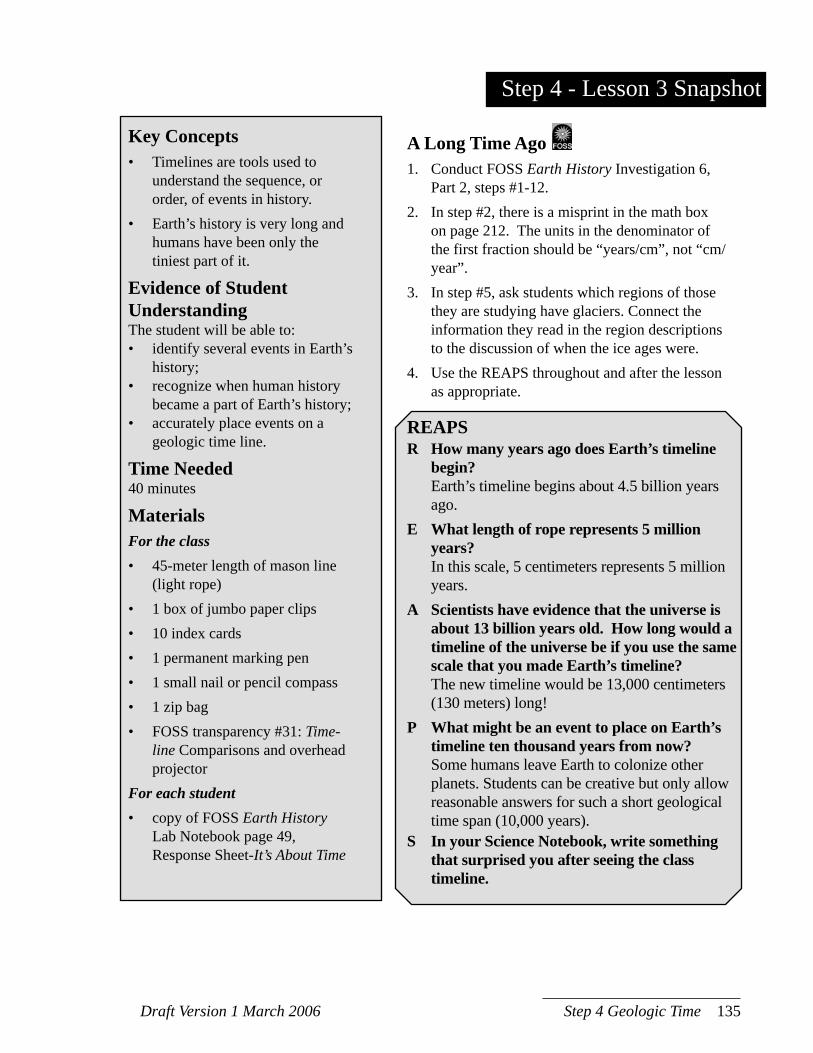
Draft Version 1 March 2006 Step 4 Geologic Time 135
Step 4 - Lesson 3 Snapshot
Key Concepts• Timelines are tools used to
understand the sequence, or order, of events in history.
• Earth’s history is very long and humans have been only the tiniest part of it.
Evidence of Student UnderstandingThe student will be able to:• identify several events in Earth’s
history;• recognize when human history
became a part of Earth’s history;• accurately place events on a
geologic time line.
Time Needed40 minutes
MaterialsFor the class• 45-meter length of mason line
(light rope)• 1 box of jumbo paper clips• 10 index cards• 1 permanent marking pen• 1 small nail or pencil compass• 1 zip bag• FOSS transparency #31: Time-
line Comparisons and overhead projector
For each student• copy of FOSS Earth History
Lab Notebook page 49, Response Sheet-It’s About Time
A Long Time Ago1. Conduct FOSS Earth History Investigation 6,
Part 2, steps #1-12.2. In step #2, there is a misprint in the math box
on page 212. The units in the denominator of the first fraction should be “years/cm”, not “cm/year”.
3. In step #5, ask students which regions of those they are studying have glaciers. Connect the information they read in the region descriptions to the discussion of when the ice ages were.
4. Use the REAPS throughout and after the lesson as appropriate.
REAPSR How many years ago does Earth’s timeline
begin? Earth’s timeline begins about 4.5 billion years
ago.E What length of rope represents 5 million
years? In this scale, 5 centimeters represents 5 million
years.A Scientists have evidence that the universe is
about 13 billion years old. How long would a timeline of the universe be if you use the same scale that you made Earth’s timeline?
The new timeline would be 13,000 centimeters (130 meters) long!
P What might be an event to place on Earth’s timeline ten thousand years from now?
Some humans leave Earth to colonize other planets. Students can be creative but only allow reasonable answers for such a short geological time span (10,000 years).
S In your Science Notebook, write something that surprised you after seeing the class timeline.
136 Exploring Earth’s Landforms Draft Version 1 March 2006
Background InformationFor background information on geologic time, refer to the FOSS Earth History Teacher’s Guide, pages 198-204.
Implementation Guide1. Follow the instructions in the FOSS Earth
History Teacher’s Guide, pages 209-214, for this lesson (Investigation 6, Part 2), steps #1-12.
2. In step #2, there is a misprint in the math box on page 212. The units in the denominator of the first fraction should be “years/cm”, not “cm/year”.
3. In step #5, ask students which regions of those they are studying have glaciers. What is their evidence? Connect the information they read in the region descriptions to the discussion of when the ice ages were.
4. Use the REAPS throughout and after the lesson as appropriate.
Advance PreparationSee FOSS Earth History Teacher’s Guide pages 210-211.
Draft Version 1 March 2006 Step 4 Geologic Time 137
Step 4 - Lesson 4 Snapshot
Key Concepts• Timelines are tools used to understand the
sequence, or order, of events in history.• The geologic time scale is an arbitrary
arrangement of geological events, most often presented as a chart.
Evidence of Student UnderstandingThe student will be able to:• construct a scaled-down geologic timeline;• divide the timeline into geologic periods
based on Earth’s history.
Time Needed40 minutes
MaterialsFor the class• 1 flat box or bag• paper clips• scissors• 15 index cards• 1 4.5 m strip of adding-machine tape• masking tape• class timeline• FOSS transparencies #32 and #33 and
overhead projectorFor each group of 2• 2 meter tapes or meter sticks• 2 4.5 m strips of adding-machine tape• 2 pens and pencils• 2 calculators (optional)For each student• copies of Student Page 4.4A: Fossils,
Rocks, and Time: The Relative Time Scale and Student Page 4.4B: The Geologic Time Scale
• FOSS Earth History Lab Notebooks, page 51, Earth History Timeline
Adding-Machine-Tape Timelines1. Conduct FOSS Earth History Investigation 6,
Part 3, steps #1-9.2. In part #9, use Student Page 4.4A: Fossils,
Rocks, and Time: The Relative Time Scale and Student Page 4.4B: The Geologic Time Scale from this unit.
3. Use the REAPS throughout and after the lesson as appropriate.
REAPSR On the adding-machine tape timelines, what
length represents 1 million years? One millimeter. E How long would your personal timeline be if 1
millimeter represented 1 year? Answers will vary with students’ age. Most will
be around 12 mm.A What makes scientists break down Earth’s
timeline into periods and smaller time spans? Accept all well-reasoned answers. Example: In one part of the world, many events may only have happened in a specific period, not throughout Earth’s history.
P During what period(s) do you think the landforms in your group’s region of the world first developed?
Example: I think the Himalayas formed during the quaternary period because I’ve heard scientists say they are “young” mountains. Accept answers based on sound evidence. If the answer is wrong, students will learn the correct answers to this question in the next lesson.
S In your Science Notebook, write down which part of Earth’s timeline you were most familiar with and why.
138 Exploring Earth’s Landforms Draft Version 1 March 2006
Background InformationFor background information on geologic time, refer to the FOSS Earth History Teacher’s Guide, pages 198-204.
Implementation Guide1. Follow the instructions in the FOSS Earth
History Teacher’s Guide, pages 215-219, for this lesson (Investigation 6, Part 3), steps #1-9.
2. In step #9, use Student Page 4.4A: Fossils, Rocks, and Time and Student Page 4.4B The Geologic Time Scale from this unit. Note the relative time scale in Student Page 4.4B is compiled from the USGS and several other sources and includes the names, name origins, and commonly-used Precambrian eon names. Relative time scale charts like this vary slightly from one to the next, but this chart includes most of the information you would ever see on any of them.
3. Use the REAPS throughout and after the lesson as appropriate
Advance PreparationSee FOSS Earth History Teacher’s Guide page 216.
Draft Version 1 March 2006 Step 4 Geologic Time 139
Fossils, Rocks, and Time: The Relative Time Scale
Student Page 4.4A
Earth is old. Scientists do not measure the time of Earth’s history in units like hours, days, and months. Even centuries and millennia are useless when considering the age of Earth. When we talk about Earth’s history, time is measured in millions and billions of years.
In order to divide geologic time into manageable chunks, the geologic time scale was devised. This time scale described how old something was or when something happened long ago. However, there was a problem. No one knew how old really old things (like rocks) were. They only knew that one rock was older than another rock because it was in a lower stratum, or layer. For this reason, a relative time scale was developed long before a time scale with years was attached.
European scientists were responsible for the development of most of the time scale. Alexandre Brongniart first published his Tableau des terrains qui composent l’écourse du globe (Table of rock units that form Earth’s crust) in 1829. He proposed to divide geologic time into two periods: an early period when continents were mostly covered by water, and a more recent period when the continents began to appear as they do today.
During the 19th century, geologists continued to work on this geologic time scale as more evidence accumulated. They started to see patterns in the kinds of fossils in different rock layers. Certain kinds of shells were in some layers, particular fish
in other layers, and plants in yet others. And, oh yes, dinosaur fossils were found in some rocks, too. They realized that shell fossils were always found in layers older (lower) than the layers with plant fossils, and dinosaur fossils never showed up in layers that did not have plant fossils in older (lower) layers. A picture of the sequence of life and rock formation was taking shape. By the beginning of the 20th century a good geologic time scale, based on fossils, was available. See the figure for how the time scale is organized.
Earth’s history is first divided into eons. These are the largest divisions of geologic time. Eons are divided into eras, which are shorter periods of time. Eras are divided into periods. Finally, periods are divided into epochs -- the shortest spans of time.
The names for these divisions of time are mostly taken from Greek words. For example, -zoic means life; and paleo- means old, meso- means middle, and ceno- means recent, or young. So the relative order of the three youngest eras is paleozoic, mesozoic, and cenozoic – the eras when animal life existed on Earth. Some of the names are taken from places where particular fossils or rocks were found, mostly in Europe, Asia, and North America. This table shows the relative geologic time scale and names. The youngest time (present-day) is at the top and the oldest time is at the bottom. Scientists divide geologic time to make it easier to study events in different parts of the world and to organize the evidence they have for those events.

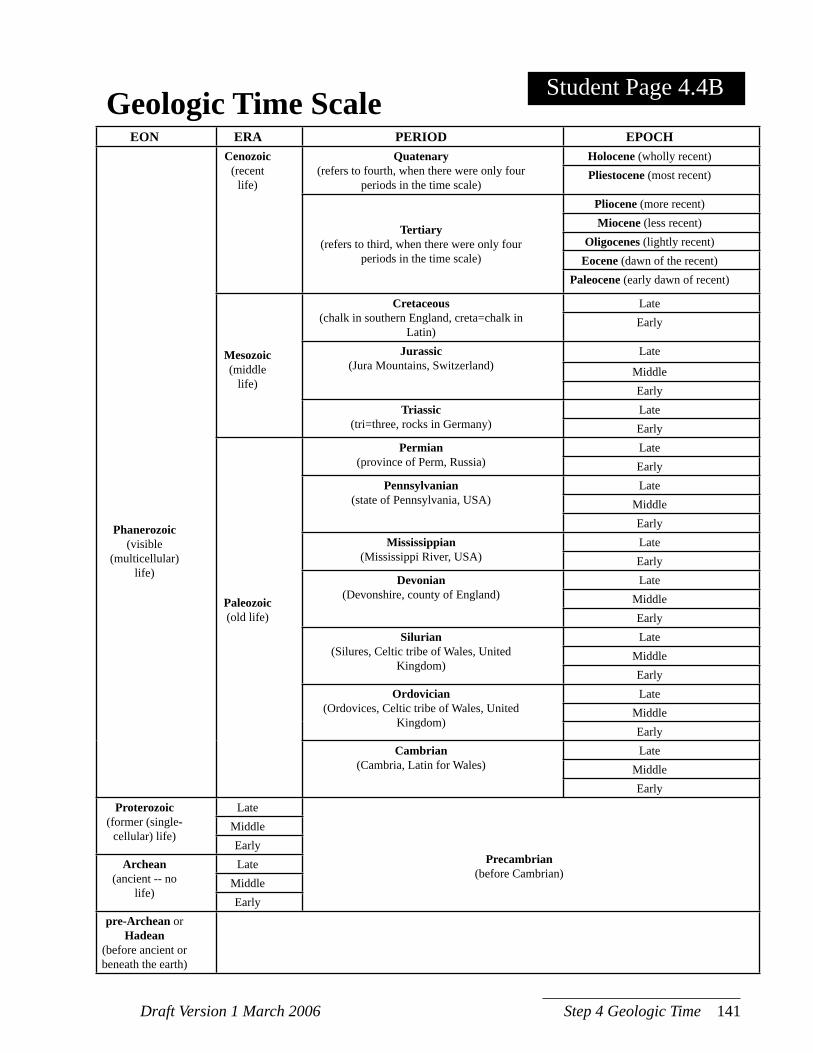
Draft Version 1 March 2006 Step 4 Geologic Time 141
Student Page 4.4BGeologic Time ScaleEON ERA PERIOD EPOCH
Phanerozoic (visible
(multicellular) life)
Cenozoic (recent
life)
Quatenary (refers to fourth, when there were only four
periods in the time scale)
Holocene (wholly recent)Pliestocene (most recent)
Tertiary(refers to third, when there were only four
periods in the time scale)
Pliocene (more recent)Miocene (less recent)
Oligocenes (lightly recent)Eocene (dawn of the recent)
Paleocene (early dawn of recent)
Mesozoic(middle
life)
Cretaceous(chalk in southern England, creta=chalk in
Latin)
LateEarly
Jurassic(Jura Mountains, Switzerland)
Late
MiddleEarly
Triassic(tri=three, rocks in Germany)
LateEarly
Paleozoic(old life)
Permian(province of Perm, Russia)
LateEarly
Pennsylvanian(state of Pennsylvania, USA)
LateMiddleEarly
Mississippian(Mississippi River, USA)
LateEarly
Devonian(Devonshire, county of England)
LateMiddleEarly
Silurian(Silures, Celtic tribe of Wales, United
Kingdom)
LateMiddleEarly
Ordovician(Ordovices, Celtic tribe of Wales, United
Kingdom)
LateMiddleEarly
Cambrian(Cambria, Latin for Wales)
LateMiddleEarly
Proterozoic(former (single-
cellular) life)
Late
Precambrian(before Cambrian)
MiddleEarly
Archean(ancient -- no
life)
LateMiddleEarly
pre-Archean or Hadean
(before ancient or beneath the earth)

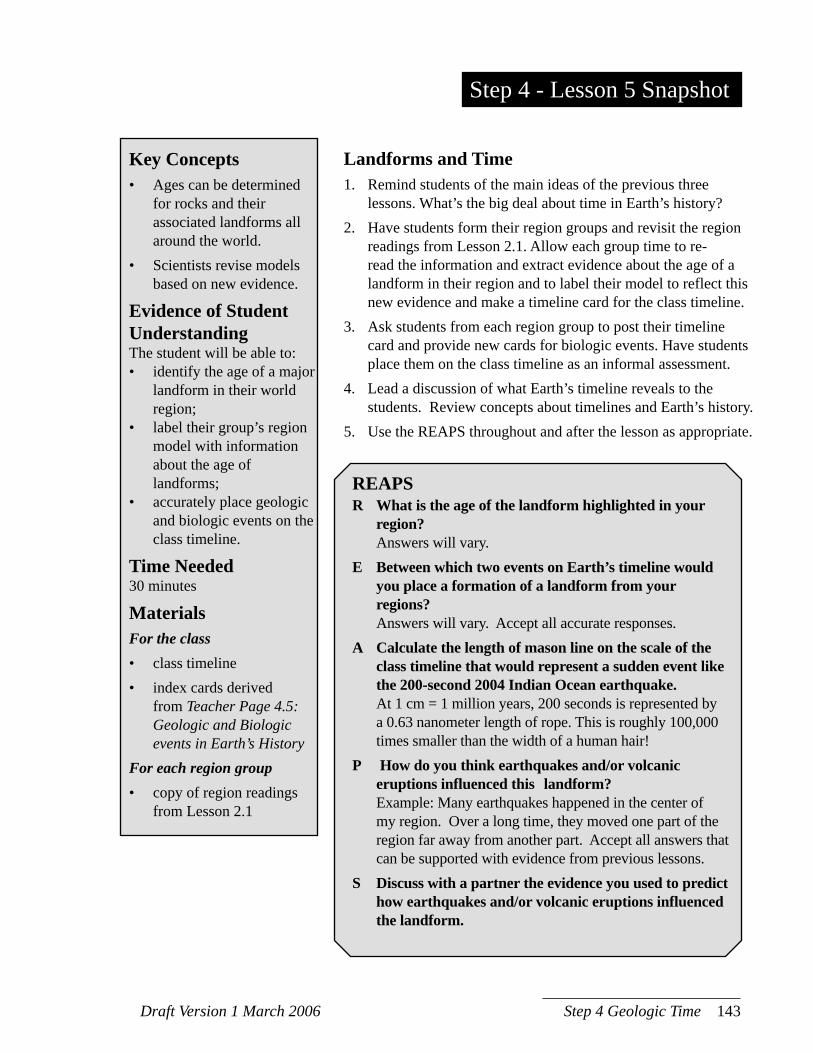
Draft Version 1 March 2006 Step 4 Geologic Time 143
Step 4 - Lesson 5 Snapshot
Key Concepts• Ages can be determined
for rocks and their associated landforms all around the world.
• Scientists revise models based on new evidence.
Evidence of Student UnderstandingThe student will be able to:• identify the age of a major
landform in their world region;
• label their group’s region model with information about the age of landforms;
• accurately place geologic and biologic events on the class timeline.
Time Needed30 minutes
MaterialsFor the class• class timeline• index cards derived
from Teacher Page 4.5: Geologic and Biologic events in Earth’s History
For each region group• copy of region readings
from Lesson 2.1
Landforms and Time1. Remind students of the main ideas of the previous three
lessons. What’s the big deal about time in Earth’s history?2. Have students form their region groups and revisit the region
readings from Lesson 2.1. Allow each group time to re-read the information and extract evidence about the age of a landform in their region and to label their model to reflect this new evidence and make a timeline card for the class timeline.
3. Ask students from each region group to post their timeline card and provide new cards for biologic events. Have students place them on the class timeline as an informal assessment.
4. Lead a discussion of what Earth’s timeline reveals to the students. Review concepts about timelines and Earth’s history.
5. Use the REAPS throughout and after the lesson as appropriate.
REAPSR What is the age of the landform highlighted in your
region? Answers will vary.E Between which two events on Earth’s timeline would
you place a formation of a landform from your regions?
Answers will vary. Accept all accurate responses.A Calculate the length of mason line on the scale of the
class timeline that would represent a sudden event like the 200-second 2004 Indian Ocean earthquake.
At 1 cm = 1 million years, 200 seconds is represented by a 0.63 nanometer length of rope. This is roughly 100,000 times smaller than the width of a human hair!
P How do you think earthquakes and/or volcanic eruptions influenced this landform?
Example: Many earthquakes happened in the center of my region. Over a long time, they moved one part of the region far away from another part. Accept all answers that can be supported with evidence from previous lessons.
S Discuss with a partner the evidence you used to predict how earthquakes and/or volcanic eruptions influenced the landform.
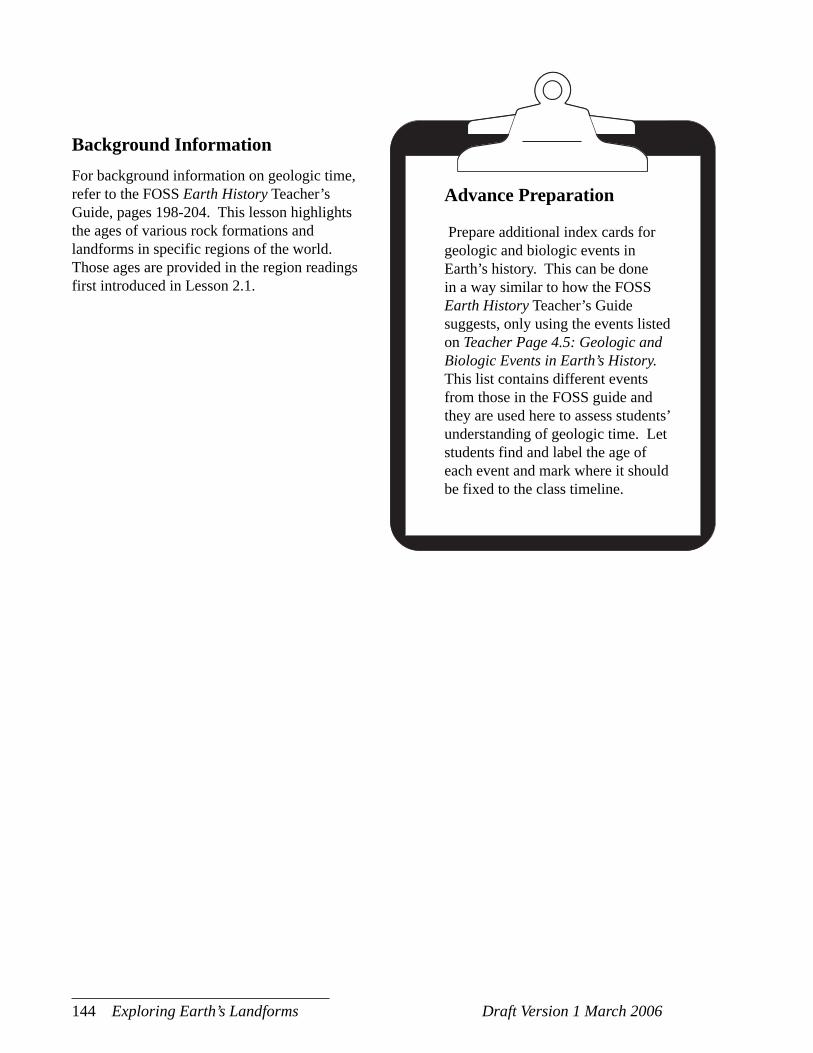
144 Exploring Earth’s Landforms Draft Version 1 March 2006
Advance Preparation
Prepare additional index cards for geologic and biologic events in Earth’s history. This can be done in a way similar to how the FOSS Earth History Teacher’s Guide suggests, only using the events listed on Teacher Page 4.5: Geologic and Biologic Events in Earth’s History. This list contains different events from those in the FOSS guide and they are used here to assess students’ understanding of geologic time. Let students find and label the age of each event and mark where it should be fixed to the class timeline.
Background InformationFor background information on geologic time, refer to the FOSS Earth History Teacher’s Guide, pages 198-204. This lesson highlights the ages of various rock formations and landforms in specific regions of the world. Those ages are provided in the region readings first introduced in Lesson 2.1.
Draft Version 1 March 2006 Step 4 Geologic Time 145
Implementation Guide
1. To support student understanding of this step’s main concepts, ask students to think about the main ideas they have learned over the past three lessons. What’s the big deal about time when we talk about Earth’s history? Remind students of the role that the mason line played in illustrating just how long Earth’s history is, and how relatively short human history has been.
2. Allow students to gather again in their region groups and revisit the region readings in Lesson 2.1. Each reading contains some information about the age of a certain type of rock or landform highlighted in the region. Ask each group to re-read the article and extract evidence about the age of a landform in the region. Provide index cards, perhaps of different colors for each region, like the ones you used in posting events in Earth’s history in Lesson 4.3. Allow students to make a card in their region groups (one for each group) to identify the age of a landform. Have students place the landform on the timeline.
At this point, students can also label their scientific models to reflect this new evidence. This would be a good breakpoint if the class period is coming to an end. You will want to be sure to save time for discussing the completed class timeline so students can take it all in as a
whole, before you have to take it down for another class.
3. Ask one student from each region group to post their timeline card on the class timeline. Provide extra paper clips or clothespins and make sure students are able to post the events accurately. Use this as in informal assessment of student understanding of geologic time and timelines. At the same time, you may distribute new geologic and biologic events, from Teacher Page 4.5: Geologic and Biologic Events in Earth’s History, that were not posted before. Ask students to look up the age for these events on Student Page 4.5: Geologic and Biologic Events in Earth’s History and mark the age and placement (in cm) for these events before posting them on the timeline.
4. Once all of the new events are on the class timeline, lead a discussion of what Earth’s timeline reveals to the students. Emphasize how human history is such a small part of the whole timeline and ask questions to probe student understanding of this idea. Review the main concepts about timelines and Earth’s history that students should know before finishing this step.
5. Use the REAPS throughout and after the lesson as appropriate.

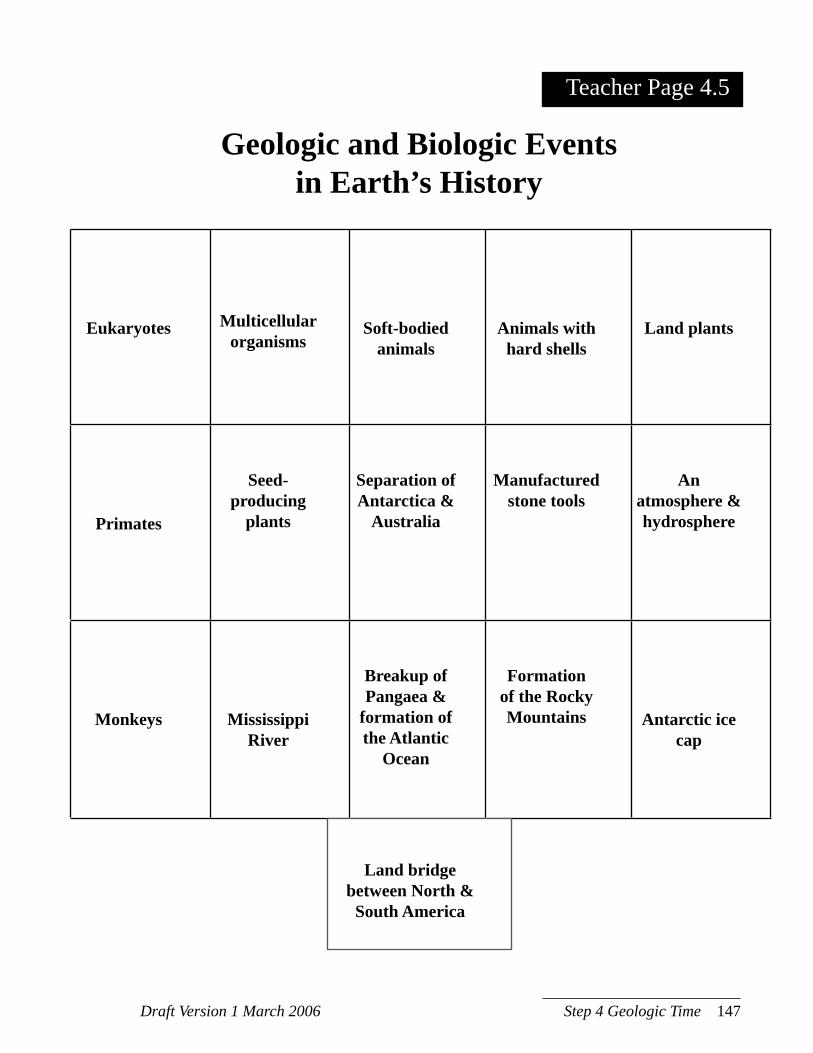
Draft Version 1 March 2006 Step 4 Geologic Time 147
Teacher Page 4.5
Eukaryotes Multicellularorganisms
Soft-bodied animals
Animals with hard shells
Land plants
Primates
Seed-producing
plants
Separation of Antarctica &
Australia
Manufactured stone tools
An atmosphere & hydrosphere
Monkeys Mississippi River
Breakup of Pangaea &
formation of the Atlantic
Ocean
Formation of the Rocky Mountains Antarctic ice
cap
Land bridge between North &
South America
Geologic and Biologic Events in Earth’s History

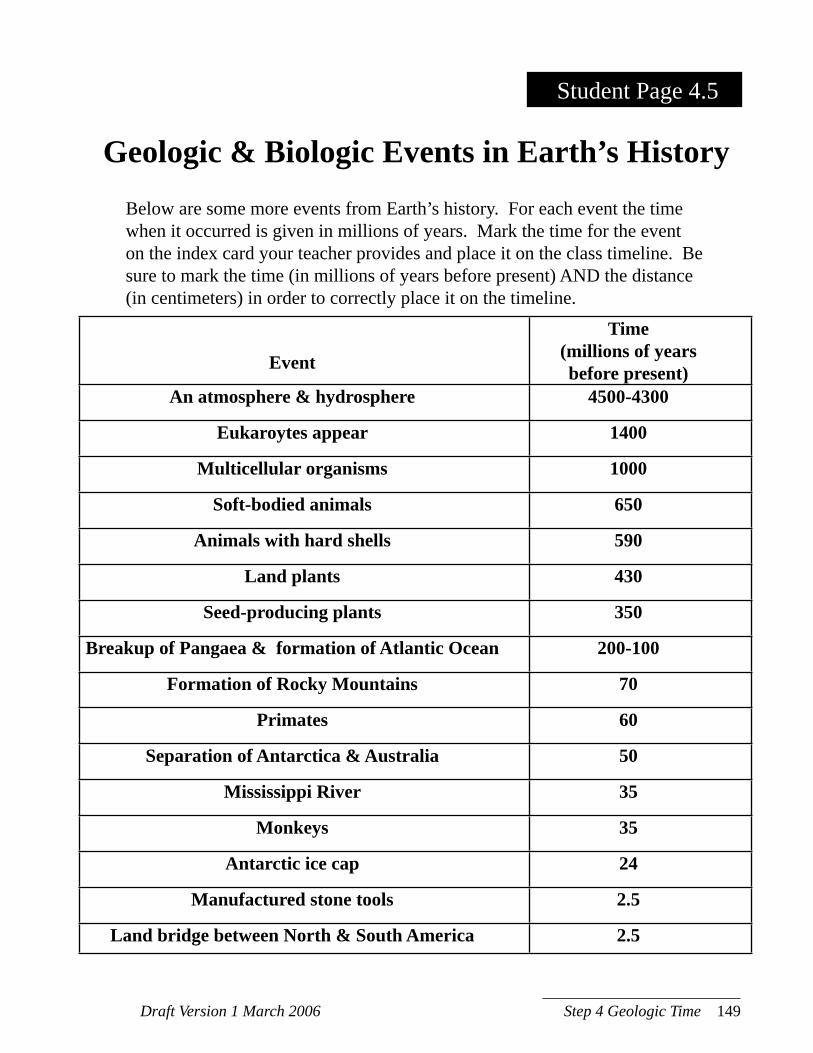
Draft Version 1 March 2006 Step 4 Geologic Time 149
Student Page 4.5
Geologic & Biologic Events in Earth’s HistoryBelow are some more events from Earth’s history. For each event the time when it occurred is given in millions of years. Mark the time for the event on the index card your teacher provides and place it on the class timeline. Be sure to mark the time (in millions of years before present) AND the distance (in centimeters) in order to correctly place it on the timeline.
Event
Time (millions of years before present)
An atmosphere & hydrosphere 4500-4300
Eukaroytes appear 1400
Multicellular organisms 1000
Soft-bodied animals 650
Animals with hard shells 590
Land plants 430
Seed-producing plants 350
Breakup of Pangaea & formation of Atlantic Ocean 200-100
Formation of Rocky Mountains 70
Primates 60
Separation of Antarctica & Australia 50
Mississippi River 35
Monkeys 35
Antarctic ice cap 24
Manufactured stone tools 2.5
Land bridge between North & South America 2.5

S T E P
5
Overview: Slow Movements
If Earth’s surface can move (as during earthquakes and volcanic eruptions), how might it have looked in the past? In Step 5, this intriguing question extends what students have learned in previous steps and introduces them to a geologic time scale. This step presents two lines of evidence that scientists have used to understand Earth’s history: the fit of continents and the distribution of fossils. This step also provides a bridge between present-day observations and the history of how the ideas of plate tectonics developed.
Students build relative and absolute timelines of events that happened during Earth’s long history. After looking at some of the major events in Earth’s history, students look at geologic events that happened in their regions and again improve the scientific model explaining their region’s landforms.
Lesson 5.1Tracking Slow Movements (45 min)
Lesson 5.2Discovering Plates (60 min)
Lesson 5.3Revising Region Models (30 min)

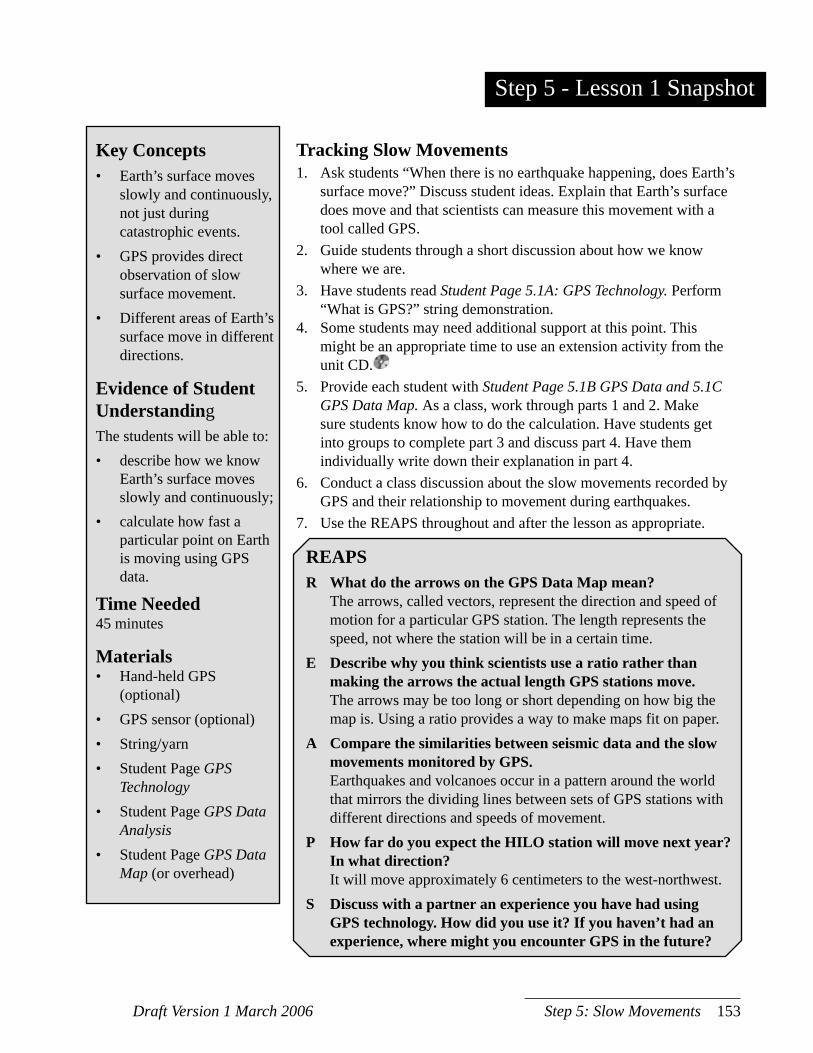
Draft Version 1 March 2006 Step 5: Slow Movements 153
Step 5 - Lesson 1 Snapshot
Key Concepts• Earth’s surface moves
slowly and continuously, not just during catastrophic events.
• GPS provides direct observation of slow surface movement.
• Different areas of Earth’s surface move in different directions.
Evidence of Student UnderstandingThe students will be able to:• describe how we know
Earth’s surface moves slowly and continuously;
• calculate how fast a particular point on Earth
is moving using GPS data.
Time Needed45 minutes
Materials• Hand-held GPS
(optional)• GPS sensor (optional)• String/yarn• Student Page GPS
Technology• Student Page GPS Data
Analysis• Student Page GPS Data
Map (or overhead)
Tracking Slow Movements1. Ask students “When there is no earthquake happening, does Earth’s
surface move?” Discuss student ideas. Explain that Earth’s surface does move and that scientists can measure this movement with a tool called GPS.
2. Guide students through a short discussion about how we know where we are.
3. Have students read Student Page 5.1A: GPS Technology. Perform “What is GPS?” string demonstration.
4. Some students may need additional support at this point. This might be an appropriate time to use an extension activity from the unit CD.
5. Provide each student with Student Page 5.1B GPS Data and 5.1C GPS Data Map. As a class, work through parts 1 and 2. Make sure students know how to do the calculation. Have students get into groups to complete part 3 and discuss part 4. Have them individually write down their explanation in part 4.
6. Conduct a class discussion about the slow movements recorded by GPS and their relationship to movement during earthquakes.
7. Use the REAPS throughout and after the lesson as appropriate.
REAPSR What do the arrows on the GPS Data Map mean? The arrows, called vectors, represent the direction and speed of
motion for a particular GPS station. The length represents the speed, not where the station will be in a certain time.
E Describe why you think scientists use a ratio rather than making the arrows the actual length GPS stations move.
The arrows may be too long or short depending on how big the map is. Using a ratio provides a way to make maps fit on paper.
A Compare the similarities between seismic data and the slow movements monitored by GPS.
Earthquakes and volcanoes occur in a pattern around the world that mirrors the dividing lines between sets of GPS stations with different directions and speeds of movement.
P How far do you expect the HILO station will move next year? In what direction?
It will move approximately 6 centimeters to the west-northwest.S Discuss with a partner an experience you have had using
GPS technology. How did you use it? If you haven’t had an experience, where might you encounter GPS in the future?
154 Exploring Earth’s Landforms Draft Version 1 March 2006
Background InformationEarth’s surface doesn’t just move during earthquakes and volcanic eruptions. In fact, Earth’s surface moves gradually every day. This slow, steady movement is not noticeable in everyday activities, but sophisticated Global Positioning System (GPS) units can detect this movement. On average, Earth’s surface moves a few centimeters (5-25) per year depending on the exact location. GPS is a network of 24 satellites in orbit around Earth and radio receivers on the ground. GPS pinpoints locations (latitude, longitude, and altitude) on Earth. The information is used for a variety of activities. You may already be familiar with GPS units—some are hand-held and used in boating, hiking, and other outdoor activities and others are fixed units used for tracking cars, airplanes, and other vehicles. The maps in this step display real data measured by the GPS network. The arrows on the maps, called vectors, represent the direction and speed of motion for particular GPS sites. The direction of the arrow simply indicates the compass direction of motion for the location while the length of the arrow represents the speed of movement (to scale, compared with the reference arrow). It is important to remember that these arrows start at the GPS location, but the tip of the arrow does NOT represent the location to which a GPS station will move in one year.
Advance PreparationBefore class, hang three pieces of string from the ceiling or some fixtures above the classroom.
They must be close enough so that the ends of each will touch at one point when fully extended. These will demonstrate the idea of triangulation. Leave them hanging as the class begins. During the lesson, pull on the three loose ends and find one point where they all meet when all strings are pulled tight. This defines one point in space based on three reference points and is a model of how GPS satellites and a receiver on the ground are used to locate latitude, longitude, and altitude.
.
Draft Version 1 March 2006 Step 5: Slow Movements 155
5. Provide each student with Student Page 5.1B: GPS Data and Student Page 5.1C: GPS Data Map (or display as an overhead). As a class, work through parts 1 and 2. Make sure students know how to do the calculation. Have students get into groups and complete part 3 and talk about part 4. Have them individually write down their explanation for part 4.
6. Conduct a class discussion about the slow movements recorded by GPS and their relationship to movement in earthquakes. Begin by asking students to look at the direction of the arrows on the GPS map. Do all the stations move in the same direction? What does this tell you about the surface of Earth? Different parts are moving in different directions. Now ask students to think about the amount that stations have actually moved. How many centimeters did they actually move? How fast is the surface of Earth moving? Very little. Just a few centimeters per year. How much did the ground move due to the Sumatra earthquake that caused the Indian Ocean tsunami they read about in Wall of Water? 20 meters horizontally and 5 meters vertically. How does the rate of movement that the GPS stations record compare to the movement in this earthquake? Very slow compared to movement from the earthquake (centimeters compared to tens of meters). Explain there are two main ways that the earth moves. Sudden movements happen during earthquakes or volcanic eruptions. Slow, steady movements happen all the time and are recorded using GPS.
7. Use the REAPS throughout and after the lesson as appropriate.
Implementation Guide1. Ask students about their thoughts on when
Earth’s surface moves. Does it move even when there is no earthquake happening? If continents were once in different places, as coastlines and fossil evidence indicate from the last step, how could they have moved over time? Explain that Earth’s surface does move all the time and that scientists can measure this movement with a tool called GPS, the Global Positioning System.
2. Now, ask the question, “Where are we?” Once you guide the class to a response involving your geographic location ask, “How do we know where we are?” Guide students to answers including maps and compasses. Introduce the idea of triangulation using three strings hanging from the ceiling, which define one position in space where the ends of the strings meet when all three are fully extended. Explain that scientists use GPS to define points in space (latitude, longitude, and altitude or elevation) and to measure the motion of an object over time. Highlight the use of GPS in everyday life -- outdoor sports or real-time driving directions, for example -- and demonstrate with handheld unit (optional) after students read Student Page 5.1A: GPS Technology.
3. Have students read Student Page 5.1A: GPS Technology. Do “What is GPS” string demonstration. This can involve showing students how to find their location or setting waypoints for students to navigate through a schoolyard.
4. Some students may need additional support at this point. This might be an appropriate time to use the Fingernail extension activity from the unit CD.

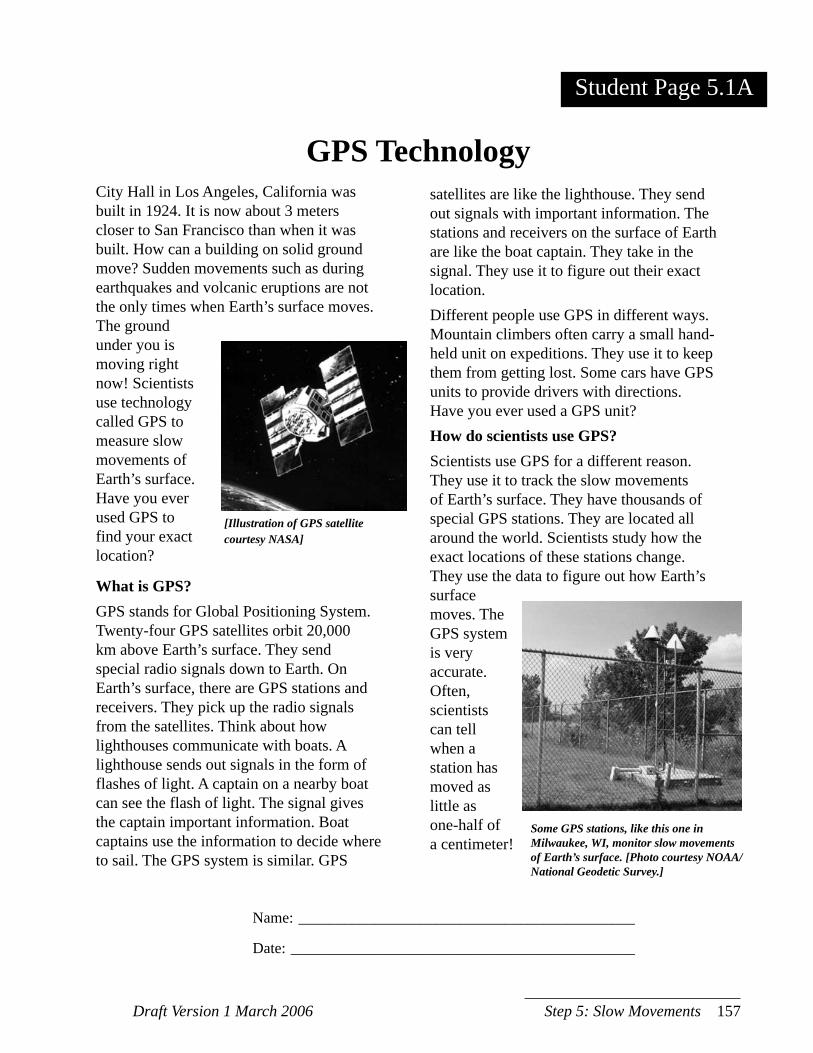
Draft Version 1 March 2006 Step 5: Slow Movements 157
GPS Technology
[Illustration of GPS satellite courtesy NASA]
Name: ____________________________________________
Date: _____________________________________________
Student Page 5.1A
City Hall in Los Angeles, California was built in 1924. It is now about 3 meters closer to San Francisco than when it was built. How can a building on solid ground move? Sudden movements such as during earthquakes and volcanic eruptions are not the only times when Earth’s surface moves. The ground under you is moving right now! Scientists use technology called GPS to measure slow movements of Earth’s surface. Have you ever used GPS to find your exact location?
What is GPS?GPS stands for Global Positioning System. Twenty-four GPS satellites orbit 20,000 km above Earth’s surface. They send special radio signals down to Earth. On Earth’s surface, there are GPS stations and receivers. They pick up the radio signals from the satellites. Think about how lighthouses communicate with boats. A lighthouse sends out signals in the form of flashes of light. A captain on a nearby boat can see the flash of light. The signal gives the captain important information. Boat captains use the information to decide where to sail. The GPS system is similar. GPS
satellites are like the lighthouse. They send out signals with important information. The stations and receivers on the surface of Earth are like the boat captain. They take in the signal. They use it to figure out their exact location.Different people use GPS in different ways. Mountain climbers often carry a small hand-held unit on expeditions. They use it to keep them from getting lost. Some cars have GPS units to provide drivers with directions. Have you ever used a GPS unit? How do scientists use GPS?Scientists use GPS for a different reason. They use it to track the slow movements of Earth’s surface. They have thousands of special GPS stations. They are located all around the world. Scientists study how the exact locations of these stations change. They use the data to figure out how Earth’s surface moves. The GPS system is very accurate. Often, scientists can tell when a station has moved as little as one-half of a centimeter!
Some GPS stations, like this one in Milwaukee, WI, monitor slow movements of Earth’s surface. [Photo courtesy NOAA/National Geodetic Survey.]

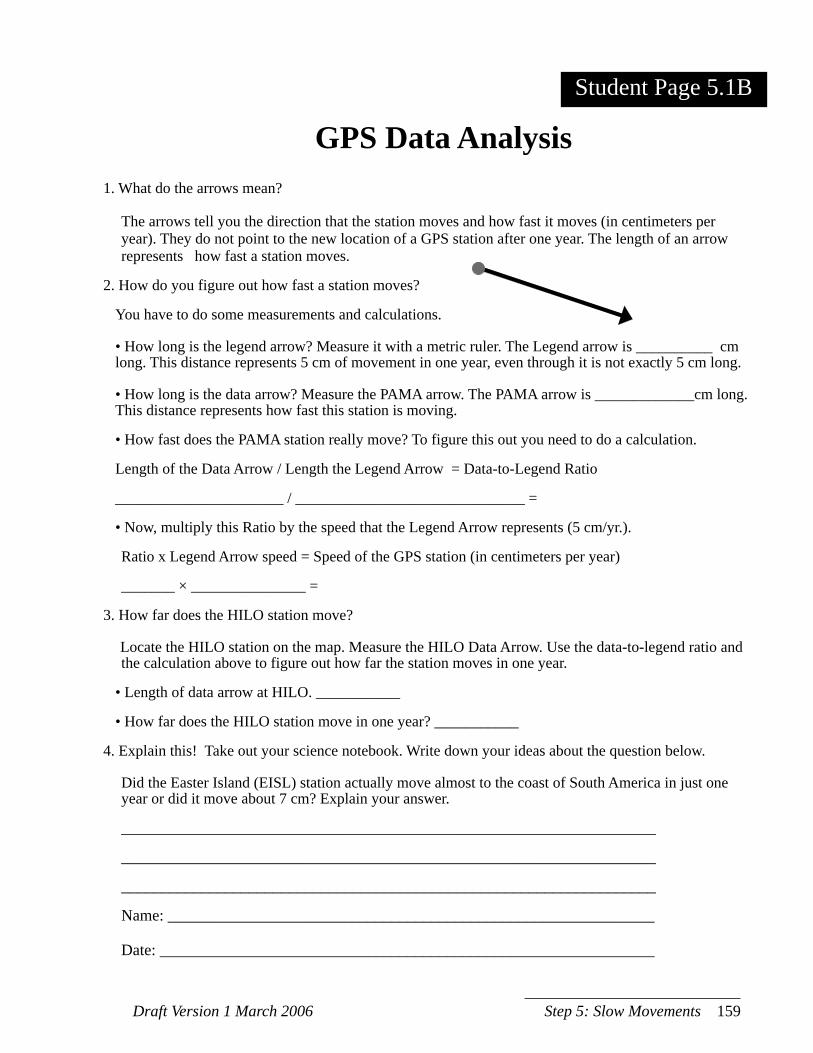
Draft Version 1 March 2006 Step 5: Slow Movements 159
1. What do the arrows mean?
The arrows tell you the direction that the station moves and how fast it moves (in centimeters per year). They do not point to the new location of a GPS station after one year. The length of an arrow represents how fast a station moves.
2. How do you figure out how fast a station moves?
You have to do some measurements and calculations.
• How long is the legend arrow? Measure it with a metric ruler. The Legend arrow is __________ cm long. This distance represents 5 cm of movement in one year, even through it is not exactly 5 cm long.
• How long is the data arrow? Measure the PAMA arrow. The PAMA arrow is _____________cm long. This distance represents how fast this station is moving.
• How fast does the PAMA station really move? To figure this out you need to do a calculation.
Length of the Data Arrow / Length the Legend Arrow = Data-to-Legend Ratio
______________________ / ______________________________ =
• Now, multiply this Ratio by the speed that the Legend Arrow represents (5 cm/yr.).
Ratio x Legend Arrow speed = Speed of the GPS station (in centimeters per year)
_______ × _______________ =
3. How far does the HILO station move?
Locate the HILO station on the map. Measure the HILO Data Arrow. Use the data-to-legend ratio and the calculation above to figure out how far the station moves in one year.
• Length of data arrow at HILO. ___________
• How far does the HILO station move in one year? ___________
4. Explain this! Take out your science notebook. Write down your ideas about the question below.
Did the Easter Island (EISL) station actually move almost to the coast of South America in just one year or did it move about 7 cm? Explain your answer.
___________________________________________________________________
___________________________________________________________________
___________________________________________________________________
Name: _____________________________________________________________
Date: ______________________________________________________________
Student Page 5.1B
GPS Data Analysis

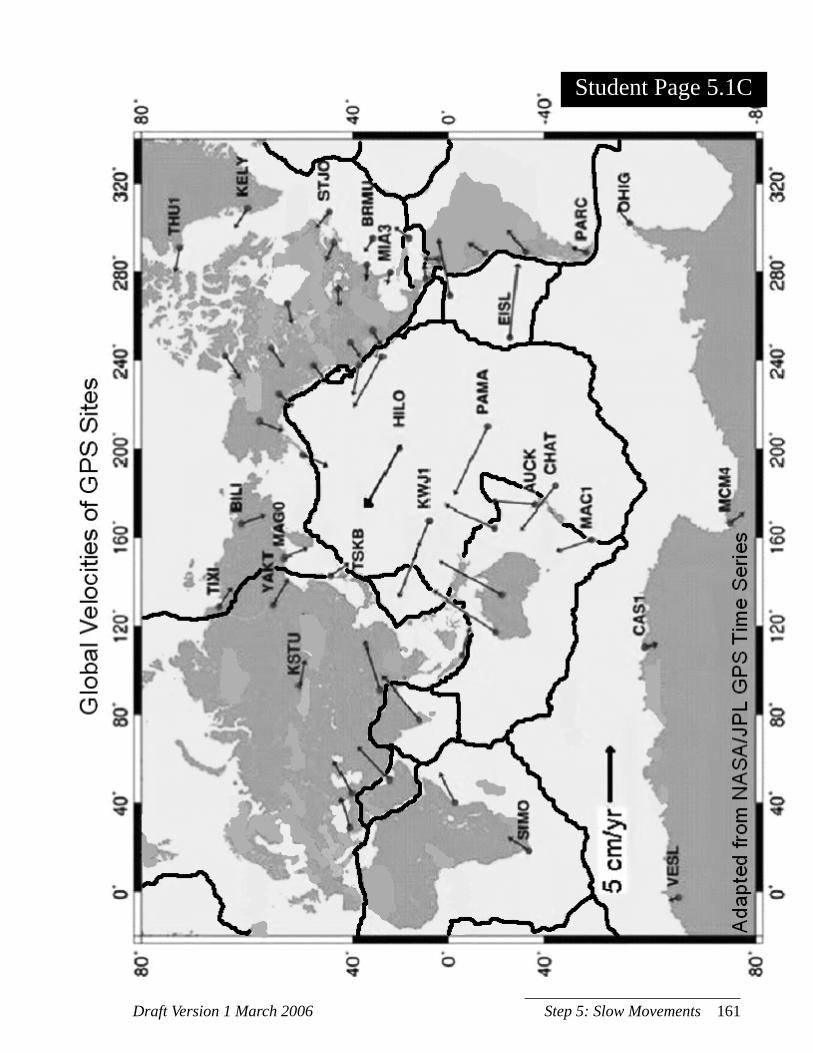
Draft Version 1 March 2006 Step 5: Slow Movements 161
GPS Data Map
Student Page 5.1C

Draft Version 1 March 2006 Step 5: Slow Movements 163
Step 5 - Lesson 2 Snapshot
Key Concepts• Earth’s surface moves slowly
and continuously, not just during catastrophic events.
• GPS provides direct observation of slow surface movement.
• Different areas of Earth’s surface move in different directions.
• Areas moving as a unit are outlined in a pattern similar to the location of earthquakes and volcanoes.
• Scientists have discovered that Earth’s surface is broken into large segments, called plates, that move slowly and continuously.
Evidence of Student UnderstandingThe student will be able to: • identify a correlation between
seismic data and tectonic plate boundaries and recognize the relative motion between plates;
• describe the relative motion between plates.
Time Needed60 minutes
MaterialsFor the class• Teacher Page 5.2: Demo Cards• GPS Data map from Lesson 5.1For each student• copy of Student Page 5.2A:
Simulating GPS Movements• copy of Student Page 5.2B:
Identifying Plates
Discovering Plates1. Facilitate GPS station movement simulation and a class
discussion about the results. Have students record their observations on Student Page 5.2A: Simulating GPS Movements.
2. Demonstrate how the HILO, PAMA, and KWJ1 stations are all contained within one black outline and that the Australia station and the ESIL station are in different sections. Show how the lines on the GPS Data Map align with the pattern of earthquake locations. Let students develop their own explanation of the relationship between the two.
3. Introduce the scientific term plate. Provide students with the names of major plates using Student Page 5.2 B Identifying Plates.
4. Use the REAPS throughout and after the lesson as appropriate.
REAPSR In which direction and how fast is the Pacific plate
moving? Generally, west-northwest at about 6–7 cm/year.E Why do all GPS stations on one plate move in a
similar direction and at about the same speed? All stations on a plate are fixed relative to each other, so they will all move together in about the same direction and at nearly the same speed.
A Describe how slow movement of the plates relate to sudden movements like earthquakes.
The differences are dramatic. Sudden movements can displace the earth by as much as several meters in a few seconds. Slow movements are on the order of centimeters per year.
P If the plates are always moving a little each year, where do you think your region will be in 100 million years?
Answers may vary.S In your Science Notebook, describe how the
activity in which you acted like plates is similar to a model for relative plate motions?
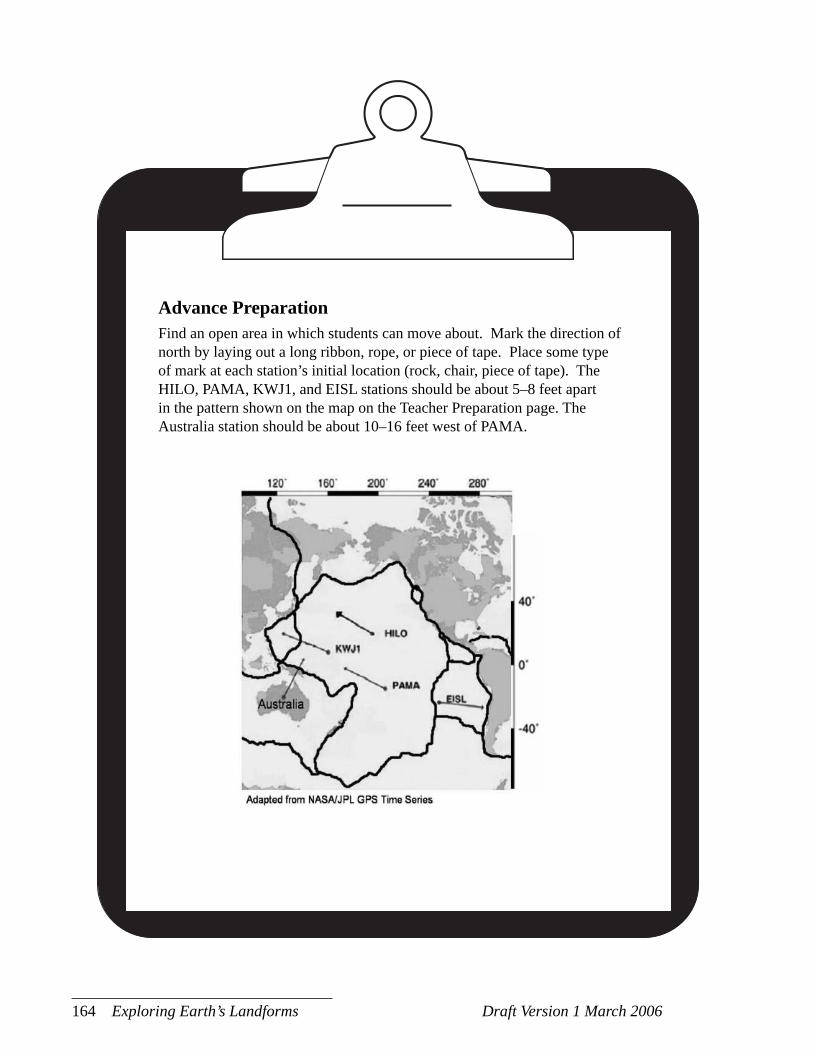
164 Exploring Earth’s Landforms Draft Version 1 March 2006
Advance PreparationFind an open area in which students can move about. Mark the direction of north by laying out a long ribbon, rope, or piece of tape. Place some type of mark at each station’s initial location (rock, chair, piece of tape). The HILO, PAMA, KWJ1, and EISL stations should be about 5–8 feet apart in the pattern shown on the map on the Teacher Preparation page. The Australia station should be about 10–16 feet west of PAMA.
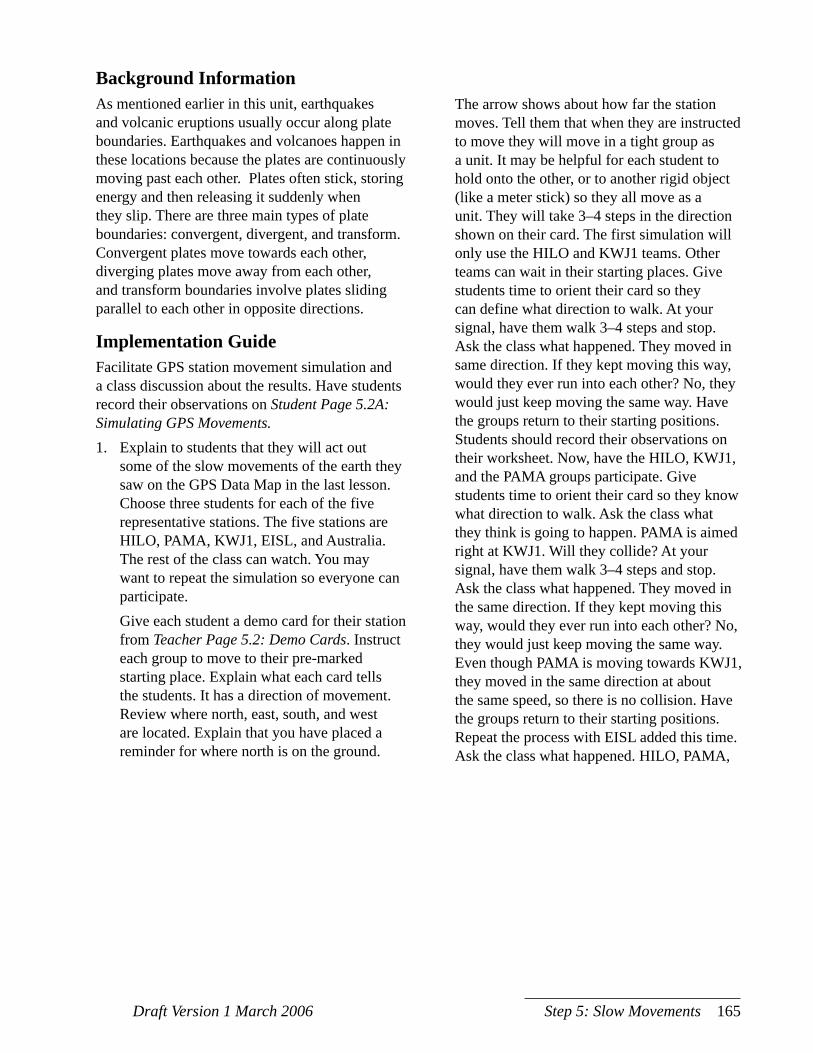
Draft Version 1 March 2006 Step 5: Slow Movements 165
Background InformationAs mentioned earlier in this unit, earthquakes and volcanic eruptions usually occur along plate boundaries. Earthquakes and volcanoes happen in these locations because the plates are continuously moving past each other. Plates often stick, storing energy and then releasing it suddenly when they slip. There are three main types of plate boundaries: convergent, divergent, and transform. Convergent plates move towards each other, diverging plates move away from each other, and transform boundaries involve plates sliding parallel to each other in opposite directions.
Implementation GuideFacilitate GPS station movement simulation and a class discussion about the results. Have students record their observations on Student Page 5.2A: Simulating GPS Movements.1. Explain to students that they will act out
some of the slow movements of the earth they saw on the GPS Data Map in the last lesson. Choose three students for each of the five representative stations. The five stations are HILO, PAMA, KWJ1, EISL, and Australia. The rest of the class can watch. You may want to repeat the simulation so everyone can participate.
Give each student a demo card for their station from Teacher Page 5.2: Demo Cards. Instruct each group to move to their pre-marked starting place. Explain what each card tells the students. It has a direction of movement. Review where north, east, south, and west are located. Explain that you have placed a reminder for where north is on the ground.
The arrow shows about how far the station moves. Tell them that when they are instructed to move they will move in a tight group as a unit. It may be helpful for each student to hold onto the other, or to another rigid object (like a meter stick) so they all move as a unit. They will take 3–4 steps in the direction shown on their card. The first simulation will only use the HILO and KWJ1 teams. Other teams can wait in their starting places. Give students time to orient their card so they can define what direction to walk. At your signal, have them walk 3–4 steps and stop. Ask the class what happened. They moved in same direction. If they kept moving this way, would they ever run into each other? No, they would just keep moving the same way. Have the groups return to their starting positions. Students should record their observations on their worksheet. Now, have the HILO, KWJ1, and the PAMA groups participate. Give students time to orient their card so they know what direction to walk. Ask the class what they think is going to happen. PAMA is aimed right at KWJ1. Will they collide? At your signal, have them walk 3–4 steps and stop. Ask the class what happened. They moved in the same direction. If they kept moving this way, would they ever run into each other? No, they would just keep moving the same way. Even though PAMA is moving towards KWJ1, they moved in the same direction at about the same speed, so there is no collision. Have the groups return to their starting positions. Repeat the process with EISL added this time. Ask the class what happened. HILO, PAMA,
166 Exploring Earth’s Landforms Draft Version 1 March 2006
and KWJ1 all moved in same direction. EISL is moving opposite to the groups on other side of the Pacific. Have the groups return to their starting positions. Repeat the process with Australia too. At your signal have them walk 3–4 steps and stop. Ask the class what happened. Some of the class moved in the same direction. If they kept moving this way, would they ever collide? No, they would just keep moving the same way. What about the rest of the class? EISL is moving away from this group. Australia is going to crash into them if you let them walk far enough. Remind students that this exercise extends the movements indicated on the map for a very long time. This is not where the land areas would end up in one year or even a few thousand years! Have students return to their desks and provide them with Student Page 5.2A: Simulating GPS Movements. You may have them work in pairs or individually to record their observations.
2. Display an overhead of the GPS Data Map from Lesson 5.1. Point out the black lines on the map. Ask students to look at all the dots inside one of the large shapes outlined with the black lines. What direction do these stations move? Have them look at another area outlined in black. Do all these stations move in the same direction? Explain that these areas all move together as a unit, just as the students did during the simulation. Now, ask students to look specifically at the pattern of the lines. Ask students where they may have seen this pattern before. Have them think about the earthquake and volcano locations they studied in Step 3. Students may recall
the pattern they observed for earthquake and volcano distribution in Step 3. Have students gather evidence for this idea. Send them back to their Science Notebooks and the maps they used in Step 3. Is the pattern similar? It may not be exact, but it is close. Once students agree that the two patterns really line up, ask them to propose an explanation for what they observe. Remind them that their explanation must be based on evidence. Remind them of the brick and board model. Have them flip back to that section of their Science Notebook. What did it tell them? That there were little movements before there was a big one. That you had to put a lot of force on it before it actually moved.
Allow students to get into groups to discuss their evidence and develop explanations. Have the groups share their ideas with the class. Challenge student ideas that seem to lack evidence. Encourage students to question one another.
3. After students make their own explanation for these boundaries, introduce the scientific term plate. Scientists define the areas contained by these lines as plates. The plate moves as a unit. Earthquakes and volcanoes occur along plate boundaries. Discuss how plates move in relation to each other. You can introduce the three main types of plate movements by referring to the GPS data maps. Have students identify plate names and boundaries in their regions from Student Page 5.2B: Identifying Plates.
4. Use the REAPS throughout and after the lesson as appropriate.

Draft Version 1 March 2006 Step 5: Slow Movements 167
TEACHER PAGE
Demo Cards
Teacher Page 5.2A

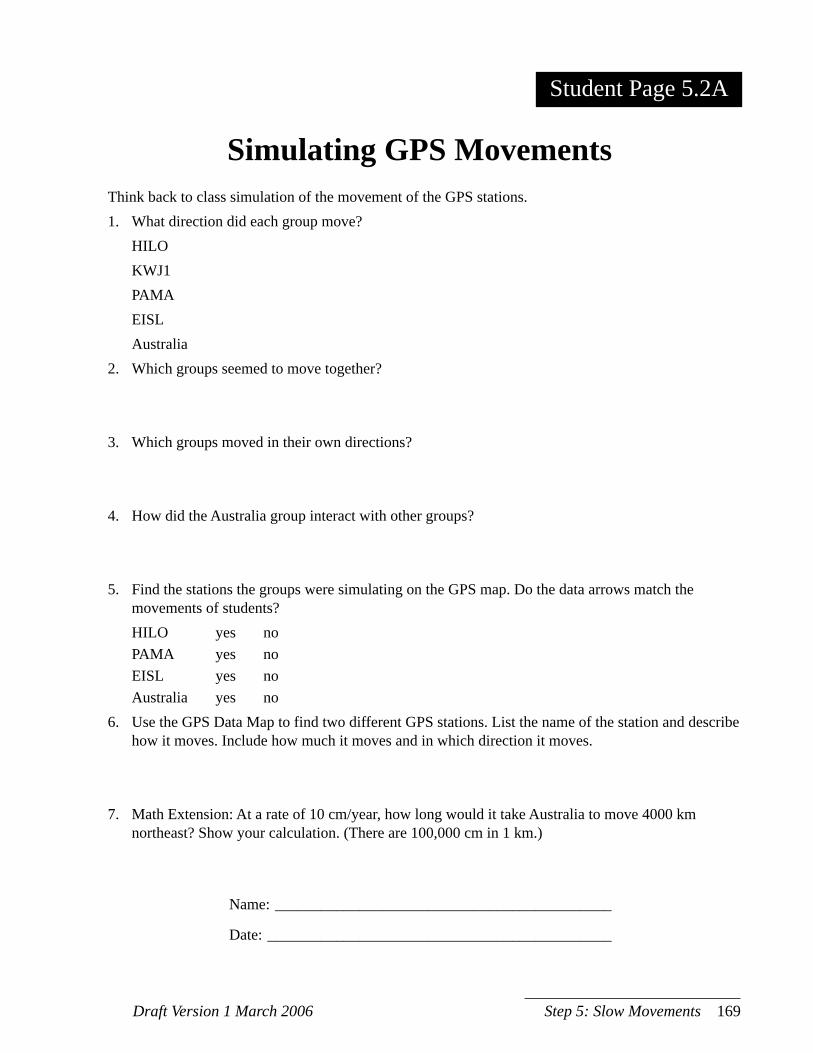
Draft Version 1 March 2006 Step 5: Slow Movements 169
Think back to class simulation of the movement of the GPS stations. 1. What direction did each group move? HILO KWJ1 PAMA EISL Australia2. Which groups seemed to move together?
3. Which groups moved in their own directions?
4. How did the Australia group interact with other groups?
5. Find the stations the groups were simulating on the GPS map. Do the data arrows match the movements of students?
HILO yes no PAMA yes no EISL yes no Australia yes no6. Use the GPS Data Map to find two different GPS stations. List the name of the station and describe
how it moves. Include how much it moves and in which direction it moves.
7. Math Extension: At a rate of 10 cm/year, how long would it take Australia to move 4000 km northeast? Show your calculation. (There are 100,000 cm in 1 km.)
STUDENT PAGE
Simulating GPS Movements
Name: ____________________________________________
Date: _____________________________________________
Student Page 5.2A

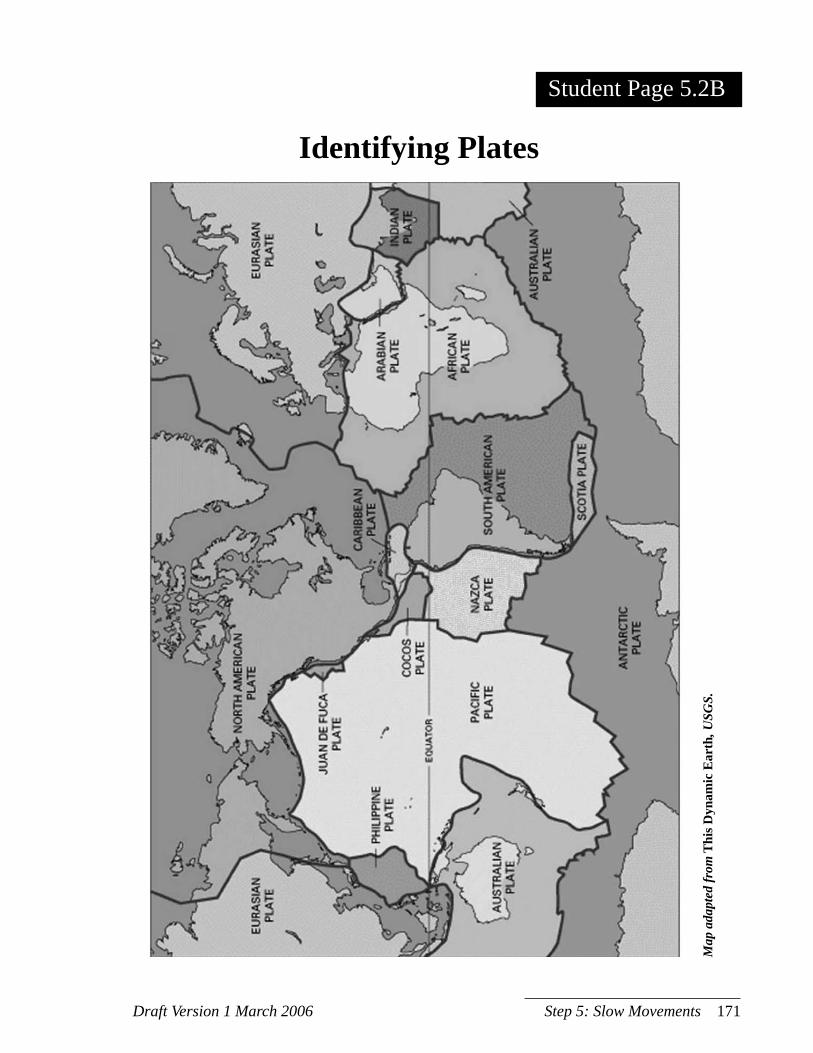
Draft Version 1 March 2006 Step 5: Slow Movements 171
Student Page
Identifying Plates
Map
ada
pted
from
Thi
s Dyn
amic
Ear
th, U
SGS.
Student Page 5.2B

Draft Version 1 March 2006 Step 5: Slow Movements 173
Key Concept • Scientists revise their models
and explanations based on new information.
Evidence of Student UnderstandingThe student will be able to: • revise their physical scientific
model based on new evidence about plate motion in their region.
Time Needed30 minutes
MaterialsFor each student• copy of Student Page 5.3A:
Model Revision Worksheet For each region group• modeling materials
Revising Regional Models1. Have students identify GPS stations and plates that are
located within their region. Explain that students will be using their new knowledge to revise the model of their region.
2. Instruct students to sketch and describe their revisions using Student Page 5.3A: Model Revision Worksheet and then allow them time to complete the model revisions.
3. Use the REAPS throughout and after the lesson as appropriate.
Step 5 - Lesson 3 Snapshot
REAPSR On what plate or plates is your region found? Answers will vary—check for accuracy using the
Identifying Plates map.E How will you revise your model based on GPS data? Answers will vary. Example: GPS data shows the
Pacific Plate is moving faster than the North American plate around California. I will color that plate darker to represent its different motion
A How do you think the plate motions in your region affect the landforms?
Answers will vary. Example: The plate motion near the Himalayas may cause the mountains to form since the plates are moving towards each other and the land has nowhere to go.
P What evidence will you use to revise your model? Answers will vary. Example: I will represent the speed
and direction of motion of plates in my region in my revised model.
S Meet with a student from another region group and discuss your answers to the Predict question: “What evidence will you use to revise your model?”
174 Exploring Earth’s Landforms Draft Version 1 March 2006
Background InformationSee Lesson 3.3 Background Information and Unit Overview for more information on revising a scientific model.
Implementation Guide1. What would students need to change about
their model so that it more accurately reflects data on plate boundaries and slow movements? Explain that students will be using their new knowledge to revise the model of their region. Students should gather in their region groups. Instruct each group to find their region on the plate boundary map. Students should identify on which plate(s) their region is located. They should also consider how the plates are moving relative to nearby plates. Ask students to answer and discuss the following questions in their groups. These can be listed on a board or chart paper.• Are there GPS stations located in your
region?• On what plate or plates is your region
found?• How do plates move or interact in your
region?• What effect do you think this has on other
information you’ve already learned about your region?
• How can you model these interactions? 2. Distribute Student Page 5.3A: Model Revision
Worksheet to each student. Each group should discuss and agree upon the revisions they will make to their model. Remind them to incorporate their new evidence about GPS stations and plate movements. Each student
Advance PreparationPrepare modeling materials. Make sure you have adequate supplies for the students’ models.
During this revision, students may show the relative motion of plates in their region or label the plates around their region.
within the group should sketch and describe the newly revised model on their worksheet before the group begins to reconstruct the model. Remind students that they are not building a new model or completely rebuilding their model but are making changes and additions to their existing model based on new evidence. Ask students to continue to think about what their model shows well and what limitations it has in light of the new evidence they have uncovered. Allow students time to complete their model revisions.
3. Use the REAPS throughout and after the lesson as appropriate.

Draft Version 1 March 2006 Step 5: Slow Movements 175
Description:What evidence are you using to revise your model?What materials are you going to use?What ideas or features are you revising and why?
____________________________________________________________________________________
____________________________________________________________________________________
____________________________________________________________________________________
____________________________________________________________________________________
____________________________________________________________________________________
____________________________________________________________________________________
____________________________________________________________________________________
____________________________________________________________________________________
____________________________________________________________________________________
STUDENT PAGE
Model Revision Worksheet
Name: ______________________________________________________
Date: _______________________________________________________
Region: _____________________________________________________
Legend
STUDENT PAGE Student Page 5.3A

Previous lessons may have caused students to ask “How can continents move? I thought Earth was one big, solid rock.” In this step, students revisit this idea. Here they are provided with the missing concepts that underlie the theory of plate tectonics. Students learn that Earth is not all solid but is made of layers with different properties. In Step 5, they learned that plates are moving. In Step 4, they saw evidence that plates, and the continents associated with them, have moved. Here, they begin to understand what makes plates move.Students read short pieces that deliver content and an engaging question. They participate in short activities and watch demonstrations that reinforce the concepts discussed in the readings. They also create a diagram of Earth on paper. As they learn more about Earth’s interior, they revise their diagram to reflect new understandings. Once students have a clear picture of what is under the surface of Earth, they return to their region models. They revise and add to their model, beginning to depict the qualities of their region below Earth’s surface.
Lesson 6.1 Earth’s Crust (35 min)
Lesson 6.2 Inside Earth (35 min)
Lesson 6.3Revising Region Models (20 min)
S T E P
6
Overview: Layers of Earth

Draft Version 1 March 2006 Step 6: Layers of Earth 179
Step 6 - Lesson 1 Snapshot
Key Concept• Plates are sections of Earth’s
outer layer—the crust.
Evidence of Student UnderstandingThe student will be able to: • describe the kinds of
information that core samples provide and how scientists use them to study Earth;
• explain how thin Earth’s crust is compared to the whole Earth.
Time Needed35 minutes
MaterialsFor each student• copy of Student Page 6.1A:
Core Samples• copy of Student Page 6.1B:
Earth’s Crust
For each group• unwrapped Milky Way
miniature• unwrapped Mars bar
miniature or Snickers miniature
• 2 plastic straws• full round slice of apple• ruler with mm scale
Earth’s Crust1. Ask what students think the center of Earth is like. Have
students make a drawing in their Science Notebooks of what they think Earth might look like if it were cut in half. Label this picture “Idea #1”.
2. Explain that one of the ways scientists learn about the inside of Earth is by taking core samples. Provide Students with Student Page 6.1A: Core Samples. Allow students time to take core samples of candy bars and come to a decision about identifying the candy bars.
3. Provide Students with Student Page 6.1B: Earth’s Crust. Allow students time to complete apple observations, measurements, and calculations. Students will make a new diagram of Earth in their science notebook, labeled “Idea #2”.
4. Use the REAPS throughout and after the lesson as appropriate.
REAPSR What kinds of information do core samples provide
scientists? Answers may vary. Answers may vary and can include:
Information about rocks and chemicals in Earth’s interior or information about Earth’s previous atmosphere from air bubbles trapped in ice cores
E Why is the apple a good model for the inside of Earth?
Student answers will vary and should include that the apple has the same ratio of skin thickness (crust) to overall diameter.
A What things are not accurate about the apple model? Answers may vary. The apple’s surface is smooth.
Earth’s surface is rough with mountains and trenches. The apple’s surface is uniform. Earth’s surface is covered in different kinds of material (soil, water, rock, sand).
P Other than the apple, what could be another model for Earth, and why?
Answers may vary. Accept all ideas that are based on accurate evidence.
S In groups, share your idea for another model of Earth.
180 Exploring Earth’s Landforms Draft Version 1 March 2006
Background InformationCore samples are one way of learning about the interior structure of things without going into them. Earth is so large that core samples cannot be taken (at least with any conceivable technology) beyond the uppermost part of the crust, a mere scratch on the surface. Core samples are often taken from ice sheets at the poles, where further analysis can reveal a lot about how Earth’s environment has changed over long periods.
Implementation Guide1. Ask students what they think the center of
Earth is like. Is it solid rock? Is it filled with water? Have each student make a drawing of Earth in their Science Notebook. Label it Idea # 1. They may draw the plates on the outside of Earth. If a student draws something in the middle, ask them what evidence they have for their drawing. They might say that they have read about what is under the crust or that they know lava from volcanoes comes from inside Earth. If they have evidence for their ideas, they can leave their drawings unchanged. If they don’t have evidence for what they draw, ask them to think about what they really know and what their drawing should look like based on what they know. Explain that scientists have collected a lot of evidence about what the inside of Earth is like. One of the techniques scientists use to learn about what is inside things is core sampling. Students will practice this technique on candy bars, rather than Earth.
2. Divide students into small groups and provide each group with Student Page 6.1A: Core Samples, two plastic straws, a Milky Way miniature, and either a Snickers miniature or a Mars Bar miniature. Allow them to read the Student Page and take core samples to figure out which candy bar is which.
3. Have students read Student Page 6.1B: Earth’s Crust. Provide each group with a full, round, apple slice. Ask them to work as a team to answer the Think and Do questions. Have each student make a new drawing of Earth in their Science Notebook. Label it Idea #2. They should make a new drawing based on evidence they learned about the crust. Their crust should be very thin. They might have plates on the surface. They might indicate that the middle is very hot.
4. Use the REAPS throughout and after the lesson as appropriate.
Advance PreparationCollect some large plastic straws (like those from fast-food restaurants). Unwrap all of the miniature candy bars. Be sure to keep each kind separate, but unlabeled. Slice apples ahead of time. They will brown, but will still work for the activity. If you prefer, keep them in a bowl of water with a few drops of lemon juice or vinegar. This will keep them from discoloring.
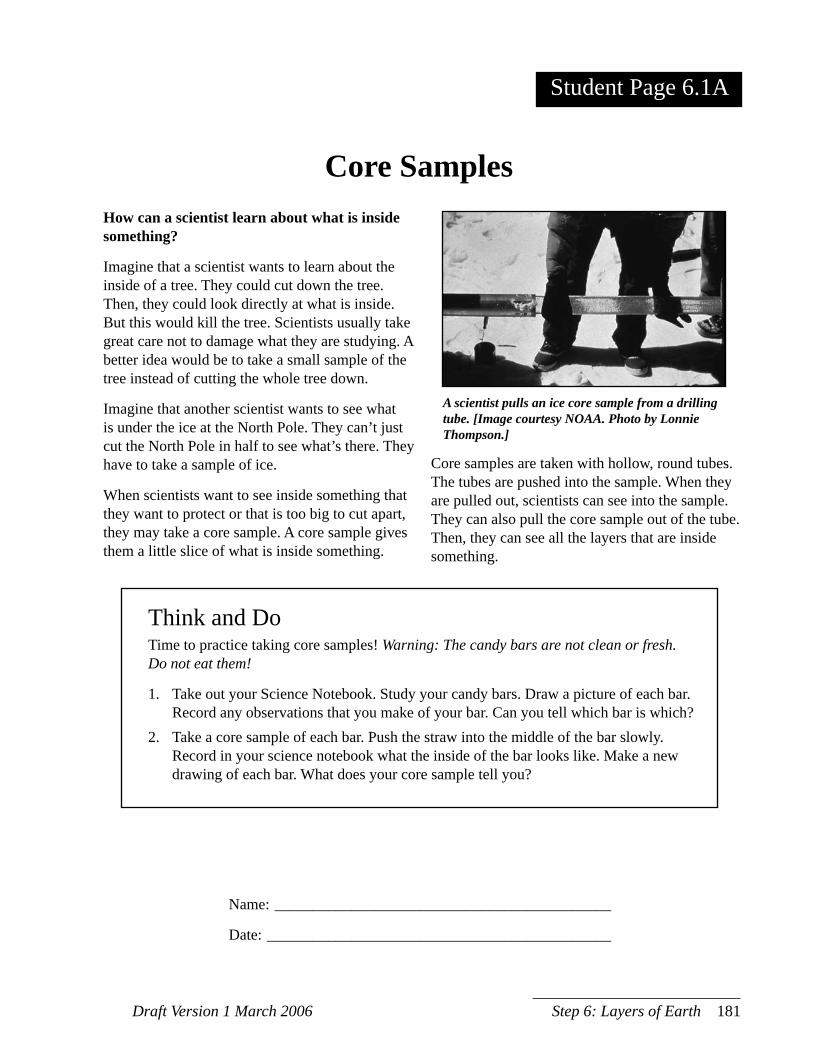
Draft Version 1 March 2006 Step 6: Layers of Earth 181
How can a scientist learn about what is inside something?
Imagine that a scientist wants to learn about the inside of a tree. They could cut down the tree. Then, they could look directly at what is inside. But this would kill the tree. Scientists usually take great care not to damage what they are studying. A better idea would be to take a small sample of the tree instead of cutting the whole tree down.
Imagine that another scientist wants to see what is under the ice at the North Pole. They can’t just cut the North Pole in half to see what’s there. They have to take a sample of ice.
When scientists want to see inside something that they want to protect or that is too big to cut apart, they may take a core sample. A core sample gives them a little slice of what is inside something.
STUDENT PAGE
Core Samples
A scientist pulls an ice core sample from a drilling tube. [Image courtesy NOAA. Photo by Lonnie Thompson.]
Core samples are taken with hollow, round tubes. The tubes are pushed into the sample. When they are pulled out, scientists can see into the sample. They can also pull the core sample out of the tube. Then, they can see all the layers that are inside something.
Think and DoTime to practice taking core samples! Warning: The candy bars are not clean or fresh. Do not eat them!
1. Take out your Science Notebook. Study your candy bars. Draw a picture of each bar. Record any observations that you make of your bar. Can you tell which bar is which?
2. Take a core sample of each bar. Push the straw into the middle of the bar slowly. Record in your science notebook what the inside of the bar looks like. Make a new drawing of each bar. What does your core sample tell you?
Name: ____________________________________________
Date: _____________________________________________
Student Page 6.1A

Draft Version 1 March 2006 Step 6: Layers of Earth 183
Scientists can see what is near the surface of Earth. Most of Earth is covered with water. The land is made of soil, clay, sand, and rock. Scientists can dig holes into the earth and see that there is rock under the surface. Scientists call this layer of rock Earth’s crust. Earth’s crust is thickest where there are mountains. It is thinner under the ocean. At the thickest part, the crust is 100 km thick.
How do scientists figure out what is deep inside Earth? What is below the crust? Think back to your candy bar test. How did you figure out what was inside the candy bars? Could scientists take a core sample all the way through Earth? Many scientists wish they could. Unfortunately, Earth is too big. Our planet is 12,756 km across. A core sample would have to be that long to go all the way through to the other side!
Scientists may not be able to get a core sample of the whole planet, but they have made some attempts. How far do you think scientists have gone? Engineers dig deep holes when they build mines. The deepest mine in the world is a gold mine in South Africa. It is 4 kilometers deep. Even 4 kilometers down, Earth is still solid rock. This is still part of the crust. The deepest hole ever drilled was in Russia. This hole was 12 km deep. The drill was still in the crust.
One thing about the hole surprised scientists. It was very hot. It was much hotter than they predicted. The temperature was 1800°C! The temperature on a hot summer day only reaches about 38°C. Water boils at 100°C. It is hard to imagine how hot 1800°C feels. Scientists can’t drill much deeper than 12 km. Their tools get so hot that they break. Even rock begins to melt at high temperatures.
STUDENT PAGE
Earth’s Crust
Think and Do1. Look at the apple slice. It represents a slice of Earth. What do you think the skin of the apple
represents?2. How thick is the skin of the apple compared to the whole apple, from skin to core? The skin is ______mm thick. The apple is ______ mm thick. Divide the thickness of the skin by the thickness of the apple. The skin is _________ % of the thickness of the apple. How thick is Earth’s crust compared to the whole planet, from crust to core?3. In your Science Notebook, draw a new diagram of Earth that shows the evidence you know
about the inside. Label it Idea # 2. Think about: • How thick is the crust compared to the size of Earth? • What is the crust made of? • What is the inside of Earth made of? • Where are the plates you learned about earlier?
Name: ____________________________________________
Date: _____________________________________________
Student Page 6.1B

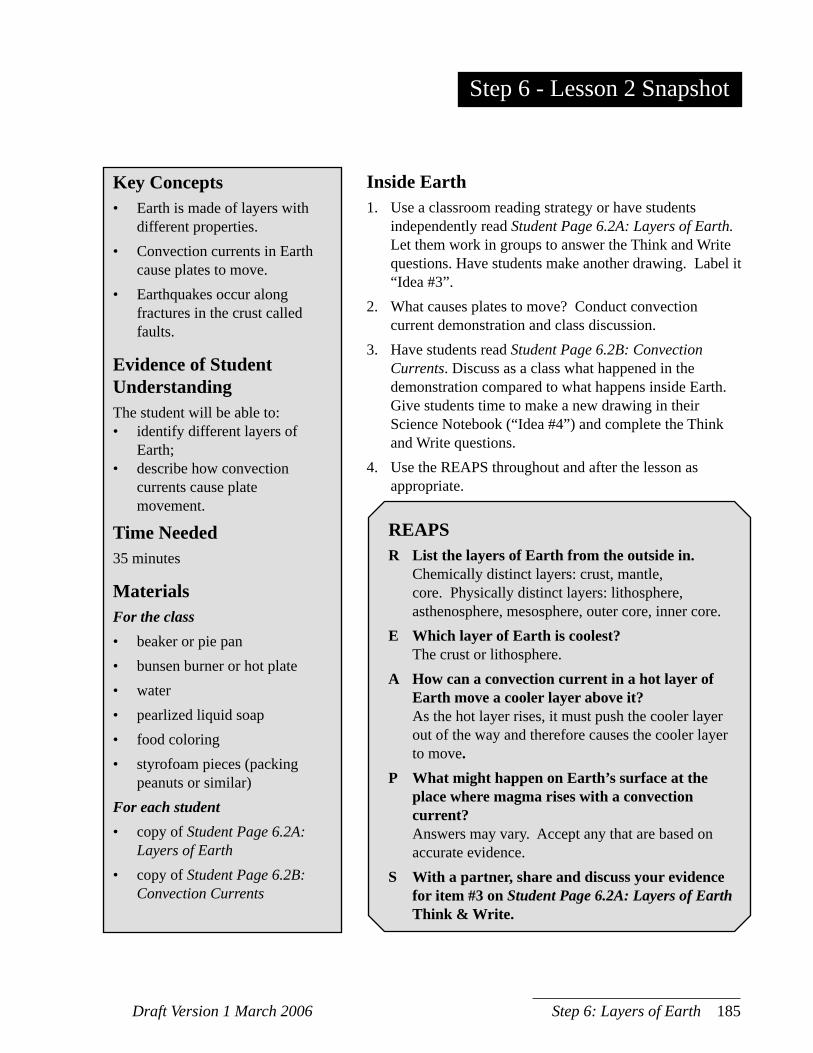
Draft Version 1 March 2006 Step 6: Layers of Earth 185
Step 6 - Lesson 2 Snapshot
Key Concepts• Earth is made of layers with
different properties.• Convection currents in Earth
cause plates to move.• Earthquakes occur along
fractures in the crust called faults.
Evidence of Student UnderstandingThe student will be able to: • identify different layers of
Earth;• describe how convection
currents cause plate movement.
Time Needed35 minutes
MaterialsFor the class• beaker or pie pan• bunsen burner or hot plate• water• pearlized liquid soap• food coloring• styrofoam pieces (packing
peanuts or similar)For each student• copy of Student Page 6.2A:
Layers of Earth• copy of Student Page 6.2B:
Convection Currents
Inside Earth1. Use a classroom reading strategy or have students
independently read Student Page 6.2A: Layers of Earth. Let them work in groups to answer the Think and Write questions. Have students make another drawing. Label it “Idea #3”.
2. What causes plates to move? Conduct convection current demonstration and class discussion.
3. Have students read Student Page 6.2B: Convection Currents. Discuss as a class what happened in the demonstration compared to what happens inside Earth. Give students time to make a new drawing in their Science Notebook (“Idea #4”) and complete the Think and Write questions.
4. Use the REAPS throughout and after the lesson as appropriate.
REAPSR List the layers of Earth from the outside in. Chemically distinct layers: crust, mantle,
core. Physically distinct layers: lithosphere, asthenosphere, mesosphere, outer core, inner core.
E Which layer of Earth is coolest? The crust or lithosphere.A How can a convection current in a hot layer of
Earth move a cooler layer above it? As the hot layer rises, it must push the cooler layer
out of the way and therefore causes the cooler layer to move.
P What might happen on Earth’s surface at the place where magma rises with a convection current?
Answers may vary. Accept any that are based on accurate evidence.
S With a partner, share and discuss your evidence for item #3 on Student Page 6.2A: Layers of Earth Think & Write.
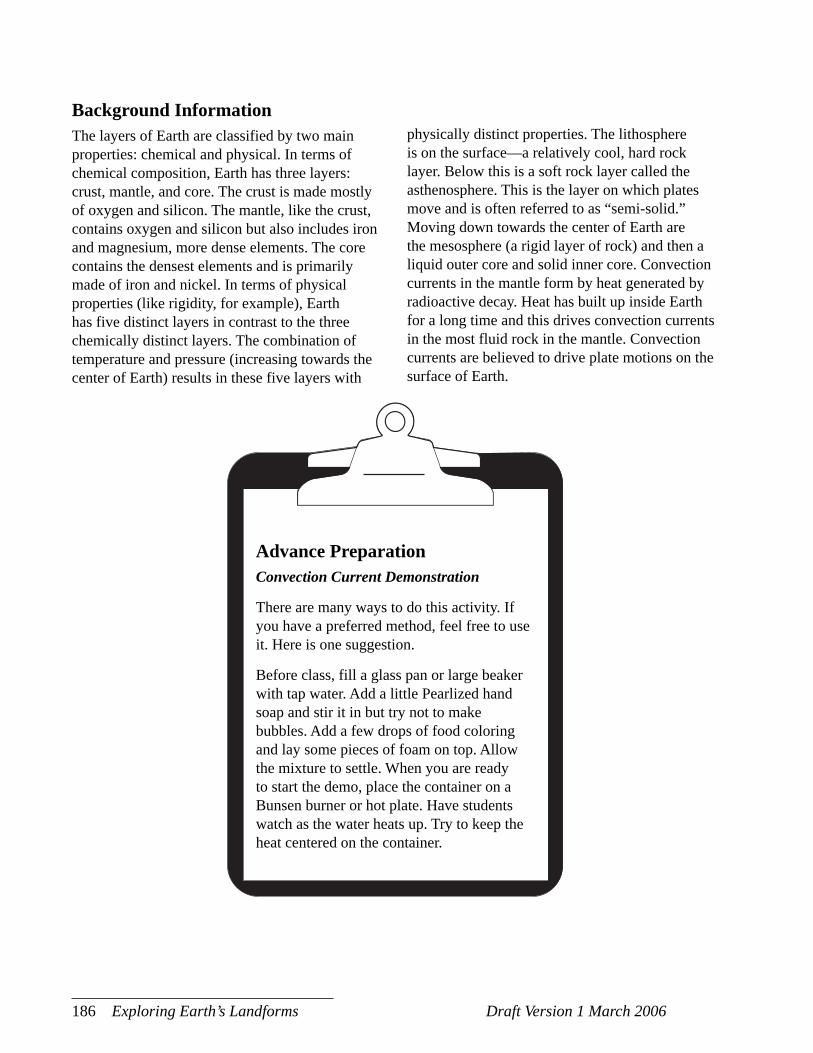
186 Exploring Earth’s Landforms Draft Version 1 March 2006
Background InformationThe layers of Earth are classified by two main properties: chemical and physical. In terms of chemical composition, Earth has three layers: crust, mantle, and core. The crust is made mostly of oxygen and silicon. The mantle, like the crust, contains oxygen and silicon but also includes iron and magnesium, more dense elements. The core contains the densest elements and is primarily made of iron and nickel. In terms of physical properties (like rigidity, for example), Earth has five distinct layers in contrast to the three chemically distinct layers. The combination of temperature and pressure (increasing towards the center of Earth) results in these five layers with
Advance PreparationConvection Current Demonstration
There are many ways to do this activity. If you have a preferred method, feel free to use it. Here is one suggestion.
Before class, fill a glass pan or large beaker with tap water. Add a little Pearlized hand soap and stir it in but try not to make bubbles. Add a few drops of food coloring and lay some pieces of foam on top. Allow the mixture to settle. When you are ready to start the demo, place the container on a Bunsen burner or hot plate. Have students watch as the water heats up. Try to keep the heat centered on the container.
physically distinct properties. The lithosphere is on the surface—a relatively cool, hard rock layer. Below this is a soft rock layer called the asthenosphere. This is the layer on which plates move and is often referred to as “semi-solid.” Moving down towards the center of Earth are the mesosphere (a rigid layer of rock) and then a liquid outer core and solid inner core. Convection currents in the mantle form by heat generated by radioactive decay. Heat has built up inside Earth for a long time and this drives convection currents in the most fluid rock in the mantle. Convection currents are believed to drive plate motions on the surface of Earth.
Draft Version 1 March 2006 Step 6: Layers of Earth 187
Implementation Guide1. Have students read Student Page 6.2A: Layers
of Earth. Let them work in groups to answer the Think and Do questions. Have students take out their Science Notebooks and make another drawing of what Earth might look like if cut in half. Label it Idea #m3.
2. What causes a floating object to move? A floating boat could be moved by the wind, a motor, or people paddling. Either way, it needs energy to move. The wind, the motor, or the people provide the energy to move the boat. Plates are no different. They need energy to move. Where do you think plates get the energy they need to move? Accept any student ideas as long as they are supported by evidence. If an idea seems to lack evidence, ask probing questions like “How do you know that?” For example:• I understand what you mean about Earth
spinning on its axis, but if that is what moves the plates would they all move in different directions like we saw on the GPS Data Map?
• What evidence do you have that wind is strong enough to move a plate?
Conduct convection current demonstration. One way to do this is described in the “Advance Preparation” section for this lesson. Ask students a few questions after the demo to make sure they think about the currents in the container and the effects on the foam pieces. How did the water move? Up and out. What provided the energy for the foam pieces
to move? The heat under the pan. Where did they move? Out toward the edges of the container. Finally, pose the question, “What do you know of that might contain enough energy to move something as big as a plate?” Challenge students to provide evidence for their statements.
3. Have students read Student Page 6.2B: Convection Currents. Discuss as a class what happened in the demonstration compared to what happens inside Earth. The foam pieces were moved to the sides. The water bubbled up in between them. The heat from the center of Earth pushes the plates to the sides. The magma bubbles up between them. The foam pieces just moved over to the sides, but Earth is covered in plates. What happens when the magna bubbles up on a plate boundary? The two plates move away from each other. What kind of plate boundary is this when two plates move away from each other? Divergent. What happens at the other edges of each plate? If they split apart they have to go somewhere. They run into other plates. Sometimes plates drop down under the plate they run into. What happens to the plate if it slips under another plate? Where is it in Earth? What layer does it go into? Does it stay solid once in that layer? Give students time to make a new drawing in their Science Notebook -- Idea # 4 -- and complete the Think and Write question.
4. Use the REAPS throughout and after the lesson as appropriate.

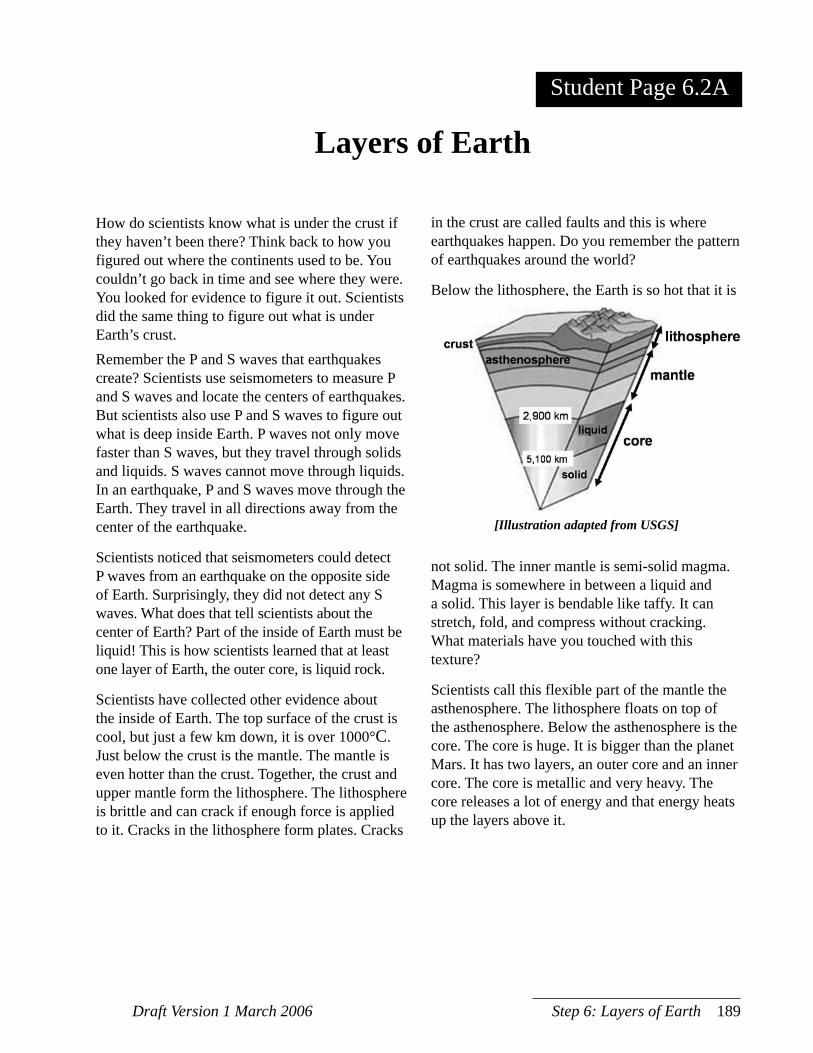
Draft Version 1 March 2006 Step 6: Layers of Earth 189
How do scientists know what is under the crust if they haven’t been there? Think back to how you figured out where the continents used to be. You couldn’t go back in time and see where they were. You looked for evidence to figure it out. Scientists did the same thing to figure out what is under Earth’s crust.Remember the P and S waves that earthquakes create? Scientists use seismometers to measure P and S waves and locate the centers of earthquakes. But scientists also use P and S waves to figure out what is deep inside Earth. P waves not only move faster than S waves, but they travel through solids and liquids. S waves cannot move through liquids. In an earthquake, P and S waves move through the Earth. They travel in all directions away from the center of the earthquake.
Scientists noticed that seismometers could detect P waves from an earthquake on the opposite side of Earth. Surprisingly, they did not detect any S waves. What does that tell scientists about the center of Earth? Part of the inside of Earth must be liquid! This is how scientists learned that at least one layer of Earth, the outer core, is liquid rock.
Scientists have collected other evidence about the inside of Earth. The top surface of the crust is cool, but just a few km down, it is over 1000°C. Just below the crust is the mantle. The mantle is even hotter than the crust. Together, the crust and upper mantle form the lithosphere. The lithosphere is brittle and can crack if enough force is applied to it. Cracks in the lithosphere form plates. Cracks
in the crust are called faults and this is where earthquakes happen. Do you remember the pattern of earthquakes around the world?
Below the lithosphere, the Earth is so hot that it is
[Illustration adapted from USGS]
not solid. The inner mantle is semi-solid magma. Magma is somewhere in between a liquid and a solid. This layer is bendable like taffy. It can stretch, fold, and compress without cracking. What materials have you touched with this texture?
Scientists call this flexible part of the mantle the asthenosphere. The lithosphere floats on top of the asthenosphere. Below the asthenosphere is the core. The core is huge. It is bigger than the planet Mars. It has two layers, an outer core and an inner core. The core is metallic and very heavy. The core releases a lot of energy and that energy heats up the layers above it.
Student Page 6.2A
Layers of Earth

Draft Version 1 March 2006 Step 6: Layers of Earth 191
Think and Write1. What evidence can you think of that might have told scientists what the mantle is like? Has
anyone ever seen magma before?
__________________________________________________________________________ __________________________________________________________________________ __________________________________________________________________________ __________________________________________________________________________ __________________________________________________________________________ __________________________________________________________________________
2. Study the diagrams of the inside of Earth that you made earlier—Idea # 1 and Idea # 2. You have gathered new evidence for what the inside of Earth is like. How do you need to change your diagram so that it agrees with the evidence? In your Science Notebook, draw a new diagram of Earth that is supported by all the evidence you have learned. Label it Idea #3. Think about:
• Where is it hottest? • How thick are the layers? • Are the layers solid, semi-solid, or liquid? • Where are the plates?
3. What do the layers of Earth have to do with Plate Tectonics? Explain your idea using as much evidence as you can.
__________________________________________________________________________ __________________________________________________________________________ __________________________________________________________________________ __________________________________________________________________________ __________________________________________________________________________ __________________________________________________________________________ __________________________________________________________________________
STUDENT PAGE
Layers of Earth(continued)
Name: ____________________________________________
Date: _____________________________________________
Student Page 6.2A Continued

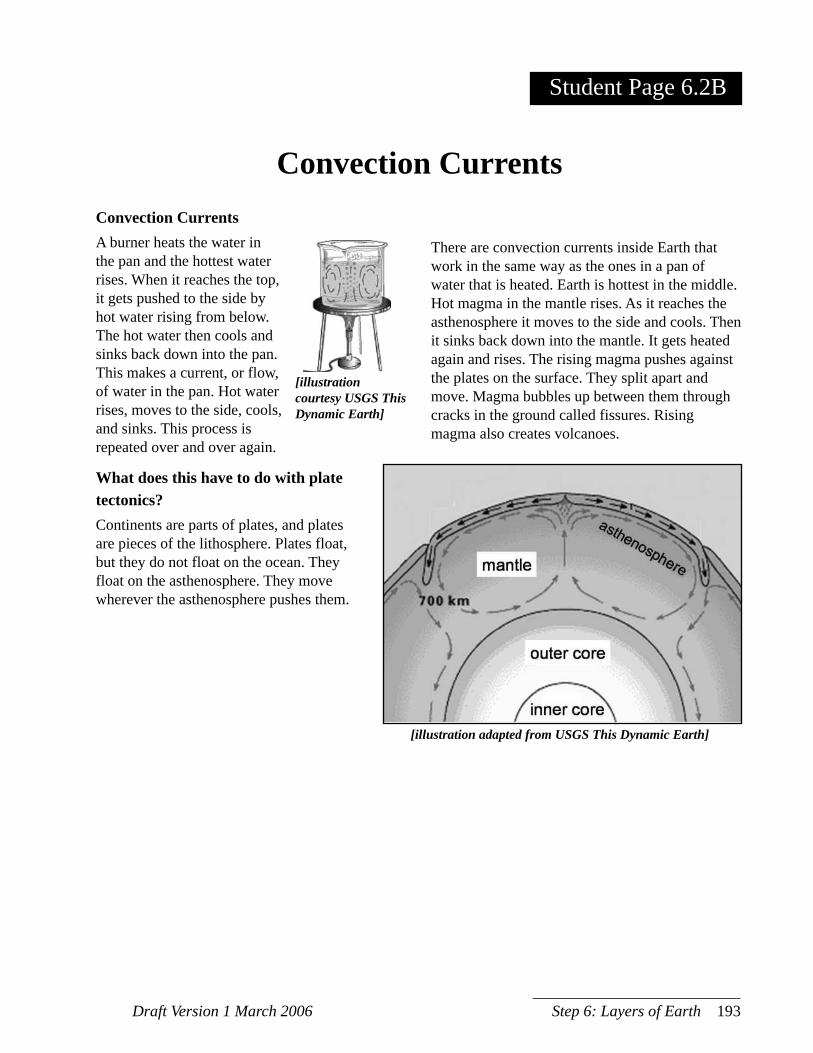
Draft Version 1 March 2006 Step 6: Layers of Earth 193
Convection CurrentsA burner heats the water in the pan and the hottest water rises. When it reaches the top, it gets pushed to the side by hot water rising from below. The hot water then cools and sinks back down into the pan. This makes a current, or flow, of water in the pan. Hot water rises, moves to the side, cools, and sinks. This process is repeated over and over again.
What does this have to do with plate tectonics?Continents are parts of plates, and plates are pieces of the lithosphere. Plates float, but they do not float on the ocean. They float on the asthenosphere. They move wherever the asthenosphere pushes them.
There are convection currents inside Earth that work in the same way as the ones in a pan of water that is heated. Earth is hottest in the middle. Hot magma in the mantle rises. As it reaches the asthenosphere it moves to the side and cools. Then it sinks back down into the mantle. It gets heated again and rises. The rising magma pushes against the plates on the surface. They split apart and move. Magma bubbles up between them through cracks in the ground called fissures. Rising magma also creates volcanoes.
STUDENT READING
Convection Currents
[illustration courtesy USGS This Dynamic Earth]
[illustration adapted from USGS This Dynamic Earth]
Student Page 6.2B

Draft Version 1 March 2006 Step 6: Layers of Earth 195
Think and Write1. In your science notebook, draw a new diagram of Earth that is supported by all the evidence
you learned. Label it Idea # 4. Think about: • Where is Earth hottest?
• How does magma move inside Earth?
• How do plates move on the surface of Earth?
2. What do convection currents have to do with plate tectonics? Explain your idea using as much evidence as you can.
__________________________________________________________________________ __________________________________________________________________________ __________________________________________________________________________ __________________________________________________________________________ __________________________________________________________________________ __________________________________________________________________________ __________________________________________________________________________ __________________________________________________________________________ __________________________________________________________________________ __________________________________________________________________________ __________________________________________________________________________
STUDENT READING
Convection Currents(continued)
Name: ____________________________________________
Date: _____________________________________________
Student Page 6.2B Continued

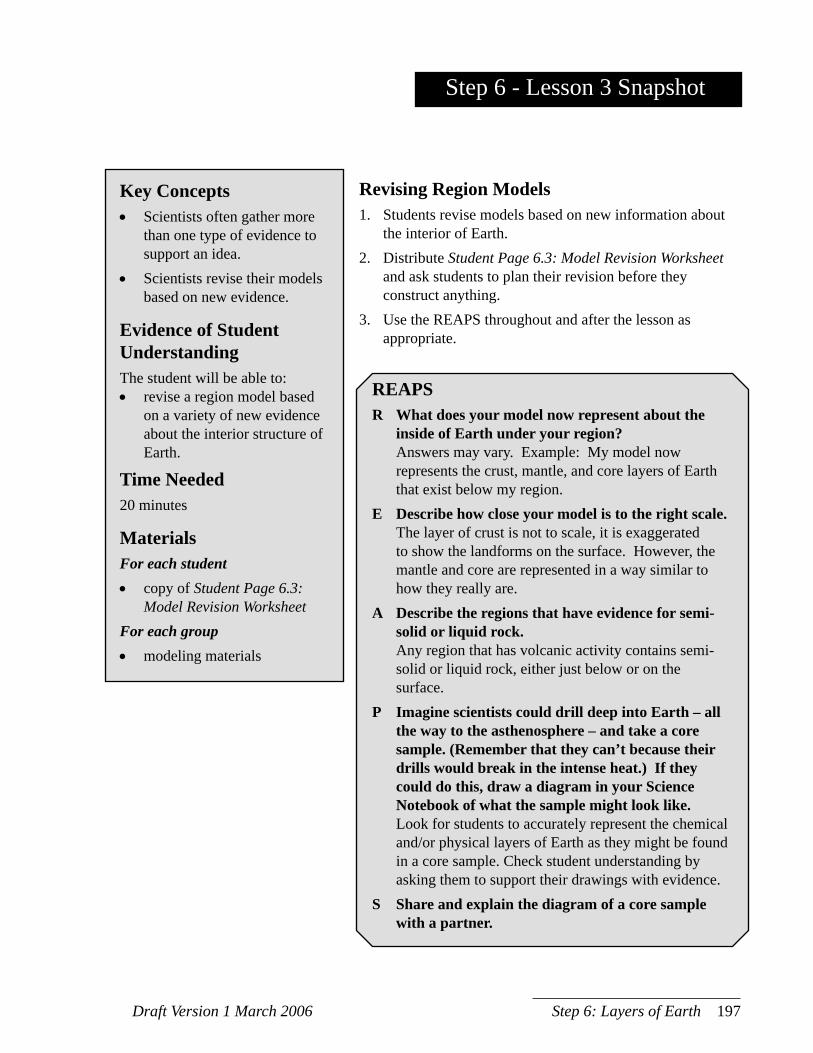
Draft Version 1 March 2006 Step 6: Layers of Earth 197
Step 6 - Lesson 3 Snapshot
Key Concepts• Scientists often gather more
than one type of evidence to support an idea.
• Scientists revise their models based on new evidence.
Evidence of Student UnderstandingThe student will be able to: • revise a region model based
on a variety of new evidence about the interior structure of Earth.
Time Needed20 minutes
MaterialsFor each student• copy of Student Page 6.3:
Model Revision WorksheetFor each group• modeling materials
Revising Region Models1. Students revise models based on new information about
the interior of Earth.2. Distribute Student Page 6.3: Model Revision Worksheet
and ask students to plan their revision before they construct anything.
3. Use the REAPS throughout and after the lesson as appropriate.
REAPSR What does your model now represent about the
inside of Earth under your region? Answers may vary. Example: My model now
represents the crust, mantle, and core layers of Earth that exist below my region.
E Describe how close your model is to the right scale. The layer of crust is not to scale, it is exaggerated
to show the landforms on the surface. However, the mantle and core are represented in a way similar to how they really are.
A Describe the regions that have evidence for semi-solid or liquid rock.
Any region that has volcanic activity contains semi-solid or liquid rock, either just below or on the surface.
P Imagine scientists could drill deep into Earth – all the way to the asthenosphere – and take a core sample. (Remember that they can’t because their drills would break in the intense heat.) If they could do this, draw a diagram in your Science Notebook of what the sample might look like.
Look for students to accurately represent the chemical and/or physical layers of Earth as they might be found in a core sample. Check student understanding by asking them to support their drawings with evidence.
S Share and explain the diagram of a core sample with a partner.
198 Exploring Earth’s Landforms Draft Version 1 March 2006
Background InformationSee Lesson 3.3 Background Information and Unit Overview for more information on revising a scientific model.
Implementation Guide1. Ask students to think about the main ideas
they have learned over the past two lessons. How can they model parts of Earth’s interior or its effects on their region?
2. Distribute Student Page 6.3: Model Revision Worksheet and ask students to plan their revision before they construct anything. Allow students time to revise their model based on the new evidence they have gathered.
3. Use the REAPS throughout and after the lesson as appropriate.
Advance PreparationPrepare modeling materials. Make sure you have adequate supplies for the students’ models.During this revision, students may show the three-dimensional structure of Earth beneath their region.

Draft Version 1 March 2006 Step 6: Layers of Earth 199
Description:What evidence are you using to revise your model?What materials are you going to use?What ideas or features are you revising and why?
____________________________________________________________________________________
____________________________________________________________________________________
____________________________________________________________________________________
____________________________________________________________________________________
____________________________________________________________________________________
____________________________________________________________________________________
____________________________________________________________________________________
____________________________________________________________________________________
____________________________________________________________________________________
STUDENT PAGE
Model Revision Worksheet
Name: ______________________________________________________
Date: _______________________________________________________
Region: _____________________________________________________
Legend
STUDENT PAGE Student Page 6.3A

This step is an application of students’ knowledge of plate movement, layers of Earth, and convection currents. They learn that new rocks are formed at divergent plate boundaries. At the same time, older crust is recycled back into the mantle in a process called subduction. Students work through a guided inquiry using new data and making connections to what they have already learned. The engaging idea is the question: What fills the gap at divergent plate boundaries? By now, students are building a coherent view of plate tectonics and getting used to using evidence to build explanations. This step reinforces that experience while providing another main idea: new surface rock is forming from material deep inside Earth while old crust moves back into the mantle at subduction zones. Students also should be able to make the connection back to the patterns they observed in Step 3 about how volcanic activity is more prevalent at these regions. Deep trenches also form at subduction zones and the plate remaining on top often contains mountains.
Lesson 7.1Divergent Plate Boundaries (40 min)
Lesson 7.2Evidence for Subduction (45 min)
Lesson 7.3Revising Region Models (20 min)
S T E P
7
Overview: Cycle of Rocks

Draft Version 1 March 2006 Step 7: Cycle of Rocks 203
Step 7 - Lesson 1 Snapshot
Key Concepts• Plate boundaries are
categorized as divergent, convergent, or transform.
• As plates diverge, new rocks fill the gap and older rocks move away from the plate boundary.
• Scientists usually gather more than one type of evidence to support an idea.
• Scientists often revise their models based on new evidence.
Evidence of Student UnderstandingThe student will be able to: • analyze data from a divergent
plate boundary simulation;• relate the data to geologic
information about where old and new rocks are found.
Time Needed40 minutes
MaterialsFor each group• 2 pencils (better if not
sharpened)• masking tape• 8x11 piece of paper cut in half
lengthwise• 2 markers or felt tip pens
(crayons will not work)• clock with second hand or
stopwatchFor each student• copy of Student Page 7.1:
Divergent Plate Boundaries
Divergent Plate Boundaries1. Ask students to draw pictures in their Science Notebooks of
all types of plate boundaries they know. Ask for examples of different kinds of plate boundaries they know and draw diagrams of them on the board. Ask students to list next to each boundary type what kinds of landforms they think are found there. Ask students to explain what they think happens at divergent boundaries and write it down or draw a picture in their Science Notebook. Explain that this investigation provides evidence to answer the question, “Where are the newest and oldest rocks near a divergent plate boundary?”
2. Divide students into small groups. Have each group share their ideas about what fills the gap at divergent plate boundaries and what the ages of the rocks are near these boundaries. Provide each team with the supplies for the activity and Student Page 7.1: Divergent Plate Boundaries. Allow students time to complete the activity and analyze their data.
3. Use the REAPS throughout and after the lesson as appropriate.
REAPSR Where were the oldest marks on the paper? Toward the edges, away from where it came between the
pencils.E Where does new rock come from to fill the gap between
diverging plates? Magma rises from the mantle/asthenosphere.A What do the old marks on the paper tell you about
where the oldest rocks on an ocean plate are? Toward the edges of the ocean plates (near coastlines),
away from the middle of the oceans.P Where do you think you will find divergent plate
boundaries in the world regions our class is studying? Answers will vary. While this is a Predict question since
it asks students to think about something they have not yet studied, the region around Iceland represents such a boundary and this is supported with evidence from GPS measurements of the plate motions in that region. Some students may begin to recognize the possibility that different regions have different boundary types.
S In your Science Notebook, make a list of questions you still have about plate boundaries.
204 Exploring Earth’s Landforms Draft Version 1 March 2006
Background InformationThere are three main types of plate boundaries: divergent, convergent, and transform. Divergent plate boundaries are explored in this lesson to find out what fills the “gap” left when two plates move apart. In fact, there is never really a gap since magma from deep within Earth is forced up at divergent boundaries and new rock is created. Good examples of divergent plate boundaries today include the regions of Iceland (part of the mid-Atlantic spreading center) and East Africa (a diverging boundary occurring on land, rather than under the ocean).
Implementation Guide1. Review the main ideas from earlier steps.
Tell students that they have seen how the earth moves both suddenly and slowly. They have developed an explanation of where the continents used to be located and how convection currents inside Earth cause plates to move. Review the three types of plate interactions: divergent, convergent, and transform. To do this, you may have students move pencils on their desk, draw diagrams on the board, or do a class demonstration. One option is to ask two students to come to the front of the room and model plate interactions. Have them stand facing each other with their palms facing each other about 1” apart. For divergent plates, have them walk away from each other. Now, have them model convergent plates. Have them push against each other’s palms. What happens?• One student may push harder than another,
pushing the other student away.• Both may push at about the same strength
and their palms may rise together.• One student may push harder and their
palms may come up over the top of the other student.
Finally, have them model transform plates. Have them move sideways, parallel to each other. They could move either in the same
direction at different speeds or in opposite directions. Remind the class of what happens when the students model divergent plates. They move away from each other. When plates diverge, is a giant hole left in the crust? What do students think fills that gap? Have students make a drawing in their Science Notebooks of what they think might be happening. They
should show what direction the plates are moving and what they think fills the gap. Remind them that they can look back at the diagram they made of Earth in Step 6 for evidence. Ask the class to look at their diagrams to try to answer these questions: • If your diagram is correct, where do you think
the newest rock would be? • Where do you think the oldest rock would be?
Have students label where they think the oldest rock and newest rock are. Explain that through this investigation they will discover more evidence that will allow them to revise and test their explanation of what fills the gap.
2. Divide students into small groups. Instruct each group to share their ideas about what fills the gap and where the new and old rocks are located. Students can revise their ideas if they see something on another student’s diagram that makes sense to them. Explain that they will need to complete an activity and then use this as evidence for their ideas. Provide each group with 2 pencils, a piece of letter-size paper, cut in half lengthwise, and masking tape. Each student will need Student Page 7.1: Divergent Plate Boundaries. Ask students to follow the directions on the student page. Have them work as a group to complete the activity and analyze their data. Travel around the room and assist students as needed.
3. Use the REAPS throughout and after the lesson as appropriate.
Advance PreparationCut one piece of letter-size paper in half lengthwise for each group. The smoother the edges, the easier it will slide through the pencils.
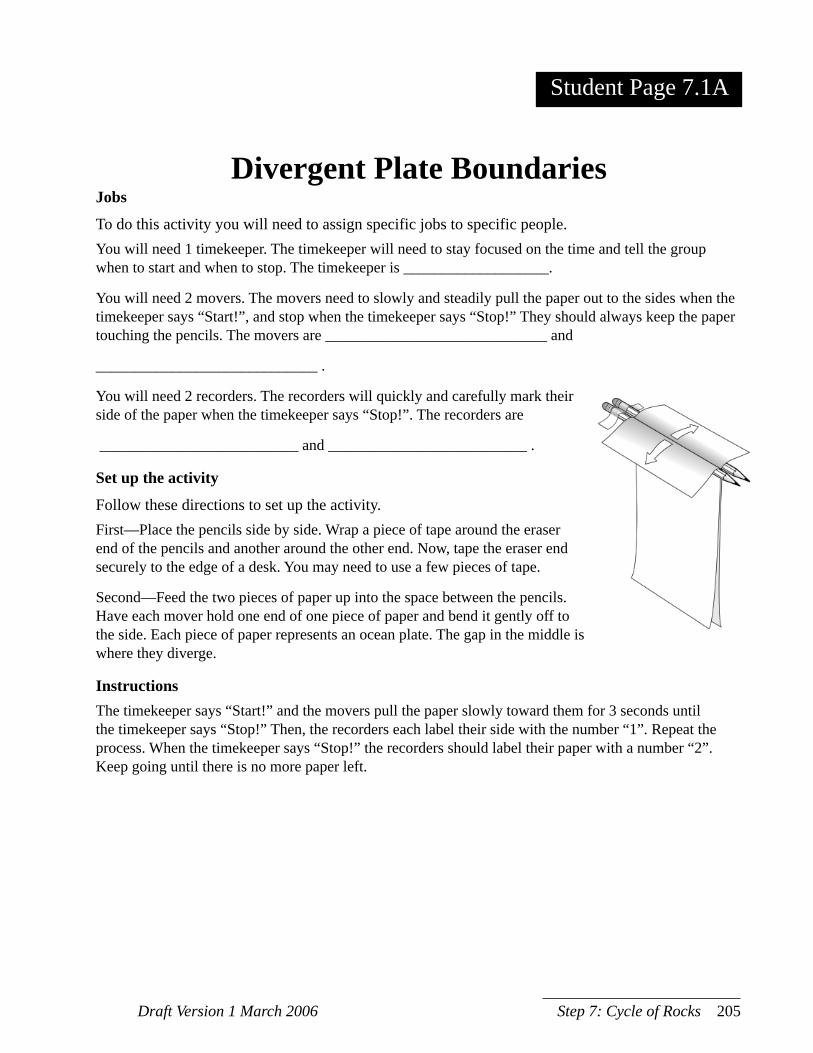
Draft Version 1 March 2006 Step 7: Cycle of Rocks 205
Jobs
To do this activity you will need to assign specific jobs to specific people. You will need 1 timekeeper. The timekeeper will need to stay focused on the time and tell the group when to start and when to stop. The timekeeper is ___________________.
You will need 2 movers. The movers need to slowly and steadily pull the paper out to the sides when the timekeeper says “Start!”, and stop when the timekeeper says “Stop!” They should always keep the paper touching the pencils. The movers are _____________________________ and
_____________________________ .
You will need 2 recorders. The recorders will quickly and carefully mark their side of the paper when the timekeeper says “Stop!”. The recorders are
__________________________ and __________________________ .
Set up the activity
Follow these directions to set up the activity. First—Place the pencils side by side. Wrap a piece of tape around the eraser end of the pencils and another around the other end. Now, tape the eraser end securely to the edge of a desk. You may need to use a few pieces of tape.
Second—Feed the two pieces of paper up into the space between the pencils. Have each mover hold one end of one piece of paper and bend it gently off to the side. Each piece of paper represents an ocean plate. The gap in the middle is where they diverge.
InstructionsThe timekeeper says “Start!” and the movers pull the paper slowly toward them for 3 seconds until the timekeeper says “Stop!” Then, the recorders each label their side with the number “1”. Repeat the process. When the timekeeper says “Stop!” the recorders should label their paper with a number “2”. Keep going until there is no more paper left.
STUDENT PAGE
Divergent Plate Boundaries
Student Page 7.1A

Draft Version 1 March 2006 Step 7: Cycle of Rocks 207
Analyze the dataHow many seconds did it take to finish moving the paper through the gap between the pencils? ________
How old is the first mark on the paper? ____________________________________________________
How old is the last mark on the paper? _____________________________________________________
Connect the data to ocean plates
Think about what this activity represents. The paper represents the plates. Plates are made of rock. The two pieces of paper, like the plates, diverge at the plate boundary. What does this activity tell you about the following questions?
Where is the oldest rock on an ocean plate compared to the plate boundary? ______________________
Where are the newest rocks on an ocean plate? ______________________________________________
Where does the new rock come from to fill the gap? __________________________________________
STUDENT PAGE
Divergent Plate Boundaries (continued)
Name: ____________________________________________
Date: _____________________________________________
Student Page 7.1A Continued

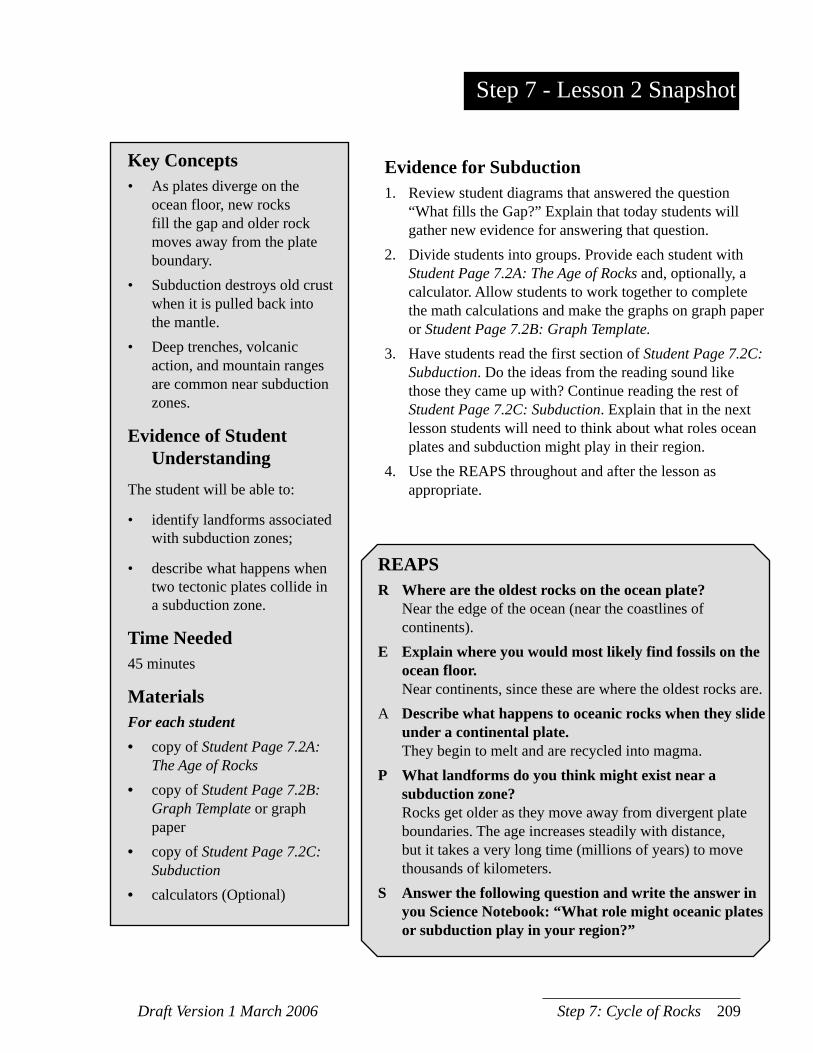
Draft Version 1 March 2006 Step 7: Cycle of Rocks 209
Step 7 - Lesson 2 Snapshot
Key Concepts• As plates diverge on the
ocean floor, new rocks fill the gap and older rock moves away from the plate boundary.
• Subduction destroys old crust when it is pulled back into the mantle.
• Deep trenches, volcanic action, and mountain ranges are common near subduction zones.
Evidence of Student Understanding
The student will be able to:
• identify landforms associated with subduction zones;
• describe what happens when two tectonic plates collide in a subduction zone.
Time Needed45 minutes
MaterialsFor each student• copy of Student Page 7.2A:
The Age of Rocks• copy of Student Page 7.2B:
Graph Template or graph paper
• copy of Student Page 7.2C: Subduction
• calculators (Optional)
Evidence for Subduction1. Review student diagrams that answered the question
“What fills the Gap?” Explain that today students will gather new evidence for answering that question.
2. Divide students into groups. Provide each student with Student Page 7.2A: The Age of Rocks and, optionally, a calculator. Allow students to work together to complete the math calculations and make the graphs on graph paper or Student Page 7.2B: Graph Template.
3. Have students read the first section of Student Page 7.2C: Subduction. Do the ideas from the reading sound like those they came up with? Continue reading the rest of Student Page 7.2C: Subduction. Explain that in the next lesson students will need to think about what roles ocean plates and subduction might play in their region.
4. Use the REAPS throughout and after the lesson as appropriate.
REAPSR Where are the oldest rocks on the ocean plate? Near the edge of the ocean (near the coastlines of
continents).E Explain where you would most likely find fossils on the
ocean floor. Near continents, since these are where the oldest rocks are. A Describe what happens to oceanic rocks when they slide
under a continental plate. They begin to melt and are recycled into magma.P What landforms do you think might exist near a
subduction zone? Rocks get older as they move away from divergent plate
boundaries. The age increases steadily with distance, but it takes a very long time (millions of years) to move thousands of kilometers.
S Answer the following question and write the answer in you Science Notebook: “What role might oceanic plates or subduction play in your region?”
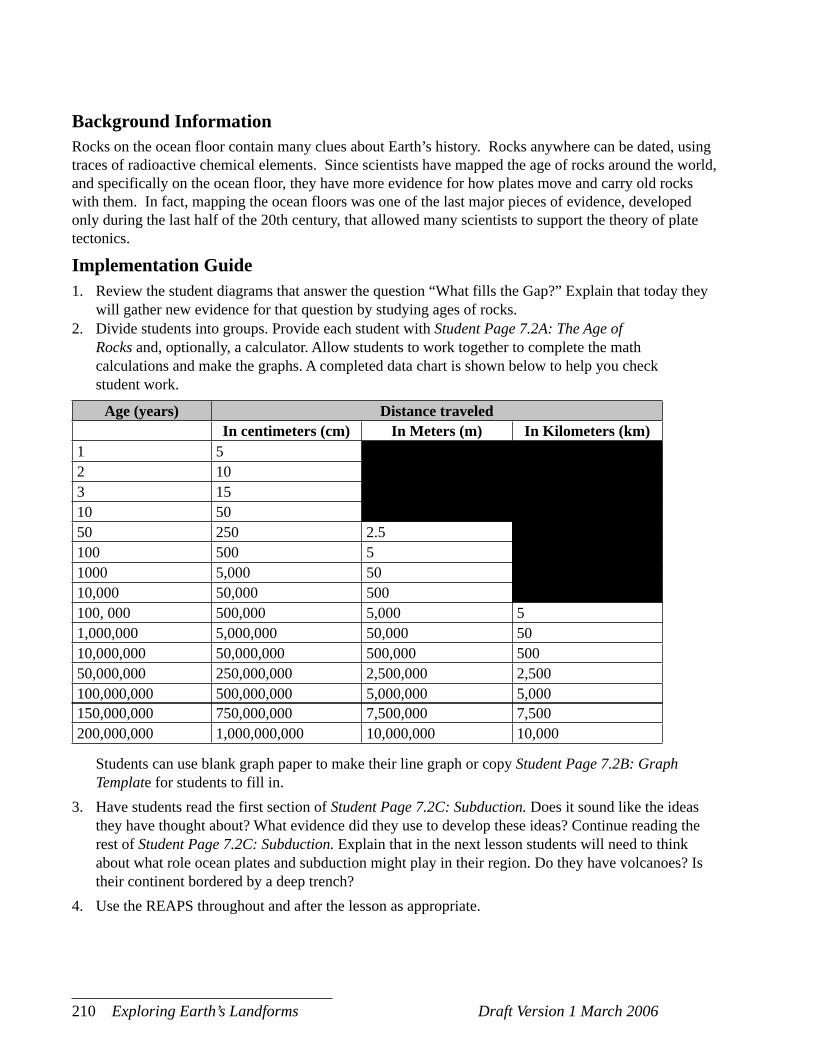
210 Exploring Earth’s Landforms Draft Version 1 March 2006
Background InformationRocks on the ocean floor contain many clues about Earth’s history. Rocks anywhere can be dated, using traces of radioactive chemical elements. Since scientists have mapped the age of rocks around the world, and specifically on the ocean floor, they have more evidence for how plates move and carry old rocks with them. In fact, mapping the ocean floors was one of the last major pieces of evidence, developed only during the last half of the 20th century, that allowed many scientists to support the theory of plate tectonics.
Implementation Guide1. Review the student diagrams that answer the question “What fills the Gap?” Explain that today they
will gather new evidence for that question by studying ages of rocks. 2. Divide students into groups. Provide each student with Student Page 7.2A: The Age of
Rocks and, optionally, a calculator. Allow students to work together to complete the math calculations and make the graphs. A completed data chart is shown below to help you check student work.
Age (years) Distance traveled In centimeters (cm) In Meters (m) In Kilometers (km)
1 52 103 1510 5050 250 2.5100 500 51000 5,000 5010,000 50,000 500100, 000 500,000 5,000 51,000,000 5,000,000 50,000 5010,000,000 50,000,000 500,000 50050,000,000 250,000,000 2,500,000 2,500100,000,000 500,000,000 5,000,000 5,000150,000,000 750,000,000 7,500,000 7,500200,000,000 1,000,000,000 10,000,000 10,000
Students can use blank graph paper to make their line graph or copy Student Page 7.2B: Graph Template for students to fill in.
3. Have students read the first section of Student Page 7.2C: Subduction. Does it sound like the ideas they have thought about? What evidence did they use to develop these ideas? Continue reading the rest of Student Page 7.2C: Subduction. Explain that in the next lesson students will need to think about what role ocean plates and subduction might play in their region. Do they have volcanoes? Is their continent bordered by a deep trench?
4. Use the REAPS throughout and after the lesson as appropriate.
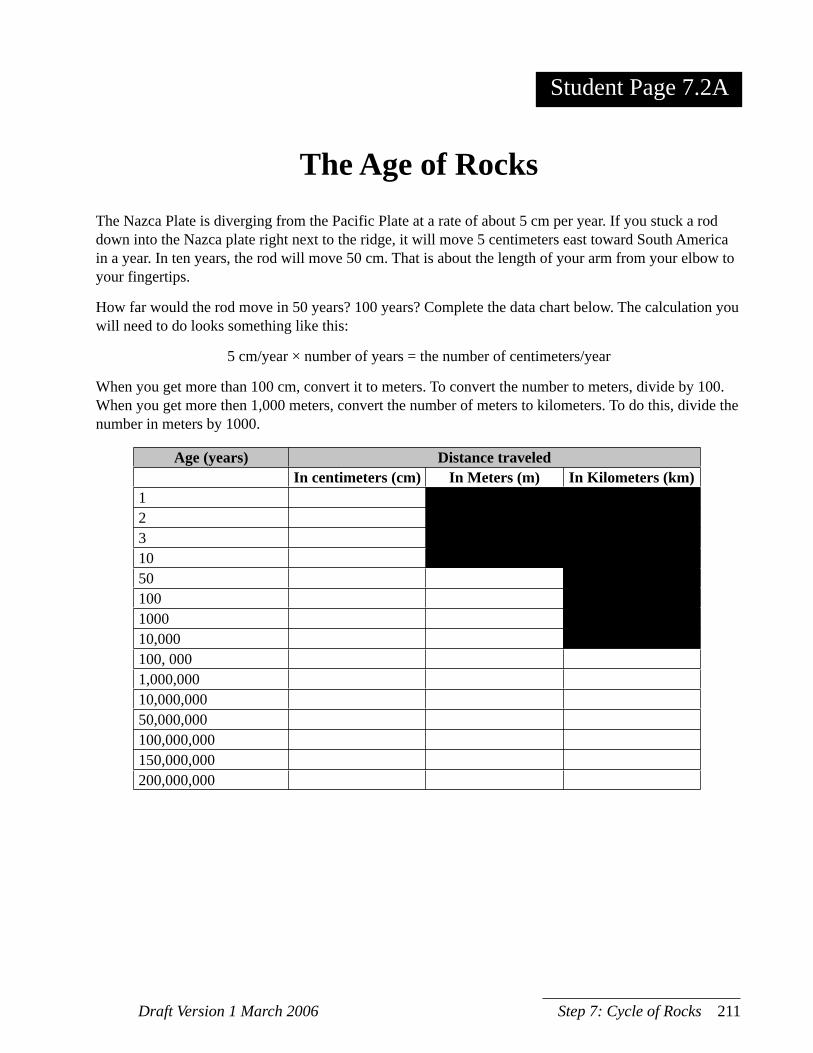
Draft Version 1 March 2006 Step 7: Cycle of Rocks 211
The Nazca Plate is diverging from the Pacific Plate at a rate of about 5 cm per year. If you stuck a rod down into the Nazca plate right next to the ridge, it will move 5 centimeters east toward South America in a year. In ten years, the rod will move 50 cm. That is about the length of your arm from your elbow to your fingertips.
How far would the rod move in 50 years? 100 years? Complete the data chart below. The calculation you will need to do looks something like this:
5 cm/year × number of years = the number of centimeters/year
When you get more than 100 cm, convert it to meters. To convert the number to meters, divide by 100. When you get more then 1,000 meters, convert the number of meters to kilometers. To do this, divide the number in meters by 1000.
STUDENT PAGE
The Age of Rocks
Age (years) Distance traveled In centimeters (cm) In Meters (m) In Kilometers (km)
1231050100100010,000100, 0001,000,00010,000,00050,000,000100,000,000150,000,000200,000,000
Student Page 7.2A

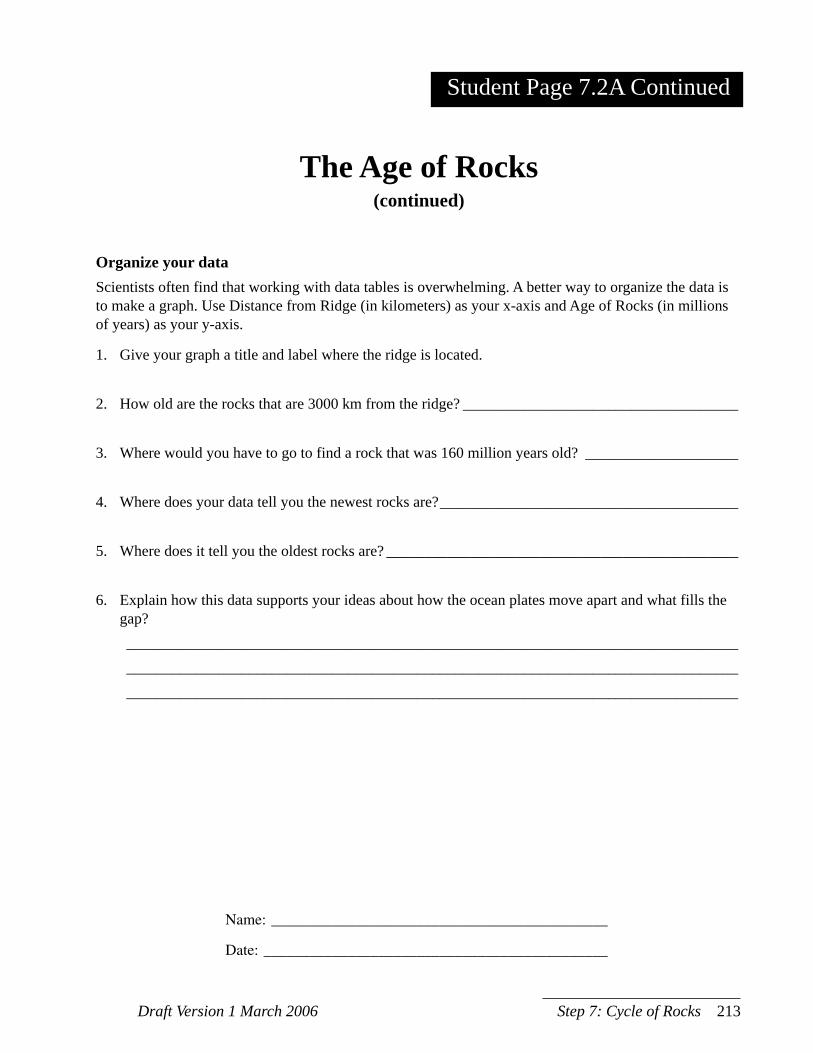
Draft Version 1 March 2006 Step 7: Cycle of Rocks 213
Organize your dataScientists often find that working with data tables is overwhelming. A better way to organize the data is to make a graph. Use Distance from Ridge (in kilometers) as your x-axis and Age of Rocks (in millions of years) as your y-axis.
1. Give your graph a title and label where the ridge is located.
2. How old are the rocks that are 3000 km from the ridge? ____________________________________
3. Where would you have to go to find a rock that was 160 million years old? ____________________
4. Where does your data tell you the newest rocks are? _______________________________________
5. Where does it tell you the oldest rocks are? ______________________________________________ 6. Explain how this data supports your ideas about how the ocean plates move apart and what fills the
gap? ________________________________________________________________________________ ________________________________________________________________________________ ________________________________________________________________________________
STUDENT PAGE
The Age of Rocks (continued)
Student Page 7.2A Continued

Draft Version 1 March 2006 Step 7: Cycle of Rocks 215
Graph Title:
STUDENT PAGE
Graph Template
Distance from Ridge (kilometers)
Age
(mill
ions
of y
ears
)
10
30
50
70
90
110
130
150
170
190
210
500 1,500 2,500 3,500 4,500 5,500 6,500 7,500 8,500 9,500
Student Page 7.2B

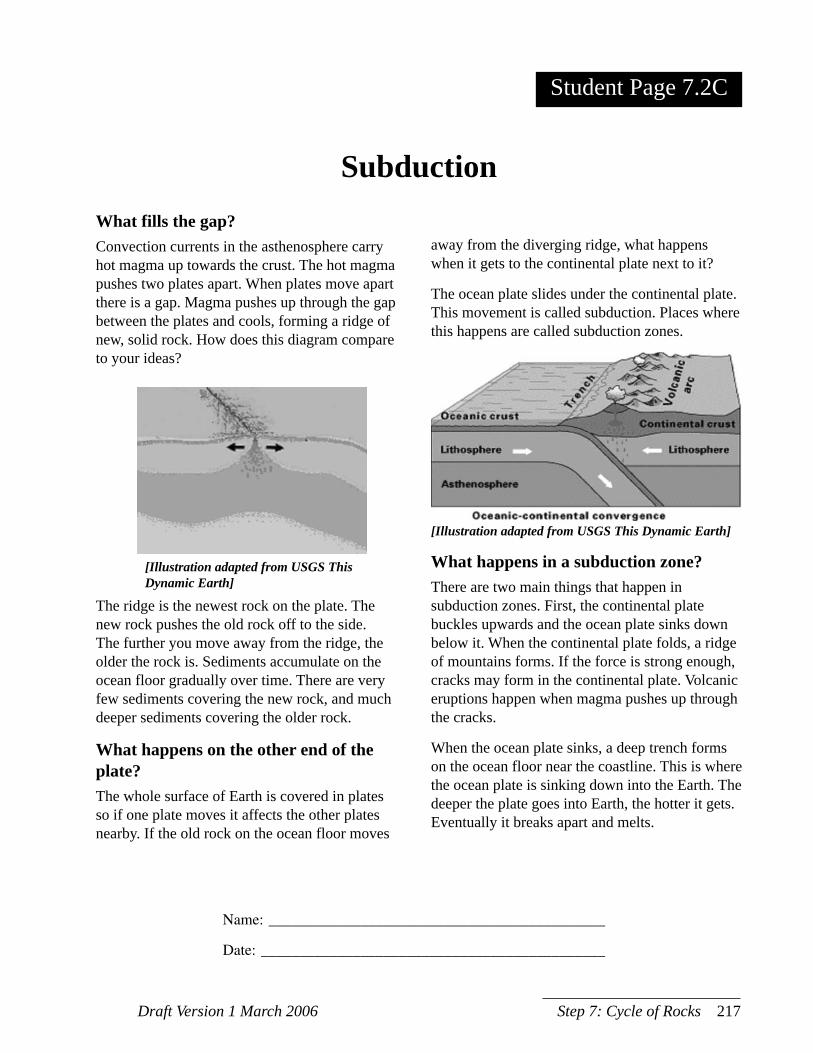
Draft Version 1 March 2006 Step 7: Cycle of Rocks 217
What fills the gap?Convection currents in the asthenosphere carry hot magma up towards the crust. The hot magma pushes two plates apart. When plates move apart there is a gap. Magma pushes up through the gap between the plates and cools, forming a ridge of new, solid rock. How does this diagram compare to your ideas?
away from the diverging ridge, what happens when it gets to the continental plate next to it?
The ocean plate slides under the continental plate. This movement is called subduction. Places where this happens are called subduction zones.
STUDENT PAGE
Subduction
[Illustration adapted from USGS This Dynamic Earth]
The ridge is the newest rock on the plate. The new rock pushes the old rock off to the side. The further you move away from the ridge, the older the rock is. Sediments accumulate on the ocean floor gradually over time. There are very few sediments covering the new rock, and much deeper sediments covering the older rock.
What happens on the other end of the plate?The whole surface of Earth is covered in plates so if one plate moves it affects the other plates nearby. If the old rock on the ocean floor moves
[Illustration adapted from USGS This Dynamic Earth]
What happens in a subduction zone?There are two main things that happen in subduction zones. First, the continental plate buckles upwards and the ocean plate sinks down below it. When the continental plate folds, a ridge of mountains forms. If the force is strong enough, cracks may form in the continental plate. Volcanic eruptions happen when magma pushes up through the cracks.
When the ocean plate sinks, a deep trench forms on the ocean floor near the coastline. This is where the ocean plate is sinking down into the Earth. The deeper the plate goes into Earth, the hotter it gets. Eventually it breaks apart and melts.
Student Page 7.2C

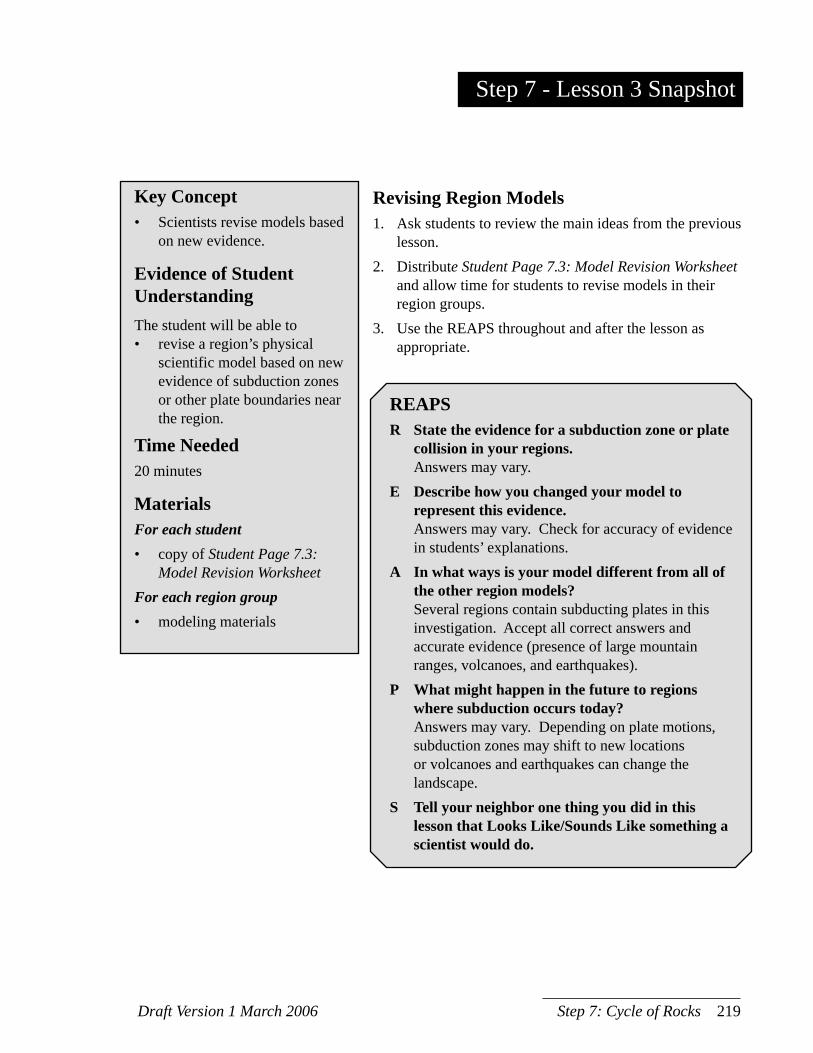
Draft Version 1 March 2006 Step 7: Cycle of Rocks 219
Step 7 - Lesson 3 Snapshot
Key Concept• Scientists revise models based
on new evidence.
Evidence of Student UnderstandingThe student will be able to• revise a region’s physical
scientific model based on new evidence of subduction zones or other plate boundaries near the region.
Time Needed20 minutes
MaterialsFor each student• copy of Student Page 7.3:
Model Revision WorksheetFor each region group• modeling materials
Revising Region Models1. Ask students to review the main ideas from the previous
lesson. 2. Distribute Student Page 7.3: Model Revision Worksheet
and allow time for students to revise models in their region groups.
3. Use the REAPS throughout and after the lesson as appropriate.
REAPSR State the evidence for a subduction zone or plate
collision in your regions. Answers may vary.E Describe how you changed your model to
represent this evidence. Answers may vary. Check for accuracy of evidence
in students’ explanations.A In what ways is your model different from all of
the other region models? Several regions contain subducting plates in this
investigation. Accept all correct answers and accurate evidence (presence of large mountain ranges, volcanoes, and earthquakes).
P What might happen in the future to regions where subduction occurs today?
Answers may vary. Depending on plate motions, subduction zones may shift to new locations or volcanoes and earthquakes can change the landscape.
S Tell your neighbor one thing you did in this lesson that Looks Like/Sounds Like something a scientist would do.
220 Exploring Earth’s Landforms Draft Version 1 March 2006
Background InformationSee Lesson 3.3 Background Information and Unit Overview for more information on revising a scientific model.
Implementation Guide1. Ask students to think about the main ideas of
subduction zones and the rock cycle. They will need to revise their model based on the new evidence they uncovered. Allow the groups to revise their models accordingly.
2. Distribute Student Page 7.3: Model Revision Worksheet as before and allow time for students to revise models in their region groups. If students have evidence for divergent, convergent, or transform plate boundaries in their region they can indicate this on the model. They can also indicate processes like subduction if it occurs in their region. Encourage students to share their ideas and begin to note similarities and differences between the regions, including California. The next step will have students presenting their models to each other.
3. Use the REAPS throughout and after the lesson as appropriate.
Advance PreparationPrepare modeling materials. Make sure you have adequate supplies for the students’ models.
During this revision, students may show the influence of plate boundaries on their region.
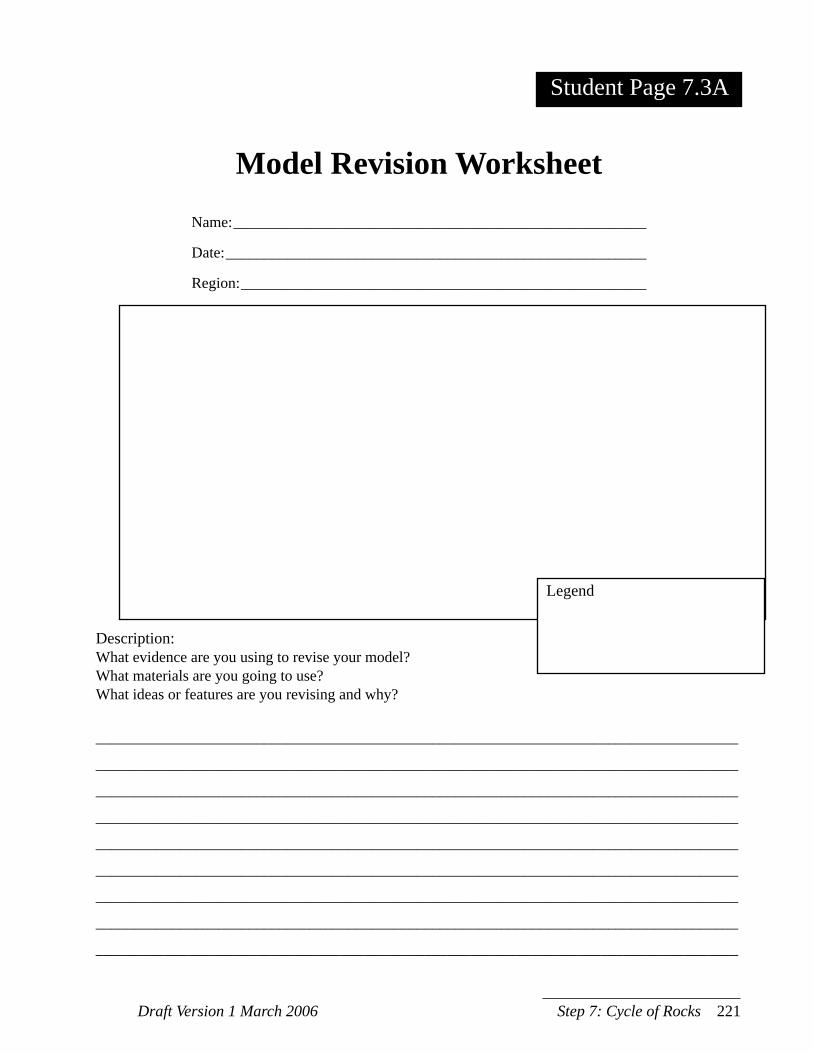
Draft Version 1 March 2006 Step 7: Cycle of Rocks 221
Description:What evidence are you using to revise your model?What materials are you going to use?What ideas or features are you revising and why?
____________________________________________________________________________________
____________________________________________________________________________________
____________________________________________________________________________________
____________________________________________________________________________________
____________________________________________________________________________________
____________________________________________________________________________________
____________________________________________________________________________________
____________________________________________________________________________________
____________________________________________________________________________________
STUDENT PAGE
Model Revision Worksheet
Name: ______________________________________________________
Date: _______________________________________________________
Region: _____________________________________________________
Legend
STUDENT PAGEStudent Page 7.3A

S T E P
8Overview:
Showcasing and Explaining Earth’s LandformsThis step provides an opportunity for students to evaluate and apply their understanding of one of this Unit’s key concepts: Plate tectonics is one way of explaining landforms, changing features and catastrophic events of Earth’s surface.
There are three lessons in this step. Students present their models in the first lesson to share important information about different types of plate boundaries and their associated landforms.
The second and third lessons involve students in evaluating information about each other’s models and the teacher’s model. Students apply what they have learned to two interesting geologic features: the Sierra-Nevada mountain range and the San Andreas Fault, both prominent features of California.
Using the evidence presented, students compare and contrast the region models presented in the first lesson to the California landform evidence provided. From that comparison, students develop an evidence-based, logical explanation for how the assigned landform developed.
In Lesson 8.2, students look at maps with evidence about the formation of the Sierra Nevada range. Students use a graphic organizer called a Frayer Model to chart how they would explain that mountain range’s formation, using evidence from other world regions. In Lesson 8.3, students examine evidence about earthquake activity and plate boundaries in present-day California. Again, students analyze the given evidence in light of the world region models to develop an explanation for the boundary movement and earthquake data.
This step provides a summative assessment opportunity that uses both small group and individual accountability strategies. The first lesson provides an opportunity for students to present their region models and learn from each other in a whole-class grouping about the key tectonic features represented in each region. The second lesson is completed in small groups, allowing for a level of formative assessment and additional instruction before the next lesson’s individual assessment. The third lesson guides students individually to write an essay to show their understanding of and ability to apply key concepts from the unit. This step also provides the teacher with an opportunity to assess student learning of major concepts before moving on to look at other possible explanations for Earth’s landforms and (in the final step) Wisconsin’s landforms. In these last two steps, students use the knowledge they have gained thus far to explain new and interesting landforms.
Lesson 8.1Model Showcase (50 min)
Lesson 8.2Explaining Mountains (50 min)
Lesson 8.3Comparing World Regions (50 min)

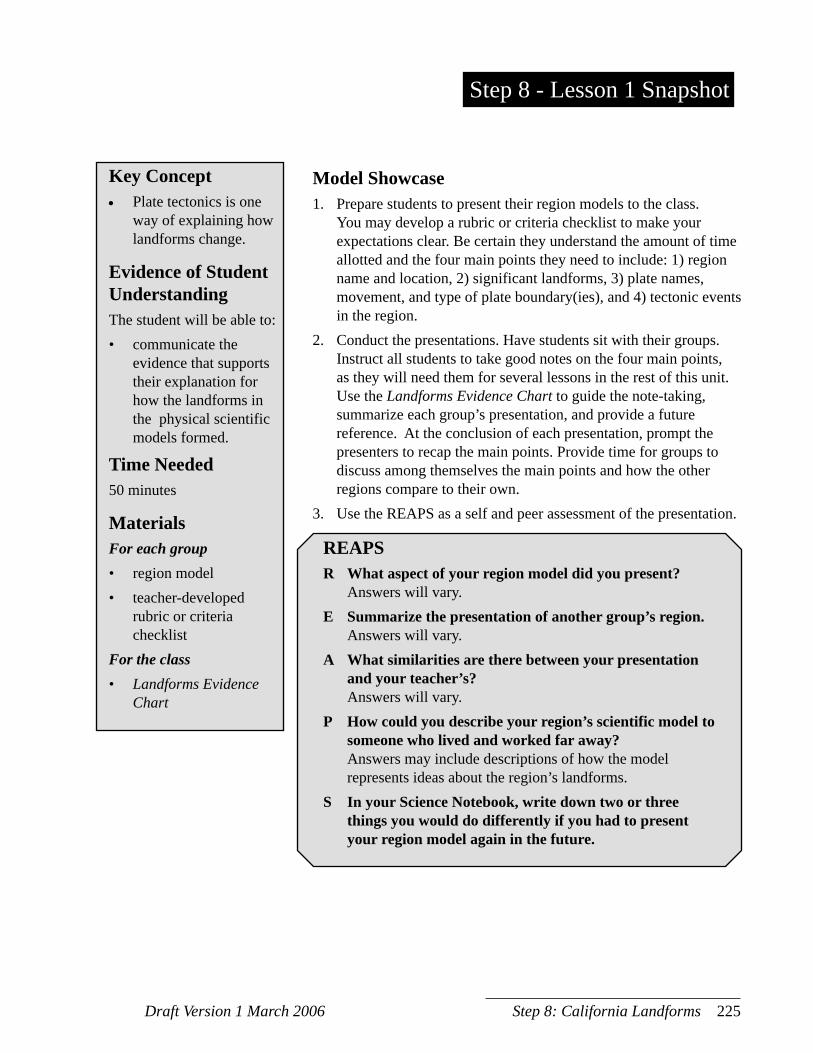
Draft Version 1 March 2006 Step 8: California Landforms 225
Step 8 - Lesson 1 Snapshot
Key Concept• Plate tectonics is one
way of explaining how landforms change.
Evidence of Student UnderstandingThe student will be able to: • communicate the
evidence that supports their explanation for how the landforms in the physical scientific models formed.
Time Needed50 minutes
MaterialsFor each group• region model• teacher-developed
rubric or criteria checklist
For the class• Landforms Evidence
Chart
Model Showcase1. Prepare students to present their region models to the class.
You may develop a rubric or criteria checklist to make your expectations clear. Be certain they understand the amount of time allotted and the four main points they need to include: 1) region name and location, 2) significant landforms, 3) plate names, movement, and type of plate boundary(ies), and 4) tectonic events in the region.
2. Conduct the presentations. Have students sit with their groups. Instruct all students to take good notes on the four main points, as they will need them for several lessons in the rest of this unit. Use the Landforms Evidence Chart to guide the note-taking, summarize each group’s presentation, and provide a future reference. At the conclusion of each presentation, prompt the presenters to recap the main points. Provide time for groups to discuss among themselves the main points and how the other regions compare to their own.
3. Use the REAPS as a self and peer assessment of the presentation.
REAPSR What aspect of your region model did you present? Answers will vary.E Summarize the presentation of another group’s region. Answers will vary.A What similarities are there between your presentation
and your teacher’s? Answers will vary.P How could you describe your region’s scientific model to
someone who lived and worked far away? Answers may include descriptions of how the model
represents ideas about the region’s landforms.S In your Science Notebook, write down two or three
things you would do differently if you had to present your region model again in the future.
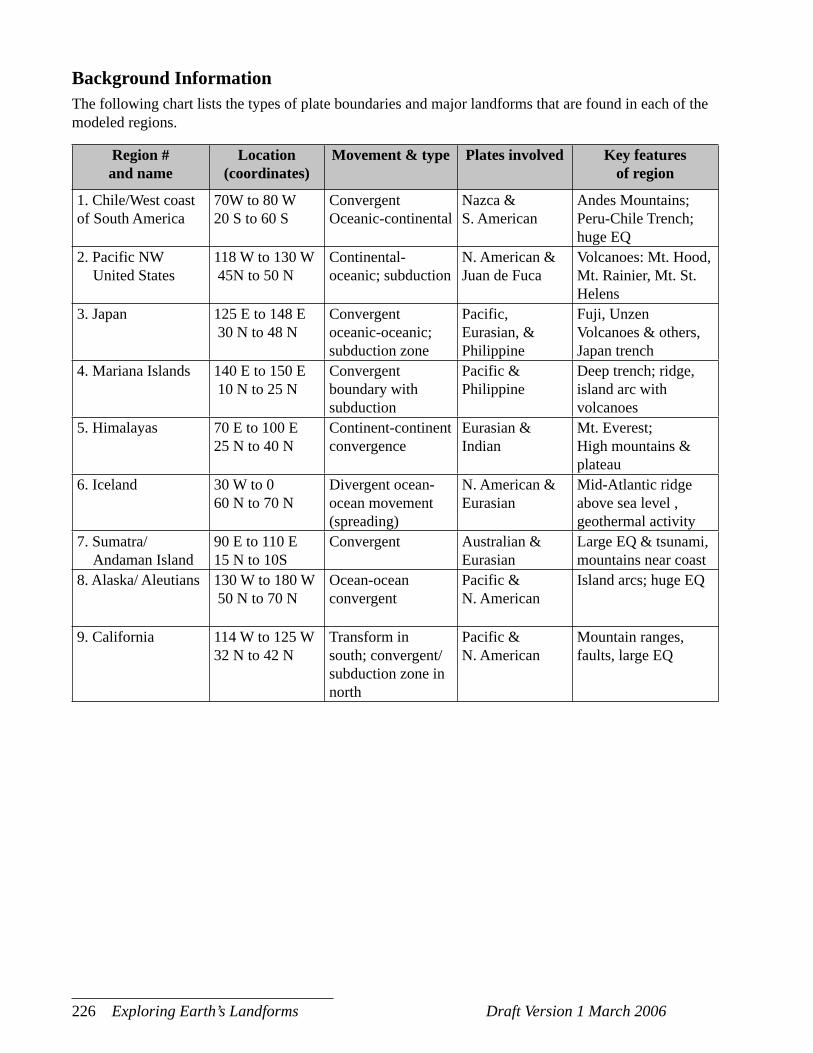
226 Exploring Earth’s Landforms Draft Version 1 March 2006
Background InformationThe following chart lists the types of plate boundaries and major landforms that are found in each of the modeled regions.
Region # and name
Location(coordinates)
Movement & type Plates involved Key features of region
1. Chile/West coast of South America
70W to 80 W20 S to 60 S
ConvergentOceanic-continental
Nazca & S. American
Andes Mountains; Peru-Chile Trench; huge EQ
2. Pacific NW United States
118 W to 130 W 45N to 50 N
Continental-oceanic; subduction
N. American & Juan de Fuca
Volcanoes: Mt. Hood, Mt. Rainier, Mt. St. Helens
3. Japan 125 E to 148 E 30 N to 48 N
Convergent oceanic-oceanic; subduction zone
Pacific, Eurasian, & Philippine
Fuji, Unzen Volcanoes & others, Japan trench
4. Mariana Islands 140 E to 150 E 10 N to 25 N
Convergent boundary with subduction
Pacific & Philippine
Deep trench; ridge, island arc with volcanoes
5. Himalayas 70 E to 100 E25 N to 40 N
Continent-continent convergence
Eurasian & Indian
Mt. Everest;High mountains & plateau
6. Iceland 30 W to 060 N to 70 N
Divergent ocean-ocean movement (spreading)
N. American & Eurasian
Mid-Atlantic ridge above sea level , geothermal activity
7. Sumatra/ Andaman Island
90 E to 110 E15 N to 10S
Convergent Australian & Eurasian
Large EQ & tsunami, mountains near coast
8. Alaska/ Aleutians 130 W to 180 W 50 N to 70 N
Ocean-ocean convergent
Pacific & N. American
Island arcs; huge EQ
9. California 114 W to 125 W32 N to 42 N
Transform in south; convergent/subduction zone in north
Pacific & N. American
Mountain ranges, faults, large EQ
Draft Version 1 March 2006 Step 8: California Landforms 227
Implementation Guide1. Explain that students will present to the class
the region models they have been working with throughout the unit. The goal of this is more than just sharing what they have built or how they built it. They are responsible for teaching the other students about their region. Provide them with specific evaluating criteria in the form of a rubric or checklist. Explain that each group will have 2–3 minutes (longer if you prefer) to teach the other students about four main points for their region. While students may include additional information about their reading during the presentation, the focus should remain on the four main points. Review each of the four main points:• name and location of the region that they
modeled• significant landforms in their region• type of plate boundary(ies) found in the
region, including the direction plates are moving (students need to use terms
Advance Preparation
Prepare students for their presentations. Students need to realize in advance that they will be teaching and learning key information during this lesson that will be needed in subsequent lessons. You might want to require students to practice their presentations outside of class before presenting to their peers in order to be better prepared. Developing a rubric or criteria checklist to clarify your expectations for the student presentations is a good idea. Provide this to students when they receive the assignment or earlier.
like oceanic plate, continental plate, convergent, transform, divergent, and subduction in their presentations when appropriate)
• tectonic events that occur in the region (earthquakes, volcanoes).
Allow students time to prepare their presentations.Prompt them with questions like:
• Who will say that?• When will each person speak?• How can you explain the movement of
those plates for the class?• How can you focus your presentation
more on the four main points rather than what you used to build your model?
Before presentations begin, explain that when students are not presenting, it is their responsibility to take detailed notes on the four main points for the region being presented. Remind students that they will need these notes
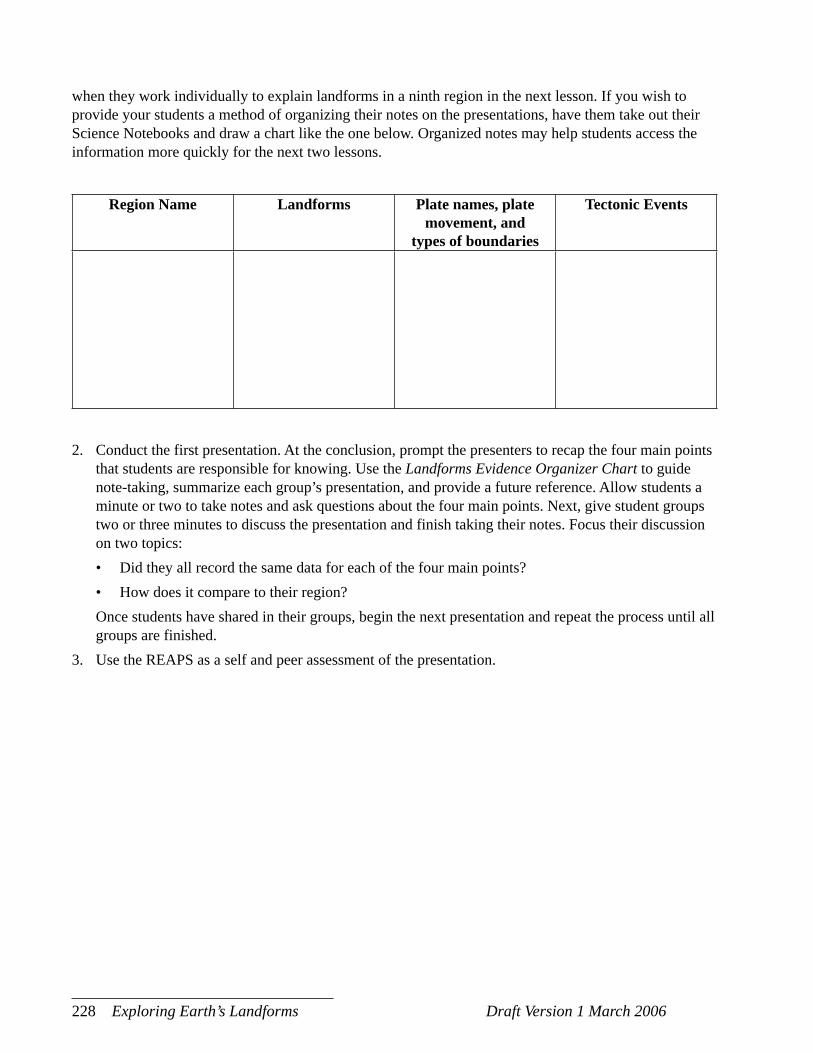
228 Exploring Earth’s Landforms Draft Version 1 March 2006
when they work individually to explain landforms in a ninth region in the next lesson. If you wish to provide your students a method of organizing their notes on the presentations, have them take out their Science Notebooks and draw a chart like the one below. Organized notes may help students access the information more quickly for the next two lessons.
2. Conduct the first presentation. At the conclusion, prompt the presenters to recap the four main points that students are responsible for knowing. Use the Landforms Evidence Organizer Chart to guide note-taking, summarize each group’s presentation, and provide a future reference. Allow students a minute or two to take notes and ask questions about the four main points. Next, give student groups two or three minutes to discuss the presentation and finish taking their notes. Focus their discussion on two topics:• Did they all record the same data for each of the four main points?• How does it compare to their region?
Once students have shared in their groups, begin the next presentation and repeat the process until all groups are finished.
3. Use the REAPS as a self and peer assessment of the presentation.
Region Name Landforms Plate names, plate movement, and
types of boundaries
Tectonic Events
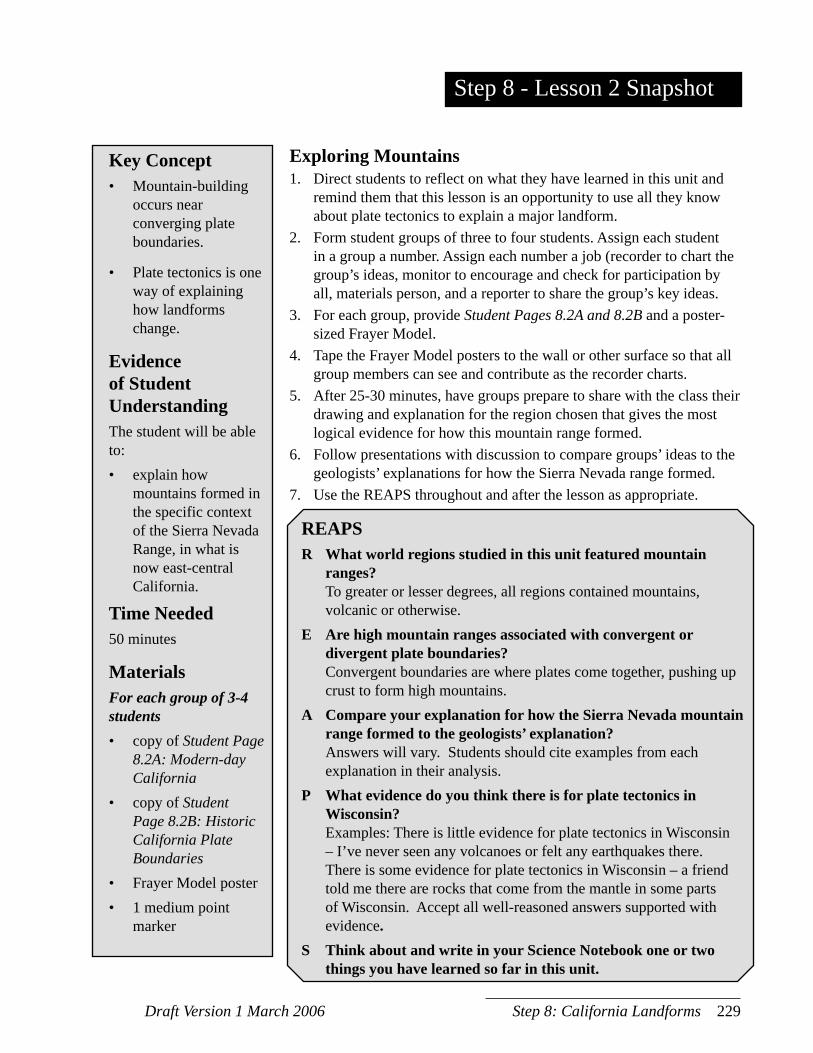
Draft Version 1 March 2006 Step 8: California Landforms 229
Step 8 - Lesson 2 Snapshot
Key Concept• Mountain-building
occurs near converging plate boundaries.
• Plate tectonics is one way of explaining how landforms change.
Evidence of Student UnderstandingThe student will be ableto: • explain how
mountains formed in the specific context of the Sierra Nevada Range, in what is now east-central California.
Time Needed50 minutes
MaterialsFor each group of 3-4students• copy of Student Page
8.2A: Modern-day California
• copy of Student Page 8.2B: Historic California Plate Boundaries
• Frayer Model poster• 1 medium point
marker
Exploring Mountains1. Direct students to reflect on what they have learned in this unit and
remind them that this lesson is an opportunity to use all they know about plate tectonics to explain a major landform.
2. Form student groups of three to four students. Assign each student in a group a number. Assign each number a job (recorder to chart the group’s ideas, monitor to encourage and check for participation by all, materials person, and a reporter to share the group’s key ideas.
3. For each group, provide Student Pages 8.2A and 8.2B and a poster-sized Frayer Model.
4. Tape the Frayer Model posters to the wall or other surface so that all group members can see and contribute as the recorder charts.
5. After 25-30 minutes, have groups prepare to share with the class their drawing and explanation for the region chosen that gives the most logical evidence for how this mountain range formed.
6. Follow presentations with discussion to compare groups’ ideas to the geologists’ explanations for how the Sierra Nevada range formed.
7. Use the REAPS throughout and after the lesson as appropriate.
REAPSR What world regions studied in this unit featured mountain
ranges? To greater or lesser degrees, all regions contained mountains,
volcanic or otherwise.E Are high mountain ranges associated with convergent or
divergent plate boundaries? Convergent boundaries are where plates come together, pushing up
crust to form high mountains.A Compare your explanation for how the Sierra Nevada mountain
range formed to the geologists’ explanation? Answers will vary. Students should cite examples from each
explanation in their analysis.P What evidence do you think there is for plate tectonics in
Wisconsin? Examples: There is little evidence for plate tectonics in Wisconsin
– I’ve never seen any volcanoes or felt any earthquakes there. There is some evidence for plate tectonics in Wisconsin – a friend told me there are rocks that come from the mantle in some parts of Wisconsin. Accept all well-reasoned answers supported with evidence.
S Think about and write in your Science Notebook one or two things you have learned so far in this unit.
230 Exploring Earth’s Landforms Draft Version 1 March 2006
Background InformationThe Sierra Nevada Range is a stretch of high mountains along the eastern border of California and western border of Nevada. The mountains extend to the north and south for about 600 km. How were they formed? Plate tectonics provides a good explanation. Most mountains form when two plates converge. Several good examples of converging plate boundaries include the regions of the Himalayas, Pacific NW, and Chile. All of these regions contain high mountains (the Himalayas, Cascades, and Andes). Converging plates must have formed the Sierra Nevada Range too. However, these mountains are not near the Pacific NW or any converging plate boundary. Scientists have to look at more evidence to understand these mountains. Scientists know that rocks in the Sierra Nevada Mountains are very old. In fact, they are 15–20 million years old. There must have been a converging plate boundary near the Sierras long ago in geologic time. Look at the diagram of plates near the west coast of North America. The diagram shows what plate movements were probably taking place about 37 million years ago. Notice the subduction zone along the coast. The Farallon Plate is moving under the North American Plate. At this point, the Sierra Nevada Range started to form. The diagram also shows outlines of what the state boundaries of California and Nevada might have looked like back then. Notice how narrow California is! The Sierra Nevada Mountains used to be close to the ocean. Today they are located far from the coast. Over time, the plate motions in this region changed and the land was lifted out of an ancient sea.
Advance PreparationThis lesson guides students to use a Frayer Model to chart their thoughts and reasoning. A Frayer Model is a graphic organizer similar to a concept map and supports students in evaluating their understanding of a central idea or object in light of four specific prompts (one per quadrant). In this lesson, the Frayer Model helps students compare and contrast information to explain the Sierra Nevada Range from evidence studied and models developed in the world regions.
Before beginning this lesson with students, cut butcher paper or use chart paper to make Frayer Model posters. You will need one poster per student group. The template for what the Frayer Model includes is included on Teacher Page 8.2: Frayer Model Template. In addition, plan where you will have groups work on the posters so that all group members can actively participate. Keep in mind that one of the advantages of the Frayer Model is that students’ thinking becomes more visible because of the poster format, so there are good opportunities for formative assessment as the posters develop.
Draft Version 1 March 2006 Step 8: California Landforms 231
Implementation Guide1. Direct students to reflect on what they have
learned in this unit and remind them that this lesson is their opportunity to use all they know
about plate tectonics to explain several major California features. Explain that this and the next lesson are designed to use the knowledge gained from the unit. Emphasize that students are expected to use correct scientific terms in their work, thoroughly explain their logic and thinking, and cite specific evidence in their responses.
2. Form student groups of three to four students. Four is the maximum suggested number because more than that makes it hard to actively involve everyone in generating the Frayer Model poster. Have group members count off to assign each a number. Assign each number a job:• recorder to chart the group’s ideas on the
Frayer Model• monitor to encourage and check for
participation by all • materials person to get and post the group’s
chart• reporter to share the group’s key ideas with
the rest of the class when asked3. For each group, provide the two maps on
Student Page 8.2A: Modern-Day California and Student Page 8.2B: Historic California Plate Boundaries and a poster-sized Frayer Model. Before students get their materials, explain what each group will receive. Describe the maps and state clearly the dates for each. One is a map of California in the present-day and one is a model for the plate motions that scientists think happened about 37 million years ago. Next, show an example of the Frayer Model and explain what each quadrant is asking for. Explain that the diagram in the fourth quadrant should depict a cross-section of the chosen model.
After students have had time to ask questions and clarify the directions, have the materials
person get copies for their group. Remind the
monitor to be certain that all group members get turns to examine the map, contribute to the conversation about the evidence, and listen to other students’ ideas.
4. Decide ahead of time where to have students work on the posters so that all group members
can see and contribute to the Frayer Model. If the posters are on a table or the floor, it is more difficult than if they are on a wall for the students to gather around and
participate in discussing the group responses.5. When groups begin to slow, explain that
each group will have a minute to explain which model they chose to diagram to the rest of the class. If substantial progress on the model is completed by twenty-five to thirty minutes, end the work and prepare for brief presentations. As each group presents, push them to explain their reasoning and evidence by asking, “How do you know?” Encourage other groups to ask questions of the presenting group.
6. After the presentations, read aloud the Background Information section from this lesson or summarize it clearly for students. You may wish to use an animation from the web to further illustrate the geologists’ explanation. This is available at: http://emvc.geol.ucsb.edu/download/nepac.php (as a QuickTime movie file) and is also provided on this Unit’s CD. Facilitate a discussion where the students compare and contrast the class’ explanations to geologists’ explanations for how the Sierra Nevada Range formed.
7. Use the REAPS throughout and after the lesson as appropriate.

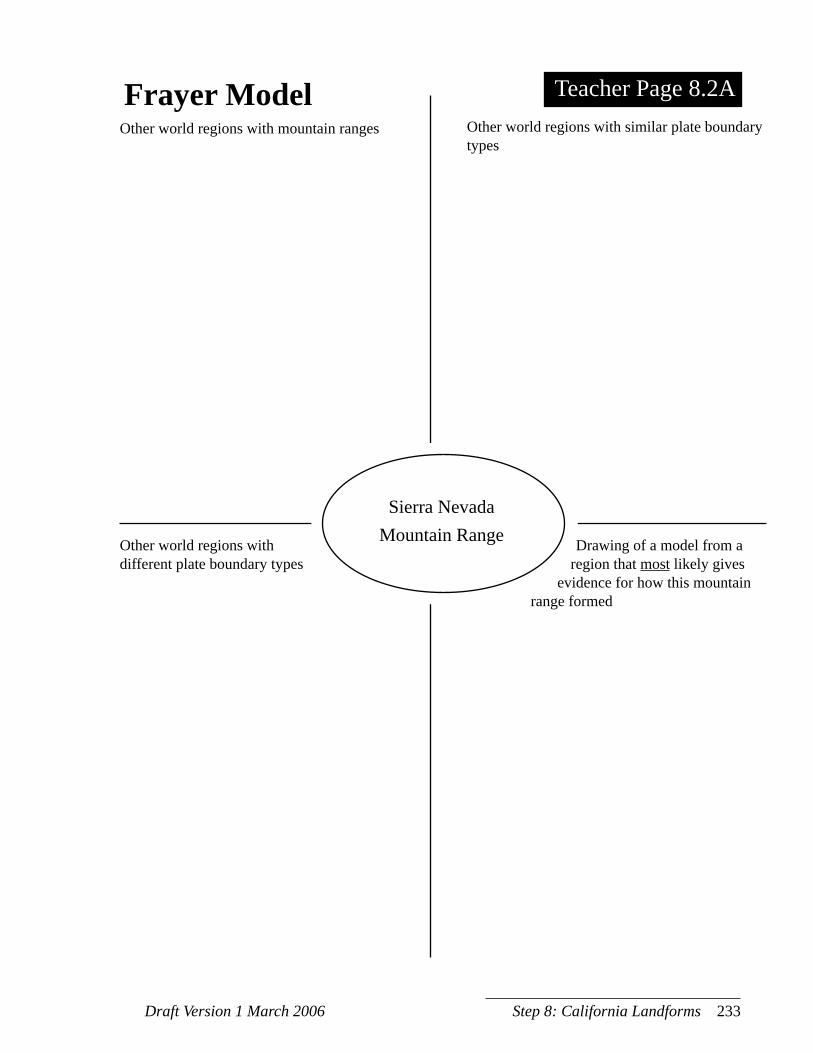
Draft Version 1 March 2006 Step 8: California Landforms 233
Sierra NevadaMountain Range
Frayer Model
Other world regions with different plate boundary types
Drawing of a model from a region that most likely gives
evidence for how this mountain range formed
Other world regions with similar plate boundary types
Other world regions with mountain ranges
Teacher Page 8.2A

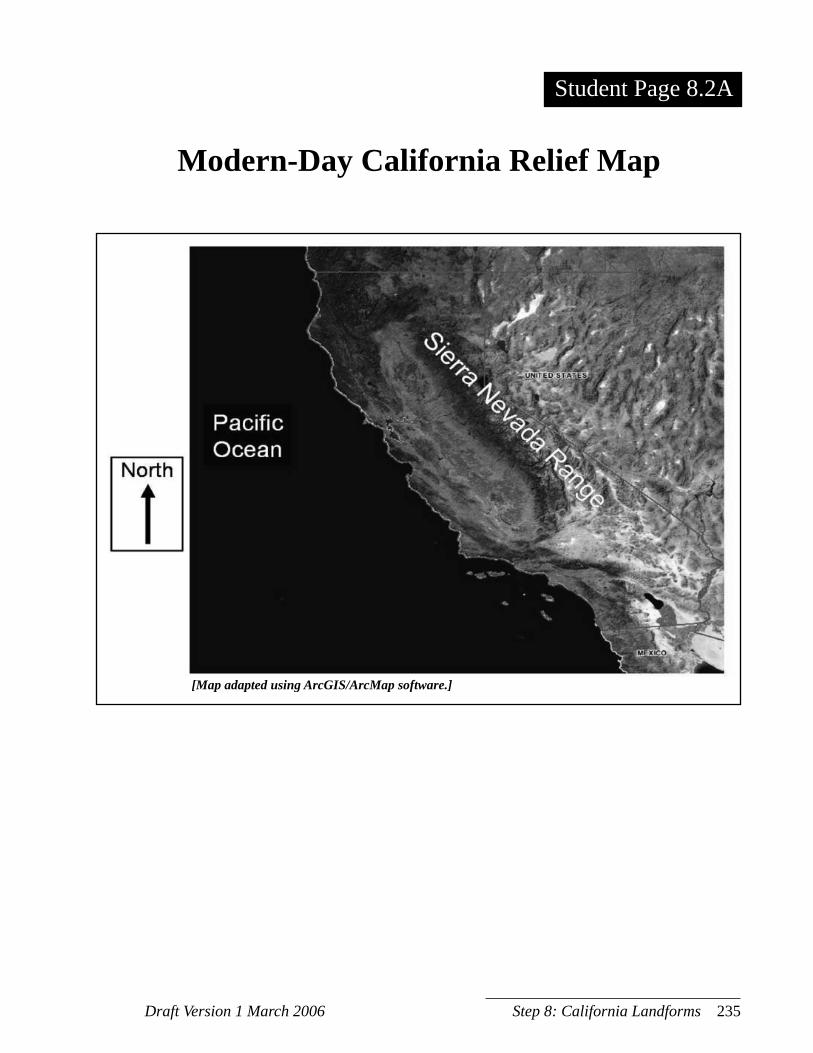
Draft Version 1 March 2006 Step 8: California Landforms 235
[Map adapted using ArcGIS/ArcMap software.]
Student Page 8.2A
Modern-Day California Relief Map

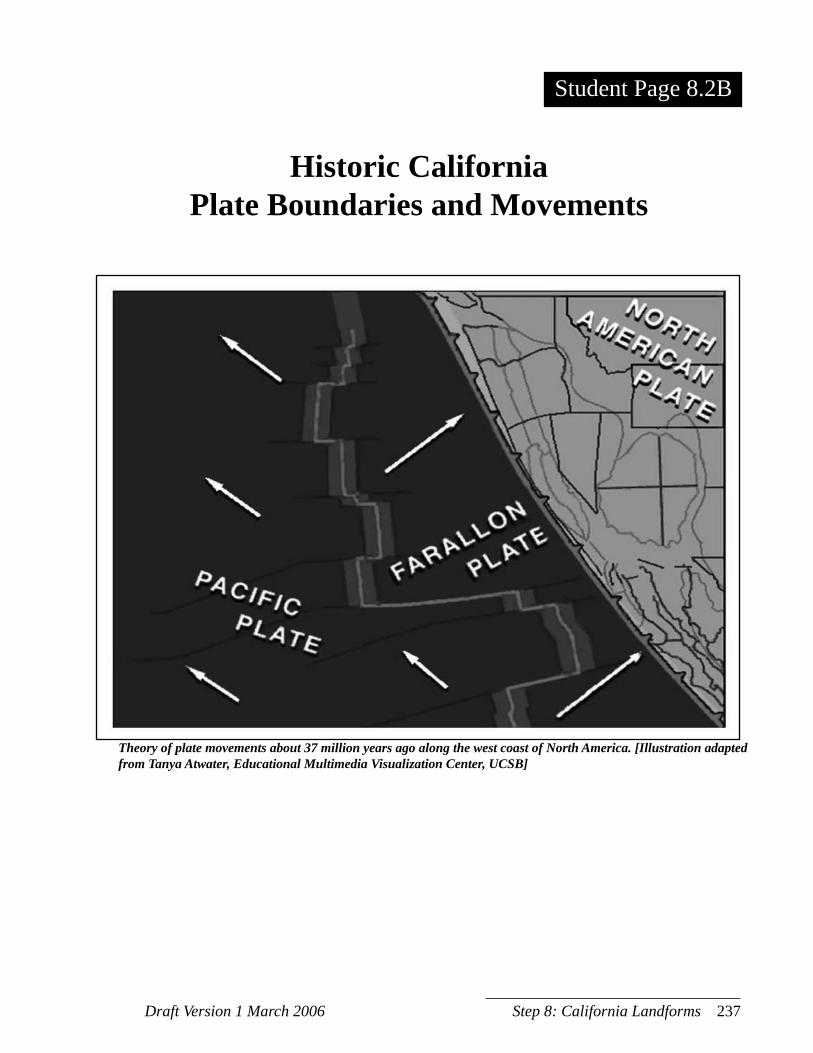
Draft Version 1 March 2006 Step 8: California Landforms 237
Theory of plate movements about 37 million years ago along the west coast of North America. [Illustration adapted from Tanya Atwater, Educational Multimedia Visualization Center, UCSB]
Student Page 8.2B
Historic California Plate Boundaries and Movements

Draft Version 1 March 2006 Step 8: California Landforms 239
assessment.7. Use the REAPS throughout
and after the lesson.
Key Concept• Plate tectonics is one way of
explaining how landforms change.
Evidence of StudentUnderstandingThe student will be able to: • compare and contrast some
of the features of California, the teacher’s model region, to the Himalaya region.
Time Needed50 minutes
MaterialsFor each student• copy of Student Page 8.3A:
California Earthquake Activity Map
• copy of Student Page 8.3B: Present-day California Plate Movements
• copy of Student Page 8.3C: California
• copy of Student Page 8.3D: Self Assessment
• notes about the class’ world region models from Lesson 8.1
Comparing World Regions1. Direct students to reflect on what they learned in this unit
and remind them that this lesson is another opportunity to use all they know about plate tectonics to compare major geological features of the teacher’s region, California, with another world region.
2. Have students work individually to review their notes about the class’ world region models.
3. Display Student Pages 8.3A and 8.3B on an overhead or projected image and discuss as a whole class what each depicts.
4. Hand out Student Pages 8.3A-D and review the instructions as a whole class.
5. Provide 20–30 minutes for students to work individually to write their response to the essay question.
6. Use the REAPS throughout and after the lesson as appropriate.
REAPSR What is one difference you wrote about between
California and the Himalaya region? Answers will vary. Example: California lies on a transform
plate boundary but the Himalayas lie on a convergent plate boundary.
E Describe how California is similar to the Himalaya region.
Answers will vary. Both regions contain high mountain ranges.
A Choose one landform of California that your teacher modeled and describe how it is influenced by plate tectonics.
Answers will vary. Accept any accurate responses supported with evidence from the California region model.
P What new questions do you have about landforms in a region of the world?
Answers will vary depending on students’ experiences, interest, and prior knowledge.
S Complete and attach the self assessment form to your essay before submitting to your teacher.
Step 8 - Lesson 3 Snapshot
240 Exploring Earth’s Landforms Draft Version 1 March 2006
Background InformationThe map of plate motions in present-day California shows a fault running through most of the state. This is the San Andreas Fault and it is the site of many earthquakes, large and small. The arrows on each plate next to the San Andreas Fault represent relative plate motions. Two plates are sliding parallel to each other in opposite directions. This plate boundary is a transform boundary. No other region in the Unit Investigation represents a transform plate boundary. In this way, the San Andreas Fault is unlike any of the region models for plate boundaries. It is different from the Himalaya region because there is no converging plate boundary.
The San Andreas Fault, being a plate boundary, is a site of frequent earthquakes. This is indicated on the EQ map of California showing all EQs over M4.0 in the last 10 years. The Himalaya region is also a plate boundary. Many earthquakes occur in the Himalaya region too. The Seismic/Eruption software program shows this data. The San Andreas Fault is similar to the Himalaya region in that they are both plate boundaries where earthquakes are common.
The Himalaya region’s most prominent feature is the tall mountains, including the tallest mountain in the world—Mt. Everest. Look at the picture of the San Andreas Fault near San Luis Obispo. (This is about halfway between Los Angeles and San Francisco.) There are also mountains in this
region of California, but they are much smaller than the Himalayas. You may remember that mountains form where there are converging plates. The Himalaya region is an area of two converging continental plates. The San Andreas Fault is a transform boundary, but part of the motion of the plates is convergent. This fault is mostly made of plates sliding parallel to each other. However, a small part of the motion brings the plates together. This produces small mountains along the Fault. These mountains are referred to as the Coastal Range Mountains of California. Even though the mountains along the San Andreas Fault are much smaller than the mountains in the Himalayas, they both are formed by two plates pushing against each other.
Advance PreparationThis lesson is for students to complete individually. As an individual activity, students have an opportunity to apply and demonstrate their understanding of key concepts related to Plate Tectonics.
Draft Version 1 March 2006 Step 8: California Landforms 241
Implementation Guide1. Direct students to reflect on what they have
learned in this unit and remind them that this lesson is their opportunity to use all they now know about plate tectonics to explain several major geological features of California. This is the “teacher’s region”, so students may or may not be familiar with the complex geology of California, depending on how closely they watched you model the process.
2. Have students work individually to review their notes about the class’ world region models. Point out that each region featured specific plate boundary types and that they are responsible for knowing the types—this is a summative assessment step.
3. For each student, provide the two maps, Student Page 8.3A: California Earthquake Activity Map and Student Page 8.3B: Present-Day California Plate Movements, as an overhead or projected image and discuss as a whole class what each depicts.
4. Hand out Student Pages 8.3A-8.3C. Review the instructions on Student Page 8.3C: California as a whole class.
5. Provide 20–30 minutes for students to work individually to write their response to the essay question: How is the plate boundary featured in the California map similar to and different from the plate boundary featured in the Himalaya region? Remind students that they are to explain their answers using specific evidence from the Himalaya model and the California maps. They may include diagrams to illustrate your points. Write on the board and emphasize that explanations must include the following terms:• Earthquake• Fault• Convergent• Plate
6. Use the REAPS throughout and after the lesson as appropriate.

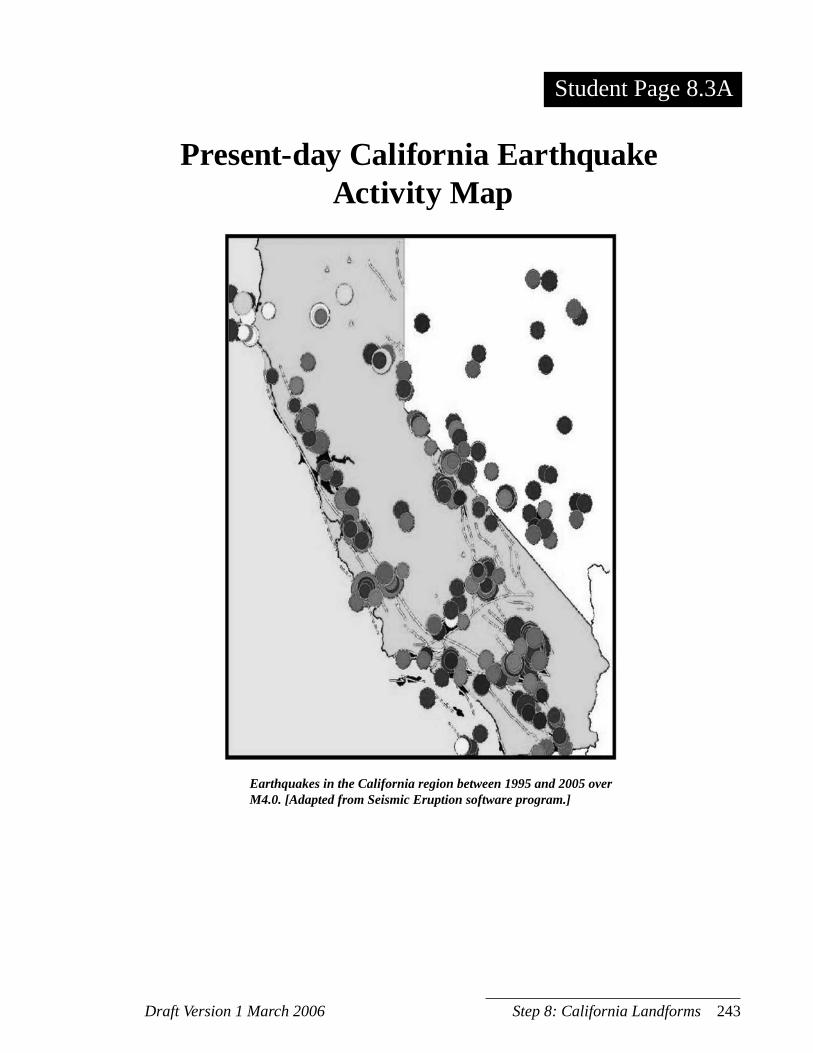
Draft Version 1 March 2006 Step 8: California Landforms 243
Earthquakes in the California region between 1995 and 2005 over M4.0. [Adapted from Seismic Eruption software program.]
Student Page 8.3A
Present-day California Earthquake Activity Map

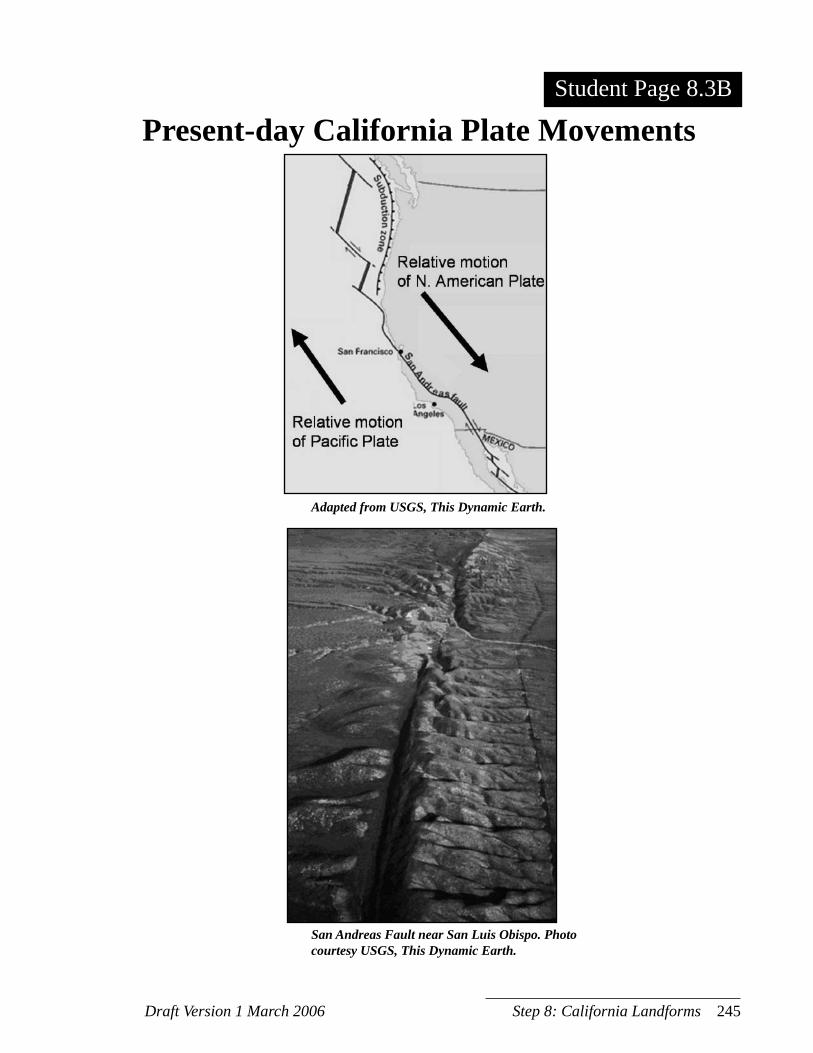
Draft Version 1 March 2006 Step 8: California Landforms 245
Adapted from USGS, This Dynamic Earth.
San Andreas Fault near San Luis Obispo. Photo courtesy USGS, This Dynamic Earth.
PAGE
Present-day California Plate MovementsStudent Page 8.3B

Draft Version 1 March 2006 Step 8: California Landforms 247
PAGE
California
Think and Write:1. Obtain a copy of the two handouts, Present-day California Earthquake Activity Map
and Present-day California Plate Movements, as your teacher directs.2. Use evidence from the two handouts and your notes from the model presentations to
write an essay answering the following question: How is the plate boundary featured in the California map similar to and
different from the plate boundary featured in the Himalaya region? Explain your answer using specific evidence from the Himalaya model and the
California maps. You may include diagrams to illustrate your points. Include in your explanation the following terms:
• Earthquake • Fault • Convergent • Plate3. Refer to and complete the Self Assessment form as you write your essay.
STUDENT PAGESTUDENT PAGEStudent Page 8.3C

Draft Version 1 March 2006 Step 8: California Landforms 249
Student Page 8.3D
Self AssessmentRefer to this form as you complete your essay. Attach this form to your essay before submitting to your teacher.
1. My essay clearly compares the types of plate boundaries in each region. Similarities:
Differences:
2. My explanations include evidence from the Himalaya model and the California maps. Himalaya:
California:
3. I use all of the scientific terms correctly and appropriately. Terms:
4. I need more information about the following concepts in order to provide improved explanations. Concepts:
5. As a result of this unit my thinking about Earth’s landforms has changed in the following ways.
Name ____________________________________ Date ___________________

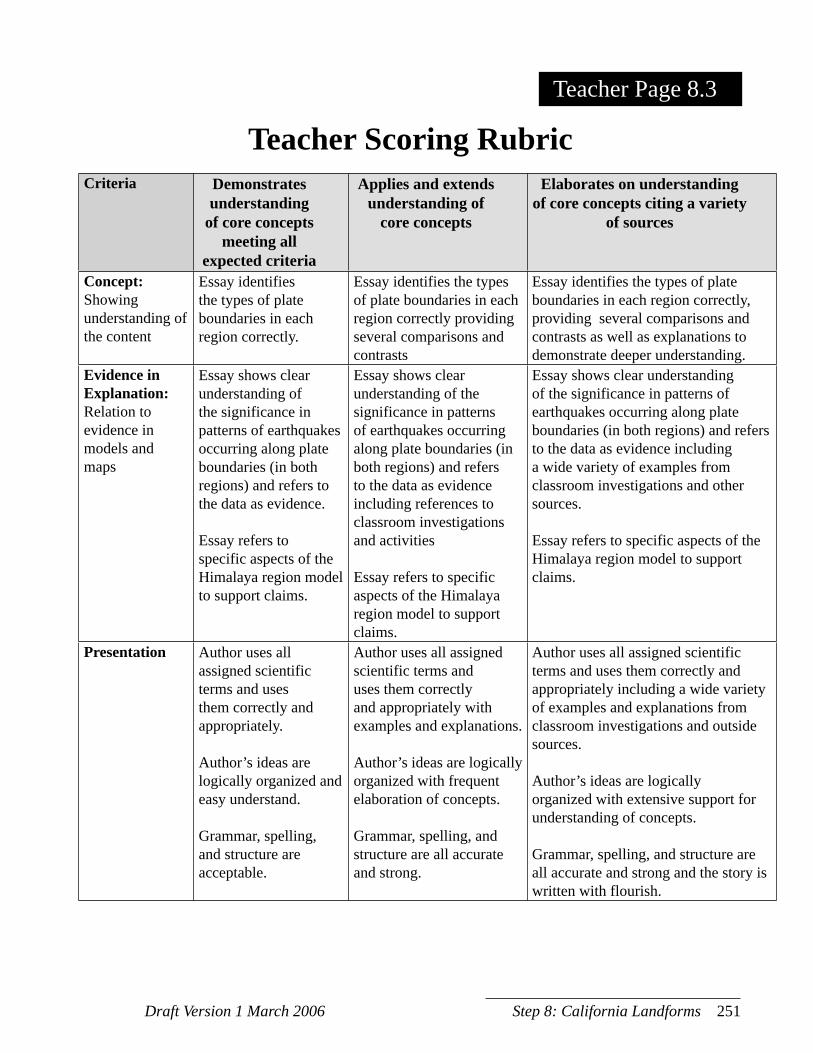
Draft Version 1 March 2006 Step 8: California Landforms 251
Teacher Scoring RubricCriteria Demonstrates
understanding of core concepts
meeting all expected criteria
Applies and extends understanding of
core concepts
Elaborates on understanding of core concepts citing a variety
of sources
Concept:Showing understanding of the content
Essay identifies the types of plate boundaries in each region correctly.
Essay identifies the types of plate boundaries in each region correctly providing several comparisons and contrasts
Essay identifies the types of plate boundaries in each region correctly, providing several comparisons and contrasts as well as explanations to demonstrate deeper understanding.
Evidence in Explanation:Relation to evidence in models and maps
Essay shows clear understanding of the significance in patterns of earthquakes occurring along plate boundaries (in both regions) and refers to the data as evidence.
Essay refers to specific aspects of the Himalaya region model to support claims.
Essay shows clear understanding of the significance in patterns of earthquakes occurring along plate boundaries (in both regions) and refers to the data as evidence including references to classroom investigations and activities
Essay refers to specific aspects of the Himalaya region model to support claims.
Essay shows clear understanding of the significance in patterns of earthquakes occurring along plate boundaries (in both regions) and refers to the data as evidence including a wide variety of examples from classroom investigations and other sources.
Essay refers to specific aspects of the Himalaya region model to support claims.
Presentation Author uses all assigned scientific terms and uses them correctly and appropriately.
Author’s ideas are logically organized and easy understand.
Grammar, spelling, and structure are acceptable.
Author uses all assigned scientific terms and uses them correctly and appropriately with examples and explanations.
Author’s ideas are logically organized with frequent elaboration of concepts.
Grammar, spelling, and structure are all accurate and strong.
Author uses all assigned scientific terms and uses them correctly and appropriately including a wide variety of examples and explanations from classroom investigations and outside sources.
Author’s ideas are logically organized with extensive support for understanding of concepts.
Grammar, spelling, and structure are all accurate and strong and the story is written with flourish.
Teacher Page 8.3

S T E P
9Overview:
Rocks, Landforms, and Erosion ProcessesThis Step’s main idea is that plate tectonics is not the only contributor to present-day landforms. Erosional processes (like rivers and glaciers) are a factor too. A great example of a river having an influence on the landscape is the Grand Canyon in Arizona. Using FOSS materials along with some Wisconsin-centered activities, students will investigate properties of the three main types of rock. This includes how they form and erode. Students will also learn new information about rock types in their regions. In addition, information about glacial processes is presented in light of the several model regions that exhibit them. In this way, students can think about how those processes also shape landforms. After this Step, students have all the lines of evidence for explaining most major landforms before they investigate Wisconsin landforms in the next and final Step.
Lesson 9.1 Sedimentary Rocks (40 min)
Lesson 9.2 Correlating Rocks (40 min)
Lesson 9.3 Igneous & Metamorphic Rocks (40 min)
Lesson 9.4 Salol Crystals (40 min)
Lesson 9.5 Landforms & Glaciers (45 min)

Draft Version 1 March 2006 Step 8: California Landforms 255
Step 9 - Lesson 1 Snapshot
Key Concept• Besides plate tectonics, erosional
processes like rivers are a way of explaining how landforms change.
• Sedimentary rocks include sandstone, limestone, and shale.
Evidence of StudentUnderstandingThe student will be able to: • describe characteristics of sedimentary
rocks and identify ones that contain carbonate;
• identify the Grand Canyon as a landform that has been developed primarily by erosional processes.
Time Needed40 minutes
MaterialsFor the class• master for rock-set labels• safety goggles• paper towels• FOSS transparencies #3 and #6 and
overhead projectorFor each group• FOSS rocks from Nankoweap and
North Canyons (or Wisconsin rocks, if available)
• hand lenses• bottle of dilute hydrochloric acid• notebook paper• FOSS Earth History Resource Books
(pages 3 and 8-17)• FOSS Earth History Lab Notebooks
(pages 6-9)
Sedimentary Rocks1. Remind students that they have learned about one
process, the theory of plate tectonics, which shapes Earth’s landforms. Ask what other processes affect Earth’s landforms. Explain they will be studying the Grand Canyon in Arizona to answer part of this question.
2. Conduct FOSS Earth History Investigation 3, Part 1, steps #1-26.
3. In step #2 introduce John Wesley Powell and how he influenced what we know about the Grand Canyon.
4. Substitute Wisconsin sedimentary rocks for Grand Canyon rocks if possible.
5. Extend the discussion of fizzing in step #20 to carbonated beverages.
6. Use the REAPS throughout and after the lesson as appropriate.
REAPSR What are sedimentary rocks made of? Sedimentary rocks can be made of sand, calcium
carbonate, and other compacted bits of earth and material.
E How are sandstone and limestone similar? They are both sedimentary rocks and were formed
by compaction over many years.A In the photos of the Grand Canyon, what
patterns do you see in the landforms? Example: The many small canyons running into
the large canyon look like tree branches or roots.P How could sedimentary rocks be used to learn
about processes in different locations? If you find the same type of sedimentary rock
in two different places, you know it must have been either transported there by some means or developed there by the same (or a similar) process.
S In small groups, discuss your answers to the Predict question.
256 Exploring Earth’s Landforms Draft Version 1 March 2006
Background InformationFor background information on the Grand Canyon and sedimentary rocks, refer to the FOSS Earth History Teacher’s Guide, pages 80-86.
Implementation Guide
1. Remind students that they have learned about one process, the theory of plate tectonics, which shapes Earth’s landforms. Ask if they know of other processes that affect Earth’s landforms. Explain that in the next few lessons they will be studying some other processes that shape Earth’s landforms. The first landform they will study is the Grand Canyon in Arizona. Probe students’ prior knowledge about the Grand Canyon and how they think it developed. Use pictures from the FOSS Earth History curriculum to guide the discussion, similar to the slide show of sudden events in Step 1 of this unit.
2. Conduct FOSS Earth History Investigation 3, Part 1, steps #1-26. The idea is to provide students with more information about processes that shape Earth’s surface so they can better explain Wisconsin landforms in Step 10 of this unit. This Investigation also adds important information for understanding one of the overarching concepts in this unit: The present is the key to the past. We learn about Earth’s history by studying present-day rocks and how they have changed over many years.
3. In step #2 first introduce who John Wesley Powell was and how he influenced what we know about the Grand Canyon. Use material from the FOSS Earth History curriculum as needed to support this discussion.
4. Substitute Wisconsin sedimentary rocks for Grand Canyon rocks if you have them. Although rocks differ slightly in composition
from place to place, sandstone is sandstone and limestone is limestone. Similar processes were at work to form them. Using Wisconsin rocks provides a more real context for students rather than something far away, like the Grand Canyon.
5. When discussion of fizzing comes up in step #20, ask students what else they know of that “fizzes”. They may say soda (or pop). Ask them what they see in fizzing soda that looks similar to what they see when rocks fizz under hydrochloric acid. Draw the analogy between carbon dioxide bubbling up through soda and carbon dioxide bubbling up through water in the acid solution when it reacts with calcium carbonate in the rock. It is almost the same thing, although nothing is reacting to create the gas when you open a bottle of soda. It is simply dissolved gas that escapes from solution in the container. Students may have some prior knowledge here that could help them understand what they are seeing and connect it to something they already know.
6. Use the REAPS throughout and after the lesson as appropriate.
Advance PreparationSee FOSS Earth History Teacher’s Guide page 89.
Draft Version 1 March 2006 Step 9: Rocks and Erosion 257
Step 9 - Lesson 2 Snapshot
Key Concept• Landforms on Earth are of different ages,
and we can determine the ages by the distribution and types of rocks in some cases and by understanding events that happen in other cases.
Evidence of StudentUnderstandingThe student will be able to: • accurately correlate common rock groups
across Wisconsin by matching evidence from the fossil record.
Time Needed40 minutes
MaterialsFor each student• copy of Student Page 9.2A: Wisconsin
Rock Profiles• copy of Student Page 9.2B: Wisconsin
Index FossilsFor each group• set of 6 Nankoweap Canyon rocks• set of 5 North Canyon rocks• 2 Scissors• 2 hand lenses• 4 FOSS Earth History Resources books
(pages 3,8,9 and 58)• 4 FOSS Earth History Lab Notebooks
Correlating Rocks 1. Conduct FOSS Earth History Investigation 3,
Part 2, steps #1-12.2. Substitute the WI-based rock correlations for
those of the Grand Canyon. This provides a closer tie to what students will be studying in the next Step.
3. Use the REAPS throughout and after the lesson as appropriate.
REAPSR What is a correlation? A correlation is a matching or relationship
between two or more things.E What do you need to know to perform a
rock correlation? You need to know the types of rocks in two
or more locations and how they are ordered.A What conditions are necessary for
sedimentary rocks to form? Sedimentary rocks usually form at the bottom
of a sea. The sediments must be compressed over a long time to turn into rock.
P If you found the same kind of sedimentary rock from two different regions, what other evidence would you need to know if the rocks were formed at the same time?
You would need to know if the same kinds of fossils are found in each rock.
S Discuss with a partner and write in your Science notebook, evidence of sedimentary rocks you have seen in Wisconsin.
258 Exploring Earth’s Landforms Draft Version 1 March 2006
Background InformationFor background information on the Grand Canyon, sedimentary rocks, and rock correlations refer to the FOSS Earth History Teacher’s Guide, pages 80-86.
Implementation Guide1. Conduct FOSS Earth History
Investigation 3, Part 2, steps #1-12.
2. Substitute Wisconsin-based rock correlations for those of the Grand Canyon. This provides a closer tie to what students will be studying in the next Step. Use Student Page 9.2A: Wisconsin Rock Profiles and Student Page 9.2B: Wisconsin Index Fossils for the rock correlation in lieu of the Nankoweap and North Canyon correlations provided in the FOSS Earth History curriculum.
3. Use the REAPS throughout and after the lesson as appropriate.
Advance Preparation
See FOSS Earth History Teacher’s Guide page 97.
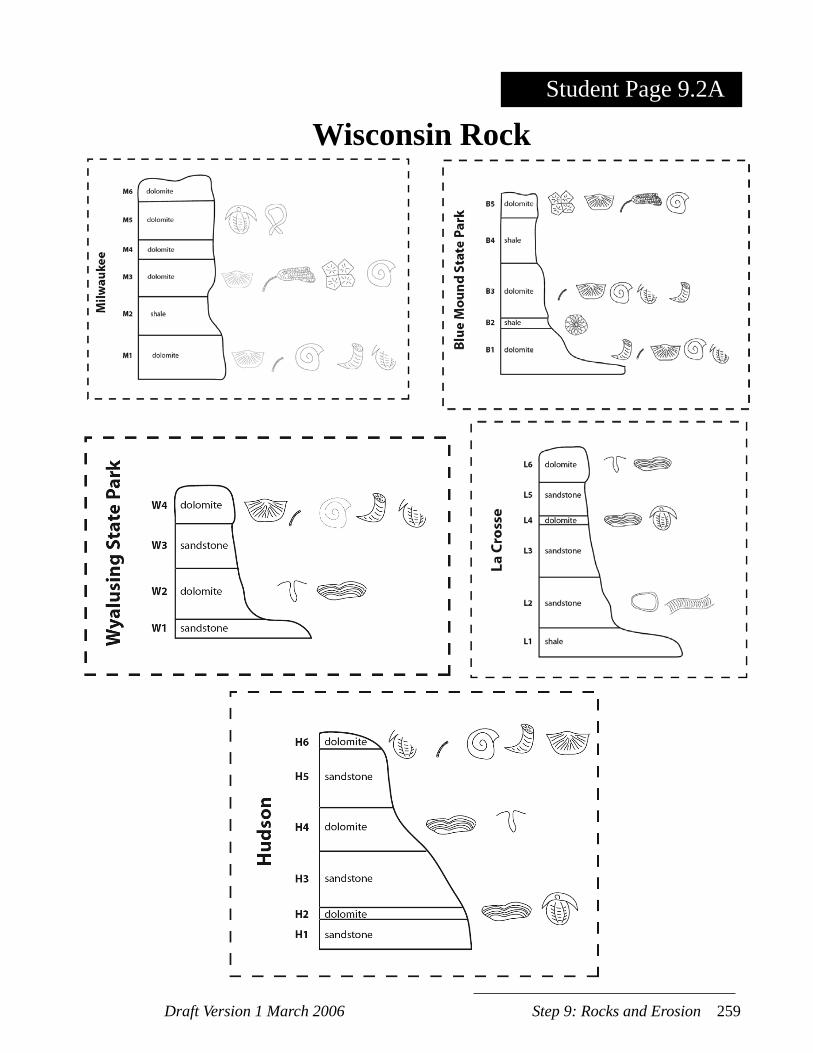
Draft Version 1 March 2006 Step 9: Rocks and Erosion 259
Student Page 9.2A
Wisconsin Rock

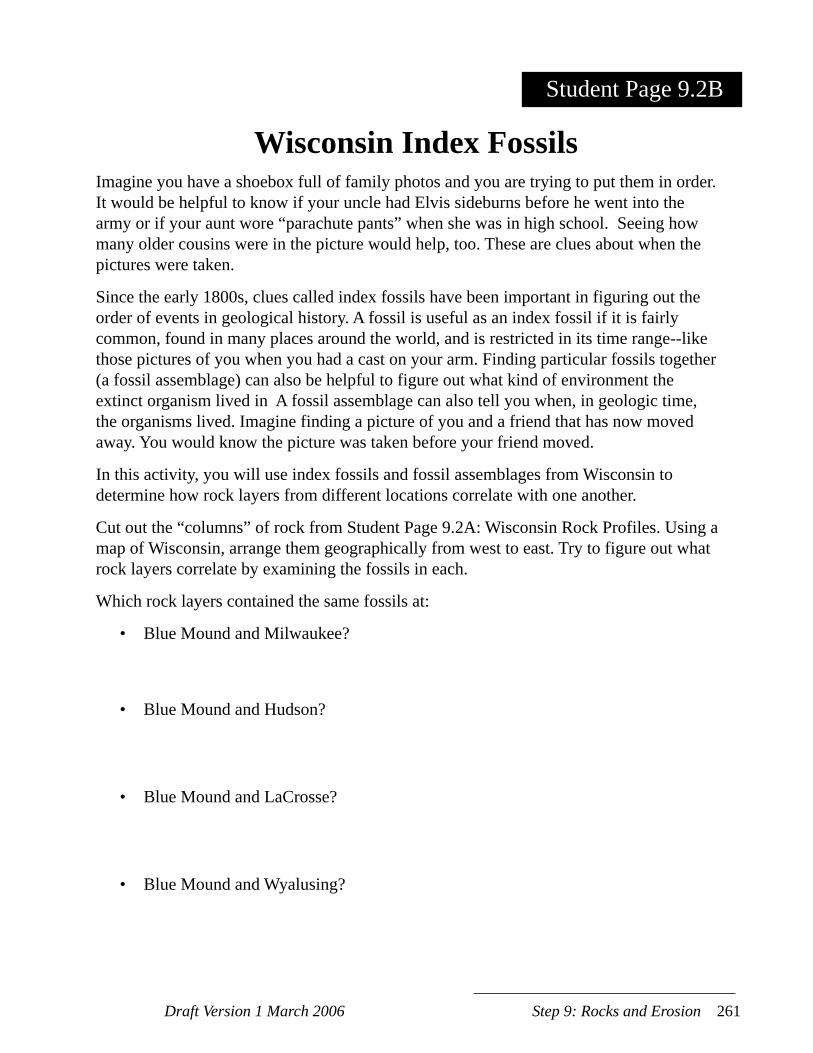
Draft Version 1 March 2006 Step 9: Rocks and Erosion 261
Imagine you have a shoebox full of family photos and you are trying to put them in order. It would be helpful to know if your uncle had Elvis sideburns before he went into the army or if your aunt wore “parachute pants” when she was in high school. Seeing how many older cousins were in the picture would help, too. These are clues about when the pictures were taken.
Since the early 1800s, clues called index fossils have been important in figuring out the order of events in geological history. A fossil is useful as an index fossil if it is fairly common, found in many places around the world, and is restricted in its time range--like those pictures of you when you had a cast on your arm. Finding particular fossils together (a fossil assemblage) can also be helpful to figure out what kind of environment the extinct organism lived in A fossil assemblage can also tell you when, in geologic time, the organisms lived. Imagine finding a picture of you and a friend that has now moved away. You would know the picture was taken before your friend moved.
In this activity, you will use index fossils and fossil assemblages from Wisconsin to determine how rock layers from different locations correlate with one another.
Cut out the “columns” of rock from Student Page 9.2A: Wisconsin Rock Profiles. Using a map of Wisconsin, arrange them geographically from west to east. Try to figure out what rock layers correlate by examining the fossils in each.
Which rock layers contained the same fossils at:
• Blue Mound and Milwaukee?
• Blue Mound and Hudson?
• Blue Mound and LaCrosse?
• Blue Mound and Wyalusing?
Wisconsin Index Fossils
Student Page 9.2B

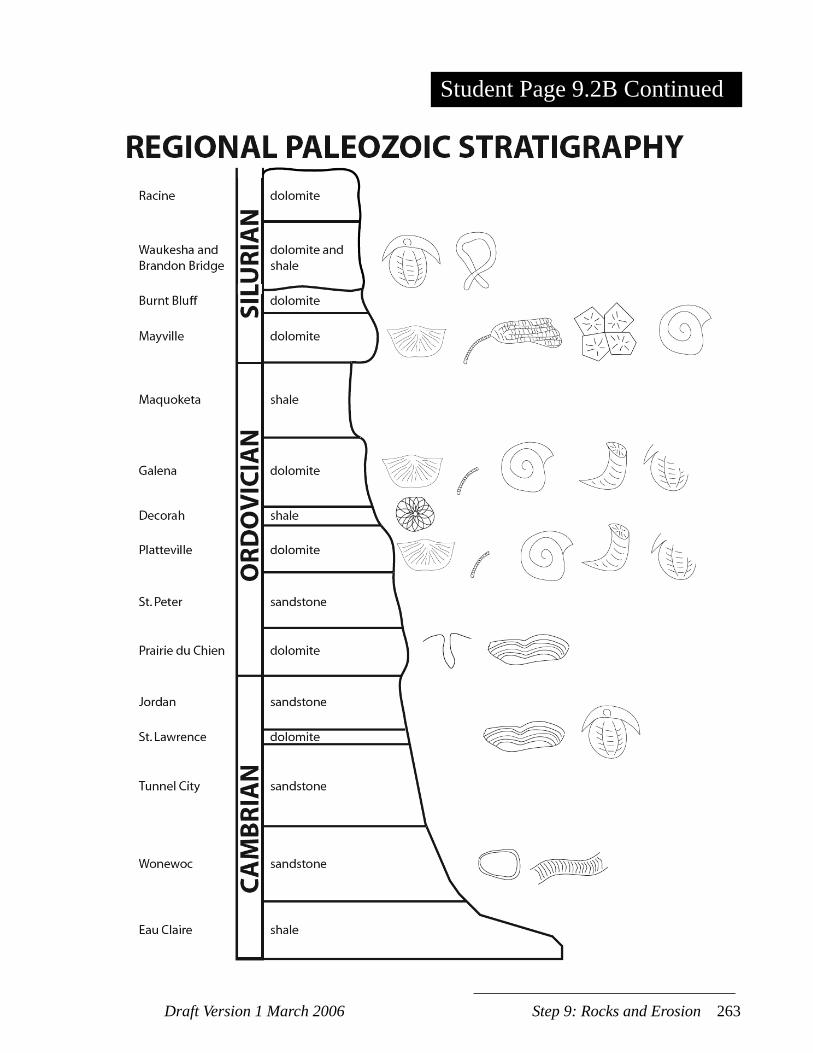
Draft Version 1 March 2006 Step 9: Rocks and Erosion 263
Student Page 9.2B Continued

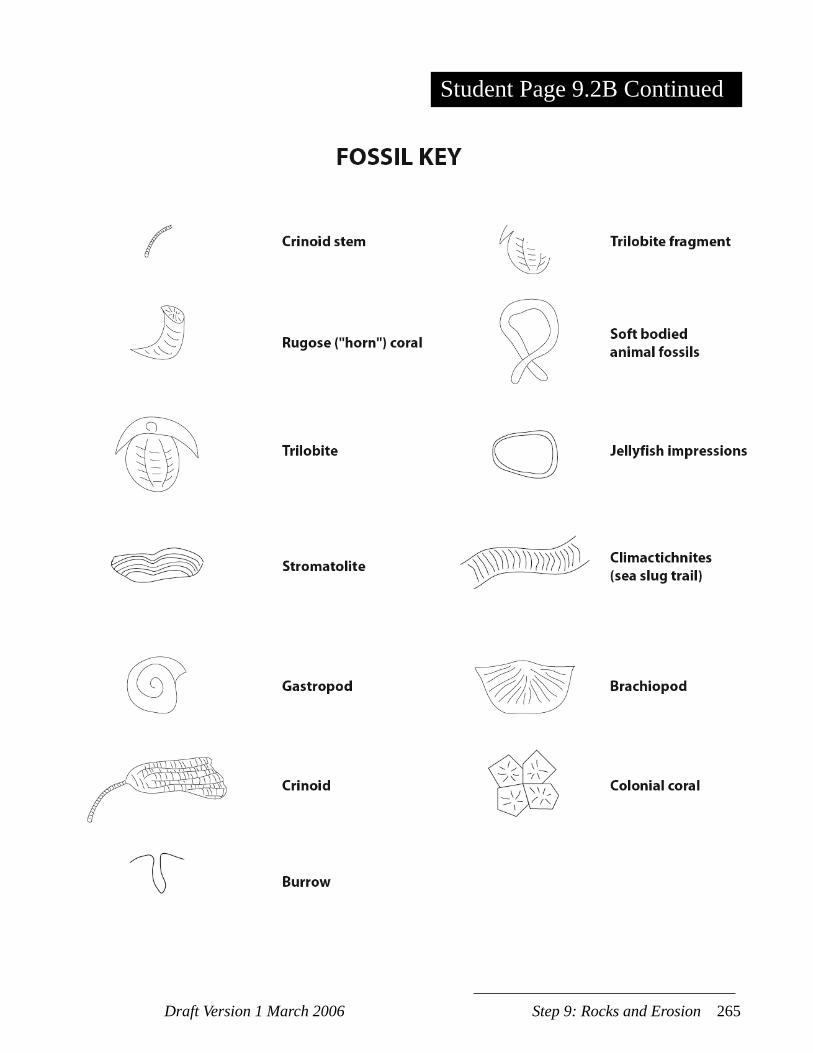
Draft Version 1 March 2006 Step 9: Rocks and Erosion 265
Student Page 9.2B Continued

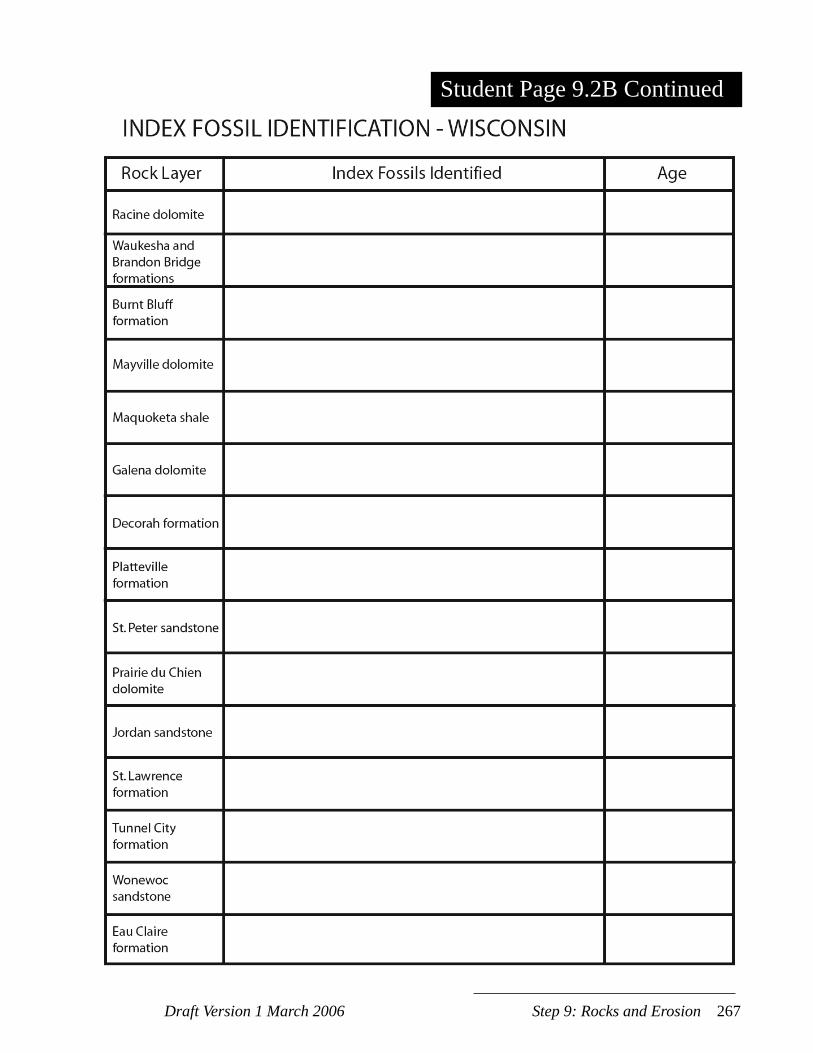
Draft Version 1 March 2006 Step 9: Rocks and Erosion 267
Student Page 9.2B Continued

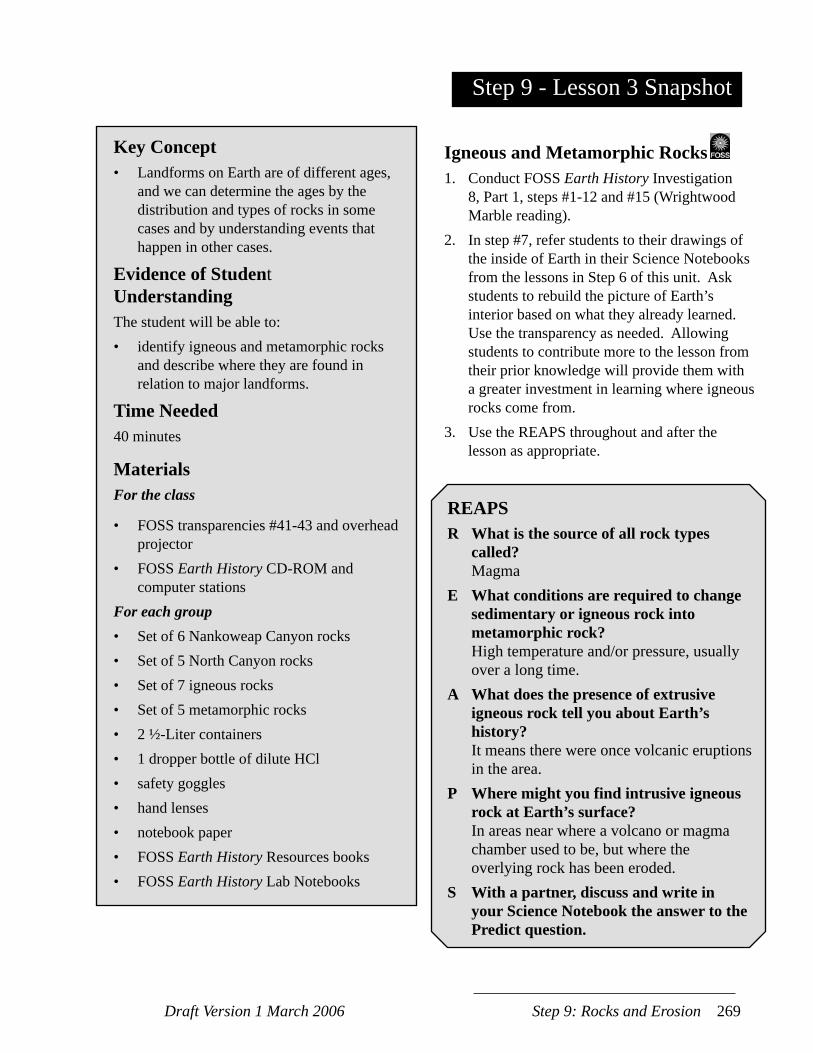
Draft Version 1 March 2006 Step 9: Rocks and Erosion 269
Step 9 - Lesson 3 Snapshot
Key Concept• Landforms on Earth are of different ages,
and we can determine the ages by the distribution and types of rocks in some cases and by understanding events that happen in other cases.
Evidence of StudentUnderstandingThe student will be able to: • identify igneous and metamorphic rocks
and describe where they are found in relation to major landforms.
Time Needed40 minutes
MaterialsFor the class
• FOSS transparencies #41-43 and overhead projector
• FOSS Earth History CD-ROM and computer stations
For each group• Set of 6 Nankoweap Canyon rocks• Set of 5 North Canyon rocks• Set of 7 igneous rocks• Set of 5 metamorphic rocks• 2 ½-Liter containers• 1 dropper bottle of dilute HCl• safety goggles• hand lenses• notebook paper• FOSS Earth History Resources books• FOSS Earth History Lab Notebooks
Igneous and Metamorphic Rocks 1. Conduct FOSS Earth History Investigation
8, Part 1, steps #1-12 and #15 (Wrightwood Marble reading).
2. In step #7, refer students to their drawings of the inside of Earth in their Science Notebooks from the lessons in Step 6 of this unit. Ask students to rebuild the picture of Earth’s interior based on what they already learned. Use the transparency as needed. Allowing students to contribute more to the lesson from their prior knowledge will provide them with a greater investment in learning where igneous rocks come from.
3. Use the REAPS throughout and after the lesson as appropriate.
REAPSR What is the source of all rock types
called? MagmaE What conditions are required to change
sedimentary or igneous rock into metamorphic rock?
High temperature and/or pressure, usually over a long time.
A What does the presence of extrusive igneous rock tell you about Earth’s history?
It means there were once volcanic eruptions in the area.
P Where might you find intrusive igneous rock at Earth’s surface?
In areas near where a volcano or magma chamber used to be, but where the overlying rock has been eroded.
S With a partner, discuss and write in your Science Notebook the answer to the Predict question.
270 Exploring Earth’s Landforms Draft Version 1 March 2006
Background Information
For background information on igneous and metamorphic rocks, refer to the FOSS Earth History Teacher’s Guide, pages 248-253.
Implementation Guide
1. Conduct FOSS Earth History Investigation 8, Part 1, steps #1-12 and #15. This includes the Wrightwood Marble reading, but not the Grand Canyon-specific steps. This lesson introduces students to the two other major types of rocks, igneous and metamorphic, so they can return to their region investigations and uncover more evidence for the landforms in their region. This will also help them better explain Wisconsin landforms in Step 10. Use Wisconsin rocks, if available, instead of the Grand Canyon rocks.
2. In step #7, refer students to their drawings of the inside of Earth in their Science Notebooks from the lessons in Step 6 of this unit. Instead of speaking to them with the transparency, use students’ own understanding of the inside of Earth to lead the discussion about where igneous rocks come from.
3. Use the REAPS throughout and after the lesson as appropriate.
Advance Preparation
See FOSS Earth History Teacher’s Guide page 255.
Draft Version 1 March 2006 Step 9: Rocks and Erosion 271
Step 9 - Lesson 4 Snapshot
Key Concept• Igneous rocks are formed when hot magma cools
and the cooling rate determines the crystal size of the rock.
Evidence of StudentUnderstandingThe student will be able to: • explain how the rate of cooling affects the size of
rock crystals formed from magma.
Time Needed40 minutes
MaterialsFor the class• 2 glass Petri dishes• 1 2-mL spoon• 2 L of hot water (50 C)• room-temperature water• 2 L of ice water• permanent marking pen• clock with second hand• (Optional) 10-30x power microscope• FOSS Earth History CD-ROM and multimedia
setup• FOSS Transparency #44 and overhead projectorFor each group• 2 hand lenses• 2 thermometers• 1 metric ruler• 2 bottles of salol• 3 0.5L containers• 1 set of seven igneous rocks• Earth History Resources books (page 89)• Earth History Lab Notebooks (pages 77 and 79)
Salol Crystals1. Conduct FOSS Earth History
Investigation 8, Part 2, steps #1-18.2. Use the REAPS throughout and after the
lesson as appropriate.
REAPSR Which rock type has a larger crystal
size, intrusive igneous or extrusive igneous?
Intrusive igneous rocks have larger crystals because they cool more slowly.
E What does liquid salol represent in this activity?
Liquid salol represents molten rock.A Explain how temperature affects
crystal size. If the temperature of melted rock falls
quickly (fast cooling rate), crystals will be small. If the temperature falls slowly (slow cooling rate), crystals will be large.
P In what regions might you find both intrusive and extrusive igneous rocks?
Answers will vary. Accept any that are supported with valid evidence.
S In your Science Notebook, write other questions you have about rock types.
272 Exploring Earth’s Landforms Draft Version 1 March 2006
Background Information
For background information on igneous and metamorphic rocks, refer to the FOSS Earth History Teacher’s Guide, pages 248-253.
Implementation Guide
1. Conduct FOSS Earth History Investigation 8, Part 2, steps #1-18. Throughout the investigation, ask students to think about what evidence they have for rock types in their regions. Where might they find evidence of igneous or metamorphic rocks?
2. Use the REAPS throughout and after the lesson as appropriate.
Advance Preparation
See FOSS Earth History Teacher’s Guide pages 260-261.
Draft Version 1 March 2006 Step 9: Rocks and Erosion 273
Step 9 - Lesson 5 Snapshot
Key Concept• Besides plate tectonics and erosion
by rivers, glaciation is another process that explains how some landforms change.
Evidence of StudentUnderstandingThe student will be able to: • identify glaciation as a process that
changes landforms;• identify major landforms
associated with glaciers.
Time Needed45 minutes
MaterialsFor each student
• CD slide show of glacial landforms* (or printed slides on transparency film)
• data projector (if using CD) or overhead projector (if using transparencies)
• (Optional) materials for ice/glacier demonstration (see extension activity on CD)For each student
• copies of Student Page 1.1: Wall of Water
• Science NotebookFor each region group
• Region readings from Lesson 2.1
*Provided on this Unit’s CD. Use “Step 9– Glacial Landforms slide show.ppt” file.
Landforms and Glaciers1. Show students images of glacial landforms in a manner
similar to that in the Step 1 slide show of earth-shattering events. Use a combination of small-group and whole-class discussion to share student observations, inferences, and questions about the scenes.
2. Ask students to work in groups to complete the Landforms Evidence Chart. They can re-visit their region readings about specific landforms related to glaciers and come up with one relationship between evidence and landform for the class Chart
3. Review the Landforms Evidence Chart as a class and remind students that they will have a chance to apply all they know to explain Wisconsin landforms in the next Step.
4. Show how glaciers move debris by setting up an ice demonstration over two or more class periods. (Optional)
5. Use the REAPS throughout and after the lesson as appropriate.
REAPSR Name three landforms commonly associated with
glaciers. Drumlins, kettles, u-shaped valleysE Describe how a glacier makes one of the
landforms you recalled. Example: Kettles develop when a depression,
scooped out by the glacier, is filled with ice as the glacier melts.
A How are valley glaciers and continental ice sheets similar?
Valley glaciers and continental ice sheets both contain debris (soil, rocks, sand) and can transport that load over long distances.
P What processes do you think were involved in shaping the landforms in Wisconsin that we see today?
Answers will vary. Use this question to probe what students think about how Wisconsin landforms developed.
S In groups discuss the information you contributed to the Landforms Evidence Chart.
274 Exploring Earth’s Landforms Draft Version 1 March 2006
Background Information
Glaciers are rivers of ice. During relatively cool periods in Earth’s history (ice ages) or in cooler climates (in mountains and high latitudes), more snow falls in the winter than melts in the summer. Over many years, this net accumulation of snow forms a large pile and compresses under its own weight, creating large sheets of ice called glaciers. Once glaciers are heavy enough, gravity pulls them downhill. This pulls them through valleys, as with valley glaciers found in mountainous regions, or flatten them out like pancakes, as with continental ice sheets, like those in Antarctica and Greenland. As glaciers move, they pick up rocks, earth, and other debris and transport them great distances. When glaciers melt, they leave this material behind. In the process, glaciers can dramatically change the landscape, carving U-shaped valleys (often seen in mountainous areas) or leaving behind hills (drumlins and kames), ridges (moraines), and small lakes (kettles), which are often the mark of continental ice sheets like those that scoured the northern U.S. during the last ice age.
Implementation Guide
1. Show images of landforms associated with glaciers. This can be done in a similar way to the Step 1 “Earth-Shattering Events” slide show. Prompt students to take notes, make observations and inferences, and answer the guiding questions as you display the pictures.
2. Divide students into groups and ask each group to develop a line for the Landforms Evidence Chart. Model the process by reviewing how you filled out the Chart in previous lessons. Each group should develop a line of evidence and relate it to a specific landform involving glaciers.
3. Complete and review the Landforms Evidence Chart as a whole class. Ask students to add their links between evidence and landforms from what they learned about glaciers. This is the last time you will add information to the Landforms Evidence Chart before you use it to guide student explanations for Wisconsin landforms in the next Step. Be sure the chart is complete and students understand the connections between the evidence/data and landforms they help explain. This can be an informal assessment of student understanding of the process of science.
4. There is a common misconception that glaciers act like bulldozers -- pushing material in front of them and then dumping it at the point of farthest advance. Look through the activity on this Unit’s CD for instructions on how to model a glacier using some water, a small container, dirt and pebbles, and a freezer. This part is optional but can help students understand how glaciers work.
5. Use the REAPS throughout and after the lesson as appropriate.
Advance Preparation
If you plan to model a glacier with ice, set up the demonstration ahead of time (see extension activity description on CD). Prepare computer and projector for the slide show or print overhead transparencies or photos for each group.
S T E P
10Overview:
Wisconsin LandformsIn this Step, students have the opportunity to think critically about local, Wisconsin-area geology. If the theory of plate tectonics explains many landforms in different regions of the world, can it also explain Wisconsin’s landforms? If so, what evidence supports it? If not, what roles do other processes, like erosion from rivers and glaciers, play in shaping present-day landforms in Wisconsin?
Students work through a guided activity that uses geologic and geographic data from Wisconsin and evidence from their region models to first identify patterns in data and develop questions about the present-day landforms of Wisconsin. Then, they look at various lines of evidence, just like those they used in their region landform investigations earlier in this unit, and develop evidence-based explanations for Wisconsin landforms.
In the final lesson, students creatively display their understanding of plate tectonics and erosional processes by describing a new, imaginary region of the world. A rubric guides students toward high-quality work that demonstrates accurate, scientific understanding of the major processes that shape Earth’s surface.
Lesson 10.1 What About Wisconsin? (50 min)
Lesson 10.2 Explaining Wisconsin Landforms (50 min)
Lesson 10.3 Develop-a-Region (50 min)

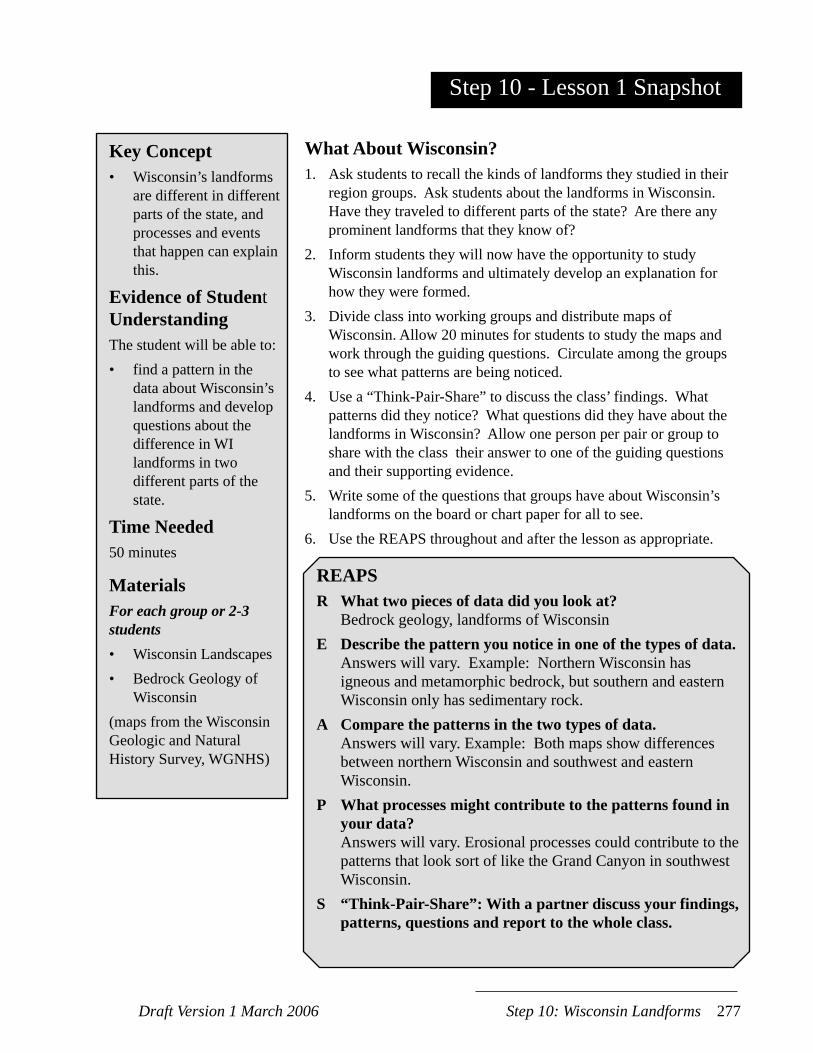
Draft Version 1 March 2006 Step 10: Wisconsin Landforms 277
Step 10 - Lesson 1 Snapshot
Key Concept• Wisconsin’s landforms
are different in different parts of the state, and processes and events that happen can explain this.
Evidence of StudentUnderstandingThe student will be able to: • find a pattern in the
data about Wisconsin’s landforms and develop questions about the difference in WI landforms in two different parts of the state.
Time Needed50 minutes
MaterialsFor each group or 2-3 students• Wisconsin Landscapes• Bedrock Geology of
Wisconsin(maps from the WisconsinGeologic and NaturalHistory Survey, WGNHS)
What About Wisconsin?1. Ask students to recall the kinds of landforms they studied in their
region groups. Ask students about the landforms in Wisconsin. Have they traveled to different parts of the state? Are there any prominent landforms that they know of?
2. Inform students they will now have the opportunity to study Wisconsin landforms and ultimately develop an explanation for how they were formed.
3. Divide class into working groups and distribute maps of Wisconsin. Allow 20 minutes for students to study the maps and work through the guiding questions. Circulate among the groups to see what patterns are being noticed.
4. Use a “Think-Pair-Share” to discuss the class’ findings. What patterns did they notice? What questions did they have about the landforms in Wisconsin? Allow one person per pair or group to share with the class their answer to one of the guiding questions and their supporting evidence.
5. Write some of the questions that groups have about Wisconsin’s landforms on the board or chart paper for all to see.
6. Use the REAPS throughout and after the lesson as appropriate.
REAPSR What two pieces of data did you look at? Bedrock geology, landforms of WisconsinE Describe the pattern you notice in one of the types of data. Answers will vary. Example: Northern Wisconsin has
igneous and metamorphic bedrock, but southern and eastern Wisconsin only has sedimentary rock.
A Compare the patterns in the two types of data. Answers will vary. Example: Both maps show differences
between northern Wisconsin and southwest and eastern Wisconsin.
P What processes might contribute to the patterns found in your data?
Answers will vary. Erosional processes could contribute to the patterns that look sort of like the Grand Canyon in southwest Wisconsin.
S “Think-Pair-Share”: With a partner discuss your findings, patterns, questions and report to the whole class.
278 Exploring Earth’s Landforms Draft Version 1 March 2006
Background InformationWisconsin geology is complex, but in a different way than most of the world regions that students studied earlier in this unit. All three processes studied in this unit have shaped Wisconsin landforms: plate tectonics, erosion from rivers, and glaciation. Distinguishing which processes affected which parts of Wisconsin (and how) is the task of local geologists, or students acting like geologists in this unit. Recognizing patterns in data is the first step towards understanding Wisconsin geology. The main pattern is in the landscapes and bedrock between the northern and eastern part of the state and the southwestern part of the state.
Implementation Guide1. Ask students what landforms they studied
in their world region groups. Use the Landform Evidence Chart to review what lines of evidence describe which landforms. Ask students about landforms in Wisconsin. What major landforms can they think of that exist in Wisconsin? Has anyone traveled to different parts of the state?
2. Let students know that they will now have the opportunity to investigate Wisconsin landforms and provide an evidence-based explanation for how they developed. This is part of the last step in this unit so students should apply everything they learned about plate tectonics and erosional processes to the activities in these last few lessons. Use the Landform Evidence Chart or other tools repeatedly to guide student thinking and the development of evidence-based explanations.
3. Divide the class into groups of 2-3 students for studying Wisconsin landforms. Distribute maps of Wisconsin and explain what they describe. One shows the landforms of Wisconsin in the form of a physical relief map. The other shows the kinds of rock that exist below ground (bedrock) in different parts of the state. Also explain the legends for each map. Allow students some time to study the maps
in groups and work through the guiding questions on the student page. Make sure students are recording their observations and thoughts in their Science Notebooks as they work. Circulate among the groups to see what patterns the students notice in the data.
4. After about 20 minutes of group study, conduct a large-group discussion about the class’ findings. What patterns did everyone notice? What questions do they have about the landforms in Wisconsin?
Remember, the focus of this investigation is to bring the students to where they can develop an evidence-based explanation for Wisconsin landforms. After this lesson, the class should have several main questions about Wisconsin landforms but they should all be related to the main pattern in the data: the fact that southwest Wisconsin is very different from northern and eastern Wisconsin. The question surrounding this dichotomy will guide the next lesson as students take a closer look at photos of landforms in the different regions and use what they learned to develop an explanation.
5. Before the lesson ends, write down some of the questions that groups have about Wisconsin landforms for all to see. This can be done on chart paper or a blackboard. Guide students towards finding one question they could answer if they were provided photographs of Wisconsin landforms to compare to the landforms they studied in previous lessons. In the next lesson, students will be provided with these photographs in the form of a slide show (on this Unit’s CD) and they can also study earthquake data from the Seismic/Eruption software program and GPS data in the Midwest US region from Step 5. The idea of this discussion is to guide student inquiry towards the question: How can we explain the patterns in landforms and bedrock geology in Wisconsin based on what we know about plate tectonics and erosional processes?
6. Use the REAPS throughout and after the lesson as appropriate.
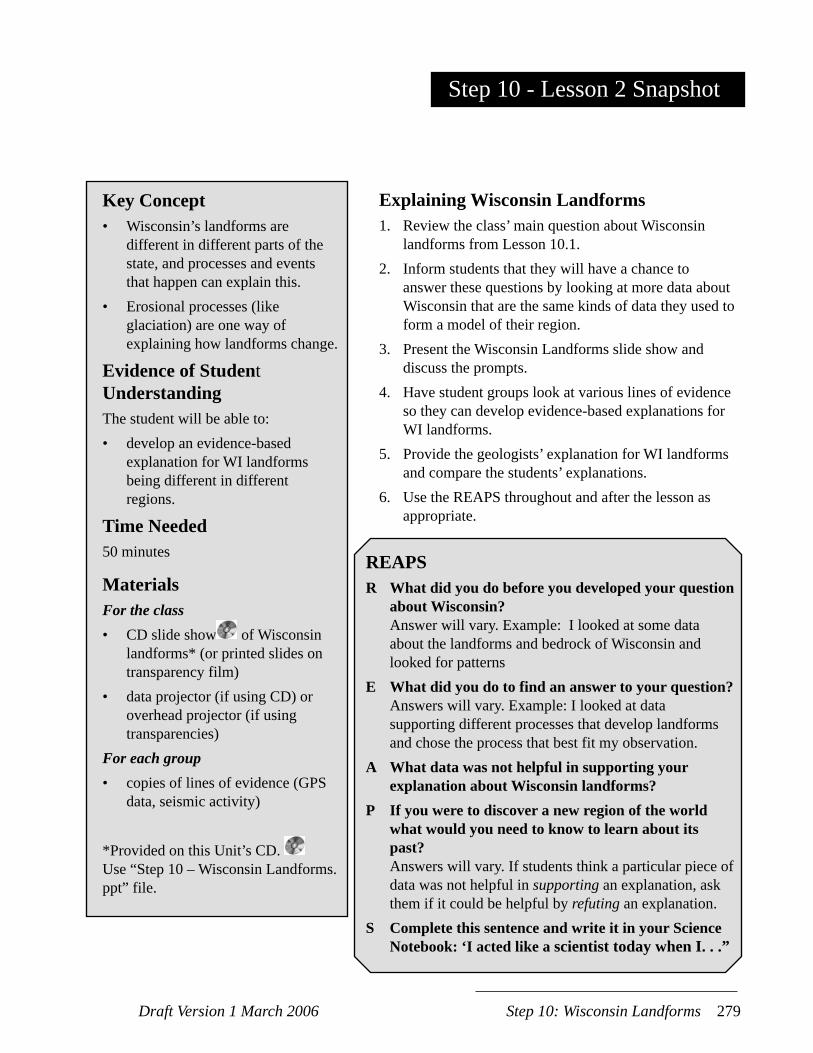
Draft Version 1 March 2006 Step 10: Wisconsin Landforms 279
Step 10 - Lesson 2 Snapshot
Key Concept• Wisconsin’s landforms are
different in different parts of the state, and processes and events that happen can explain this.
• Erosional processes (like glaciation) are one way of explaining how landforms change.
Evidence of StudentUnderstandingThe student will be able to: • develop an evidence-based
explanation for WI landforms being different in different regions.
Time Needed50 minutes
MaterialsFor the class• CD slide show of Wisconsin
landforms* (or printed slides on transparency film)
• data projector (if using CD) or overhead projector (if using transparencies)
For each group• copies of lines of evidence (GPS
data, seismic activity)
*Provided on this Unit’s CD. Use “Step 10 – Wisconsin Landforms.ppt” file.
Explaining Wisconsin Landforms1. Review the class’ main question about Wisconsin
landforms from Lesson 10.1.2. Inform students that they will have a chance to
answer these questions by looking at more data about Wisconsin that are the same kinds of data they used to form a model of their region.
3. Present the Wisconsin Landforms slide show and discuss the prompts.
4. Have student groups look at various lines of evidence so they can develop evidence-based explanations for WI landforms.
5. Provide the geologists’ explanation for WI landforms and compare the students’ explanations.
6. Use the REAPS throughout and after the lesson as appropriate.
REAPSR What did you do before you developed your question
about Wisconsin? Answer will vary. Example: I looked at some data
about the landforms and bedrock of Wisconsin and looked for patterns
E What did you do to find an answer to your question? Answers will vary. Example: I looked at data
supporting different processes that develop landforms and chose the process that best fit my observation.
A What data was not helpful in supporting your explanation about Wisconsin landforms?
P If you were to discover a new region of the world what would you need to know to learn about its past?
Answers will vary. If students think a particular piece of data was not helpful in supporting an explanation, ask them if it could be helpful by refuting an explanation.
S Complete this sentence and write it in your Science Notebook: ‘I acted like a scientist today when I. . .”
280 Exploring Earth’s Landforms Draft Version 1 March 2006
Advance PreparationPrepare to view the Step 10 slide show with the class, similar to the procedure you used in Steps 1 and 9.
Implementation Guide1. Review the main ideas about Wisconsin
landforms from Lesson 10.1 Restate the main question that students were guided to about Wisconsin landforms.
2. Inform students that in this lesson they will have an opportunity to explain Wisconsin Landforms based on evidence. The data they have is the same kind of data they used in developing explanations for their regions earlier in the unit.
3. Present the Wisconsin Landforms slide show. Use the “Step 10 – Wisconsin Landforms” PowerPoint™ slide show provided on this Unit’s CD. Discuss the guiding questions throughout the slide show and have students record their questions, observations, and inferences in their Science Notebooks.
4. Divide students into groups to study lines of evidence like those presented in earlier parts of this unit. Students may look at maps of earthquake activity from the Seismic/Eruption software program and the GPS data map near the Midwest US. Students may also use the photographs of landforms from their regions and Wisconsin (from the slide show provided on this Unit’s CD) and the Landforms Evidence Chart to develop their explanation. Allow about 15-20 minutes for students to study the data and develop an explanation for which processes affected WI landforms and how. Guide student groups by questioning their evidence (do they notice patterns in the data?) and providing additional information and clarification where necessary.
5. Provide the geologists’ explanation for WI landforms as given in this lesson’s Background Information. If available, show students the back of the Wisconsin Landscapes map from WGNHS. This has a picture of the Wisconsin glaciation ice sheets and describes some of Wisconsin’s landforms. Ask students to compare their answer to the geologists’ answer and note similarities or differences. Use the Landforms Evidence Chart to recall accurate explanations for various landforms.
6. Use the REAPS throughout and after the lesson as appropriate.
Background InformationNote: The following text is adapted from the Wisconsin Geological and Natural History Survey.
The diverse landscapes of Wisconsin can be divided into three major regions. First, the northern and eastern parts of the state were most recently covered by a continental glacier called the Laurentide Ice Sheet. This occurred during a period known as the Wisconsin Glaciation, approximately 26,000-10,000 years ago. These areas of the state have many hills, ridges, plains, and lakes. Second, the central to western and south-central parts of the state were glaciated during advances of early ice sheets, less recently than the northern and eastern areas. This region includes gently rolling hills. Finally, the “driftless area” in southwestern Wisconsin was probably never covered by glaciers. This region contains many streams and rivers that have eroded the landscape over time to look like branching, tree-like patterns on a map.
Glaciation played a very important part in shaping Wisconsin’s landforms. The mark of glaciers is evident in the various landforms found in parts of the state that were once covered by ice. These landforms include kettles, moraines, drumlins, kames, eskers, and erratics. The bedrock geology of Wisconsin also tells a story. Igneous and metamorphic rocks in the northern part of the state are remnants of tectonic activity several billion years ago. Indeed, plate tectonics has its place in Wisconsin history, just not recently as in other world regions studied in this Unit. Sedimentary rocks in other parts of the state were deposited later, mostly when shallow seas covered parts of the state. The Baraboo range in south-central Wisconsin is a good example of a remnant of a mountain range that was once developed by actions of plate tectonics in Wisconsin.
Draft Version 1 March 2006 Step 10: Wisconsin Landforms 281
Step 10 - Lesson 3 Snapshot
Key Concept• The present is the key to the past.• Science is ongoing and inventive and
scientific understandings have changed over time as new evidence is found.
Evidence of StudentUnderstandingThe student will be able to: • communicate how the formation of
landforms in an imaginary region of the world can be explained using the scientific ideas behind plate tectonics and/or erosional processes;
• demonstrate how scientific understandings have changed over time as new evidence is found.
Time Needed50 minutes
MaterialsFor each student• copy of Student Page 10.3A: Develop-
a-Region Project• copy of Student Pages 10.3B and C:
Peer and Self AssessmentFor each group of 2-4 students• modeling materials like those provided
in Step 2• supply of markers or crayons for map-
making
Develop-a-Region1. Review the main ideas from the previous lessons.
Remind students of the three main processes they studied that influence Earth’s landforms: Plate Tectonics, erosion by rivers, and glaciation.
2. Distribute Student Page 10.3A: Develop-a-Region Project and allow students time to write a description of their region, draw a map with a legend, and/or design and build a physical model of their region.
3. Have students display their imaginary regions’ models and descriptions for the rest of the class.
4. Provide students with Student Page 10.3B: Self and Peer Assessment and have them visit some of the projects to provide feedback.
5. Facilitate a whole-class discussion about what the students have learned during this unit.
6. Use the REAPS to have students reflect on their projects and include responses in their diagrams in the form of diagrams and legends.
REAPSR What major landform did you include in
your region?E How did you represent this landform in
your drawing/map?A How did your landform change over
time? P If scientists visited your region, what
might they do to learn about it’s history?S Use the Rubric provided to assess your
project.
282 Exploring Earth’s Landforms Draft Version 1 March 2006
Implementation Guide
1. Review the main ideas from the previous lessons and refer to the Landforms Evidence Chart when applicable. Inform students that they have learned about three main processes that influence Earth’s landforms: plate tectonics, erosion by rivers, and glaciation. Each of these processes develops or somehow influences different kinds of landforms. Students will use what they have learned about each of these processes in this lesson when they develop and explain the landforms in their own region of the world.
2. Distribute the instructions for this project found on Student Page 10.3A: Develop-a-Region Projects. Make sure students understand what they need to do and how much time they have. This could involve one or more class periods depending on how you structure the assessment.
3. Provide students with Student Page 10.3B: Self and Peer Assessment. As students are working on the projects, use the criteria
and rubric to guide them in developing quality projects about their fictional regions.
4. Have students display their models and descriptions for the class. Instruct students to visit 2 or 3 other regions and provide feedback to other students using Student Page 10.3C: Peer and Self-Assessment. Depending on how much class time you have, allow students to critique more or fewer regions as long as they provide in-depth feedback.
5. Facilitate a whole-class discussion about what the students have learned during this unit that makes it possible to better understand our planet. Use some kind of “de-briefing” method to help students retain what they have learned and summarize all of the ideas for everyone.
6. Use the REAPS to have students reflect on their projects and include responses in their diagrams in the form of diagrams and legends.
Draft Version 1 March 2006 Step 10: Wisconsin Landforms 283
Student Page 10.3 A
Develop-a-Region Project
Directions:
1. Develop an imaginary region that includes a landform influenced by one or more of the following processes:
•plate tectonics,
•water erosion,
•glaciation.
2. Develop a visual representation of your region to demonstrate the sequence of events or processes that changed the landform over time. The visual could be in the form of one of the following or any other visual representation you might think of:
•comic strip,
•diagram,
•model.
3. Provide a written description of the events that shaped this landform over time. This could be in the form of:
•a story,
•descriptions in the comic strip,
•an essay.
4. Your project will be displayed in the classroom for your classmates to provide feedback on the visual representation and your written description.

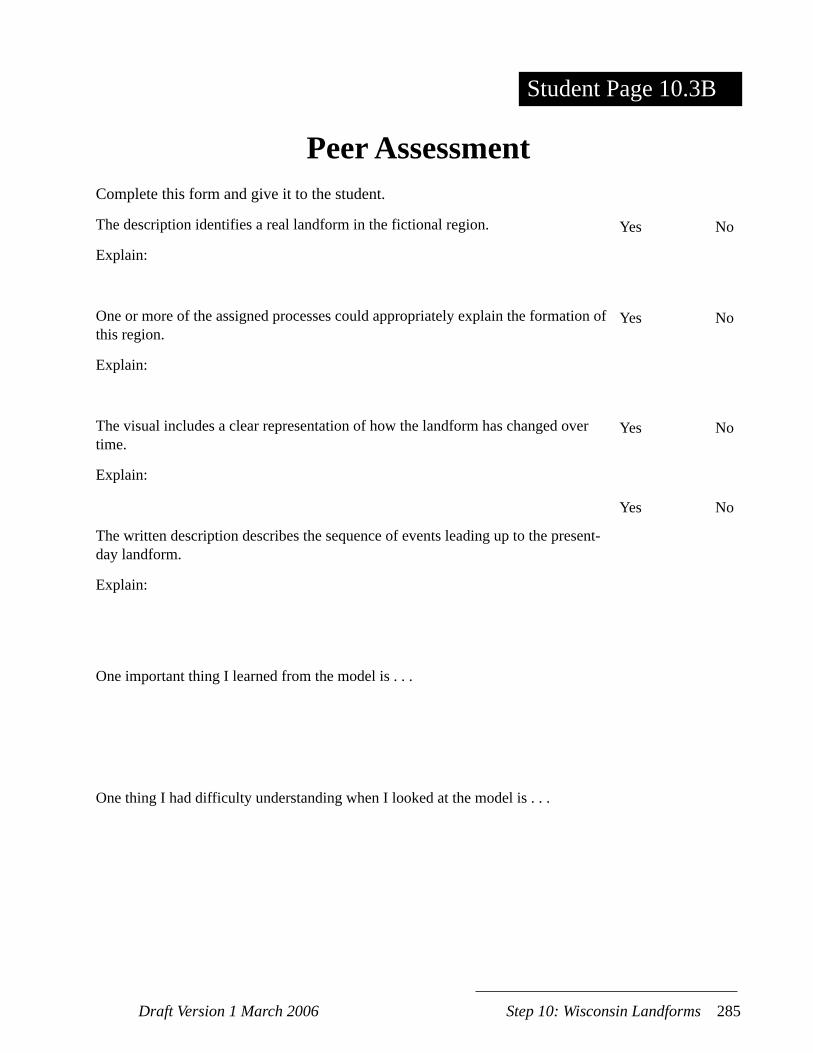
Draft Version 1 March 2006 Step 10: Wisconsin Landforms 285
Student Page 10.3B
Peer AssessmentComplete this form and give it to the student.
The description identifies a real landform in the fictional region.
Explain:
One or more of the assigned processes could appropriately explain the formation of this region.
Explain:
The visual includes a clear representation of how the landform has changed over time.
Explain:
The written description describes the sequence of events leading up to the present-day landform.
Explain:
One important thing I learned from the model is . . .
One thing I had difficulty understanding when I looked at the model is . . .
Yes No
Yes No
Yes No
Yes No

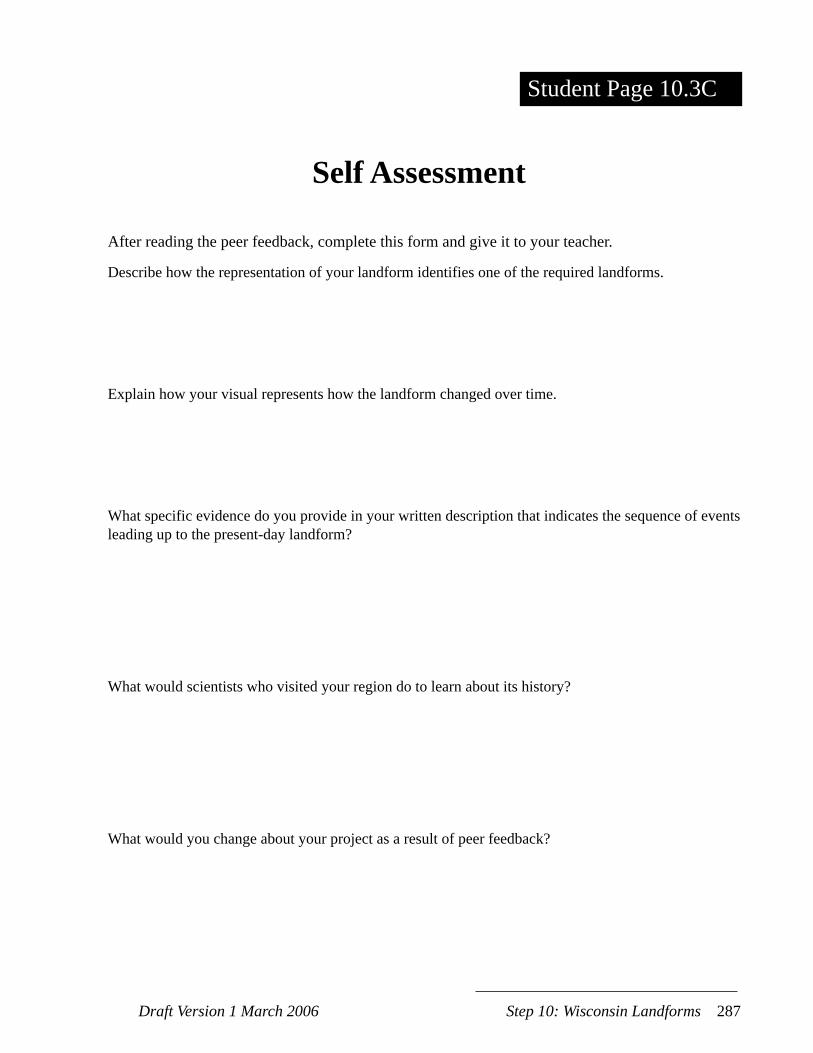
Draft Version 1 March 2006 Step 10: Wisconsin Landforms 287
Student Page 10.3C
Self Assessment
After reading the peer feedback, complete this form and give it to your teacher.
Describe how the representation of your landform identifies one of the required landforms.
Explain how your visual represents how the landform changed over time.
What specific evidence do you provide in your written description that indicates the sequence of events leading up to the present-day landform?
What would scientists who visited your region do to learn about its history?
What would you change about your project as a result of peer feedback?

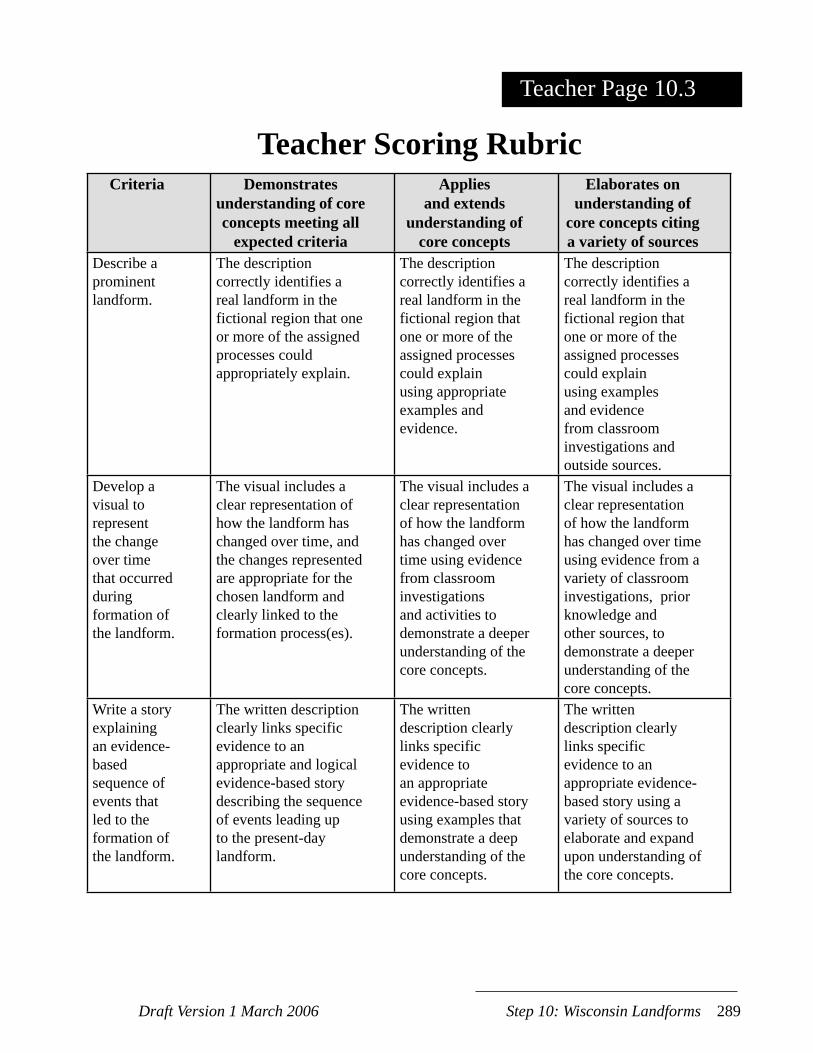
Draft Version 1 March 2006 Step 10: Wisconsin Landforms 289
Teacher Page 10.3
Teacher Scoring RubricCriteria Demonstrates
understanding of core concepts meeting all
expected criteria
Applies and extends
understanding of core concepts
Elaborates on understanding of
core concepts citing a variety of sources
Describe a prominent landform.
The description correctly identifies a real landform in the fictional region that one or more of the assigned processes could appropriately explain.
The description correctly identifies a real landform in the fictional region that one or more of the assigned processes could explain using appropriate examples and evidence.
The description correctly identifies a real landform in the fictional region that one or more of the assigned processes could explain using examples and evidence from classroom investigations and outside sources.
Develop a visual to represent the change over time that occurred during formation of the landform.
The visual includes a clear representation of how the landform has changed over time, and the changes represented are appropriate for the chosen landform and clearly linked to the formation process(es).
The visual includes a clear representation of how the landform has changed over time using evidence from classroom investigations and activities to demonstrate a deeper understanding of the core concepts.
The visual includes a clear representation of how the landform has changed over time using evidence from a variety of classroom investigations, prior knowledge and other sources, to demonstrate a deeper understanding of the core concepts.
Write a story explaining an evidence-based sequence of events that led to the formation of the landform.
The written description clearly links specific evidence to an appropriate and logical evidence-based story describing the sequence of events leading up to the present-day landform.
The written description clearly links specific evidence to an appropriate evidence-based story using examples that demonstrate a deep understanding of the core concepts.
The written description clearly links specific evidence to an appropriate evidence-based story using a variety of sources to elaborate and expand upon understanding of the core concepts.

Related Documents