Exploring Drivers Of Grocery Retail Patronage Within The Generation Z Segment By Robbie Abrams A Thesis Presented to The University of Guelph In partial fulfilment of requirements for the degree of Master of Science in Marketing and Consumer Studies Guelph, Ontario, Canada © Robbie Abrams, August, 2020

Welcome message from author
This document is posted to help you gain knowledge. Please leave a comment to let me know what you think about it! Share it to your friends and learn new things together.
Transcript
Exploring Drivers Of Grocery Retail Patronage Within The Generation Z
Segment
By
Robbie Abrams
A Thesis
Presented to
The University of Guelph
In partial fulfilment of requirements
for the degree of
Master of Science
in
Marketing and Consumer Studies
Guelph, Ontario, Canada
© Robbie Abrams, August, 2020
ABSTRACT
EXPLORING DRIVERS OF GROCERY RETAIL PATRONAGE WITHIN THE
GENERATION Z SEGMENT
Robbie Abrams Advisor
University of Guelph, 2020 Dr. Tanya Mark
This research aims to improve the capacity in which grocery retailer patronage can be
explained from the perspective of generation Z consumers. As this young and underrepresented
demographic grows, the grocery retail industry will need to adapt to the changing preferences of
their consumers. Using a methodology which combines survey and conjoint testing, drivers of
patronage influencing generation Z consumer retail choices are identified and analyzed through
comparisons of their utility. The findings from this research offer firms in the Canadian grocery
industry an opportunity to build their profile on generation Z consumers in order to improve their
appeal and provide a better service to younger consumers as the national grocery shopping
environment continues to evolve.
iii
ACKNOWLEDGEMENTS
Before beginning I would like to acknowledge and highlight the immense contributions
of a number of individuals without which this thesis would not have been possible.
First, this thesis and my entire degree would not have been possible without the
encouragement and support from my incredible supervisor Dr. Tanya Mark. Tanya, without your
support as both an instructor and a mentor, I would never have considered the opportunity to
pursue this thesis at all. You opened so many doors for me while providing a number of valuable
experiences and I will always be grateful.
I also want to thank my committee member Dr. Vinay Kanetkar. Vinay, I spent countless
hours in your office, often unannounced, where you patiently helped me understand what I
previously thought were numerous foreign concepts. You shared your valuable time with me and
I am thankful for your generosity.
I also want thank the entire staff and faculty in the Department of Marketing and
Consumer Studies who made this experience so much more than I could ever have hoped.
Additionally, my fellow MCS cohort, I am always going to value the thoughtful conversation,
idea brainstorming, and academic support you provided.
Last but certainly not least, I would like to thank my friends and family. Mom, Dad,
Steven, Katie and Taylor, you supported me on this journey despite my changing course several
times. You did it with love, compassion, and encouragement, giving me the opportunity to
explore this academic endeavour on my own terms, something I will always appreciate.
iv
Table of Contents
ABSTRACT..................................................................................................................................ii
ACKNOWLEDGEMENTS ......................................................................................................... iii
List of Tables ................................................................................................................................. vi
1. Introduction ..........................................................................................................................1
2. Literature Review...................................................................................................................3 2.1 Who is Generation Z? ..................................................................................................................................... 3 2.2 Drivers of Grocery Retail Patronage ............................................................................................................... 4 2.3 Technological Drivers ..................................................................................................................................... 9 2.4 Summary of Gaps in Literature..................................................................................................................... 13
3. Research Questions.............................................................................................................. 14
4. Study 1 (Pre-test) ................................................................................................................. 14 4.1 Objective ....................................................................................................................................................... 14 4.2 Methodology ................................................................................................................................................ 15
4.2.1 Participants ........................................................................................................................................... 15 4.2.2 Design ................................................................................................................................................... 15 4.2.3 Procedure.............................................................................................................................................. 15
4.3 Results........................................................................................................................................................... 16
5. Study 2: Main Study ................................................................................................................. 17 5.1 Objective ....................................................................................................................................................... 17 5.2 Methodology ................................................................................................................................................ 17
5.2.1 Participants ........................................................................................................................................... 17 5.2.2 Design ................................................................................................................................................... 17 5.2.3 Procedure.............................................................................................................................................. 20
5.3 Results........................................................................................................................................................... 21 5.3.1 Descriptive Statistics ............................................................................................................................. 21 5.3.2 Empirical Approach ............................................................................................................................... 22
6. Discussion ............................................................................................................................ 24 6.1 Influence of Traditional Drivers on Retailer Preference............................................................................... 24
6.1.1 Time to Store (Proximity)...................................................................................................................... 24 6.1.2 Assortment ........................................................................................................................................... 26 6.1.3 Price Promotion .................................................................................................................................... 27
6.2 Influence of Technology Drivers on Retailer Preference ............................................................................. 29 6.2.1 Self-Checkout ........................................................................................................................................ 29 6.2.2 Mobile Coupon ..................................................................................................................................... 30 6.2.3 Mobile App ........................................................................................................................................... 31
6.3 How Combinations of Drivers Influence Retailer Preference ...................................................................... 33 6.3.1 Technology Drivers ............................................................................................................................... 33 6.3.2 The Proximity Question ........................................................................................................................ 34 6.3.3 Traditional and Technology Trade off .................................................................................................. 37
7. Contributions ....................................................................................................................... 39 7.1 Theoretical Contributions ............................................................................................................................. 39 7.2 Managerial Contributions ............................................................................................................................. 40
8. Limitations and Future Research .......................................................................................... 41
9. Conclusion ........................................................................................................................... 44
v
10. References ....................................................................................................................... 45
11. Appendices ...................................................................................................................... 52 Appendix 1: Conjoint Survey Design .................................................................................................................. 52 Appendix 2: Patronage Driver Design Codes ...................................................................................................... 53 Appendix 3: WOM Survey Questions ................................................................................................................. 53 Appendix 4: Perceived Value Survey Questions ................................................................................................. 53 Appendix 5: Demographic Survey Questions ..................................................................................................... 54 Appendix 6: Conjoint Survey Introduction ......................................................................................................... 54 Appendix 7: Choice Alternative Example ........................................................................................................... 55 Appendix 8: Discrete Choice Experiment SAS Code ........................................................................................... 55
vi
List of Tables
Table 1: Conjoint Survey Items .................................................................................................... 19
Table 2: Survey Data Descriptive Statistics.................................................................................. 21
Table 3: Parameter Estimates For Conjoint Results ..................................................................... 22
Table 4: Summary of Utility Values ............................................................................................. 33
Table 5: Assortment and Price Promotion versus 10 Minute Proximity Difference .................... 36
Table 6: Assortment and Price Promotion versus 5 Minute Proximity Difference ...................... 37
Table 7: Assortment and Technology Driver Trade-Off .............................................................. 39
1
1. Introduction
In 2014 the first cohort of generation Z consumers turned 18, marking the beginning of
adult life for the most mysterious albeit socially popular generational segment. While still
relatively young, the generation Z segment is key to sustaining growth in many industries on
account of its increasing size and distinct behaviour. One industry that should view generation Z
as a critical group to study are grocery retailers. Increased competition from discount chains,
value wholesalers, and online stores has chipped away at growth in this historically stable
industry (Kuijpers et al., 2018). Now at a crossroads, generation Z consumers and their decisions
regarding where they shop are more important to grocery retailers than ever before.
The decisions consumers make regarding where, when, and what they buy is captured in
the marketing phenomenon called retailer patronage. Establishing and reinforcing relationships
with consumers is a strategic objective for firms aiming to convert them into “patrons”.
Therefore, identifying the drivers of retail patronage that influence the consumer’s likelihood to
shop at one retailer over another has been a key focus across retail and marketing research (Blut
et al 2018, Pan & Zinkhan 2006). Familiar drivers such as discount depth, proximity to the
retailer, and product assortment (Blattberg et al 1995, Dube et al. 2017, Gupta 1988, Sinha &
Banerjee 2004, Stassen et al 1999) receive significant coverage in marketing literature for their
accuracy in facilitating informed industry decisions while increasing traffic in retail stores.
Years of academic research have reviewed and tested these drivers among several generations of
consumers including baby boomers (born: 1946-1966), generation X (born 1967-1981), and
millennials (born: 1982-1995)1. Insights yielded from these generations have influenced how
1 Generational dates are approximate and reflect an average time period from several studies. (Southgate 2017)
2
retailers price their products, stock their shelves, and even where they open new stores. While
knowledge about the three largest economic segments remains vital to marketers, there is notably
limited research directed toward the emerging cohort of generation Z consumers.
Defined as a segment born 1996 and onwards, generation Z is poised to become the
largest consuming segment within the next decade (Southgate, 2017). Generation Z is a segment
with a growing number of consumers who matured in an age where the internet and mobile
technology have become prominent in everyday life. Growing up in such a connected age, their
exposure to media online, on TV, and on their phones has given the segment access to
information about brands right at their fingertips (IBM, 2017). Several industry reports highlight
the presence generation Z consumers will have on the consumption marketplace by 2020,
including the command of 40 percent of all consumer shopping, upwards of 44 billion dollars in
buying power, all while spending over 5 hours a day online (IBM 2017, Netzer 2017, Shay
2017). As they finish their education, enter the workforce, and start families, the retail
marketplace must prepare to brace for and adapt to the changing needs of a new consumer
segment.
The goal of this research is to investigate factors driving generation Z retailer patronage
from the perspective of the retailer in order to provide actionable insights managers can
implement to increase consumer traffic in their stores. This thesis will identify the relative
effectiveness of the drivers of retailer patronage among the generation Z segment in the grocery
industry. Supermarkets and grocery chains cater to all generations of shoppers and are only
beginning to feel the effects of generation Z buying power. In 2014, the first cohort of generation
3
Z consumers turned 18 and as these young adults mature so will their financial independence. As
generation Z grows into a larger segment of consumers, marketers will require more knowledge
about the young people who are shopping in their stores. This research benefits to grocery
managers in the Canadian marketplace who strive to increase their appeal to a younger cohort of
consumer.
After identifying the need for marketers to treat generation Z consumers as a unique
segment that is satisfied in different ways than its counterparts, the question then shifts to what
patronage differences will influence their behaviour? Building on existing research, this thesis
will assess how generation Z consumers respond differently to key drivers of retailer patronage.
Drivers will be tested among generation Z consumers to demonstrate which continue to resonate
with consumers, which fail to remain significant, and to identify any unknown drivers that are
impacting the younger audience.
2. Literature Review
2.1 Who is Generation Z?
Generation Z is defined as segment of consumers born in 1996 or later (aged less than 23)
who, by the end of 2019, are expected to account for over 32% of the global population
(Bloomberg 2018). Their upbringing coincides almost directly with the widespread diffusion of
internet and mobile technology into everyday lives. In the early 2000s, it was estimated that 37%
of children aged 5-16 engaged in online consumption activity (Greenfield 2004). That number
was reported at 84% in 2013 (Bassiouni & Hackley 2014) with no evidence of slowing down.
4
Due to this heightened exposure to brands and products during their formative years, generation
Z consumers have acquired large amounts of brand knowledge and developed a distinct set of
expectations about their consumption experience compared to previous generations (Wood
2013).
While all generations have had to adapt to evolving technology in their everyday lives,
what sets generation Z apart is that they have not known a world without the internet, mobile
phones, and widespread connectivity. There is a somewhat grey area surrounding the transition
from generation Y (millennials) to generation Z. From a consumption standpoint, the major
characteristic difference is the adoption of technology versus being a technology “native”, one
who has known nothing except how the world is now (Priporas et al 2017). So, while other
generations may have pioneered innovation and connectivity, generation Z adopts a different
perspective, one that sets them apart from other generations by expecting a higher level of
convenience, technological innovation, and connectivity in their shopping experience (Wood
2013). These qualities set generation Z apart as an important segment to market towards because
their upbringing indicates they will have different priorities and expectations than other
generations (Schlossberg, 2016).
2.2 Drivers of Grocery Retail Patronage
The choice of where to shop is a complex decision for the consumer. The answer is
contingent on who the consumer is, coupled with which drivers of patronage they value.
Previous retailer patronage studies have tested their drivers on established generational segments
(i.e. millennials, generation X, baby boomers, etc.). Generation Z consumers are still emerging as
5
a significant segment in the retail marketplace and as a result are underrepresented in the
literature. Heightened technological acumen paired with an upbringing in the connected, digital
age suggests that these consumers will act differently than their predecessors (Bassiouni &
Hackley 2014). An indication of shifting behaviour raises the question about whether or not
existing retailer patronage knowledge will apply to this segment. In order to determine this
change, the following drivers have been identified from existing literature to test among
generation Z consumers to measure whether their impact continues to be relevant for a younger
generation. Each driver chosen for this research was consistently found to carry significant
influence over grocery retail patronage in existing literature. The drivers have been covered
individually or together as indicators of retail preference and consist of a wide range of factors
that affect the customer; from their experiences in store, to the types of products available to buy,
as well as the influences in their lives like their peers and family.
A leading driver of grocery retail patronage are the price promotions offered for products
sold by the retailer. Price promotions can be defined as “temporary price discounts offered to the
customer” (Blattberg et al 1995). There are two strategies managers can use when implementing
price promotions; using smaller discounts at a high frequency or larger discounts at a small
frequency (Alba et al 1999). The discount size offered within the price promotion offers the most
direct view of how this driver will influence the consumer’s patronage decision. Therefore, we
will consider the depth (size) of the discount consumers receive on the products they buy as the
driver for the duration of this thesis. In his 1988 article, Gupta shows how consumers are more
likely to purchase a discounted product over non-discounted competing products while
simultaneously consuming more of that product. Using a multinomial logit model, Gupta
6
empirically shows that promotional price cuts (discounts) result in a positive coefficient for both
choice (= 0.716) and quantity (= 0.321) of the purchase for a specific product. Further
research in the price promotion space has investigated promotion strategies such as loss leaders
or double couponing. A study conducted by Walters and Rinne (1986) found that the
effectiveness of these promotions on overall store performance was likely contingent on the
characteristics of the retailer’s consumers. Their study looked at three grocery retailers who
appealed to different demographics and found that the effectiveness of the discount varied store
to store. In the context of this thesis it will be important to capture whether discount depth
influences retailer patronage choices for the generation Z segment more or less effectively than it
has been shown for previous generations.
Another driver shown to influence the consumer’s grocery retail selection is product
assortment. Consumers want to maximize their efficiency when shopping and ideally would buy
everything they need at the lowest price in one retail location (Stassen et al, 1999). Product
assortment can be defined as the total set of products offered by the retailer, reflecting both the
breadth and depth of product lines (Simonson, 1999). The challenge facing retailers is that many
product categories consist of far too many SKUs (product options) for one retailer to stock
(Mittelstaedt & Stassen, 1990). Despite similar products within categories, there are very few
options that every retailer would carry. This means that product assortment and availability can
play a critical role in a consumer’s patronage decision. If the retailer does not carry what the
consumer wants, they may lose that consumer to a competitor, even if the initial retailer carries
several other products desired for the consumer’s basket. Stassen and colleagues (1999)
empirically showed that product assortment is a stronger driver of customer preference than
7
price. In their study, the researchers use multiple regression to test customer overlap between
retailers of varying geographical distances as a measure to identify where customers would
prefer to shop. The results showed that differentiation in price was not significant (P>0.1) in
influencing consumer overlap in almost all product categories. Comparatively, increased product
assortment in retailers resulted in a positive, significant coefficient ranging from 0.18 to 0.36 at
each distance level (1 to 10 miles) tested in the study. These findings are important because they
show that under the same conditions, consumers care more about the assortment of products in
the retailers they choose than the prices they are receiving. If retailers better align their product
assortment with the needs of the consumer, then successful retailers are better positioned to gain
the consumer’s business compared to a competitor who offers lower prices but not all the desired
products. Creating an optimal assortment experience would suggest a positive relationship to
generation Z patronage and therefore is included in our testing for further investigation.
The geographical location of the retailer in relation to the consumer is one of the earliest
drivers of retail patronage. Coined as the “Law of Retail Gravitation” by Reilly (1931), the
concept suggests that a shopping center’s attraction can be considered as inversely proportional
to the driving time from the consumer’s home center. This law laid the foundation for
subsequent research investigating how proximity to the retailer affected consumer patronage
decisions. One such study was conducted by Sinha and Banerjee (2004) who tested a host of
patronage drivers that affected retailer choices. The results found that within the grocery
category, proximity to the retailer was the strongest indicator of preference. Using a multinomial
logit analysis on their survey data, the researchers found that proximity had a significant
(P<0.01), positive (= 0.8695) effect on retailer choice. Furthermore, results showed that 36.67%
8
of respondents selected proximity to the retailer as their number 1 choice for why they preferred
a particular retailer. This is an example of a commonly considered driver that has not been
investigated in the context of generation Z and will be tested further in this thesis.
When they make purchasing decisions, consumers constantly trade off price and quality
in the products they buy. Gerstner (1985) investigates this trade-off with a question asking
whether higher prices signal higher quality products. His study concludes that the price-quality
relationship is weak and in many product categories price does not accurately reflect the highest
quality products. Therefore, the onus is placed on the consumer to decide for themselves what
constitutes value in their purchases. In 1988 Zeithaml explored the different ways in which value
can be perceived, ranging from the price paid to the benefit the product offers the consumer.
Zeithaml’s research suggests that the consumer has a different set of objectives when selecting a
retailer and how they perceive the retailer’s offering of value has been shown to influence their
preference. Perceived value can be broken down into four different levels, each indicating an
individual perception of value: (1) value as low price, (2) value is what I want in a product, (3)
value is the quality I get for the price I pay, and (4) value is what I get for what I give (Zeithaml
1988). On each level the consumer’s idea of what defines value is slightly different. Depending
on what they perceive or how strongly they consider it, the consumer may be more or less likely
to consider this driver when making their patronage decision.
Another driver of grocery retailer preference offering marketing managers insight into
retailer patronage decisions is Word of Mouth (WOM). WOM can be defined as positive or
negative engagement about a brand within a consumer’s community (East et al, 2007). As
9
communities continue to migrate online at a rate of up to 70% per year, retailers and researchers
alike must react accordingly (Groeger & Buttle, 2016). An empirical study conducted by Kumar
and colleagues (2013) tested the value of WOM as a factor that can successfully aid in
stimulating traffic to products and brands. Their study on positive WOM offered a model that
predicted and applied their own estimates for social media influences on sales. Using their
predictive model the researchers showed a significant correlation (r=0.87) between positive word
of mouth from key influencers and sales generated during a set time period. The resulting
findings indicate strong evidence for the significance of WOM on influencing consumer
shopping choices. Unlike other drivers of retailer preference, WOM is not as clearly defined as a
price point, distance, or physical availability of products (Brown et al. 2005). WOM influences
through consumer to consumer channels, both in person and online. Within generation Z
consumers, online connectivity is a huge distinguishing feature of the segment and they have
been shown to spend much more of their time tied to their devices. Including this driver in our
research addresses the technological experience of generation Z to determine if connectivity to
peer-to-peer networks increase the influence WOM can have on retailer patronage.
2.3 Technological Drivers
This thesis will extend beyond the identified key drivers of patronage to explore
additional factors that may influence generation Z consumers. Generation Z is the technology
driven generation, noted by their higher usage rates of smartphone and social media technologies
in addition to their earlier age of technology adoption (Bassiouni & Hackley 2014). Familiarity
with consistent connectivity as well as a heightened acumen for integrating technology into their
lives presents an opportunity to explore new drivers of patronage. Specifically, how the
10
implementation of technological elements in the grocery retailer can influence retailer patronage
in a similar capacity to the previously discussed drivers.
Technology in grocery retailers has rapidly evolved in the past decade (Forrester 2015,
Inman & Nikolova 2017, NCR 2014, ) with the inclusion of new features such as self-checkout,
mobile couponing, and the increased prevalence of retailer specific mobile apps. These
innovations in the retail space create new interactions for consumers. For some, in older
generations, these changes require an adaptation to the traditional shopping experience. For
generation Z technology is a native element, a characteristic in their lives they have not lived
without. This familiarity to technology creates a completely different perception of the retailer
for generation Z consumers compared to older segments in the market. The presence of each
technology driver: automated self-checkout, mobile coupon delivery, and retailer app
compatibility enhances the experience the consumer has within the store (Meuter et al. 2000,
Inman & Nikolova 2017)
One of generation Z’s most valuable resources, similar to all generations, is their time.
Grewal and colleagues (2003) empirically showed that wait times are a driver of retailer
patronage. Using a maximum likelihood model the researchers showed a significant (p<0.01),
negative (= -0.32) total effect of wait times on retailer patronage decisions. Their findings
indicated that if consumers know a retailer can offer them an experience with limited waiting
time, the consumer will prefer that option (Grewal et al 2003). Self-checkout technology
immediately addresses wait time concerns. Automated self-checkout is an appealing upgrade for
the retailer, cutting down on staff while offering more kiosks for consumers to make their own
11
purchases. The only caveat to this solution is the requirement for the consumer to maneuver the
technology successfully. In today’s grocery marketplace generation Z consumers are willing to
use this technology to speed up their checkout, with 90% identifying themselves as self-checkout
users (NCR 2014). This preference by generation Z consumers to use self-checkouts during their
shopping experience indicates that the availability of this technology while shopping could
influence their patronage of a particular retailer. To our knowledge self-checkout technology has
not been tested as a driver of retailer patronage for any generation. Therefore it presents an
opportunity to investigate further how consumers view integrated technology in their shopping
experience
The second technology driver of the shopping experience is the consumer’s ability to
coordinate mobile couponing with their purchases. Mobile couponing literature indicates that
attitudes toward the coupon and redemption rates are tied the consumer’s ability to view their
smartphone as a medium for receiving a discount (Dickinger & Kleijnen 2008). Traditionally,
these discounts come in the form of physical coupons and in-store specials. However, the rise of
the smartphone has allowed retailers and brands to offer coupons remotely, customized to the
consumer’s demographic profile (Im & Ha 2012). Offering mobile coupons creates another
opportunity for consumers to save and with their increased technological savviness, generation Z
consumers are comfortable on their phones. At the grocery store, mobile devices are the first
point of online contact for the consumer (Forrester 2015) and there is an opportunity for the
retailer to insert couponing offers at any point during the shopping experience. If retailers are
able to connect with consumers physically in their stores as well as remotely through their
12
devices, the overall experience with the retailer can be enhanced and lead to an increased drive
for the consumer to select the retailer (Dube et al 2017).
The final technology driver builds off of the mobile couponing advantage to consider the
effect of retailer specific apps on the consumer shopping experience. Offering generation Z
consumers the opportunity to use their mobile device to aid in shopping can not only improve the
convenience of the experience but also create a relationship between the consumer and the
retailer (Peng et al 2014). Gray (2015) conducted a study of retailer apps analyzing reviews and
ratings online in the Android and IOS app stores. The investigation found that the strongest
performers were the ones who optimized the relationship between delivering content at the
correct moments while creating seamless operating experiences for consumers. The study was
conducted in the American marketplace and found that grocery stores scored the second lowest
average rating among retail app categories, indicating this segment has a long way to go creating
an online experience for their consumers. For consumers in the generation Z segment who have
indicated they want to be making their purchases in store (IBM 2017), grocery retailers have not
been making the collaboration work between tech savvy consumers and their mobile presence.
The application of mobile app technology on the grocery shopping experience is still an
emerging field and has yet to be maximized by retailers. Including mobile app availability as a
driver in this study may yield insight into how generation Z consumers want to shape their
grocery retailer experience. IBM (2017) research indicates generation Z consumers average over
5 hours of internet connectivity each day. Mobile app compatibility for grocery retailers is a
driver of retailer patronage marketing managers can control in their appeal to a younger
audience.
13
2.4 Summary of Gaps in Literature
As previously discussed, there is a shared gap in the retailer patronage literature that does
not account for the differentiation between generation Z and its generational counterparts. There
is mounting evidence that generation Z consumers will behave differently than previous
generations. Given reports about generation Z’s shopping preferences there is a gap in existing
research which does not identify significant drivers of retailer patronage for consumers in this
segment. This thesis addresses this gap through proposed testing of five key drivers historically
shown to influence patronage behaviour among older generations. All five drivers (discount
depth, product assortment, proximity, perceived value, and WOM) chosen for this thesis are tied
to preliminary generation Z evidence that suggests there is insight to be gained through further
testing.
An additional gap in the literature is the limited research investigating the influence of
technological features as drivers of grocery retail patronage. All three technology based drivers:
self-checkout, mobile coupons, and retailer focused apps enhance the consumer’s retail
experience. Given evidence positioning generation Z as technology natives who spend upwards
of 5 hours connected to technology each day (IBM 2017), there is substantive support for testing
these drivers further.
14
3. Research Questions
The behavioural and lifestyle differences between generation Z and its predecessors
cannot be ignored. Raised with a more critical and comparative view on the products and brands
they consume, generation Z will exhibit different retailer selection behaviour than their
millennial, generation X, or baby boomer counterparts. There is a gap in the literature and
marketplace in terms of understanding how this segment makes retailer choices. Managers must
prepare to understand this generation’s retailer selection process now, in order to maintain a
competitive advantage in the future.
Addressing the need for a better understanding of generation Z’s retailer patronage
preferences this thesis will aim to empirically answer the following research questions:
1. Which drivers influence generation Z consumers’ grocery retailer patronage preferences?
2. Do technology-driven features in the grocery shopping experience influence the
patronage preferences for the generation Z segment?
3. Do combinations of technological and retail drivers lead to increased consumer
preference for the grocery retailer?
4. Study 1 (Pre-test)
4.1 Objective The pre-test was conducted as an investigative survey to aid in identifying conjoint
survey levels for several of the drivers in the main study. Existing research for the product
assortment, price promotion, and proximity drivers vary in the scales used to measure their
15
influence. The objective of the pre-test is to identify levels for the discrete choice design that are
relevant for the generation Z audience.
4.2 Methodology
4.2.1 Participants There were 72 undergraduate students from the University of Guelph’s student research
pools recruited to complete the online study. This number met the participant power
requirements which was calculated by conducting a power analysis using G*Power software.
The input for the model includes: tails=2, effect size=0.5 (medium), alpha= 0.05, power=0.95,
allocation ratio=1.
4.2.2 Design The study consists of six categories of questions asking the participants about their
grocery shopping behaviour. Consumers were asked probing questions that address each of the
patronage drivers identified for the conjoint study including: product assortment, discount depth,
proximity, couponing, mobile usage, and self-checkout. In addition, they were given the
opportunity to elaborate on additional “factors” that influence their grocery store preferences.
4.2.3 Procedure Participants expressing interest in completing the study received a link to the Qualtrics
driven survey in their email. Participants were reminded to only begin the survey if their birthday
was in 1996 or later, making them qualified members of generation Z. Before beginning the
survey, participants were asked to read a consent form and agree to participate in the survey.
After beginning the survey, they were asked their birth year and if it did not fall into the
generation Z range they were directed to the end of the survey and their response was omitted.
16
Next, participants were asked a series of questions about their grocery shopping
purchasing behaviour. The questions asked participants to select products and categories they
had recently bought on past shopping trips.
Next, participants were questioned about their experiences in grocery stores. They were
asked about the technology they used while shopping including smartphones and self-checkout
services. They were also asked about the amount of time it took them to travel to the grocery
store. These questions were followed up by several demographic questions which can be found
in Appendix 5.
4.3 Results There were three sections of the pre-test that informed the main study: product
assortment, price promotions, and proximity. The questions asked in the pre-test informed how
each driver would be communicated in the main study’s conjoint analysis.
With the product assortment driver, the key result was determining a grocery category
(dairy, baked goods, juice…etc.) that respondents commonly purchased from when they bought
groceries. This category would become the focus for the product assortment driver in the
conjoint analysis. The pre-test determined that produce, fresh fruits and vegetables, were the
most appropriate category to use with 75% of pre-test respondents choosing it as a category they
bought from on their last shopping trip.
A similar criterion was used to inform the price promotion driver of the conjoint analysis.
The pre-test determined a category of product where consumers would receive a discount. For
this driver the second highest purchased product category was selected as an appropriate group to
receive a discount. Milk was selected by approximately 42% of respondents and was chosen to
be the product to which a discount was applied in the main study.
17
The final result that directly linked the pre-test to the main study was proximity.
Respondents of the pre-test were asked how long it took them to travel to the store on their last
shopping trip. This question informed the four levels of distance to include in the main study
conjoint analysis. Approximately 85% of respondents indicated a travel time between 5-20
minutes. These results supported the range of travel times included in the main study.
5. Study 2: Main Study
5.1 Objective
The main study investigates how each of the drivers that were identified in the literature
review influence generation Z consumer’s retailer patronage behaviour. This study addresses
which drivers are most influential to retailer preference as well as which combinations of drivers
prove most effective for retailer selection among the target audience.
5.2 Methodology
5.2.1 Participants After completion of the study, 237 undergraduate participants were recruited through the
University of Guelph student research pool. The number of participants met the power
requirement calculated by conducting analysis using G*Power software. The input for the model
includes: tails=2, effect size=0.25 (medium), alpha= 0.05, power=0.95, allocation ratio=1.
5.2.2 Design The main study tested eight drivers of grocery retail patronage through a survey
comprised of two component, scale based questions and a discrete choice experiment. The first
component of the study asked a two sets of survey questions drawn from literature to test the
WOM and Perceived Value drivers. The WOM driver asked 4 questions using a seven-point,
18
never-frequently scale adapted from Brown and colleagues’ 2005 battery (Appendix 3). The
Perceived Value driver also asked 4 questions using a seven point, never-frequently scale based
on Zeithaml’s 1988 development of the driver (Appendix 4).
The other six proposed drivers were included as retailer attributes in a discrete choice
experiment. Based on the results of the pre-test as well as insight from existing literature, each
driver included 2-4 levels randomly assigned to each option (Appendix 1). The question set and
level distribution was created using a discrete choice experiment design code through SAS. The
SAS discrete choice code (Appendix 8) created 18 choice sets with two questions per set with
even distribution of item levels across the choices participants received. The survey design
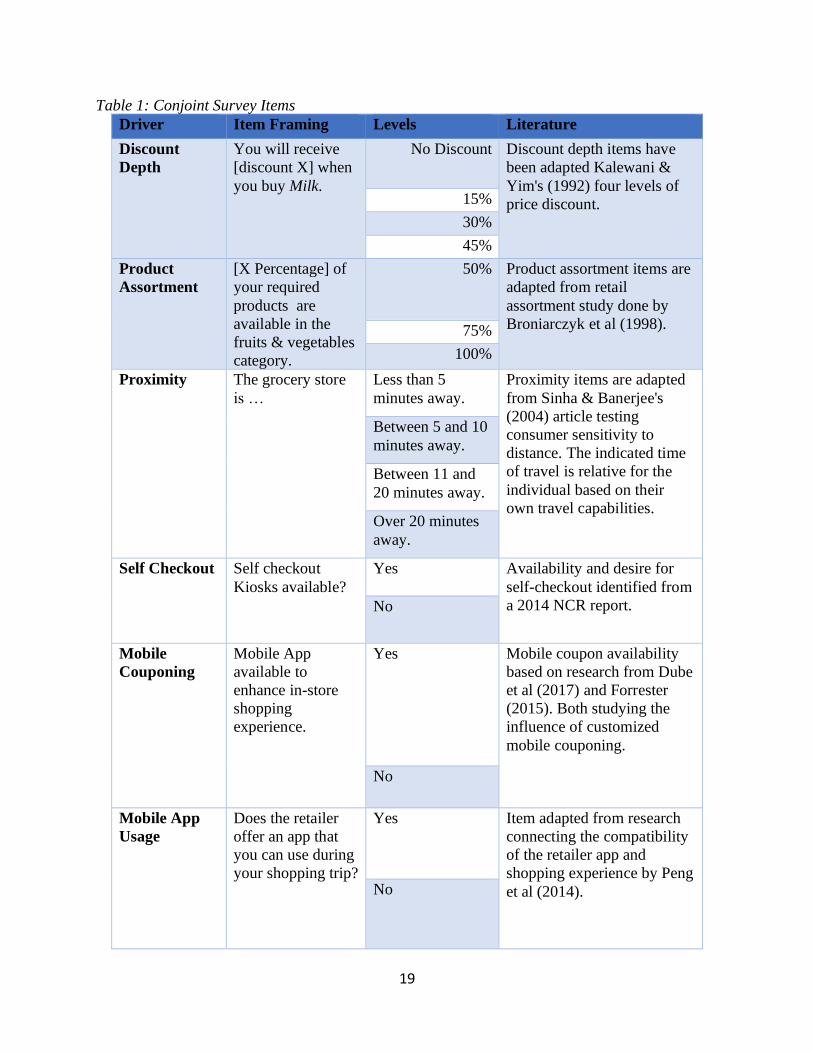
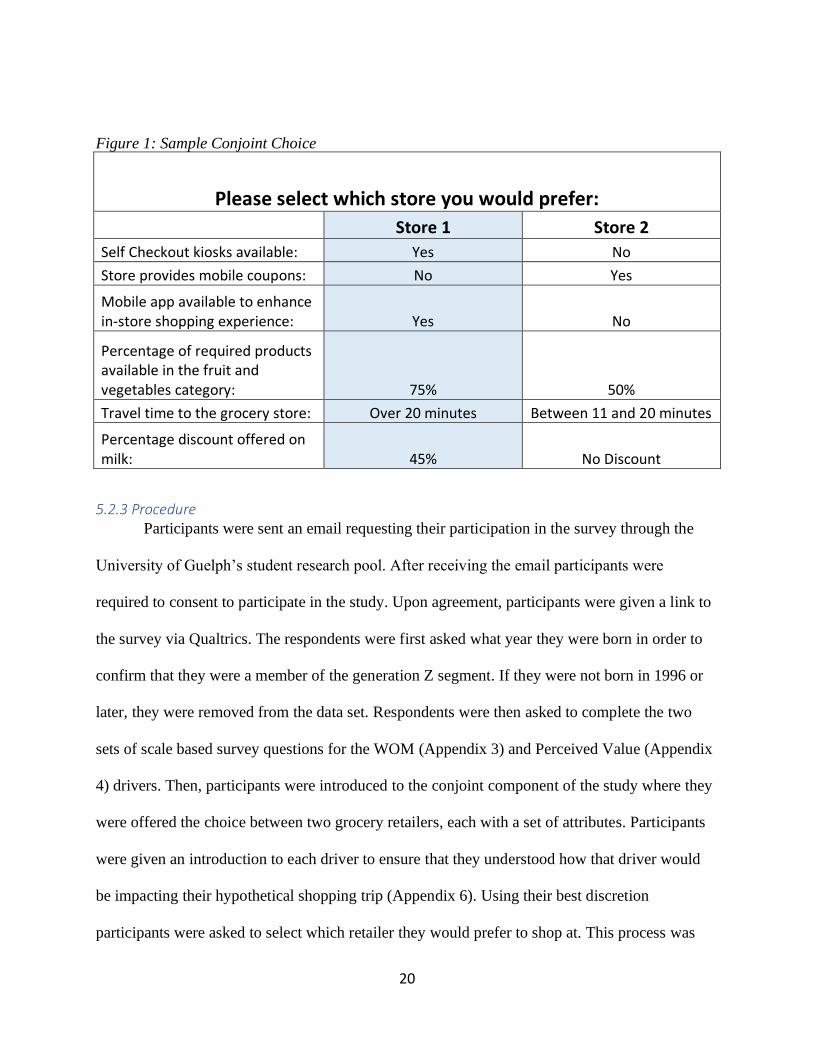
evenly distributed the six drivers and their levels (Table 1) by framing each choice as a shopping
decision between two hypothetical grocery retailers (Figure 1).
Participants were given brief descriptions of each driver included in the experiment
(Appendix 6) in order to prime the experiences they might associate with their choices. The
survey design included 18 hypothetical retailer choices for participants to make. A summary of
driver level distribution and their coding can be found in Appendices 1 and 2.
After completing the conjoint section of the survey participants were asked to answer
several demographic questions to investigate their shopping habits. These questions help analyze
the utility of each driver across demographic groups of consumers while simultaneously
confirming each respondent is a member of generation Z. A complete summary of the
demographic questions can be found in Appendix 5.
19
Table 1: Conjoint Survey Items
Driver Item Framing Levels Literature
Discount
Depth
You will receive
[discount X] when
you buy Milk.
No Discount Discount depth items have
been adapted Kalewani &
Yim's (1992) four levels of
price discount. 15%
30%
45%
Product
Assortment
[X Percentage] of
your required
products are
available in the
fruits & vegetables
category.
50% Product assortment items are
adapted from retail
assortment study done by
Broniarczyk et al (1998). 75%
100%
Proximity The grocery store
is …
Less than 5
minutes away.
Proximity items are adapted
from Sinha & Banerjee's
(2004) article testing
consumer sensitivity to
distance. The indicated time
of travel is relative for the
individual based on their
own travel capabilities.
Between 5 and 10
minutes away.
Between 11 and
20 minutes away.
Over 20 minutes
away.
Self Checkout Self checkout
Kiosks available?
Yes Availability and desire for
self-checkout identified from
a 2014 NCR report. No
Mobile
Couponing
Mobile App
available to
enhance in-store
shopping
experience.
Yes Mobile coupon availability
based on research from Dube
et al (2017) and Forrester
(2015). Both studying the
influence of customized
mobile couponing.
No
Mobile App
Usage
Does the retailer
offer an app that
you can use during
your shopping trip?
Yes Item adapted from research
connecting the compatibility
of the retailer app and
shopping experience by Peng
et al (2014). No
20
Figure 1: Sample Conjoint Choice
Please select which store you would prefer:
Store 1 Store 2
Self Checkout kiosks available: Yes No
Store provides mobile coupons: No Yes
Mobile app available to enhance in-store shopping experience: Yes No
Percentage of required products available in the fruit and vegetables category: 75% 50%
Travel time to the grocery store: Over 20 minutes Between 11 and 20 minutes
Percentage discount offered on milk: 45% No Discount
5.2.3 Procedure Participants were sent an email requesting their participation in the survey through the
University of Guelph’s student research pool. After receiving the email participants were
required to consent to participate in the study. Upon agreement, participants were given a link to
the survey via Qualtrics. The respondents were first asked what year they were born in order to
confirm that they were a member of the generation Z segment. If they were not born in 1996 or
later, they were removed from the data set. Respondents were then asked to complete the two
sets of scale based survey questions for the WOM (Appendix 3) and Perceived Value (Appendix
4) drivers. Then, participants were introduced to the conjoint component of the study where they
were offered the choice between two grocery retailers, each with a set of attributes. Participants
were given an introduction to each driver to ensure that they understood how that driver would
be impacting their hypothetical shopping trip (Appendix 6). Using their best discretion
participants were asked to select which retailer they would prefer to shop at. This process was
21
repeated for the eighteen retailer choices. Each respondent of the survey received the same
eighteen retailer choices, however, the order they received those choices was randomized for
each participant. Finally, respondents answered several follow-up exploratory and demographic
questions before confirming the submission of their data for the survey.
5.3 Results
5.3.1 Descriptive Statistics
Table 2: Survey Data Descriptive Statistics
Descriptive Statistics Survey Data
N= 237
Mean SD Reliability
(∝)
Perceived
Value
5.45 1.30 0.69
Word of
Mouth
3.63 1.46 0.89
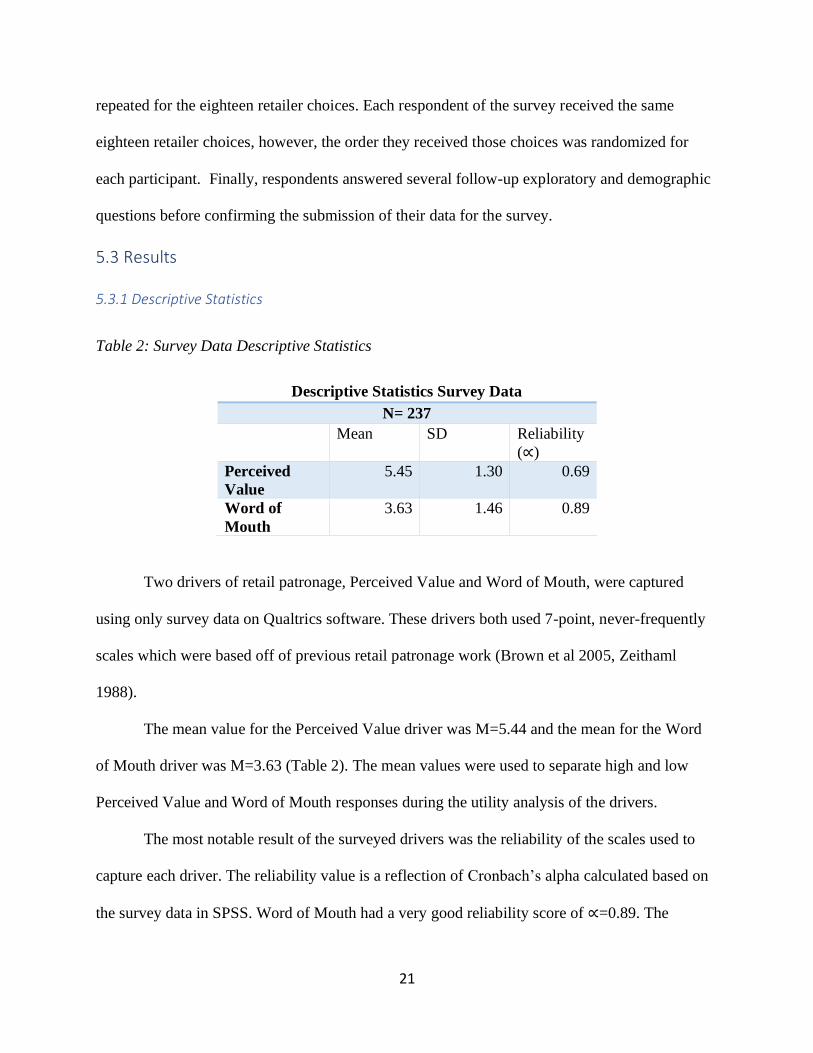
Two drivers of retail patronage, Perceived Value and Word of Mouth, were captured
using only survey data on Qualtrics software. These drivers both used 7-point, never-frequently
scales which were based off of previous retail patronage work (Brown et al 2005, Zeithaml
1988).
The mean value for the Perceived Value driver was M=5.44 and the mean for the Word
of Mouth driver was M=3.63 (Table 2). The mean values were used to separate high and low
Perceived Value and Word of Mouth responses during the utility analysis of the drivers.
The most notable result of the surveyed drivers was the reliability of the scales used to
capture each driver. The reliability value is a reflection of Cronbach’s alpha calculated based on
the survey data in SPSS. Word of Mouth had a very good reliability score of ∝=0.89. The
22
Perceived Value reliability was ∝=0.69, which is an acceptable value to include in the analysis.
With acceptable levels of scale reliability, both Word of Mouth and Perceived Value findings are
included in the analysis of survey results.
5.3.2 Empirical Approach
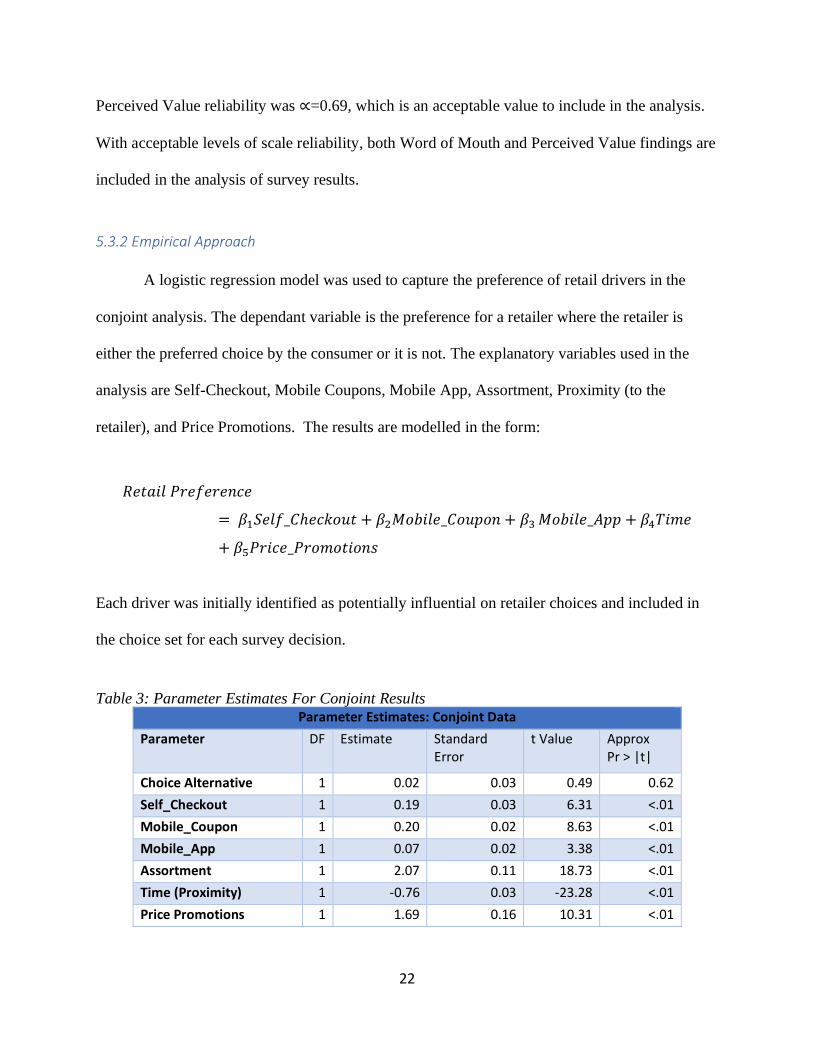
A logistic regression model was used to capture the preference of retail drivers in the
conjoint analysis. The dependant variable is the preference for a retailer where the retailer is
either the preferred choice by the consumer or it is not. The explanatory variables used in the
analysis are Self-Checkout, Mobile Coupons, Mobile App, Assortment, Proximity (to the
retailer), and Price Promotions. The results are modelled in the form:
𝑅𝑒𝑡𝑎𝑖𝑙 𝑃𝑟𝑒𝑓𝑒𝑟𝑒𝑛𝑐𝑒
= 𝛽1𝑆𝑒𝑙𝑓_𝐶ℎ𝑒𝑐𝑘𝑜𝑢𝑡 + 𝛽2𝑀𝑜𝑏𝑖𝑙𝑒_𝐶𝑜𝑢𝑝𝑜𝑛 + 𝛽3 𝑀𝑜𝑏𝑖𝑙𝑒_𝐴𝑝𝑝 + 𝛽4𝑇𝑖𝑚𝑒
+ 𝛽5𝑃𝑟𝑖𝑐𝑒_𝑃𝑟𝑜𝑚𝑜𝑡𝑖𝑜𝑛𝑠
Each driver was initially identified as potentially influential on retailer choices and included in
the choice set for each survey decision.
Table 3: Parameter Estimates For Conjoint Results
Parameter Estimates: Conjoint Data
Parameter
DF
Estimate
Standard Error
t Value
Approx Pr > |t|
Choice Alternative 1 0.02 0.03 0.49 0.62
Self_Checkout 1 0.19 0.03 6.31 <.01
Mobile_Coupon 1 0.20 0.02 8.63 <.01
Mobile_App 1 0.07 0.02 3.38 <.01
Assortment 1 2.07 0.11 18.73 <.01
Time (Proximity) 1 -0.76 0.03 -23.28 <.01
Price Promotions 1 1.69 0.16 10.31 <.01
23
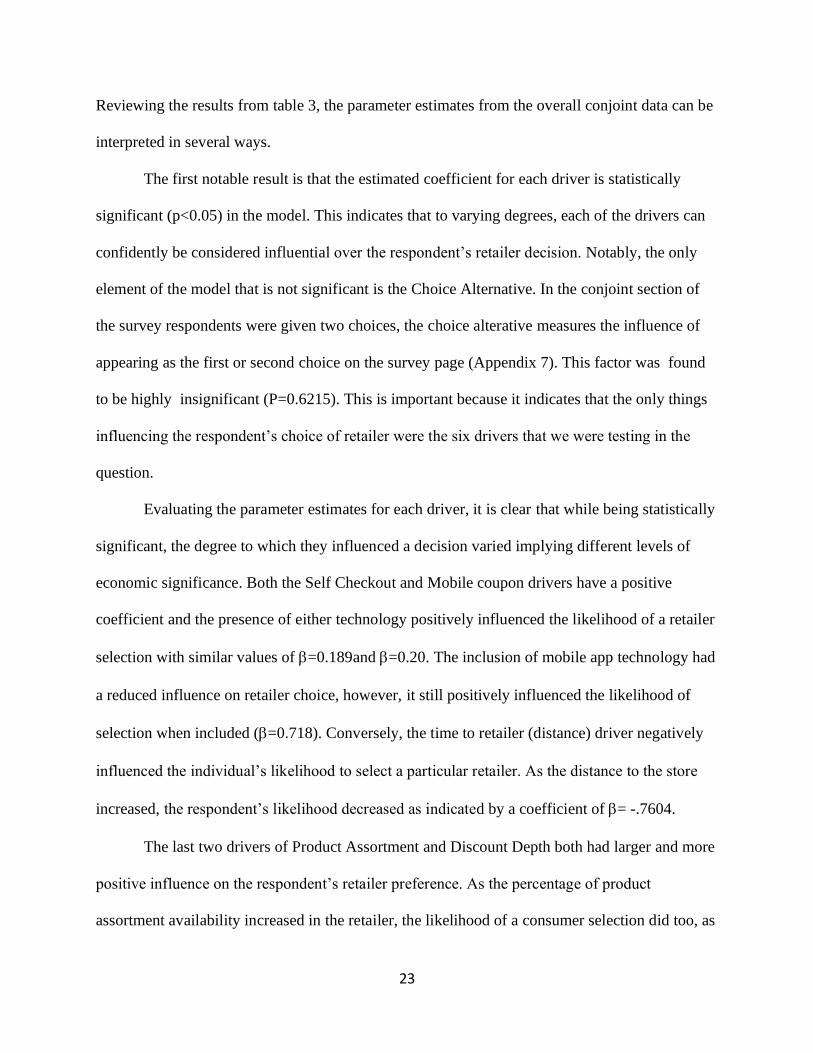
Reviewing the results from table 3, the parameter estimates from the overall conjoint data can be
interpreted in several ways.
The first notable result is that the estimated coefficient for each driver is statistically
significant (p<0.05) in the model. This indicates that to varying degrees, each of the drivers can
confidently be considered influential over the respondent’s retailer decision. Notably, the only
element of the model that is not significant is the Choice Alternative. In the conjoint section of
the survey respondents were given two choices, the choice alterative measures the influence of
appearing as the first or second choice on the survey page (Appendix 7). This factor was found
to be highly insignificant (P=0.6215). This is important because it indicates that the only things
influencing the respondent’s choice of retailer were the six drivers that we were testing in the
question.
Evaluating the parameter estimates for each driver, it is clear that while being statistically
significant, the degree to which they influenced a decision varied implying different levels of
economic significance. Both the Self Checkout and Mobile coupon drivers have a positive
coefficient and the presence of either technology positively influenced the likelihood of a retailer
selection with similar values of =0.189and =0.20. The inclusion of mobile app technology had
a reduced influence on retailer choice, however, it still positively influenced the likelihood of
selection when included (=0.718). Conversely, the time to retailer (distance) driver negatively
influenced the individual’s likelihood to select a particular retailer. As the distance to the store
increased, the respondent’s likelihood decreased as indicated by a coefficient of = -.7604.
The last two drivers of Product Assortment and Discount Depth both had larger and more
positive influence on the respondent’s retailer preference. As the percentage of product
assortment availability increased in the retailer, the likelihood of a consumer selection did too, as
24
represented by a coefficient of =2.0739. A similar case was found for the discount depth
respondent’s received on milk products. As the percentage of discount increased, the likelihood
of retailer selection did as well, represented by a coefficient of =1.6911.
6. Discussion
To the best of our knowledge, there has been limited research focused on studying generation
Z consumers’ grocery retail patronage in the existing academic literature. This thesis is the first
to solely focus on what motivates generation Z consumers when they are selecting which grocery
retailer to patronize using a conjoint analysis methodology. This research tested six drivers of
retailer patronage through a combined survey and conjoint study. The objective of this research
was to address three primary research questions including: identifying which individual
patronage drivers influenced generation Z consumers, whether new technologically driven
drivers had an effect on retailer preference, and which combinations of drivers increased
consumer preference.
Using parameter estimates from Table 3 the utility of each of the six drivers of patronage
were determined. The utility was used to identify how the inclusion or degree in which a driver is
offered by a retailer influences the respondent’s likelihood of preference. A complete summary
of these utilities can be found in Table 4 and are discussed in the following sections.
6.1 Influence of Traditional Drivers on Retailer Preference
6.1.1 Time to Store (Proximity)
The proximity driver was measured using intervals of time representing how long it
would take the respondent to reach the grocery retailer. In the conjoint analysis this driver was
measured using four levels, representing incremental time increases to travel to the retailer.
25
The utility analysis measured how the respondent’s preference for the retailer shifted as
the time to get to the retailer increased. This analysis was conducted using the furthest distance
(over 20 minutes to retailer) as the baseline to compare against. The results showed that when the
largest difference was shown between choice (15 minutes), respondents preferred the closest
retailer 91% of the time. As the difference decreased (10 minutes), respondents preferred the
closer retailer 82% of the time. Finally, when the difference between retailers was only 5
minutes, respondents preferred the closer retailer 68% of the time.
When analyzing these results from a demographic perspective, the largest difference in
proximity utility was seen with respondents who scored in the low Word of Mouth group. These
individuals preferred the closer option 6%, 8%, and 6% more than the high Word of Mouth
group at each of the three difference levels. Gender and Perceived Value factors did not show
large differences between their demographic groups and mirrored the utility preferences of the
overall analysis.
The proximity driver represented the largest difference in preference among drivers of
retailer patronage. With all three time intervals indicating strong differences between the closer
and further options (82%, 64%, and 36%). The distance to the retailer had the biggest effect on
respondents’ likelihood to choose a specific retailer. This finding aligns with much of the
existing literature which supports proximity as a driver of retailer patronage. The findings from
this research support this driver from a generation Z perspective, contributing evidence that
existing findings about proximity as a driver also can apply to the younger generation who had
not been included in other studies. For marketing manager and grocery retailers, these findings
align well with existing research that indicate convenient physical presence is critical when
appealing to consumers (Pan & Zinkhan 2006). Respondents were strongly influenced by the
26
time it takes them to travel to a grocery store, especially when that difference is more than 10
minutes in travel time.
6.1.2 Assortment
Product assortment relates to the availability of the products the consumer intends to buy
at the target retailer. The driver captured the percentage of the consumer’s intended basket that
was available at the retailers outlined in the conjoint analysis. This driver has three levels: 50%,
75%, and 100% of the basket size consumers intended to buy.
The 50% level was used as a baseline to compare the utility of the increased assortment
percentages. The overall model showed that a retailer carrying 75% of the intended assortment
compared to the baseline was preferred by survey respondent’s 63% of the time when all other
drivers were equal. The preference improved to 74% when the assortment was increased to
100%.
The utility analysis was conducted for demographic categories on both levels of
assortment (75% vs 50% and 100% vs 50%). Women showed a higher preference compared to
men by 6% (66% vs 60%) at the 75% level and 10% (79% vs 69%) at the 100% level.
Additionally, there were small differences between higher and lower perceived value and word
of mouth respondents. With the lower group in each driver reflecting an increased utility for a
higher assortment level.
The assortment driver is important to consider as it is a direct reflection of the products
grocery retailers choose to stock. Among generation Z consumers in this study, there is a clear
preference for a retailer that can meet their grocery basket needs (i.e. stock the products they are
looking to buy). Just like their millennial or baby boomer counterparts, generation Z wants an
efficient grocery shopping experience. They want to buy as many of their required products as
27
they can in one place. This desire is reflected through their preference of 100% assortment 74%
of the time. These results can indicate to retailers that consumers are influenced by the products
available at a particular grocery store. Managers have to make decisions regarding what products
to stock and these results support insight into rationalization for retailers as they decide which
products consumers want to buy may, in turn, lead to the retailer offering a targeted assortment
that better attracts consumers. Additionally, stocking the products to meet assortment needs is
only part of the solution. Retailers must also ensure that consumers are aware of the product set
offered by the retailer. Communicating their assortment offering to the consumer in a
personalized and simplified way can make it easier for the consumer to be aware that their
assortment needs are being met by the retailer. Following the results of this study, if grocery
retailers are able to convey how their assortment better matches the consumers intended basket
needs, they will be more likely to be included in the consumers grocery shopping choices. As
shown in the utility analysis, the grocery retailer does not even need to carry 100% of the desired
items to be preferred. They simply need to carry a higher percentage of the assortment
requirement to improve their appeal to generation Z consumers.
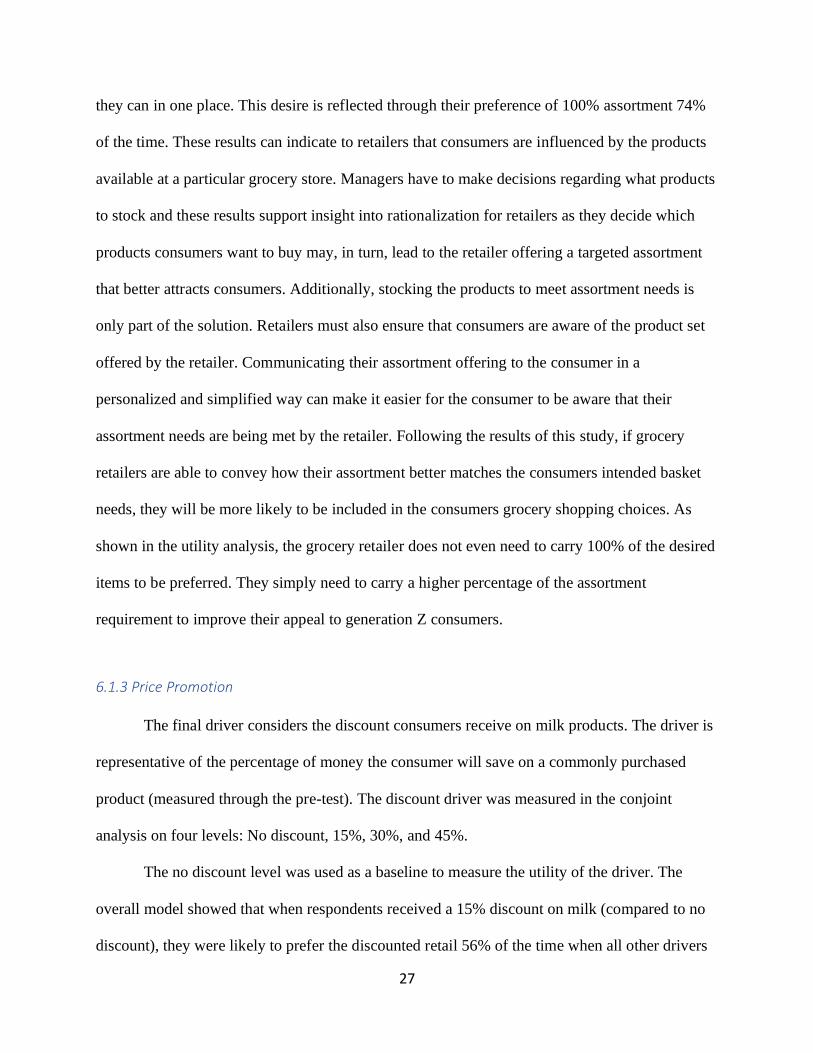
6.1.3 Price Promotion
The final driver considers the discount consumers receive on milk products. The driver is
representative of the percentage of money the consumer will save on a commonly purchased
product (measured through the pre-test). The discount driver was measured in the conjoint
analysis on four levels: No discount, 15%, 30%, and 45%.
The no discount level was used as a baseline to measure the utility of the driver. The
overall model showed that when respondents received a 15% discount on milk (compared to no
discount), they were likely to prefer the discounted retail 56% of the time when all other drivers
28
were equal. The preference increased to 62% when a 30% discount on milk was offered and 68%
for a discount of 45%.
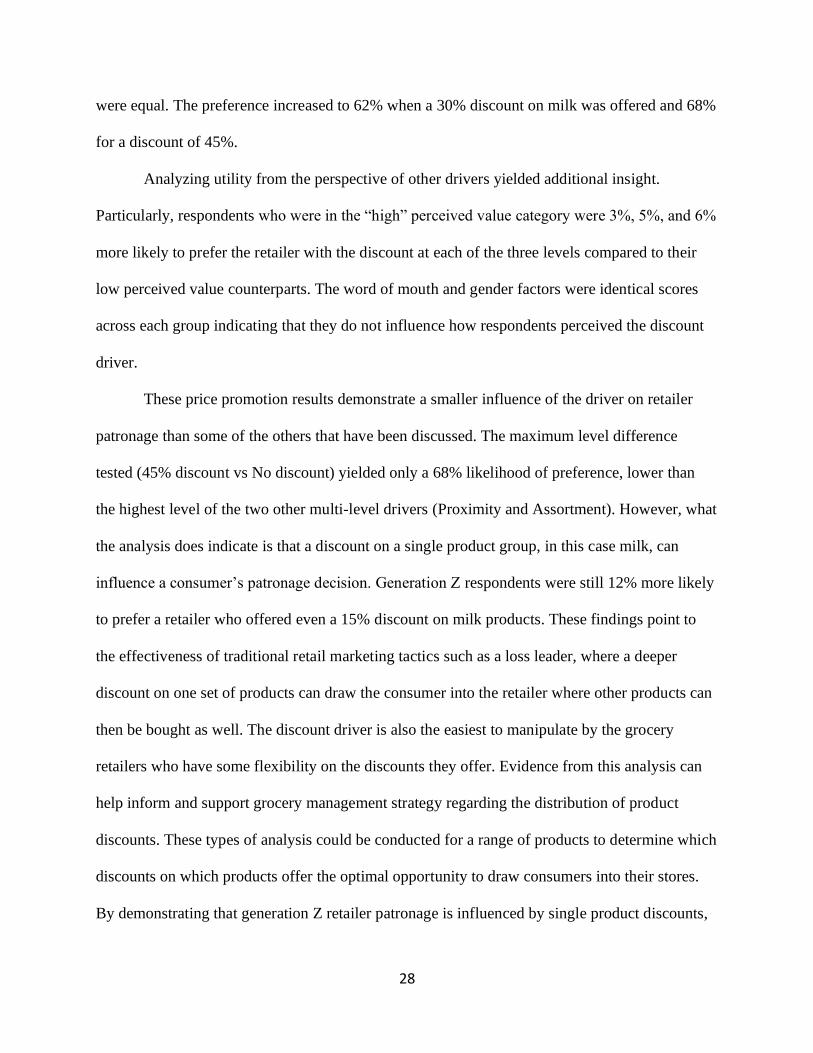
Analyzing utility from the perspective of other drivers yielded additional insight.
Particularly, respondents who were in the “high” perceived value category were 3%, 5%, and 6%
more likely to prefer the retailer with the discount at each of the three levels compared to their
low perceived value counterparts. The word of mouth and gender factors were identical scores
across each group indicating that they do not influence how respondents perceived the discount
driver.
These price promotion results demonstrate a smaller influence of the driver on retailer
patronage than some of the others that have been discussed. The maximum level difference
tested (45% discount vs No discount) yielded only a 68% likelihood of preference, lower than
the highest level of the two other multi-level drivers (Proximity and Assortment). However, what
the analysis does indicate is that a discount on a single product group, in this case milk, can
influence a consumer’s patronage decision. Generation Z respondents were still 12% more likely
to prefer a retailer who offered even a 15% discount on milk products. These findings point to
the effectiveness of traditional retail marketing tactics such as a loss leader, where a deeper
discount on one set of products can draw the consumer into the retailer where other products can
then be bought as well. The discount driver is also the easiest to manipulate by the grocery
retailers who have some flexibility on the discounts they offer. Evidence from this analysis can
help inform and support grocery management strategy regarding the distribution of product
discounts. These types of analysis could be conducted for a range of products to determine which
discounts on which products offer the optimal opportunity to draw consumers into their stores.
By demonstrating that generation Z retailer patronage is influenced by single product discounts,
29
this research is supporting further, specified research investigating additional product categories
where these discounts could improve patronage outcomes for retailers.
6.2 Influence of Technology Drivers on Retailer Preference
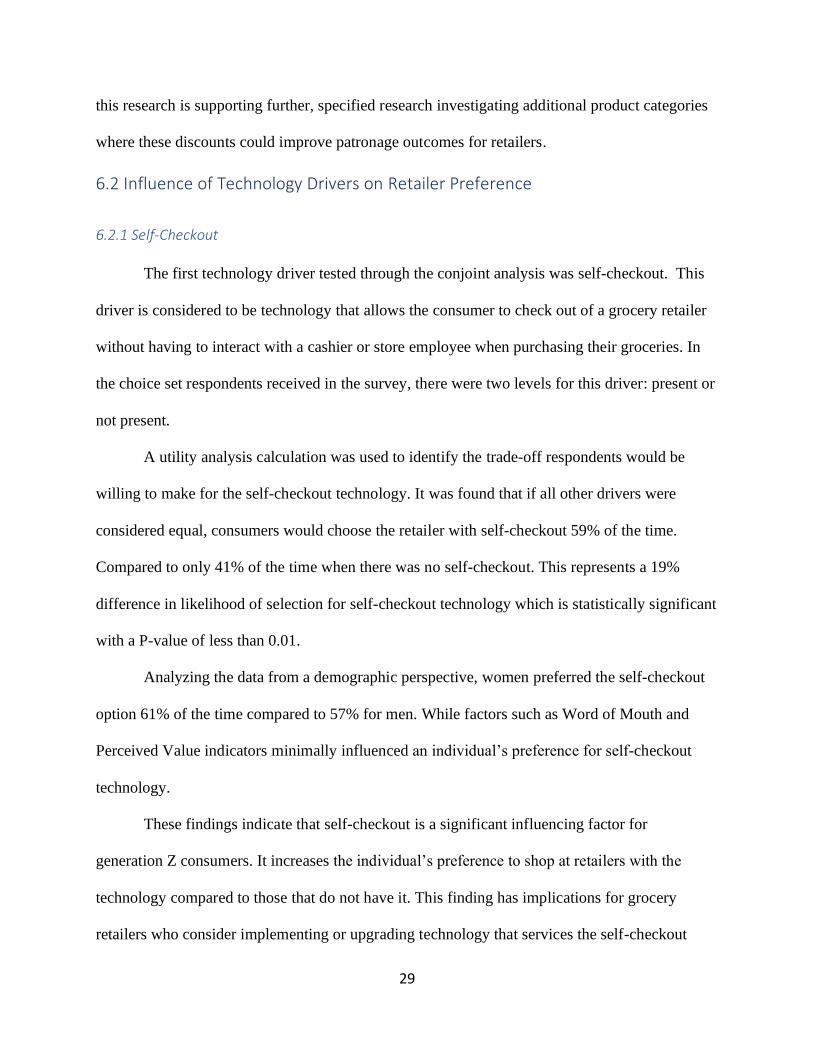
6.2.1 Self-Checkout
The first technology driver tested through the conjoint analysis was self-checkout. This
driver is considered to be technology that allows the consumer to check out of a grocery retailer
without having to interact with a cashier or store employee when purchasing their groceries. In
the choice set respondents received in the survey, there were two levels for this driver: present or
not present.
A utility analysis calculation was used to identify the trade-off respondents would be
willing to make for the self-checkout technology. It was found that if all other drivers were
considered equal, consumers would choose the retailer with self-checkout 59% of the time.
Compared to only 41% of the time when there was no self-checkout. This represents a 19%
difference in likelihood of selection for self-checkout technology which is statistically significant
with a P-value of less than 0.01.
Analyzing the data from a demographic perspective, women preferred the self-checkout
option 61% of the time compared to 57% for men. While factors such as Word of Mouth and
Perceived Value indicators minimally influenced an individual’s preference for self-checkout
technology.
These findings indicate that self-checkout is a significant influencing factor for
generation Z consumers. It increases the individual’s preference to shop at retailers with the
technology compared to those that do not have it. This finding has implications for grocery
retailers who consider implementing or upgrading technology that services the self-checkout
30
need in their stores. Generation Z respondents do value this technology and these findings
indicate it could be a worthwhile investment as it appeals to young consumers. Retailers such as
Sobeys have already begun testing the next generation of self-checkout in the form of “smart”
shopping carts where consumers checkout while they shop (Edminston, 2019). Findings in this
research support efforts to improve existing technology to enhance the consumer experience.
Self-Checkout technology is a shopping tool that is built for speed to decrease wait times and
expedite the checkout process. Innovation to improve these processes will indirectly benefit the
curb appeal of a grocery retailer, especially among consumers who like to shop with maximum
efficiency.
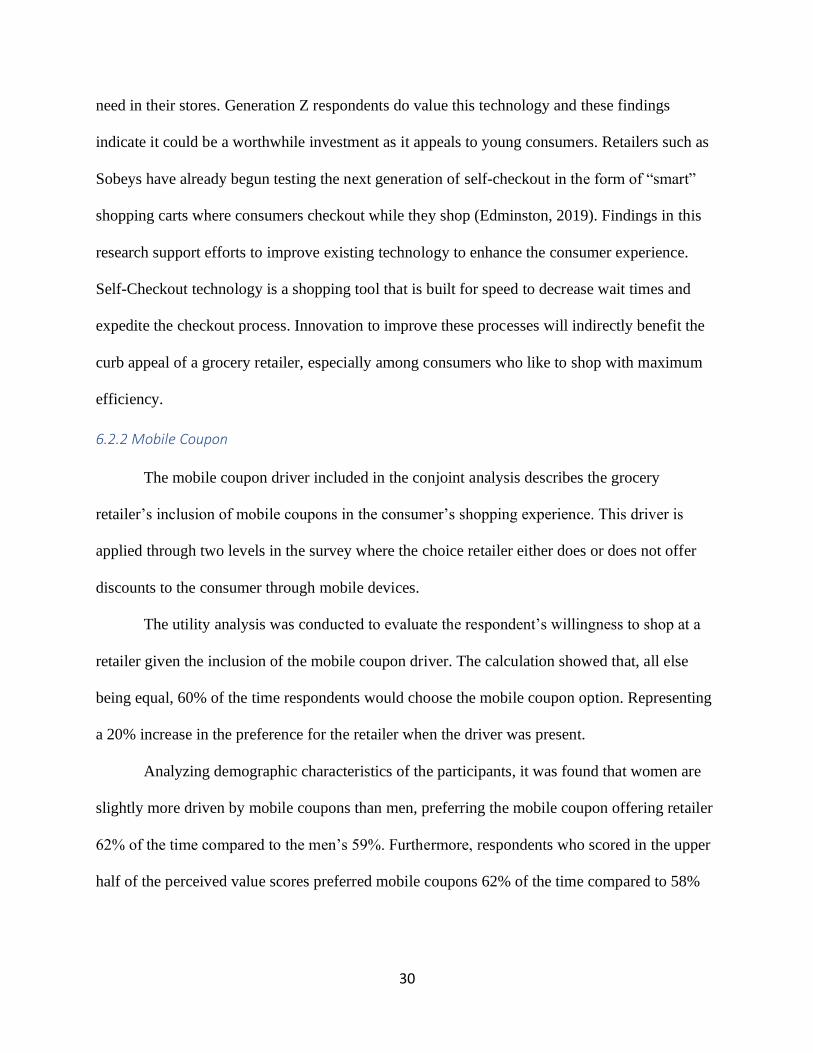
6.2.2 Mobile Coupon
The mobile coupon driver included in the conjoint analysis describes the grocery
retailer’s inclusion of mobile coupons in the consumer’s shopping experience. This driver is
applied through two levels in the survey where the choice retailer either does or does not offer
discounts to the consumer through mobile devices.
The utility analysis was conducted to evaluate the respondent’s willingness to shop at a
retailer given the inclusion of the mobile coupon driver. The calculation showed that, all else
being equal, 60% of the time respondents would choose the mobile coupon option. Representing
a 20% increase in the preference for the retailer when the driver was present.
Analyzing demographic characteristics of the participants, it was found that women are
slightly more driven by mobile coupons than men, preferring the mobile coupon offering retailer
62% of the time compared to the men’s 59%. Furthermore, respondents who scored in the upper
half of the perceived value scores preferred mobile coupons 62% of the time compared to 58%
31
for individuals who scored in the lower half. The difference was only marginal for individuals
based on Word of Mouth criteria.
These findings demonstrate how mobile coupon discounts positively influence a
respondent’s likelihood to shop at a retailer. These results align well with existing research that
identifies mobile coupons as a medium for improving redemption rates and consumption among
consumers that use them. Additionally, it makes sense that consumers who have higher
perceived value characteristics hold mobile coupons in a higher regard. These are the individuals
more sensitive to value, meaning the inclusion of technology that helps them save should
naturally appeal to them more. For retailers, this is important supplementary information that
supports their continued integration of mobile couponing technology in their stores. These
findings indicate that developing more couponing opportunities via smartphone can increase the
appeal of stores to a generation Z audience. These findings help inform decisions about
partnerships with existing third-party mobile couponing companies such as Flipp, Checkout51,
or Caddle. These findings indicate a desire from generation Z consumers for grocery retailers to
offer mobile couponing options and the more active the retailer is in including these options, the
stronger the appeal the retailer will have to the consumer.
6.2.3 Mobile App
The final technology driver of patronage tested in the study was grocery retailer mobile
apps. This driver captured the respondent’s preferences based on whether the specific retailer
offered an app that could be integrated into their shopping experience at the particular store. This
driver was applied on two levels with the choice of either offering or not offering an app during
the shopping experience.
32
The utility analysis measured how respondent’s shopping preferences were influenced by
this driver. The results showed that when all other drivers were equal, the retailer offering the
mobile app integration was preferred 54% of the time, the smallest difference among the three
technologically driven drivers.
The differences identified through the demographic information was also minimal.
Factors including gender, Perceived Value, and Word of Mouth all showed differences of 3% or
less between the inclusion and exclusion of mobile app technology during the shopping
experience.
The findings for this driver revealed much smaller difference in the levels tested in the
conjoint survey. While there was a slight preference for including the technology (8%), the
overall differences did not compare to the other technological drivers measured through the
conjoint analysis (Self-Checkout: 19%, Mobile Coupon: 20%).
The likely explanation for the difference in preference is that respondents may have been
unclear about what encompassed mobile app integration. The unfamiliarity may be a result of a
current lack of smartphone integration into the Canadian grocery store shopping experience.
Grocery retailers scored the lowest out of all retailer categories in terms of app preference among
consumers (Gray, 2015). Part of this low score was a lack of effective presence in the buying
process. Simply put, consumers are not used to using their phones to help them shop. What these
results show is that comparatively, grocery retailers may not need to expend resources supporting
mobile app integration as critically as other technological drivers of the grocery shopping
experience. Generation Z consumers may be on their phones more than other generations, but in
this research this familiarity did not translate to a desire for more mobile usage in the shopping
experience.
33
Table 4: Summary of Utility Values
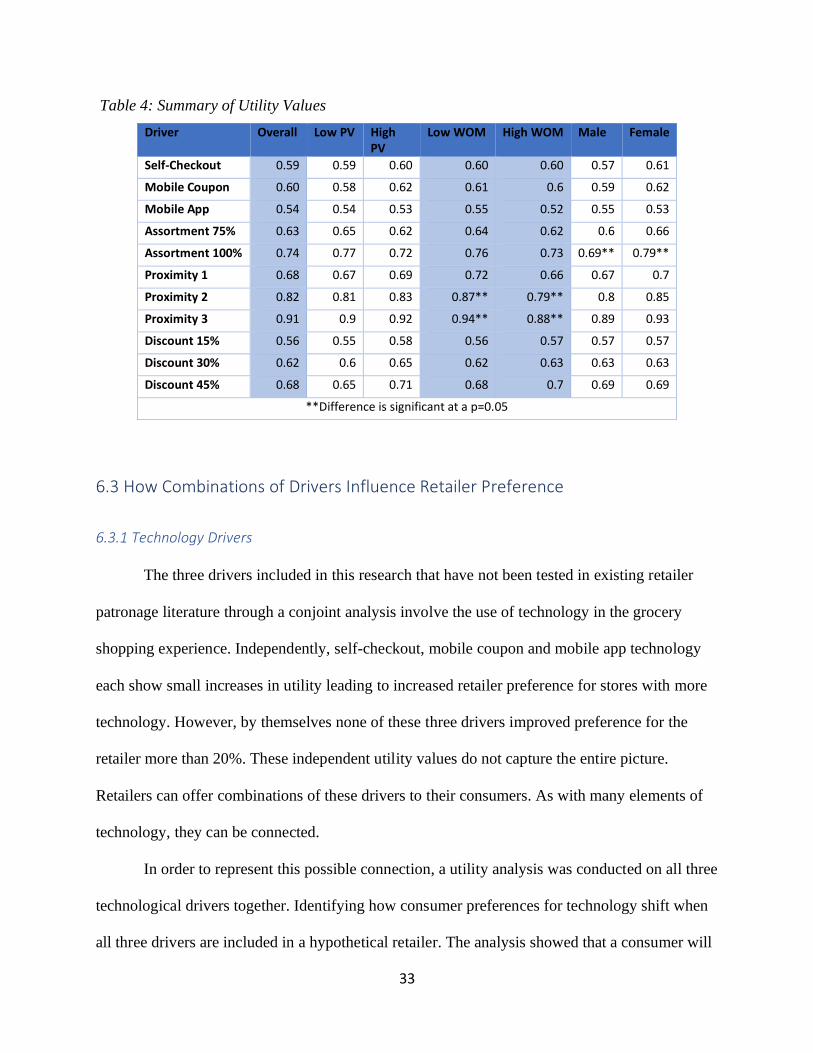
6.3 How Combinations of Drivers Influence Retailer Preference
6.3.1 Technology Drivers
The three drivers included in this research that have not been tested in existing retailer
patronage literature through a conjoint analysis involve the use of technology in the grocery
shopping experience. Independently, self-checkout, mobile coupon and mobile app technology
each show small increases in utility leading to increased retailer preference for stores with more
technology. However, by themselves none of these three drivers improved preference for the
retailer more than 20%. These independent utility values do not capture the entire picture.
Retailers can offer combinations of these drivers to their consumers. As with many elements of
technology, they can be connected.
In order to represent this possible connection, a utility analysis was conducted on all three
technological drivers together. Identifying how consumer preferences for technology shift when
all three drivers are included in a hypothetical retailer. The analysis showed that a consumer will
Driver Overall Low PV High PV
Low WOM High WOM Male Female
Self-Checkout 0.59 0.59 0.60 0.60 0.60 0.57 0.61
Mobile Coupon 0.60 0.58 0.62 0.61 0.6 0.59 0.62
Mobile App 0.54 0.54 0.53 0.55 0.52 0.55 0.53
Assortment 75% 0.63 0.65 0.62 0.64 0.62 0.6 0.66
Assortment 100% 0.74 0.77 0.72 0.76 0.73 0.69** 0.79**
Proximity 1 0.68 0.67 0.69 0.72 0.66 0.67 0.7
Proximity 2 0.82 0.81 0.83 0.87** 0.79** 0.8 0.85
Proximity 3 0.91 0.9 0.92 0.94** 0.88** 0.89 0.93
Discount 15% 0.56 0.55 0.58 0.56 0.57 0.57 0.57
Discount 30% 0.62 0.6 0.65 0.62 0.63 0.63 0.63
Discount 45% 0.68 0.65 0.71 0.68 0.7 0.69 0.69
**Difference is significant at a p=0.05
34
prefer the retailer with all three technological drivers 71% of the time compared to retailers who
do not offer the technology features. These findings indicate that consumers are 50% more likely
to select the retailer with the technology than the one without, a much larger selection rate than
any individual technology driver.
The insight from this finding is that while technology drivers offer some increased utility
for the retailer on their own, the most effective implementation of technology comes when
multiple features can be used together. This is an actionable insight for retailers as the
technology is already available to simultaneously connect these drivers. Mobile apps for retailers
can support platforms for coupons. Consumers have the ability to connect credit cards to their
smartphones in order to pay for products completely through their mobile devices. A major
Canadian grocery retailer, Sobeys, is already beginning to test combinations of these
technologies through smart shopping carts where products can be located, scanned, and paid for
all through the cart itself (Dunham, 2019). As technologies become more accessible to grocery
retailers, managers will need to take advantage of how these features appeal to generation Z
consumers. This research confirms preference towards technology and indicates an opportunity
for retailers to implement store features that will improve the chances of a generation Z
consumer choosing their store over a competitor.
6.3.2 The Proximity Question
The amount of time it took to travel to the retailer was the individual driver which had a
large influence on retailer preference for generation Z consumers. At the maximum difference in
time (15 minutes), respondents preferred the closer option 91% of the time. At the smallest
interval (5 minutes), the closer option was still preferred 68% of the time, more than almost
every other driver.

35
With proximity being such a dominant driver of patronage, a utility analysis was
conducted to investigate at what level of other additional drivers would respondents trade-off the
distance to the retailer. In order to determine this insight, the assortment and price promotion
drivers were included in the analysis.
At the maximum level of difference between proximity items (15 minutes) there were no
combinations of assortment and discount drivers that yielded a preference for the further retailer
above 50%. However, as shown in table 5, when there was a 10 minute difference in proximity,
the further store was preferred in two conditions. In both cases the assortment had to be
maximized, with 100% of the required products. While the discount on milk had to be minimally
30% for the further store to be preferred.
When the proximity driver was only 5 minutes apart, there were 8 of 12 conditions where
the further option was preferred at least equally to the closer one. Shown in table 6, the
maximum levels for both assortment and price promotion yielded a preference for the further
option of that at least equal to the closer option, in 4 cases over 20% more, and in one case 48%
more.
These findings indicate several insights for marketing managers to consider. The first is
the powerful influence of proximity on the consumer’s choice of retailer. As is consistent with
existing research on retailer patronage, how far away the store is from the consumer plays a
major role in how likely a consumer is to choose that store to shop at. The findings from this
research indicate that when the difference in distance between two stores is 15 minutes or more,
generation Z consumers will overwhelmingly choose the closer store (up to 91% of the time).
However, there are many conditions where the further store will be preferred to the closer one.
When the distance between two stores decreases to approximately 10 minutes apart, the further
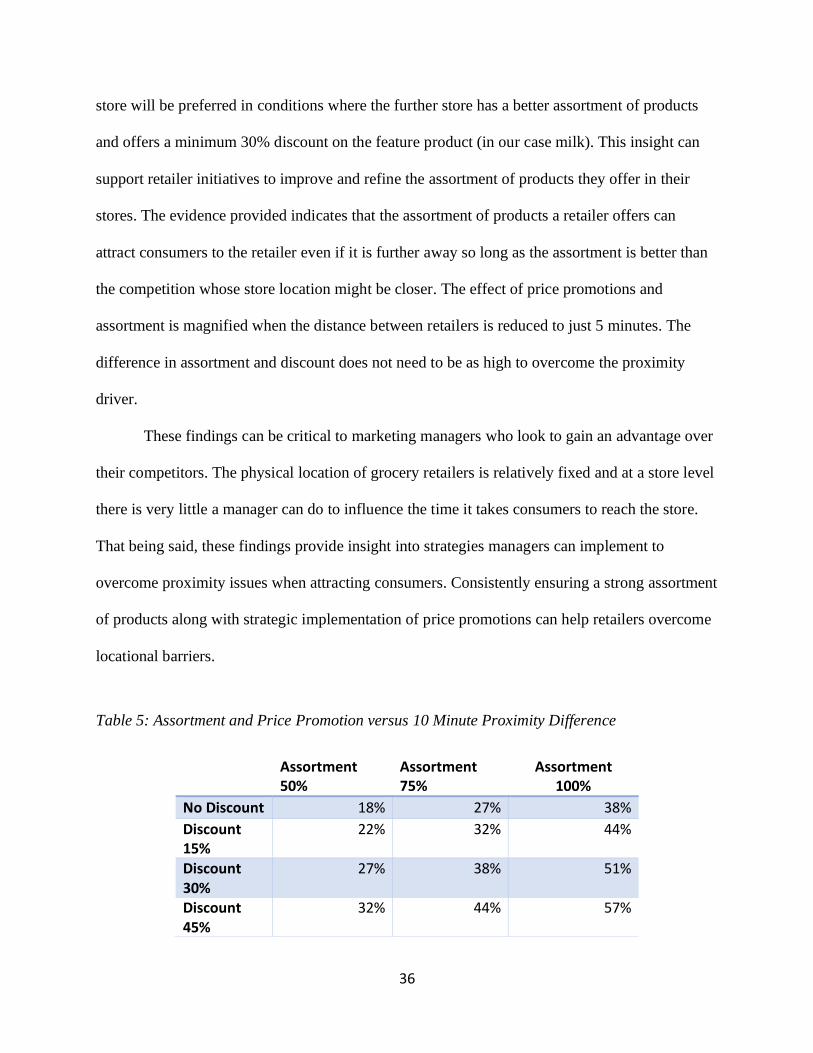
36
store will be preferred in conditions where the further store has a better assortment of products
and offers a minimum 30% discount on the feature product (in our case milk). This insight can
support retailer initiatives to improve and refine the assortment of products they offer in their
stores. The evidence provided indicates that the assortment of products a retailer offers can
attract consumers to the retailer even if it is further away so long as the assortment is better than
the competition whose store location might be closer. The effect of price promotions and
assortment is magnified when the distance between retailers is reduced to just 5 minutes. The
difference in assortment and discount does not need to be as high to overcome the proximity
driver.
These findings can be critical to marketing managers who look to gain an advantage over
their competitors. The physical location of grocery retailers is relatively fixed and at a store level
there is very little a manager can do to influence the time it takes consumers to reach the store.
That being said, these findings provide insight into strategies managers can implement to
overcome proximity issues when attracting consumers. Consistently ensuring a strong assortment
of products along with strategic implementation of price promotions can help retailers overcome
locational barriers.
Table 5: Assortment and Price Promotion versus 10 Minute Proximity Difference
Assortment 50%
Assortment 75%
Assortment 100%
No Discount 18% 27% 38%
Discount 15%
22% 32% 44%
Discount 30%
27% 38% 51%
Discount 45%
32% 44% 57%
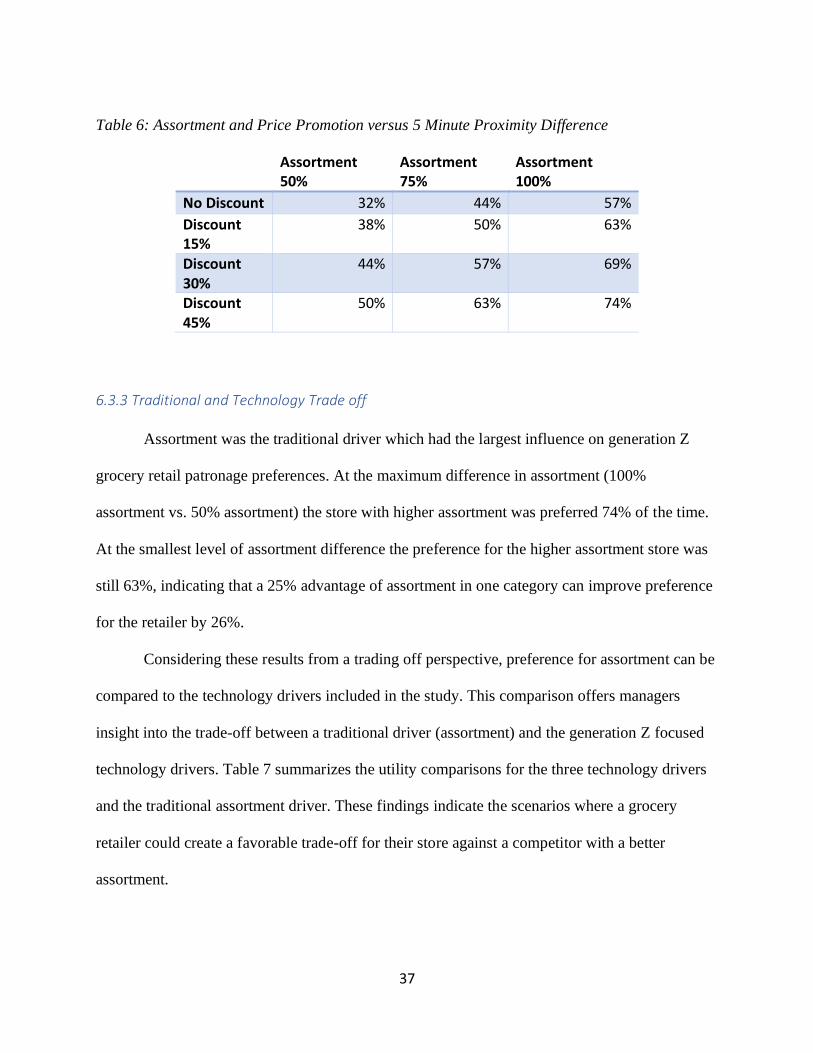
37
Table 6: Assortment and Price Promotion versus 5 Minute Proximity Difference
Assortment 50%
Assortment 75%
Assortment 100%
No Discount 32% 44% 57%
Discount 15%
38% 50% 63%
Discount 30%
44% 57% 69%
Discount 45%
50% 63% 74%
6.3.3 Traditional and Technology Trade off
Assortment was the traditional driver which had the largest influence on generation Z
grocery retail patronage preferences. At the maximum difference in assortment (100%
assortment vs. 50% assortment) the store with higher assortment was preferred 74% of the time.
At the smallest level of assortment difference the preference for the higher assortment store was
still 63%, indicating that a 25% advantage of assortment in one category can improve preference
for the retailer by 26%.
Considering these results from a trading off perspective, preference for assortment can be
compared to the technology drivers included in the study. This comparison offers managers
insight into the trade-off between a traditional driver (assortment) and the generation Z focused
technology drivers. Table 7 summarizes the utility comparisons for the three technology drivers
and the traditional assortment driver. These findings indicate the scenarios where a grocery
retailer could create a favorable trade-off for their store against a competitor with a better
assortment.

38
In the first condition where assortment is equal between two stores, every condition
where the target store offers technology features in their shopping experience is preferred
(preference>50%). In the second condition, where the competitor has an assortment advantage of
25% the influence of individual technology drivers is not high enough to overcome the
preference for higher assortment. However, when the disadvantaged retailer included multiple
technology features in their store they are preferred over the higher assortment retailer by up to
20%. In the final condition, where there is a 50% assortment advantage for the competitor, no
combination of technology drivers can influence preference by over 50%. However, the
difference between the two retailers can be reduced to 6% when the disadvantaged assortment
retailer offers all three technology drivers.
These findings offer marketing managers insight into strategies they can employ to
overcome deficiencies in traditional drivers. While some retailers are smaller and may not be
able to offer assortment to the same capacity as others, these differences can be overcome in
many cases by the addition of technology drivers to the retail experience. This research included
technology drivers because of the unique relationship generation Z consumers, digital natives,
have with technology. Despite these drivers having smaller individual influence over grocery
retailer patronage, when combined with other technology drivers they offer significant benefit to
retailers looking to overcome traditional obstacles. There are four cases where combinations
technology drivers create a positive trade off in retail preference creating differences of up to
12% when two drivers are combined (Self Checkout & Mobile Coupon) and 20% when all three
drivers are combined. The findings provide further support for the positive effect technology can
have on retail patronage. Grocery retailers where assortment is limited due to physical or
economic restrictions can adapt their strategy to appeal to generation Z consumers in different
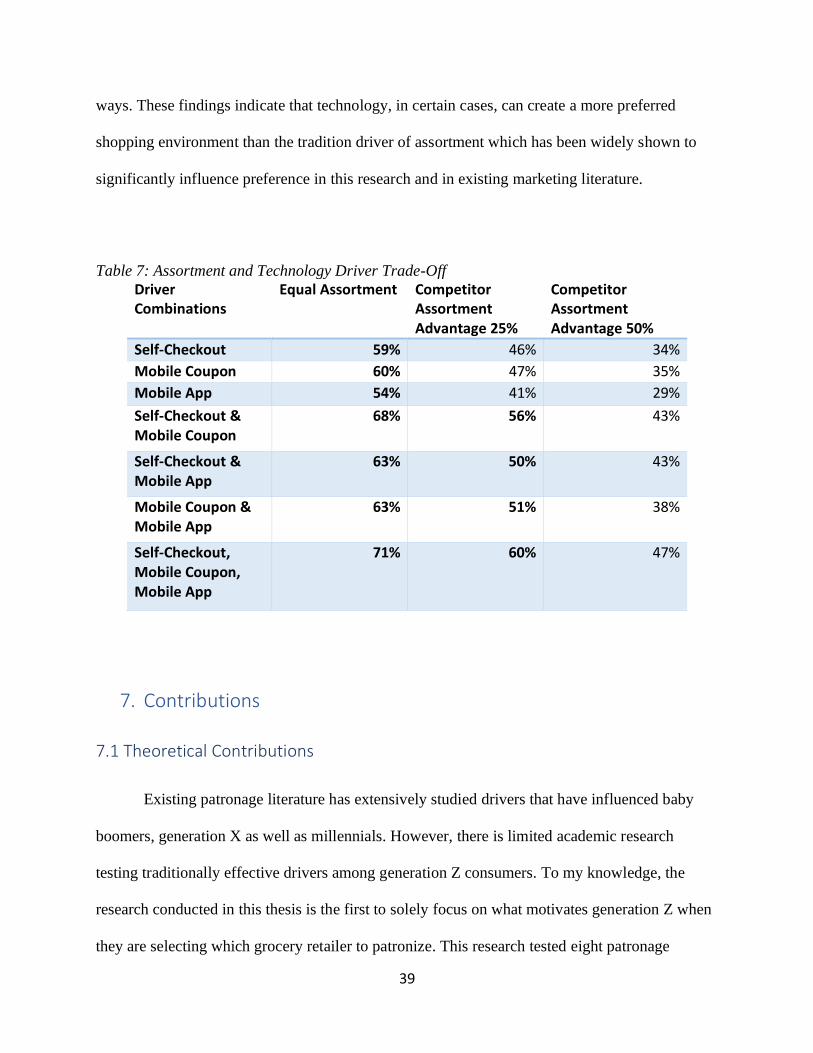
39
ways. These findings indicate that technology, in certain cases, can create a more preferred
shopping environment than the tradition driver of assortment which has been widely shown to
significantly influence preference in this research and in existing marketing literature.
Table 7: Assortment and Technology Driver Trade-Off
Driver Combinations
Equal Assortment Competitor Assortment Advantage 25%
Competitor Assortment Advantage 50%
Self-Checkout 59% 46% 34%
Mobile Coupon 60% 47% 35%
Mobile App 54% 41% 29%
Self-Checkout & Mobile Coupon
68% 56% 43%
Self-Checkout & Mobile App
63% 50% 43%
Mobile Coupon & Mobile App
63% 51% 38%
Self-Checkout, Mobile Coupon, Mobile App
71% 60% 47%
7. Contributions
7.1 Theoretical Contributions
Existing patronage literature has extensively studied drivers that have influenced baby
boomers, generation X as well as millennials. However, there is limited academic research
testing traditionally effective drivers among generation Z consumers. To my knowledge, the
research conducted in this thesis is the first to solely focus on what motivates generation Z when
they are selecting which grocery retailer to patronize. This research tested eight patronage
40
drivers, covering both traditional and technology focused attributes. These drivers can be studied
further and compared to other generations such as Millennials or Baby Boomers to evaluate how
patronage behaviour many change between generations.
Another theoretical contribution from this research is the methodology used to measure
participant preference for the patronage drivers. The discrete choice approach and subsequent
analysis was able to show that each driver significantly influenced retail patronage decisions.
The methodology could be applied in a future academic study to other generations and provide
comparative analysis for different generations of consumers.
7.2 Managerial Contributions
The retail marketplace has yet to feel the full revenue potential of generation Z
consumers. Only five years ago no consumers in the segment were above the age of 18. Even in
2020, a majority of generation Z consumers are dependent on their parents who are consumers
from a different generation. The gradual shift towards financial independence for generation Z
has created a new, emerging segment that grocery retailers must begin preparing for. Raised with
a different perspective on brands and shopping experience, the unique and technologically driven
background of generation Z individuals indicates that these young consumers will respond
differently to drivers of retail patronage.
For industry, these findings offer managers and marketers insight into how they can
position their stores in a way that appeals to generation Z consumers. Industry reports show that
young consumers still overwhelmingly prefer to shop at brick-and-mortar grocery stores, shifting
to focus towards getting generation Z consumers to choose a target retailer (IBM, 2017).
Capturing generation Z consumers when they are still in the formative years of identifying their
preferred grocery stores could be vital to securing a lifelong customer. Findings in this study can
41
enhance and educate managerial efforts to increase grocery retailer appeal within the youngest
segment by identifying drivers they can realistically implement.
8. Limitations and Future Research
One limitation of this research are the participants that were used to test the drivers in the
survey. Each of the respondents were members of the University of Guelph’s student research
pool. While this collection of possible respondents offered a very accessible group of generation
Z consumers, a difficult segment to exclusively capture, they are not a representative sample of
consumers that comprise this segment. Surveying exclusively university students presents a
challenge when applying results to the general population. While there are individuals in the
university setting from all walks of life, a further study capturing generation Z perspectives
throughout the social network would connect findings to the entire consumer group more
accurately.
A second limitation of this research are the limited generalizations of the findings. While
the main study provided retailer patronage insights regarding the Canadian grocery industry, the
results cannot be statistically tied to other retail industries. The drivers included in the testing for
this research were chosen due to their significance in past grocery retail patronage literature,
their significance within other retail industries cannot be assumed. Future research towards other
industries could adapt the methodology from this thesis and apply it to other industries. The
process may involve identifying the traditionally influential drivers from the target industry and
applying them within the survey method proposed in this research.
Another limitation was the number of drivers that were tested that potentially influence
generation Z’s patronage behaviour. Due to the time and resource constraint for conducting
conjoint analysis, the research limited the number of drivers that were tested to eight. Five
42
drivers (Discount, Assortment, Proximity, Word of Mouth, and Perceived Value) were included
because they had been proven drivers of retail patronage in previous academic literature in
addition to their connection to established generation Z behaviour. The three technological
drivers were included as hypothesized drivers of generation Z retail patronage. However, there
are many other drivers that have been shown to influence retail patronage behaviour across
decades of research in the field of study. Drivers such as convenience, product quality, store
atmosphere, and store branding offer additional influencing factors that might affect a
consumer’s patronage decision. This research was not meant to be all encompassing, rather, we
selected drivers that would connect most directly to known generation Z preferences based on
existing literature. By excluding drivers, the breadth of the analysis was limited, however, it
allowed the drivers that were included to be investigated more in depth. Future research could
investigate additional drivers further.
A future research opportunity could be to investigate the technological factors on a more
targeted level. This research captured self-checkout, mobile coupon, and mobile app technology
preferences in a broad sense. These technologies can vary significantly within each driver. If
grocery retailers intend to implement new technology into their stores, this research can offer a
preliminary glimpse into how that technology will influence consumer patronage intentions. This
research discussed several potential patronage trade-offs where technology drivers interacted
with traditional drivers. Every possible combination of the interactions between the drivers was
not included due to the scope of the project. Instead, the discussion focused on the managerial
implications for technology trade-offs within traditional drivers. In regard to the details of the
technology’s influence on the shopping experience, additional field testing and consumer panels
43
could be conducted to ensure that technology influences the shopping experience in a meaningful
way for consumers.
As discussed earlier, while the findings in this thesis offer insights into generation Z
patronage preferences, the research is extremely limited when comparing generation Z results
with other generations of consumers such as baby boomers, generation X, and millennials. This
research only tested drivers of retail patronage for generation Z consumers which means the
results cannot be directly compared between generations. The comparisons would have been
strengthened through the collection of samples from other generations. However, this presents
another direction for future research. The research approach could apply a similar methodology
to other generations of participants and compare how each driver influences retail patronage.
Future research could build on the generation Z findings from this thesis and create modernized
profiles of each consumer segment based on their generation affiliation. Research of that
capacity would provide further support for marketing managers as they continually aim to serve
each group of consumers. With targeted information about what motivates more consumers to
shop, managers would be able to tailor efforts specific to each generation through the mediums
which they are most receptive.
44
9. Conclusion
Over the coming years generation Z consumers are going to change how grocery retailing
is conducted. They will be the consumer group leading the way as major grocery retailers
implement significant technological upgrades to an industry historically resistant to innovation.
As the population of the demographic swells, so too will the demand for more insight into the
consumer group’s preferences. This thesis serves as an introduction to generation Z consumers as
a new cohort of grocery shoppers who have a set of preferences for grocery retailers that need to
be met. Some of these preferences mirror those of previous generations while others are driven
by technology and will continue to evolve as new resources become available to both consumer
and retailer. This research highlights opportunities for retailers to take action so that when
generation Z consumers reach their full economic capacity in the marketplace, retailers will be
ready to meet their grocery demands and achieve an advantageous position in market
competition.
45
10. References Alba, Joseph W., Carl F. Mela, Terence A. Shimp, and Joel E. Urbany. (1999) “The Effect of
Discount Frequency and Depth on Consumer Price Judgments.” Journal of Consumer
Research, 26(2), 99–114.
Arnold, Stephen J., Tae H. Oum, and Douglas J. Tigert. (1983) "Determinant Attributes in Retail
Patronage: Seasonal, Temporal, Regional, and International Comparisons." Journal of
Marketing Research, 20(2), 149-157.
Bassiouni, Dina and Chris Hackley (2014), “Generation Z children’s adaptation to digital
consumer culture: A critical literature review”. Journal of Customer Behaviour, 13(2),
113-133.
Blattberg, Robert C., Richard Briesch, and Edward J. Fox. (1995) "How Promotions
Work." Marketing Science, 14(3)., 122-132.
Bloomberg (2018) “Gen Z is set to outnumber Millennials within a year” Retrieved June 27th,
2019 from: https://www.bnnbloomberg.ca/gen-z-is-set-to-outnumber-millennials-
within-a-year-1.1125841
Blut, Markus, Christoph Teller, Arne Floh,. (2018). “Testing Retail Marketing-Mix Effects on
Patronage: A Meta-Analysis”, Journal of Retailing, 94 (2), 113-135.
46
Brown, T., Barry, T., Dacin, P., & Gunst, R. (2005). Spreading the word: Investigating
antecedents of consumers’ positive word-of-mouth intentions and behaviors in a retailing
context. Journal of the Academy of Marketing Science, 33(2), 123-138.
Dickinger, Astrid, Mirella Kleijnen. (2008). “Coupons going wireless: Determinants of consumer
intentions to redeem mobile coupons”. Journal of Interactive Marketing, 22(3), 23-39.
Dubé, J. P., Fang, Z., Fong, N., & Luo, X. (2017). Competitive price targeting with smartphone
coupons. Marketing Science, 36(6), 944-975.
Dunham, Jackie. (2019). Sobeys Launches ‘Smart Cart” as Grocers Scramble to Innovate. CTV
News. Retrieved January 23rd, 2020 from: https://www.ctvnews.ca/sci-tech/sobeys-
launches-high-tech-smart-cart-as-grocers-scramble-to-innovate-1.4653853
East, Robert, Kathy Hammond, and Malcolm Wright (2007). “ The relative incidence of positive
and negative word of mouth: A multi-category study”. International Journal of Research
in Marketing, 24, 175-184.
Edminston, 2019 https://business.financialpost.com/news/retail-marketing/sobeys-tests-smart-
grocery-cart-a-self-checkout-on-wheels-that-gets-smarter-as-you-shop
47
Forrester (2015). “The State Of Mobile Apps For Retailers”. Forrester Consulting. Retrieved
July 18th, 2019 from:
https://www.retailmenot.com/corp/static/filer_public/78/9c/789c947a-fe7c-46ce-908a-
790352326761/stateofmobileappsforretailers.pdf
Gerstner, Eitan. (1985) “Do Higher Prices Signal Higher Quality?” Journal of Marketing
Research, 22(2), 209–215
Gray, Ben (2015), The Best- and Worst-Rated Retail Apps,. Applause Analytics ARC Report,
Retrieved July 18th, 2019 from: http://go.applause.com/rs/539-CKP-074/ images/ARC-
The-Best-and-Worst-Rated-Retail-Apps-2015.pdf
Greenfield, P.M. (2004). “Developmental considerations for determining appropriate internet
use guidelines for children and adolescents”. Journal of Applied Developmental
Psychology, 25(6), 751-762.
Grewal, Dhruv, Julie Baker, Michael Levy and Glenn Voss (2003). “The effects of wait
expectations and store atmosphere evaluations on patronage intentions in service-
intensive retail stores,” Journal of Retailing, 79, 259–268.
Gupta, S. (1988). Impact of Sales Promotions on When, What, and How Much to Buy. Journal
of Marketing Research, 25(4), 342-355.
Hansen, Robert and Terry Deutscher (1977). “An empirical investigation of attribute importance
in retail store selection,” Journal of Retailing, 53 (4), 59–72.
48
IBM (2017). “Uniquely Generation Z: What brands should know about today’s youngest
consumers”. IBM Institute for Business Values. Retrieved July 15th, 2019 from:
https://www.ibm.com/thought-leadership/institute-business-value/report/uniquelygenz#
Inman, J. Jeffrey, Hristina, Nikolova. (2017) “Shopper-Facing Retail Technology: A Retailer
Adoption Decision Framework Incorporating Shopper Attitudes and Privacy Concerns”,
Journal of Retailing, 93 (1), 7-28.
Im, Hyunjoo, Young Ha, (2012) "Who are the users of mobile coupons? A profile of US
consumers", Journal of Research in Interactive Marketing,(6)3, 215-232
Kumar. V, Vikram Bhaskaran, Rohan Mirchandani, Milap Shah. (2013) “Creating a Measurable
Social Media Marketing Strategy: Increasing the Value and ROI of Intangibles and
Tangibles for Hokey Pokey.” Marketing Science, 32.2, 194-212.
Meuter, Matthew L., Amy L. Ostrom, Robert I. Roundtree, and Mary Jo Bitner. (2000) "Self-
Service Technologies: Understanding Customer Satisfaction with Technology-Based
Service Encounters." Journal of Marketing 64(3), 50-64.
Mittelstaedt, Robert A., and Robert E. Stassen. (1990) "Shopping Behavior and Retail
Merchandising Strategies." Journal of Business Research 21(3), 243-58.
NCR (2014), Self-Checkout: A Global Consumer Perspective, Retrieved July 18th, 2019 from:
https://www.ncr.com/sites/default/files/white papers/RET SCO wp.pdf
49
Netzer, J. (2017). 5 Stats on Generation Z Buying Habits Marketers Need. Retrieved July 16th
2019 from: https://www.spredfast.com/social-marketing-blog/5-stats-generation-z-
buying-habits-marketers-need
Peng, K., Chen, Y. and Wen, K. (2014), "Brand relationship, consumption values and branded
app adoption", Industrial Management & Data Systems, 114(8), 1131-1143.
Priporas, C. V., Stylos, N., & Fotiadis, A. K. (2017). Generation Z consumers' expectations of
interactions in smart retailing: A future agenda. Computers in Human Behavior, 77, 374–
381.
Reilly, William J. (1931). The Law of Retail Gravitation. New York: Author.
Schlossberg, M. (2016).”Teen Generation Z is being called 'millennials on steroids,' and that
could be terrifying for retailers.” Retrieved July 16th 2019 from:
https://www.businessinsider.com/millennials-vs-gen-z-2016-2
Sinha, Piyush Kumar,. Arindam Banerjee, (2004) "Store choice behaviour in an evolving
market", International Journal of Retail & Distribution Management, (32)10, 482-494.
Sirohi, Niren and Edward McLaughlin (1998). “A model of consumer perceptions and store
loyalty intentions for a supermarket retailer,” Journal of Retailing, 74 (2), 223–245.
Simonson, Itamar (1999).”The effect of product assortment on buyer preferences”. Journal of
Retailing, 75(3), 347-370.
50
Shay, Matthew (2017). “Move Over Millennials: Generation Z Is The Retail Industry's Next Big
Buying Group”, Forbes, Retrieved July 16th 2019 from:
https://www.forbes.com/sites/ibm/2017/01/12/move-over-millennials-generation-z-is-the-
retail-industrys-next-big-buying-group/#3df533ce2f0a
Southgate, D. (2017). “The emergence of Generation Z and its impact in advertising: Long-term
implications for media planning and creative development.”, Journal of Advertising
Research, 57(2), 227-235.
Stassen, Robert, John D. Mittelstaedt, Robert A. Mittelstaedt, (1999) “Assortment overlap: its
effect on shopping patterns in a retail market when the distributions of prices and goods
are known”, Journal of Retailing, 75(3), 371-386.
Walters, Rockney G., and Heikki J. Rinne (1986). "An empirical-investigation into the impact of
price promotions on retail store performance." Journal of Retailing, 62(3), 237-266.
Wood, Stacey. (2013) “Generation Z as consumers: trends and innovation.” Institute for
Emerging Issues: NC State, Retrieved July 18th 2019 from: https://iei.ncsu.edu/wp-
content/uploads/2013/01/GenZConsumers.pdf
Yue Pan, George M. Zinkhan, (2006) “Determinants of retail patronage: A meta-analytical
perspective”, Journal of Retailing, 82(3), 229-243

51
Zeithaml, Valarie A. (1988) "Consumer Perceptions of Price, Quality, and Value: A Means-End
Model and Synthesis of Evidence." Journal of Marketing 52 (3), 2-22.
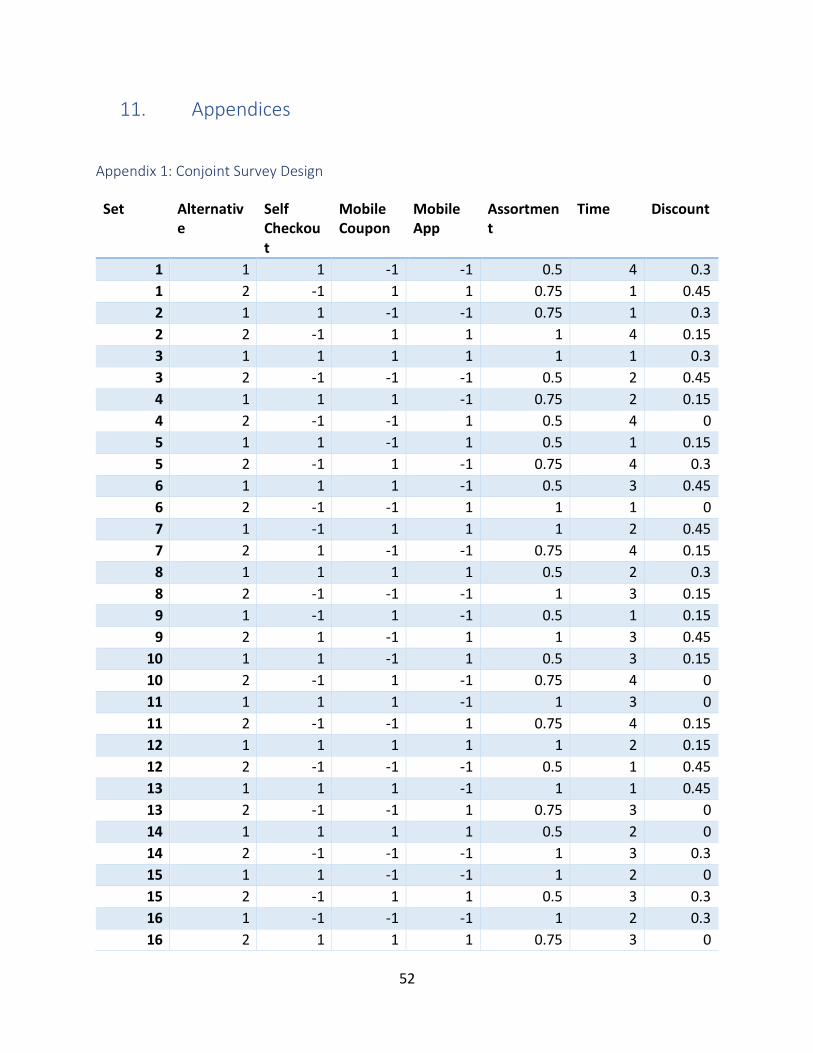
52
11. Appendices
Appendix 1: Conjoint Survey Design
Set Alternative
Self Checkout
Mobile Coupon
Mobile App
Assortment
Time Discount
1 1 1 -1 -1 0.5 4 0.3
1 2 -1 1 1 0.75 1 0.45
2 1 1 -1 -1 0.75 1 0.3
2 2 -1 1 1 1 4 0.15
3 1 1 1 1 1 1 0.3
3 2 -1 -1 -1 0.5 2 0.45
4 1 1 1 -1 0.75 2 0.15
4 2 -1 -1 1 0.5 4 0
5 1 1 -1 1 0.5 1 0.15
5 2 -1 1 -1 0.75 4 0.3
6 1 1 1 -1 0.5 3 0.45
6 2 -1 -1 1 1 1 0
7 1 -1 1 1 1 2 0.45
7 2 1 -1 -1 0.75 4 0.15
8 1 1 1 1 0.5 2 0.3
8 2 -1 -1 -1 1 3 0.15
9 1 -1 1 -1 0.5 1 0.15
9 2 1 -1 1 1 3 0.45
10 1 1 -1 1 0.5 3 0.15
10 2 -1 1 -1 0.75 4 0
11 1 1 1 -1 1 3 0
11 2 -1 -1 1 0.75 4 0.15
12 1 1 1 1 1 2 0.15
12 2 -1 -1 -1 0.5 1 0.45
13 1 1 1 -1 1 1 0.45
13 2 -1 -1 1 0.75 3 0
14 1 1 1 1 0.5 2 0
14 2 -1 -1 -1 1 3 0.3
15 1 1 -1 -1 1 2 0
15 2 -1 1 1 0.5 3 0.3
16 1 -1 -1 -1 1 2 0.3
16 2 1 1 1 0.75 3 0
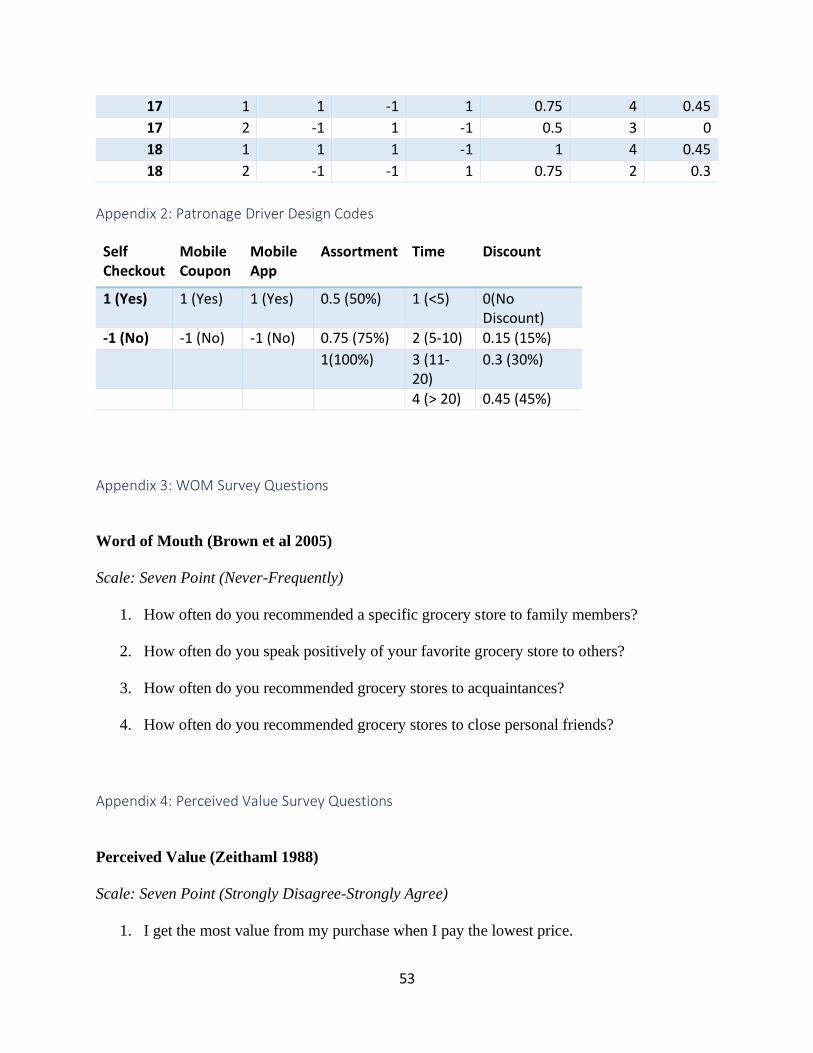
53
17 1 1 -1 1 0.75 4 0.45
17 2 -1 1 -1 0.5 3 0
18 1 1 1 -1 1 4 0.45
18 2 -1 -1 1 0.75 2 0.3
Appendix 2: Patronage Driver Design Codes
Self Checkout
Mobile Coupon
Mobile App
Assortment Time Discount
1 (Yes) 1 (Yes) 1 (Yes) 0.5 (50%) 1 (<5) 0(No Discount)
-1 (No) -1 (No) -1 (No) 0.75 (75%) 2 (5-10) 0.15 (15%)
1(100%) 3 (11-20)
0.3 (30%)
4 (> 20) 0.45 (45%)
Appendix 3: WOM Survey Questions
Word of Mouth (Brown et al 2005)
Scale: Seven Point (Never-Frequently)
1. How often do you recommended a specific grocery store to family members?
2. How often do you speak positively of your favorite grocery store to others?
3. How often do you recommended grocery stores to acquaintances?
4. How often do you recommended grocery stores to close personal friends?
Appendix 4: Perceived Value Survey Questions
Perceived Value (Zeithaml 1988)
Scale: Seven Point (Strongly Disagree-Strongly Agree)
1. I get the most value from my purchase when I pay the lowest price.
54
2. I get the most value from my purchase when the product I buy offers me the greatest
benefit.
3. I get the most value from my purchase when I get the most that I can for the least amount
of money.
4. I get the most value from my purchase when I pay the lowest price for a quality brand.
Appendix 5: Demographic Survey Questions 1. You identify as:
a. Male
b. Female
c. Other
d. Prefer Not To Respond
2. Your Year of Birth:
a. [Text Entry]
3. Do you currently reside in a University of Guelph Residence?
a. Yes
b. No
Appendix 6: Conjoint Survey Introduction
Grocery Store Choices
In the following section you will be asked to choose between two hypothetical grocery stores.
Each store with have 6 attributes describing the shopping experience and products available at that grocery store.
There will be a total of 18 choice sets where you will be asked to make a decision.
The six grocery store attributes you have to consider are:
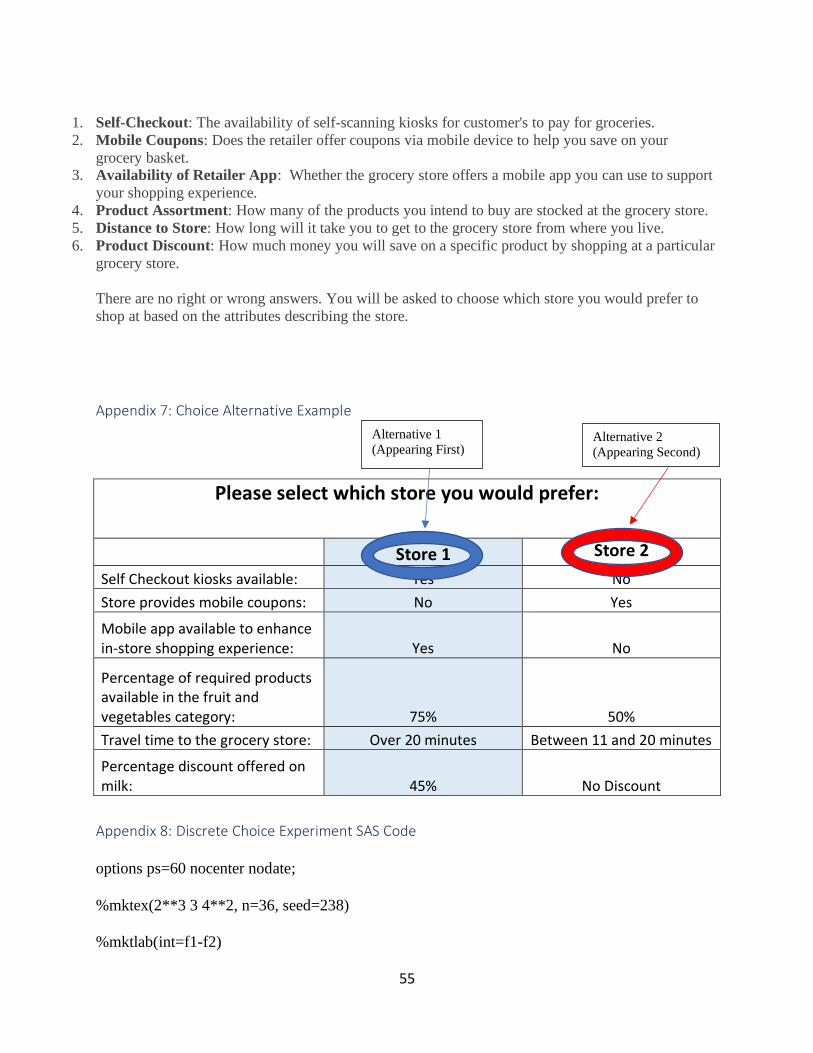
55
1. Self-Checkout: The availability of self-scanning kiosks for customer's to pay for groceries.
2. Mobile Coupons: Does the retailer offer coupons via mobile device to help you save on your
grocery basket. 3. Availability of Retailer App: Whether the grocery store offers a mobile app you can use to support
your shopping experience.
4. Product Assortment: How many of the products you intend to buy are stocked at the grocery store.
5. Distance to Store: How long will it take you to get to the grocery store from where you live.
6. Product Discount: How much money you will save on a specific product by shopping at a particular
grocery store.
There are no right or wrong answers. You will be asked to choose which store you would prefer to
shop at based on the attributes describing the store.
Appendix 7: Choice Alternative Example
Please select which store you would prefer:
Store 1 Store 2
Self Checkout kiosks available: Yes No
Store provides mobile coupons: No Yes
Mobile app available to enhance in-store shopping experience: Yes No
Percentage of required products available in the fruit and vegetables category: 75% 50%
Travel time to the grocery store: Over 20 minutes Between 11 and 20 minutes
Percentage discount offered on milk: 45% No Discount
Appendix 8: Discrete Choice Experiment SAS Code
options ps=60 nocenter nodate;
%mktex(2**3 3 4**2, n=36, seed=238)
%mktlab(int=f1-f2)
Alternative 1
(Appearing First) Alternative 2
(Appearing Second)
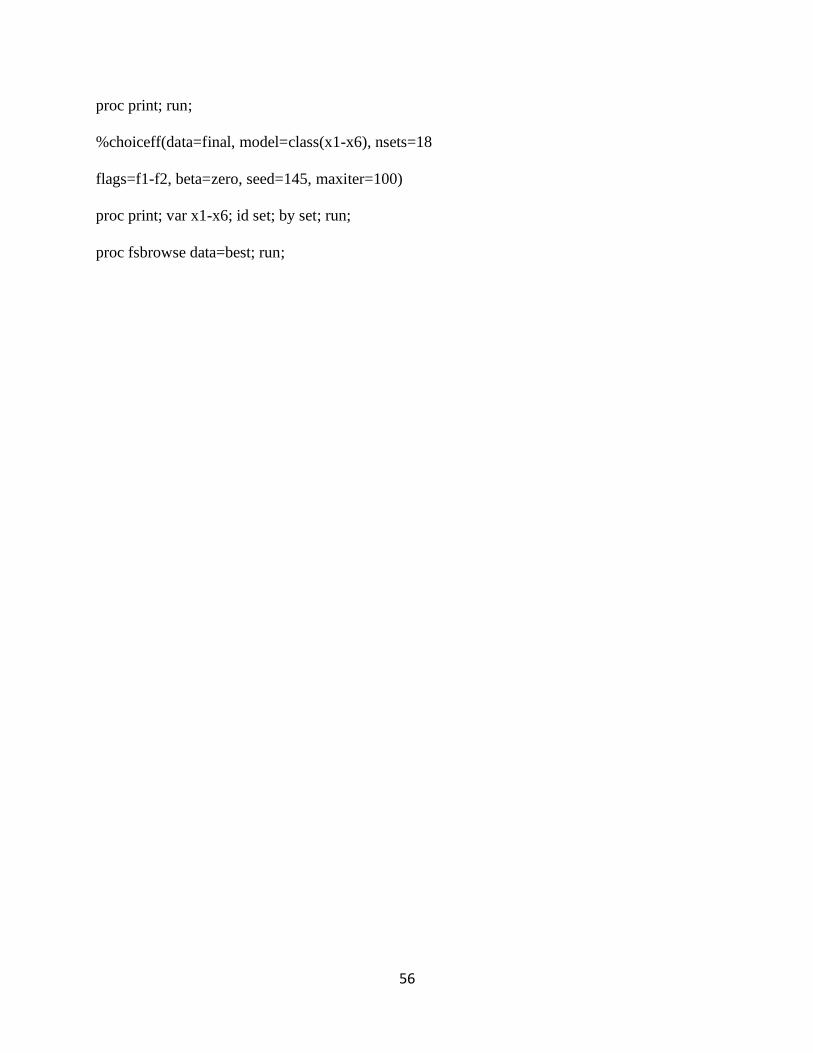
56
proc print; run;
%choiceff(data=final, model=class(x1-x6), nsets=18
flags=f1-f2, beta=zero, seed=145, maxiter=100)
proc print; var x1-x6; id set; by set; run;
proc fsbrowse data=best; run;
Related Documents