i Exploring Differential Item Functioning on reading achievement between English and isiXhosa language subgroups by NANGAMSO MTSATSE Submitted in partial fulfilment of the requirements for the degree MAGISTER EDUCATIONIS in the Faculty of Education at the UNIVERSITY OF PRETORIA PROMOTER: DR S. VAN STADEN OCTOBER 2017

Welcome message from author
This document is posted to help you gain knowledge. Please leave a comment to let me know what you think about it! Share it to your friends and learn new things together.
Transcript

i
Exploring Differential Item Functioning on reading achievement
between English and isiXhosa language subgroups
by
NANGAMSO MTSATSE
Submitted in partial fulfilment of the requirements for the degree
MAGISTER EDUCATIONIS
in the Faculty of Education
at the
UNIVERSITY OF PRETORIA
PROMOTER: DR S. VAN STADEN
OCTOBER 2017

ii
“I declare that the dissertation which I hereby submit for the degree M.Ed. in
Assessment and quality assurance in education and training, at the
University of Pretoria, is my own work and has not previously been
submitted by me for a degree at this or any other tertiary institution.”
.............................................................
NANGAMSO MTSATSE
31 OCTOBER 2017

iii
ETHICAL CLEARANCE CERTIFICATE
iv
ACKNOWLEDGEMENTS
Firstly, I dedicated this study to my nephew and nieces, Hlumelo, Joyanda and
Lelona. May this study always remind you of who are you, where you want to go
and to never forget where you come from. I hope this study serves as a beacon of
hope for every African child who may think that their Africanism is not important.
I would love to give praise and thanks to amanyange basekhaya kwaMacethe kunye
namaZizi together with ooRhadabe kunye namaNtlane ukundikhusela kunye
nondibonisa indlela maxesha onke. To my supervisor Dr Surette van Staden and
Professor Howie, thank you for the learning experience, tears and laughter. You
have watched me grow academically and this study would not have happened
without your consist support and guidance. May God bless you and every student
who goes through your hands.
Thank you to uMama no Tata wam, Nomathamsanqa and Mafa Mtsatse for all the
love, support throughout my studies, furthermore, for being my supporters and
teaching me the value of education. To my sister, Ayanda for always being a
listening ear and encouraging me every time this journey seemed impossible. Thank
you to my dearest CEA colleagues Karen, Celeste, Mishack, for being my think-
tank, providing a space where I am able to bounce off ideas, and for giving critical
feedback. To my fellow students, Cecil and Naledi, for the sessions when we
corroborated and motivated each other.
I would also like to give acknowledgement to UNISA, particularly Linguistics and
Modern Languages, for allowing time off at work and support to complete the study.
Lastly, I would like to extent the greatest appreciation to the National Research Fund
(NRF) for the financial support in conducting and completing the study.

v
ABSTRACT
Post-Apartheid South Africa has undergone an educational language policy shift
from only Afrikaans and English in education to the representation of all 11 official
languages: Afrikaans, English, isiZulu, isiXhosa, isiNdebele, siSwati, Sesotho,
Setswana, Tshivenda and Xitsonga. The national languages policy included the
Language in Education Policy (LiEP), which stipulates that learners from grades 1-
3 in all ways possible should be provided the opportunity to be taught in their home
language (HL). With this change, there has been a need to increase access to
African languages in education. The 2007 Status of LoLT report released by the
Department of Education (DoE) revealed that since 1996 up to 65% of learners in
the foundation phase are being taught in their home language. In other ways, the
LiEP has been successful in bridging the gap of access to African languages in the
basic education system.
With that said, there has been rapid growth of interest in early childhood cross-
cultural literacy assessment across the globe. Internationally South Africa has
participated in the Southern and Eastern Africa Consortium for Monitoring
Education Quality as well as the Progress in International Reading Literacy Study
studies. The design of these particular international studies meant participation in
the same assessment but in different languages, calling into question the
equivalence of assessments across languages. Assessing across languages
should aim to encourage linguistic equivalence, functioning equivalence, cultural
equivalence as well as metric equivalence. South Africa has taken part in three
cycles of the Progress in International Reading Literacy (PIRLS) study. The
purposes of the current study is to present secondary analysis of the prePIRLS 2011
data, to investigate any differential item functioning (DIF) of the achievement scores
between English and isiXhosa.
The Organisation for Economic Co-operation and Development (OECD) developed
a framework of input, process and output for curriculum process. The framework
shows the multiple facets that needs to be considered when implementing a
vi
curriculum in a country. The curriculum process framework was used as the
theoretical framework for this study. The framework views curriculum success as a
process of measuring how the intended curriculum (input) was implemented
(process) and should be reflected in the attained curriculum (output). The adapted
framework is LiEP as the attained curriculum, as learners in the prePIRLS 2011 are
tested in the LoLT in Grades 1-3. Followed by the prePIRLS 2011 assessment, as
the implemented curriculum testing the learners’ comprehension skills requires by
grade 4 in their HL. Lastly, the attained curriculum refers the learners’ achievement
scores in the prePIRLS 2011 study.
A sample of 819 Grade 4 learners (539 English L1 speaking learners and 279
isiXhosa L1 speakign learners) that participated in the prePIRLS 2011 study were
included in this study. These learners wrote a literary passage called The Lonely
Giraffe, accompanied by 15 items. The study made use of the Rasch model to
investigate any evidence of Differential Item Functioning (DIF) on the reading
achievement of the learners.
The findings showed that the items did not reflect an equal distribution. In addition,
an item by item DIF analysis revealed discrimination on one subgroup over the
other. A further investigation showed that these discriminations could be explained
by means of inaccurate linguistic equivalence. The linguistic equivalence could be
explained by means of mistranslation and/or dialectal differences. Subsequently,
the complexities of dialects in African languages are presented by providing
isiXhosa alternative translations to the items. The significance of the current study
is in its potential contribution in further understanding language complexities in
large-scale assessments. Additionally, in attempts to provide valid, reliable and fair
assessment data across sub-groups.
Key Terms:
PrePIRLS 2011, reading literacy, isiXhosa dialects, Rasch measurement, reading
literacy achievement, item bias, translations, secondary analysis

vii
viii
LANGUAGE EDITOR

ix
LIST OF ABBREVIATION
ANA Annual National Assessment
CEA Centre for Evaluation and Assessment
DBE Department of Basic Education
DOE Department of Education
HL Home Language
IEA International Association for the Evaluation of Educational
Achievement
LIEP Languages in Education Policy
LoLT Language of Learning and Teaching
PIRLS Progress in International Reading Literacy Study
PrePIRLS preProgress in International Reading Literacy Study
SACMEQ Southern and Eastern Africa Consortium for Monitoring Educational
Quality
SPSS Statistical Package for the Social Science Study
UNESCO United Nations Educational, Scientific and Cultural Organization
x
Table of Content
ETHICAL CLEARANCE CERTIFICATE ............................................................... iii
ACKNOWLEDGEMENTS ..................................................................................... iv
LIST OF ABBREVIATION .................................................................................... ix
LIST OF FIGURES .............................................................................................. xiii
CHAPTER 1: INTRODUCTION AND BACKGROUND ......................................... 1
1.1 INTRODUCTION ................................................................................... 1
1.2 THE CONTEXT FOR THIS STUDY .......................................................... 2
1.3 PROBLEM STATEMENT ......................................................................... 4
1.4 RESEARCH QUESTIONS ........................................................................ 8
1.5 RESEARCH METHODOLOGY ................................................................. 9
1.6 STRUCTURE OF THE DISSERTATION .................................................. 11
CHAPTER 2: THE PREPIRLS 2011 STUDY IN SOUTH AFRICA ...................... 14
2.1 INTRODUCTION TO PREPIRLS 2011 ................................................... 14
2.2 BACKGROUND TO PREPIRLS 2011 IN SOUTH AFRICA ................ 14
2.3 SOUTH AFRICA’S PERFORMANCE IN PREPRIRLS 2011 .................. 16
2.3.1 South Africa’s overall performance....................................................... 17
2.3.2 PrePIRLS 2011 Benchmarks ............................................................... 18
2.3.3 South Africa’s performance by language .............................................. 20
2.4 PREPIRLS 2011 LEARNING TO READ ............................................. 21
2.5 PREPIRLS 2011 ASSESSMENT FRAMEWORK ............................... 23
2.5.1. Purposes for Reading .......................................................................... 23
2.5.2 Processes of Comprehension .............................................................. 23
2.5.3 Reading Literacy Behaviours and Attitudes .......................................... 25
2.6 PREPIRLS 2011 STUDY AND METHODS ......................................... 27
2.6.1 prePIRLS 2011 Assessment Instruments ............................................. 27
2.6.2 PrePIRLS 2011 Sampling .................................................................... 29

xi
2.6.3 Translation processes .......................................................................... 29
2.6.4 Quality Assurance ................................................................................ 30
2.6.5 Data Analysis ....................................................................................... 30
2.7 CONCLUSION ..................................................................................... 31
CHAPTER 3: LITERATURE REVIEW ................................................................. 33
3.1 CHANGES IN THE SOUTH AFRICAN EDUCATIONAL LANDSCAPE . 33
3.2 LANGUAGE IN EDUCATION IN SOUTH AFRICA SINCE 1994 ........... 36
3.3 EDUCATIONAL LANDSCAPE: APARTHEID ERA VERSUS THE NEW
SOUTH AFRICA ............................................................................................... 38
3.4 LANGUAGE IN EDUCATION POLICY ................................................... 39
3.4.1 Home Language Teaching ............................................................... 39
3.4.2 The Debates around the LiEP Policy ................................................ 40
3.5 REVISED NATIONAL CURRICULUM STATEMENT ............................. 42
3.6 READING LITERACY ............................................................................. 46
3.6.1 Early Literacy Development in South African classes .......................... 46
3.7 ASSESSMENT IN LITERACY ................................................................ 47
3.7.1 Comparative studies ......................................................................... 48
3.8 LANGUAGE PLANNING ........................................................................ 53
3.9 ISIXHOSA LEXICOGRAPHY ................................................................. 55
3.10 CONCLUSION ..................................................................................... 63
3.11 CONCEPTUAL FRAMEWORK ........................................................... 60
CHAPTER 4: RESEARCH DESIGN AND METHODOLOGY .............................. 64
4.1 INTRODUCTION ..................................................................................... 64
4.2 SAMPLE FOR THE CURRENT STUDY ................................................. 64
4.3 ASSESSMENT INSTRUMENTS ............................................................. 65
4.4 DATA ANALYSIS ................................................................................... 66
4.5 Methodological Norms .......................................................................... 68
4.5.1 Identification of the target language, which is the LOLT. .................. 69
4.6 RESEARCH ETHICS .............................................................................. 71
xii
CHAPTER 5: DATA PRESENTATION AND RESULTS ..................................... 72
5.1 RESULTS ............................................................................................... 72
5.2 RESPONSES TO RESEARCH QUESTIONS ......................................... 72
5.2.1 Evidence for answering the main research question ........................ 73
5.2.2 Evidence for answering the research sub-question .......................... 74
5.2.2.1 Item Characteristic Curve for Item 1 ................................................. 78
5.2.2.2 Item Characteristic Curve for Item 2 .................................................. 79
5.2.2.3 Item Characteristic Curve for Item 5 .................................................. 81
5.2.2.4. Item Characteristic Curve for Item 6 ................................................. 83
5.2.2.5. Item Characteristic Curve for Item 7 ................................................. 84
5.2.2.6 Item Characteristic Curve for Item 11 ................................................ 86
5.2.2.7 Item Characteristic Curve for Item 14 ................................................ 87
5.3.1 Evidence for answering the research sub-question two ....................... 88
5.4 SUMMARY OF RESULTS ...................................................................... 93
CHAPTER 6: CONCLUSIONS AND RECOMMENDATIONS ............................. 95
6.1 SUMMARY OF THE RESEARCH APPROACH .................................. 95
6.1.1 Data Source ......................................................................................... 95
6.1.2 Data preparation................................................................................... 95
6.1.3 Data processing ................................................................................... 96
6.2. DISCUSSION ON MAIN FINDINGS .................................................... 97
6.2.1 Discussion on Sub-question 1 findings ................................................. 98
6.2.2 Discussion on Sub-question 2 findings ............................................... 100
6.3 METHODOLOGICAL REFLECTIONS .............................................. 103
6.4 LIMATATIONS OF THE STUDY ....................................................... 103
6.5 RECOMMENDATIONS...................................................................... 104
LIST OF REFERENCES ................................................................................. 106

xiii
LIST OF FIGURES
Figure 1.1: South African Learner Performance in prePIRLS 2011 2011 by
Language of the Test. Note: the light blue line indicates the International Centre
point of 500 Sourced from (Mullis et al., 2011). ...................................................... 3
Figure 2.1: South African Grade 4 Learner Performance in prePIRLS 2011
compared internationally ...................................................................................... 17
Figure 2.2: prePIRLS 2011 South Africa’s benchmark achievement (Howie et el.,
2012. p 47). .......................................................................................................... 19
Figure 2.3: South African Learner Performance in prePIRLS 2011 by Language of
the Test ................................................................................................................ 20
Figure 2.4: The prePIRLS 2011 Conceptual Framework (Mullis et al., 2012)....... 22
Figure 3.1: South African Learner Performance in prePIRLS 2011 by Language of
the Test. Note: the light blue line indicates the International centre point of 500
sourced from (Howie et al., 2012) ........................................................................ 51
Figure 3.2: Adapted from Lodge, RA. (1995). French: from dialect to standard.
London: Routledge. .............................................................................................. 57
Figure 3.3: A reconstructed figure from dialects issues of isiXhosa by Gxilishe
(1996) and Nyamende (1994). ............................................................................. 58
Figure 3.4: Curriculum Process (OECD, 2005) .................................................... 61
Figure 3.5: Conceptual Framework adapted from OECD, 2005 ........................... 62
Figure 5.1: Y-axis expected value in an item characteristic curve labels .............. 76
Figure 5.2: X-axis expected value in an item characteristics curve labels ............ 77
Figure 5.3: IRT model curve ................................................................................. 77
Figure 5.4: Example of an ICC graph English and isiXhosa sub groups .............. 78
Figure 5.5: Item 1 characteristic curve ................................................................. 79
Figure 5.6: Item 2 characteristic curve ................................................................. 80
Figure 5.7: Item 5 characteristic curve ................................................................. 82
Figure 5.8: Item 6 Characteristics Curve .............................................................. 83
Figure 5.9: Item 7 Characteristics Curve .............................................................. 85
Figure 5.10: Item 11 Characteristics Curve .......................................................... 86
Figure 5.11: Item 14 Characteristics Curve .......................................................... 87
xiv
LIST OF TABLES
Table 2.1: International benchmarks of Reading Achievement (Mullis et al., 2012).
............................................................................................................................. 18
Table 2.2: Percentage of prePIRLS 2011 Reading Assessment Devoted to each
Reading Purpose and Comprehension Process taken from Mullis et al., 2012 .... 25
Table 2.3.: Matrix sampling blocks (Mullis et al., 2012). ....................................... 27
Table 2.4: prePIRLS 2011 booklet design ............................................................ 27
Table 3.1: Population distribution under the apartheid regime. Sources: Census
1960 Statesman's Year-Book 1967–1968; ........................................................... 34
Table 3.2: Home Language distribution in South Africa (Census, 2011) .............. 36
Table 3.3: Summary of the Educational landscape from Apartheid to Post-Apartheid
............................................................................................................................. 38
Table 3.4: Overall performance of the foundation phase learners in the ANA 2012
(DBE, 2013) .......................................................................................................... 49
Table 3.5: Levels and Trends in Learner achievements across Regions in South
Africa (SACMEQ, 2007) ....................................................................................... 50
Table 4.1: Item summary for ‘‘The Lonely Giraffe’’ and processes of comprehension.
Adapted from Mullis et al., 2012 ........................................................................... 66
Table 5.1: Number and percentage of learners who answered items in English and
IsiXhosa correctly ................................................................................................. 73
Table 5.2: DIF Summary for The Lonely Giraffe ................................................... 75
Table 5.3: Teacher’s responses to Item 1 ............................................................ 88
Table 5.4: Teacher responses to Item 2 ............................................................... 90
Table 5.5: Teacher responses to Item 5 ............................................................... 92
Table 6.1: Test Translation Error Dimensions according to Salano-Flores et al.,
2009 ................................................................................................................... 101

1
CHAPTER 1: INTRODUCTION AND BACKGROUND
1.1 INTRODUCTION
The aim of the study is to explore the possible effects of Differential Item Functioning
(DIF) using data from the Grade 4 prePIRLS South Africa 2011 study. It proposes
to investigate the English and isiXhosa responses to a passage aimed at assessing
learners’ abilities to read for literary experience, and to provide alternative
translations for the literary passage in the three isiXhosa dialects spoken across
three areas, namely, Mount Frere to Umzimkhulu, Lusikisiski, and Mbashe to Kei
river
Prior to the first democratic elections in 1994 there were only two official languages,
Afrikaans and English, but after the elections, under the interim constitution,
English, Afrikaans, isiZulu, isiXhosa, isiNdebele, siSwati, Sesotho, Sepedi,
Setswana, Tshivenda and Xitsonga together received recognition as official
languages (RSA, 1996). South Africa is a multilingual society with 11 official
language and part of the interim constitution was to provide equality in education
and promote education development (RSA, 1996).
As stipulated in the Constitution (Chapter 2), learners have the right to be taught in
a language of their choice (RSA, 1997b). The Language in Education Policy (LiEP)
states that learners in every way possible should be given the opportunity to be
taught in their home language in Grades 1 to 3 and from Grade 4 they should be
introduced to English as a language of teaching and learning (DBE, 2012).
South Africa, in particular, has been struggling to improve the reading literacy
performance in primary schools. Studies such as the Progress in International
Reading Literacy (PIRLS), the Southern and Eastern African Consortium for
Monitoring Educational Quality (SACMEQ) and the Annual National Assessment
(ANA) have shown that South Africa’s primary school learners’ abilities to read are
much lower than those of counterparts internationally (UNESCO, 2007).
2
1.2 THE CONTEXT FOR THIS STUDY
An organisation for large-scale comparative studies for educational achievement
and other aspects of education, the International Association for the Evaluation of
Educational Achievement (IEA) is an independent, international co-operative of
national research institutions and governmental research agencies of participating
countries. It aims to provide international benchmarks to help policymakers provide
high quality data in order to increase understanding of factors that influence
teaching and learning. The IEA conducts assessments on topics such as Reading
Literacy, Mathematics, Sciences and Civic education, with reading assessment
known as the Progress in International Reading Literacy Study (PIRLS).
South Africa participated in PIRLS 2006 for the first time, with a test was
administered in the official languages at Grade 4 and 5 levels (Howie et al., 2008).
The scaling and the participants’ achievements were depicted by using the 500
points mean and 100 standard deviations as set international (Mullis et al., 2009).
The Grade 4 learners achieved an average score of 253 (SE=4.6) and the Grade 5
learners achieved an average score of 302 (SE=5.9). It is notable that South Africa’s
sample was formulated keeping in mind the languages distribution in the country.
South Africa achieved the lowest score of all 45 participating education systems,
hence the design for PIRLS 2011 was revised, with Grade 5 learners tested only in
English and Afrikaans (Howie et al., 2012). However, for the purpose of testing
learners across the official languages, prePIRLS 2011 was introduced, designed to
be an easier assessment to accommodate countries in which learners were still
developing their reading skills (Mullis et al., 2012).
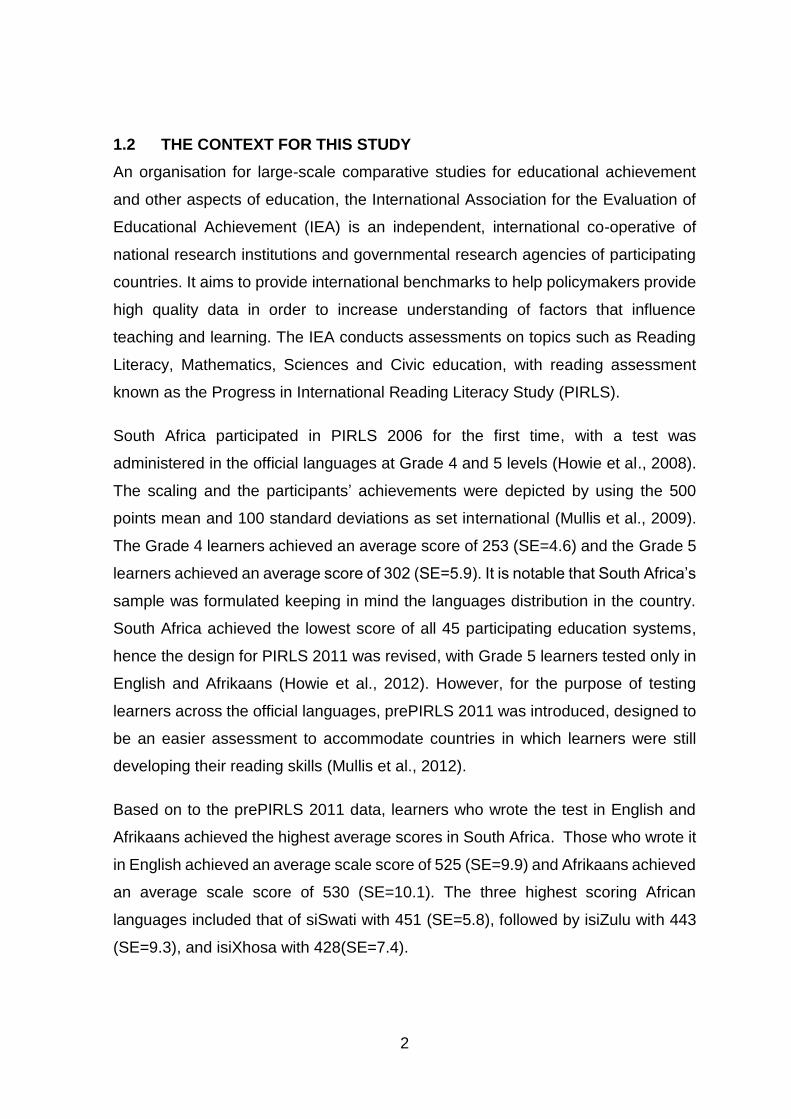
Based on to the prePIRLS 2011 data, learners who wrote the test in English and
Afrikaans achieved the highest average scores in South Africa. Those who wrote it
in English achieved an average scale score of 525 (SE=9.9) and Afrikaans achieved
an average scale score of 530 (SE=10.1). The three highest scoring African
languages included that of siSwati with 451 (SE=5.8), followed by isiZulu with 443
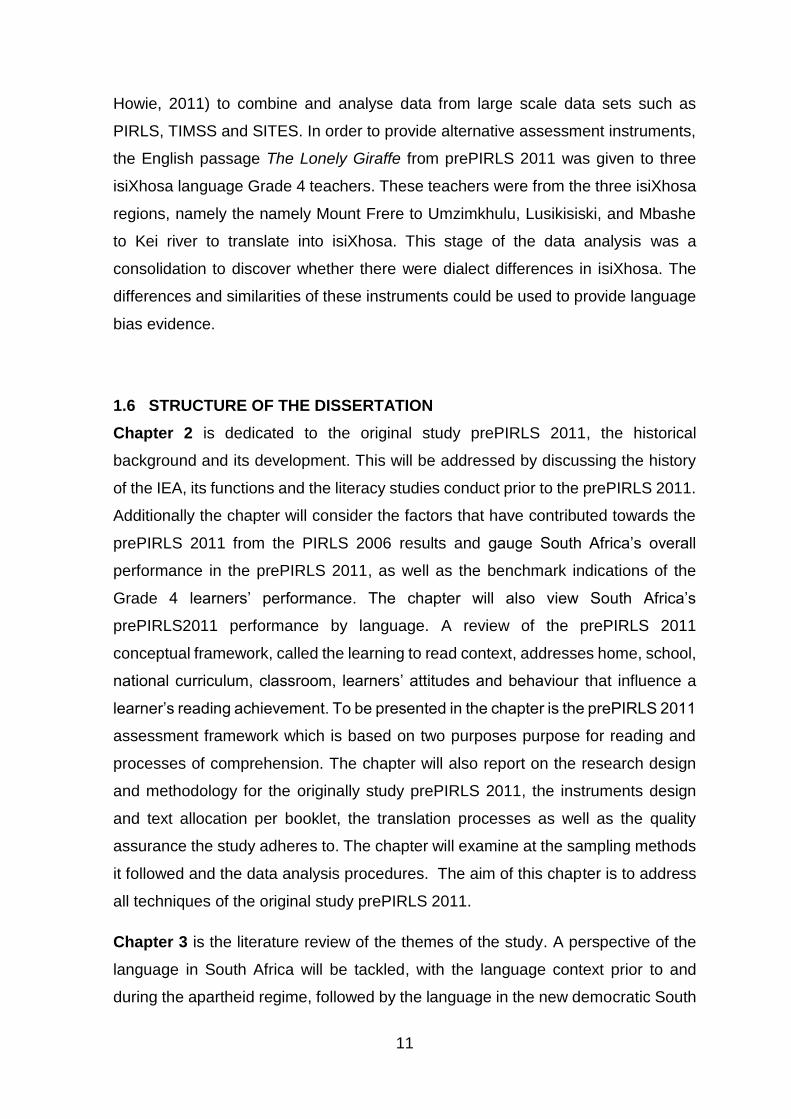
(SE=9.3), and isiXhosa with 428(SE=7.4).

3
Figure 1.1: South African Learner Performance in prePIRLS 2011 2011 by Language of the Test. Note: the light blue line indicates the International Centre point of 500 Sourced from (Mullis et al., 2012).
As illustrated in Figure 1.1 (above), isiXhosa is placed fifth best performing language
out of the 11, though the achievement is significantly lower than the centre point,
considering it is the second most widely spoken language in the country (Census,
2011). For this reason, the study aims to investigate the possible reasons for the
isiXhosa prePIRLS 2011 results.
According to oral history (Peires, 1981), the ancestors of amaXhosa were the first
group of the Nguni to migrate to South Africa, around the 13th century, from the
east coast of Southern Africa. The language isiXhosa is an agglutinative tonal
language of the Bantu family, which is a family group from Southern African tribes
(Loest et al., 1997). There is a clear distinction between amaXhosa and isiXhosa
speakers, the former being those who claim descent from an ancestral king named
Xhosa, which is amaQcaleka and amaRharhabe of the present day (Bekker, 2003).
The latter, isiXhosa speaking tribes are the Thembu, Mpondo, Mpondemise, Bhele,
Zizi, Hlubi and Bhaca. The Xhosa speaking tribes have their own history but speak
the language isiXhosa and The Xhosa speaking tribes came from Natal as refugees
of Mfeqana wars and settled in the amaXhosa land in the early 18th century (Bekker,
2003). The refugees became part of the amaXhosa and adapted their language and
culture, hence current isiXhosa speaking groups’ customs have a close
0
100
200
300
400
500
600
Ave
rage
Sca
le S
core
4
commonality (Mayer, 1971). Their isiXhosa dialect thus differs slightly from the
original one spoken by the amaXhosa (Bekker, 2003). Due to the South Africa’s
political history, many of the isiXhosa speaking people were pressured to leave their
tribes and homelands and seek better employment in urban areas such as
Johannesburg, Cape Town and the industrial hubs of Port Elizabeth, Kimberly and
Rustenburg. They settled in these urban and industrial cities where they integrated
with English, Afrikaans and other African speakers. Due to migrant labour and their
nature of work they often spoke the employer’s language (Peires, 1981) and so
there were new isiXhosa dialects that had developed from integration and migrant
labour.
The study aims to explore learner achievement in the prePIRLS 2011 South Africa
taking into account translation bias due to the development of isiXhosa dialects.
1.3 PROBLEM STATEMENT
Prior to the apartheid era it was the missionaries in South Africa who began to
provide reading resources for Africans (Edwards & Ngwary, 2011). Although the
majority of resources published in South Africa were in Afrikaans and English (DAC,
2008) in 1994 a mandate was issued under the interim constitution which was
responsible for readdressing language inequality. The Pan South African Language
Board (PanSALB) is an organisation which is responsible for the development of
the 11 official languages and promotion of multilingualism (RSA, 1996). The boom
in translation then followed the democratic elections but lack of standardisation of
African languages has impacted literacy development in the country. The reasons
for these challenges include the pool of people undertaking the translation of books
for children being small and the frequent complaints regarding the quality of the
translation (Edwards & Ngwary, 2011). It has further caused issues in the
standardisation of the different African languages (Prah, 2009). The PanSALB has
established lexigraphy units for each language to develop terminology and
standardisation of languages though there is little evidence from the unit’s
development as most of the work was undertaken under apartheid (Heugh, 2006).
There seem to be a delay in regards to keeping pace with the needs of the
publishing industries (Edwards & Ngwary, 2011) so the issues around translation

5
and standardisation have negatively impacted the education sector. The curriculum
promotes multilingualism and learners being taught in the home language. The lack
of resources and terminology in African languages has resulted to Afrikaans and
English still being the preferred languages for teaching and learning. On the other
hand, the government is introducing educational policies which should encourage
learners to be taught in the home language.
In South Africa, the Language in Education Policy (LiEP) has been implemented to
recognise the different home languages and create opportunities for learners to be
taught in their home language from Grades 1 to 3. The policy was published to
highlight the use of home language as a language of learning and teaching (LoLT),
guided by the South African Schools Act 1996(b) with legislation aimed at promoting
multilingualism, the development of the official languages, and respect for all
languages used in the country (DoE, 1997). The LoLT is another language policy
that forms part of the LiEP and suggests that learners are to be taught in their Home
Language (HL) (DoE, 2010). The National Curriculum and Assessment Policy
Statement (CAPS) of 2011 for HL and First Additional Language (FAL) stipulates
that the main developmental skills are listening, speaking and language structure
which are further developed and refined but with an emphasis on reading and writing
skills (DoE, 2011).
The LiEP is a building block in implementing multilingualism in schools and
classrooms. The principles of the policy is to maintain home language for teaching
and learning, but poses the question posed is as to whether the policy is effectively
implemented in classrooms. South African classrooms today are linguistically
diverse and this dynamic situation could cause potential challenges for the teachers
in deciding on the language of instruction (Pretorius, 2014). In addition, because of
these diverse societies, learners identify with home language not only because of
their home language but also the dominant language where they reside. Due to the
diversity of society, learners also speak languages that are most spoken in their
communities. In addition, and inter-cultural marriages have resulted in families
having more than one language spoken in their household. These discrepancies
between home languages do not guarantee effective implementation of the LiEP for
children in the foundation phase. According to Probyn et al. (2002), schools are not
equipped to make decisions about the school language policies that meet the

6
requirements of the LiEP. There is a lack of resources to teach in African language
and African teachers are not adequately trained to teach in their home languages
(van Staden & Howie & Bosker, 2014).
The debate continues whether the LiEP has been successfully implemented in
schools, with ineffective implementation of the policy blamed for mostly affecting
African learners in former Model C schools1 (Mncwango, 2012). The LiEP
encourages schools to offer HL as a LoLT (1997b), however, African learners in
former Model C schools have English or Afrikaans (Mncwayo, 2012). The LoLT
means that African learners have to adapt to the schools’ language of learning which
in most cases is different to their home language. A strong argument made by some
schools that parents enrol their children to learn English therefore there is no
demand to offer African languages (Mncwayo, 2012). Additionally, a case study
done by Probyn et al. (2002) showed that three of the four sampled former Model C
schools refused to consider revising their school language policy to accommodate
African learners. The key principle of the LiEP is to promote multilingualism and to
maintain all cultures and languages across all ethnicities. In contrast, the education
curriculum stipulates that learners from Grade 4 be introduced to English as LoLT
and their HL as a first additional language (DBE, 2009).
As a result, most learners undergo a language transition in Grade 3 and 4 (Howie
et al., 2009). Due to the lack of resources and training to teach African languages,
the rationale is that English is the favoured language of teaching (World Bank,
2007). Grade 3 learners who are taught in their home language have to change to
the LoLT in Grade 4, presenting a challenge for the learners as the introduction of
English in Grade 3 does not equip them for the transition or the language demands
encountered in Grade 4. The common underlying principle in reading proficiency
relates to academic proficiency (Cummins, 2001), so in order for learners to be able
to learn in any other subject it is vital that they master the foundation of reading.
Thus, in a bilingual education system it is important for learners to learn in their
home language to develop strong literacy skills for building academic literacy
proficiency (Pretorius, 2014). In an intervention that was conducted in functional
1 Model C Schools refer to the Afrikaans and English segregated schools during the apartheid regime.

7
township schools, Pretorius (2014) describes the transition as “from learning to read
to reading to learn”. There is an unloaded gap between Grades 3 and 4 which
presents a need to catch up in the intermediate phase. Within a multilingual
education context that expects learners to be bi-literate, reading to learn is
undertaken in a language that is not their home one, and this contributes to the
challenges of the LoLT transitions (Pretorius, 2014). In order to have an effective
teaching and learning environment, teachers need to ensure that their teaching
methodologies and practices are correct and efficient.
Code switching is generally not accepted as a classroom strategy or methodology
(Probyn, 2001), though it is being practiced in South African classrooms, where
teachers and learners share a common home language that is used for teaching
and learning (Probyn, 2009), while the LoLT is English. Teachers use code
switching to utilise the linguistic resources of the classroom in a responsive way and
in so doing the hope is to achieve a range of cognitive and effective teaching and
learning goals. In a bilingual classroom in which LoLT is not the home language,
teachers are faced with goals of the content and the language of teaching (Wong-
Fillmore, 1986). Teachers’ classroom practises are moulded by the language
proficiency of the learners (Cummins, 2001). According to Martin-Jones (1995),
code switching is related to the language policy debate, and the LiEP encourages
schools to teach in the home language, though schools still insist on having English
as a LoLT (Mncwayo, 2012). Learners’ poor proficiency in the language of teaching
and learning has a direct association on their academic achievement (Probyn,
2001). The Annual National Assessment (ANA) has shown that learners are still
performing below the expected benchmark in literacy reading.
The past 20 years have shown an increase in countries that participated in
international testing for learning in mathematics, science and reading (Kamens &
McNeely, 2010). Although there has been an increased interest in these cross-
cultural comparative assessments there have been methodological challenges
(Wolf et al., 2015). The factors that weigh heavily on them can be briefly
summarised in four major categories: 1) the scope of the item content’s equitability
for each of the countries participating; 2) comparisons across countries being
facilitated by the use of common scaling techniques; 3) sampling being
representative and adequate; and 4) the appropriate language to be used in testing

8
(Kamens & McNeely, 2010). Comparative studies such as prePIRLS 2011,
Southern and Eastern Consortium for Monitoring Educational Quality (SACMEQ)
and the Trends in Mathematics and Science Studies (TIMSS) are standardised tests
developed for an English population. The value of standardised testing is not
identical for a learner whose home language is not English (Goh, 2004). In South
Africa, prePIRLS 2011 was administered in Grade 4 in the LoLT of Grades 1-3, as
this was presumably the home language to which learners would have been
exposed in the Foundation Phase (Howie et al., 2012). The question posed whether
the standardised tests developed for an English-speaking population and translated
into the 10 other official languages create bias in assessment. The challenges faced
are replicating a test in another language whilst consistently retaining its original
meaning. The contextualisation of the passages may also create the possibility for
some learners being disadvantaged.
1.4 RESEARCH QUESTIONS
Based on the above background, the main research question is posed as follows:
What is the difference in the reading achievement score between English
and isiXhosa Grade 4 prePIRLS 2011 passage The Lonely Giraffe?
The main research question is then divided:
Sub-question 1:
To what extent can the differences explained by providing evidence of bias
in Differential Item Functioning (DIF) be found between English and isiXhosa
Grade 4 prePIRLS 2011 response to a reading passage The Lonely Giraffe?
Sub- question 2:
To what extent could any of the other isiXhosa dialects have provided
alternative forms of the items to the passage The Lonely Giraffe?

9
1.5 RESEARCH METHODOLOGY
The aim of this study is to explore translation bias by using DIF methods, employing
a quantitative secondary analysis of the prePIRLS 2011 South African data and the
learner achievement booklets drawing responses to a passage from The Lonely
Giraffe, a literary work that has a total of six free response questions and nine
multiple choice questions. It explores items only from achievement booklets in
English and isiXhosa. Quantitative methods make up a process that is systematic
and objective, backed up by numerical data (Maree, 2013). Quantitative research
consists of experimental and non-experimental designs (Creswell, 2008) and the
nature of the study is a quantitative secondary analysis making use of a non-
experimental design existing data.
Secondary analysis can be defined as second-hand (McCaston, 2005) with a
research design that is collected for a different purpose from the primary research
(Sørensen et al., 1996). This study made use of existing data gathered for the
purpose of prePIRLS 2011 to explore any item bias for the English and isiXhosa
passages by means of quantitative secondary analysis. The sampling required by
the prePIRLS 2011 study was a target population of learners representing at least
four years of schooling (Mullis et al., 2009). In South Africa’s case, schools were
sampled according to language of instruction and school status, referring to the
LoLT of schools in the first three schooling years.
An intended number of 345 schools were sampled for prePIRLS 2011 (Howie et al.,
2012), with the total who participated in the prePIRLS 2011 being 15,744, of whom
2,205 were English and 1,090 isiXhosa. The reading assessment instrument
comprised Grade 4 level fictional (literary) stories and non-fictional (informational)
stories. The item types in the test booklets consisted of multiple choice as well as
free response questions (Howie et al., 2012). For the purpose of this study, the
focus was on the passage The Lonely Giraffe, a passage in a story about a group
of animals in a bushveld setting and how a lonely giraffe acts as a rescuer during a
crisis to secure his place among the other animals (van Staden & Howie, 2011).
The passage appears in test booklets 3, 4 and 12. The prePIRLS 2011 achievement
booklets were randomly assigned to the learners before the test was administered,
with assessment instruments developed in English. In the South African context the
assessment instruments were translated into the 10 other official languages. The

10
translation process of the prePIRLS 2011 South Africa underwent strict guidelines
and procedures set out by the IEA for all participating countries (Howie et al., 2012).
This was instituted to ensure that all official languages underwent the same
verification and quality assurance. This study aims to investigate how assessment
instruments developed for an English population and when translated into African
languages creates item bias.
In order to answer the main question a Rasch Item Response Theory (IRT) was
used to analyse the secondary data from prePIRLS 2011. IRT works as a single
parameter model that measures learners’ probability to answer a test item correctly
(Smit, 2004). The probability of a learner being able to answer a test item depends
on the item bias so the aim of the analysis would be to establish whether the item
functions differently for learners of different probabilities. According to Smit (2004),
item bias is associated with differential item functioning (DIF), that is the level of
difficulty of a test item that depends on some characteristics of a group (Cambridge,
1998). DIF is used when individuals of different backgrounds are tested and has the
assumption that individuals have the same proficiency but different probabilities to
answer the question correctly (Garmerman & Goncaluas & Siares, 2011). In this
particular study the probability of answering the question correctly is dependent on
the English and isiXhosa group differences, therefore differences in language. The
language differences can then be associated with different probabilities (Gierl &
Khaliq, 2001). RUMM2030 software was used to analyse the data through Rasch
IRT.
Based on the outcomes of the evidence of bias (main question), the hypothesis was
that there would be differences in the item responses from the English and isiXhosa
learners. The different probabilities of the two language groups influence the way in
which the item is answered correctly. In this case, the performances of the learners
from the language groups were not the same and varied across the items. With this
assumption, the main question was divided into two sub-questions. For the purpose
of answering sub-question 1, descriptive statistics were used to identify and report
variations in reading literacy achievement between English and isiXhosa The Lonely
Giraffe responses. The IEA’s International Database Analyser (IDB Analyser)
software was used to report the descriptive statistics, a plug-in for the Statistical
Package for the Social Sciences (SPSS) developed by the IEA (van Staden &
11
Howie, 2011) to combine and analyse data from large scale data sets such as
PIRLS, TIMSS and SITES. In order to provide alternative assessment instruments,
the English passage The Lonely Giraffe from prePIRLS 2011 was given to three
isiXhosa language Grade 4 teachers. These teachers were from the three isiXhosa
regions, namely the namely Mount Frere to Umzimkhulu, Lusikisiski, and Mbashe
to Kei river to translate into isiXhosa. This stage of the data analysis was a
consolidation to discover whether there were dialect differences in isiXhosa. The
differences and similarities of these instruments could be used to provide language
bias evidence.
1.6 STRUCTURE OF THE DISSERTATION
Chapter 2 is dedicated to the original study prePIRLS 2011, the historical
background and its development. This will be addressed by discussing the history
of the IEA, its functions and the literacy studies conduct prior to the prePIRLS 2011.
Additionally the chapter will consider the factors that have contributed towards the
prePIRLS 2011 from the PIRLS 2006 results and gauge South Africa’s overall
performance in the prePIRLS 2011, as well as the benchmark indications of the
Grade 4 learners’ performance. The chapter will also view South Africa’s
prePIRLS2011 performance by language. A review of the prePIRLS 2011
conceptual framework, called the learning to read context, addresses home, school,
national curriculum, classroom, learners’ attitudes and behaviour that influence a
learner’s reading achievement. To be presented in the chapter is the prePIRLS 2011
assessment framework which is based on two purposes purpose for reading and
processes of comprehension. The chapter will also report on the research design
and methodology for the originally study prePIRLS 2011, the instruments design
and text allocation per booklet, the translation processes as well as the quality
assurance the study adheres to. The chapter will examine at the sampling methods
it followed and the data analysis procedures. The aim of this chapter is to address
all techniques of the original study prePIRLS 2011.
Chapter 3 is the literature review of the themes of the study. A perspective of the
language in South Africa will be tackled, with the language context prior to and
during the apartheid regime, followed by the language in the new democratic South

12
Africa, comparing the language policies from these three different eras and
exploring the differences in the official languages from the perspective of African
languages. The second theme in the literature review is the different language
policies implemented in the new democratic South Africa. The discussion will
include a scrutiny of the Chapter 2 Bill of Rights and exploring the ways in which the
democratic South Africa aims to promote multilingualism, respect for all races,
languages and cultures. The discussion will include looking at the Language in
Education Policy, its key principles, implementation and debates around the topic.
The prePIRLS 2011 was conducted when the Revised National Curriculum
Statement (RNCS) was still in place so the chapter will look into the significant
learning areas in languages under it. A brief discussion on assessment will review
how different authors view assessment in a school-based context, assessment in
national and international contexts. This theme aims to explore how the differences
and similarities in these three different levels of assessment can contribute
positively or negatively towards a learner’s performance. The last theme in the
literature review is the standardisation of African languages. As regards the
development, write-up and standardisation of African languages in South Africa, the
focus will be isiXhosa as the sub-group that participated in the prePIRLS 2011. The
theme will deliberate the isiXhosa lexicography and illustrate the different dialects
within the language.
Chapter 4 includes secondary analysis research design, using the Rasch theory to
measure the item difficulty levels of the learner achievement scores with Rumm
2030 software. Second, the descriptive statistics will be included to answer the
research questions. The chapter will briefly discuss the nature of the prePIRLRS
2011 data collection, capturing, processing, reliability and validity. For the purpose
of this study the focus is on the English and isiXhosa achievement booklets.
Chapter 5 is based on data analysis that begins with descriptive statistics for the
overall achievement scores for English and isiXhosa sub-group language for The
Lonely Giraffe. Descriptive statistics also present the number of correct respondents
in each item, following a statistical technique named the ANOVA to test the null
hypothesis between the means scores between the sub-groups. This analysis also
displays the p-value of each item to determine the functioning between the two sub-
groups. After the items that provide evidence for non-functioning are identified, an

13
additional phase of analysis is conducted. This third analysis consisted of item
characteristic curves (ICC). The ICC graphs enable one to depict the differential
item functioning of the English and isiXhosa language groups. These graphs are
based on the Item Response Theory (IRT), which measures the predicted value
against the obtained value and indicate whether the item has any difficulty level
discrimination towards one group over the other. From the ICC graphs, the items
that show evidence of discrimination towards isiXhosa will undergo the final stage
of analysis. These identified items will then be given to Foundation Phase teachers
from different isiXhosa dialect areas to review the translations. All the comments
will be compiled to determine whether the difficulty levels are due to translation
issues or bias in the items.
Chapter 6 is the final chapter of the study, where the recommendations and
conclusions are discussed. The data presented in chapter 5 indicated four main
recommendations. Lastly, the chapter concludes by explaining the identified
translation errors in terms of the test translation error dimension theory.
14
CHAPTER 2: THE PREPIRLS 2011 STUDY IN SOUTH AFRICA
2.1 INTRODUCTION TO PREPIRLS 2011
The International Association for the Evaluation of Educational Achievement (IEA)
is an organisation for large-scale comparative studies of educational achievement
and other aspects of education. It is an independent, international cooperative of
national research institutions and governmental research agencies that aims to
provide, inter alia, international benchmarks to assist policymakers to provide high
quality data to increase their understanding of factors associated with teaching and
learning (Mullis et al., 2012). It conducts assessment of topics such as reading
literacy, mathematics, science and civic education and conducts assessment
research in well-known international studies such as the Trends in Mathematics and
Science Studies (TIMSS), and the Progress in International Reading Literacy Study
(PIRLS) (Mullis et al., 2012).
This chapter aims to provide an overview of the research design and methodology
of the framework used by the IEA for the prePIRLS 2011 study. It will include a
discussion of the history and background of the study and factors that contributed
to its establishment, with a description of South Africa’s performance as well as the
benchmark allocations. It will then address the research design of the prePIRLS
2011 study that will look at the paradigm, the assessment framework, the process
followed in the passages selection, the translation guidelines and the scientific
allocation of passages in the booklets. The methodology is used to discuss the
sampling method, data collection and the quality control procedures to which the
study had to adhere. The current study is a secondary analysis of the prePIRLS
2011 data and the main purposes of this chapter is to address the international
study design and methods of the prePIRLS 2011 used.
2.2 BACKGROUND TO PREPIRLS 2011 IN SOUTH AFRICA
The first international comparative reading literacy study initiated by the IEA took
place across 32 educational systems in 1991. The Reading Literacy study aimed to
examine reading literacy across countries that included Belgium, Botswana,
Canada, Denmark, France, Finland, Germany, Greece, Hong Kong, Sweden,
Thailand, USA and New Zealand. The framework design of the study assessed the

15
nature of reading instruction, relationships between reading comprehension and the
aspects of the home and school environment. The target population was nine and
14 year old learners and Finland scored the highest reading literacy achievement
with both age groups, while the USA achieved high reading scores in the nine year
old learners’ assessment and Sweden, France and New Zealand achieved high
reading scores in the 14 year old assessment. It was also learnt that schools that
were more effective in the development of reading literacy had more female
teachers and the availability of the books at home, school or at a nearby community
library was identified as a key factor for high achievement in reading literacy
(Brinkley et al., 1995).
Ten years later this study was followed by the Progress in International Reading
Literacy Study (PIRLS) in 2001 with 35 education systems2 or countries
participating. PIRLS 2006 was the third study under the IEA, and enabled countries
to identify long-term trends. The third cycle would allow the countries to monitor the
developments in reading and education over time (Mullis et al., 2009). The research
objectives of prePIRLS 2011 were to explain national performance and international
comparisons for:
The reading achievement of Grade 4 learners in South Africa;
The reading achievement of Grade 4 learners in 11 official South African
languages, and the achievement of benchmark in reading;
Grade 4 learner competencies in relations to goals and standards for reading
education;
The impact of the home environment and social conditions on Grade 4
learner performance and how parents foster reading literacy with PIRLS
2006 as baseline data;
The organisation and planning of the reading curriculum in the Grade 4 by
schools with PIRLS 2006 as baseline data;
2 Refers to the education curriculum of the countries that participated in the prePIRLS 2011 study.

16
Classroom approaches to and strategies for the teaching of reading in Grade
4, taking into account time and reading material for instruction; and
Policy implementation regarding curriculum and infrastructural development
at schools at Grade 4 level.
Adopted from (Howie et el., 2012 p 21)
The research objectives aimed at establishing a new baseline as prePIRLS 2011
were a new study but the 2011 cycle has been unable to provide trend data as yet.
South Africa participated in the IEA’s reading literacy study for the first time in the
PIRLS 2006 study, then conducted in South Africa by the Centre for Evaluation and
Assessment in 441 schools in October and November 2004, which resulted in the
assessment of 16,073 of Grade 4 learners and 14,657 Grade 5 learners across all
11 official languages. The assessment of two grades endorsed the tracking
progress from Grades 4 to 5. Overall, South Africa was one of the lowest performing
countries with the Grade 5 learners achieving the lowest score of 302 (SE=5.6). The
Grade 4 learners achieved an average score of 253 (SE=4.6) (Howie et al., 2008).
South Africa participated in PIRLS 2011, the fourth study under the IEA on
international literacy comparative reading assessment, and the second cycle in
which they participated. In addition to PIRLS 2011, South Africa opted to participate
in prePIRLS 2011 which was administered across all 11 official languages in Grade
4. As an easier assessment, it allowed developing countries the opportunity to
measure reading literacy achievement, since achievement scores in PIRLS 2006.
South Africa were at very low levels. In PIRLS 2011 only Grade 5 learners were
tested in English and Afrikaans (Howie et al., 2012), since learners who were tested
in these languages in PIRLS 2006 were performing the best.
2.3 SOUTH AFRICA’S PERFORMANCE IN PREPIRLS 2011
The performance of South Africa in prePirls 2001 can be broken down as in this
section.

17
2.3.1 South Africa’s overall performance
South Africa was one of three countries that participated in prePIRLS 2011 along
with Colombia and Botswana (Howie et al., 2012). It was the lowest performing
country relative to the scale with a centre point of 500 (median) and a standard
deviation of 100. The centre point made it possible for cross-country comparison
since the countries presented a wide variation (Mullis et al., 2012).
Figure 2.1: South African Grade 4 Learner Performance in prePIRLS 2011 compared internationally
Figure 2.1 (above) shows the performance of the countries that participated in the
prePIRLS 2011 study, indicating the overall performance of South Africa with an
average score of 461 (SE=3.7). The overall performance of South Africa and
Botswana is significantly lower that the centre point of 500 by 37 and 39 points.
Colombia obtained an average score of 576, which is above the centre point by 76
points (Howie et al., 2012). Botswana and South Africa were the only African
countries participating in this particular study and South Africa remained the lowest
performing in Africa. Girls achieved an average score of 475, and boys an average
score of 446, confirming international trends in gender comparison.
576
500463 461
0
100
200
300
400
500
600
700
Columbia International CentrePoint
Botswana South Africa
Ave
rage
Sca
le S
core
Countries participating prePIRLS 2011 study

18
2.3.2 PrePIRLS 2011 Benchmarks
In prePIRLS 2011, Grade 4 learners’ reading achievement was categorised by four
benchmarks, namely (1) advanced international; (2) high international; (3)
intermediate international; and (4) the low international (Mullis et al., 2009). Table
2.1 (below) indicates the different ones, with scores associated with and the level of
competence presented by each.
Table 2.1: International benchmarks of Reading Achievement (Mullis et al., 2012).
Advanced International benchmark
625 When reading literary texts, learners can:
Intergrade ideas and evidence across a text to appreciate overall themes
Interpret story event and character actions to provide reasons, motivations, feelings
and character traits with full text – based support
When reading information texts, learner can:
Distinguish and interpret complex information from different parts of texts and
provide full text – based support
Integrate information across a text to provide explanations, interpret significance
and sequence activities
High International benchmark
550 When reading Literary texts, learners can:
Locate and distinguish significant actions and details embedded across the text
Make inferences to explain relationship between intentions, actions, events and
feelings and give text – based support
Interpret and integrate story events and character actions and traits from different
parts of text
Evaluate the significant of events and actions across the entire story
Recognise the use of some language features
When reading information text learners can:
Locate and distinguish relevant information within a dense text or a complex table
Make inferences about logical connections to provide explanations and reasons
Integrate textual and visual information to interpret the relationship between ideas
Evaluate content and textual elements to make generalisations
Intermediate International benchmark
475 When reading Literary texts, learners can:
Retrieve and reproduce explicitly stated actions, events and feelings
Make straight forwarded inferences about the attributes, feelings and
motivations of main characters
Interpret obvious reasons and causes and give simple explanations
Begin to recognise language features and style
When reading information texts, learners can:

19
Locate and reproduce two or three pieces of information from within the
text
Use subheading, text boxes and illustrations to locate parts of the text
Low International benchmark
400 When reading Literary texts, learners can:
Locate and retrieve an explicitly stated detail
When reading information texts, learners can:
Locate and reproduce two or three pieces of information from within the
text
Use subheadings and text boxes, and illustrate to locate part of the text
The prePIRLS 2011 South Africa’s overall benchmark performance is as follows;
Figure 2.2: prePIRLS 2011 South Africa’s benchmark achievement (Howie et el., 2012. p 47).
Figure 2.2 (above) shows that 29% of South African learners who participated in
prePIRLS 2011 achieved within the low international benchmark. A small
percentage of 12.4% learners reached the high international benchmark and only
6.1% reached the advanced international benchmark. A majority of the Grade 4
learners participating reached between the lower two benchmarks. The total
percentage of these learners in the lower two benchmarks is 52.73%, which
translates to the majority of the Grade 4 learners who were only able to reach
28.63 29.6
23.13
12.46
6.17
0
5
10
15
20
25
30
35
Did not reachlow
internationalbenchmark
LowInternationalbenchmark
IntermediateInternationalbenchmark
HighInternationalbenchmark
AdvancedInternationalbenchmark
South Africa's Learner Achievement
South Africa's LearnerAchievement

20
between 0 and 475 scale score points. Additionally, a much lower percentage,
18.63%, reached the higher two benchmarks. The difference between the higher
and lower benchmarks amounted to a difference of 34.1% of learners, with an
alarming 28.63% unable to even reach the low international.
2.3.3 South Africa’s performance by language
PrePIRLS 2011 was administered in the 11 official languages. Of the 10 African
languages, nine performed below the international centre point (Howie et al., 2012).
Figure 2.3: South African Learner Performance in prePIRLS 2011 by Language of the Test
Grade 4 learners who wrote the test in English and Afrikaans achieved the highest
average scores in South Africa, above the international centre point of 500. Learners
who were tested in English achieved an average scale score of 525 (SE=9.9) and
those who were tested in Afrikaans achieved an average scale score of 530
(SE=10.1). The three highest scoring African languages was siSwati with 451
(SE=5.8), followed by isiZulu with 443 (SE=9.3) points, then isiXhosa with 428
(SE=7.4) points. The lowest performing African languages were Sepedi with 388
(SE=7.4) and Tshivenda with 395 (SE=7.6) points (Howie, et al., 2012).
0
100
200
300
400
500
600
Ave
rage
Sca
le S
core
21
This study focuses on the language isiXhosa, the second most widely spoken
language in South Africa, across three provinces, Eastern Cape, Western Cape and
Northern Cape (Census, 2011). The learners who wrote the test in isiXhosa in the
prePIRLS 2011 achieved an average score of 428 (SE=7.4) points, substantially
below the international centre point of 500.
2.4 PREPIRLS 2011 LEARNING TO READ
Reading literacy is defined by the IEA as fundamental to the prePIRLS 2011:
… the ability to understand and use those written language forms required
by society and/or valued by the individual. Young readers can construct
meaning from a variety of texts. They read to learn, to participate in
communities of readers in school and everyday life, and for enjoyment (Mullis
et al., 2009).
The aim of the prePIRLS 2011 assessment was to provide interaction between the
reader and the passage to construct a meaning from text. It understood reading in
school and in everyday life, with learners constructing meaning and developing
effective reading strategies to reflect on reading (Howie et al., 2012). The reading
experiences of learners show an association with home, school, classroom context
and the communities in which they live (Mullis et al., 2009). The assessment
framework was based on a belief that a learner’s reading achievement made a
contribution to various contexts, such as national and community, home, school and
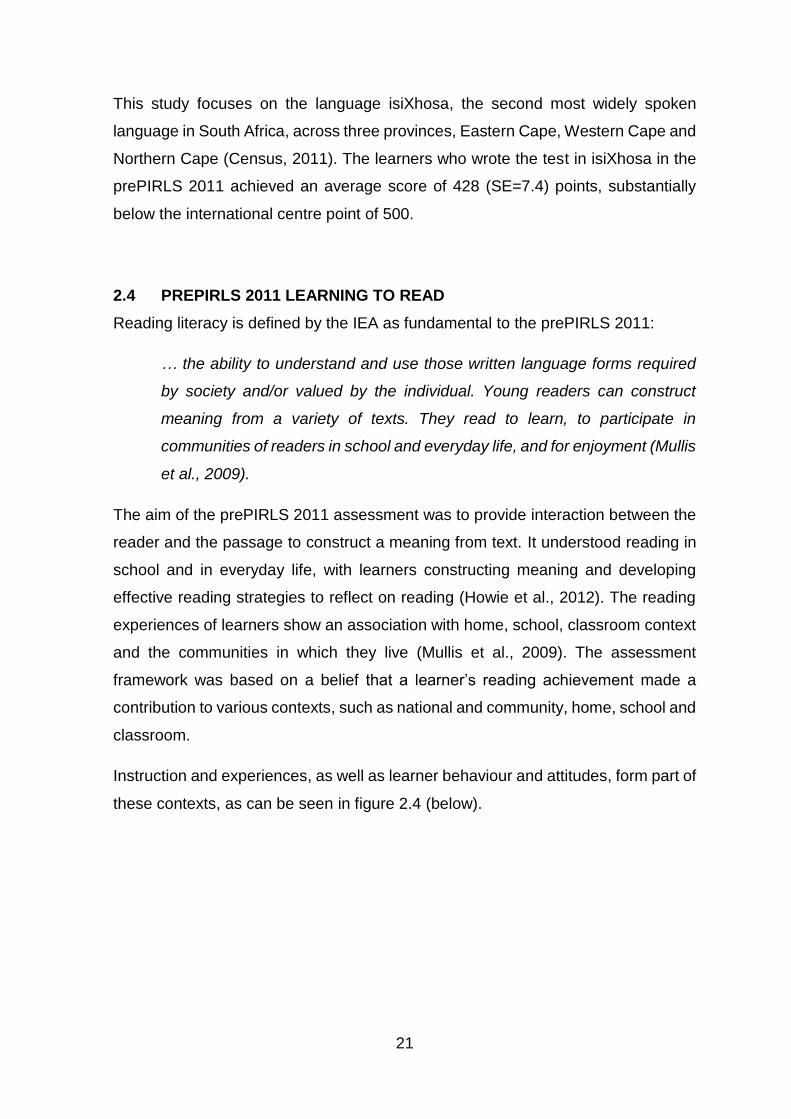
classroom.
Instruction and experiences, as well as learner behaviour and attitudes, form part of
these contexts, as can be seen in figure 2.4 (below).

22
Figure 2.4: The prePIRLS 2011 Conceptual Framework (Mullis et al., 2012).
The conceptual framework posits that learner reading achievement is based on six
main contexts. The national and community contexts involve aspects such as the
socio-economics and Gross Domestic Product (GDP), which have a relationship
with the home, school and classroom environment to which the learners are
exposed. The home context refers to the child’s access to domestic, economic,
social and educational resources. In additional to the home context is the emphasis
on parental literacy development and the parents’ reading behaviour and attitudes,
which will impact the learners’ achievement by means of modelling and guidance.
The school context refers to the type of school a learner is in and how that affects
reading and attainment. This also includes the productivity and work ethic the school
has as well as its organisation (Howie et al., 2012). The classroom context is
apparent through the teacher education and development, teacher characteristics
and attitude. Another aspect is the classroom context, which include characteristics
such class size, instructional resources, technology use and activities (Mullis et al.,
2012). The learner behaviour and attitude consist of reading literacy behaviour,
positive attitudes towards reading and attitudes towards learning to read (Howie et
al., 2012).
National &
Community
Home School Classroom
Instruction
and
Experience
Learner
Reading
Achievem
Learner
Behaviour
and

23
2.5 PREPIRLS 2011 ASSESSMENT FRAMEWORK
The prePirls 2011 assessment framework comprised the following components.
2.5.1. Purposes for Reading
For fourth year schooling learners’ reading is often focussed on two aspects, namely
narratives and informational texts, whilst the prePIRLS 2011 study was centred on
two purposes of reading, namely, a) reading for literary experiences; and b) reading
to acquire and use information. The assessment had an equal allocation of both.
The items that accompanied the passages also addressed the reading purposes,
for example, a literary text as a fictional passage and questions about the themes,
plot, setting and characters. Literary experiences allow a reader to engage with the
text to express feelings, atmosphere, ideas, settings, actions, consequences and
character (Mullis et al., 2012). For Grade 4 learners literary reading offered the
learners a chance to explore the situations and feelings that they might have come
across. PrePIRLS 2011 literary text was mainly in the form of narrative fiction.
The informational passages were in a form of informative articles or instructional
text and asked questions that addressed the information contained in the passage
(Mullis et al., 2012). Reading for the use and acquisition of information could be
addressed in several informational texts. Young learners usually read informational
texts to cover a wide range of content for example scientific, historical, and
geographical and social sciences (Mullis et al., 2012). The prePIRLS 2011
assessment focused on informational text that would reflect learners’ authentic
experiences with reading informational passages in and out of the schooling
environment.
2.5.2 Processes of Comprehension
According to Baker and Beall (2009), readers construct meaning in different ways.
The prePIRLS 2011 assessment framework assessed mainly four processes of
comprehension, namely, a) focus on and retrieve explicitly stated information; b)
making straightforward inferences; c) interpreting and integrating ideas and
information; and e) evaluating and critiquing content and textual elements (Mullis et
al., 2012).
24
Focus on explicitly stated information looks at how a reader retrieves it in a text to
answer a question, including tasks that will identify information relevant to the
specific goal of reading, searching for specific ideas, definitions of words or phrases,
identifying the setting of a story and finding the topic sentence or main idea (Mullis
et al., 2012). To make straightforward inferences a reader constructs meaning from
a text through ideas not clearly stated in it (Zwaan & Singer, 2003). The prePIRLS
2011 assessed this text processing by inferring that one event causes another event
and conducting the main point made by a series of arguments. The ability to make
straightforward inferences also includes tasks that will identify generalisations made
in the text and describing the relationship between characters (Mullis et al., 2012).
The third process of comprehension in the prePIRLS 2011 assessment framework
was to interpret and integrate ideas and information such that the reader might
engage with a text that would focus on local or global meaning. To achieve this
particular text process involved inclusion of discerning the overall message or
theme of a text and considering an alternative to actions of characters, comparing
and contrasting text information, inferring a story’s mood or tone and interpreting a
real-world application of text information (Mullis et al., 2012).
Concerning the evaluation of content and textual elements a reader shifts the focus
from constructing meaning to critically analysing the text itself. The tasks for the
comprehension process are judging the completeness or clarity of information in the
text. The reader evaluates the likelihood that the events described could really
happen and the author’s argument and describe the effect of language features,
such as metaphors or tone and determining an author’s perspective on the central
topic (Mullis et al., 2012).
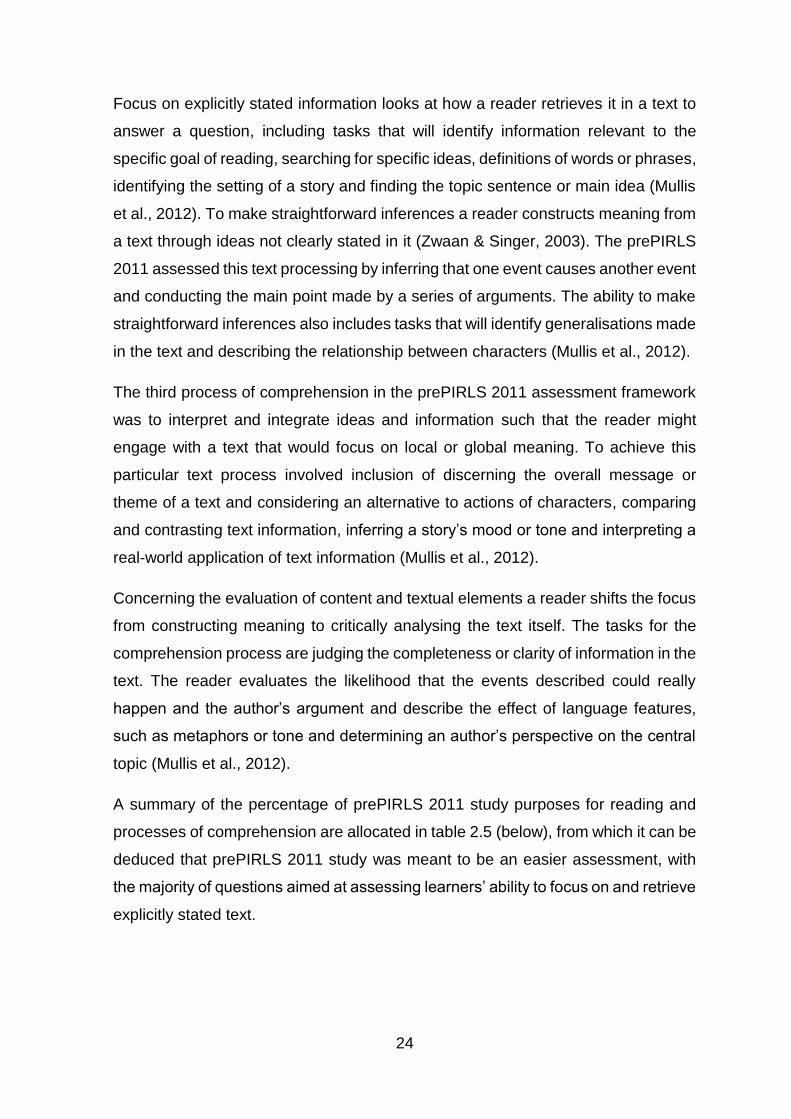
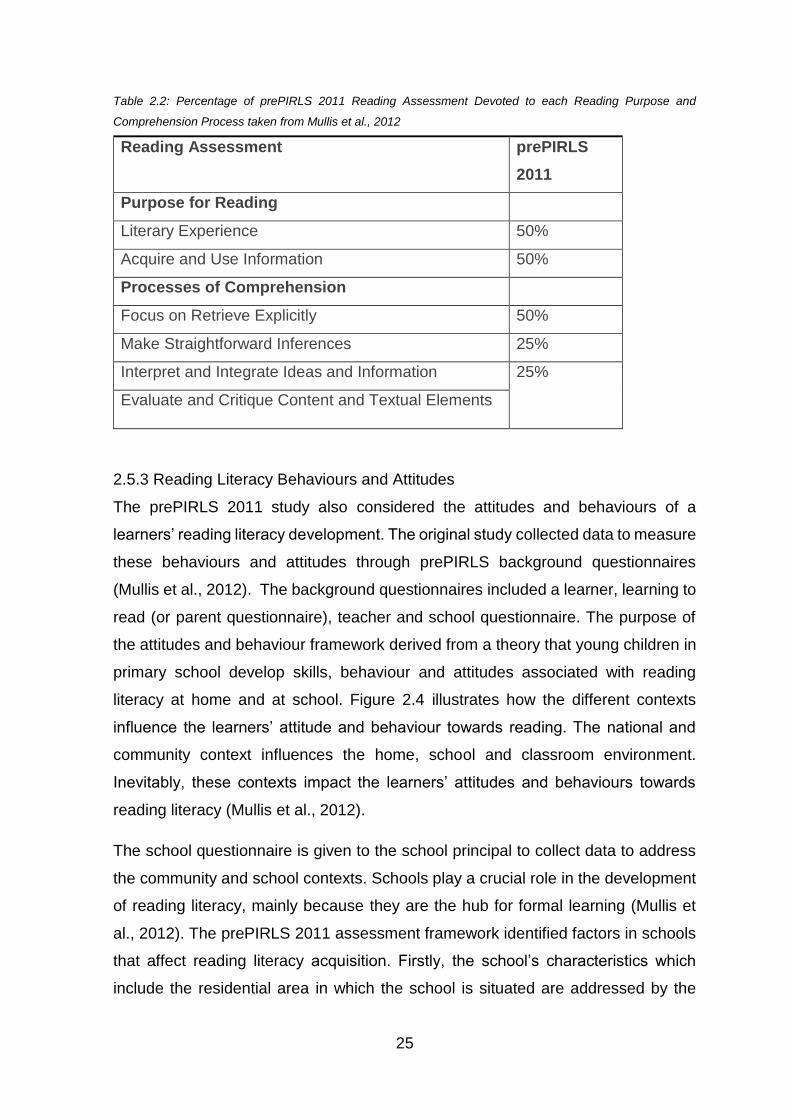
A summary of the percentage of prePIRLS 2011 study purposes for reading and
processes of comprehension are allocated in table 2.5 (below), from which it can be
deduced that prePIRLS 2011 study was meant to be an easier assessment, with
the majority of questions aimed at assessing learners’ ability to focus on and retrieve
explicitly stated text.
25
Table 2.2: Percentage of prePIRLS 2011 Reading Assessment Devoted to each Reading Purpose and
Comprehension Process taken from Mullis et al., 2012
Reading Assessment prePIRLS
2011
Purpose for Reading
Literary Experience 50%
Acquire and Use Information 50%
Processes of Comprehension
Focus on Retrieve Explicitly 50%
Make Straightforward Inferences 25%
Interpret and Integrate Ideas and Information 25%
Evaluate and Critique Content and Textual Elements
2.5.3 Reading Literacy Behaviours and Attitudes
The prePIRLS 2011 study also considered the attitudes and behaviours of a
learners’ reading literacy development. The original study collected data to measure
these behaviours and attitudes through prePIRLS background questionnaires
(Mullis et al., 2012). The background questionnaires included a learner, learning to
read (or parent questionnaire), teacher and school questionnaire. The purpose of
the attitudes and behaviour framework derived from a theory that young children in
primary school develop skills, behaviour and attitudes associated with reading
literacy at home and at school. Figure 2.4 illustrates how the different contexts
influence the learners’ attitude and behaviour towards reading. The national and
community context influences the home, school and classroom environment.
Inevitably, these contexts impact the learners’ attitudes and behaviours towards
reading literacy (Mullis et al., 2012).
The school questionnaire is given to the school principal to collect data to address
the community and school contexts. Schools play a crucial role in the development
of reading literacy, mainly because they are the hub for formal learning (Mullis et
al., 2012). The prePIRLS 2011 assessment framework identified factors in schools
that affect reading literacy acquisition. Firstly, the school’s characteristics which
include the residential area in which the school is situated are addressed by the

26
school questionnaire. Secondly, the school’s organisation for instruction in literacy-
related policies is used to determine the formal reading instruction the learners
receive. Thirdly, the school’s climate for learning which inevitably has an impact on
the academic programmes is addressed. Lastly, the availability and quality of the
school’s resources also contribute to the quality of learning instruction and are
addressed by the school questionnaire (Mullis et al., 2012).
The teacher questionnaire was given to the teacher of the sampled class, and the
questionnaire aimed to collect date on the classroom context. The teacher and
classroom environment is another influential determinant on a learner’s literacy
development. Firstly, the questionnaire determines how the teacher’s education and
development assist in their own knowledge and understanding of how learners learn
to read. Secondly, it determines how a teacher’s attitude and characteristic impacts
the learners in the classroom experiences of reading. Thirdly, the classroom context
is ascertained by determining the class size, teaching approaches, teaching
strategies, instructional materials and use of technology. All these classroom
contexts assume an influence on the learners’ progress (Mullis et al., 2012).
The learning to read questionnaire was given to the learners’ parents, guardian or
caregiver. It provided insight into the home environment on reading literacy. A
family’s belief about reading as well as the learner’s exposure to text impacts the
learner’s own belief and experience about reading (Baker et al., 1996). The
questionnaire measured two aspects, firstly, economic, social and educational
resources, secondly parental emphasis on literacy development.
The learner questionnaire was completed by the learner and explored the learners’
characteristics and attitudes. The first aspects in the questionnaire measured the
reading literacy behaviours of the learner. As a learner develops reading literacy the
time he or she spends reading and doing the activities become significant (Mullis et
al., 2012). Therefore, the time spent on reading, including outside school reading
activities, cultivates a habit of long-life reading habit for learners and increases the
practise skills (Duke, 2004). The second aspect is the learners’ attitudes towards
learning to read and reading itself. The assumption is that learners who read well
have a positive attitude towards reading and learning to read (Mullis et al., 2009;
2012). For example, a learner who spends more time reading will consequently

27
develop proficiency in reading and one who has a strong self-concept about reading
ability will continue to read on current levels of learning and will enjoy challenging
readings.
2.6 PREPIRLS 2011 STUDY AND METHODS
PrePIRLS 2011 utilised the IEA approaches to international surveys and
comparatives studies (Howie et al., 2012). The research approach of the study is a
quantitative cross-sectional survey design which makes use of assessment
instruments and questionnaires.
2.6.1 prePIRLS 2011 Assessment Instruments
PrePIRLS 2011 instruments included the achievement booklets and background
questionnaires which had been developed in English and distributed to the
participating countries by the International Study Centre (ISC). The achievement
booklet is the assessment book the learners completed by reading passages and
answering questions based on the passages. It included Grade 4 level fiction stories
and informational level text passage, supplied by the different participating
countries. The passages were aimed at engaging the learners in a full range of
reading strategies, for example, a) retrieving and focusing on specific ideas; b)
making simple and more complex inferences; and c) examining and evaluating text
features. The items that accompanied the reading passages consisted of two types
of questions, namely, multiple-choice and free response (Howie et al., 2012).
A matrix design was used to ensure the spread of passages across the booklets
(Howie et al., 2012). The reading passages and its items were divided into groups
and blocks, for example, the literary passages from L1 – L4 and the informational
passages I1 – I4. This meant there were a total of eight blocks, which needed to be
distributed across 12 different achievement booklets (Mullis et al., 2009).
Table 2.3.: Matrix sampling blocks (Mullis et al., 2012).
Table 2.4: prePIRLS 2011 booklet design
Purpose for Reading Block
Literary Experience L1 L2 L3 L4
Acquire and use information I1 I2 I3 I4

28
Additional to the assessment instruments are the background questionnaire which
aimed to collect data relating to the reading behaviour of learners and the reading
attitudes of learners, parents, teachers and school principals. The learner
questionnaire included items that could collect information about the learners’ home
and school experiences about learning to read. Furthermore, the learner
questionnaire also collected information about the attitudes of the learners’ reading
habits (Mullis et al., 2012). The learner questionnaire was in the language in which
the learners completed the prePIRLS 2011 assessment.3.
To ascertain the learners’ reading experiences at home a parent questionnaire was
also designed. Referred to as the Learning to Read Survey in prePIRLS 2011 it also
3 The language of testing coincided with the Language in Learning and Teaching in which learners were taught during their Foundation Phase.
Booklet Literary Experience Acquire and Use Information
1 L1 L2
2 L2 L3
3 L3 L4
4 L4 I1
5 I1 I2
6 I2 I3
7 I3 I4
8 I4 L1
9 L1 I1
10 I2 L2
11 L3 I3
12 I4 L4

29
included parents’ behaviour and attitudes towards reading. As with the learner
questionnaire the parent questionnaire was also translated in the LoLT of the
learner. The teacher questionnaire was completed by the language teacher, aimed
at gathering information about the teaching and learning related to reading and
language in the classroom context. The school questionnaire was completed by the
principal and aimed to collect data about the school context related to reading and
language (Mullis et al., 2012). The teacher and school questionnaires were only
administered in English as a cost-saving device, with the assumption that teachers
and principals would be able to read English. For the purpose of this study, the
background questionnaire data will not be explored or analysed.
2.6.2 PrePIRLS 2011 Sampling
The sampling required by the study was a target population who had four years of
schooling. In South Africa this meant Grade 4 learners, with a design that required
at least 150 schools (Mullis et al., 2009). A three-stage stratified cluster sampling
design was used in prePIRLS 2011 (Joncas & Foy, 2010), meaning that during the
first stage schools were sampled, then during the second stage intact classrooms
were randomly selected followed by all the learners in these classes as the third
stage sampling unit (Joncas & Foy, 2010).
In South Africa, the sample was stratified specifically by language of instruction. A
total of 345 schools were sampled for prePIRLS, but only 341 schools participated
in the study (Howie et al., 2012). The schools that did not participate were due to
schools’ refusal to participate or the closing of schools. The 341 schools translate
into a total 15 744 Grade 4 learners who wrote the prePIRLS 2011 assessment.
2.6.3 Translation processes
The instruments had to be modified by means of conceptualisation into South
African context and items translated in the other ten languages (Howie et al., 2012).
A process of back translation was used (Stubbe, 2010). Passages and items were
developed in English, professional translators were appointed to translate from
English into Afrikaans, isiNdebele, isiXhosa, isiZulu, siSwati, Sepedi, Sesotho,
Setswana, Tshivenda and Xitsonga, after which they were translated back into

30
English (Howie et al., 2012). The back translation is a process used to check that
the meaning of the passage in the translated language remains the same as
presented in English. The instruments underwent a scrutinised process of
international translation verification submitted to the IEA, which appointed
independent translation verifiers to assure quality, verify the translations and adhere
to standardisation (Howie et al., 2012). Due to the number of official languages in
South Africa, the IEA only verified the seven most spoken languages, namely,
Afrikaans, English, isiXhosa, isiZulu, Sepedi, Sesotho and Setswana (Howie et al.,
2012). The CEA had to ensure additional quality for the remaining four smaller
languages.
2.6.4 Quality Assurance
The study consisted of several checkpoints that were set by the IEA as strict
guidelines for quality assurance during data collection. Throughout the data
collection, external monitors visited schools during testing to ensure all procedures
were according to IEA standards. The instruments then went to the next stage of
the project which was the scoring of the response items by scorers comprising
student teachers and retired teachers. As far as possible, mother tongue speakers
were used (Howie et al., 2012) and in this phase of the study a certain percentage
of booklets in each language were quality assured to ensure that scoring was
conducted fairly across all booklets. This meant that some booklets were scored
twice to ensure consistency in marking, after which international scoring reliability
was checked. This meant that all countries who administered the assessment in
English exchanged booklets to score. The data capturing was by a service provider
appointment by the CEA. Both the multiple choice and coded response items were
captured. A total of 60% of the achievement booklets were captured twice to ensure
consistency with the data capturers. The software used to capture the data was
WinDem and all these quality checkpoints aimed to increase the validity and
reliability of the study (Howie et al., 2012).
2.6.5 Data Analysis
The achievement instruments were randomly assigned to learners before the test
date, each instrument being marked with the learner’s name and surname, 8 digit

31
ID number linked to the school and class of the learner. The data collection was
conducted by a market research company appointed by the CEA. Training was
provided to the fieldworkers and the fieldwork supervisors to ensure standardised
procedures and compliance with the IEA guidelines. The data collection took place
during October and November 2011 (Howie et al., 2012). The assessment was in a
form of a one day test session. The learners were given in total 80 minutes to
complete the achievement booklets (40 minutes per booklet) with a compulsory
break after the first 40 minutes.
The prePIRLS 2011 South African achievement data is presented by language and
gender (Howie et al., 2012). A learner who participated in prePIRLS 2011 was only
assessed on a certain subset of items from the entire prePIRLS 2011 reading item
pool (Foy et al., 2011). Because a learner was assessed on a subset of the items
there was a need to have a learner’s score for the entire assessment framework for
analysis and reporting purposes. In line with the purpose, prePIRLS 2011 uses the
item response theory (IRT) scaling approach to describe a learner achievement on
the assessment. IRT works as a single-parameter model that measures learners’
probability to answer a test item correctly (Smit, 2004). The scaling approach utilities
a multiple imputation termed ‘plausible values’, the use of which is a methodology
to obtain proficiency scores in reading. To increase the reliability scores of the
scaling approach, prePIRLS 2011 uses a term known as ‘conditioning, a process
by which learners’ responses to the items are combined with information about their
background (Foy et al., 2011).
2.7 CONCLUSION
This chapter presented an outline of the prePIRLS 2011 study as it was conducted
for international purposes. It discussed the background with an overview of the
South African performance presented by looking at the overall performances of the
country, the benchmark performance points and the achievement scores by
language. It also included the assessment framework with the purposes for reading
and processes of comprehension. The chapter aimed to show how the sample was
selected as well as how the achievement instruments and background
questionnaires were posed. A description was given of how quality assurances
during data collection were ensured. It ends with a description of the use of plausible

32
values to report achievement results, which for the current study forms a critical part
of the analysis.

33
CHAPTER 3: LITERATURE REVIEW
This chapter is an overview of reviewed literature, the first topic being the changes
in the educational landscape in South Africa, comparing the educational context of
the apartheid era and the ‘new South Africa’. A debate around the Language in
Education Policy (LiEP) will be dealt with, to discuss how different scholars may
view it, exploring the challenges and the successful aspects. The chapter will also
look at the curriculum history in South Africa followed by a breakdown of the Grade
4 language RNCS outcomes and standards. It will include an outline of the
assessment standards in reading literacy as viewed nationally and internationally to
understand what they mean in a global educational context. Additionally, the
chapter will present findings of the systemic evaluation such as the Annual National
Assessment and international comparative studies namely the Southern and
Eastern African Consortium for Monitoring Educational Quality (SACMEQ) and the
Progress in International Reading Literacy Study (PIRLS). Lastly, the chapter will
unfold the processes involved in standardisation of languages in South Africa, by
considering what formulates a standardised language.
3.1 CHANGES IN THE SOUTH AFRICAN EDUCATIONAL LANDSCAPE
South Africa has a protracted history of language policy and development with
Language having been used as a tool for segregation for many years (Sayed, 2011).
In 1948, under the Apartheid Act, the language policies were formalised and made
legislation. Between then and the first multiracial democratic elections in 1994 the
government recognised only Afrikaans and English as official languages (Brook
Napier, 2011) with no acknowledgment of the African languages by the government,
since all public signs, boards and communications were in Afrikaans or English only.
The Apartheid regime not only not refused to recognise African languages it also
constructed education policies that would be different across the racial groups.
Under Apartheid, South Africa consisted of four provinces the Cape Colony, Natal,
Transvaal and the Orange Free State, each with its own legislation but the supreme
legislation being the Constitution which overruled provincial legislation. The
population distribution across all four provinces remained the same with Bantus

34
(black people) dominating followed by whites except for the Cape Colony with
Coloureds and lastly Asians (Census, 1960). Table 3.1 (below) presents the statics
of the 1960 Census.
Table 3.1: Population distribution under the apartheid regime. Sources: Census 1960 Statesman's Year-
Book 1967–1968;
Province Cape Colony Natal Transvaal Orange
Free State
Total Percent
Bantu 3,011,080 2,199,920 4,633,378 1,083,886 10,928,264 68.3%
White 1,003,207 340,235 1,468,305 276,745 3,088,492 19.3%
Coloured 1,330,089 45,253 108,007 25,909 1,509,258 9.4%
Asiatic 18,477 394,854 63,787 7 477,125 3.0%
Total 5,362,853 2,980,262 6,273,477 1,386,547 16,003,139 100.0%
% of
South
Africa
33.5% 18.6% 39.2% 8.7% 100.0%
According to Table 3.1, by 1960 South Africa had a total population of 16,003,139,
a large proportion of whom, 68.3%, consisted of Bantus, 19.3% Whites, 9.4%
Coloured and 3% Asian. The province with the largest population was Transvaal
with 39.2%, because of high labour migration from rural to urban settlements for the
mining industry and economic boost in urban areas.
During apartheid the educational policies and practices did not recognise
multilingualism (Brook Napier, 2011), underpinned by the Bantu Education Act of
1948 which labelled schools for white learners as European or Model C schools and
those for non-white learners as Native schools (RSA, 1953). The Native language
Education Policy outlined that learners from Grades 1 to 3 would be taught in an
African language (Alexandra, 2003). The African language was decided by either
the homeland administration under which the school fell or by Bantu provincial
administration (RSA, 1953). In addition, a first additional language for the native
schools was a choice between Afrikaans and English (Alexandra, 2003). The

35
apartheid governments recognised the importance of learning in home language
but officials rejected the ideology, citing the following (UNESCO, 1953:11):
It is axiomatic that the best medium for teaching a child is his mother
tongue…But, it is not always possible to use mother tongue in school and,
even when possible, some factors may impede or condition its use.
According to Alexandra (2003), the language policy was in line with the most up-to-
date international educational research, which proposed the idea of building a
society that regarded Africans as inferior. Moreover, the government claimed to
provide academic evidence for the detribalisation of African people (Alexandra,
2003).
Under the same Bantu Education Act, No 47 1948, the language medium from
Grades 4 to 12 was either Afrikaans or English and the First Additional Language
was an African language (Alexandra, 2003), which meant that for white and non-
white school groups the medium of instruction was only Afrikaans or English. The
time allocated for the languages in black native schools was set in a way that
learners spent more learning and teaching time on Afrikaans and English (Nkondo,
n.d). The weekly allocated time was 4 hours 30 minutes for Afrikaans and English,
3 hours and 30 minutes for their mother tongue (Transvaal Education Department,
1970).
In Model C schools, learners took Afrikaans and English for equal amounts of time
of 4 hours per week. The second phase of Bantu Education began in 1975, when
the Ministry insisted that from Grades 4 to12 the LoLT would be both English and
Afrikaans. This legislation resulted in a lot of resistance by learners themselves as
well as teachers and native community members (Alexandra, 2003).
The apartheid system managed to use language in education as a tool to segregate
learners from different backgrounds, races and cultures. As a result of the Bantu
Act, significant importance was placed on teaching in Afrikaans or English and the
African languages remained neglected. The irony of the language policy is how
African learners had to use Afrikaans or English and white learners did not have to
learn any African language. Indirectly, this policy was sending a message to the
African learners that their languages were not essential and it was more significant

36
to learn Afrikaans or English (Nkondo, n.d). South Africa’s government, through
local resistance and international sanctions realised the importance of reforming its
segregated policy and move towards a more non-racial, democratic country that
acknowledges every language and culture as part of the nation.
3.2 LANGUAGE IN EDUCATION IN SOUTH AFRICA SINCE 1994
In 1994, South Africa held its first democratic elections in which citizens above the
ages of 18 years old of all races, ethnicities and cultures were given the opportunity
to vote. The language policies were integral to the new government strategy to
redress the discrimination of the past and rebuild a new identity for the country
(Chick, 2002). The aim of the LiEP was to promote multilingualism and a non-racial
country. Language equity was one of the main development key issues in
developing African languages and improving access to these languages. In Chapter
1 (6) of the new constitution Afrikaans, English, isiNdebele, isiXhosa, isiZulu,
Sepedi, Sesotho, Setswana, siSwati, Tshivenda and Xitsonga were legislated as
official languages.
According to the South African Census 2011, the language distributions in
households were as follows:
Table 3.2: Home Language distribution in South Africa (Census, 2011)
Official Language Percentage of the population
speak the language
Afrikaans 13.5%
English 9.6%
isiNdebele 2.1%
isiXhosa 16%
isiZulu 22.7%
Sepedi 9.1%
Sesotho 7.6%
Setswana 8%
siSwati 2.6%
Tshivenda 2.4%
Xitsonga 4.5%

37
According to Table 3.2, isiZulu (22.7%) is the most spoken language, followed by
isiXhosa (16%) and by Afrikaans (13.5%) (Census, 2011). The other official
languages are spoken by fewer than 10% of the population. The total number of
people who speak African languages are many more than for Afrikaans and English.
Due to the diverse language society it is important for government to ensure all
language needs and demands for the country are addressed, thus, under the Interim
Constitution of 1996 the government aimed to install democratic policies in all
sectors, including education and language (Reconstruction and Development
Programme, 1994).
The language policy innovations in the new South Africa included a multiple-
languages model which focused on language inclusivity in education (Desai, 1994).
Chapter 2 of the Bill of rights in the Constitution promoted cultural diversity and basic
human rights (RSA, 1996). The LiEP targeted language practices in schools,
specifically addressing the LoLT (National Education Policy Investigation, 1996) It
was introduced under the interim Constitution of 1996 as a mandate to promote
multilingualism and respect for all languages and cultures in the country (RSA,
1996), stating that learners from Grades R to 3 should be offered their HL as one of
LoLT as far as possible. The LiEP aimed to promote mother tongue teaching and
learning (DBE, 2007).
The Norms and Standards regarding Language Policy published in the South
African Schools Act 1996 set out guidelines on issues concerning learners which
included aspects of attendance, admission policy, language policy and code of
conduct. The act stipulated protocol and procedures with regards to school
governance and general provisions (RSA, 1996). The purpose was to ensure a
centralised guideline that all public schools could adhere to. Chapter 1 (5) deals with
admission procedures to public school based on educational requirements without
unfairly discriminating in any way. With regards to the language policy in public
schools it was to be determined by the school governing body. In section 6B, the
Act highlighted non-discrimination in respect of official languages. This section of
the act provides a centralised system on how schools undertake the decision of
determining the language policy.
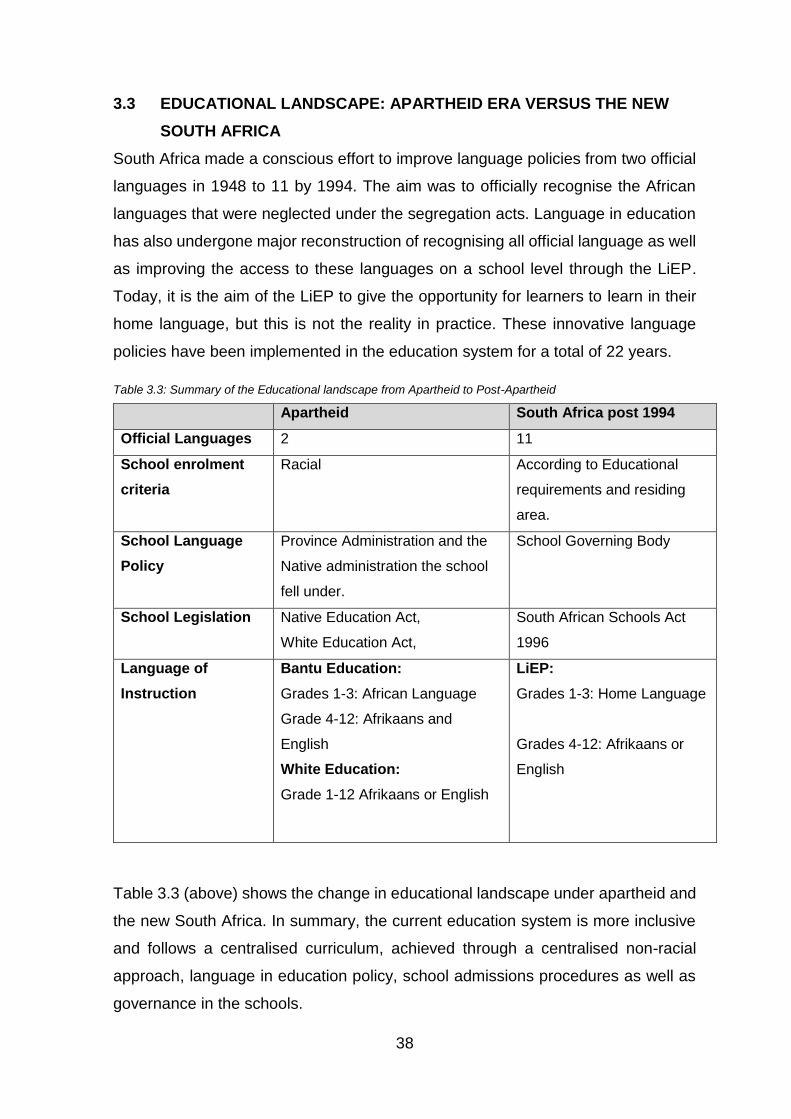
38
3.3 EDUCATIONAL LANDSCAPE: APARTHEID ERA VERSUS THE NEW
SOUTH AFRICA
South Africa made a conscious effort to improve language policies from two official
languages in 1948 to 11 by 1994. The aim was to officially recognise the African
languages that were neglected under the segregation acts. Language in education
has also undergone major reconstruction of recognising all official language as well
as improving the access to these languages on a school level through the LiEP.
Today, it is the aim of the LiEP to give the opportunity for learners to learn in their
home language, but this is not the reality in practice. These innovative language
policies have been implemented in the education system for a total of 22 years.
Table 3.3: Summary of the Educational landscape from Apartheid to Post-Apartheid
Apartheid South Africa post 1994
Official Languages 2 11
School enrolment
criteria
Racial According to Educational
requirements and residing
area.
School Language
Policy
Province Administration and the
Native administration the school
fell under.
School Governing Body
School Legislation Native Education Act,
White Education Act,
South African Schools Act
1996
Language of
Instruction
Bantu Education:
Grades 1-3: African Language
Grade 4-12: Afrikaans and
English
White Education:
Grade 1-12 Afrikaans or English
LiEP:
Grades 1-3: Home Language
Grades 4-12: Afrikaans or
English
Table 3.3 (above) shows the change in educational landscape under apartheid and
the new South Africa. In summary, the current education system is more inclusive
and follows a centralised curriculum, achieved through a centralised non-racial
approach, language in education policy, school admissions procedures as well as
governance in the schools.

39
3.4 LANGUAGE IN EDUCATION POLICY
The LiEP was introduced under the interim constitution of 1996, the aim being to
address the issues of language in learning and teaching in education by providing
a centralised document to which all public schools were expected to adhere. The
LiEP stated that learners from Grades 1 to 3 should be provided in every way
possible with an opportunity to be taught in their home language (RSA, 1996). The
forthcoming Grade 4 to 12 learners should then change their LoLT to English to help
promote multilingualism in classrooms and maintain respect for all official languages
(RSA, 1996). This section will address the debate around the LiEP, to evaluate
whether the goal of the policy has been achieved.
3.4.1 Home Language Teaching
Home language teaching and learning is a sound policy initiated for development of
African languages, which are underdeveloped in the areas of standardisation,
terminology and literature (Edwards & Ngwaru, 2011). Granville et al. (2010) argue
that all learners should be at least taught one African language throughout all their
schooling years and that the already qualified educators who can teach in one or
more should start doing so, with newly qualified educators obtaining an African
language as part of their qualification and training (Granville, 2010). The
development and the insistence of African languages can be understood as an
approach to balance the access to official languages and to bridge the gap created
by discriminating policies.
These motives are in line with the constitutional objective of living in a multilingual
society and, as Pretorius (2014) argues, learning to read in HL builds strong literacy
skills. Similarly, Cummins (2001) is in favour of it playing a fundamental role in a
learner’s development in reading proficiency skills and supplementary skills in a
second language. This judgement is based on a common framework for language
proficiency by Cummins (2008), known as cognitive academic language proficiency
(CALP). The CALP looks at a learner’s ability to understand and express in oral and
written modes, describing language proficiency as the ability to understand, express
concepts and ideas that are relevant to success in schools (Cummins, 2008).
According to CALP, language proficiency develops through social context in the
interaction of schooling (Cummins, 2008), implying that language proficiency also
means the extent to which a learner has access to and command of the oral and

40
written academic context. The CALP model findings were relevant to a
bi/multilingual learner, so theoretically if a learner masters the language proficiency
skills in the home language it provides necessary cognitive skills to tackle an
additional one.
In summary, the LiEP is a practical policy for two major reasons. Firstly, the
development of African languages should be instilled in the curriculum through
compulsory offering of African languages as HL or FAL in all 12 years of schooling.
Further, learners should have the right to choose any of the 11 official languages as
LoLT (Granville et al., 2010). Secondly, the authors based their promotion of the
LiEP on justifying the need to grasp literacy proficiency and cognitive skill in home
language first. This argument translates into having the foundation skills to learn a
second language. Authors such as Pretorius (2014) and Cummins (2001, 2008)
acknowledge the importance of mastering early literacy skills by learning to read in
the home language. Therefore, learning a second language would be easier
because of the foundational skills developed.
3.4.2 The Debates around the LiEP Policy
In practice, the LiEP has its implementation challenges and there are authors who
oppose the idea of multilingual education. Scholars such as Mncwango and Moyo
(2000) argue that it intends to have justified goals but has been incorrectly
implemented, and the foundation of multilingualism starts at school level
(Mncwango, 2012). The authors believe that schools are good agencies to rebuild
the nation. Furthermore, schools can be utilised as tools to promote multilingualism
and diversity in the country but the groundwork implementation and practise of the
LiEP does not enhance its proposed goal. Pretorius (2014) raises a practical issue
in that the LoLT changes to mostly English in the intermediate phase, and learners
tend to struggle in Grade 4 with LoLT transition. During the foundation phase,
learners are in the process of developing literacy skills in their HL, but are introduced
to a second language for the first time at Grade 4. Consequently, teachers have to
catch up in Grade 4 and are mostly confronted with learners who have
underdeveloped skills in English.
Another factor that counts negatively towards the LiEP is that parents prefer their
children to be taught in English (Heugh, 1996). According to Tshotsho (2013),
41
parents are reluctant for their children to be taught in an African language because
they are not convinced of the future benefits of home language education. English
is used in business and workplace and is the language used mostly for tertiary
education. A decrease in the demand of multilingual education from parents and
lack of impracticality of home language also result in authors such as Probyn (2009)
and Kamwangamalu (2010) concluding that parents are more willing to enrol their
children in schools that teach in English.
The lack of standardisation of African languages has resulted in limited reading
material, books and terminology. One of the claims that Tshotsho (2013) makes is
that the Department of Education had inadequately developed programmes and
teaching materials to teach in HL. The former Model C schools are then
unenthusiastic to accommodate increasing numbers of African learners in their
classrooms (Probyn, 2009) and argue that the lack of trained teachers and
resources are the main factors prohibiting them from providing African languages
as the LoLT (Mncwango, 2012). To effectively promote multilingual education will
be more expensive than the single option of English (Mncwango, 2012). The last
point made by Heugh (2006) is that it is very difficult to allocate a home language to
South African children as they live in a multicultural and integrated society with more
than one HL. Instead of enforcing the idea of one African language per learner it
centralises the LoLT as English and offers numerous African languages as first or
second additional ones.
In brief, the arguments for authors against the practise of the LiEP can be
summarised as three main factors. Firstly, the implementation has had a greater
impact on the learners’ reading proficiency, even in a second language. Secondly,
parents prefer their children to be taught in English as it is associated with access
to the world of employment, status and power (Banda, 2004). Thirdly, there is a lack
of resources to be able to provide LoLT in African language effectively.
Overall the LiEP is a suitable policy which addresses the needs of the country
(Granville et al., 2010). On the one hand, HL teaching and learning has the ability
to increase learners’ reading proficiency (Cummins, 2001) and it promotes a
multilingual society that respects cultures and ethnicities. On the other hand, the
practicality of the policy remains a challenge. The lack of teacher training and

42
resources has impacted negatively on the implementation of the LiEP (Tshotsho,
2013). Parents prefer their children to receive an English education rather than an
African one for future opportunities.
3.5 REVISED NATIONAL CURRICULUM STATEMENT
The Department of Basic Education (DBE) has clearly outlined the objectives and
aims of the education curriculum, one of the main ones being to provide fair and
equal education across all races, cultures and languages (DBE, 2010) with
standards and requirements for HL subjects the same across all languages. One of
the first curricula to be implemented in the post-1994 South Africa is Curriculum
2005, an education model based on the principles of outcomes based education
(OBE) (Jansen & Taylor, 2003) and aimed at providing a framework for
development of an alternative system to the apartheid education system (Chisholm,
2003). The curriculum focused on learner-centred education which positioned the
educator as a facilitator. Furthermore, it emphasised results and success on the
outcomes and the achievement through different paces rather than a subject-bound
curriculum (Jansen & Taylor, 2003). The curriculum was open and relied on
educators creating their own learning programmes and materials (DBE, 1997). As
with any curriculum, it had its own success and challenges. In a curriculum review
committee report (2000) implementation of the curriculum has been confounded by:
Lack of alignment between curriculum and assessment policy
Inadequate orientation, training and development of teachers
Variability of quality of learning support materials, often unavailable and not
sufficiently used in classrooms
Policy overload and limited transfer of learning into classrooms
Shortages of personnel and resources to implement and support C2005
Inadequate recognition of curriculum as the core business of education
departments (Chisholm, 2003).
The Curriculum Review Committee therefore recommended a reformed curriculum
that would address the misfits of Curriculum 2005. In 2001, the new National
Curriculum Statement (NCS) was introduced, its fundamental design being to
specify the knowledge content more clearly (Jansen & Taylor, 2003). For that
reason, the NCS presented smaller learning areas, a reintroduction of history and

43
most importantly promotion of the values of the Constitution (Chisholm, 2003). The
second phase of the NCS was applied in 2006, as the Revised National Curriculum
Statement (RNCS), adding the learning outcomes and assessment standards that
were designed from critical and development outcomes (DOE, 2003) and
emphasised learner-centred and activity-based education. In 2008, the Curriculum
Review Committee reported on the RNCS and found four main concerns:
Complaints about the implementation of the NCS
Teachers being overburdened with administration
Different interpretations of the curriculum requirements
Underperformance of learners (Du Plessis, 2013).
For the above reasons the curriculum underwent further revisions and new features
were included or replaced in the new Curriculum Assessment Policy Statement
(CAPS), with the following aspects addressed:
CAPS Foundation Phase instructional time increased
Mathematics to be called ‘numeracy’ and Language referred to as ‘literacy’
First Additional Language is added to the Foundation Phase
Intermediate Phase learning areas decreased from eight to six subjects
Senior Phase School-Based Assessment to count for 40% and the year-end
examination 60%
Further Education and Training Phase content reorganised for several of the
subjects and the exam structure changed in some of the subjects
All Grades use a 7-point scale
Learning outcomes and assessment standards removed and called ‘topics
and skills’
Learning area and learning programmes called ‘subjects’
CAPS given a week-by-week teaching plan
The curriculum statements and learning programmes guidelines replaced by
one document, CAPS (Du Plessis, 2013).
Following the NCS, another wave of curriculum change happened in the form of the
Revised National Curriculum Statement (RNCS), with provision for all 11 official
languages as home language (HL), first additional language (FAL) and second

44
additional languages (SAL). Access to language teaching in schools is available in
all 11 official languages and can be offered as HL, FAL or SAL. Furthermore, the
curriculum stated that learners in foundation phase (Grades R to 3) should be taught
in HL as recommended by the LiEP (DoE, 2003). The language curriculum in the
RNCS made provision for promoting multilingualism in the classrooms by all
learners being offered an additional language. The HL assessment standards stated
that learners should be able to understand and speak the language. The curriculum
supported the development of this competence with regard to numerous types of
literacy, namely reading, writing, visual and critical literacies. The first additional
language guidelines acknowledged that learners did not necessarily have any
knowledge of the language when they came to school (DoE, 2003) and the
curriculum started by developing learners’ ability to understand and speak the
language. Learners would be able to transfer the literacies acquired in their HL to
their first additional language with support for those learners who would use their
first additional language as one of learning and teaching in Grade 4.
The SAL was planned for learners who wished to learn three languages and the
third language might be official or foreign. The Assessment Standards ensured that
learners would be able to use the language for general communicative purposes.
Less time would be allocated to learning the SAL than to the HL or first additional
language (DoE, 2003).
The reading curriculum for Grade 4 summarised the outcomes in four main
categories:
Reading and viewing:
Listening and Speaking
Language usages and Structure
Writing and Presenting (DBE, 2012. p 14).
For the target population of this study the Grade 4 reading curriculum specified that
‘reading and viewing’ outcomes are achieved when the learner is able to understand
in a simple way some elements of stories and understand in a simple way some
elements of poetry on social issues (DoE, 2003).
In Grade 4, the assessment standards were as follows:
45
Read a variety of texts for different purposes using variety of reading and
comprehension strategies
View and comment on various visuals texts
Describe their feelings about texts giving reasons
Discuss how the choice of language and graphical features influence the
reader
Identify and discuss aspects such as central idea, character, setting and plot
in fiction texts
Infer reasons for the actions in a story
Recognise the different structures, language use, purpose and audiences of
different types of texts
Identify and discuss values in texts in relation to cultural, moral, social and
environmental issues
Understand and respond appropriately to information texts
Interpret simple visual texts
Select information texts for own information needs (DoE, 2002, pp. 72 -77).
In light of the curriculum, prePIRLS 2011 focused on written assessment as the
purpose for reading and the processes of comprehension (Howie et al., 2012). The
purposes for reading were divided into: 1) reading for literary purposes, and: 2)
reading for the use and acquisition of information. Each of the reading purposes
comprised 50% off the assessment (Mullis et al., 2012). In assessing the processes
of comprehension, the learner was required to:
focus on and retrieve explicitly stated information
make straightforward inferences
interpret and integrate ideas and information
examine and evaluate content, language and textual elements (Howie et al.,
2012. P.11).
The assessment standards and objectives of prePIRLS 2011 corresponded with the
RNCS standards implemented at the time when the study was conducted. The
outcomes and objectives of prePIRLS 2011 were those the learners in South Africa
were expected to be able to achieve. Subsequently, this also meant that with

46
regards to curriculum content expectation the RNCS is on par with international
demands and standards.
3.6 READING LITERACY
Literacy can be defined as the ability to read and write and according, to Perry
(2012), literacy focuses on particular skills such as phonemic awareness, fluency
and comprehension (Perry, 2012). Literacy can be used for recreation and personal
growth, while providing young children with the ability to participate more
extensively in their communities and societies (Mullis et al., 2012). It can also be
defined as a symphony of words put together to convey a message or a meaning.
Part of literacy is also to comprehend and to show understanding of words and to
engage in the process of reading (Perry, 2012). As a concept it is broad and has
several meanings and relates to different views. With multicultural education, the
growth of the use of technology in teaching the expansion of texts is no longer just
on paper (O’Byrne & Smith, 2015) as a recent term ‘multi-literacies’ has been used
to describe and include various forms of literacy, notably in text, visuals, digital and
other formats.
Reading literacy refers to the ability to understand and use written language forms
by society in which readers can construct meaning from different types of text (Mullis
et al., 2012). PrePIRLS 2011 defines reading literacy as a constructive and
interactive process, consequently the meaning is constructed in the interaction
between reader and text in the context of particular reading experiences (Mullis,
Martin, Kennedy, Trong & Sainsbury, 2009. p.11). In a classroom environment
reading literacy is often assessed to determine the learners’ abilities to understand
and construct meaning. Early literacy development provides them with the ability to
develop reading proficiency from a young age and have an introductory foundation
to reading as a whole (Cummins, 2001).
3.6.1 Early Literacy Development in South African classes
Early literacy development is the foundation of reading proficiency (de Witt et al.,
2008), whilst according to Chall’s (1983) developmental model of reading, reading
has five stages, scaled from 0 as the lowest to 5 as the highest. Pre-reading takes
place in stages 0, 1 and 2, which is the period of ‘learning to read’ and 3, 4 and 5
as the period of ‘reading to learn’ (Chall, 1983). This model posits that up to Grade

47
3, literacy emphasises ‘learning to read’, meaning that learners will begin to acquire
reading fluency using texts (Pretorius, 2014). By the time a learner reaches Grade
4 he or she is in the third stage of ‘reading to learn’, and required to apply reading
skills (Willenberg, 2005). The model is closely related to CALP by Cummins (2001),
with factors in the South African context that do not ensure effective early literacy
development in classrooms. Firstly, African learners undergo a language transition
from Grades 3 to Grade 4 (Howie et al., 2012). As Pretorius (2014) highlights, the
issues that learners are being taught in their home language until Grade 3 and from
Grade 4 are introduced to a new language of learning. The African learners in Grade
4 are expected to ‘read to learn’ with their second language.
Secondly, ‘code switching’ is being practiced in South African classrooms, when
teachers and learners share a common home language that is used for teaching
and learning (Probyn, 2009), while the LoLT is English. Code switching is generally
not accepted as a classroom strategy or methodology (Probyn, 2001), but teachers
use it as a linguistic resource in a responsive way to achieve a range of cognitive
and effective teaching and learning goals. On the other hand, learners are not
adequately exposed to the English LoLT as stipulated in the curriculum instruction,
therefore, African learners find themselves in the ‘learning to read’ phase in their
home language but struggle with ‘reading to learn’ in English (Pretorius, 2014).
3.7 ASSESSMENT IN LITERACY
‘Assessment’ is a broad concept and authors have their individual opinions of
interpreting the term. The purpose of this particular study is to examine assessment
in education and how the lack of standardisation in African language may serve as
a bias in testing. Assessment is generally defined as the process of evaluating the
content knowledge, skills and acquired information a learner has obtained in a
specific subject. According to Walvoord (2004), it is a systematic data collection of
information about learners whilst for Palomba et al. (1999) it has as a purpose the
improvement of learning and development. The term is driven by the questions that
seek to answer what learners should know in the process ascertaining through data
collection whether they have acquired skills, content and habits of mind that will
make them successful (Dwyer, 2008).

48
Assessment is a term generically used to describe quizzes, tests, surveys and
exams (Sheperd & Godwin, 2004). Considering the above authors’ perspectives
one can then define it as being focussed on the purpose it aims to achieve and
aligned to a specific subject or learning area. Together with the purpose of the
assessment and the subject content, a form needs to be articulated in a way that
will enhance learning. For instance, assessment of reading literacy is regularly
administered by standardised tests which can assist in interpreting learners’ reading
achievements (Sattarpour & Ajideh, 2014). Reading literacy assessment has a
specific focus, which in prePIRLS 2011 was on early childhood reading for literary
experience, to acquire and use information (Mullis et al., 2008). The goal of the
foundation phase is to support learners as soon as possible and use the appropriate
assessment instruments.
3.7.1 Comparative studies
South Africa participates in a number of national and international assessment
programmes to track learner performance across grades. National evaluation
results are often used for making important decisions that will impact learners,
educators, communities, administrators, schools and districts (Au, 2007).
International assessments enable countries to monitor their curriculum standards
and goals on a global scale. Equally important is the indication of performance that
national and international assessments can provide (Kamens & McNeely, 2010).
In 2010, the Department of Basic Education introduced a systemic evaluation called
the Annual National Assessment (ANA) to monitor numeracy and literacy in Grades
1, 2, 3, 6 and 9. The purpose was to highlight the areas in numeracy, literacy
knowledge and skills, but the results reflected that learners participating were
inadequately equipped (DBE, 2012). The key weakness areas were summarised
into a few categories:
Many learners cannot read with comprehension
Many learners are not able to produce meaningful written outputs
Learners lack the ability to make correct inferences from the given
information in a text
Learners’ knowledge of grammar is very limited
Learners struggle to spell frequently used words correctly

49
Handwriting, particularly in the Foundation Phase, leaves much to be desired
in many cases (DBE, 2013).
The learners who participated in the Foundation Phase were assessed in their home
language. The performances in the 11 home languages that are offered in schools
are as follows:
Table 3.4: Overall performance of the foundation phase learners in the ANA 2012 (DBE, 2013)
HOME
LANGUAGE
GRADE 1 GRADE 2 GRADE 3
Afrikaans 63,5 61,6 60,5
English 62,4 58,9 53,9
IsiNdebele 51,5 54,9 46,5
IsiXhosa 54,3 52,3 49,9
IsiZulu 56,3 56,7 53,1
Sepedi 52,5 51,7 46,6
Setswana 51,2 45,0 44,3
SiSwati 54,3 55,6 48,0
Sotho 57,6 54,6 54,0
Tshivenda 58,8 56,1 49,4
Xitsonga 58,0 54,7 49,1
As presented in table 3.4, the problem seems to be at Grade 3, as most African
languages did not achieve above 50%. Afrikaans and English achieved the highest
average marks across all three grades.
The Southern and Eastern African Consortium for Monitoring Educational Quality
(SACMEQ) showed trends in reading levels and mathematic achievements for
Grade 6 learners (SACMEQ, 2007), emphasising that the planning of improvements
in the quality of education required better indicators of literacy and numeracy skills.
The indicators allow decision-makers to assess the performance of school systems
and to provide information that could be used for strategies aimed at improving the
quality of education. The SACMEQ assessments were placed on a single scale with
the anchor as a mean score of 500 and a standard deviation of 100 (SACMEQ,

50
2007). South Africa first joined the study in 2000 SACMEQ II; then the 2007 SAMEQ
III study.
Table 3.5: Levels and Trends in Learner achievements across Regions in South Africa (SACMEQ, 2007)
Province 2000 Literacy Levels 2007 Literacy
Levels
Eastern Cape 444 448*
Free State 446 481*
Gauteng 576 573
KwaZulu-Natal 517 486**
Mpumalanga 428 474*
Northern Cape 470 506
Limpopo 437 425**
North West 428 506
Western Cape 629 583**
South Africa 492 495
SACMEQ II & II 500 512
*provinces achieved below the 500 mean score point
**provinces that have decreased literacy levels by more than 10 points
Table 3.5 shows the SACMEQ literacy achievement by province in 2000 and in
2007 according to the provinces’ achievements, indicating the overall achievement
scores in South Africa. The overall scores are below the mean score of 500, so in
general the literacy skills for Grade 6 learners in the country are below average. A
total of five provinces achieved below the mean score of 500 at an average of 463
points in the SACMEQ 2007. Scores for KwaZulu-Natal, Limpopo and Western
Cape decreased from 2000 to 2007 by more than 10 points, an indication of
improvement from SACMEQ II to III, but still of concern that many provinces failed
to reach the 500 mean score point.
The Progress in International Reading Literacy Study (PIRLS) is an international
comparative study that aims to measure learner reading literacy proficiency (Mullis
et al., 2012). In South Africa, the assessment was conducted in 11 official languages
in Grade 4 (Howie et al., 2012). As noted in chapter 2, South Africa first participated
in PIRLS 2006, then in PIRLS 2011. Due to poor performance in PIRLS 2006 the
country opted to participate in prePIRLS at a Grade 4 level (Howie et al., 2012). The
prePIRLS was an easier assessment and conducted in all 11 official languages,
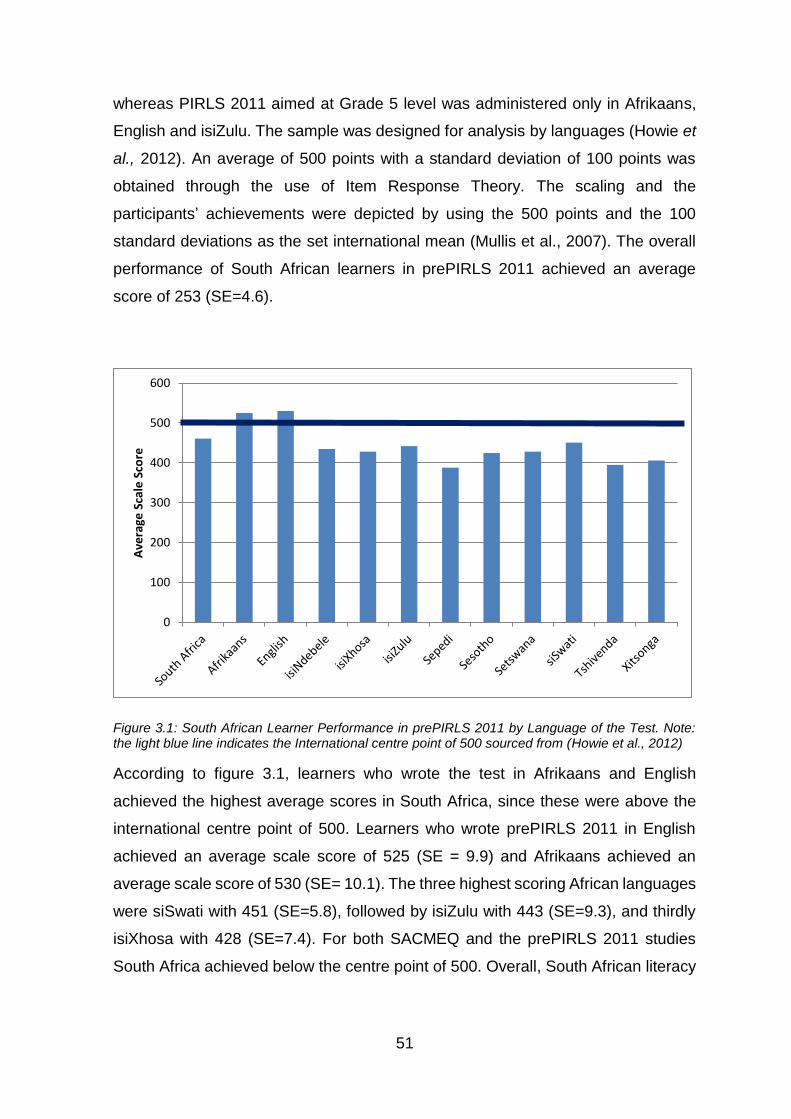
51
whereas PIRLS 2011 aimed at Grade 5 level was administered only in Afrikaans,
English and isiZulu. The sample was designed for analysis by languages (Howie et
al., 2012). An average of 500 points with a standard deviation of 100 points was
obtained through the use of Item Response Theory. The scaling and the
participants’ achievements were depicted by using the 500 points and the 100
standard deviations as the set international mean (Mullis et al., 2007). The overall
performance of South African learners in prePIRLS 2011 achieved an average
score of 253 (SE=4.6).
Figure 3.1: South African Learner Performance in prePIRLS 2011 by Language of the Test. Note: the light blue line indicates the International centre point of 500 sourced from (Howie et al., 2012)
According to figure 3.1, learners who wrote the test in Afrikaans and English
achieved the highest average scores in South Africa, since these were above the
international centre point of 500. Learners who wrote prePIRLS 2011 in English
achieved an average scale score of 525 (SE = 9.9) and Afrikaans achieved an
average scale score of 530 (SE= 10.1). The three highest scoring African languages
were siSwati with 451 (SE=5.8), followed by isiZulu with 443 (SE=9.3), and thirdly
isiXhosa with 428 (SE=7.4). For both SACMEQ and the prePIRLS 2011 studies
South Africa achieved below the centre point of 500. Overall, South African literacy
0
100
200
300
400
500
600
Ave
rage
Sca
le S
core

52
proficiency levels in the foundation phase do not meet the requirements of indicators
set out internationally.
The increased growth in international assessment has posed dynamic challenges
and perhaps raised issues around the subject so it is essential that an international
assessment ensures that the content and scope of items is equitable for all countries
participating. Furthermore, organisations or associations need to establish a
measure, for example, a common scale technique for comparison purposes. There
are several factors that can be taken into account in cross-country assessment.
Firstly, the sampling needs to be randomly assigned and representative, with use
of language appreciating and accommodating all countries participating (Wolf et al.,
2015). Secondly, a common scale needs to be developed, for example, the
prePIRLS 2011 assessment ensured that an international centre point of 500 was
set. Thirdly, a consolidated correct translation procedure should be practised to
ensure standard assessment (Mullis et al., 2012). The authors have emphasised
that cultural sensitivity, deeper understanding and respect for all other cultures are
key concepts in providing valid translation and cross-cultural research. On the issue
of translation, Mason (2005) articulates the idea of translation to strive to achieve
conceptual equivalence, which implies that an item may be translated into different
words but the original meaning remains intact (Mason, 2005). Many scholars
suggest that multiple translators should be used in the process of translation
(Hambleton & Kanjee, 1993; Maneesriwongual & Dixon, 2004, Mason, 2005). To
check equivalence of the assessment they use frequency word counts, instruments
with strong test-retest reliability measure, and a pilot test-retest with bilingual
participants using two versions. A suggestion is also made to conduct workshops
with focus groups strategies to review each item and reach consensus on the best
translation (Beauford et al., 2009).
The translation procedure of the prePIRLS 2011 assessment was from English to
the other ten official languages. The assessment booklets were first given to
professional translators to translate into the assigned language. The second phase
was the back translation, in which a different translator would translate from the
assigned language into English. This phase was to ensure that the meaning of the
translated text remained the same as English (Howie et al., 2012). Thereafter, the
IEA verified the translation by only sending the most spoken languages, namely,

53
Afrikaans, English, isiZulu, isiXhosa, Sepedi, Sesotho and Setswana to
independent translators. This was an additional checkpoint in the study to ensure
truthful translation. Authors such as Hambleton and Kanjee (1993) look at cross-
cultural testing, and summarise translation challenges into: (a) cultural differences;
(b) technical factors; and (c) judgement and empirical design. All three factors
together are sources of invalidity in test translation work. Beauford et al. (2009) also
highlight the need for international test instruments to adhere to cultural
appropriateness and standardisation of African languages.
3.8 LANGUAGE PLANNING
Language planning in South Africa was one of the critical obligations after 1994 to
rebuild national pride and restore the values of diversity, integrity and respect for
cultures and races. Under the interim Constitution of 1996 (Ch. 1 section 6) the
recognition of 11 official languages as opposed to only Afrikaans and English was
legislated for (RSA, 1996). The fundamental aim of this act was to take into account
the oppressive legislation of the apartheid regime that had marginalised the nine
African languages in the country. To implement it in a more practical manner and
looking at positive measures towards growing the status and use of the African
languages, language policies were developed (Yu & Dumisa, 2015). The language
planning has mainly been implemented through four major government
departments: i) Arts, Culture and Heritage; ii) Communication; iii) the Department of
Basic Education and Higher Education and Training; and iv) Justice and
Constitutional Development (RSA, 1996). Additionally, agencies, policies and
bodies were also established to fulfil the responsibility of the act, namely:
Pan South African Language Board (PanSALB)
Language Task Group (LangTag)
Language in Education Policy (LiEP)
The National Language Policy Framework (NLPF)
The Use of Official Languages Act 12 of 2012 (Yu & Dumisa, 2015).
PanSALB was established as a statuary body that would monitor and implement
the use of and status of all official languages, with structured lexicographical units
for each official language that would ensure terminology, standardisation and
promotion of multilingualism (Edwards & Ngwaru, 2011). According to Heugh

54
(2006), most of the terminology work was in fact carried out during apartheid and
remains relevant today. The first people to write up African languages were the
missionaries using their knowledge of orthographies and grammar with the
language speaker providing vocabulary (Alberts & Mollema, 2013). In spite of the
attempts of the missionaries to develop spelling and orthography for African
languages, each missionary used his or her own knowledge of history, genesis,
linguistic and political boundaries, resulting in a number of discrepancies (Poulos &
Msimang, 1998). For example, the same words were spelt differently by different
missionaries.
In 1928, efforts were made to readdress the discrepancies in orthography by the
Union government by appointing an advisory committee on Bantu Studies and
Research to harmonise the orthographies of the African languages, with the Suto-
Pedi-Chuana Sub-Committee for the Sotho languages, Sesotho, Sepedi and
Setswana. However, the difficulties and the representatives from the languages
differed so much that the orthographies from the committee were not accepted
(Alberts, 2013). The Transvaal Department of Education than called a conference
with an aim of reducing the orthographic differences in African languages, resulting
in a Sotho Terminology and Orthography No. 1 published in 1951, then the
Zulu/Xhosa Terminology and Orthography No. 1 in 1957 (Poulos & Msimang, 1998).
Webb (2013) wrote that nothing of real substance had changed since 1996
regarding the political status of the African languages as they were not used
meaningfully in parliament, courts of law, universities, schools or the print media.
Many scholars, such as Cele (2004), Foley (2004), Tshotsho (2013) and Webb
(2013) further criticised the language policies for being too politicised, which had
resulted in poor implementation, failures of which were said to be mainly due to two
factors: 1) difficulties in balancing the interests of all 11 official languages; and 2)
slow linguistic development, which included standardisation and making them
relevant to advancing literature, science and technology.
The standardisation of African languages has become a problem and the emphasis
on the differences between various official languages has masked the
commonalities within Nguni and Sotho clusters (Edwards & Ngwaru, 2011). From

55
the translator’s perspective it is these differences in orthography that make it
challenging to standardise African languages:
If we develop materials in Setswana, you will find that people, say in Kimberley or
areas outside the Hurutsi, look at those material and say: Ah this isn’t proper
Setswana, this isn’t my Setswana this is Hurutsi Setswana”. And it is true of all our
languages-isiXhosa, isiZulu, whatever you would like to mention. There are in some
instances quite significant variations that are considered unacceptable by other
speakers of the same language. (Edwards & Ngwaru, 2011. p 596).
Prinsloo’s (2011) proposal is that it should be the right of the language speakers
rather than those of the language that should capture the true essence of the debate
around African languages in South Africa. Within society are also linguistically
diverse groups, such that language in South Africa is no longer limited to specific
geographical borders, regions, cultures or tribes. In the new democratic classrooms
there are high probabilities of having learners from multiple home languages
(NEEDU, 2012). Through social changes the African languages have evolved,
developed and become different orthographies within one language, leading to
different dialects (Prinsloo, 2011). The dialectisation of African languages serves as
a complicating factor when deciding on which dialect will be seen or used as the
most standardised language in which the learners can be taught (NEEDU, 2012).
3.9 ISIXHOSA LEXICOGRAPHY
As noted above, most development in African languages was after 1910 (Poulos &
Msimang, 1998), with translations, terminology, dictionaries still relevant and useful
in the 21st century. The earliest record of written isiXhosa lexicography dates back
to 1776 through a dictionary titled Appendix to Sparrman (Mtuze, 1992). The author
Andrew Sparrman, a natural scientist, compiled a short isiXhosa dictionary
containing numerals, nouns, adjectives and verbs (Nkomo & Wababa, 2013). For
Pahl (1989), the list of words differs slightly from those used today. A total of 16
isiXhosa lexicography works have been published between the years of 1776 and
2008. Nkomo & Wababa (2013) also found evidence of a relatively long history of
lexicography work for isiXhosa as an African language. Taking into account the
extensive isiXhosa dictionaries published and long history of lexicography, one can
gather that isiXhosa as a language is fairly standardised. To an extent the
lexicography has addressed mistranslations in the previous works, such as the

56
Kafir-English Dictionary (KED) 1899/1915 (Nkomo & Wababa, 2013). The focus of
the particular lexicography was to look at the mistranslation of cultural terms in the
KED (Moropa & Kruger, 2000). It is evident that much work has been carried out in
the past with regards to isiXhosa lexicography (Nkomo & Wababa, 2013).
The question posed by Nkomo & Wabab (2013) is whether current dictionaries could
be updated to suit the more complex dialects and meet the current lexicographic
needs amongst isiXhosa speaking communities. There are several isiXhosa
speaking communities in South Africa, grouped according to tribes such as Bhaca,
Mpondo, Hlubi, Gcaleka, Ngqika, Thembu, Mfengu, Mpondomise, Xesibe, Cele,
Ndlambe and Ntlangwini. The different communities also associate with specific
dialects of isiXhosa (Nyamenda, 1994), spoken predominantly in the Cape
Provinces, but with dialect variations particularly distinctive in the former
homelands, Transkei and Ciskei. The first missionary to settle amongst the Xhosa
people was Theodorus van der Kemp, from the London Missionary society in 1799
with Chief Nqgika and his people along the Tyume River (Nyamenda, 1994). In this
way, the Ngqika dialect was learnt and written down, with the bible translated and
the language taught in school by the missionaries who succeeded van der Kemp.
The pioneering processes lead the Ngqika dialect to be seen today as the ultimate
standardised isiXhosa language, sharing many similarities with the Ndlambe and
Thembu dialect. With the further writing up of the language, isiXhosa included not
only the Ngqika but also the Ndlambe and Thembu dialects (Nyamenda, 1994).
The other dialects spoken in the regions of the Mpondo, Bhaca, Hlubi, Mpondomise,
Xesibe, Cele and Ntlangwini were regarded as independent languages of the Xhosa
cluster. The Ngqika, Thembu and Ndlambe dialects are recognised as official
written and taught isiXhosa and enjoy higher status among Xhosa speakers than
the other dialects. According to Gxilishe (1996), the question is whether or not to
use the learners’ non-standard dialects in the classroom. The author explains that
the two strong arguments for using one standard dialect in classrooms would on
one hand be that it may be a useful bridge to the standard language. On the other
hand, the use of home language has shown to be to the satisfaction of many,
beneficial in promoting the child’s self-image and sense of belonging (Gxilishe,
1996). The relationship between dialect and language is often seen as exclusive
rather than inclusive.

57
If by implication a language is a sum of many of its dialects, the general assumption
is that some dialects are not the ‘proper language’ or are even unscientific (Mesthrie,
1998). Lodge (1995) address the issue of dialect and standard language as follows:
Figure 3.2: Adapted from Lodge, RA. (1995). French: from dialect to standard. London: Routledge.
Looking at figure 3.2, the standard language is simply a dialect along with all the
others. Everybody speaks a dialect, even if it is the standard language. If one would
have to reconstruct the figure to present what authors such as Gxilishe (1996) and
Nyamende (1994) understand around the issues of isiXhosa dialects, the figure
would be represented as follows:
Ngqika
Mpondo
Hlubi
Bhaca
isiXhosa
Thembu
Language
Dialects

58
Figure 3.3: A reconstructed figure from dialects issues of isiXhosa by Gxilishe (1996) and Nyamende (1994).
Figure 3.3 demonstrates the current isiXhosa language issue and how only a few
isiXhosa dialects are seen and recognised as standardised isiXhosa, whereas there
are other dialects which form part of the isiXhosa language but that have been
regarded as unofficial, non-standard or even not “proper” isiXhosa. Another
illustration of how these dialects can be of disadvantage to a learner in a classroom
environment due to translations, terminology and vocabulary of words (Nyamenda,
1994) can be presented as follows:
Example 1:
Bhaca dialect:
isiXhosa Bhaca
Ukhuko – mat isicamba - mat
Umvumndla – hare unoqwaja- hare
Ukuthetha – to speak ukubhobha- to speak
(Nyamenda, 1994:205).
Example 1 shows how words in isiXhosa and the Bhaca dialect are completely
different in conveying the same meaning. By implication, a learner who completes
a paper in isiXhosa, but whose home language is Bhaca, may be confused and
unable to conceptualise the meaning of the low frequency words as presented in
the example above.
Example 2:
Mpondo:
isiXhosa Mpondo
Ndiyahamba – I am going Ndriyahamba – I am going
Indoda endala – an old man indroda endrala – an old man

59
Intombi – a girl intrombi – a girl
Umntu – a person umntru-a person
Inkwenkwe – a boy inkrwenkrwe – a boy
(Nyamende, 1992:205).
Example 2 indicates the different spelling used for word in isiXhosa and the Mpondo
dialect. Predominantly, the difference in spelling is in the prefix or the suffix which
in African languages will show the pronoun of a word. Consequently, the different
spelling has an impact on the meaning or the interpretation the learner might have.
Example 3:
Hlubi:
isiXhosa Hlubi
olu dongwe – this clay eli dongwe – this clay
unyawo lwam – my foot inyawo lam – my foot
ebuhlanti – in the kraal ekuhlanti – the kraal
ebusuku – at night ekesuku – at night
inqconqoni – mosquito umniyane – mosquito
umngxuma – a hole isigodi – a hole
(Nyamende, 1994:205).
Example 3 shows that the Hlubi dialect differs in the first person prefix and has
different vocabulary for some words from isiXhosa. Consequently, the different
vocabulary and prefix can mislead a learner in understanding a meaning of a word.
Agreeing with Nyamende (1994), little has been published in the different isiXhosa
dialects. On one side, the standard isiXhosa is generally associated with those that
are educated and have had a Christian teaching, whilst on the other side are the
numerous dialects which have been neglected in the country, associated with
narrow-mindedness, ignorance and backwardness amongst Xhosa people

60
(Nyamenda, 1994). Indirectly, by standardising a dialect over others has also
created the mind-set of inferiority and superiority amongst people, who are from the
same ancestors, cultural and historical background (Nyamenda, 1994). One dialect
is recognised as the official language therefore it is used in educational curriculum
across different people with their own dialects.
The aim of this study is to investigate possible bias in using an international study
prePIRLS 2011 passage which was translated from English into isiXhosa
administered across in all Xhosa regions regardless of dialect differences. The
translation of the instrument may have contributed towards bias in testing, where
the isiXhosa learners could have experienced challenges in answering and
understanding the passages due to translation issues. Evidently, this could have
contributed to the achievement of the learners. Home language learning and
teaching serves as a strong foundation to learning how to read (Cummins, 2001,
Pretorius, 2014 & Probyn, 2001), however, in contrast to the HL learning and
teaching theory is the low achievement in reading literacy assessments of the
African languages in comparison to English and Afrikaans, in national as well as
international studies.
3.10 CONCEPTUAL FRAMEWORK
The identified conceptual framework for this study is the curriculum process
framework, designed by the IEA in 2005 (Mullis et al., 2007). It links the key role
components in an educational system with regards to evaluating an education
system (OECD, 2005).

61
Antecedents Context Curriculum
Inputs
Process
Outputs
Figure 3.4: Curriculum Process (OECD, 2005)
The framework links the inputs, process and outputs on an antecedent, context and
curriculum level. Antecedents refer to socio-economic factors, such as the country’s
economy, the school’s management and the background of the learner. The context
in this framework refers to the structure education system according to the OECD
and the operation of the schools in different countries (OCED, 2005). The curriculum
refers to the goals of the curriculum, how it is implemented in schools and what are
its outcomes (OCED, 2005).
For the purpose of the study, the focus is on the Intended curriculum, implemented
curriculum and attained curriculum. The following is the adapted conceptual
framework:
Antecedents Context Curriculum
Intended Curriculum
Educational System
Country Circumstances
Classroom Conditions School
Implemented Curriculum
Attained Curriculum
LearnerCharacteristics of the learner

62
LiEP
PrePIRLS 2011
Assessment
Achievement
Scores
Figure 3.5: Conceptual Framework adapted from OECD, 2005
The intended curriculum in the study refers to what is intended by the education
system by means of the LiEP, the educational policy implemented at the time the
prePIRLS 2011 was conducted. The LiEP includes the objectives of the reading
curricula and indicates that all 11 official languages are available for learners to be
taught in from Grades 1 to 3. Additionally, learners should be provided with the
opportunity to be taught in their home language as much as possible. In Grade 4
the curriculum instructs that learners should make the transition to being taught
English as a home language and as LoLT.
The implemented curriculum refers to the prePIRLS 2011 assessment results as a
gauge of what has been achieved by the intended curriculum. The prePIRLS 2011
assessment was designed to assess learners in all 11 official languages as per
intended curriculum guidelines in the Foundation Phase to measure the reading
literacy in the HL in which learners were taught over three years. As a result, the
prePIRLS 2011 assessment is measuring the implementation of the LiEP. The
assessment instruments were developed in English then translated into the 10 other
official languages.
The attained curriculum refers to the prePIRLS 2011 learners’ achievement scores.
For purposes of the current analyses, the achievement scores will be analysed by
means of differential item functioning (DIF). This particular analysis will predict any
Intended Curriculum
Educational System
Country Circumstances
Classroom Conditions School
Implemented Curriculum
Attained Curriculum
LearnerCharacteristics of the learner

63
item bias between languages for the same passage, suggesting items that are
biased against a specific language sub-group. The study anticipates explaining
such item bias as a result of the prePIRLS 2011 translations.
The conceptual framework (figure 3.5) is able to elaborate the process thinking of
this study. The LiEP has its intended curriculum objectives, which the prePIRLS
2011 assessment is used to measure the implementation of the policy. The
achievement scores reflect what the attained curriculum achieved.
3.11 CONCLUSION
The education landscape in South Africa has changed to promote a multilingual
system. The shift from only two official languages to 11 is an attempt to redress
language inequalities of the past and parent influences which school language
children will be taught in through a uniform schools act. The introduction to the LiEP
has given learners an opportunity to be taught in their home language from Grades
1 to 3. Generally, the LiEP has positive objectives that aimed to uplift the values of
the Constitution, however, it has been shown to have challenges that prohibit
success. It is fundamental that international studies ensure strict technical
guidelines for the translation of assessment instruments. Studies, such as the
prePIRLS 2011, put in place strict guidelines for translation procedures and several
check points to ensure that content of the assessment is not lost. South Africa has
made efforts to develop African languages since 1994. Although there is a lack of
education materials that can enhance the implementation of the LiEP, researchers
make a point that it is under-standardisation of the African languages that continue
to be a challenge for African books being published. It is evident that the issue of
dialects within African languages is one of the contributory factors amongst
translators and writers.

64
CHAPTER 4: RESEARCH DESIGN AND METHODOLOGY
4.1 INTRODUCTION
The prePIRLS 2011 research methodology was addressed in chapter 2. For the
purpose of this particular study, a quantitative secondary analysis was considered
the most appropriate research method. Quantitative method is a process that is
systematic and objective and consists of numerical data (Maree, 2013), following
experimental and non-experimental designs (Creswell, 2008). The nature of the
study is a quantitative secondary analysis making use of a non-experimental design.
Secondary analysis can be defined as second-hand analysis (McCaston, 2005) and
can also be seen as a research design that is collected for a purpose different from
the primary research (Sørensen et al., 1996). This study made use of existing data
gathered for the purpose of prePIRLS 2011, to explore evidence of differential item
functioning in the data gathered for the English and isiXhosa passages by means
of a quantitative secondary analysis.
This chapter will discuss the research methodology relevant to this study and
describe the sample size for this particular study and a discussion about the
assessment instruments which include the passages and items. It includes how the
data analysis was completed to answer each research question and will address
validity and reliability of the data used as well as the translations procedures.
4.2 SAMPLE FOR THE CURRENT STUDY
The sampling required by the prePIRLS 2011 study was a target population of
learners representing at least four years of schooling. In South Africa this meant
Grade 4 learners, with a required sample of at least 150 schools (Mullis et al., 2009).
A three-stage stratified cluster sampling design was used in the prePIRLS 2011
(Joncas & Foy, 2010). The schools were sampled at first stage, followed by a
second stage of sampling of classrooms and a third stage of sampling of all learners
in intact classrooms that were selected for participation (Joncas & Foy, 2011). In
South Africa’s case, schools were sampled according to language of instruction and
school status. This sample refers to the language of learning and teaching of

65
schools in the first three schooling years. An intended number of 345 schools were
sampled for prePIRLS 2011 although only 341 participated (Howie et al., 2012). The
difference in intended and actual sampling was due to schools that no longer existed
or that refused to participate.
The total number of learners who participated in the prePIRLS 2011 was 15,744, of
whom 2,205 were tested in English and 1,090 in isiXhosa. For the aim of this study
the sample size of 819 was included, comprising 539 learners who completed the
selected passage in English and 279 learners who completed the selected reading
passage in isiXhosa. Not every learner who participated in prePIRLS 2011
completed every passages. The matrix design as discussed in chapters 2 was a
method used to assign passages to the booklets.
4.3 ASSESSMENT INSTRUMENTS
The reading assessment instrument comprised Grade 4 level fictional (literary)
stories and non-fictional (informational) stories. The purpose of reading and the
processes of comprehension formed the basis of the reading assessment. Learners
had to engage in a wide range of strategies including retrieving and focusing on
specific ideas, making simple and more complex inferences and examining and
evaluating texts. The item types in these test booklets were comprised of multiple
choice as well as free response questions (Howie et al., 2012). The mark allocation
of a multiple choice item was one and the maximum mark for a constructed
response item was three
For the purpose of this study, the focus is on “The Lonely Giraffe”, a literary passage
with a total of six free response questions and nine multiple choice questions. The
passage is a story about a group of animals in a bushveld setting and how a lonely
giraffe acts as a rescuer during a crisis to secure his place among the other animals
(van Staden & Howie, 2014). The passage appears in test booklets three, four and
twelve. Table 4.1 summarises the items for the passages:

66
Table 4.1: Item summary for ‘‘The Lonely Giraffe’’ and processes of comprehension. Adapted from Mullis et al.,
2012
Item Item format Maxi-
mum
score
Process of comprehension
1 Constructed response 1 Focus on and retrieve explicitly stated information
2 Multiple choice question 1 Focus on and retrieve explicitly stated information
3 Constructed response 1 Focus on and retrieve explicitly stated information
4 Multiple choice question 1 Focus on and retrieve explicitly stated information
5 Multiple choice question 1 Focus on and retrieve explicitly stated information
6 Multiple choice question 1 Making straightforward inference
7 Multiple choice question 1 Making straightforward inference
8 4Not administered
9 Multiple choice question 1 Focus on and retrieve explicitly stated information
10 Multiple choice question 1 Making straightforward inference
11 Constructed response 1 Making straightforward inference
12 Multiple choice question 1 Focus on and retrieve explicitly stated information
13 Constructed response 1 Examine and evaluate content, language and textual elements
14 Constructed response 1 Focus on and retrieve explicitly stated information
15 Constructed response 1 Interpret and integrate ideas and information
4.4 DATA ANALYSIS
This study aims to investigate how assessment instruments developed for an
English population and then translated in African languages creates item bias.
The main research question that guided this research is:
What is the difference in reading achievement between the English and
isiXhosa Grade 4 prePIRLS 2011 passage “The Lonely Giraffe”?
For the purpose of answering the main question, descriptive statistics were used to
identify and report differences in reading literacy achievement between English and
isiXhosa responses. An overall performance of the passage between the two
language sub-groups will be presented. The IEA’s International Database Analyser
(IDB Analyser) software was used to report the descriptive statistics. IDB is a plug-
4 Item 8 * not administered due to translation
67
in for the Statistical Package for the Social Sciences (SPSS) which was developed
by the IEA (van Staden & Howie, 2014). The IDB Analyser was developed to
combine and analyse data from large scale data sets such as PIRLS, in full (TIMSS)
and in full (SITES).
Sub-question 1:
To what extent are the differences explained by providing evidence of bias
in Differential Item Functioning (DIF) can be found between English and
isiXhosa Grade 4 prePIRLS 2011 response to a reading passage “The
Lonely Giraffe”?.
In order to answer sub-question 1, Rasch Item Response Theory (IRT) was used to
analyse the secondary data from prePIRLS 2011. IRT works as a one-parameter
model that measures learners’ probability to answer a test item correctly (Smit,
2004). The probability of a learner being able to answer a test item depends on the
item bias. The aim of the analyses would be to establish whether the item functions
differently for learners of different abilities. According to Smit (2004), item bias is
associated with differential item functioning (DIF), that is, the level of difficulty of a
test item depends on some characteristics of a group (Cambridge, 1998). DIF is
used when individuals of different backgrounds are tested and has an assumption
that individuals have the same proficiency but different probabilities to answer the
question correctly (Garmerman & Goncaluas & Siares, 2011). In this particular study
the probability of answering the question correctly was dependent on the English
and isiXhosa group differences, therefore differences in language. According to
Gierl and Khaliq (2001), language differences can be associated with different
probabilities of a learners answering an item correctly. RUMM2030 software was
used to analyse the data.
The first analysis conducted is an overall DIF analysis summary of “The Lonely
Giraffe” passage, displaying a person factor ANOVA of the 14 items, and the
measurement of the main effect, meaning the effect of the independent variable (in
this case the language sub-groups) on a dependent variable (the achievement
scores). The second analysis used to answer sub-question 1 is an overall item
summary presented in an item mapping graph to point out the distribution of the
learners’ scores to the item location. This item map provides information on which

68
items were too easy, too difficult or moderate by considering the persons plotting
for each item location. The last analysis that to be used is the item by item DIF by
means of an item characteristic curve graph, which shows the relationship between
the value a person of a given location estimate is expected to obtain on that item.
Based on the outcomes of the evidence of bias, the hypothesis is that there will be
differences in the item responses from the English and isiXhosa learners, explicable
by how the language of the test could have affected the way in which the item was
answered correctly. The following hypotheses statements for the study are:
H0 = µEnglish = µisiXhosa or
Ha = µEnglish ≠ µisiXhosa
Sub-question 2:
To what extent could any of the other isiXhosa dialects have provided
alternative forms of the items to the passage ‘Lonely Giraffe’?
In order to provide alternative assessment items, the English passage from
prePIRLS 2011 was given to three isiXhosa language Grade 4 teachers from the
three isiXhosa regions, namely, Mount Frere to Umzimkhulu, Lusikisiski, and
Mbashe to Kei river to translate into isiXhosa. This stage of the data analysis aims
to add depth to any evidence of differential item functioning in presenting alternative
scenarios for what the items could have looked like had more than one dialect of
isiXhosa been used in the translation of the passage into standard isiXhosa. The
differences or similarities of these alternative forms of the items can be used to
provide alternative scenarios of what the items could have looked like across
different dialects in attempts to discover reasons for differential item functioning.
4.5 Methodological Norms
This is a non-experimental study therefore validity and reliability are the main focus
of methodological norms by firstly looking at how validity and reliability were ensured
in the prePIRLS 2011 study.
69
There were several checkpoints during the preparations of the study, from the
unpacking of the instruments to the dispatch of the instruments. The IEA set strict
guidelines, standards and monitoring processes to which all participating countries
had to adhere. The fieldwork monitoring involved members from the CEA visiting
schools on the day of testing, unannounced, to observe and record adherence to
guidelines and fieldwork administration. Additionally, an International Quality
Control Monitor (IQCM) was appointed and trained by the IEA to serve as an
external quality control measure that reported directly to the IEA on the data
collection activities (Howie et al., 2012).
The CEA’s strict quality control ensured validity and reliability for this study. For a
secondary analysis, it is vital to ensure validity and reliability because the data
remains objective and will not change based on the researcher’s subjectivity. The
aim of the study is to explore the translation validity in cross-language assessment.
In the prePIRLS 2011 the instruments were developed in English then translated
into the targeted language (Malak & Trong, 2007). According to Sperber, Devellis
and Boehlecke (1994), Pène (2007) and Kucer (2009) the translating of assessment
instruments could pose a threat to the validity of the research in terms of text
meaning, difficulty levels and cultural equivalence. PrePIRLS 2011 underwent a
strict translation verification process (Malak & Trong, 2007). The following
procedure were the prePIRLS 2011 guidelines.
4.5.1 Identification of the target language, which is the LOLT.
Identification of translators and the requirements for knowledge of English as
well as the target language.
Translation of instruments from English to the target language, if necessary
adaptation in some cases were granted.
Back-translation of the instrument from the targeted language into English.
Comparison and reconciliation of the two independent translations.
Documentation of all cultural adaptations (Malak & Trong, 2007).

70
In South Africa, the prePIRLS 2011 instruments were contextualised into South
African English then translated into the 10 other official languages (Howie et al.,
2012).
All translators were appointed on the basis that they were registered with the South
African Translators Institute, and given flexibility to change (van Staden & Howie &
Howie 2014) terms or expressions that were not familiar in their culture. Change
was only permitted if the translations did not change the meaning of the text and all
changes in the translations were recorded on the National Adaption forms, to keep
record of all changes made. The back-translation stage involved two translators, the
translator who would translate from source text (English) to target language, then a
second translator who would translate the text from target language back to English
(Howie et al., 2012). Any differences in meaning between the source text and the
back translated text would be checked and if these two texts showed differences in
meaning the first translator was requested to make adjustment to .maintain the
meaning as in the source text.
The last stage of the translation process of the prePIRLS 2011 assessment was the
international verification (Howie et al., 2012). All translated instruments were
submitted to the IEA, who appointed an independent translator to assure quality and
verify the translation instrument for each country participating in PIRLS 2006. The
international verifiers’ aim was to ensure:
The difficulty or meaning of the text was not affected by the translation.
Questions did not become more difficult or easy as a result of translation.
Information was not added or omitted.
All assessment booklets comprised the correct passage and al the items.
All background questionnaires included all the original items (van Staden &
Howie & Howie, 2014).
The methodological consideration of translating instruments could compromise the
quality, linguistic equivalence and techniques used to analyse the data (Sperber et
al., 1994). Supporting this argument is Rice, Pappamihiel and Lake (2004), for
whom literacy should aim to be context-embedded and culturally appropriate to the
learner’s background, that is, when it is broken down it is supported by strategies of

71
cultural literacy transmission (Rice, Pappamihiel & Lake., 2004). In addition, being
context-embedded gives learners a range of cues to the meaning of the text. As
mentioned above, prePIRLS 2011 followed strict translation guideline to ensure in
every way possible that translations retained the meaning of text across languages.
4.6 RESEARCH ETHICS
The participants identified will be kept confidential and protected at all times (Maree,
2013). The study will make use of the achievement scores of the prePIRLS 2011
Grade 4 learners who completed the reading test in English and isiXhosa. The
researcher has no direct contact with the participants and no personal information
will be needed. The researcher has been granted ethical clearance from the Faculty
of education at the University of Pretoria to continue partaking in the study.
In conclusion, the methodology of the study is a secondary analysis of the prePIRLS
2011 Lonely Giraffe data. As mentioned above the data collection, assessment
booklet are those administered under the original study. For the current study, I will
extract the English and isiXhosa sub language groups of the passage. Thereafter,
follow up consultations with Grade 4 isiXhosa teachers will be conducted to explore
whether any mistranslation are identified. All the necessary UP ethics application
processes have been followed and granted by the institution.

72
CHAPTER 5: DATA PRESENTATION AND RESULTS
5.1 RESULTS
Chapter 5 presents the results of the data analysis conducted in the study, mainly
in three phases in accordance with the research questions of the study.
The first phase of data analysis is to answer the main research question: “What is
the difference in reading achievement between the English and isiXhosa Grade 4
prePIRLS 2011 passage ‘The Lonely Giraffe’?” For the main research question, a
table will be presented which shows the frequency and the percentage of learners
who answered items correctly for both English and isiXhosa.
The second phase of the data analysis is to answer the first sub-question: “To what
extent are the differences explained by providing evidence of bias in Differential
Item Functioning (DIF) can be found between English and isiXhosa Grade 4
prePIRLS 2011 response to a reading passage ‘The Lonely Giraffe’?” To answer
the question, a DIF table is presented with the ANOVA statistic to test the hypothesis
statements about differential functioning, and demonstrate the item functioning
between the English and isiXhosa. Additionally, an item characteristic curves (ICC)
is included for the items which do not show uniform functioning between the two
language sub-groups. The ICC makes use of the Item Response Theory (IRT) which
depicts the probability of a learner answering the item correctly.
The third phase of data analysis is to answer the second sub-question: “To what
extent could any of the other isiXhosa dialects have provided alternative forms of
the items to the passage ‘The Lonely Giraffe’?” This section of the data will illustrate
teacher comments on the translations of the item that show some discrimination.
5.2 RESPONSES TO RESEARCH QUESTIONS
As response to the research questions the data analysis will only examine 14 items
of The Lonely Giraffe, which included the sample of learners who completed the
passage in English and isiXhosa. A total of 818 learners completed the passage,
539 of whom completed it in English and 279 in isiXhosa. The items consisted of
eight multiple choice and six open response question types, details for each of which

73
have been detailed in Chapter 4. The following sections provide results according
to each research questions of the study.
5.2.1 Evidence for answering the main research question
The main research question of the study is “What is the difference in reading
achievement between the English and isiXhosa Grade 4 prePIRLS 2011 passage
‘Lonely Giraffe’?” The total score learners could obtain for this passage was 14. The
mean score obtained by learners who answered questions to the passage in English
was 7.22 and for isiXhosa it was 4.08. This translates into the overall average
percentage score for the English at 48.1% and 27.2% for learners who responded
to the passage in isiXhosa. As percentage, learners who wrote the passage in
IsiXhosa achieved considerably lower score than English. Table 5.1 (below)
presents the percentage of learners across the two sub-groups that obtained
individual items correctly.
Table 5.1: Number and percentage of learners who answered items in English and IsiXhosa correctly
English = 539 Learners isiXhosa = 279 Learners
Item No
N Completed
N Correct % Correct N Completed
N Correct % Correct
Item 1 531 411 76.3 257 123 44.1
Item 2 517 389 72.2 235 125 44.8
Item 3 530 406 75.3 246 139 49.8
Item 4 518 234 43.4 228 58 20.8
Item 5 504 296 54.9 224 43 15.4
Item 6 520 310 57.5 229 122 43.7
Item 7 517 325 60.3 225 103 36.9
Item 9 515 382 70.9 221 122 43.7
Item 10 512 358 66.4 218 106 38.0
Item 11 504 265 49.2 216 59 21.1
Item 12 499 60 11.1 220 41 14.7
Item 13 517 221 41.0 230 44 15.8
Item 14 511 284 52.7 224 56 20.1
Item 15 507 257 47.7 218 67 24.0
For learners who responded to the passage in English, items 4, 11, 12, 13, 15 were
correctly answered by less than 50%. The highest percentage responded correctly
to item 1 with 76.3%. The lowest correct responses were for item 12 with only 11.1%
of the learners who answered the item correctly. Fewer than 50% responded
correctly across all items, the highest correct response being obtained for item 3

74
(49.8%) and the lowest for item 5 (15.4 %). The results in Table 5.1 confirm that in
the prePIRLS 2011 passage many more isiXhosa learners were unable to answer
the items correctly. Sub–question one: Finding DIF evidence to explain differences
in achievement.
5.2.2 Evidence for answering the research sub-question
Table 5.2 presents an overall DIF analysis summary of the data, consisting of an
ANOVA test, which includes a person factor analysis of all 14 items in the passage.
The ANOVA is conducted mainly for two purposes, firstly to compare mean scores
of two independent groups and secondly to test a null hypothesis (Maree, 2013). In
this study, the two independent groups refer to English and isiXhosa language sub-
groups. The null hypothesis states that the English mean score is equal to the
isiXhosa mean score (µEnglish = µisiXhosa). If the null hypothesis is untrue the
alternative hypothesis is accepted, which states the English mean score is not equal
to the isiXhosa mean score (Ha = µEnglish ≠ µisiXhosa).
When analysing an ANOVA, the most important value to look at is the f-value and
the p-value. The former is a ratio that two quantities (English and isiXhosa means
scores) are expected to be roughly equal under the null hypothesis (Maree, 2013).
The latter (probability value) is the statistical model used to test a null hypothesis in
order to put a figure on the statistical significance of evidence (Maree, 2013).
Together these values are able to inform the statistically significant5 differences
among the mean score between English and isiXhosa languages sub-group for
each item.
5 Statistically significant is the likelihood that a relationship between two or more variables is caused by something other than random chance.

75
Table 5.2: DIF Summary for The Lonely Giraffe
In table 5.2, a small p-value is typically <0.05, which indicates strong evidence
against the null hypothesis, therefore the null hypothesis can be rejected. A large p-
value of >0.05 indicates weak evidence against the null hypothesis, consequently
failing to reject the null hypothesis (Cohen, 1988). In the current study, the mean
scores are not the same across English and isiXhosa language sub-groups. By
using DIF one can calculate the p-value and determine the functionality across the
two language groups.
Table 5.2 shows a summary of the differential functional item of the passage for
each item as evidenced by ANOVA statistics. In other words, the table presents the
results of each item for: 1) compared mean scores between English and isiXhosa
(Mean squared); 2) the f-value, which is the expected equal score under the null
hypothesis testing (f-ratio) and: 3) the p-value, which is the probability value used
to quantify the statistical significance of evidence. The statistically significant results
at 5% level are highlighted in grey. These items are significant because the p-values
are < 0.05 and therefore present strong evidence against the null hypothesis. This
results in the null hypothesis for items 2, 5, 6, 7, 14, 1, 11 to be rejected. Additionally,
these items are also reported in terms of non-uniform DIF where the ability
differences in the responses to items are inconsistent among the groups (Andrich,
Language
Item Mean Squared F-ratio p-value
1C 9.11 13.269 0.000304
2M 3.89 4.523 0.033798
3C 0.15 0.276 0.599406
4M 0.47 0.433 0.510578
5M 21.57 20.895 0.000000
6M 22.33 18.503 0.000013
7M 2.72 2.784 0.095688
9M 0.03 0.032 0.859100
10M 0.44 0.565 0.452536
11C 0.64 0.783 0.037657 12M 0.84 1.342 0.247188
13C 0.36 0.306 0.580223
14C 5.43 7.633 0.005902
15C 0.57 0.852 0.356362

76
D., & Luo, G., 2003). The small p-value (< 0.05) is also able to infer in a DIF analysis
that the item responses are not the same between the English and isiXhosa
language sub-groups. The small p-value in DIF between the two groups are
correspondingly interpreted as an existence of some discrimination in the items.
The DIF will be presented for each item on a graph, consisting of three line graphs:
a) the IRT depicted model; b) the performance of English learners who answered
that item; and c) the performance of isiXhosa learners who answered that item. In
order to show the uniform functioning of the two groups, graph b) and c) should
demonstrate a similar pattern to graph a), to represent a non-discriminative
functioning between the two languages sub-groups. However, if the graphs show
some sort of a discriminative functioning by not following the predicted graph a) a
third phase of data analysis is applied.
Figure 5.1: Y-axis expected value in an item characteristic curve labels
Figure 5.1 (above) presents an ICC graph, with the y-axis labelling expected value,
also known as the probability score. The probability of a correct response starts
from 0.0 as the lowest probability and incorrect response to 1.0 as the highest
probability and correct response. The x-axis is labelled person location, which also
means the location of the learner’s ability. The assumption here is that each
examinee has some amount of underlying ability, and is placed on the ability scale
ranging from -3 to 3. The scale is divided into two parts, the lower class interval and
upper class interval. The former, between points -3 and 0 on the x-axis of the graph,
are the examinees with a lower ability to respond correctly to an item. The upper
Highest probability
Lowest probability
Incorrect response

77
class interval, between points 0 and 3 on the x-axis of the graph, are the examinees
with a higher ability to answer an item correct (Figure 5.2, below).
Figure 5.2: X-axis expected value in an item characteristics curve labels
The IRT generates a model curve for each item that depicts a person’s ability in
relation to probability to respond correctly to an item, plotted on the graph.
Figure 5.3: IRT model curve
Lastly, the ICC presents a line graph with the obtained score (y-axis) to an ability
score (x-axis). Together the ICC graph and the modelled curve can be compared to
measure the accuracy of the predicted graph (model) to the obtained graph (ICC).
For the purpose of this study, the graphs consist of two ICC’s, with the English and
isiXhosa sub-group compared to the modelled curve as indicated below.
Lower Class Interval Upper Class Interval
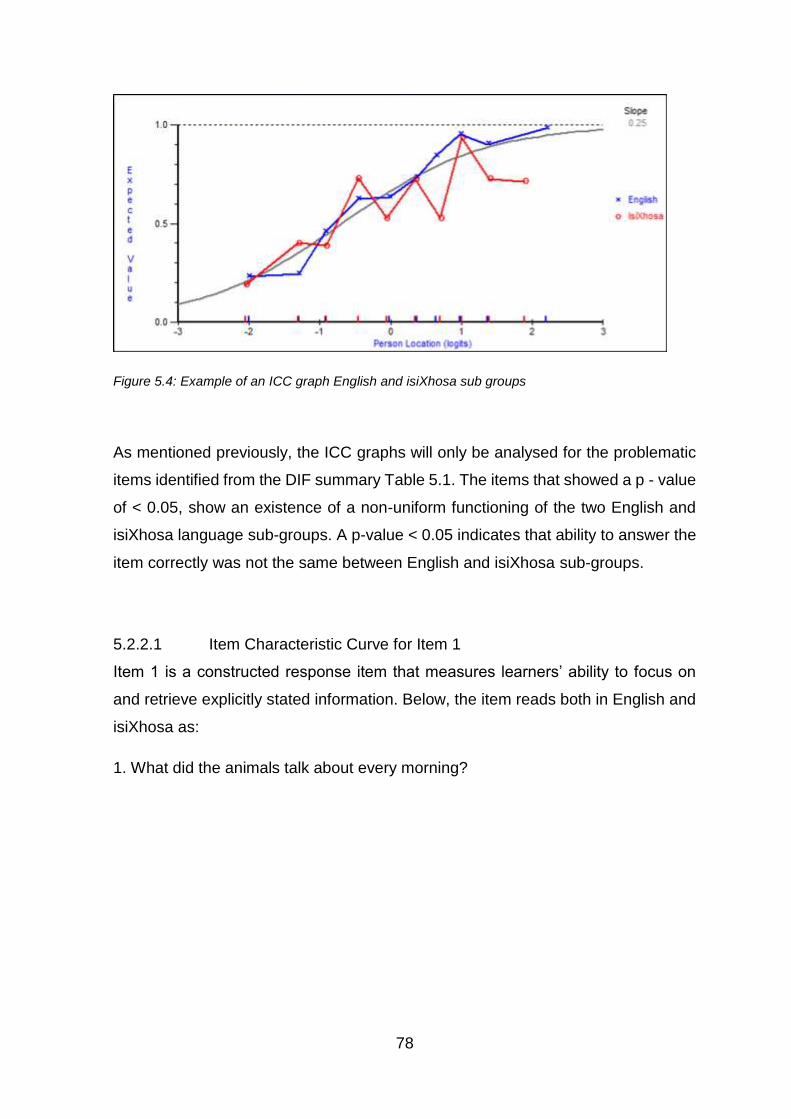
78
Figure 5.4: Example of an ICC graph English and isiXhosa sub groups
As mentioned previously, the ICC graphs will only be analysed for the problematic
items identified from the DIF summary Table 5.1. The items that showed a p - value
of < 0.05, show an existence of a non-uniform functioning of the two English and
isiXhosa language sub-groups. A p-value < 0.05 indicates that ability to answer the
item correctly was not the same between English and isiXhosa sub-groups.
5.2.2.1 Item Characteristic Curve for Item 1
Item 1 is a constructed response item that measures learners’ ability to focus on
and retrieve explicitly stated information. Below, the item reads both in English and
isiXhosa as:
1. What did the animals talk about every morning?

79
1. Zazithetha ngantoni ntsasa nganye izilwanyana?
Figure 5.5: Item 1 characteristic curve
Figure 5.5 (above) illustrates the ICC graph for English (blue) and isiXhosa (red)
language sub-group responses to item 1 as well as the IRT model (grey). Both
English and isiXhosa sub-groups at -2 person location are below the model curve,
which means the learners in the -2 ability scale had found item 1 difficult. The
English sub-group follows a similar pattern as the model curve, between -2.5 and
0.7 person location above the model curve. When a sub-group ICC is above the
model, this means the probability to respond to the item correctly was higher than
the expected value indicated in the model curve. The isiXhosa lower class interval
(between points -3 and 0 on the x-axis of the graph) is below the model (grey), which
reveals that the item was more challenging for learners who were tested in isiXhosa.
5.2.2.2 Item Characteristic Curve for Item 2
Item 2 was a multiple-choice question, the process of comprehension that was
measured was to focus on and retrieve explicitly stated information. The item is
presented in both in English and isiXhosa below.

80
2. Why didn’t anyone listen to the giraffe?
He did not wait his turn to speak.
He spoke too quietly to be heard.
He was too tall.*6
He was not friendly.
2. Kwakutheni kwakungekho silwanyana siyimamelayo indlulamthi?
Yayingalindeli ithuba layo lokuthetha.
Yayithethela phantsi, ingvakali.
Yayinde kakhulu.*
Yayingenabubele.
Figure 5.6: Item 2 characteristic curve
Figure 5.6 (above) points out that item 2 for both English and isiXhosa sub-groups
is inconsistent. For the English sub-group (blue), the lower class interval (between
points -2 and -1.7 on the x-axis of the graph) the curve is below the model curve
and the isiXhosa curve. The curve implies that the learners between -2 and -1.7
6 *Indicated the correct answer for the Item

81
person location English sub-group found the item more difficult than those who
completed the passage in isiXhosa. The English learners on person location was
between -1 to - 0.4 and 0.6 to 1.3 who experienced the item as less difficult. The
person locations’ curve is above the model curve. The isiXhosa sub-group curve
(red) is inconsistent through the different person location points. In person location
-1.8 to -1.3 and -1.1 to -.0.9, the curve is above the model curve and the English
sub-group curve, which means the item was less challenging for these particular
learners. However, the isiXhosa learners within the upper class intervals (between
points 0 and 3 on the x-axis of the) found the item considerably more difficult than
did the English sub-group. The isiXhosa curve in the upper class intervals is
considerably lower than the model curve and the English curve. The results in figure
5.2’s item graph characteristics curve can be explained as item discrimination
towards the learners who completed the passage in isiXhosa in upper class
intervals.
5.2.2.3 Item Characteristic Curve for Item 5
Item 5 was a multiple-choice question, aimed at the process of comprehension to
focus on and retrieve explicitly stated information. The item is presented in both in
English and isiXhosa below:
5. What did the giraffe stop doing over the summer?
wandering off
frightening the birds
appearing in the treetops
speaking to anyone*
5. Yintoni eyayeka ukuyenza indlulamthi ngexesha lehlobo?
ukuhamba
ukoyikisa iintaka
ukuvela phezulu emithini
ukuvela phezulu emithini*

82
Figure 5.7: Item 5 characteristic curve
Figure 5.7 (above) reveals the ICC for item 5 in the passage between English and
isiXhosa sub-groups. Both begin at the same point of -2 person location with the
obtained value of 0.18 and the obtained value above that expected. The significance
of this point is that for learners situated at -2 person location the item was easier
than predicted by the model curve (grey). On one hand, the English curve follows
the pattern and mostly is above the model curve. The curve can be interpreted to
say that person location -0.5 to 2 (upper class interval) experienced the item as
easier than expected. On the other hand, the isiXhosa curve decreases below the
model curve. The isiXhosa curve means that the obtained values were much lower
than the expected ones, which indicated the learners had trouble in answering the
item. Additionally, because the English (blue) curve proved easier and the isiXhosa
(red) more difficult, it can be concluded that item 5 discriminated against the
isiXhosa language sub-group, so the ICC curve shows that item 5 carried much
more cognitive load for the isiXhosa sub-groups than the English sub-group.
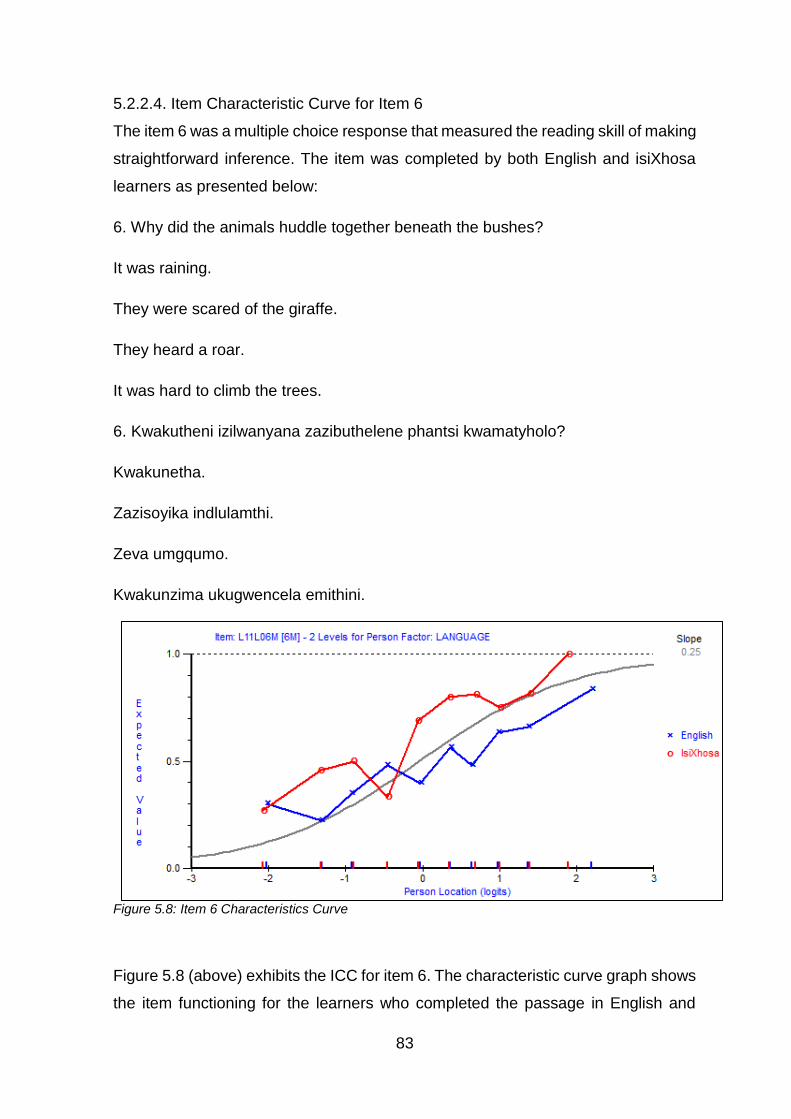
83
5.2.2.4. Item Characteristic Curve for Item 6
The item 6 was a multiple choice response that measured the reading skill of making
straightforward inference. The item was completed by both English and isiXhosa
learners as presented below:
6. Why did the animals huddle together beneath the bushes?
It was raining.
They were scared of the giraffe.
They heard a roar.
It was hard to climb the trees.
6. Kwakutheni izilwanyana zazibuthelene phantsi kwamatyholo?
Kwakunetha.
Zazisoyika indlulamthi.
Zeva umgqumo.
Kwakunzima ukugwencela emithini.
Figure 5.8: Item 6 Characteristics Curve
Figure 5.8 (above) exhibits the ICC for item 6. The characteristic curve graph shows
the item functioning for the learners who completed the passage in English and

84
isiXhosa. In person location -2 to 0 (lower class interval) the isiXhosa curve (red)
and English curve (blue) are both above the model curve (grey), so that for both
sub-groups the obtained value is more than the expected one. From that, it can be
deduced that there were no difficulties in answering the item for persons in the lower
class. However, the isiXhosa curve is above both the English curve and the model
curve, implying that for isiXhosa learners at location -2 to 0 the item was far easier
than how the English learners experienced the item. In the upper class interval
(person location 0 – 3), the isiXhosa sub-group followed the pattern of the model
curve and in some instances is above the model curve. The curve suggests that the
item was less challenging for the isiXhosa sub-group. For the English sub-group in
the upper class interval, the curve decreases below the model curve, so that the
item was challenging for the English sub-group Because of the two-sub-group
curves, the ICC indicate that item 6 discriminated against the English sub-group. In
this case, the item it was more difficulty for the English sub-group than it was for the
isiXhosa sub-group.
5.2.2.5. Item Characteristic Curve for Item 7
Item 7 was a multiple choice response question to measure the reading skill of
making straightforward inference. The item appeared in the booklet in the following
written form in English and isiXhosa:
7. “His big eyes widened like saucers.”
What do these words from the story tell you about the giraffe?
He was glad.
He was shocked.
He was angry.
He was excited.
7. “Amehlo ayo amakhulu atwezeka okweesosari.”
Akuxelela ntoni la magama asuka ebalini ngendlulamthi?
Yayonwabile.

85
Yayothukile.
Yayinomsindo.
Yayinehlombe.
Figure 5.9: Item 7 Characteristics Curve
Figure 5.9 (above) is item 7’s item characteristic curves for both English and
isiXhosa sub-groups. At person location -2 the obtained value for both English (blue)
and isiXhosa (red) is above the expected value. This location suggests that the
learners at -2 person location had found the item less challenging. Overall, the
isiXhosa sub-group curve is above the model curve in particular in location -1.5 to -
0.8 and 0.5 to 2. The illustrated isiXhosa curve leads to understanding that at the
mention person location the item was easier than expected. The English sub-group
curve in most locations is below the model curve, in person location -1.7 to -0.5 and
0 to1.5. When an ICC is below the model the item is shown to be difficult for the
sub-group. However, if one considers the closeness of the gap between the English
and isiXhosa curves it shows little differences in obtained values. Due to the small
difference between the two curves the item is not seen to discriminate against any
sub-group.

86
5.2.2.6 Item Characteristic Curve for Item 11
Item 11 is a constructed response item, which measures the reading skills making
a straightforward inference. It is presented in both English and isiXhosa below:
11. Why couldn’t some of the animals climb up the slippery tree trunks?
11. Kwakutheni ukuba ezinye izilwanyana zingakwazi ukukhwela kwiziqu zemithi
ezimtyibilizi?
Figure 5.10: Item 11 Characteristics Curve
Figure 5.10 (above) is the ICC of item 11 for both English and isiXhosa sub-groups.
The starting point for both English (blue) and isiXhosa (red) curve at -2 are below
the model curve. In line with the illustration, it infers that for learners located in -2
person location the obtained value was less than the expected value, meaning it
was difficult. For the isiXhosa curve the obtain value continues to be 0 from person
location -2 to -1.8, however gradually progress to above the model curve from point
-1.9 to 1.1. The English curve follows a simaliar pattern to the isiXhosa curve but
remains slightly below it and above the model curve in person location -0.9, 0.5 and
1 to 2. As in figure 5.9 item 7, the gap between the English and isiXhosa curves is
of slight difference, so one does not deduce any discriminative patterns for either
two sub-groups.
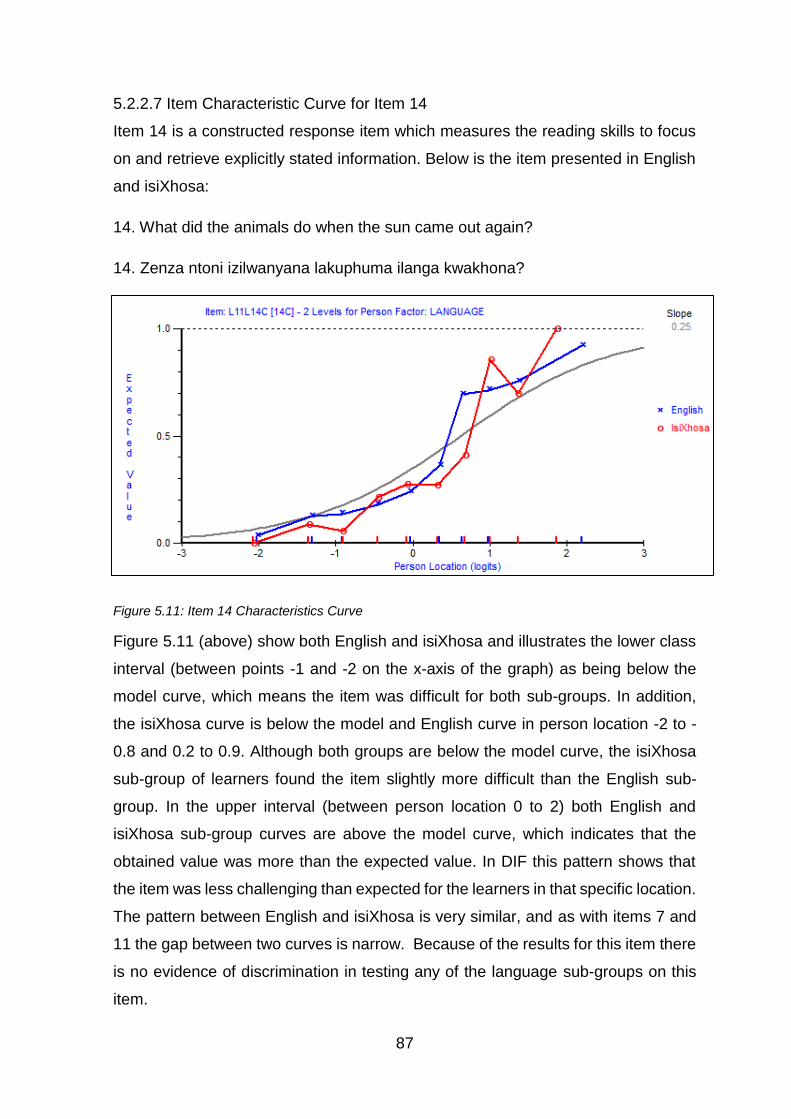
87
5.2.2.7 Item Characteristic Curve for Item 14
Item 14 is a constructed response item which measures the reading skills to focus
on and retrieve explicitly stated information. Below is the item presented in English
and isiXhosa:
14. What did the animals do when the sun came out again?
14. Zenza ntoni izilwanyana lakuphuma ilanga kwakhona?
Figure 5.11: Item 14 Characteristics Curve
Figure 5.11 (above) show both English and isiXhosa and illustrates the lower class
interval (between points -1 and -2 on the x-axis of the graph) as being below the
model curve, which means the item was difficult for both sub-groups. In addition,
the isiXhosa curve is below the model and English curve in person location -2 to -
0.8 and 0.2 to 0.9. Although both groups are below the model curve, the isiXhosa
sub-group of learners found the item slightly more difficult than the English sub-
group. In the upper interval (between person location 0 to 2) both English and
isiXhosa sub-group curves are above the model curve, which indicates that the
obtained value was more than the expected value. In DIF this pattern shows that
the item was less challenging than expected for the learners in that specific location.
The pattern between English and isiXhosa is very similar, and as with items 7 and
11 the gap between two curves is narrow. Because of the results for this item there
is no evidence of discrimination in testing any of the language sub-groups on this
item.

88
Overall, item characteristic curves shown above only item 1, 2 and 5 point out non-
uniform functioning between the English and isiXhosa sub-group and denote some
discrimination of the isiXhosa sub-group. Items 6,7,11 and 14 according to the item
characteristic show none or very little discrimination for any sub-group. The
identified items with non-uniform functioning will form the third phase of the analysis
as part of sub-question two.
5.3.1 Evidence for answering the research sub-question two
The second sub–question to the current study asks: “To what extent could any of
the other isiXhosa dialects have provided alternative forms of the items to the
passage ‘Lonely Giraffe’?”. In order to answer this question, items 1, 2 and 5 proved
to be problematic and provided evidence of DIF between the English and isiXhosa
sub-groups of Grade 4 learners who responded to these items.
Subsequently, these items, as presented in the prePIRLS 2011 test, were given to
isiXhosa first language speaking teachers from specific dialect areas. The teachers
were on Foundation Phase in their respective schools and have more than five
years of teaching experience in the Intermediate Phase classrooms. Teacher A was
from between Mount Frere and Umzimkhulu, an area that predominantly speaks the
isiBhaca dialect. Teacher B was from Lusikisisi, an area where isiMpondo is mostly
spoken, and Teacher C was from the Mbashe area where isiHlubi is mostly spoken.
The teachers were asked to provide possible alternatives or comment on the
translations to these three items based on what they could have looked like in their
dialects. For each item, a table with each teacher’s response will be presented, and
followed by a discussion.
Table 5.3: Teacher’s responses to Item 1
prePIRLS Item 1 English
prePIRLS Item 1 isiXhosa
Teacher) A (isiBhaca
Teacher B (isiMpondo)
Teacher C (isiHlubi)
What did the animals talk about every morning?
Zazithetha ngantoni ntsasa nganye izilwanyana?
“Zazibhobha ngantoni ntsatsa nganye tilwanyana”
“Zazithetha ngantroni ngetsatsa nganye izilwanyana”
“Zazithetha ngantoni qho kusasa izilwanaya”
89
The following are the comments and feedback from the teachers with regard to item
1:
Teacher A indicates that the word “talk” (English) in the prePIRLS isiXhosa item 1
is “thetha” (isiXhosa). She refers to the word “talk” as “bhobha” (isiBhaca) which is
the word used in her dialect. Teacher A therefore provides an alternative word,
which she explains as commonly used as a synonym for the verb “talk”. Additionally,
she highlights that this synonym is the word she uses in her classroom and a word
that refers to “talk” in their dialect spoken in their community. Teacher A also shows
a different way to spell “animals” (English) “izilwanyana” (isiXhosa) in her response,
as illustrated by the description below:
Original item Teacher A
Izilwanyana Tilwanyana
Teacher A indicates that, in the isiBhaca dialect, the phoneme izi does not exist,
which indicates plurality, but instead uses a different prefix and phoneme that is ti.
This means that the prefix izi does not exist in isiBhaca, and perhaps if learners
have not been taught prefixes well enough it could cause confusion in the text.
Teacher B made use of different prefixes for the word “morning” (English) in the
isiXhosa “ntsasa” prePIRLS item 1 in the following way:
Original item Teacher B
ntsasa ngetsatsa.
According to teacher B, nge is a word she uses in her classroom to emphasise “for
every morning this is what happens…”. Teacher B also points out that using
ngetsatsa is not necessary linked to her dialect, but a prefix that is used for
emphasis and in her opinion is regularly used in her community. Learners are likely
to be more familiar with the word as presented in table 5.12 than as it was presented
in the prePIRLS 2011 passage.
Lastly, teacher C used a different word (or synonym) to emphasise the notion of
“every morning this is what happened…” in the following manner:
Original item Teacher C

90
Ntsatsa nganye Qho kusasa
Teacher C suggests that instead of using “ntsatsa nganye”, she would present it to
her learners as “qho kusasa”. Teacher C supported her phrasing as being
cognitively appropriate for Grade 4 learners in her classroom.
The responses from the teachers is a combination of dialect vocabulary used in the
classroom as well as the use of low frequency words used in item 1 as presented
by the prePIRLS 2011 passage. Additionally, the representation of the item
structure is an alternative way the teachers felt the item could have been asked in
order to be more comprehensive for the learners in their respective classrooms.
Lastly, teachers’ comments were based on the dialect use of high frequency words
that are commonly spoken in their specific areas.
In terms of item 2, the following were identified:
Table 5.4: Teacher responses to Item 2
prePIRLS Item 2 English
prePIRLS Item 2 isiXhosa
Teacher) A (isiBhaca
Teacher B (isiMpondo)
Teacher C (isiHlubi)
Why didn’t anyone listen to the giraffe?
Kwakutheni kwakungekho silwanyana siyimamelayo indlulamthi?
Yini eyenta kungabiko tilwanyana timamela indlulamthsi?
Kwakutheni kungekho silwanyana esiyimamelayo indlulamthi?
“Kutheni le nto kungazange kube silwanyana siyimamelayo indlulamnthi?”
Considering Table 5.13, teacher A rephrased the entire sentence and spelled some
words differently from the original item 2. For example:
Original Item Teacher A
Silwanyana Tilwanyana
Siyamamelayo Timamela
Indlulamthi Indlulamthsi
Teacher A explains the differences in spelling as dialect phonemes. Further, she clarified
that in her dialect the letter “S” is non-existent and replaced with the phoneme “Ti”. The
phoneme “THI” is pronounced and spelt as “THSI”. Additionally, she mentioned that usually

91
learners in foundation phase struggled with the differences in the pronunciation of these
phonemes. In the rephrasing of the sentence, teacher A provided an alternative sentence
construction and explained it by saying it was a “better translation…” and not too complex
for learners in Grade 4. Teacher A pointed out a constant struggle in teaching
“standardised” isiXhosa in dialectal isiBhaca, by which she expressed that in early literacy
years she experienced having to teach “standardised” isiXhosa in her dialect as a form of
code switching in her classroom.
Teacher B removed a prefix of the word in the below demonstration:
Original item Teacher B
Kwakungekho kungekho
Teacher B removed the prefix of “kwakungekho” to “kungekho”. The motivation here
is that she has taught her learners when there was the same prefix in two words
after one another, for example as illustrated in the isiXhosa prePIRLS 2011
“Kwakutheni kwakungekho”. To remove the prefix of the second word, an example
from teacher B response “Kwakutheni kungekho” is provided. She noted that in her
dialect that is how they speak and to her makes the most sense of removing the
prefix of the second word.
Teacher C has represented first part of the item in the following way:
Original item Teacher C
Kwakutheni kwakungekho Kutheni le nto kungazange kube
Teacher C rephrased the first part of the item from “Kwakutheni kwakungekho” to
“Kutheni le nto kungazange kube”. Teacher C’s justification of the change is that the
sentence of the original item would be at a difficult level for the learners in her Grade
4 classroom, quoting from the field note: “…lentoni, sisXhosa esinzulu, apha asifiki
apha...” translates to “…this is deep Xhosa, here!!, we do not even get there…”.
The teachers’ responses presented a mix between dialect use in classroom and the
use of low frequency words or unfamiliar sentence structures. Teacher C in
particular highlighted that the item was written in “too” formal isiXhosa, which the
learners in her classroom were not familiar with and would struggle to understand
at their level.
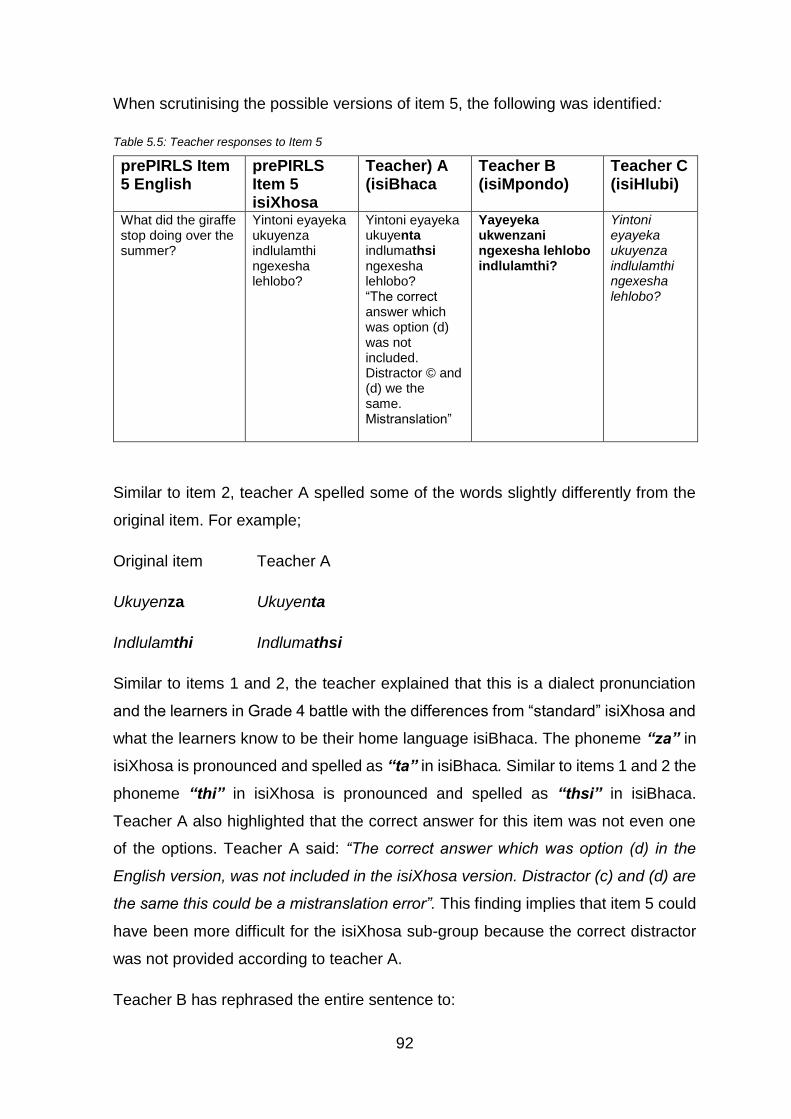
92
When scrutinising the possible versions of item 5, the following was identified:
Table 5.5: Teacher responses to Item 5
prePIRLS Item 5 English
prePIRLS Item 5 isiXhosa
Teacher) A (isiBhaca
Teacher B (isiMpondo)
Teacher C (isiHlubi)
What did the giraffe stop doing over the summer?
Yintoni eyayeka ukuyenza indlulamthi ngexesha lehlobo?
Yintoni eyayeka ukuyenta indlumathsi ngexesha lehlobo? “The correct answer which was option (d) was not included. Distractor © and (d) we the same. Mistranslation”
Yayeyeka ukwenzani ngexesha lehlobo indlulamthi?
Yintoni eyayeka ukuyenza indlulamthi ngexesha lehlobo?
Similar to item 2, teacher A spelled some of the words slightly differently from the
original item. For example;
Original item Teacher A
Ukuyenza Ukuyenta
Indlulamthi Indlumathsi
Similar to items 1 and 2, the teacher explained that this is a dialect pronunciation
and the learners in Grade 4 battle with the differences from “standard” isiXhosa and
what the learners know to be their home language isiBhaca. The phoneme “za” in
isiXhosa is pronounced and spelled as “ta” in isiBhaca. Similar to items 1 and 2 the
phoneme “thi” in isiXhosa is pronounced and spelled as “thsi” in isiBhaca.
Teacher A also highlighted that the correct answer for this item was not even one
of the options. Teacher A said: “The correct answer which was option (d) in the
English version, was not included in the isiXhosa version. Distractor (c) and (d) are
the same this could be a mistranslation error”. This finding implies that item 5 could
have been more difficult for the isiXhosa sub-group because the correct distractor
was not provided according to teacher A.
Teacher B has rephrased the entire sentence to:

93
Original item Teacher B
Yintoni eyayeka ukuyenza Yayeyeka ukwenzani
indlulamthi ngexesha lehlobo? ngexesha lehlobo indlulamthi?
Teacher B‘s explanation for rephrasing the sentence was that the original item
would be too challenging for learners in her classroom. Teacher B highlighted that
at Grade 4 level the learners have not yet grasped the sentence complexity of the
“standardised” isiXhosa.
Teacher C simply stated that the original item was appropriate for Grade 4 learners
in her classroom and had no comments.
For item 5, the pattern of using a dialect to teach the “standardised” isiXhosa is
evident. In addition, teacher B felt strongly about the level of difficulty of the item in
reference for the learners in her classroom. Surprisingly, teacher C had no comment
on this particular question.
5.4 SUMMARY OF RESULTS
The results of the present study may be summarized by pointing out that, firstly,
evidence was found for statistically significant differences between English and
isiXhosa when comparing mean scores obtained across the 14 items. The overall
percentage score for the English sub-group is 48.1% and the isiXhosa sub-group is
27.2%. Both sub-groups achieved below 50%, however, isiXhosa performed
considerably lower than English the language group. Having said that, Table 5.1
also presents the percentage score for each item of The Lonely Giraffe. It is
important to point out that isiXhosa performed lower than English for each of the 14
items. To be specific, items 4, 11, 12, 13 and 15 were typically the lowest
percentage score for the isiXhosa sub-group.
Secondly, the DIF analysis revealed items 1, 2, 5, 7, 11 and 14 as problematic. As
displayed in Table 5.2, the problematic items provide evidence that the mean scores
between the two sub-groups are not equal for all 14 items. Therefore, the null
hypothesis which states English language sub-group scores are equal to isiXhosa
languages sub-group score for prePIRLS 2011 “The Lonely Giraffe” ( H0 = µEnglish

94
= µisiXhosa) is rejected. Thirdly, these problematic items were further investigated
by means of an item by item analysis and only items 1, 2 and 5 provided substantial
evidence of DIF. By examining figures 5.6 to 5.11 these items were more difficult to
complete for the isiXhosa sub-group than the English sub-group.
The chapter concludes with possible alternative forms of these three items based
on what teachers in FP classrooms know to use in their dialects. In summary, the
teachers’ responses were a combination of translation issues used in the items as
well as the use of dialect code switching in their classrooms. The teachers provided
synonyms to words they felt to be too difficult for learners in Grade 4. Additionally,
they presented alternative translations to the items for language level
appropriateness for the learners in Grade 4.

95
CHAPTER 6: CONCLUSIONS AND RECOMMENDATIONS
This last chapter summarises the research approach in the study, with discussions
of the findings as presented in Chapter 5 as well as the methodological reflection. It
also includes the limitations of the study and concludes with recommendations
emanating from the evidence presented.
6.1 SUMMARY OF THE RESEARCH APPROACH
The research methodology has been discussed in detail in Chapter 4, however, in
the following section the data source, data preparation and data processing are
discussed before providing a summary of the results.
6.1.1 Data Source
The current study is a secondary analysis of the prePIRLS 2011 South African data.
As outlined in Chapter 2, it assessed Grade 4 learners in all 11 official languages,
namely, Afrikaans, English, isiNdebele, isiXhosa, isiZulu, siSwati, Sesotho,
Setswana, Sepedi, Tshivenda and Xitsonga (Howie et al., 2012). The prePIRLS
2011 study had a total of eight passages that were translated into all official
languages. These passages were compiled to form 14 booklets by using the matrix
method as described in chapter, each of which had two reading passages
accompanied by 13-15 items (Howie et al., 2012). For the purpose of this study, the
data consisted of responses from the passage ‘The Lonely Giraffe’ passage, in
particular data responses from the English and the isiXhosa learners. The passage
had 15 items, of which seven were constructed responses and eight were multiple
choice questions.
6.1.2 Data preparation
The passage ‘The Lonely Giraffe’ is one of the four released passages and the data
is available on a public domain. The full dataset and the isiXhosa version of the
passage was obtained from the Centre of Evaluation and Assessment. The data
96
had to be prepared for the use of only ‘The Lonely Giraffe’ and responses in English
and isiXhosa from the entire dataset. The demographical variables were removed,
since only the UIN (unique identification number) and the achievement item
responses were applicable to this particular study. The IDB Analyzer was used for
the data preparation, which is an SPSS plug in software for large dataset.
6.1.3 Data processing
In order to conduct the analysis, which included descriptive statistics and a DIF
analysis, quantitative analyses were conducted. Based on the results, three
teachers from different isiXhosa dialectal areas were consulted for further insights
on the items and how they performed. SPPS was used for the descriptive statistics,
which calculated firstly the overall achievement score of the English and isiXhosa
sub-groups in percentages for the passage. Secondly, the number of learners who
answered each item correctly were also calculated in percentage scores. The
descriptive statistics presented the sub-group that performed higher in ‘The Lonely
Giraffe’, as well as demonstrated the sub-group that achieved the highest correct
responses per item.
The second phase of data processing was the DIF analysis in two parts, the
summary of DIF by means of ANOVA and the item characteristic curves. The
ANOVA is a statistical test for two independent groups’ means score (Maree, 2013).
The p-value illustrates the significant difference in the means scores between the
two groups. Identifying the items with a low p-value, the second part of the analysis
was applied. Each of the items with a p-value <0.05 was presented with an item
characteristic curve that demonstrated how the item functioned between the two
groups. Only three items produced significant non-uniform functioning between
English and isiXhosa. These items were then presented to three isiXhosa teachers
from different dialectal areas in the Eastern Cape. The teachers were given both
English and isiXhosa prePIRLS 2011 versions of the items to scrutinise and give
any comments on how the items were translated. The teachers provided their
comments and these were presented as a summary of how each teacher responded
to each item.

97
6.2. DISCUSSION ON MAIN FINDINGS
The main research question of the current study asked “What is the difference in
reading achievement between the English and isiXhosa Grade 4 prePIRLS 2011
passage ‘The Lonely Giraffe’ passage?” The evidence to answer the question is
presented in Table 5.1 in chapter 5, with overall percentage score for English of
48.1% and isiXhosa of 27.2%. The significant difference between the two leads to
the scrutiny of each item in the passage, and firstly, the isiXhosa sub-group
performed significantly lower across all 14 items of the passage and scored below
the mean score for all. These results confirm earlier findings by Howie et al. (2012)
presented in Chapter 2 that, overall, the African languages performed below the
international benchmark as stipulated by the IEA in the prePIRLS 2011 South
African study. Also of relative importance, the English sub-group performed
generally higher than the isiXhosa sub-group, but scored below the mean score for
items 4, 11, 12, 13 and 15. Having said that, the data in Table 5.1 led to a second
phase of the analysis in attempts to further investigate the items by investigating
differential item functioning between English and isiXhosa.
Sub-question 1 asked: “To what extent are the differences explained by providing
evidence of bias in Differential Item Functioning (DIF) can be found between English
and isiXhosa Grade 4 prePIRLS 2011 response to a reading passage ‘The Lonely
Giraffe’ passage?” Table 5.2 demonstrated the results to test the null hypothesis
statement that the English language sub-group scores were equal to the isiXhosa
sub-group score for prePIRLS 2011 ‘The Lonely Giraffe’ passage ( H0 = µEnglish
= µisiXhosa). The ANOVA statistical analysis was used to test the mean scores of
the two language groups. Table 5.2 confirmed that the null hypothesis was rejected
since the mean scores of English and isiXhosa language sub-groups were not
equal. In particular, items 1, 2, 5, 7, 11 and 14, according to statistically significant
p-values, showed non-uniform functioning between the two language sub-groups.
Hence, the variations in the p-values provided evidence that the items in the
passage functioned differently between English and isiXhosa language sub-groups.
The ANOVA analysis can account for the mean scores differences and non-uniform
functioning. However, for further DIF analysis, an item-by-item characteristics curve
was conducted for the problematic, non-uniform items.

98
As mentioned above, the ICC curve makes use of an expected value predicted by
the IRT and the obtained values, together with a person location that indicates a
latent ability. Data from figure 5.2.6 to 5.2.11 illustrated the ICC for items 1, 2, 5, 6,
7 and 11. Of the problematic items as identified in Table 5.2, only items 1, 2 and 5
provided substantial evidence of DIF. The items were found by displays of ICC to
be more difficult for the isiXhosa sub-group than the English sub-group.
Sub question 2 asked: “To what extent could any of the other isiXhosa dialects have
provided alternative forms of the items to the passage ‘The Lonely Giraffe’?” Items
1, 2 and 5 were given to three isiXhosa Home Language (HL) teachers to examine
the translation. These three items underwent the third phase of analysis due to the
non-uniform functioning between English and isiXhosa sub-groups. Additionally,
these items were explored to establish whether the discrepancies could be
explained by means of translation issues and/or the use of dialects in isiXhosa
teaching in classrooms. In summary, the differences in the dialects as described by
the respondents are that isiBhaca (teacher A) had different phonemes, therefore,
words were spelled and pronounced differently from the “standardised” isiXhosa as
presented in the prePIRLS 2011 study. IsiMpondo (teacher B) seemed to have
slightly different ways of constructing sentences to the “standardised” isiXhosa. As
with isiBhaca, isiHlubi (teacher c) also presented on a few occasions different ways
of presenting the item. Both these dialects in most cases made use of synonyms
that the teachers felt were most familiar to the learners. According to the teachers’
comments, non-uniform item functioning could possibly be justified by issues of
translation and teacher dialect code switching in classrooms.
6.2.1 Discussion on Sub-question 1 findings
Due to the growth in cross-languages assessment globally, during the last decade
scholars have started exploring ways to ensure high quality assessments which
include good translations across different languages. In South Africa, cross
language literacy assessments have their challenges with 11 official languages that
need to be accommodated. The transition from assessment in source text English
into the targeted agglutinating African languages has its complexities, therefore

99
strict translations procedures need to be applied in any educational achievement
studies.
According to Arffman (2013), when translating international achievement
assessments for the purpose of comparison it is vital that the different ones are
equivalent, in four main ways, namely, linguistic, functional, cultural and metric
(Pena, 2007). Linguistic equivalence refers to the meaning of text in both
assessment languages being the same in both versions (Grisay, 2003; Sireci &
Berberoglu, 2000). In the IEA procedures, the back-translation insured this measure
by providing direct English translation of the translated isiXhosa passages and items
by a different translator. Functional equivalence entails ensuring the two language
versions of the assessment are measuring the same construct (Pena, 2007; Rogler,
1999). As in linguistic equivalence, the back translation procedure in the IEA
guidelines ensures that the constructs are the same across the languages. Cultural
equivalence refers to items that could possibly have different saliences for different
cultural and linguistic groups (van der Veer, Ommundsen, Hak & Larsen, 2003;
Pena, 2007). Additionally, the cultural equivalence focuses on how different cultures
and languages interpret the underlying meaning of an item (Pena, 2007). The IEA
procedure in addressing this equivalence is by including a process of
contextualisation for each country participating in prePIRLS 2011 (Howie et al.,
2012). Lastly, metric equivalence is the item or question text difficulty level (Pena,
2003), which Pena (2003) suggests can be measured in two ways, namely, by
conducting a DIF analysis or piloting and refining the instrument. Unlike the other
equivalences this step only included in piloting the English items before the main
prePIRLS 2011 study was undertaken in South Africa. Hence, the aim of the study
to measure item difficulty by means of differential item functioning makes a further
contribution in assuring metric equivalence.
By conducting a DIF analysis, the study examined whether any items held heavier
cognitive load for one language sub-group over the other. As presented in Chapter
5, three items provided evidence of DIF, meaning that some were harder for the
isiXhosa sub-group than for the English sub-group. Thus, DIF can possibly serve
as source of item bias (Solano-Fores, Backhoff & Contreras-Nino, 2009), however
not for the majority of items that were presented to learners who responded to the
passage. Since only three items out of 12 items showed DIF, there is not substantial

100
argument, in this case, to assume that it applies to all African languages.
Additionally, since there are a few items with DIF, the strict guidelines set by the IEA
are valid and assessments in the different languages can be comparable. The
importance of the IEA’s recommended steps should not be underestimated, namely:
Step 1: One translator translates the first target language version on the basis
of the English source version.
Step 2: The national version is reviewed by a translation reviewer.
Step 3: The reviewed version is verified by an independent translator
appointed by the IEA, while the verifier makes suggestions for the corrections
and improvements.
Step 4: The national translator decides the final versions and have them
compiled into test booklets.
Step 5: The verifier checks that the obligatory corrections have been made.
(Arffman, 2013).
A well-rounded approach should be seen as multiple sourced that from a
judgemental perspective affects the equivalence of tests rather than examining the
correctness thereof. This means that translation procedures should include
processes that consist of checkpoints that will provide different inputs and
perspectives on the texts and items. If achieved, as in the prePIRLS 2011, it links
to the aim and purpose of cross languages assessments.
6.2.2 Discussion on Sub-question 2 findings
Erikan (2002), Gierl and Khaliq (2001), and Erikan, Gierl, McGreith, Puhan and Koh
(2004) argue that an incorrect item translation may affect its DIF. Based on this
theory, the third analysis of the study consisted of understanding the item and its
translation. Although only three items indicated non-uniform item functioning, it is
as important to explore these three items to understand the DIF in greater depth.
Solano-Flores, Backhoff and Contrera-Nino (2009) have summarised a Theory of
Test Translation Error into ten main languages dimensions of the item design, as
illustrated by Table 6.1:
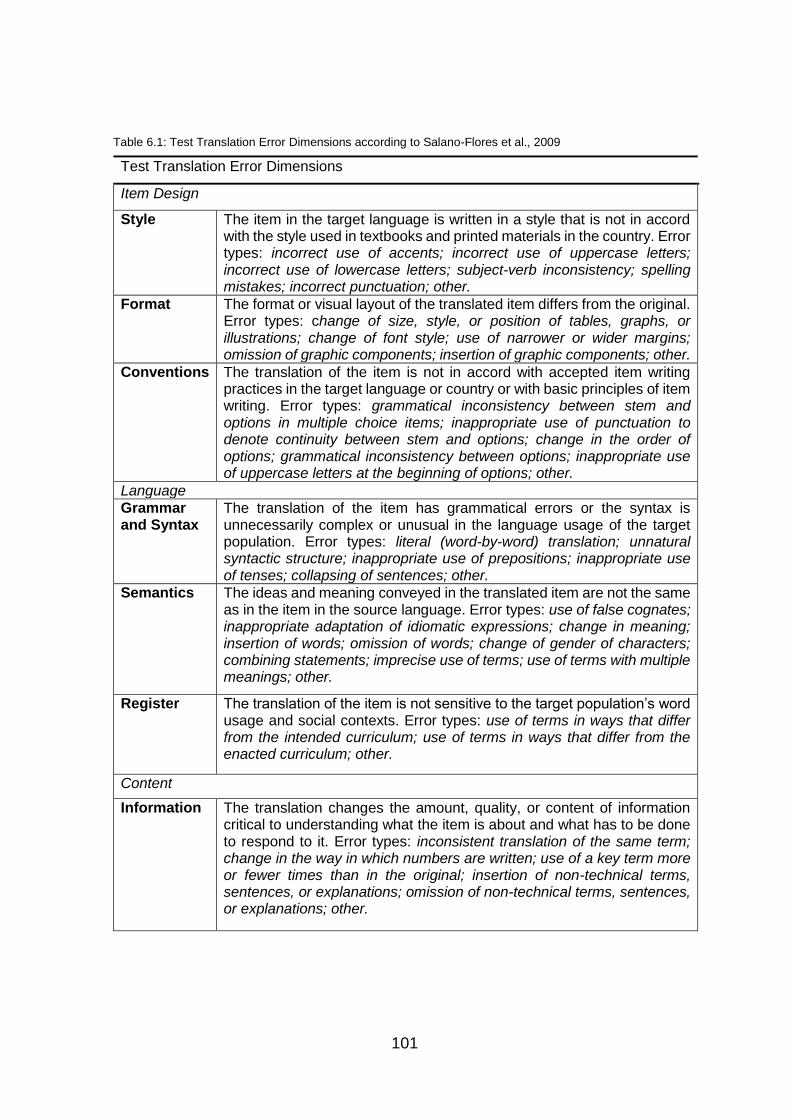
101
Table 6.1: Test Translation Error Dimensions according to Salano-Flores et al., 2009
Test Translation Error Dimensions
Item Design
Style The item in the target language is written in a style that is not in accord with the style used in textbooks and printed materials in the country. Error types: incorrect use of accents; incorrect use of uppercase letters; incorrect use of lowercase letters; subject-verb inconsistency; spelling mistakes; incorrect punctuation; other.
Format The format or visual layout of the translated item differs from the original. Error types: change of size, style, or position of tables, graphs, or illustrations; change of font style; use of narrower or wider margins; omission of graphic components; insertion of graphic components; other.
Conventions The translation of the item is not in accord with accepted item writing practices in the target language or country or with basic principles of item writing. Error types: grammatical inconsistency between stem and options in multiple choice items; inappropriate use of punctuation to denote continuity between stem and options; change in the order of options; grammatical inconsistency between options; inappropriate use of uppercase letters at the beginning of options; other.
Language
Grammar and Syntax
The translation of the item has grammatical errors or the syntax is unnecessarily complex or unusual in the language usage of the target population. Error types: literal (word-by-word) translation; unnatural syntactic structure; inappropriate use of prepositions; inappropriate use of tenses; collapsing of sentences; other.
Semantics The ideas and meaning conveyed in the translated item are not the same as in the item in the source language. Error types: use of false cognates; inappropriate adaptation of idiomatic expressions; change in meaning; insertion of words; omission of words; change of gender of characters; combining statements; imprecise use of terms; use of terms with multiple meanings; other.
Register The translation of the item is not sensitive to the target population’s word usage and social contexts. Error types: use of terms in ways that differ from the intended curriculum; use of terms in ways that differ from the enacted curriculum; other.
Content
Information The translation changes the amount, quality, or content of information critical to understanding what the item is about and what has to be done to respond to it. Error types: inconsistent translation of the same term; change in the way in which numbers are written; use of a key term more or fewer times than in the original; insertion of non-technical terms, sentences, or explanations; omission of non-technical terms, sentences, or explanations; other.
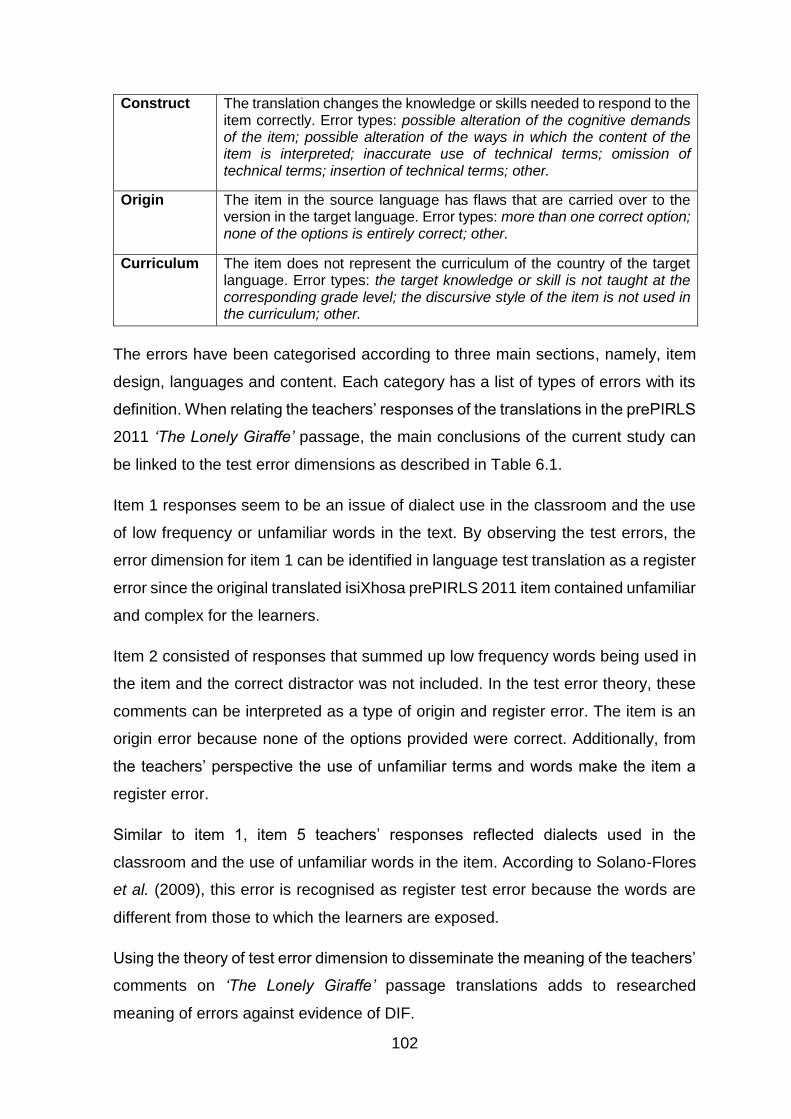
102
Construct The translation changes the knowledge or skills needed to respond to the item correctly. Error types: possible alteration of the cognitive demands of the item; possible alteration of the ways in which the content of the item is interpreted; inaccurate use of technical terms; omission of technical terms; insertion of technical terms; other.
Origin The item in the source language has flaws that are carried over to the version in the target language. Error types: more than one correct option; none of the options is entirely correct; other.
Curriculum The item does not represent the curriculum of the country of the target language. Error types: the target knowledge or skill is not taught at the corresponding grade level; the discursive style of the item is not used in the curriculum; other.
The errors have been categorised according to three main sections, namely, item
design, languages and content. Each category has a list of types of errors with its
definition. When relating the teachers’ responses of the translations in the prePIRLS
2011 ‘The Lonely Giraffe’ passage, the main conclusions of the current study can
be linked to the test error dimensions as described in Table 6.1.
Item 1 responses seem to be an issue of dialect use in the classroom and the use
of low frequency or unfamiliar words in the text. By observing the test errors, the
error dimension for item 1 can be identified in language test translation as a register
error since the original translated isiXhosa prePIRLS 2011 item contained unfamiliar
and complex for the learners.
Item 2 consisted of responses that summed up low frequency words being used in
the item and the correct distractor was not included. In the test error theory, these
comments can be interpreted as a type of origin and register error. The item is an
origin error because none of the options provided were correct. Additionally, from
the teachers’ perspective the use of unfamiliar terms and words make the item a
register error.
Similar to item 1, item 5 teachers’ responses reflected dialects used in the
classroom and the use of unfamiliar words in the item. According to Solano-Flores
et al. (2009), this error is recognised as register test error because the words are
different from those to which the learners are exposed.
Using the theory of test error dimension to disseminate the meaning of the teachers’
comments on ‘The Lonely Giraffe’ passage translations adds to researched
meaning of errors against evidence of DIF.

103
6.3 METHODOLOGICAL REFLECTIONS
The study followed a secondary analysis research method that is designed to be
conducted in a feasible timeframe and one that would be suitable to answer the
research questions. The performance between English and isiXhosa achievement
in ‘The Lonely Giraffe’ was presented in percentage scores instead of points as in
the original study because percentages are widely understood, even by people with
little or no statistical knowledge. The software selected for the data analysis was
RUMM2030, on the basis that it is the most accessible to analyse the IRT and DIF.
After discussion with teachers and identification of the strong themes that appeared
in the translations, maybe more teachers could have been consulted to examine the
item translation as mean of quality assurance or to conduct crosschecks. However,
the purpose of the study was not to retranslate the items but simply to identify any
item DIF and possibly explain the DIF as possible source of translation bias.
6.4 LIMATATIONS OF THE STUDY
The limitation of the study is that only one passage out of eight possible ones was
explored. This is mainly because the IEA only released four prePIRLS 2011
passages into the public domain, and of these ‘The Lonely Giraffe’ has a context
and plot that are mostly familiar to learners in South Africa. The bushveld settings,
animals, such as the bird, lion, elephant and giraffe, are all common animals to
which learners would be able to relate.
The second limitation of the study is the choice of languages examined. IsiXhosa
was a more convenient language choice, as the researcher is an isiXhosa mother
tongue speaker. Also, it is the second most widely spoken language in South Africa
yet performed below average in the prePIRLS 2011 study. English is used as a point
of comparison mainly because the passage was developed in English and no
translation procedures were applied to the English assessment (apart from national
adaptations from US English to UK English). Since the aim of the study was to
explore any translation bias in the prePIRLS passages it was perceptible that the
English passage would be comparable to the translated isiXhosa passage.

104
The last identified limitation of the study is the number of respondents interviewed
for the translation and dialect phase of the study. Only three teachers were identified
to examine the translation and provide any feedback, because they were
conveniently available and more would have meant a more elaborate analysis.
6.5 RECOMMENDATIONS
In light of the results discussion, only three items of ‘The Lonely Giraffe’ prePIRLS
2011 passage showed some evidence of DIF. On the one hand, despite the DIF, it
is still a minority of the items and therefore it is not sufficient in this case to explain
differences in learner performance between English and isiXhosa sub-groups by
means of DIF. It is recommended that as cross-cultural assessment increases,
studies should insist on implementing strict translation guidelines as those used in
the IEA studies. Such practises affect issues of validity as well as aid in minimising
sources of test bias.
On the other hand, the teacher’s responses to the item were concerning. According
to the responses, a dominating theme was found in the discrepancies in teaching
isiXhosa HL in the three teacher’s classrooms. Every teacher has his or her own
teaching method, and different ways of teaching the same content. In this study, the
three teachers from the different dialect areas often taught isiXhosa in their dialects.
We may consider this as a code-switching strategy within the language (as opposed
to switching between different languages). However, vocabulary and orthography
of dialect and standard isiXhosa often differ. Further, if teachers are going to apply
dialect language principles in isiXhosa this could potentially create confusion for the
learners. Until now, the possible role of dialects have largely been unexplored and
while discussions on code switching and translanguaging exist, the dialectic
differences within a language should be explored. A second recommendation is
therefore for further work to be done on dialect use within the same language as
part of teachers’ classroom practice. Building on this study’s observation an
interesting follow-up study would be to explore the teacher’s content knowledge in
early reading literacy across different African languages.
In conclusion, the crucial factor in academic performance is that it goes hand-in-
hand with language proficiency (Cummins, 2001). Furthermore, in a country such

105
as South Africa, with a multilingual society, language proficiency not only requires
fluency in English but also strong foundation skills in African HL. This means good
early literacy foundation skills to enable easier acquisition of any additional
languages (Cummins, 2001, Pretorius 2014), a premise of the current Language in
Education Policy. As noted in Chapter 3, African languages consistenly perform
lower than English and Afrikaans in literacy assessments such as the prePIRLS
2011, SACMEQ 2007 and the ANAs. Inevitably, this means that if learners struggle
with their HL, their acquisition of English as LoLT is also at risk. English is used as
LoLT from Grades 4 to 12 as well as in tertiary education and dominates the
workplace.
The policy intention of the Language in Education policy is to give recognition to 11
official languages in Foundation Phase in order for learners to learn from a strong
mother-tongue base. This policy issue means that large-scale assessment in
primary schooling has to take place across all 11 official languages. At the
implemented level, the current study found that translations in at least two
languages are valid; therefore performance at the attained level should be an
accurate reflection of learners’ abilities. However, reliance on translations as valid
method of assessing a multi-lingual population means that strict translation and
quality assurance procedures have to be in place. Thus, the main conclusion from
the findings of the study suggests that strict translation guidelines, as followed by
the IEA, indicate very little error for test translation bias. With the availability of data
from such studies, results can be used to re-evaluate the teaching of African
languages, in particular in the early grades. Additionally, teaching in African
languages has its challenges (Murray, 2011), which necessitate the further use of
data to train African language teachers in crucial early literacy skills and how to
teach it in early grades.

106
LIST OF REFERENCE
Alberts, M. & Mollema, N. (2013). Developing legal terminology in African
Languages as aid to the Court Interpreter: A South African perspective. Lexikos
Journals, 23, 29-58.
Alexandra, A. (2003). Language Education Policy, National and Sub-National
Identities in South Africa. Council of Europe: Stratburg.
Andrich, D., & Luo, G. (2003). Conditional pairwise estimation in the Rasch model
for ordered response categories using principal components. Journal of applied
measurement, 4(3), 205-221.
Arffman, I. (2013). Problems and issues in translating international educational
achievement tests. Educational Measurement: Issues and Practice. 32(2), 2 – 14.
Au, W. (2007). High-stakes testing and curricular control: A qualitative
metasynthesis. Educational Researcher, 36(5), 258-267.
Baker, D. A., & Crompton, J. L. (2000). Quality, satisfaction and behavioral
intentions. Annals of tourism research, 27(3), 785-804.
Baker, L., & Beall, L. C. (2009). 17 Metacognitive Processes and Reading
Comprehension. Handbook of research on reading comprehension, 373.
Banda, F. 2004. Literacy practices in black and coloured communities in South
Africa: Towards a pedagogy of multiliteracies. In M.J. Muthwii and A.N. Kioko (eds).
New language bearings in Africa. Clevedon: Multilingual Matters, 10-33.
Beauford, J.E., Nagashima, Y.N., & Wu M. (2009). Using translated instruments in
research. Journal of College Teaching & Learning, 6(5), 77-82.
Bekker, I. (2003). Using historical data to explain language attitudes: A South
African case study. Africa and Applied Linguistics, (Eds) Makoni, S. and U Meinhof.
AILA Review, Volume 16, 62-77.
Binkley, M., Rust, K., & Winglee, M. (Eds.). (1995). Methodological issues in
comparative educational studies: The case of the IEA Reading Literacy Study.
Washington, DC: NCES

107
Brook Napier, D. (2011). Critical issues in language and education planning in
twenty first century in South Africa. US-China Education Review,1. 58-76.
Cambridge, U. O. (1998). Studies in Language Testing: Multilingual glossary of
language testing terms. Cambridge: University Press.
Cele,N. (2004). Equity of access and equity of outcomes challenged by language
policy, politics and practice in South African higher education: the myth of language
equality in education. South African Journal of Higher Education, 18(1), 38-56.
Census 2011 Statistical release [Online]. Available:
www.statssa.gov.za/census2011/product/census 2011 in brief.pdf. [2016, January
29]
Chall, J. S. (1983). Literacy: trends and explanations. Educational
Researcher, 12(9), 3-8.
Chick, J.K. (2002). Constructing a multicultural national identity: South African
classrooms as sites of struggle between Competing Discourses. Journal of
Multilingual and Multicultural Development, (23) 6, 462-478.
Chisholm, L. The Politics of Curriculum Review and Revision in South Africa. Paper
presented at the Oxford International Conference on Education and Development,
9-11 September 2003.
Cohen, J. (1988). Statistical power analysis for the behavioral sciences (2nd ed).
Hillsdale, NJ: Erlbaum.
Creswell, J. (2008). Educational research: Planning, conducting and evaluating
quantitative and qualitative research (1st ed., Pearson new international ed.).
Harlow, Essex: Pearson.
Cummins, J. (2001). Instructional conditions for trilingual development. International
Journal of Bilingual Education and Bilingualism, 4(1), 61-75.
Cummins, J. (2008). BICS and CALP: Empirical and Theoretical Status of the
Distinction. In: Street, B. & Hornberger, N. H. (Eds.). (2008). Encyclopedia of
Language and Education, 2nd Edition, Volume 2: Literacy. (pp. 71-83). New York:
Springer Science + Business Media LLC.

108
De Witt, M. W., Lessing, A. C., & Lenayi, E. M. (2008). An investigation into the state
of early literacy of preschool learners. Journal for Language Teaching, 42(1), 38-
47.
Department of Arts and Culture (DAC). (2008). Catalogue of South African
children’s literature. Pretoria: Department of Arts and Culture.
Department of Basic Education. (2007). Status of the Language of Learning and
Teaching (LoLT) in South African public schools. Pretoria, South Africa: Author
Department of Basic Education. (2011). National Curriculum Statement Grades R –
12. Government Gazette No. 34600, Vol. 555. Pretoria, South Africa: Author
Department of Basic Education. (2012). Curriculum and Assessment Policy
Statement Gr R-12. Pretoria. Retrieved from http://www.education.gov.za
Department of Basic Education. (2012). Diagnostic Report of the Annual National
assessment. Retrieved from http://www.education.gov.za.
Department of Basic Education. (2013). Report on the Annual National assessment
2013. Retrieved from http://www.education.gov.za.
Department of Education. (1997). Language in Education Policy. December 19.
Government Gazette No 18887. Pretoria, South Africa: Author
Department of Education. (2002). Whole School Evaluation (WSE). Pretoria,
Department of Education
Department of Education. (2003). Grade 3 Foundation Phase Systemic Evaluation
Report. Pretoria. Retrieved from http://www.education.gov.za.
Desai, Z. (1994). Praat or speak but don’t thetha: On language rights in South Africa.
Language and Education, 8(12),19-29.
Du Plessis, E. (2013). Introduction to CAPS. Curriculum & Instructional Studies:
UNISA.
Duke, R. E., Bryson, S., Hammer, L. D., & Agras, W. S. (2004). The relationship
between parental factors at infancy and parent-reported control over children's
eating at age 7. Appetite, 43(3), 247-252.

109
Dwyer, P.M. (2008). Beyond Bean Counting: Creating Departmental Assessment
that is Manageable and Meaningful. Presentation at Kutztown University
Assessment Symposium, 17 April 2008
Edwards, V & Ngwaru. (2011). African language publishing for children in South
africa: challenges for translators. International Journal of bilingual education and
Biligualism, 14(5). 589 -602
Edwards,V & Ngwaru, J.M. (2011). African language publishing for children in South
African: challenges for translators. International Journal of Bilingual Education and
Bilingualism, 14(5) 589-602.
EFA Global Monitoring Report. (2011). The hidden crisis: Armed conflict and
education. Paris: UNESCO
Ercikan, K. (2002). Disentangling sources of differential item functioning in multi-
language assessments. International Journal of Testing, 2,199 – 215.
Ercikan, K., Gierl, M.J., McCreith, T., Puhan, G., & Koh,K. (2004). Comparability of
bilingual versions of assessments: Sources of incomparability of English and French
versions of Canda’s national achievement tests. Applied Measurement in
Education, 17, 301 – 321.
Foley, A. (2004). Language policy for higher education in South Africa: implications
and complications. South African Journal of Higher Education, 18(1), 57-71.
Foy, P., Brossman, B & Galia, J. (2011). Scaling the TIMSS and PIRLS 2011
Achievement Data: Methods and Procedures. Boston: TIMMS & PIRLS
International Study Center Lynch School of Education: Boston College.
Gierl, M. J., & Khaliq, S. N. (2001). Identifying sources of differential Item and bundle
functioning on translated achievement tests: A confirmatory analysis. Journal of
Educational Measurement, 164-187.
Goh. D.S. (2004). Assessment Accommodations for Diverse Learners. Boston:
Pearson Education Inc.
Granville, S., Janks, H., Mphahlele, M., Reed, Y., Watson, P., Joseph, M., &
Ramani, E. (2010). English With or Without G(u)ilt: A position paper on Language

110
in education policy For South Africa. Journal of Language and Education, 12(4),
254-272.
Grisay, A. (2003). Translation procedures in OECD/PISA 2000 international
assessment. Language Testing, 20. 225-240.
Gxilishe, D.S. 1996. The dilemma of dialect in the classroom: A case for Xhosa.
Per Linguam Journals. Download:
perlinguam.journals.ac.za/pub/article/download/208/318 Date: 8 July 2015.
Hambleton, R.K & Kanjee, A. (1993). Enhancing the validity of cross-cultural
studies: Improvements instruments translation methods. Paper presented at the
Annual Meeting of the American Education Research Association (Atlanta, GA. April
13-15, 1993).
Heugh, K. (1996). The Case Against Bilingual and Multilingual Education in South
Africa. PREASA – Occasional Papers, 6.
Heugh,K. (2006). Financing mother tongue and bilingual education. In optimizing
learning and education in Sub-Saharan Africa, ed. H. Alidou, A. Boly B. Brock-Utne,
Y.S. Diallo, K. Heugh and H.E. Wolff (2006). Available from http://wwwadeanet,org
(accessed May 11, 2016).
Heugh. K. (2007). Language and literacy issues in South Africa. In Global issues in
languages and development: Perspectives from postcolonial languages, ed. N.
Rassool, 187-217.Clevedon: Multilingual Matters.
Howie, S., Venter, E., van Staden & Howie, S., Zimmerman, L., C., du Toit.,
Scherman, V. & Archer, E. (2008). PIRLS 2006 Summary Report: South African
Children’s Reading Literacy Achievement: Pretoria: CEA
Howie, S.J, van Staden & Howie, S, Tshele, M, Dowse, C. & Zimmerman, L. (2012).
South African Children’s Reading Literacy Achievement Summary Report. Pretoria:
Centre for Evaluation and Assessment.
Jansen, J. & Taylor, N. (2003). Educational change in South Africa 1994-2003: Case
Studies in Large scale Education Reform. Country Studies Education Reform and
Management Publication Series, 2(1).

111
Joncas M, Foy P. (2010). Sample Design in TIMSS and PIRLS. [Internet].
Downloaded on 15 June 2015. Available: http://timssandpirls.bc.edu/methods/t-
sample-design.htm
Jones, F. (1995). Learning an alien lexicon: A teach-yourself case study. Second
Language Research, 11(2), 95-111.
Kamens, D.H & McNeely, C.L. (2010). Globalization and the growth of International
educational testing and national assessment. Comparative Education Review. 54
(1). 5-25
Kamwangamalu, N. M. (2010). Multilingualism and codeswitching in
education. Sociolinguistics and language education, 116.
Kamwangamalu, N.M. (2010). The Language planning situation in South Africa.
Current Issues in Language Planning. pp 361 – 445. Routledge: London.
Kucer, S.B (2009) Dimensions of Literacy. New York: Routledge
Lodge, R. A. (1995). French; from dialect to standard. London: Routledge
Loest, V., Britz, R., & Pauw, H. (1997). The acquisition of Xhosa : An ethnolinguistic
study. South African Journal of Ethnology, 20(4), 180-190.
Malak, B & Trong, K.L. (2007). Translation and translation verification of the PIRLS
reading assessment and questionnaires. In M.O Martin, I.V.S. Mullis & A.M.
Kennedy (Eds.), PIRLS 2006 technical report, (pp.49-60). Chestnut Hill: Boston
College.
Maneesriwongual, W., & Dixon, J.K. (2004). Instrument translation process: A
methods review. Journal of Advance Nursing, 26(5), 820 -826.
Maree, K. (Ed.). (2013). First steps in research (First edition. ed.). Pretoria: Van
Schaik.
Mason, T.C. (2005). Cross-cultural instruments translation: Assessment,
translation, and statistical application. American Annal of the Deaf, 150 (1), 67-72.
Mayer, Philip. (1971). Townsmen and tribesmen: conservatism and the process of
urbanization in a South African city. Cape Town: Oxford University Press.

112
McCaston, M.J. (2005). Advisor June 2005. Updated from M.Katherine McCaston
(1998)Partnership & Household Livelihood Security Unit. Tips for Collecting,
Reviewing, and Analyzing Secondary Data. CARE
Mesthrie, R. (1998). Words across worlds: Aspects of language contact and
language learning in the eastern cape, 1800-1850. African Studies, 57(1), 5-26.
Mncwango, E.M. (2012). The stuttering implementation of language policies in the
South African. Journal of Human and Social Sciences, 4(1), 58-62
Moloi, M., & Chetty, M. (2007). The SACMEQ III project in South Africa: a study of
the conditions of schooling and the quality of education. Paris, France: SACMEQ.
Moropa, K. & Kruger, A. (2000). Mistranslation of culture-specific terms in Kropf;s
Kafir-English Dictionary. South African Journal of African Languages, 20(1), 70-79.
Moyo, T. (2002). The Role of English in Education and in Multilingual South Africa.
In SATESOL Proceedings of the Fourth National Conference. University of the
North, 5-7 August, 92 -101.
Mtuze, P.T. (1992). A Critical Survey of Xhosa Lexicography 1772-1989. Lexikos,
2,165-177.
Mullis, I. V. S., Martin, M. O., Kennedy, A., & Foy P. (2007). PIRLS 2006
international report: IEA’s Progress in International Reading Literacy Study in
primary schools in 40 countries. Chestnut Hill, MA: TIMSS & PIRLS International
Study Center, Boston College.
Mullis IVS, Martin MO, Kennedy AM, Trong KL & Sainsbury M. (2009). PIRLS 2011
Assessment framework. Boston College: TIMSS and PIRLS International Study
Center.
Mullis, I.V.S., Martin, M. O., Foy, P. & Drucker, K.T.(2012). PIRLS 2011 International
Results in Reading. Boston: TIMSS & PIRLS International Study Center Lynch
School of Education: Boston College.
National Education Evaluation & Development Unit. (2013). National Report 2012:
The state of literacy teaching and learning in the Foundation Phase.

113
National Educational Policy Investigation. (1992). Language-report of the NEPI
Committee. Cape Town: Oxford University Press/NECC
Nkomo, D. & Wababa, Z. (2013). IsisXhosa Lexicograpgy: Past, Present and
Future. Paper presented at the Eighteenth International Association of African
Lexicography (Afrilex). Nelson Mandela Metropolitan University, Port Elizabeth, 2-5
July 2013.
Nkondo, C. (n.d) Comparison of the syllabus of the Bantu Education Department
with that of the Transvaal Education Department and other related matters. 17-19
Nyamende, 1994. Regional Variation in Xhosa. Spil Plus (26):202-217
O’Byrne, W.I, & Smith, S.A. (2015). Multicultral education and multiliteracies:
exploration and exposure of literacy practises with preservice teachers. Journal of
Reading & Writing Quarterly,31(2), 168-184.
OECD. (2005). Contextual Framework for PISA 2006 (draft Version). London:
OECD.
Pahl, H.W et al. (1989). The Greater Dictionary of Xhosa: English-Xhosa-Afrikaans,
Xhosa-English-Afrikaans. Johannesburg: Educum Publishers.
Palomba, A & Banta T.W. (1999). Assessments Essentials: Planning,
Implementing, and Improving Assessment in Higher Education. San Francisco:
Jossey Bass.
Peires, J., Rhodes University. Institute of Social and Economic Research, & Nguni
Workshop Nguni Workshop (1979 : Rhodes University). (1981). Before and after
shaka : Papers in nguni history. Grahamstown, South Africa: Institute of Social and
Economic Research, Rhodes University
Pena, E.D. (2007). Lost in translation: methodological considerations in cross-
cultural research. Child Development. 78(4). 1255-1264.
Perry, K. H. (2012). What Is literacy? A critical overview of sociocultural
perspectives. Journal of Language and Literacy Education, 8(1), 50-71.

114
Poulos, G., & Msimang, C. (1998). A linguistic analysis of zulu (1st ed. ed.). Pretoria:
Via Afrika.
Prah, K. (2009). Home language education in African for emancipation and
development: Towards the intellectualization of African languages. In Languages
and education in Africa: A comparative and transdisciplinary analysis, ed. B. Brock
–Utne and i. Skattum, 83-104. Oxford: Symposium Books.
Pretorius, E.J. (2014). Supporting transition or playing catch – up in Grade 4?
Implications for standards in education and training. Perspectives in Education.
32(10) 51 -75).
Prinsloo, M. (2011). The odd couple: Diverging paths in language policy and
educational practices. Perspectives in Education, 29(4), 1–9.
Probyn, M. (2001). Teacher voices: Teachers reflections on learning and teaching
through the medium of English as an additional language in South African.
International Journal of Educational and Bilingualism, 12(2), 123 -136.
Probyn, M. (2009). ‘Smuggling the vernacular into the classroom’: conflicts and
tensions in classroom codeswitching in township/rural schools in South Africa.
International Journal of Bilingual Education and Bilingualism, 4(4), 249-266.
Probyn, M., Murray, S., Botha, L., Botya, P., Brooks, M., & Westphal, V. (2002)
Minding the gaps – an investigating into language policy and practice in four Eastern
Cape district. Perspective in Education. 20(1), 29 – 46.
Republic of South Africa. (1953). Bantu Education Act, Act No. 47 of 1953.
Government Printing.
Republic of South Africa. (1996). South African Schools Act, No 84 of 1996.
Government Printing Pretoria.
Retrieved: https://www.datafirst.uct.ac.za/dataportal/index.php/catalog/251
Rice, D.C., Pappamihiel, N.E., & Lake, V.E. (2004). Lesson Adaptation and
Accommodation: Working with native speakers and English language students in
the same Science classroom. Childhood Education,121-127.

115
Rogler,L.H. (1999). Methodological sources of cultural insensitivity in mental health
research. American Psychologist. 54, 424-433.
Sattarpour, S., & Ajideh, P. (2014). Investigating the relatedness of Cloze-Elide test,
Multiple-Choice Cloze Test, and C-test as Measures of Reading
Comprehension. Journal of English Language Teaching and Learning, 6(13), 89-
112.
Sayed, Y., & Ahmed, R. (2011). Education quality in post‐apartheid South African
policy: balancing equity, diversity, rights and participation. Comparative
Education, 47(1), 103-118.
Sheperd, E & Godwin, J. (2004). Assessment through the Learning Process. White
paper: Questionmark Corporation.Shohamy, E. (2001). Fairness in language
testing. In: Elder, C., Brown, A,. Grove, E., Hill, K., Iwashita, N., Lumley, T.,
McNamara, T. & O’Loughlin, K. (eds) Experimental with uncertainty: Essays in
honour of Alan Davis. Cambridge University Press: pp 15 -19.
Sireci,S.G., & Berberoglu,G. (2000). Using bilingual respondents to evaluate
translated-adapted items. Applied Measurement in Education. 13, 229 – 248.
Smith, R. M. (2004). Detecting item bias with Rasch Model. In E. V. Smith, & R. M.
Smith, Introduction to Rasch Measurement, 391-418. Maple Grove: JAM Press.
Solano-Flores, G., Backhoff, E., & Contreras-Nino, L.A. (2009). Theory of Test
Translation Error. International Journal of Testing, 9, 78-91.Stubbe, T.C. (2011).
How do different versions of a test instrument function in a single language? A DIF
analysis of the PIRLS 2006 German assessments. Educational Research and
Evaluation. pp 465-481.
SØrensen, H.T., Sabroe, S. Olsen, J. (1996). A framework for evaluation of
secondary data source for epidemiological research. International Journal of
Epidemiology, 25(2), 435-442.
Sperber, A. D., Devellis, R. F., & Boehlecke, B. (1994). Cross-cultural translation:
methodology and validation. Journal of cross-cultural psychology, 25(4), 501-524.

116
Stubbe,T.C. (2010). How do different versions of a test instrument function in a
single language? A DIF analysis of the PIRLS 2006 German assessments.
Educational Research and Evaluation. pp 465-481.
The Republic of South Africa. (1996). The Constitution of the South Africa Act 108
of 1996. Pretoria: Government Printer.
Transvaal Education of Department. (1970). Teachers’ Guide: Bantu Education
Department. Government Printing.
Tshotsho, B.P. (2013). Mother tongue debate and language policy in South Africa.
International Journal of Humanities and Social Science, 3(3), 39-44.
UNESCO. (1953). The Use of Vernacular Languages in Education. Paris:
UNESCO.
UNESCO. (2007). Education for all Global Monitoring Report: Strong foundations.
Paris: UNESCO.
Union of South Africa Office of Census and Statistics. (1960). South Africa Census 1960. South Africa: Author.
Van der Veer, K., Ommundsen, R., Hak, T., & Larsen, K.S. (2003). Meaning shift of
items in different language versions. A cross-national validation study of the Illegal
Aliens Scale. Quality & Quantity: International Journal of Methodology. 37, 193 –
206.
Van Staden & Howie, S. & Bosker, R. (2014). Factors that affect South African
reading literacy achievement: evidence from prePIRLS 2011. South African Journal
of Education. 34 (3). pp 1-9.
Van Staden & Howie, S. & Howie, S.J. (2014). Exploring possible effects of
Differential Item Functioning on reading achievement across language sub-groups:
A South African perspective. Pretoria: University of Pretoria. This reference should
be to the conference presentation at the WERA conference in Edinburgh, November
2015.
Walvoord, B.E. (2004). Assessment Clear and Simple: A Practical Guide for
Institution, Departments and General Education. City: John Wiley & Sons.

117
Webb, V. (2013). African languages in post-1994 education in South Africa: our own
Titanic? Southern African Linguistic and Applies Languages Studies, 3(1), 173-184.
Willenberg, I. (2005). Starting at the beginning: Early childhood literacy intervention
as a strategy for reducing adult illiteracy. Language Matters: Studies in the
Languages of Southern Africa, 36(2), 162-175.
Wolf, R., Zahner, D., & Benjamin, R. (2015). Methodological challenges in
international comparative post-secondary assessment programs: lessons learned
and the road ahead. Studies in Higher Education. 40 (30), 471-481.
Wong Fillmore, L. (1986).Teaching bilingual learners. In M.C. Wittrock (ed.)
Handbook of Research on Teaching (pp. 648 -685). New York: Macmillan.
World Bank. (2007). World Development Report: Development and the Next
Generation. The World Bank: Washington DC.
Yu,K., & Dumisa, S. (2015). Community support- the missing link in indigenous
languages promotion in South Africa? Journal for Language Learning, 31(1), 60-73.
Zwaan, R. A., & Singer, M. (2003). Text comprehension. Handbook of discourse
processes, 83-121.
Related Documents


