Exploring Developmental Skills, Supports & Challenges with PFSS Schools Michael C. Rodriguez Campbell Leadership Chair in Education & Human Development March 21, 2017 Educational Psychology

Welcome message from author
This document is posted to help you gain knowledge. Please leave a comment to let me know what you think about it! Share it to your friends and learn new things together.
Transcript
Exploring Developmental Skills, Supports & Challenges
with PFSS Schools
Michael C. RodriguezCampbell Leadership Chair in Education & Human Development
March 21, 2017
Educational Psychology
http:/www.edmeasurement.net/PFSS.pdf
http:/www.edmeasurement.net/Sum.pdf

Minnesota Youth Development Research Group
Department of Educational Psychology Michael C. RodriguezCollege of Education & Human Development Campbell Leadership Chair
Anthony AlbanoOkan BulutJulio CabreraYu-Feng ChangCarlos ChavezRaul Guzman
Tahoe JungYoungsoon KangStacy KarlRik LammYukiko MaedaBrett Morrow
Kyle NickodemJose PalmaLuke StankeMartin Van BoekelKory VueAri Warshawsky
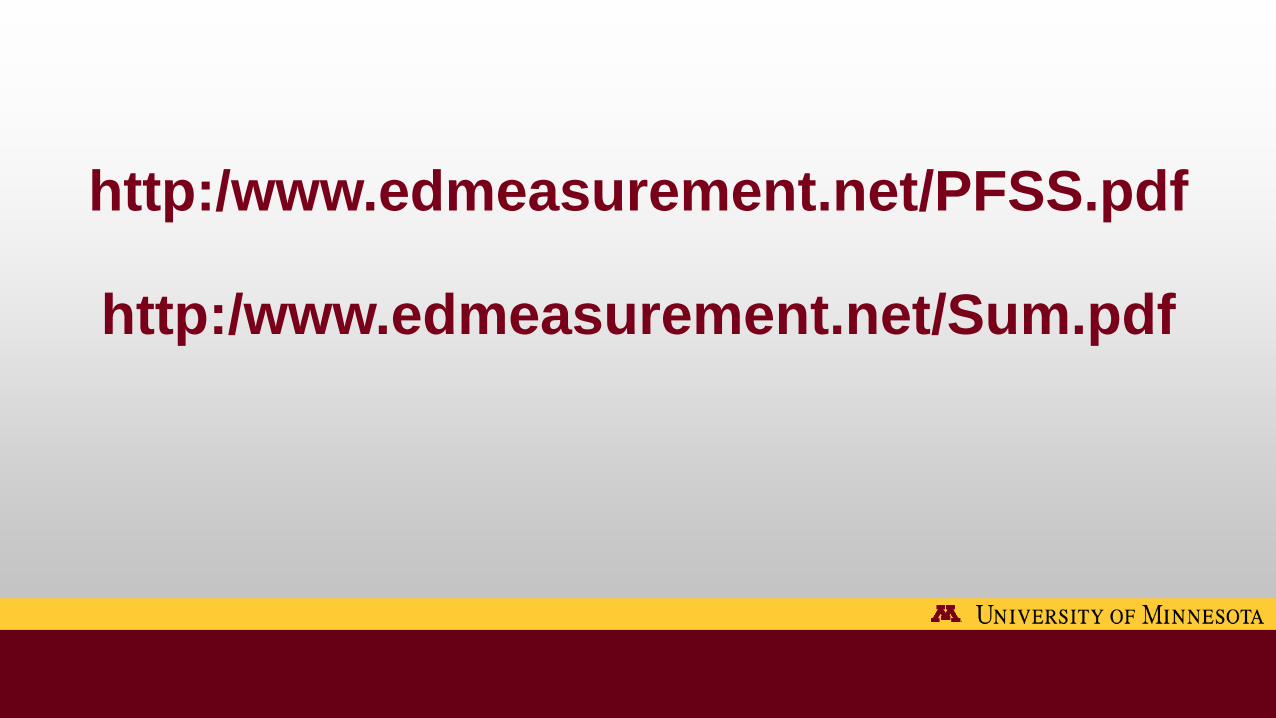
Minnesota Student Survey – Statewide
• Population “survey” of students in grades 5, 8, 9, 11• All 87 MN Counties• 1,218 schools in 309 school districts
• 162,034 students (84% of Districts) in 2013 • 168,733 students (85% of Districts) in 2016
• 37 Charter schools
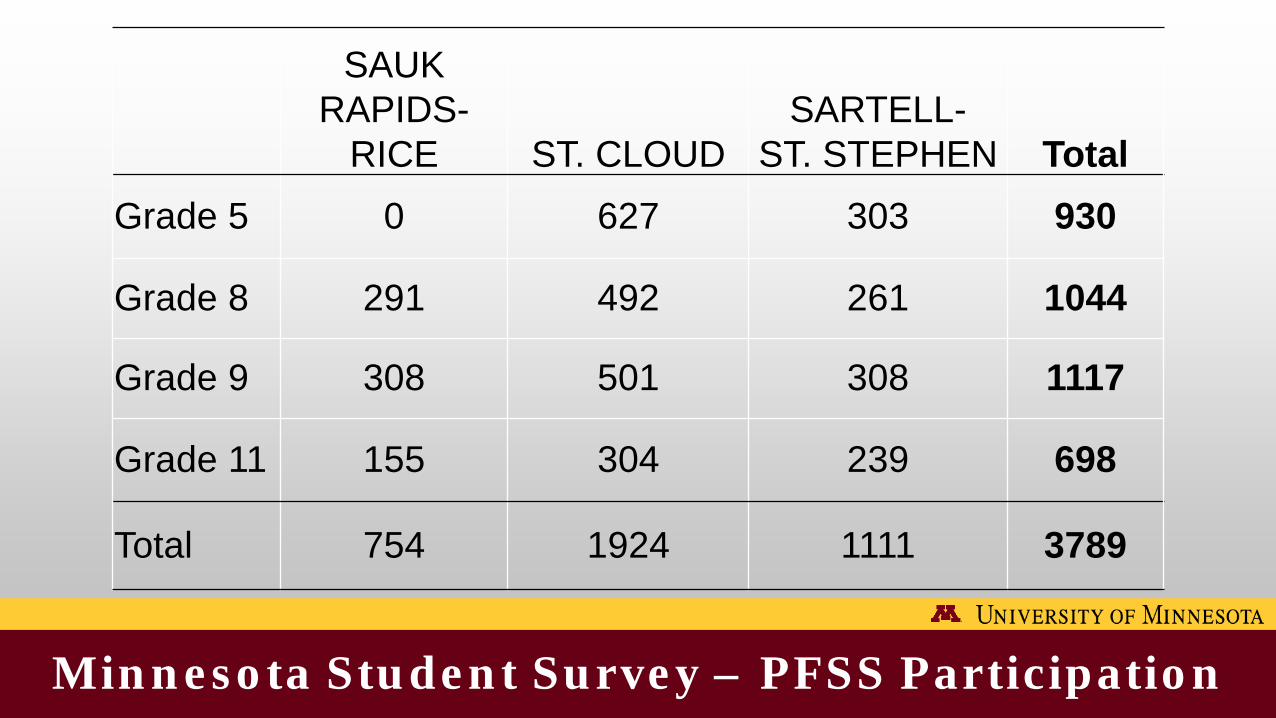
Minnesota Student Survey – PFSS Participation
SAUK RAPIDS-
RICE ST. CLOUDSARTELL-
ST. STEPHEN TotalGrade 5 0 627 303 930
Grade 8 291 492 261 1044
Grade 9 308 501 308 1117
Grade 11 155 304 239 698
Total 754 1924 1111 3789
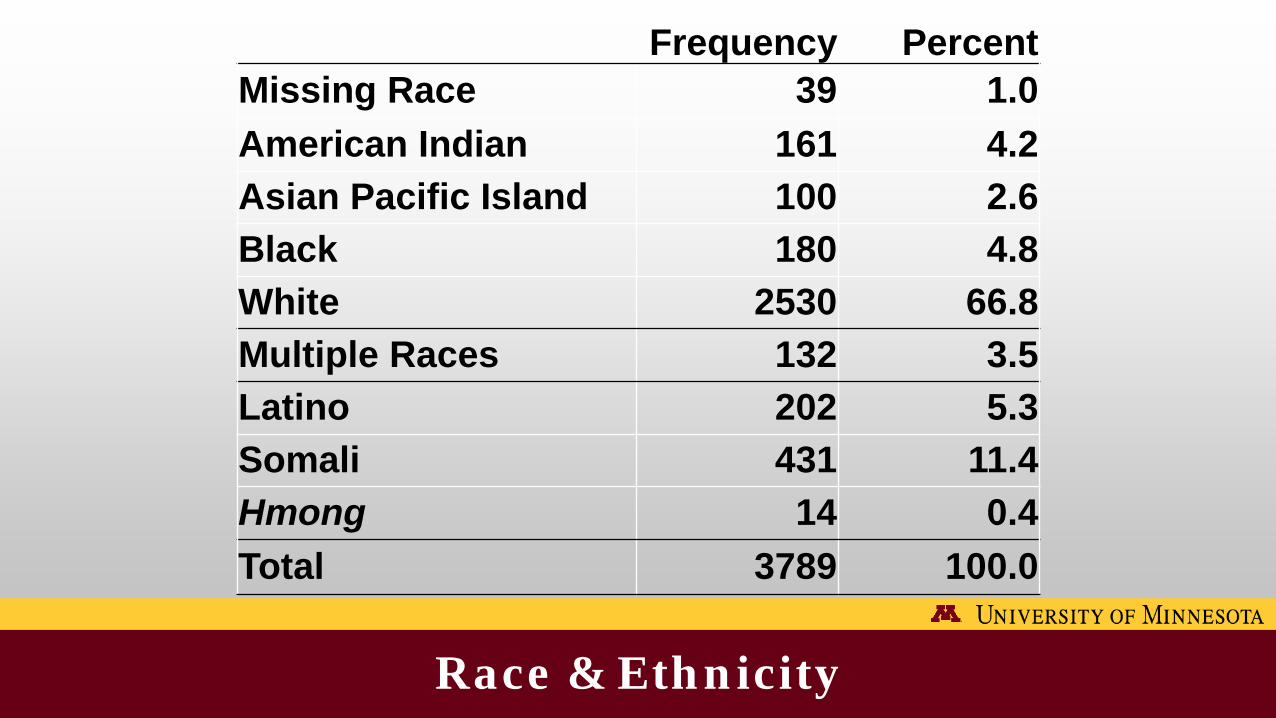
Race & Ethnicity
Frequency PercentMissing Race 39 1.0American Indian 161 4.2Asian Pacific Island 100 2.6Black 180 4.8White 2530 66.8Multiple Races 132 3.5Latino 202 5.3Somali 431 11.4Hmong 14 0.4Total 3789 100.0
Our Process
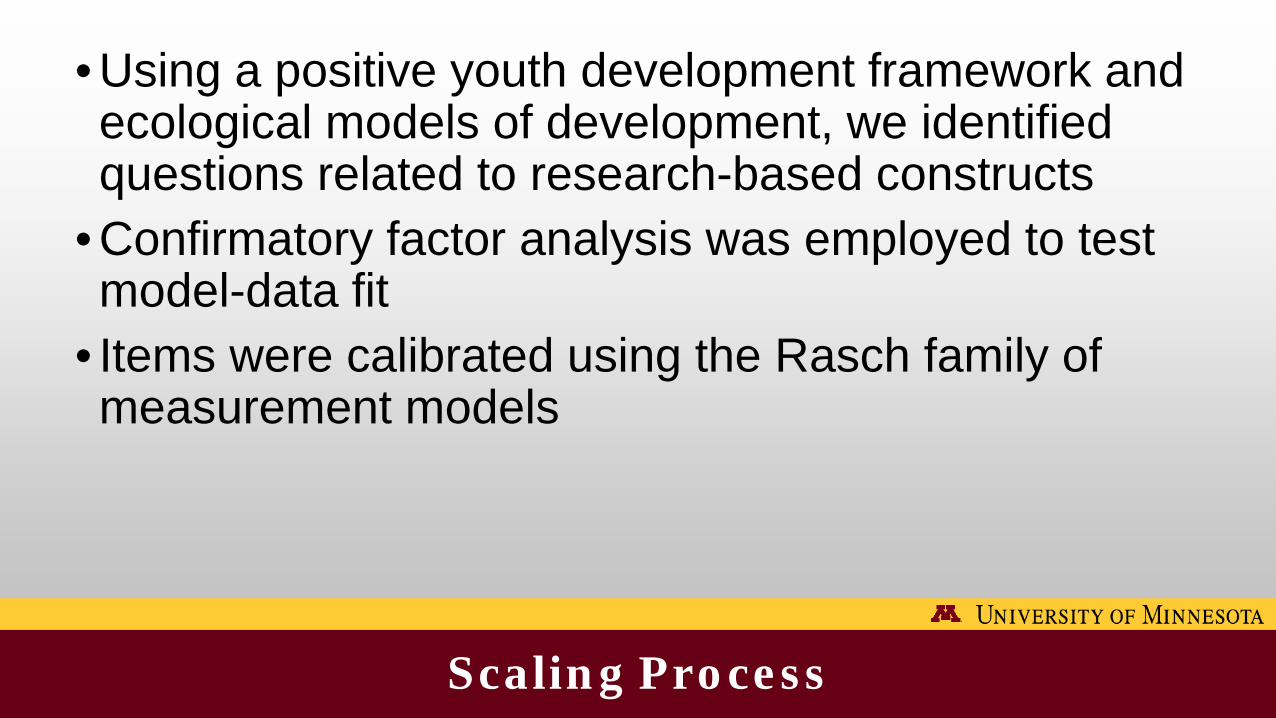
Scaling Process
• Using a positive youth development framework and ecological models of development, we identified questions related to research-based constructs
• Confirmatory factor analysis was employed to test model-data fit
• Items were calibrated using the Rasch family of measurement models
Understanding the Score Scale
• To support interpretation, the score scale was converted to a scale that generally ranges from a low of 5 to a high of 15.
• A score of 10 is the mid-point of the scale. It describes the point at which a development skill or support goes from weak to strong or negative to positive.
• A score of 10 indicates that the skill, support, or challenge is more true for a student than not
Our Current Efforts
Achieving educational equity and positive youth development requires us to explore context, to identify the many ways youth develop, to acknowledge and support youth where they are. This will be relevant to success in school success in families and communities positive youth programming equitable policy development
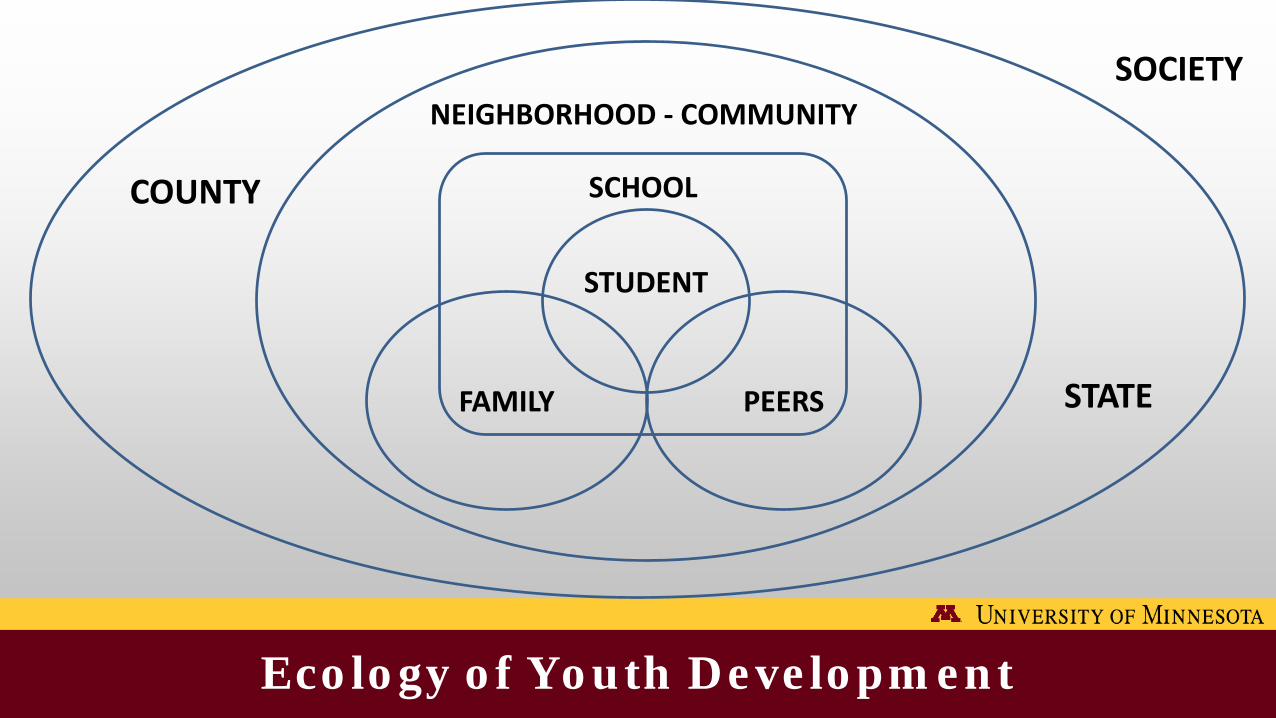
Ecology of Youth Development
PEERSFAMILY
STUDENT
SCHOOL
NEIGHBORHOOD - COMMUNITY
COUNTY
SOCIETY
STATE
Positive Youth Development
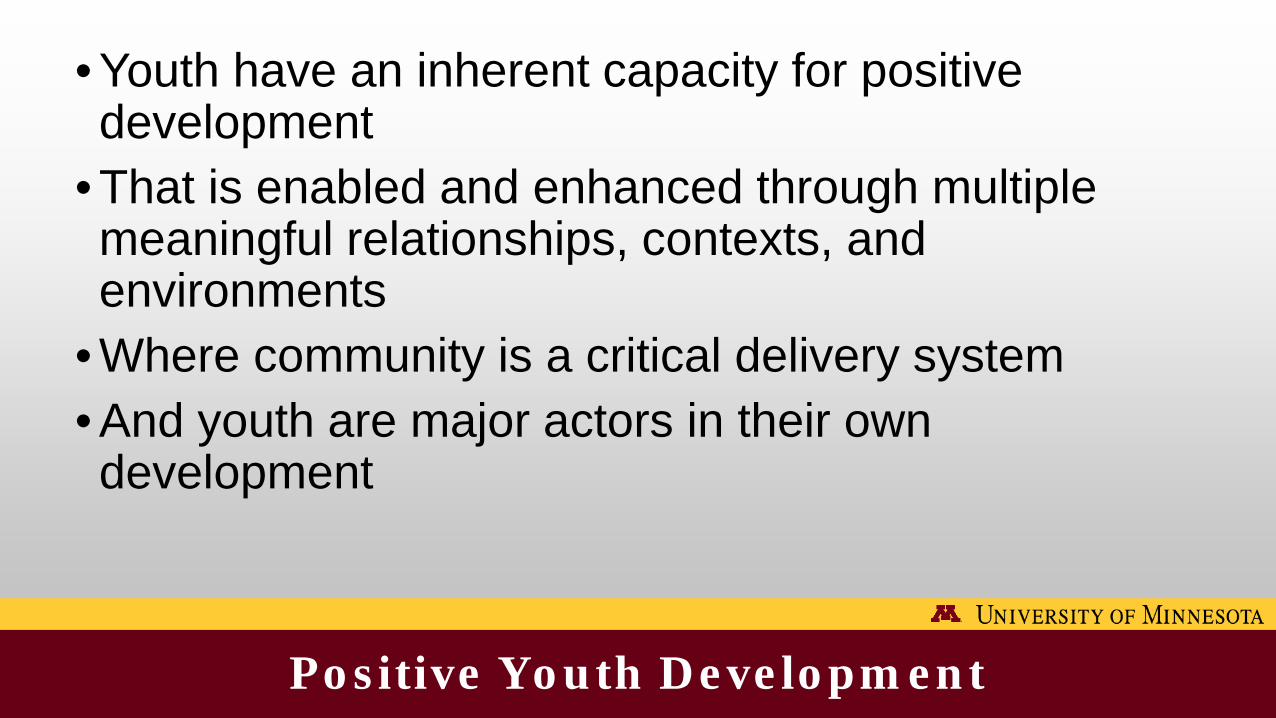
• Youth have an inherent capacity for positive development
• That is enabled and enhanced through multiple meaningful relationships, contexts, and environments
• Where community is a critical delivery system • And youth are major actors in their own development

Developmental Measures in 2013/16 MSS
Developmental Skills
Developmental Supports
Developmental Challenges
1. Commitment to Learning
1. Empowerment* 1. Bullied
2. Positive Identity*
2. Family/ CommunitySupport
2. Bullying
3. Social Competence*
3. Teacher/School Support
3. Mental Distress
*DAP 4. Family Violence
Learning about StudentsIn PFSS Schools
Averages give us an idea of the average level of Developmental Skills, Supports, and Challenges.
Distributions of these measures give us an idea of the variability in Skills, Supports, and Challenges.
With greater variability, the greater need to tailor our approaches to meet the wider range of needs.
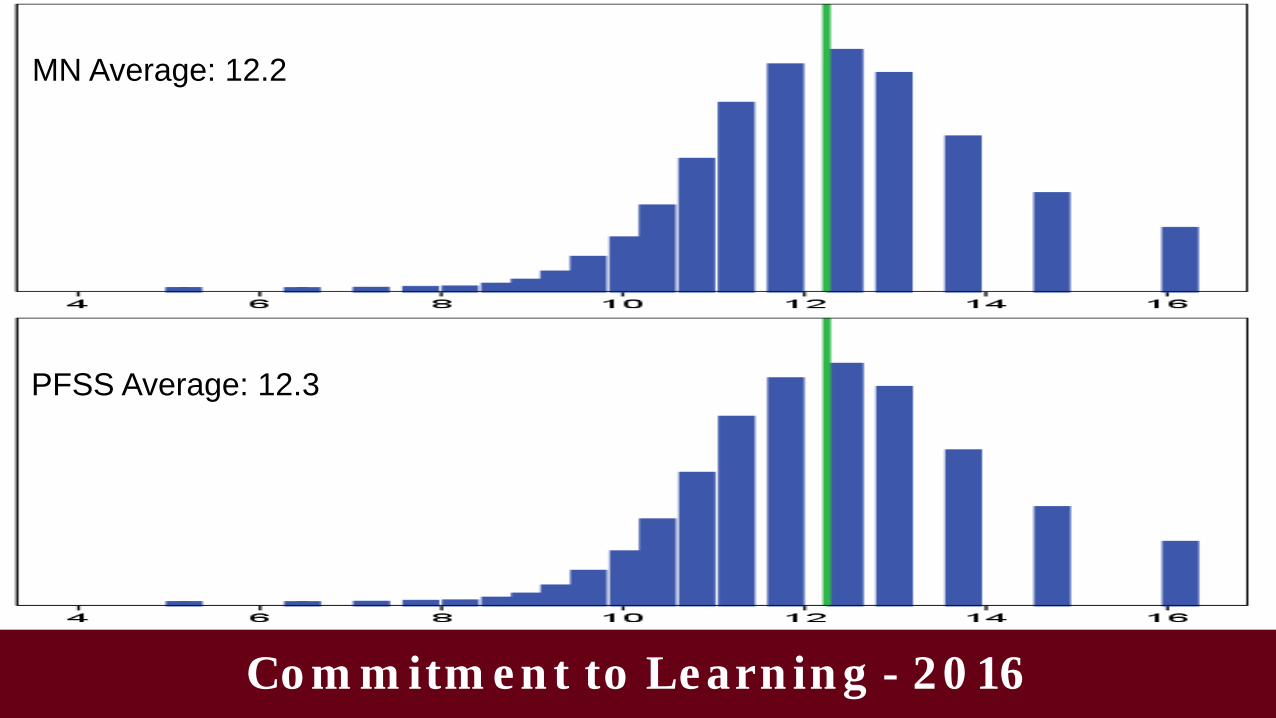
Commitment to Learning - 2016
MN Average: 12.2
PFSS Average: 12.3
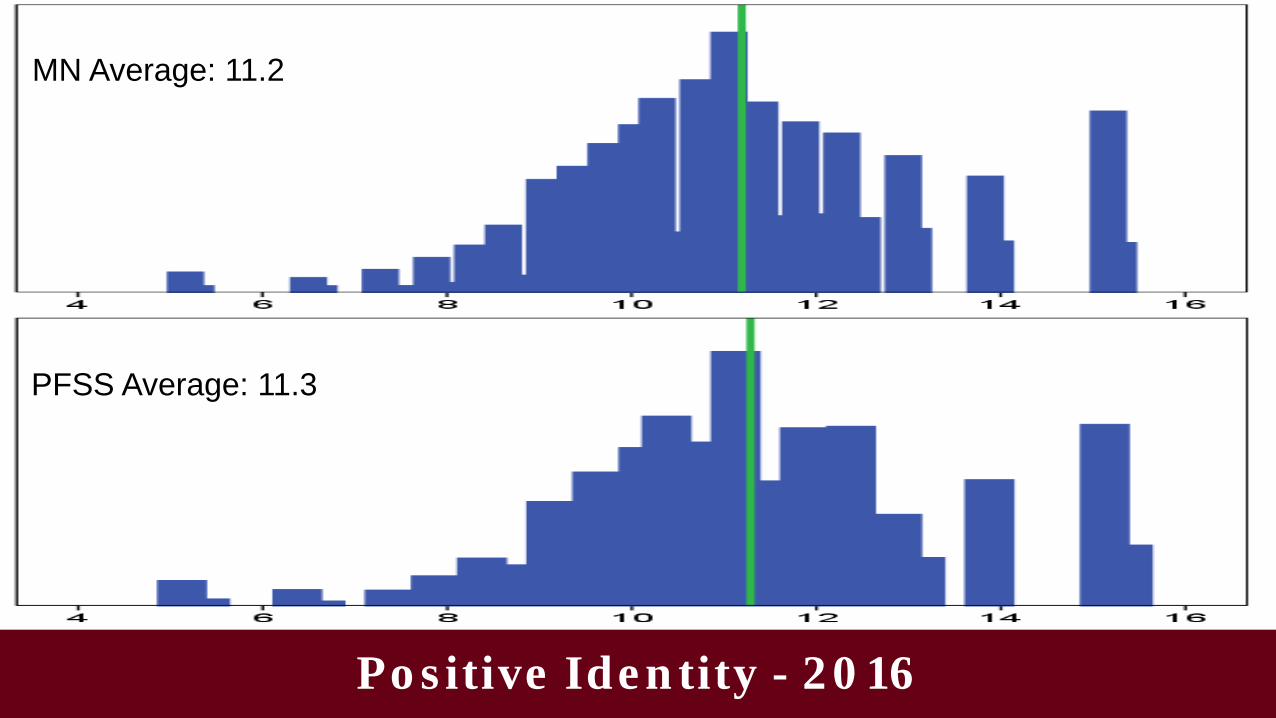
Positive Identity - 2016
MN Average: 11.2
PFSS Average: 11.3
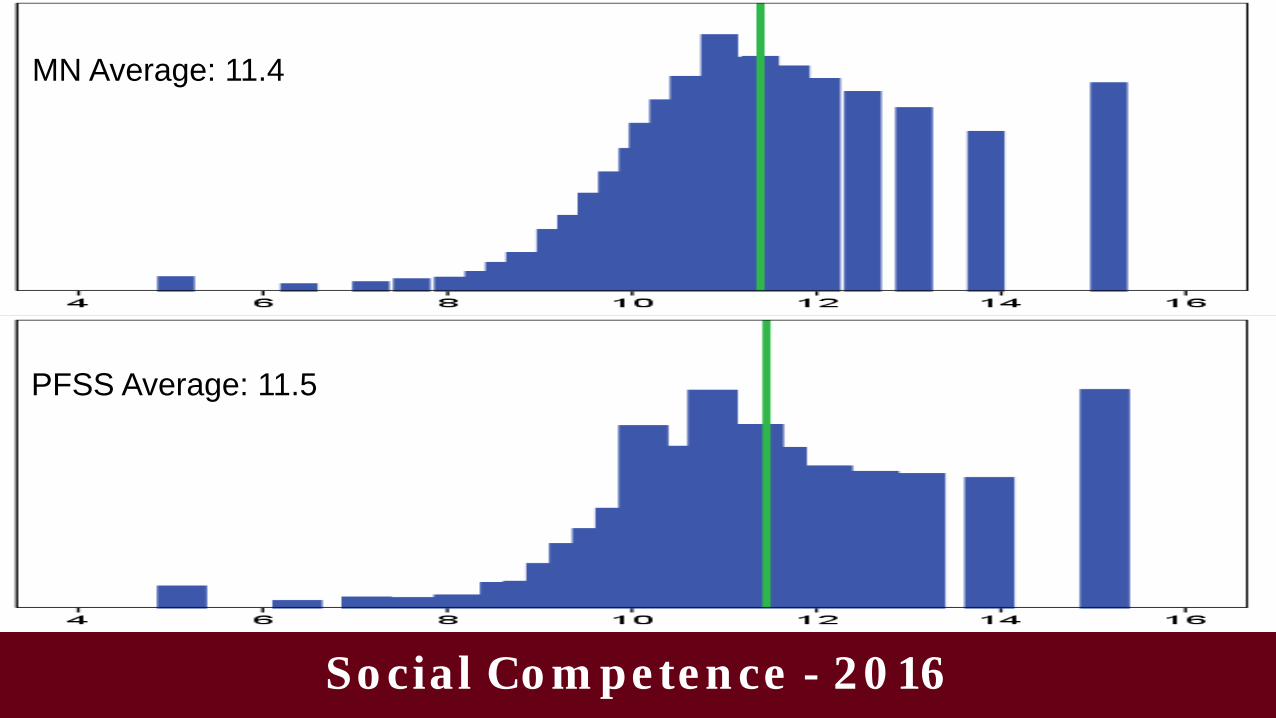
Social Competence - 2016
MN Average: 11.4
PFSS Average: 11.5
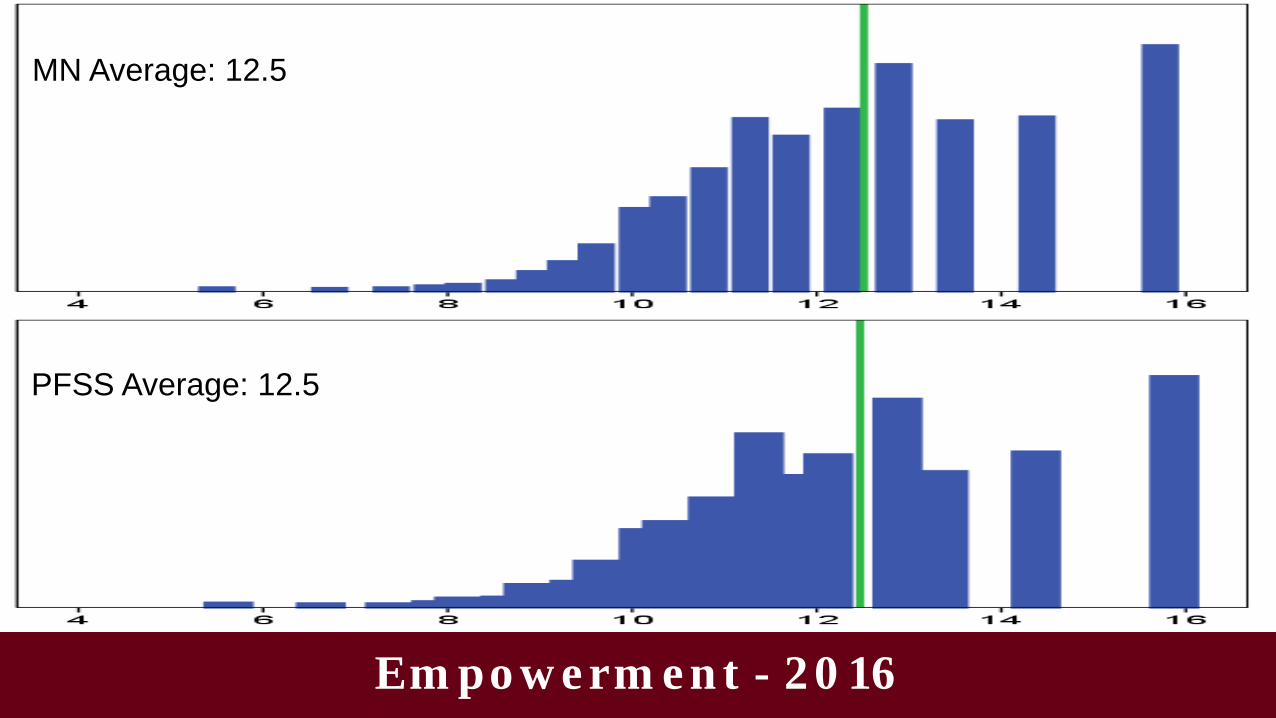
Empowerment - 2016
MN Average: 12.5
PFSS Average: 12.5

Family/Community Support - 2016
MN Average: 12.4
PFSS Average: 12.5
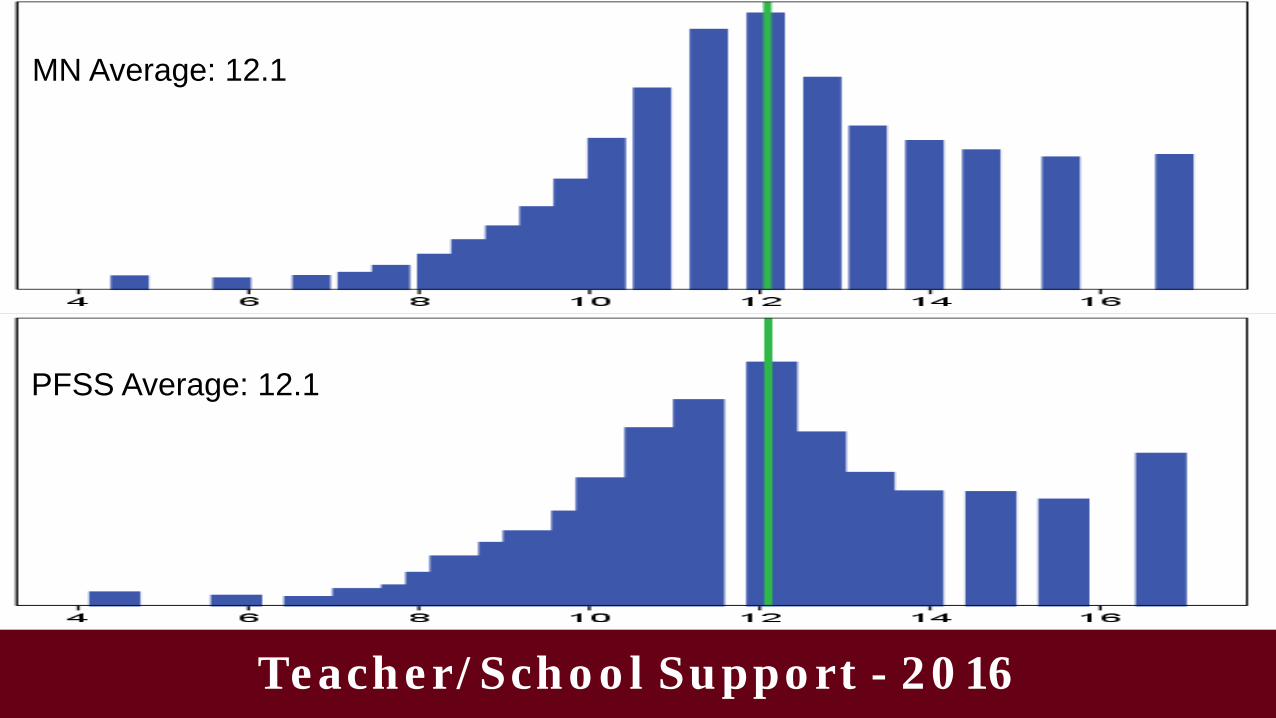
Teacher/School Support - 2016
MN Average: 12.1
PFSS Average: 12.1
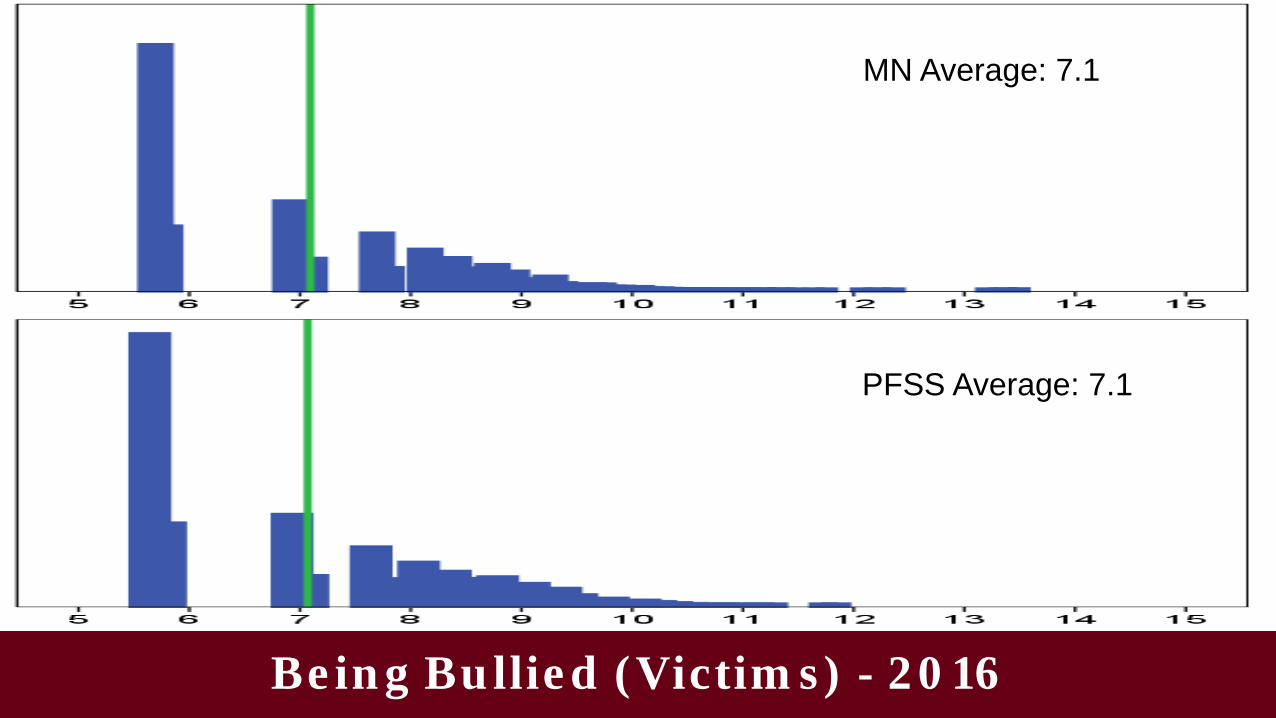
Being Bullied (Victims) - 2016
MN Average: 7.1
PFSS Average: 7.1

Bullying (Perpetrators) - 2016
MN Average: 6.8
PFSS Average: 6.8

Mental Distress - 2016
MN Average: 7.0
PFSS Average: 7.1
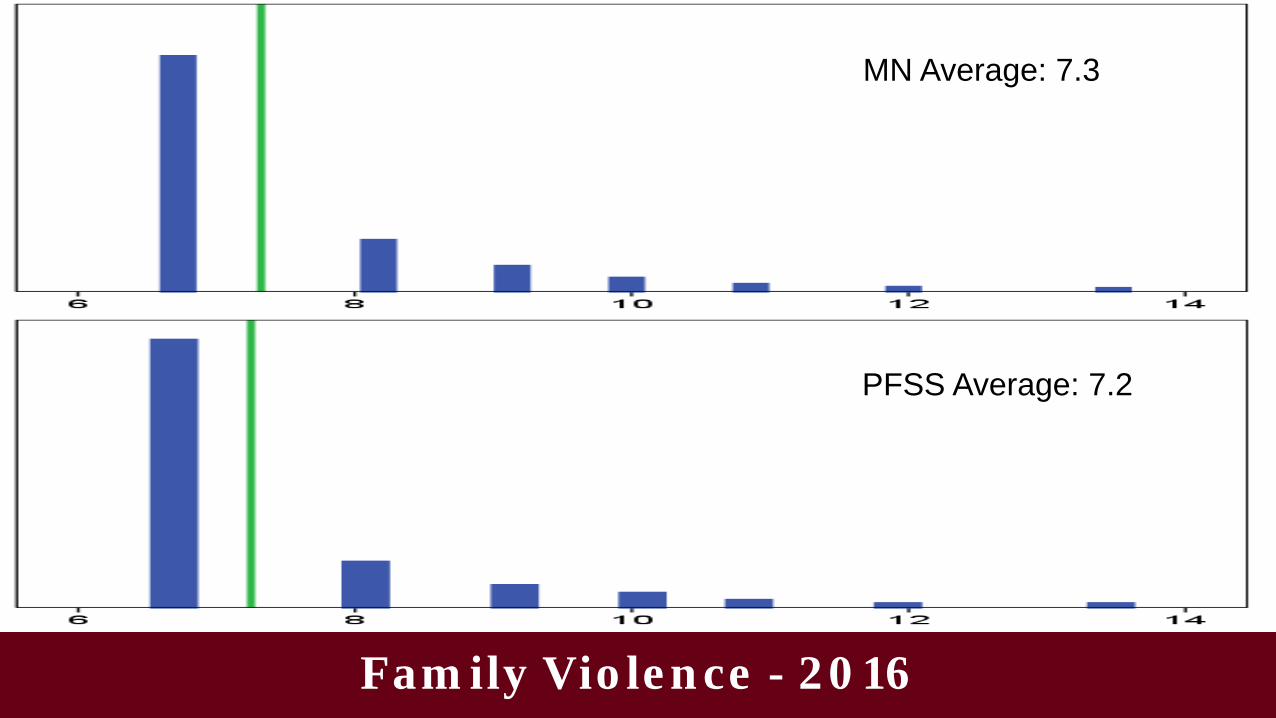
Family Violence - 2016
MN Average: 7.3
PFSS Average: 7.2
Examining Disparities
Moving toward Equity
Disparities in Achievement v. Developmental Skills
• We use a common effect size – the difference between groups in standard deviations
• To put these in perspective, we can examine these effects in achievement (achievement gaps).
• MN data were reviewed for 2015 NAEP results in Reading and Mathematics.
• We see much larger disparities in achievement than we do with Developmental Skills & Supports.
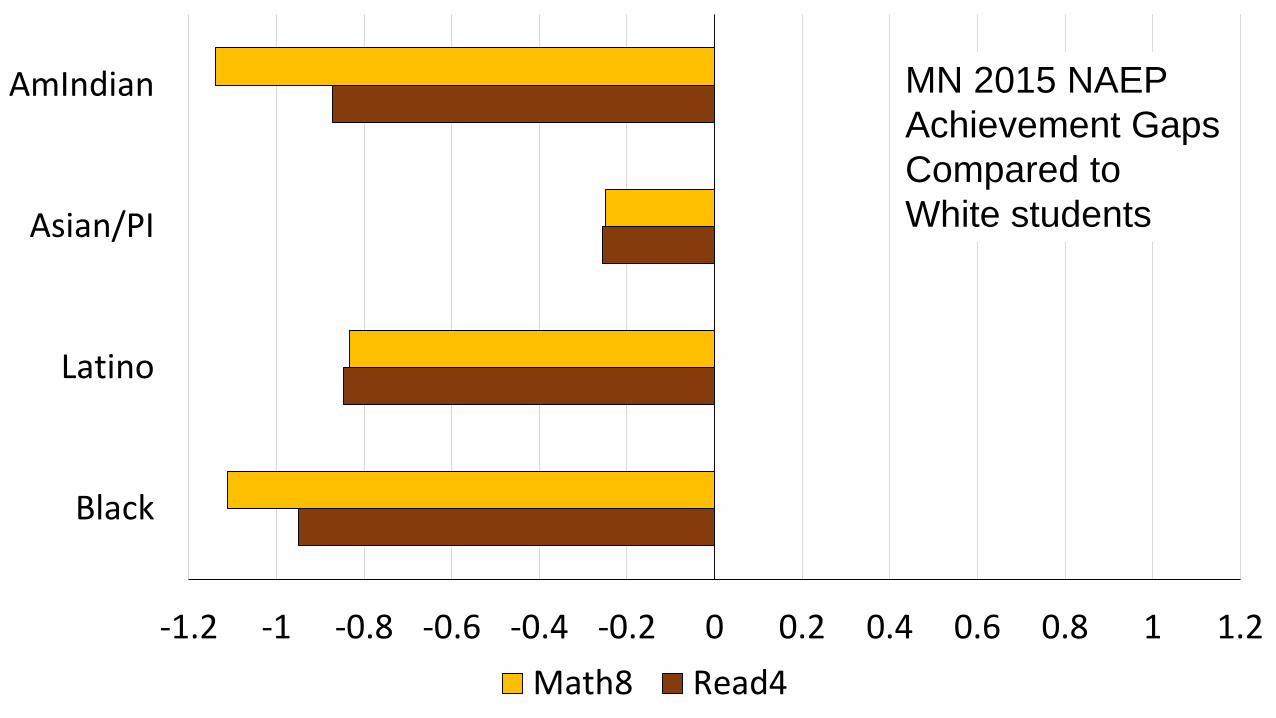
-1.2 -1 -0.8 -0.6 -0.4 -0.2 0 0.2 0.4 0.6 0.8 1 1.2
Black
Latino
Asian/PI
AmIndian
Math8 Read4
MN 2015 NAEP Achievement GapsCompared to White students
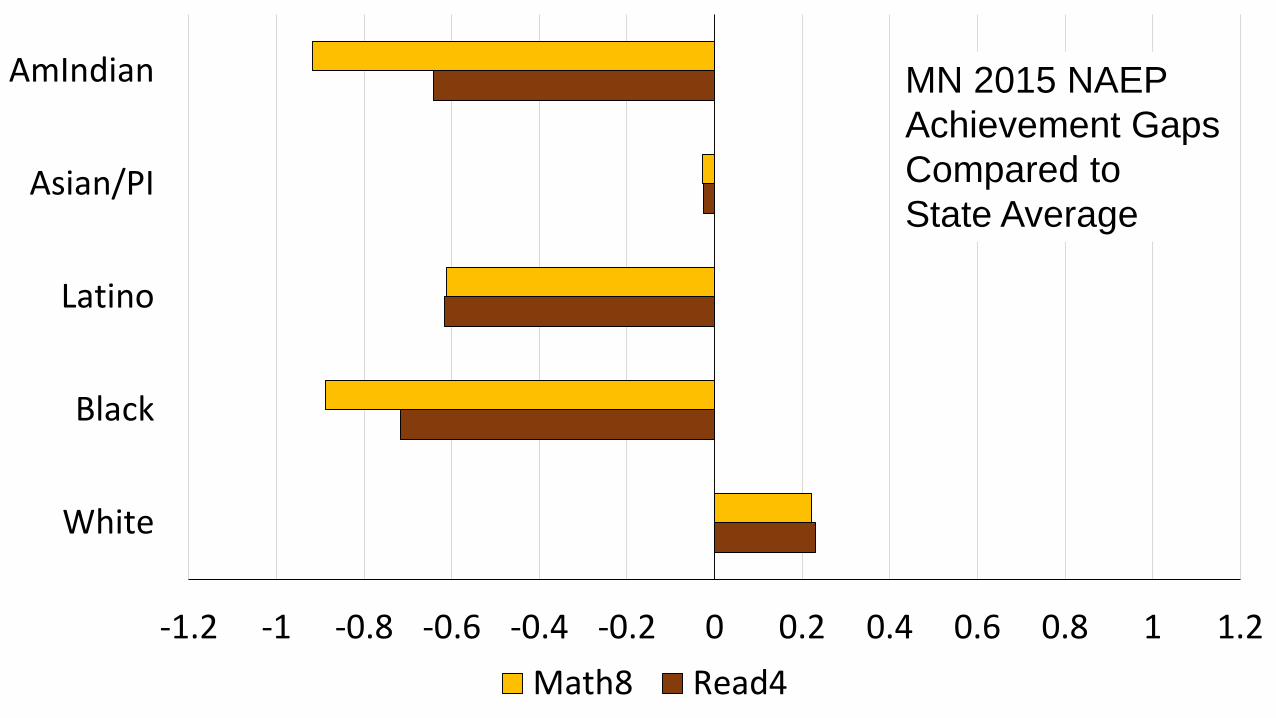
-1.2 -1 -0.8 -0.6 -0.4 -0.2 0 0.2 0.4 0.6 0.8 1 1.2
White
Black
Latino
Asian/PI
AmIndian
Math8 Read4
MN 2015 NAEP Achievement GapsCompared toState Average
Evaluating Disparities
• Disparities are defined in the next few slides as group differences from the State Average
• Each bar represents the number of SD difference between youth in each group v. State Average.
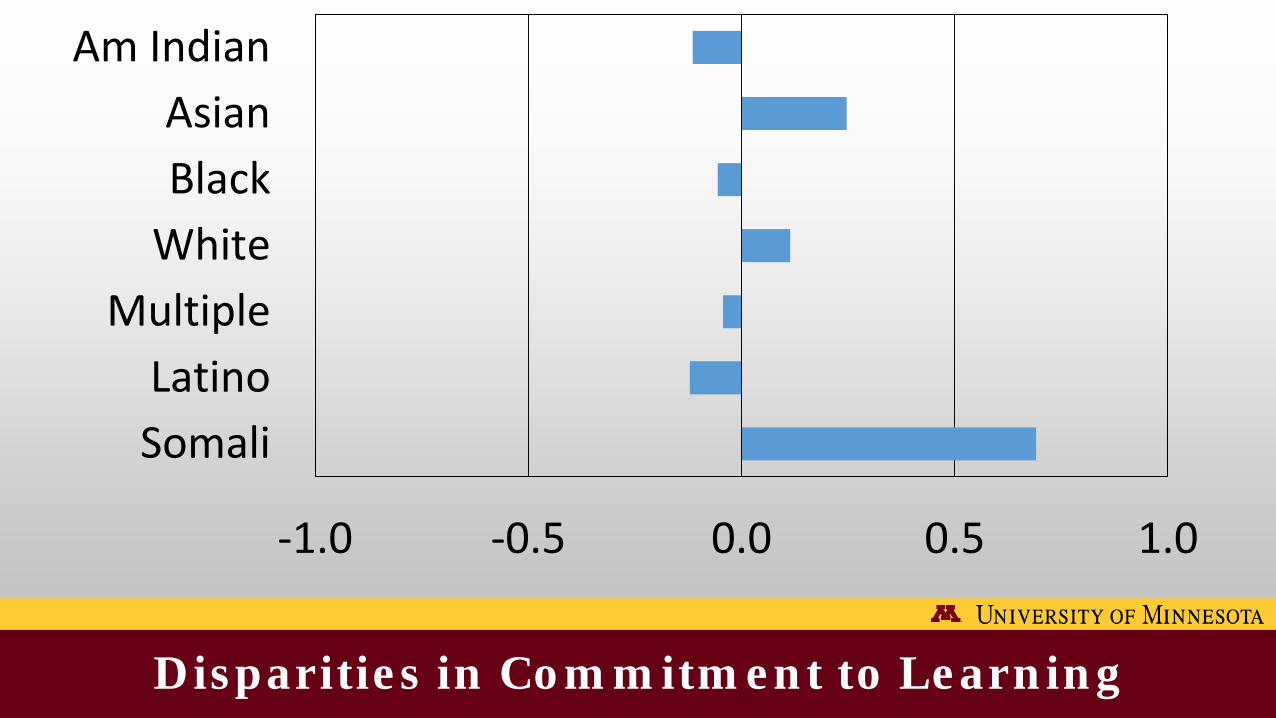
Disparities in Commitment to Learning
-1.0 -0.5 0.0 0.5 1.0
Am IndianAsianBlack
WhiteMultiple
LatinoSomali
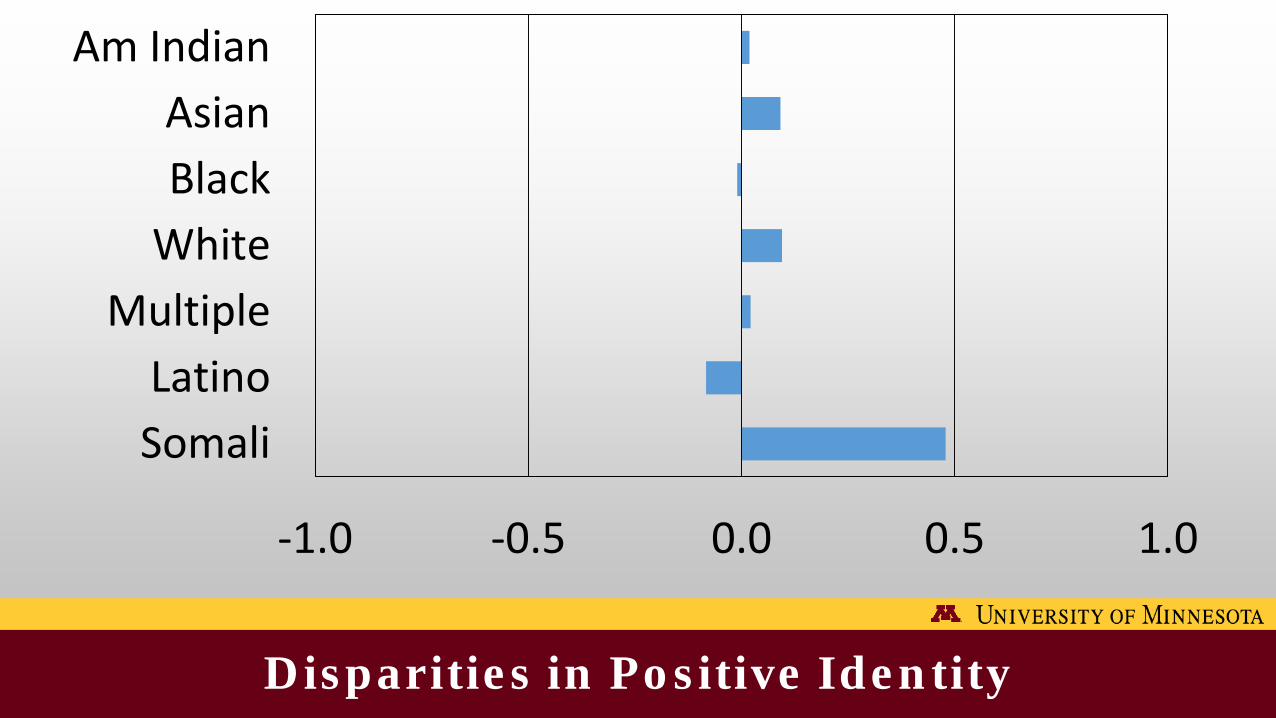
Disparities in Positive Identity
-1.0 -0.5 0.0 0.5 1.0
Am IndianAsianBlack
WhiteMultiple
LatinoSomali
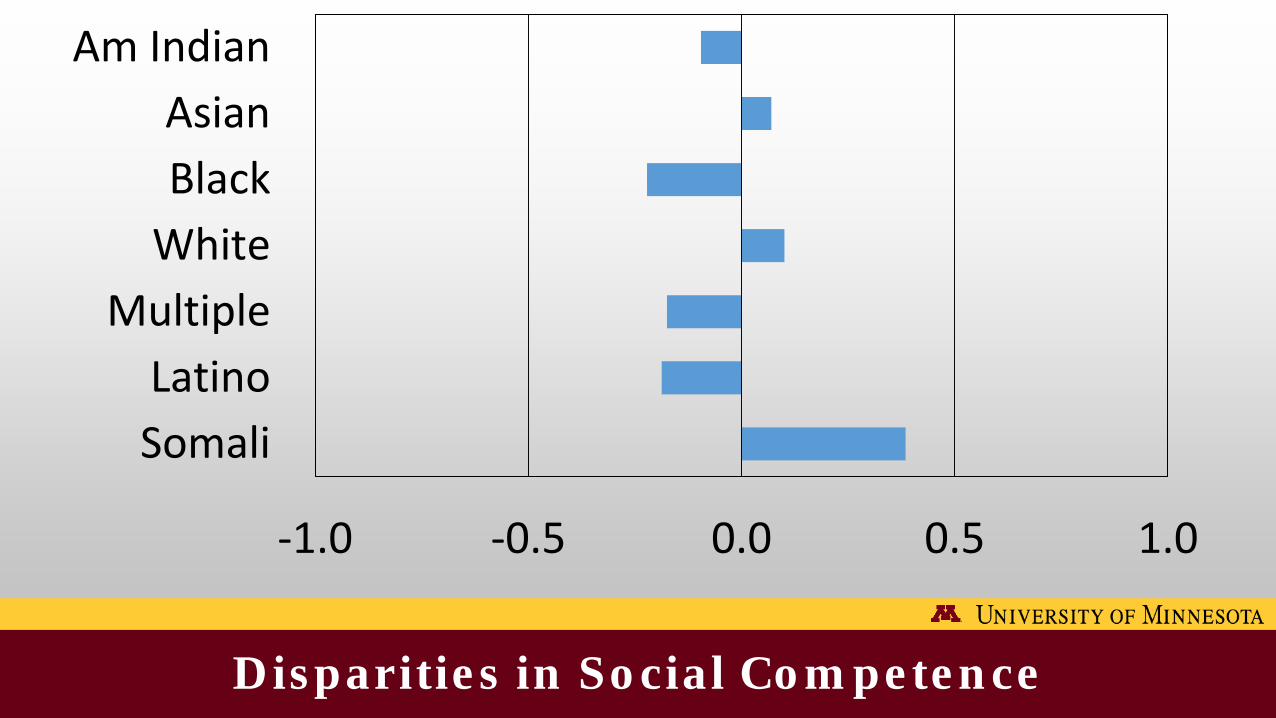
Disparities in Social Competence
-1.0 -0.5 0.0 0.5 1.0
Am IndianAsianBlack
WhiteMultiple
LatinoSomali
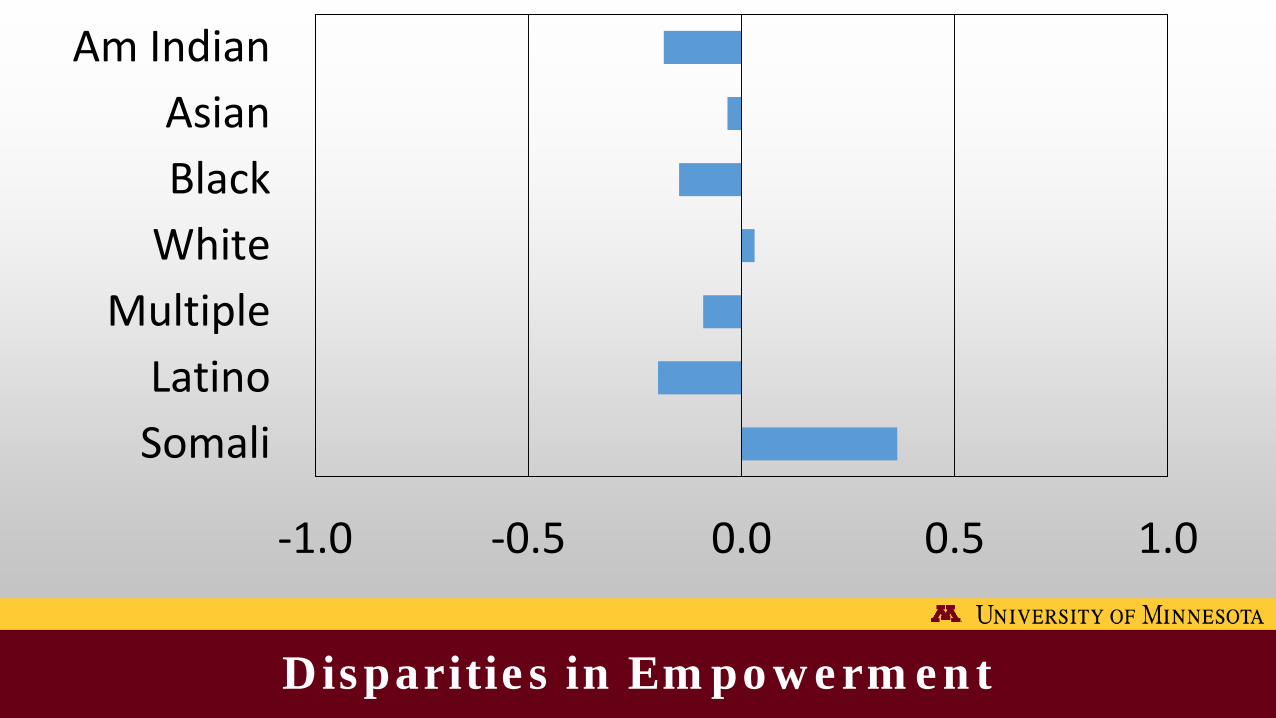
Disparities in Empowerment
-1.0 -0.5 0.0 0.5 1.0
Am IndianAsianBlack
WhiteMultiple
LatinoSomali
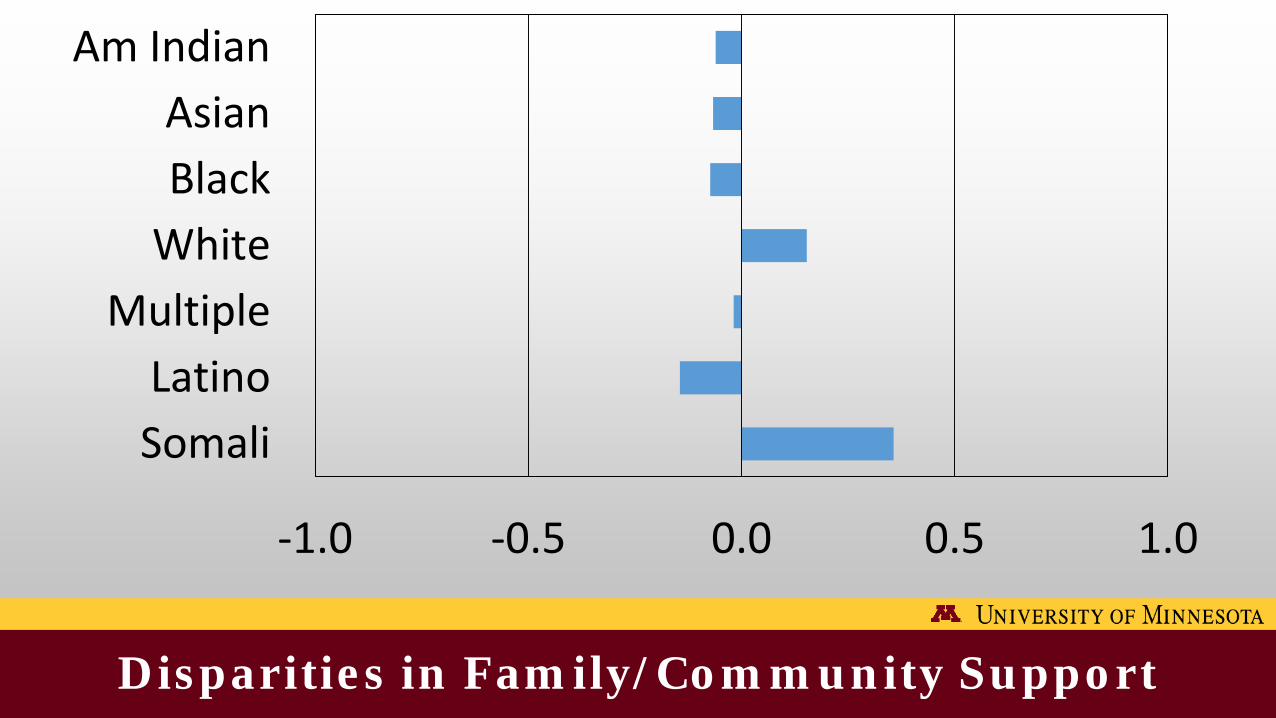
Disparities in Family/Community Support
-1.0 -0.5 0.0 0.5 1.0
Am IndianAsianBlack
WhiteMultiple
LatinoSomali
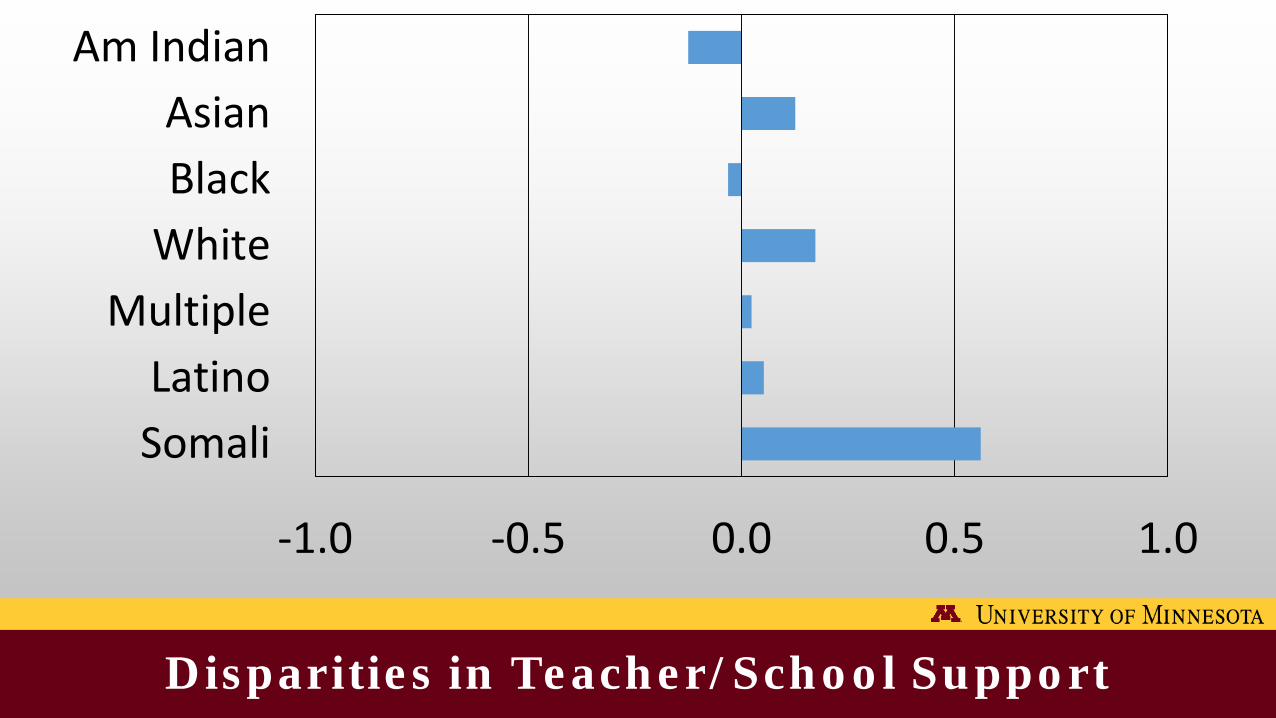
Disparities in Teacher/School Support
-1.0 -0.5 0.0 0.5 1.0
Am IndianAsianBlack
WhiteMultiple
LatinoSomali
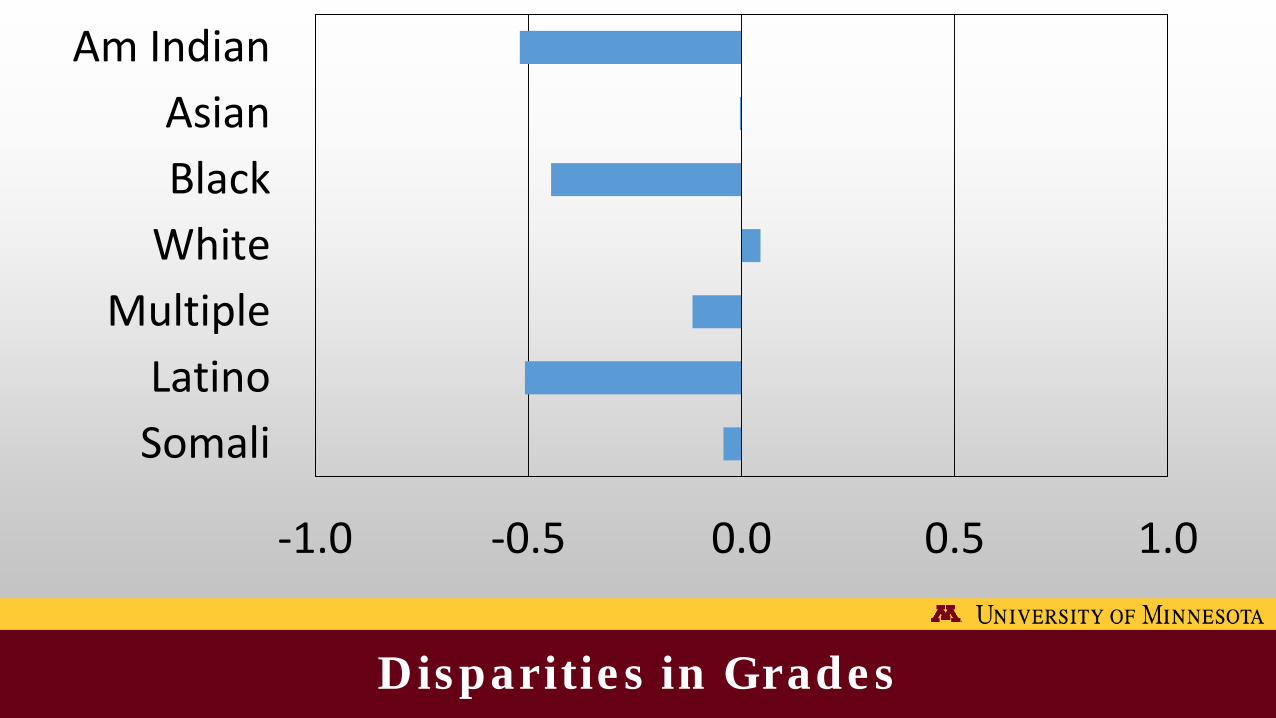
Disparities in Grades
-1.0 -0.5 0.0 0.5 1.0
Am IndianAsianBlack
WhiteMultiple
LatinoSomali
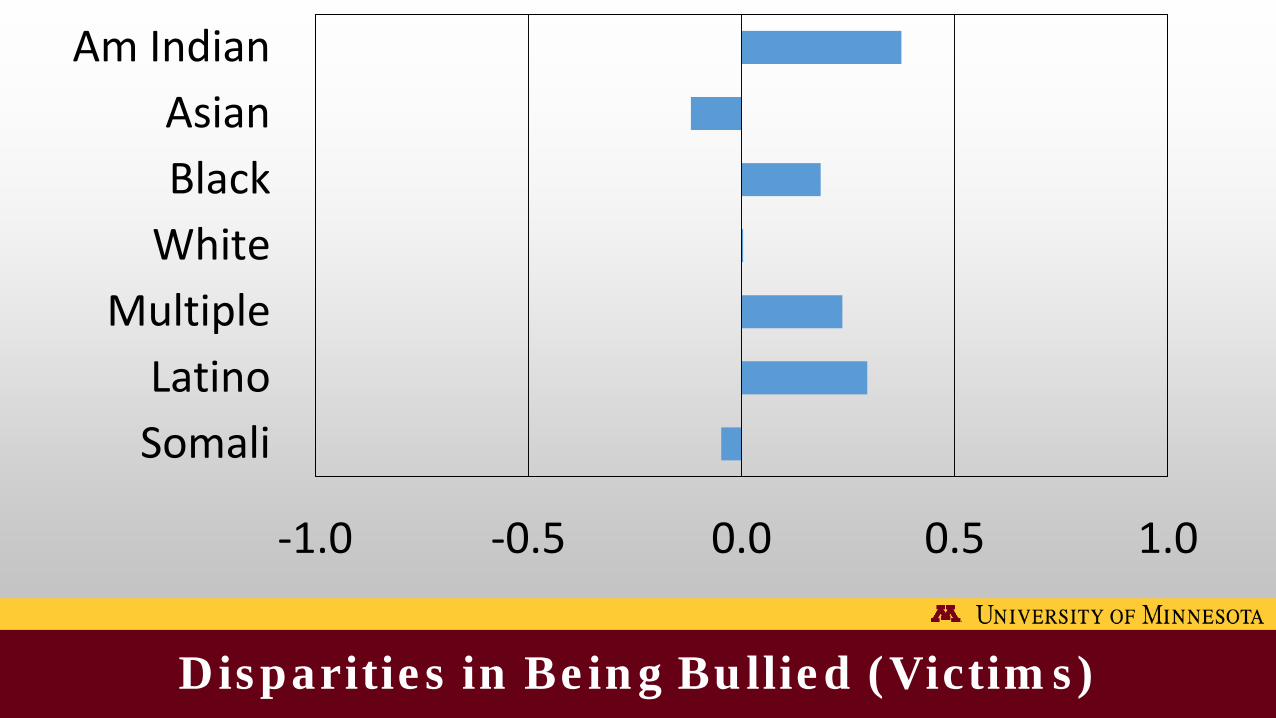
Disparities in Being Bullied (Victims)
-1.0 -0.5 0.0 0.5 1.0
Am IndianAsianBlack
WhiteMultiple
LatinoSomali
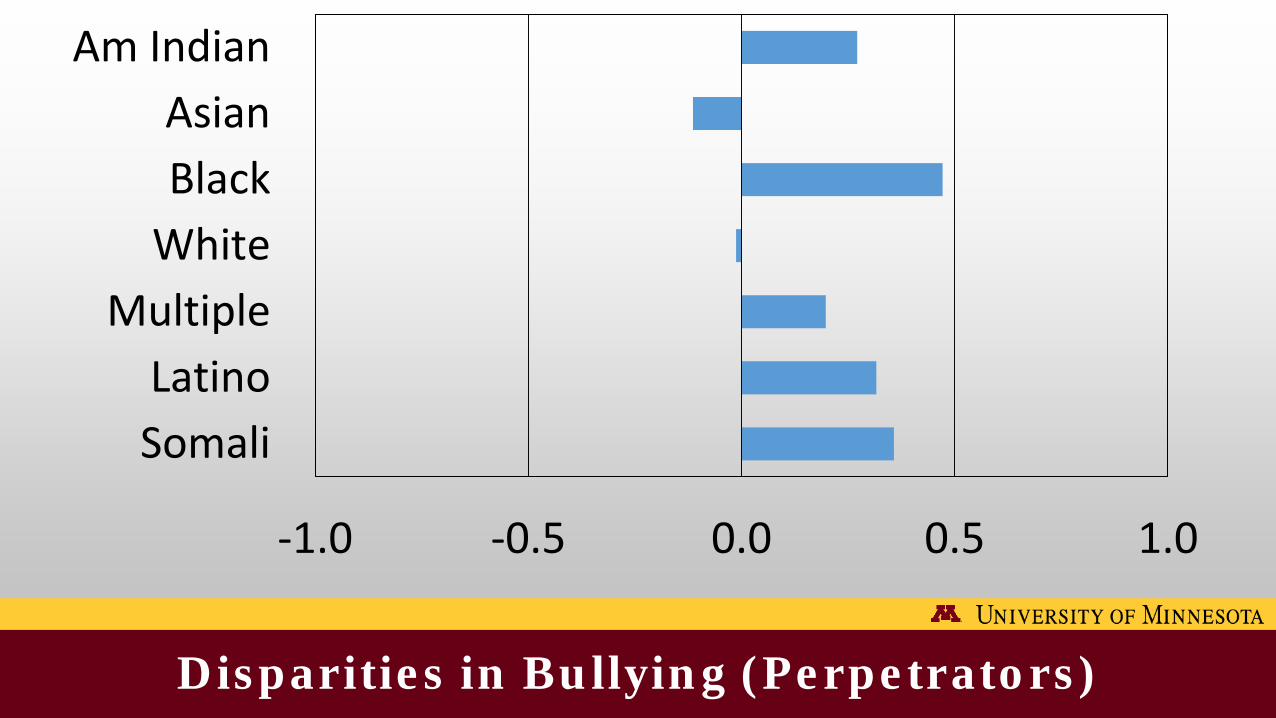
Disparities in Bullying (Perpetrators)
-1.0 -0.5 0.0 0.5 1.0
Am IndianAsianBlack
WhiteMultiple
LatinoSomali
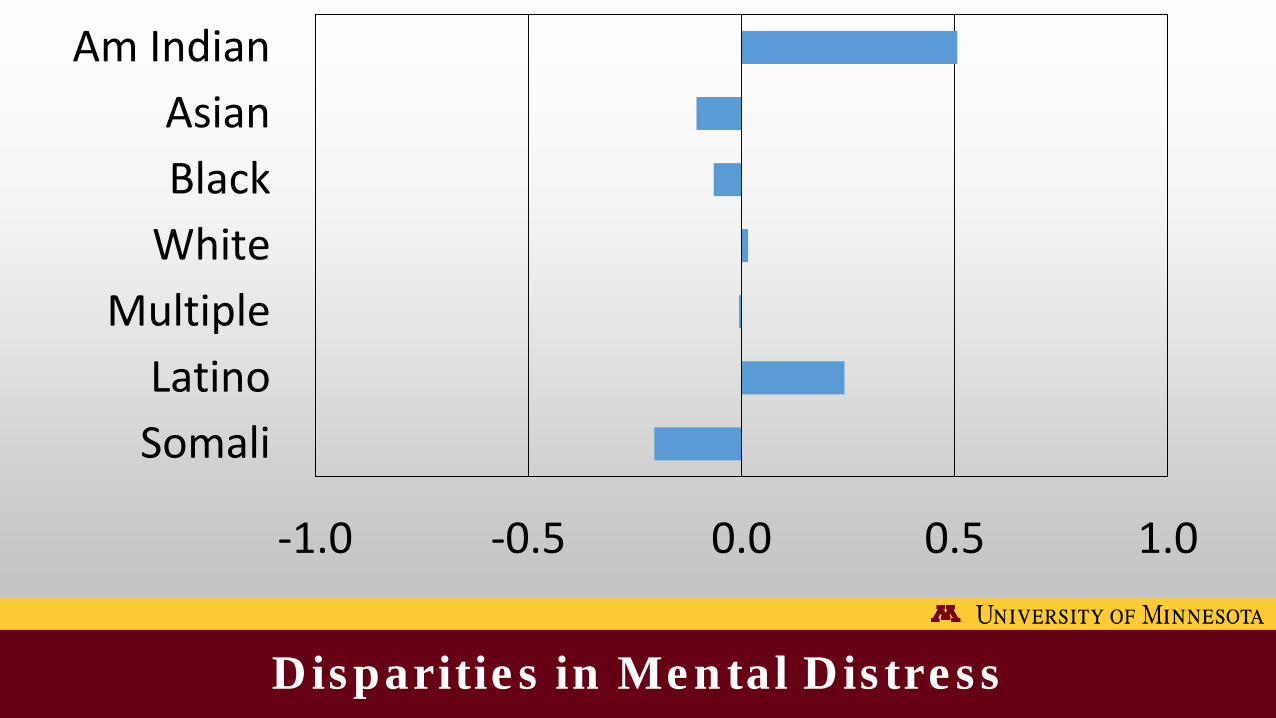
Disparities in Mental Distress
-1.0 -0.5 0.0 0.5 1.0
Am IndianAsianBlack
WhiteMultiple
LatinoSomali
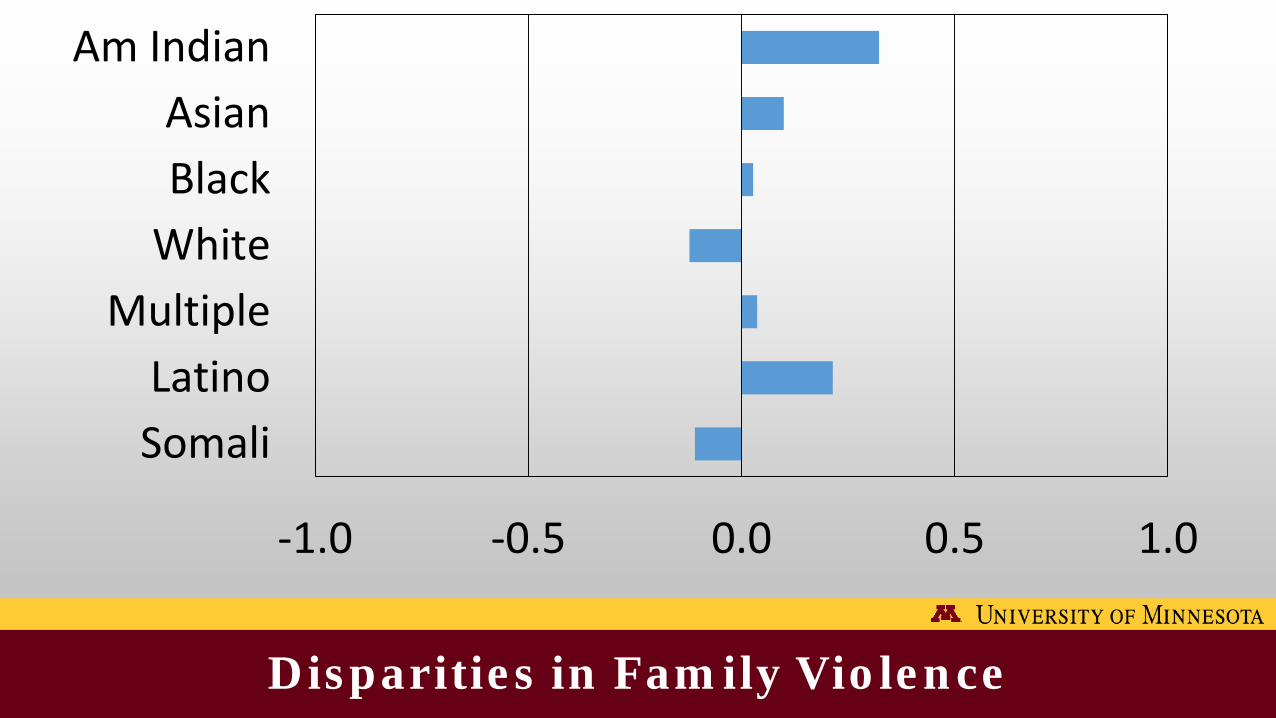
Disparities in Family Violence
-1.0 -0.5 0.0 0.5 1.0
Am IndianAsianBlack
WhiteMultiple
LatinoSomali
Used by Generation Next
Equipped for Learning
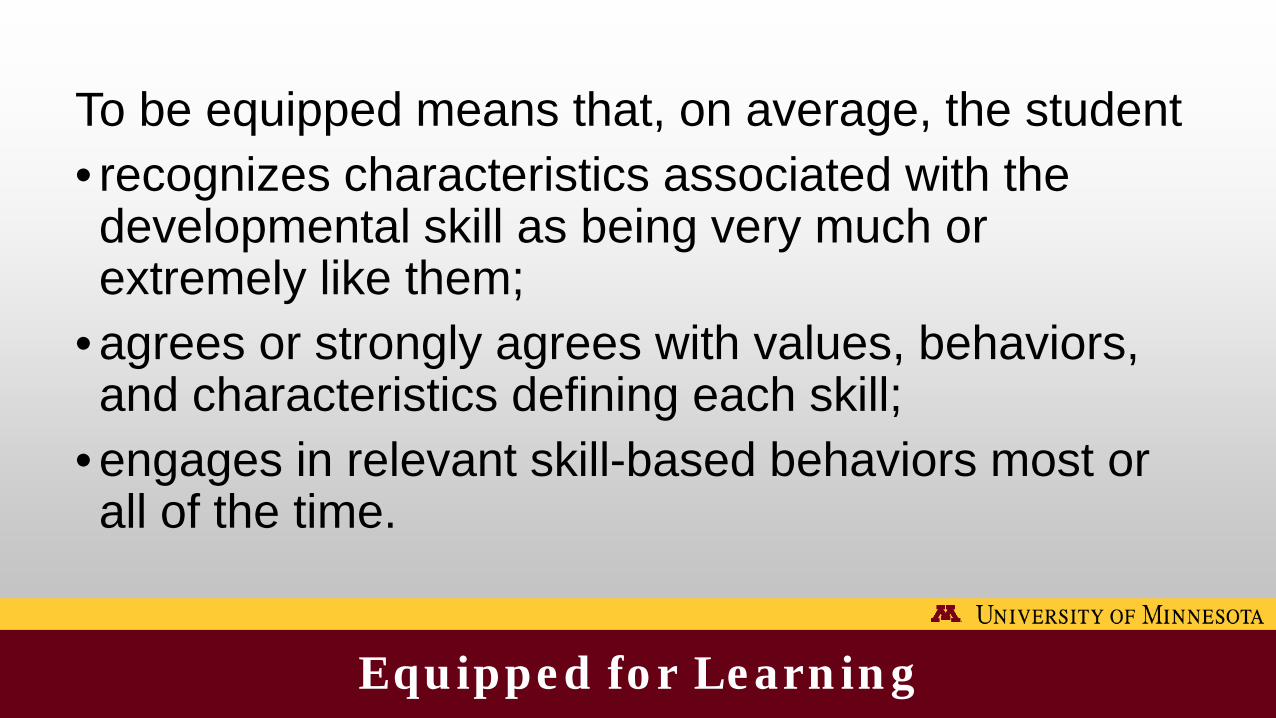
Equipped for Learning
To be equipped means that, on average, the student• recognizes characteristics associated with the developmental skill as being very much or extremely like them;
• agrees or strongly agrees with values, behaviors, and characteristics defining each skill;
• engages in relevant skill-based behaviors most or all of the time.
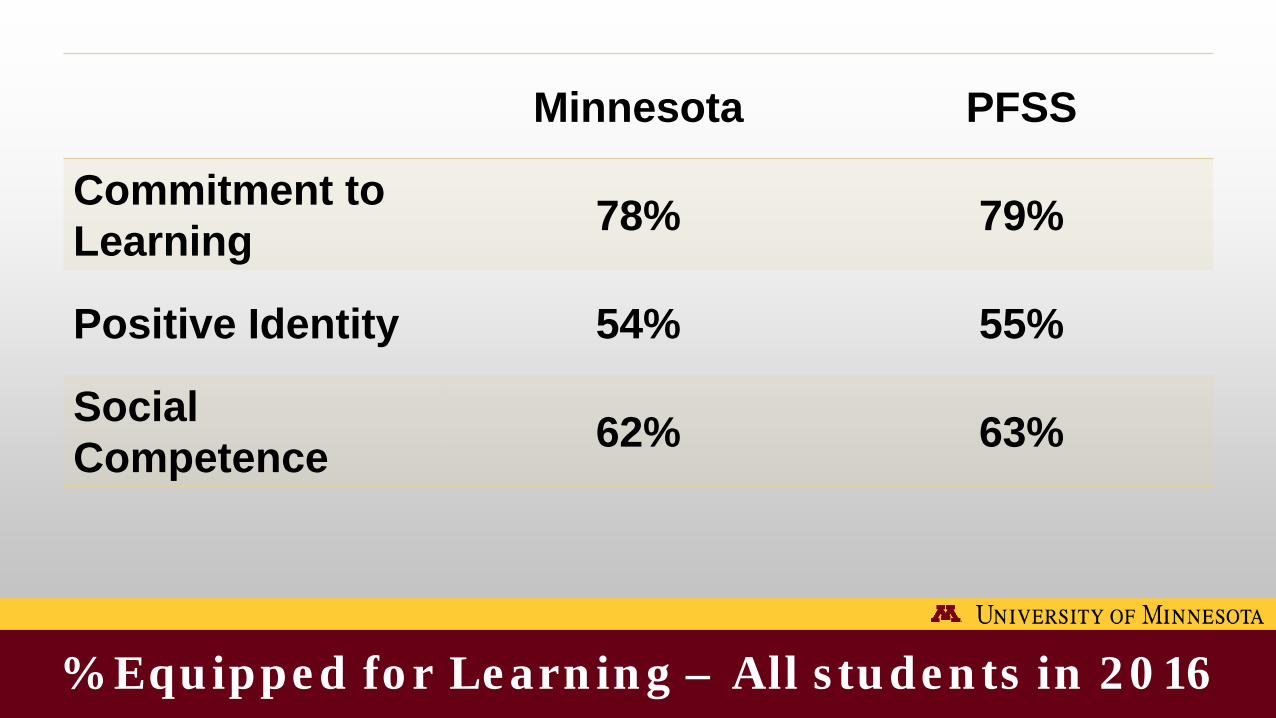
% Equipped for Learning – All students in 2016
Minnesota PFSS
Commitment to Learning 78% 79%
Positive Identity 54% 55%
Social Competence 62% 63%
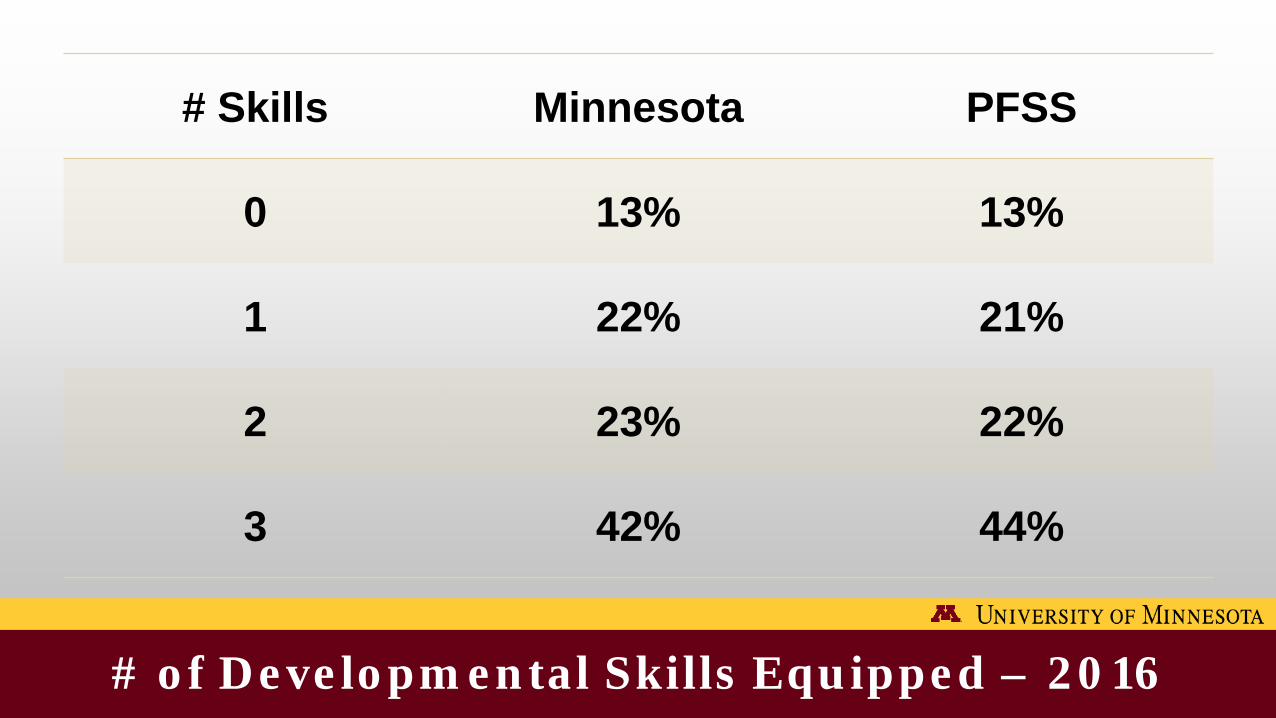
# of Developmental Skills Equipped – 2016
# Skills Minnesota PFSS
0 13% 13%
1 22% 21%
2 23% 22%
3 42% 44%
Including All PFSS Schools - 2016
Does being equipped matter?
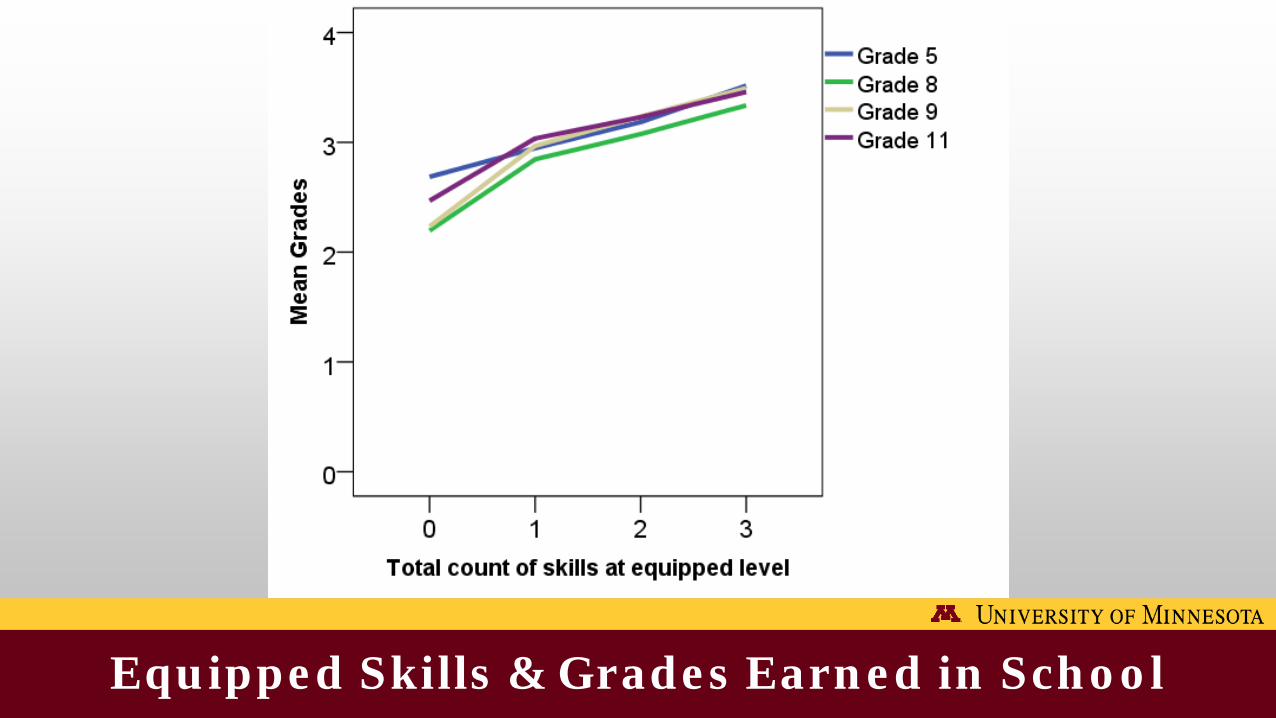
Equipped Skills & Grades Earned in School
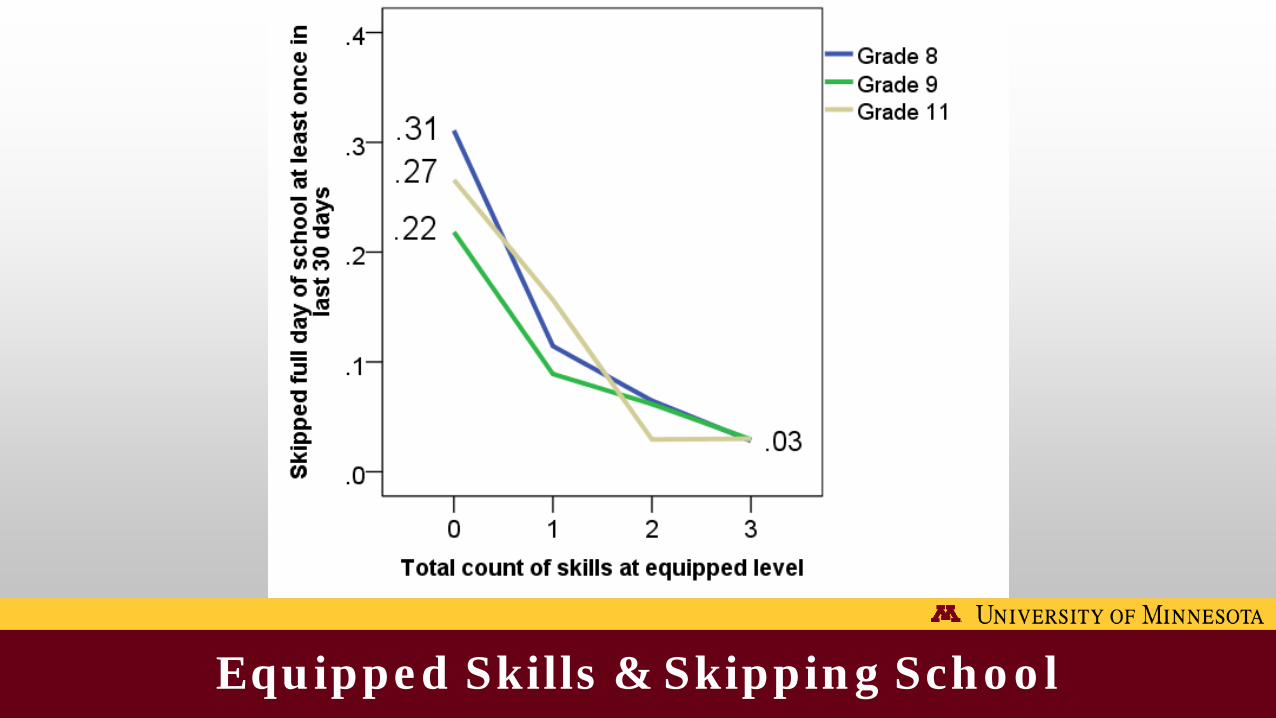
Equipped Skills & Skipping School
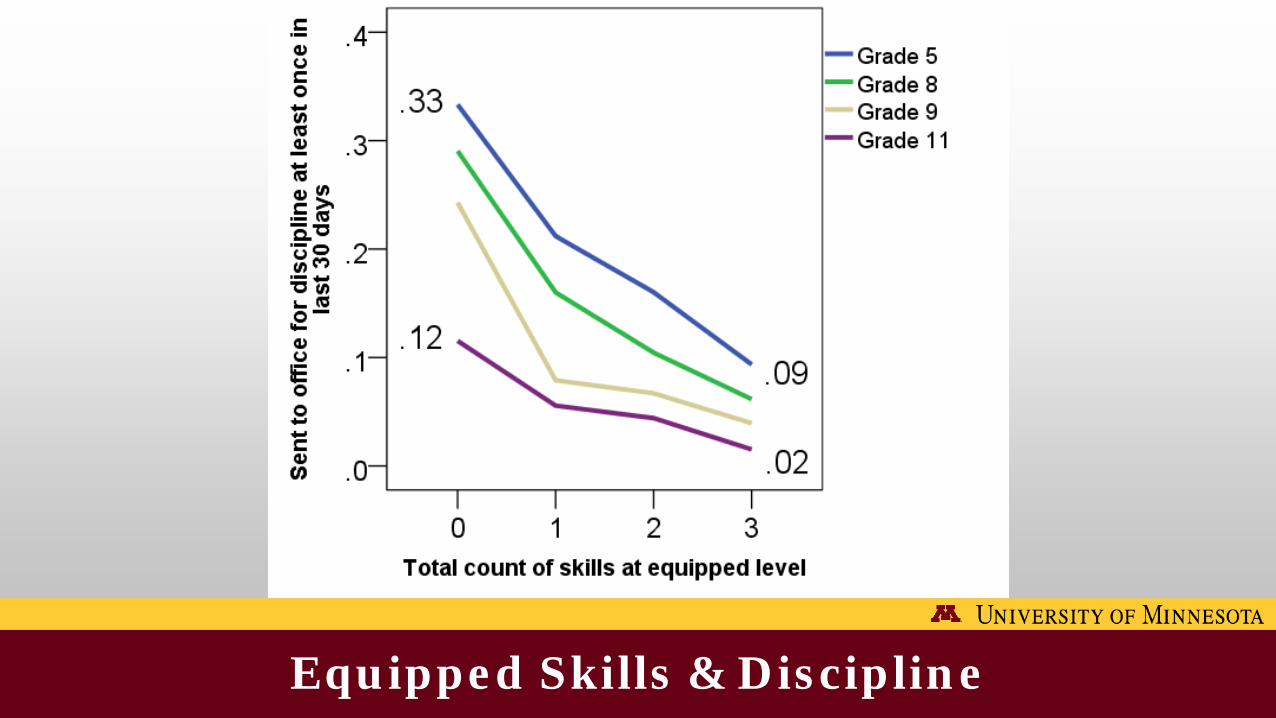
Equipped Skills & Discipline
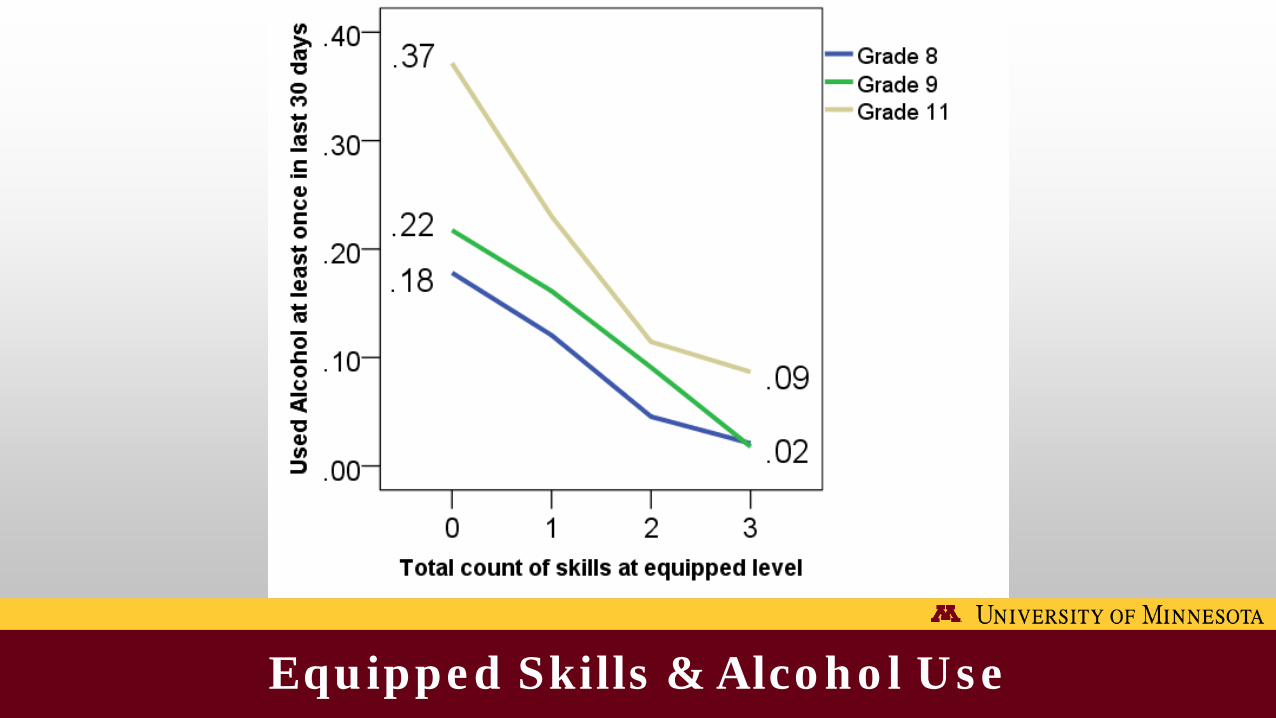
Equipped Skills & Alcohol Use
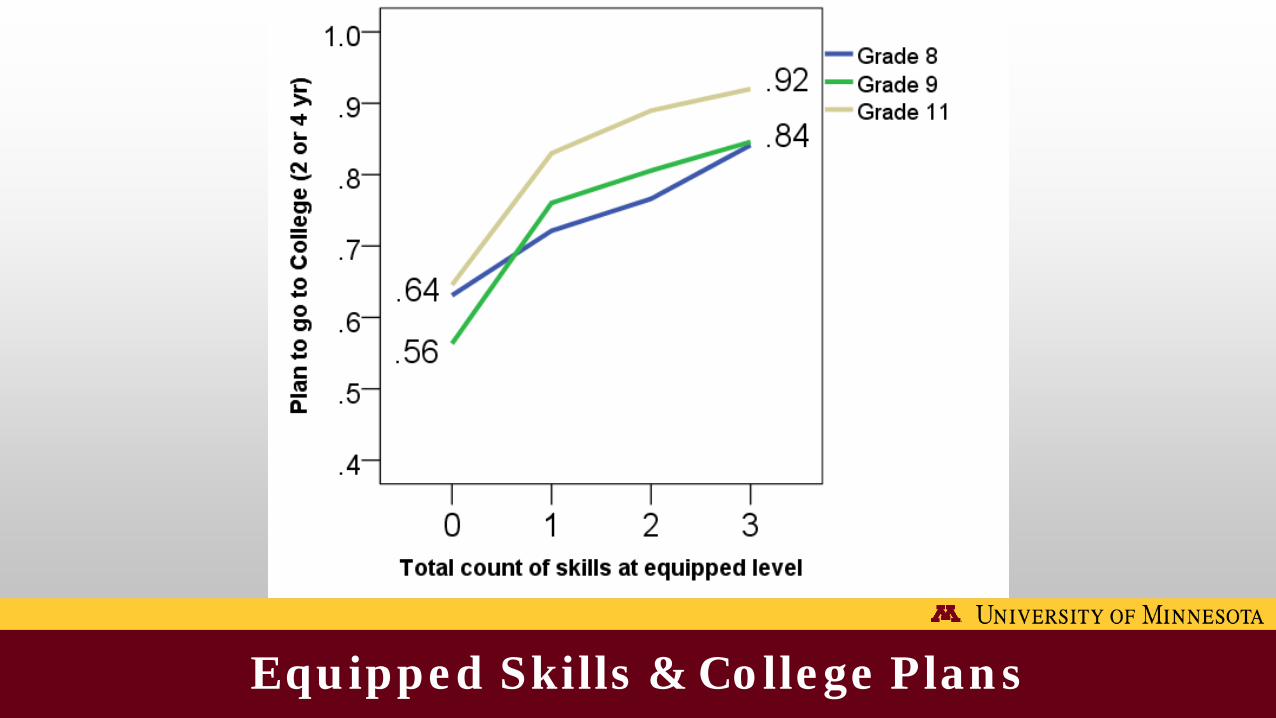
Equipped Skills & College Plans
Many Communities
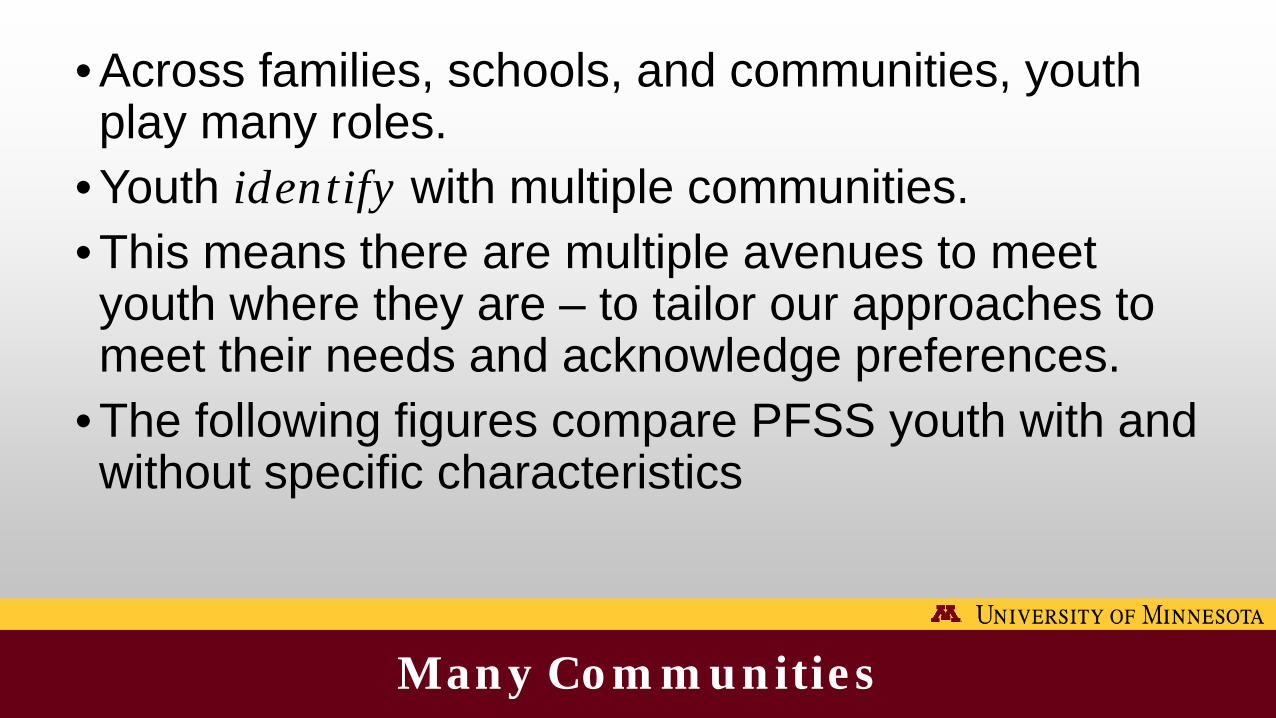
• Across families, schools, and communities, youth play many roles.
• Youth identify with multiple communities.• This means there are multiple avenues to meet youth where they are – to tailor our approaches to meet their needs and acknowledge preferences.
• The following figures compare PFSS youth with and without specific characteristics
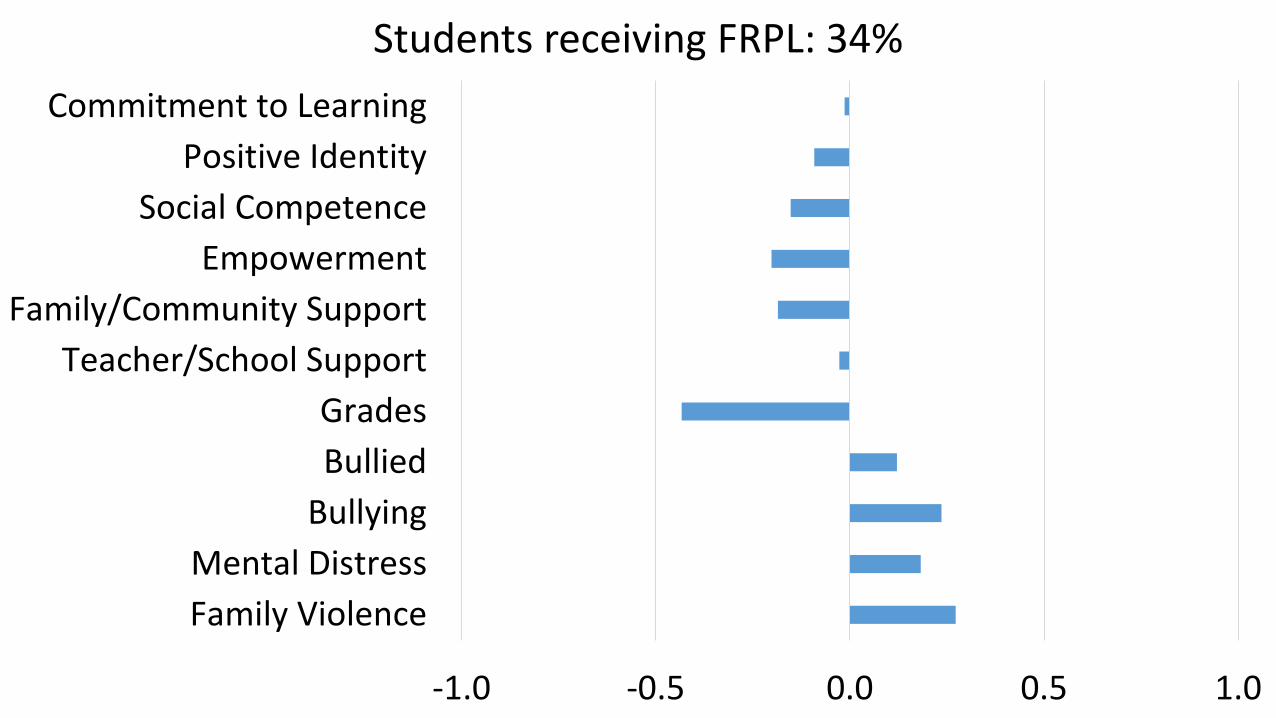
-1.0 -0.5 0.0 0.5 1.0
Commitment to LearningPositive Identity
Social CompetenceEmpowerment
Family/Community SupportTeacher/School Support
GradesBullied
BullyingMental DistressFamily Violence
Students receiving FRPL: 34%
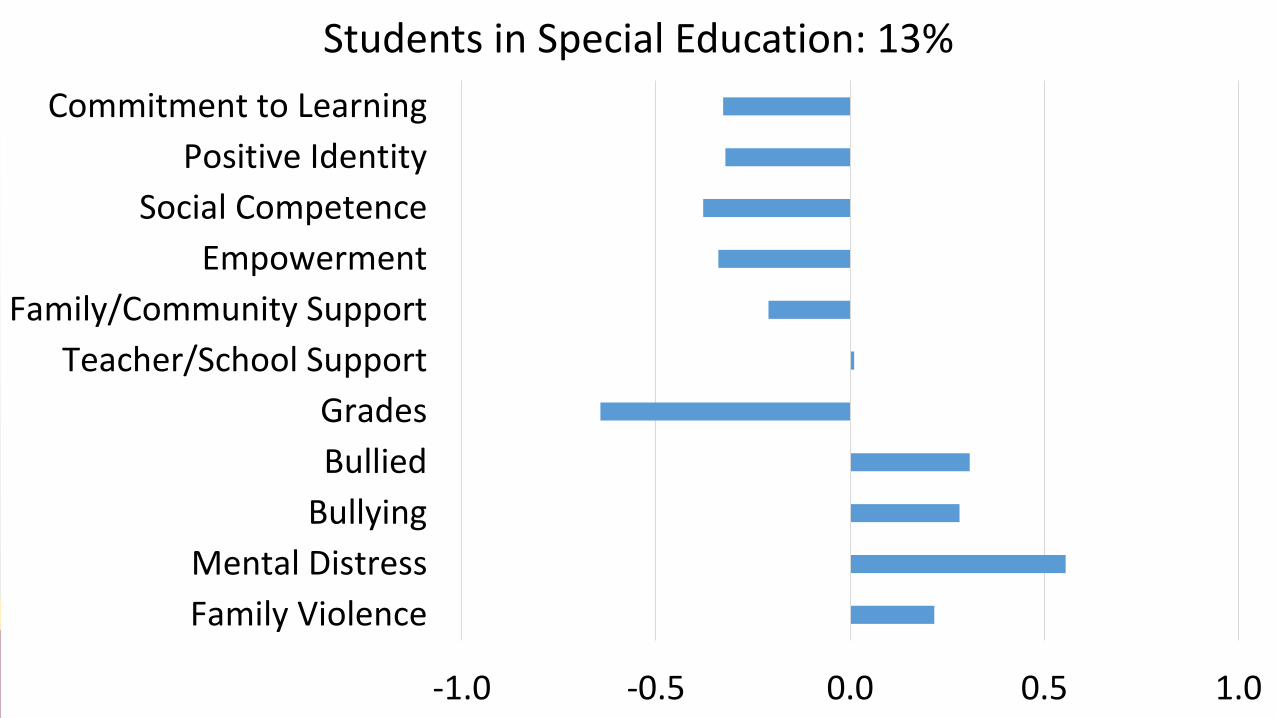
-1.0 -0.5 0.0 0.5 1.0
Commitment to LearningPositive Identity
Social CompetenceEmpowerment
Family/Community SupportTeacher/School Support
GradesBullied
BullyingMental DistressFamily Violence
Students in Special Education: 13%
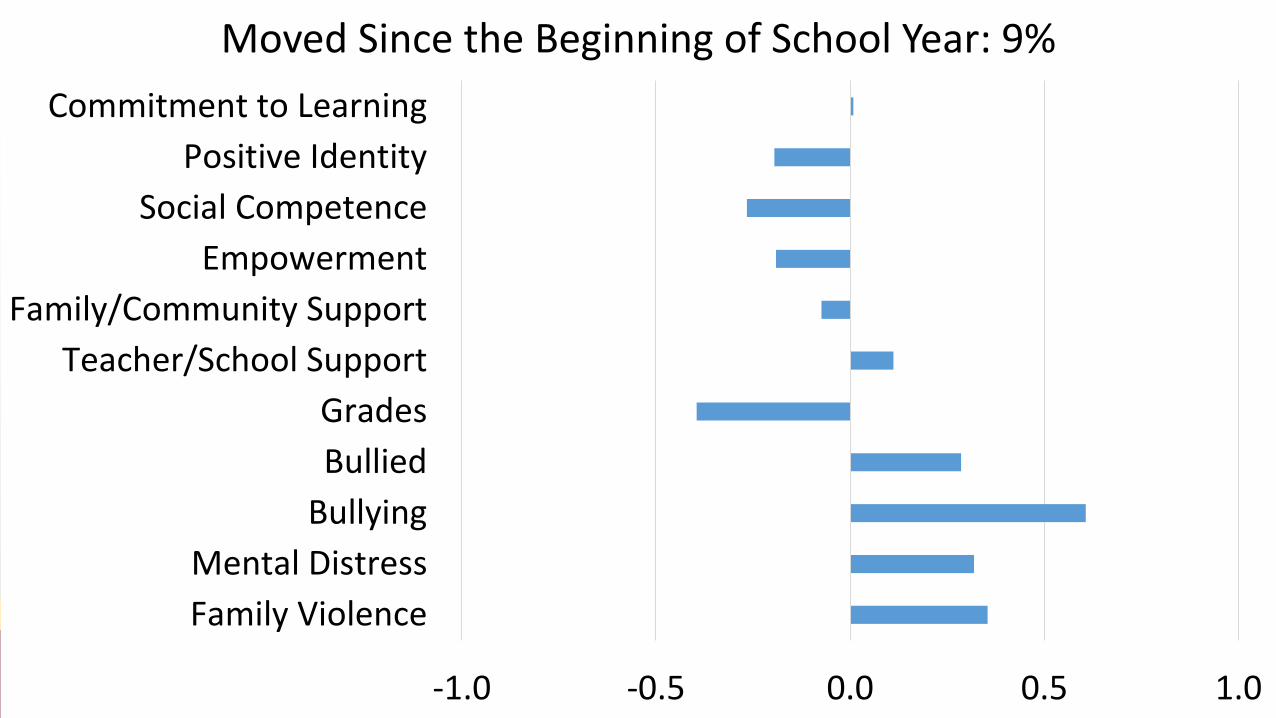
-1.0 -0.5 0.0 0.5 1.0
Commitment to LearningPositive Identity
Social CompetenceEmpowerment
Family/Community SupportTeacher/School Support
GradesBullied
BullyingMental DistressFamily Violence
Moved Since the Beginning of School Year: 9%
-1.0 -0.5 0.0 0.5 1.0
Commitment to LearningPositive Identity
Social CompetenceEmpowerment
Family/Community SupportTeacher/School Support
GradesBullied
BullyingMental DistressFamily Violence
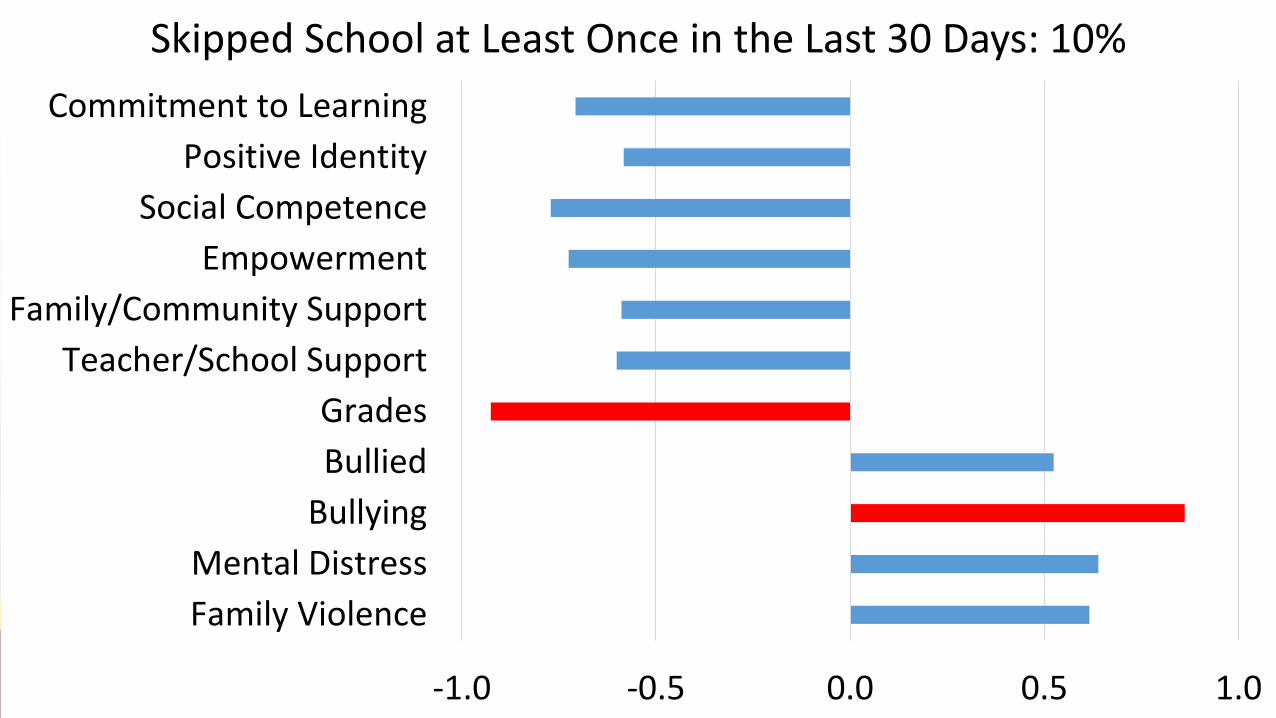
Skipped School at Least Once in the Last 30 Days: 10%
-1.0 -0.5 0.0 0.5 1.0
Commitment to LearningPositive Identity
Social CompetenceEmpowerment
Family/Community SupportTeacher/School Support
GradesBullied
BullyingMental DistressFamily Violence
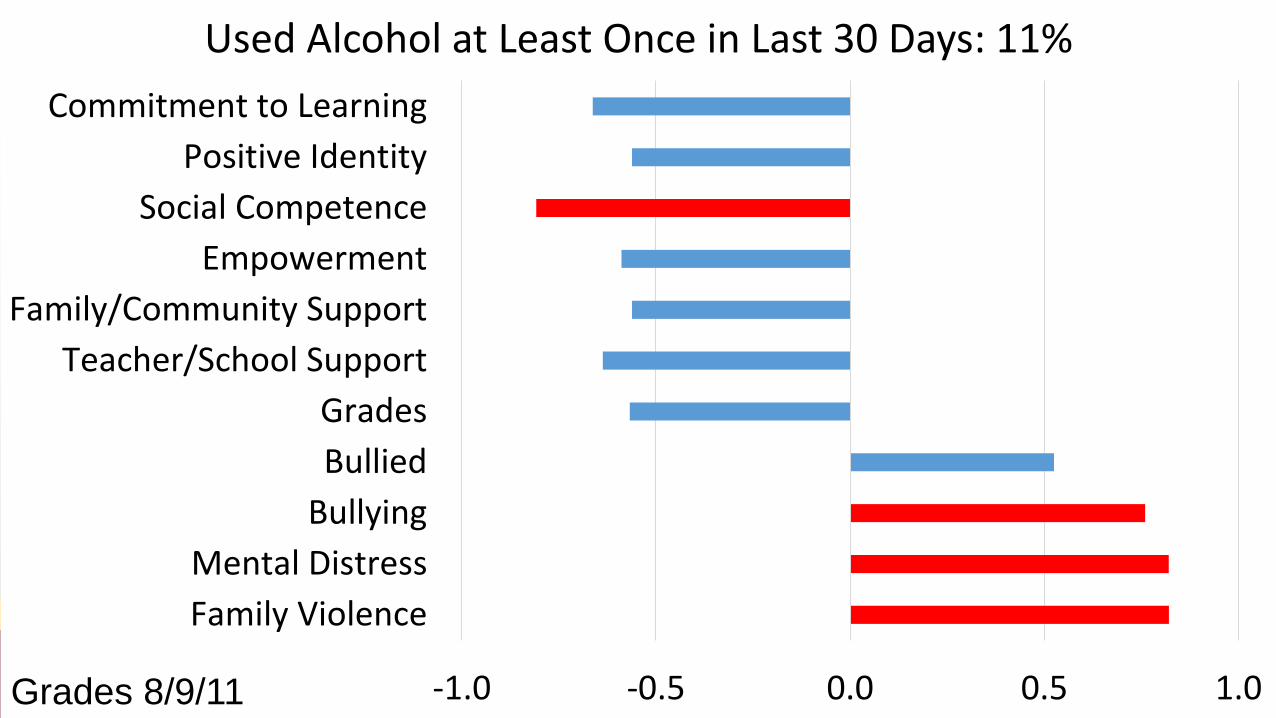
Used Alcohol at Least Once in Last 30 Days: 11%
Grades 8/9/11

-1.0 -0.5 0.0 0.5 1.0
Commitment to LearningPositive Identity
Social CompetenceEmpowerment
Family/Community SupportTeacher/School Support
GradesBullied
BullyingMental DistressFamily Violence
Gay/Lesbian/Bisexual/Questioning Students: 13%
Grades 9/11
-1.0 -0.5 0.0 0.5 1.0
Commitment to LearningPositive Identity
Social CompetenceEmpowerment
Family/Community SupportTeacher/School Support
GradesBullied
BullyingMental DistressFamily Violence
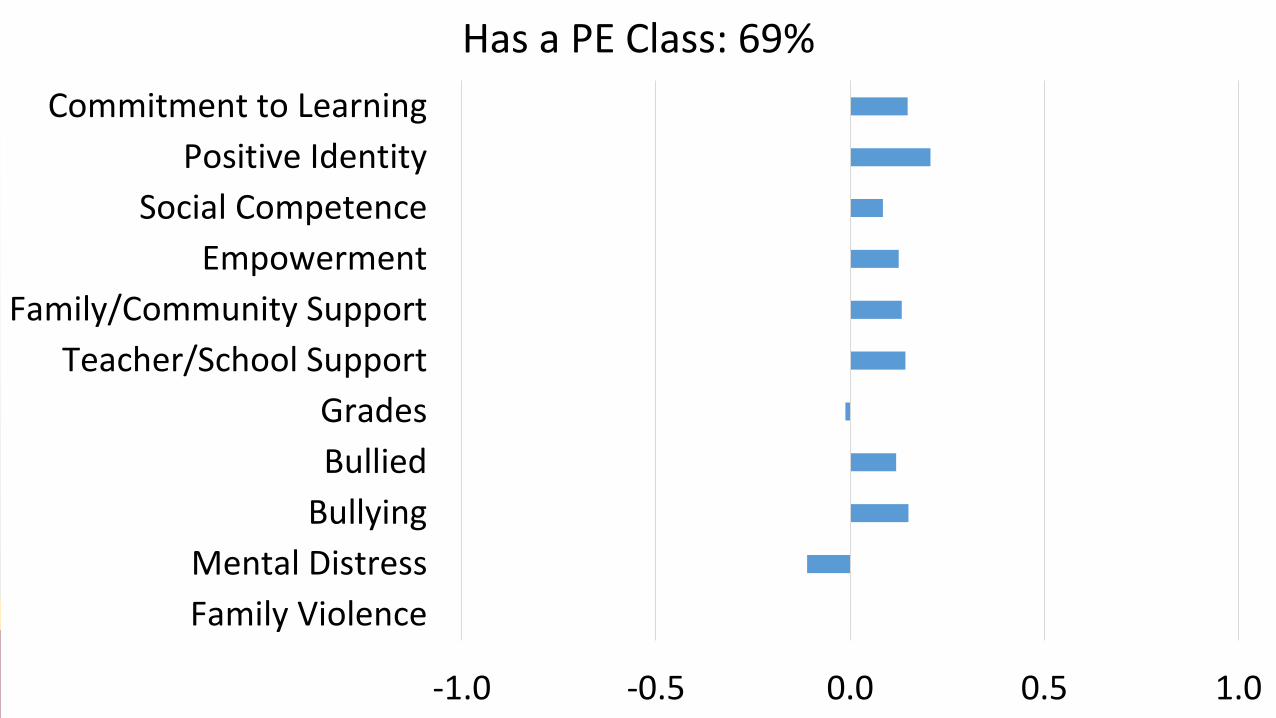
Has a PE Class: 69%

-1.0 -0.5 0.0 0.5 1.0
Commitment to LearningPositive Identity
Social CompetenceEmpowerment
Family/Community SupportTeacher/School Support
GradesBullied
BullyingMental DistressFamily Violence
Participates in at least one School-BasedAfterschool Activity: 53%
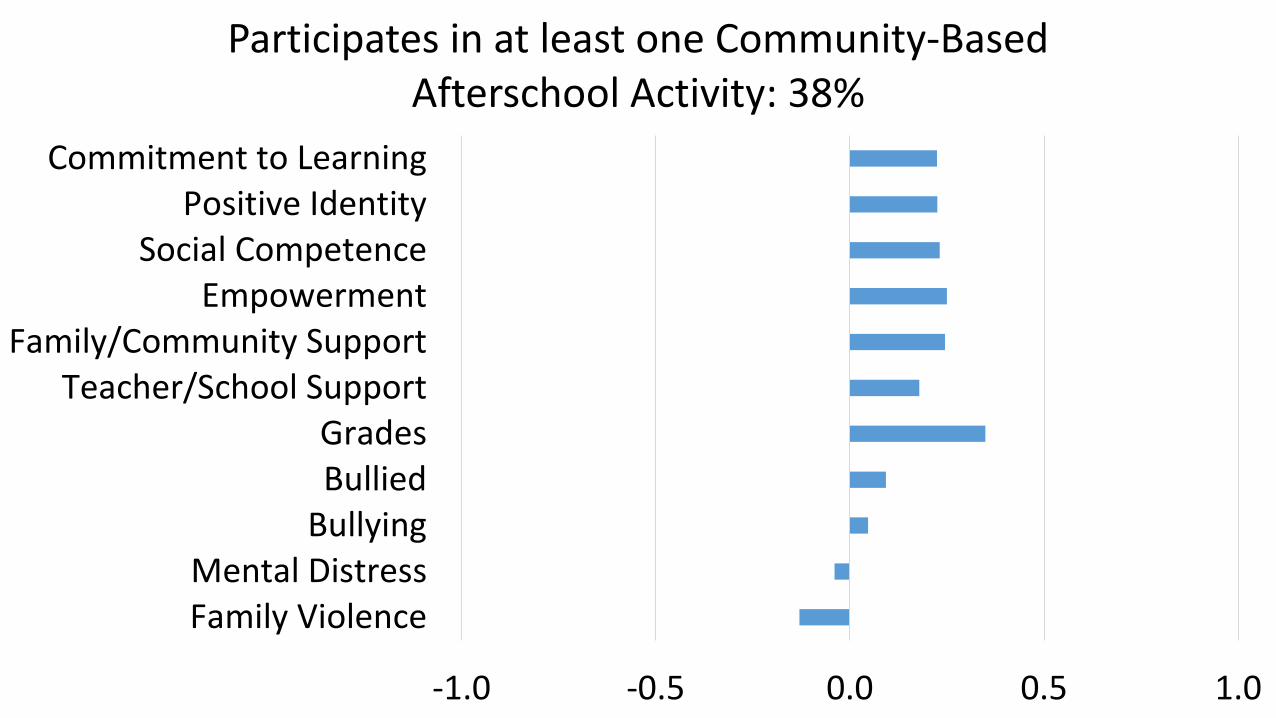
-1.0 -0.5 0.0 0.5 1.0
Commitment to LearningPositive Identity
Social CompetenceEmpowerment
Family/Community SupportTeacher/School Support
GradesBullied
BullyingMental DistressFamily Violence
Participates in at least one Community-Based Afterschool Activity: 38%
A closing message…
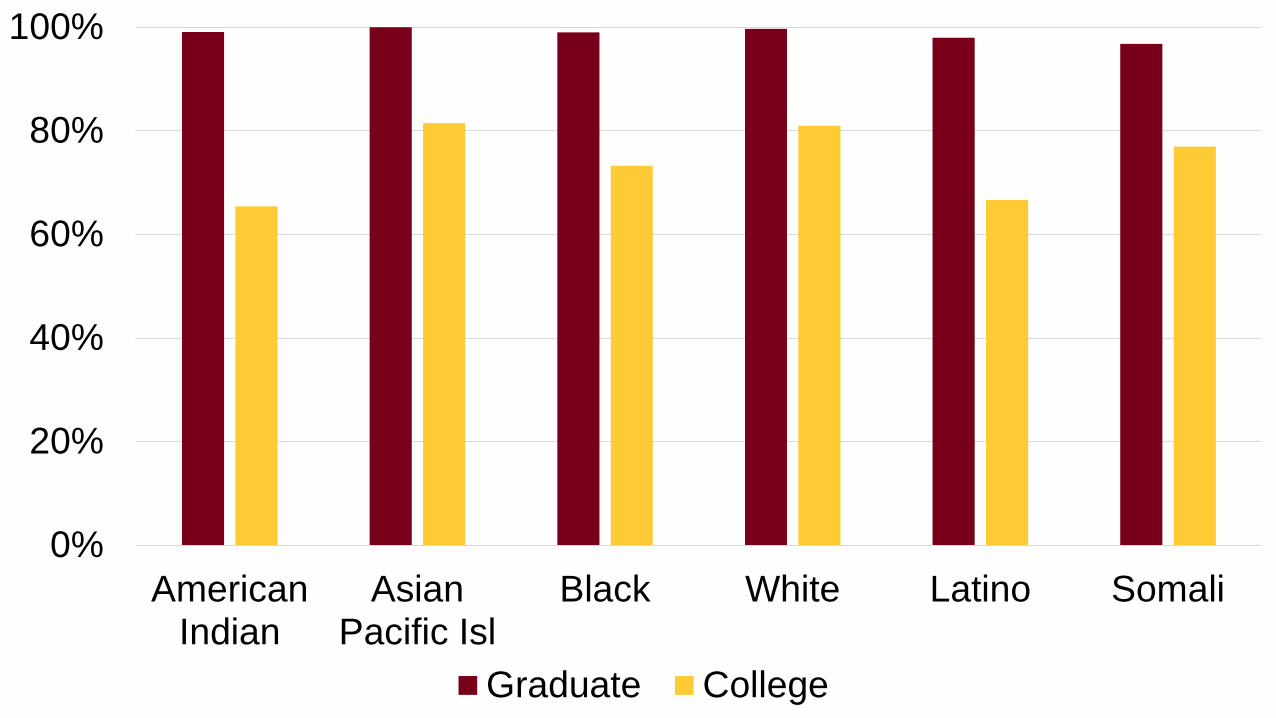
Post High School Plans – Grades 8/9/11
0%
20%
40%
60%
80%
100%
AmericanIndian
AsianPacific Isl
Black White Latino Somali
Graduate College
Related Documents