Exploring deep potential aquifer in water scarce crystalline rocks Subash Chandra ∗ , E Nagaiah, D V Reddy, V Ananda Rao and Shakeel Ahmed CSIR – National Geophysical Research Institute, Uppal Road, Hyderabad 500 007, Andhra Pradesh, India. ∗ Corresponding author. e-mail: [email protected] chandra [email protected] Characterization of the shear zone with pole–pole electrical resistivity tomography (ERT) was carried out to explore deep groundwater potential zone in a water scarce granitic area. As existing field condi- tions does not always allow to plant the remote electrodes at sufficiently far of distance, the effect of insufficient distance of remote electrodes on apparent resistivity measurement was studied and shown that the transverse pole–pole array affects less compared to the collinear pole–pole array. Correction factor have been computed for transverse pole–pole array for various positions of the remote electrodes. The above results helped in exploring deep aquifer site, where a 270 m deep well was drilled. Tempo- ral hydro-chemical samples collected during the pumping indicated the hydraulic connectivity between the demarcated groundwater potential fractures. Incorporating all the information derived from differ- ent investigations, a subsurface model was synthetically simulated and generated 2D electrical resistivity response for different arrays and compared with the field responses to further validate the geoelectrical response of deep aquifer set-up associated with lineament. 1. Introduction Water scarcity is a well known problem in India particularly in the hard rock terrain of semi- arid climatic condition, where groundwater level has considerably declined due to over-exploitation and irregular rainfall. Existing bore-wells (∼60 m deep) in Andhra Pradesh are not yielding enough water to fulfill the requirement (Rao et al. 2008). TERI’s report (2003) brings astonishing details on the existing as well as the impending water cri- sis in India. The investigation presents the declin- ing trend of water storage since 1947 to 1997 and projects a dismal scenario of India by 2047. The annual per capita water availability in India fell by 62% in the first 50 years of independence and the trend may likely to worsen in the next 50 years with a projected 67% decline. The underground reser- voirs are expected to dry by 2025 in as many as 15 states in India, if the present level of exploita- tion and misuse of underground water continues. Decision support tool developed in granitic ter- rain of Mahaeshwram watershed in southern India projected that 50% of the existing wells go dry in few years causing serious socio-economic con- sequences, if the present trend of groundwater exploitation continues. Hence it was suggested for change in the cropping pattern as well as artificial groundwater recharge (Dewandel et al. 2007). Though the groundwater is replenishable due to rainfall, the imbalance between recharge and pumping is widening due to increasing population Keywords. Geophysics; collinear and transverse pole–pole array; groundwater resources; deep potential aquifer; fracture zone; granite. J. Earth Syst. Sci. 121, No. 6, December 2012, pp. 1455–1468 c Indian Academy of Sciences 1455

Welcome message from author
This document is posted to help you gain knowledge. Please leave a comment to let me know what you think about it! Share it to your friends and learn new things together.
Transcript
Exploring deep potential aquifer in water scarcecrystalline rocks
Subash Chandra∗, E Nagaiah, D V Reddy, V Ananda Rao and Shakeel Ahmed
CSIR – National Geophysical Research Institute, Uppal Road, Hyderabad 500 007, Andhra Pradesh, India.∗Corresponding author. e-mail: [email protected] chandra [email protected]
Characterization of the shear zone with pole–pole electrical resistivity tomography (ERT) was carriedout to explore deep groundwater potential zone in a water scarce granitic area. As existing field condi-tions does not always allow to plant the remote electrodes at sufficiently far of distance, the effect ofinsufficient distance of remote electrodes on apparent resistivity measurement was studied and shownthat the transverse pole–pole array affects less compared to the collinear pole–pole array. Correctionfactor have been computed for transverse pole–pole array for various positions of the remote electrodes.The above results helped in exploring deep aquifer site, where a 270 m deep well was drilled. Tempo-ral hydro-chemical samples collected during the pumping indicated the hydraulic connectivity betweenthe demarcated groundwater potential fractures. Incorporating all the information derived from differ-ent investigations, a subsurface model was synthetically simulated and generated 2D electrical resistivityresponse for different arrays and compared with the field responses to further validate the geoelectricalresponse of deep aquifer set-up associated with lineament.
1. Introduction
Water scarcity is a well known problem in Indiaparticularly in the hard rock terrain of semi-arid climatic condition, where groundwater levelhas considerably declined due to over-exploitationand irregular rainfall. Existing bore-wells (∼60 mdeep) in Andhra Pradesh are not yielding enoughwater to fulfill the requirement (Rao et al. 2008).TERI’s report (2003) brings astonishing details onthe existing as well as the impending water cri-sis in India. The investigation presents the declin-ing trend of water storage since 1947 to 1997 andprojects a dismal scenario of India by 2047. Theannual per capita water availability in India fell by62% in the first 50 years of independence and the
trend may likely to worsen in the next 50 years witha projected 67% decline. The underground reser-voirs are expected to dry by 2025 in as many as15 states in India, if the present level of exploita-tion and misuse of underground water continues.Decision support tool developed in granitic ter-rain of Mahaeshwram watershed in southern Indiaprojected that 50% of the existing wells go dryin few years causing serious socio-economic con-sequences, if the present trend of groundwaterexploitation continues. Hence it was suggestedfor change in the cropping pattern as well asartificial groundwater recharge (Dewandel et al.2007). Though the groundwater is replenishabledue to rainfall, the imbalance between recharge andpumping is widening due to increasing population
Keywords. Geophysics; collinear and transverse pole–pole array; groundwater resources; deep potential aquifer; fracture
zone; granite.
J. Earth Syst. Sci. 121, No. 6, December 2012, pp. 1455–1468c© Indian Academy of Sciences 1455

1456 Subash Chandra et al.
associated with high agriculture activity based onthe groundwater.
The entire hydrogeological set-up in the hardrock region can be divided into two distinctgroundwater systems. One at shallow depth usuallylies in unconfined conditions with a local rechargeand dense pumping structures. This system ofaquifer is vulnerable to both for water scarcity aswell as contamination. The other one is at compar-atively deeper depth in confined or semi-confinedconditions with recharge source at a longer distanceand comparatively less groundwater withdrawal.Such a system is less vulnerable compared to shal-low one. Hence there is a need to explore the deepgroundwater potential fracture zones to meet thepresent demand.
A decade back, depth to groundwater was veryshallow, and exists in the weathered/laminatedportion of the hard rock areas. However, due tothe mounting stress on the groundwater system,water levels declined to the fissured zone. Eventhe deeper wells also turns dry due to limitedpotential of fracture system and extensive devel-opment. The fissured/fractured zone lying or con-nected with lineament still have better chances of
supplying the water even during the pre-monsoonperiod (Chandra et al. 2006a, 2010). As density offracture reduces with depth, exploration of deepfractures becomes a challenging task. The volumet-ric contribution of the deeper fracture to the totalsignal measured at surface become insignificant.
In general, the characteristic features of graniticaquifers that are found in the southern Indianpeninsula revealed that potential aquifers can befound up to a depth of around 60 m from thesurface except rarely captured deep fractures ofthe tectonic origin. Chandra et al. (2010) explored>60 m deep high yielding wells associated withthe quartz reef in granite host rock. Such fea-tures are mostly one dimensional and quite dif-ficult to delineate using surface geophysical tech-niques. This paper presents an approach adoptedto explore deep fracture systems associated withpotential groundwater zone, in a water scarcegranitic terrain located at APSP campus, Dich-pally, Nizamabad district in India (figure 1). Thisstudy was done to provide water to approximately1500 people belonging to the Andhra PradeshSpecial Police (APSP), 7th Batallian, Dichpally,Nizamabad.
78.16 78.17 78.18 78.19 78.2 78.21 78.22 78.23 78.24
Longitude (Deg. E)
18.55
18.56
18.57
18.58
18.59
18.6
18.61
18.62
18.63
18.64
Latit
ude
(Deg
. N)
Gunpur
DichpalliDusgaon
Mulangi
Bibipur
ER1ER2
ER3
ER4
395 m
408 m
421 m
434 m
447 m
460 m
473 m
486 m
499 m
512 m
525 m
538 m
APSP Campus
Elevation
Railway Line
Drainage Line
Surface Tank
Road
Niz
amsa
gar C
anal
U. Gondwana
L. Gondwana
Sullavai
Pakhal
Archean
Study Area (APSP Campus)Nizamabad
Andhra Pradesh
Godavari Basin
INDIA
Figure 1. Location map of APSP campus, Dichpally, Nizamabad (India).
Exploring deep potential aquifer in water scarce crystalline rocks 1457
2. Study area
APSP campus is located in Dichpally villageof Nizamabad district (i.e., ∼135 km NNW ofHyderabad) in Andhra Pradesh covering 19◦–20◦N and 77◦–79◦E (figure 1). The shallow aquifersystem is having limited groundwater potentialand almost meager groundwater available duringsummer months. The area is covered by penin-sular gneissic complex, which includes variouslitho-units, mainly granites and gneisses withnumerous enclaves of older metamorphic rocks ofdiverse mineralogy (Dubbak 1990; Perraju andNatarajan 1977; Rao et al. 2008). Several protero-zoic dolerite dykes and also quartz intrusions areseen in the area trending in N–S direction. Cre-taceous basalts are covered in the south-west andsouth-eastern parts.
The study area is the south-western fringe zoneof a major lineament called Godavari rift valleyrunning NW–SE direction. The multi-stage devel-oped Godavari rift valley created several weakzones/faults in basement rock at their respectiveboundaries (Sarma and Rao 2005). These weakzones are potential zones for groundwater occur-rence. Geophysical methods are used to identifythese weak zones in order to explore deep ground-water potential zones.
3. Hard rock aquifer characteristics
Groundwater resources in crystalline rocks such asgranites, gneisses and schists is mainly restricted toweathered and to some extent to the fracture zones.Due to high heterogeneity in the hard rock, espe-cially in terms of fracture system, the aquifer char-acteristics vary from place to place and thereforethe water holding capacity of these rocks also varydrastically in space (Chandra et al. 2006a, 2008).In hard rock regions, groundwater occurs mainly at
the top in weathered/laminated granite and otherpore spaces found in the form of cracks, jointsand fractures developed as a result of some geo-logical process. Weathering and fissuring are inter-linked processes. For example, biotite in granite isrelatively more susceptible to weathering when itcomes in to contact with moisture (Eggler et al.1969; Ledger and Rowe 1980) and the resultantswelling increase the volume favouring the develop-ment of cracks and fissures (Dewandel et al. 2006).However, there are other types of fractures gener-ated due to tectonic activities, which are supposedto be extended to a large distance horizontally aswell as sub-vertically which favour the groundwatermovement (Sukhija et al. 2006). Fissuring is mostlycontrolled by geomorphology of the area and thustheir extension may not be very large. Whereas,the tectonic fractures may be of large dimensionbased on the strength of the tectonic activity.
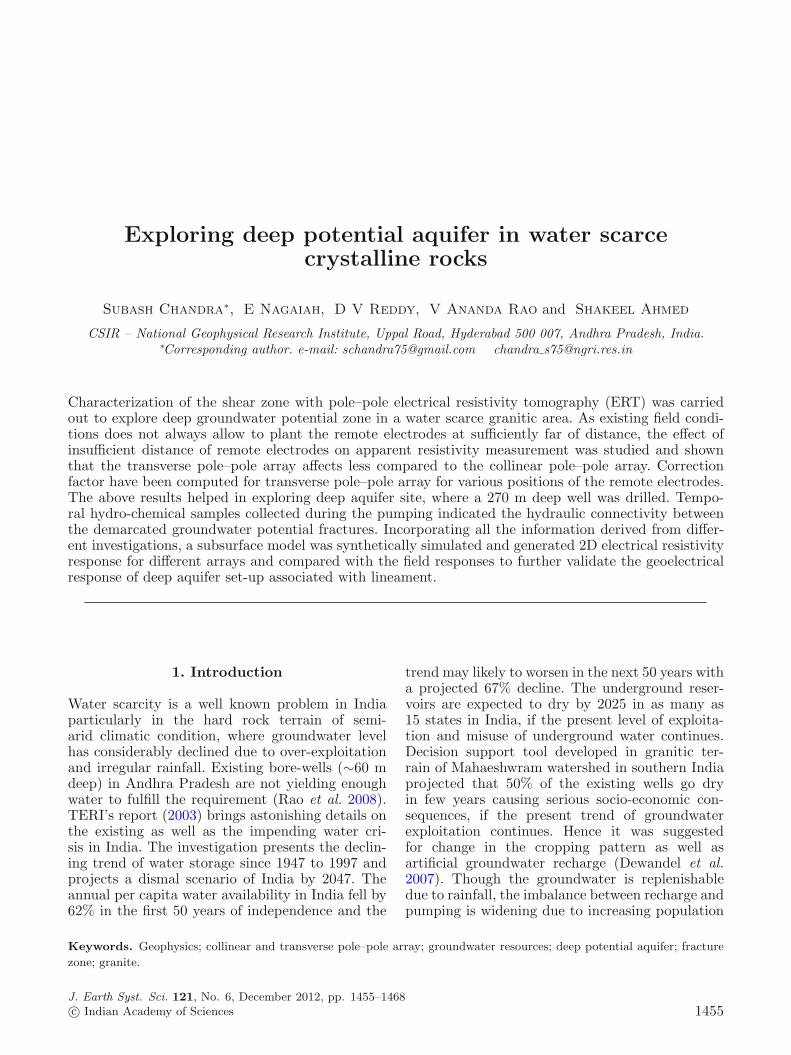
Wyns et al. (2004) have given a simplified geo-logical model describing various litho units in hardrocks (figure 2). The units are described from topto bottom as: (i) saprolite or regolith, derived fromprolonged in situ decomposition of bed rock with athickness varying from negligible, where eroded tofew tens of meters. The base of the saprolite is fre-quently laminated, constituted by a relatively con-solidated weathered parent rock (Eswaran and Bin1978; Acworth 1987; Sharma and Rajamani 2000;Chigira 2001; Dewandel et al. 2006), (ii) fissuredlayer consists of dense horizontal, sub-horizontaland sub-vertical fissures (Houston and Lewis 1988;Howard et al. 1992; Marechal et al. 2003; Wynset al. 2004), and then (iii) compact bedrock, thatmay locally exhibit tectonic fracturing. The fis-sured layer is generally characterized by two sets offissures like sub-horizontal and sub-vertical, wheredensity decreases with depth (Houston and Lewis1988; Howard et al. 1992; Dewandel et al. 2006;Chandra et al. 2008) and assume the transmissivefunction of the composite aquifer. The lithological
Figure 2. Simplified geological weathering profile of hard rock aquifer (after Wyns et al. 2004).

1458 Subash Chandra et al.
model shows dominance of lateral fracture over ver-tical, which is probably the characteristic propertyof the hard rock generated due to fissuring; how-ever, the deeper fractures could be generated dueto tectonic activity.
With the consequence of groundwater over-exploitation, water level is receding annually andthus, at present, confined to fissured/fracturedzones. Groundwater movement in the fractured/fissured zone is dependent on the fracture network.Therefore, this zone is also called as semi-confinedaquifer as water struck while drilling at deeperlevel rises upward to maintain the hydraulic andatmospheric pressure balance.
4. Methodologies used
Referring to Wyns et al.’s (2004) lithological modelof hard rock, it was planned to explore the deepfractured granite associated with lineament thatmay qualify into potential aquifer. Thus, Shut-tle Radar Topographic Mission (SRTM) data aswell as geological map of the area were stud-ied to prepare lineament map followed by fieldground surveys. Four ERT profiles with Wenner–Schlumberger array were carried out first to con-firm the existence of lineament in the field fol-lowed by deep characterization by pole–pole ERT.To overcome the practical problem of insufficientdistance for remote electrodes, these were plantedin transverse direction of the profile and cor-rection factor (to be multiplied with the mea-sured apparent resistivity data before its inversionfor true resistivity) was computed for the exist-ing field condition. Based on the ERT results, asite was selected and drilled to cross-check theERT results and also to understand the hard rockcomplexity. Temporal hydro-chemical data wereanalyzed to find out the interconnectivity of theobserved fractures. Hydraulic conductivity for dif-ferent zones has been estimated from electricalresistivity parameters. To have a cross validationof all the geophysical results, synthetic simula-tion has been carried out to generate 2D electricalresistivity response of shear zone across profile.
5. Results and discussions
5.1 Geomorphology
It is quite evident from the earlier studies thatlineaments play a vital role in exploring thegroundwater potential sites (Lattman and Parizek1964; Mabee et al. 1994; Magowe and Carr 1999;Chandra et al. 2006a; Solomon and Quiel 2006).Field studies were carried out to map the lineamentpattern in the study area using the Shuttle Radar
Topographic Mission (SRTM) images, remote sens-ing data of Landsat image of ETM+2000 (Path-144and Row-47 form USGS website www.landsat.org).Visual interpretation of the SRTM data, revealedcluster of regional lineaments within the base-ment rock trending in different directions suchas NW–SE, NNW–SSE, NNE–SSW and NE–SW(figure 3a, b). The NW–SE lineaments are predom-inant in the region running hundreds of kilometers.
The geological map of Nizamabad districtobtained from Geological Survey of India (1995)has also been studied for structural interpreta-tion of the study area around Dichpally (figure 3c,d). It has also revealed similar features, i.e., thereare three sets of lineaments trending in NW–SEand NE–SW and N–S to NNE–SSW directions.The major lineaments of NW–SE are cross-cut byNE–SW lineaments. The NW–SE trend resemblesa major deformed zone, which acts as a shear zoneand other directions of lineaments could be frac-tures resulting from the shear zone. Deccan basalticflows are also covered in the surface area in thesouth of Dichpally. The major NW–SE lineamentrunning from Dichpally joins Godavari river, ori-ented in the east-west direction locally. Severaldolerite dykes with varying length (few metersto several kilometers) and width (10–50 m) arealso seen traversing N–S direction passing east ofDichpally (figure 3c, d). But majority of dykesare running in NE–SW direction located at thesouthern portion.
Field observations reveal that the tonalities andyounger granites have undergone brittle to ductiledeformation at several places. Phyllonitic natureand shear zone imprints of small scale arcuate pat-terns found in the basement tonalities at Dusgaonvillage represent NW–SE ductile shearing. Grey topink porphyritic granites of younger intrusions inbasement tonalities were observed at several places.The fractures in the granites have been intrudedby number of thin quartz veins that may interruptthe groundwater movement.
5.2 Electrical resistivity
Having wide range of resistivity for different geo-logical materials, electrical methods are the firstpreference for the various hydrogeological problems(Keller and Frischknecht 1966; Kelly and Frohlich1985; Singhal et al. 1998; Barker et al. 2001; Jainet al. 2003; Chand et al. 2004; Rao and Chandra2005; Krishnamurthy et al. 2006; Chandra et al.2006b,c, 2010; Dhakate et al. 2008). Vertical elec-trical sounding by Schlumberger array is the mostcommonly employed method to demarcate the ver-tical resistivity distribution. The geomorphologi-cal study reveals that the APSP campus falls on

Exploring deep potential aquifer in water scarce crystalline rocks 1459
(a) (b)
(c)
(d)
Figure 3. (a) SRTM; (b) interpreted lineament map from SRTM; (c) geological map; and (d) interpreted lineament fromgeological map of the study area and its surroundings.
a shear zone lineament, and hence, 1-D sound-ings are vulnerable to the near surface inhomo-geneity (NSI) effects that mislead the resistivityinterpretation (Chandra et al. 2004). Therefore,2D electrical resistivity measurements were car-ried out to get the high resolution data. Four2-D ERT profiles (ER1, ER2, ER3 and ER4)with Wenner–Schlumberger were carried out in andaround the campus to investigate deep weathered-fissured/fractured granite associated with linea-ment. The profiles are 470 m long except ER2,i.e., 710 m long. The acquired data has beeninverted by RES2DINV inversion program (Lokeand Barker 1996; Loke 2000). The inverted resis-tivity images are arranged as per their layout infigure 4. Although the profiles ER1 and ER3 didnot give any expected response to lineament, a lit-tle indication of low resistivity anomaly (markedby arrow at 360 m on lateral scale in figure 4)was observed in ER2. Chandra et al. (2010) stud-ied ERT response of lineament for varying field
conditions and noise levels and shown that suchpoor resistivity anomaly could also be the result ofrandom noise in the field data. Still it cannot beignored completely as the anomaly lies at the cen-tre of the profile, which is high sensitive zone ofthe Wenner–Schlumberger array. However, it needsfurther detailed investigation to the deeper level.The profile ER4 lying outside the campus has givensignificant anomalous low resistivity zone at 265 mlateral scale. A line joining to these points foundoriented in NW–SE direction corresponding to themajor lineament as shear zone marked in lineamentmap and geological map of Nizamabad. Although,ER4 has reflected higher degree of anomaly, it liesoutside the campus. The objective was to providedeep groundwater potential well inside the campusand hence, in spite of poor indication in ER2 imagethat falls inside the campus, was selected for deepersubsurface investigation, with the help of pole–poleERT of 10 m electrode spacing using Syscal pro 72instrument.

1460 Subash Chandra et al.
Arrow indicating low resistivity zone
Line of possible shear zone
N
ER1
ER4
ER2
ER3
APSP Campus
Figure 4. Wenner–Schlumberger ERT profiles at APSP campus and its vicinity and line of probable shear zone.
In pole–pole array, two electrodes (one current‘B’ and one potential ‘N’) need to be planted atinfinity distance called as remote electrodes, andother two electrodes (i.e., current ‘A’ and potential‘M’) take part in the measurement along the profile(figure 5a) called active electrodes. It is not alwayspossible to maintain the ideal infinity distance tothe remote electrodes due to various reasons suchas topographic undulations, busy road/rail tracks,forests, villages, cattle, etc. As the study area is oftriangular in shape and surrounded by roads andrail track, arranging the remote electrodes at faroff distance is not possible. In such situation, theplacement effect of the remote electrodes on theapparent resistivity was studied.
Two arrangements of pole–pole array have beenconsidered here, viz., (1) collinear pole–pole, wherethe remote electrodes are planted in the line ofprofile, and (2) transverse pole–pole, where remotecurrent and potential electrodes are planted intransverse direction on either side of the profile line(figure 5).
For the ΔV potential difference (mV) measureddue to current injection ‘I’ (mA), the apparent
resistivity ρa for half space can be calculated usingequation (1) given below:
ρa = KΔV
I(1)
where K is called as geometrical factor that isdetermined solely by the geometry of the electrodeset-up and can be calculated as:
K = 2π
[1
|AM| −1
|BM| −1
|AN| +1
|BM|
]−1
.
(2)
Using the above formula, geometrical factor Kc andKt respectively for collinear and transverse pole-pole arrays can be formulated as per figure 5(a):
Kc = 2πan2 − 1
n2 − n − 4(3)
Kt = 2πa
[1 − 1
2n− 1√
1 + n2
]−1
(4)
where ‘a’ is the distance between active elec-trodes AM and ‘na’ is the distance of the remote

Exploring deep potential aquifer in water scarce crystalline rocks 1461
Figure 5
0 10 20 30 40 50 60 70 80 90 1001
1.2
1.4
1.6
1.8
2
normalized remote electrode spacing (na) with AM ( a) i.e. n(=na/a)
Influ
enci
ng f
acto
r of
rem
ote
elec
trod
es
KcKt
4 5 6 7 8 9 101
1.2
1.4
1.6
1.8
2
normalized remote electrode spacing (na) with AM ( a) i.e. n(=na/a)
Influ
enci
ng f
acto
r of
rem
ote
elec
trod
es
KcKt
(a)
(b)
Collinear pole-pole
Active electrodes
Remote electrodes
Transverse pole-pole
a na
A M N B
na
N
a
na
na
A M
B
(c)
Figure 5. (a) Collinear and transverse pole–pole arrays, (b) influencing factor of remote electrodes on apparent resistivitymeasurement against normalized remote electrode spacing with active electrode spacing AM, and (c) zoom view of (b) forthe n in the range of 4–10.
electrodes from M . The array become ideal pole–pole when n is extremely large for which the abovegeometrical factor reduces to:
K∞ = 2πa. (5)
In this condition, it is immaterial which directionthe remote electrodes are planted, the apparentresistivity measurement is unaffected.
To visualize the effect of the collinear and trans-verse pole–pole arrays on the apparent resistivity,the geometrical factor has been calculated withvarying distance of remote electrodes. Figure 5(b)shows the computed geometrical factors (Kc andKt) for collinear and transverse pole–pole arraysnormalized with K∞ plotted against n, i.e., remoteelectrode spacing (BM) normalized with the active
electrodes spacing (AM). The effect of remoteelectrode reduces exponentially with increasingvalue of n and more or less become constant aftern reaches 10 or more. Therefore, it is universallyadopted to keep remote electrode at least 10 timesof the profile length for 1-D or largest value of AMin case of 2-D survey. Thus for 300 m long profile,remote electrodes are to be planted each at 3 kmaway that means total 6 km long wire has to bespread out solely for remote electrodes. But theproblem was difficult even to maintain 10 times fardistance to the remote electrodes and hence look-ing for small value of n, a clear difference can beseen between the Kc and Kt (figure 5c). The Kt
has lesser effect than the Kc. For example, Kc andKt reach to 1.42 and 1.55 respectively for n = 5.

1462 Subash Chandra et al.
Therefore in the present field, transverse pole–poleERT was planned with remote electrode position 5times (i.e., ∼1500 m) of the largest value of AM,i.e., 300 m.
Due to the existing field constraints, the remoteelectrodes distance was compromised to 5 timesinstead of 10, correction factor (C.F.) was com-puted (i.e., C.F.=Kt/K∞) to overcome the effectof remote electrodes on the apparent resistivity.Figure 6(a) demonstrate the computed correctionfactor curve with varying electrode separation(AM) keeping the remote electrodes at varying dis-tances, viz., 500, 525, 550, 600, 750, 1000, 1500,2500, 4500 and 7500 m. For each curve, positionof the remote electrodes is fixed. Closer the remoteelectrodes, higher the degree of influence on appar-ent resistivity and hence higher the correction fac-tor which is quite obvious. Thus the pole–pole
ERT were processed by incorporating the remoteelectrodes location and inverted to get the actualformation resistivity distribution.
The pole-pole ERT has revealed subsurface elec-trical resistivity response up to 285 m depth(figure 6b). The central low resistivity anomalyobserved in the Wenner–Schlumberger image waswell resolved, which is significantly low in the rangeof 300–500 Ωm continuing to the bottom of the pro-file. High RMS error (i.e., 9.7) was expected dueto laterally heterogeneous media, but the low resis-tivity anomaly of the order of 100 Ωm observedon the bottom edges was surprising. Therefore, theinverted data was checked for sensitivity distribu-tion that is found in the range of 0.0785–19.4 andhence applying the cut-off sensitivity 0.125, lowsensitive part was removed (figure 6c). Now thehigh sensitive resistivity section was found up to
(a)
(c)
(d)
Recommended site for
0 50 100 150 200 250 300 3500
2
4
6
8
10
12
Active electrodes (AM) separation (m)
Co
rrec
tio
n f
acto
r
Correction factor for pole-pole array
y: 500 my: 525 m
y: 550 m
y: 600 m
y: 750 my: 1000 m
y: 1500 m
y: 2500 m
y: 4500 my: 7500 m
Figure 6. (a) Correction factor curve computed for varying positions of the remote electrodes, (b) transverse pole–poleERT section, and (c) transverse pole–pole ERT section after blanking out the low sensitive zone.

Exploring deep potential aquifer in water scarce crystalline rocks 1463
240 m depth, where one can rely and take thedecision.
As the electrolytic conduction is mainly respon-sible for current flow in granite, the low resistivityis an indication of weaker, i.e., weathered-fracturedzone saturated with water. Such thick and deepanomalous zone is considered as an indication ofdeep tectonic fractures saturated with water andhence recommended for drilling of the deep well atthe centre of ER2 profile.
6. Validation
To validate the above results, a well (NB-1) hasbeen drilled at the recommended site down to adepth of 270 m, where number of fracture zonehas been encountered at different depths withthe ingress of water at ∼31, 110, and 180 mrespectively. Drilling authority reported occurrenceof enormous amount of water yielding around∼15 m3/h and hence drilling was stopped at 270 m.A motor has been installed at 225 m depth toexploit the groundwater for drinking purposes. Thebore well is supplying the water with the same yieldsince 2008. The well was logged for electrical resis-tivity measurement that has confirmed the wateringress depths in the form of low resistivity (fig-ure 6d). There is an additional low resistivity zoneencountered at ∼67 m depth indicating a thin sheetjoint. Further validation was carried out by ana-lyzing the temporal hydro-chemical distribution ofpumped groundwater and synthetic simulation ofERT response of shear zone lineament.
6.1 Hydrochemical analysis
The mechanism of groundwater flow in fracturedhard rocks, where inhomogeneties and discon-tinuities have a dominant role to play, is asimportant as that siting a well. Yield of a borewell in the multi-fracture system is dependingon the individual fracture thickness, its watersource and inter-communication, between the dif-ferent fracture systems. To understand the aquiferinter-communication, hydrochemical and isotopicmethods are quite useful (Mazor 1991; Sukhijaet al. 2006).
Geomorphological and geosynthetic methodsadopted in the study area resulted drilling of 270 mdeep bore well with existence of three groundwa-ter potential fracture zones. In order to find outits interconnectivity, hydrochemical analysis andC-14 dating were attempted. Apart from the drilleddeep well (NB-1), two more samples were also col-lected for hydrochemistry and C-14 dating from thenearby existing shallow bore wells (∼67 m) (i.e.,PB-2 at ∼25 m and PB-3 at ∼300 m distance) T
able
1.
Tem
pora
lhyd
roch
emic
aldis
trib
ution
in270
mdee
pwel
l(N
B-1
).
Tim
eSam
pling
ehC
ond
TD
SN
aK
Mg
Ca
Cl
SO
4H
CO
3N
O3
F
Loca
tion
(min
)date
pH
mV
μS/cm
mg/l
Wate
rty
pe
NB
-1-S
10
16/5/2008
6.7
1900
480
40.9
7.1
27.2
118.6
57.8
29.2
500.2
30.9
1.1
Ca-M
g-H
CO
3
NB
-1-S
-20
10/2/2009
6.6
1−
18
1270
680
58.2
5.2
32.0
140.8
134.4
34.7
488.0
52.6
0.6
Ca-M
g-H
CO
3-C
l
NB
-1-S
-35
10/2/2009
6.4
−5
1250
670
57.6
4.8
31.6
139.4
127.0
44.0
475.8
43.7
1.2
Ca-M
g-H
CO
3-C
l
NB
-1-S
-410
10/2/2009
6.3
9−
41160
620
53.2
5.0
29.3
131.2
113.9
36.1
469.7
40.2
0.7
Ca-M
g-H
CO
3-C
l
NB
-1-S
-515
10/2/2009
6.4
8−
9921
491
40.9
4.5
24.5
110.0
68.1
29.4
457.5
29.4
0.7
Ca-M
g-H
CO
3
NB
-1-S
-650
10/2/2009
6.8
4−
30
877
467
38.4
4.4
23.5
107.0
59.5
27.0
451.4
30.1
0.7
Ca-M
g-H
CO
3
PB
-20
10/2/2009
6.4
8−
9890
474
41.3
3.7
25.2
108.0
67.7
32.3
442.3
36.4
0.9
Ca-M
g-H
CO
3
PB
-30
10/2/2009
6.6
6−
22
948
505
48.3
4.2
25.6
108.5
82.4
26.7
436.2
31.9
1.1
Ca-M
g-N
a-H
CO
3-C
l
1464 Subash Chandra et al.
to understand the communication between shallowand deep aquifers.
Initially, one sample was collected from thenewly drilled bore well using a simple bailor forhydrochemical measurements 10 days after thedrilling. A 17.5 HP submersible pump was installedin the well at a depth of 225 m and has beenpumped continuously for their use. The pump wasstopped for few days before the C-14 sample col-lection. At the time of C-14 sample collection, assoon as the pump started, a sample is collected forhydrochemistry and four more samples were col-lected at different intervals during the 50 min. ofpumping (table 1). For carbon-14 dating ∼150 ltrsample collected after ∼10 min. of pump started.
Hydrochemical analysis (major ions includingpH, conductivity and TDS) and C-14 dating weremade at NGRI Laboratory. The hydrochemicaldata provided some useful information on inter-connectivity of different fractures. As it can be seenfrom table 1, the concentration of different chem-ical constituents are having great difference whenthe sample was bailed out from the water table10 days after the drilling and the 1st sample col-lected from the deep aquifer by submersible pump(table 1). The first sample is relatively more min-eralized (∼1.5 times) than the shallow well waters.The total dissolved solids (TDS) of deeper water
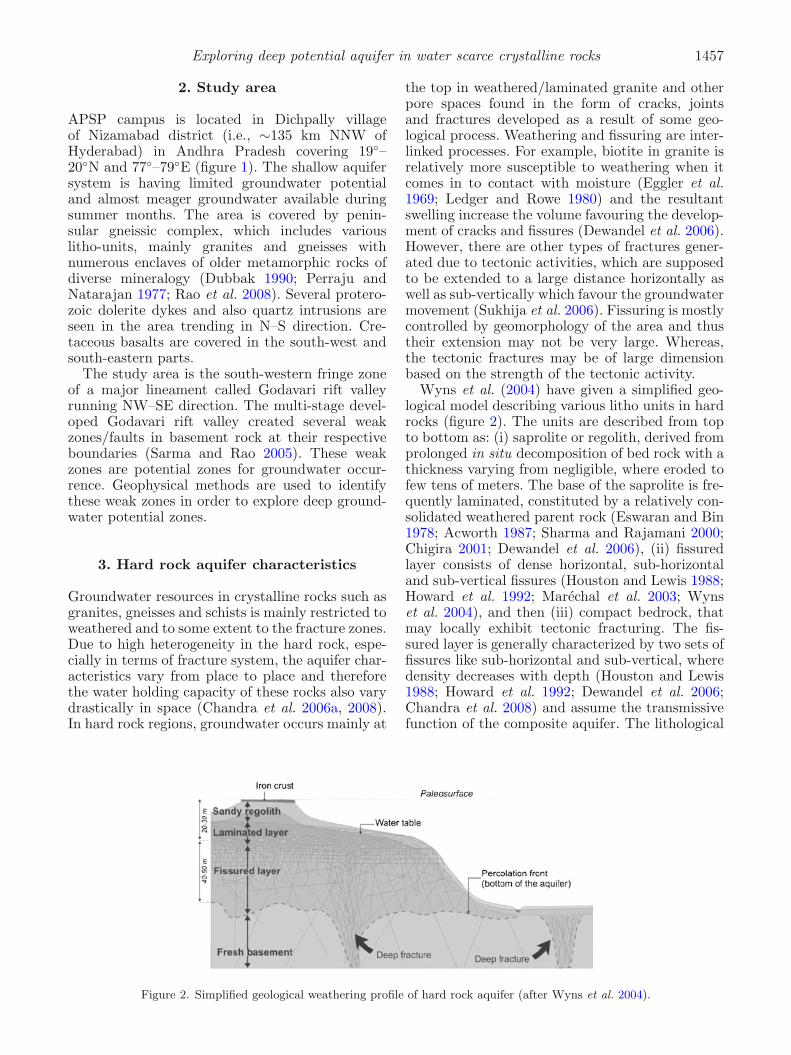
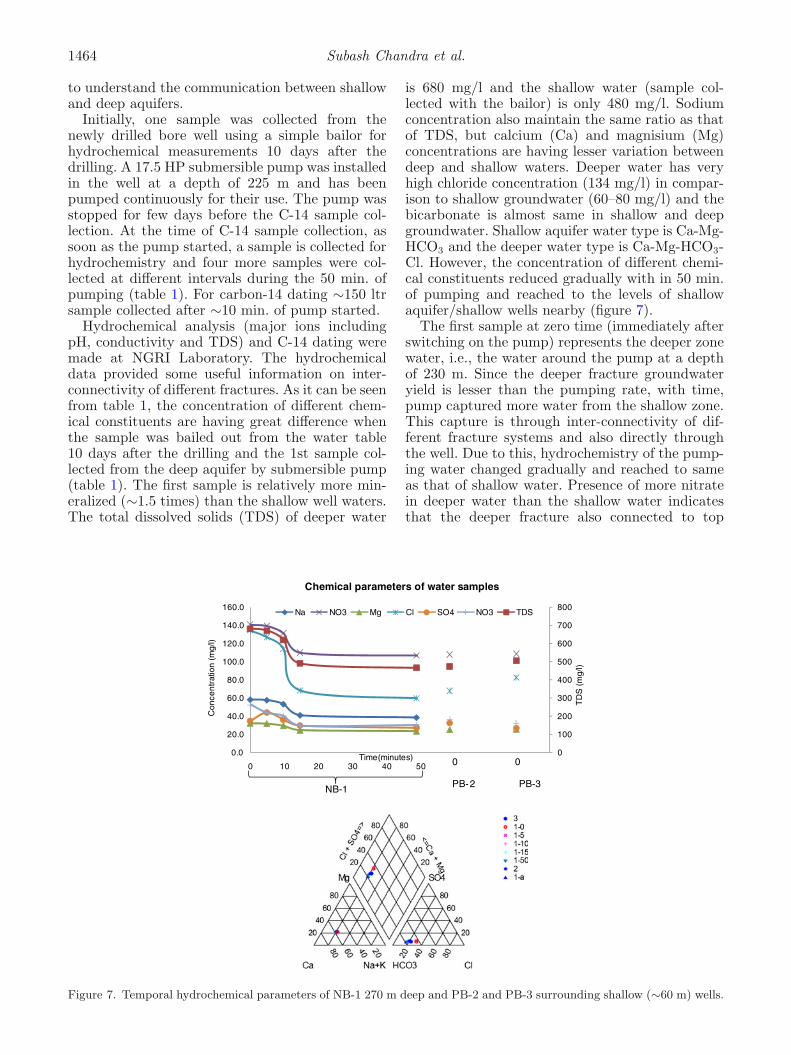
is 680 mg/l and the shallow water (sample col-lected with the bailor) is only 480 mg/l. Sodiumconcentration also maintain the same ratio as thatof TDS, but calcium (Ca) and magnisium (Mg)concentrations are having lesser variation betweendeep and shallow waters. Deeper water has veryhigh chloride concentration (134 mg/l) in compar-ison to shallow groundwater (60–80 mg/l) and thebicarbonate is almost same in shallow and deepgroundwater. Shallow aquifer water type is Ca-Mg-HCO3 and the deeper water type is Ca-Mg-HCO3-Cl. However, the concentration of different chemi-cal constituents reduced gradually with in 50 min.of pumping and reached to the levels of shallowaquifer/shallow wells nearby (figure 7).
The first sample at zero time (immediately afterswitching on the pump) represents the deeper zonewater, i.e., the water around the pump at a depthof 230 m. Since the deeper fracture groundwateryield is lesser than the pumping rate, with time,pump captured more water from the shallow zone.This capture is through inter-connectivity of dif-ferent fracture systems and also directly throughthe well. Due to this, hydrochemistry of the pump-ing water changed gradually and reached to sameas that of shallow water. Presence of more nitratein deeper water than the shallow water indicatesthat the deeper fracture also connected to top
0
100
200
300
400
500
600
700
800
0.0
20.0
40.0
60.0
80.0
100.0
120.0
140.0
160.0
0 10 20 30 40 50 60 70 80
Con
cent
ratio
n (m
g/l)
Time(minutes)
Chemical parameters of water samples
Na NO3 Mg Cl SO4 NO3 TDS
NB-1
0 0
PB-2 PB-3
TD
S (
mg/
l)
Figure 7. Temporal hydrochemical parameters of NB-1 270 m deep and PB-2 and PB-3 surrounding shallow (∼60 m) wells.
Exploring deep potential aquifer in water scarce crystalline rocks 1465
shallow fractures/vadose zone in the nearby area.The C-14 results of the deep as well as shallowwells indicated only Modern age (about 50 years).These two observations indicate that though thedeep well encountered multilayer aquifer system(sheet joints), being the shear zone, the sheet jointsare connected by a network of vertical joints.
6.2 Synthetic 2D resistivity modelling
Although, all the observations have been foundcorroborating with each other, a little differenceor some additional information was given by dif-ferent approaches such as the resistivity responsein ER2 Wenner–Schlumberger image was confinedto shallow level (i.e., 91 m) with little indica-tion of lineament, whereas transverse pole–poleERT has strongly reflected lineament with an
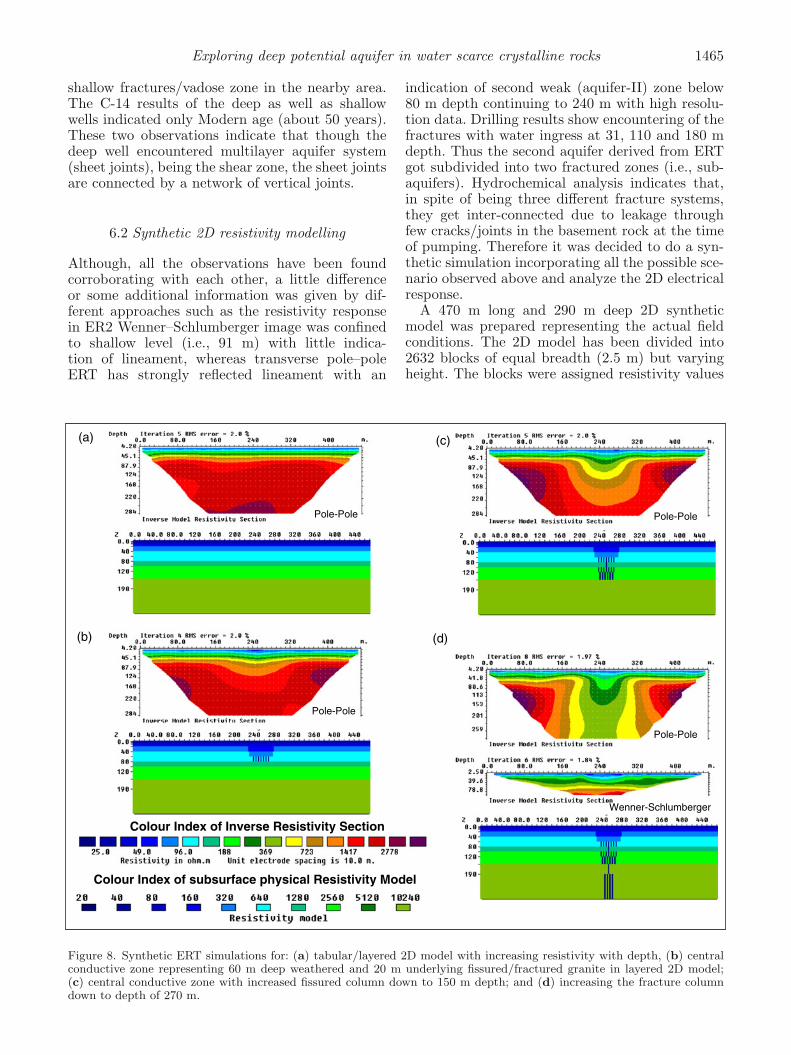
indication of second weak (aquifer-II) zone below80 m depth continuing to 240 m with high resolu-tion data. Drilling results show encountering of thefractures with water ingress at 31, 110 and 180 mdepth. Thus the second aquifer derived from ERTgot subdivided into two fractured zones (i.e., sub-aquifers). Hydrochemical analysis indicates that,in spite of being three different fracture systems,they get inter-connected due to leakage throughfew cracks/joints in the basement rock at the timeof pumping. Therefore it was decided to do a syn-thetic simulation incorporating all the possible sce-nario observed above and analyze the 2D electricalresponse.
A 470 m long and 290 m deep 2D syntheticmodel was prepared representing the actual fieldconditions. The 2D model has been divided into2632 blocks of equal breadth (2.5 m) but varyingheight. The blocks were assigned resistivity values
Colour Index of Inverse Resistivity Section
Colour Index of subsurface physical Resistivity Model
(a)
(b)
(c)
(d)
Pole-Pole
Pole-Pole
Pole-Pole
Pole-Pole
Wenner-Schlumberger
Figure 8. Synthetic ERT simulations for: (a) tabular/layered 2D model with increasing resistivity with depth, (b) centralconductive zone representing 60 m deep weathered and 20 m underlying fissured/fractured granite in layered 2D model;(c) central conductive zone with increased fissured column down to 150 m depth; and (d) increasing the fracture columndown to depth of 270 m.

1466 Subash Chandra et al.
in increasing order with depth considering thealteration in the granite reduces with depth result-ing in reduction of volumetric percentage of waterwhich causes rise in resistivity. Although num-ber of synthetic simulations were performed, onlyfour typical models are presented in figure 8, i.e.,(i) horizontal stratified subsurface with increasingresistivity with depth; (ii) horizontal stratifiedsubsurface with 80 m deep central low resistivityblocks; (iii) horizontal stratified subsurface with150 m deep central low resistivity blocks; and (iv)horizontal stratified subsurface with 270 m centrallow resistivity blocks. The central blocks wereassigned 20 Ωm resistivity to represent water satu-rated pores found due to fractures. Apparent resis-tivity data were generated for Wenner–Schlumbergerand pole–pole arrays using RES2DMOD and pro-duced true resistivity subsurface model after inver-sion of apparent resistivity data by RES2DINV.Prior to inversion, 2% random error was added tothe apparent resistivity data to bring the simula-tion results to the real field conditions.
The first inverted true resistivity model has pro-duced almost similar layered 2D resistivity struc-ture as well as same order of resistivity to thesynthetic subsurface model. As the depth level ofthe low resistivity blocks are increasing in sec-ond, third and fourth synthetic models, loweringof the low resistivity front could also be seen inthe inverted resistivity models of the correspondingprofiles. Figure 8(d) represents both the Wenner–Schlumberger and pole–pole images for the same
synthetic model. The inverted 2D synthetic sec-tions are reasonably close to the field sections.
It is important to note that, even the shallowlow resistivity blocks produce the low resistivityanomaly to the greater depths than the actual. Forexample, low resistivity blocks assigned up to 80 mand 150 m in figure 8(b and c) respectively weregiven relatively significant anomaly to the corre-sponding depth. But anomaly pattern (with lesscontrast) also continue roughly to its double theactual depth level. Thus, a care should be takenwhile considering the depth of the geological targetand hence suggested to look for the significantlystrong anomaly.
Thus, the investigation results obtained from thevarious methods are validated and the syntheticmodel in figure 8(d) can be taken as quite closeto real subsurface condition. Although the presentdata is not sufficient to prepare actual weatheringcross section, but to visualize ground condition, allthe observations are integrated and prepared 2Dcross section of weathering profile of the shear zonethat shows top saprolite followed by underlyingweathered-fissured, fissured and compact granite(figure 9). The central zone with dense fractures isnothing but the shear zones and the fracture zonedemarcated through geophysics and conformed bydrilling can be seen at different depths.
The integrated study has helped in exploring adeep potential groundwater zone in APSP cam-pus falling in water scarce granitic terrain inNizamabad district, Andhra Pradesh (India). It
Distance (m)
NB-1 PB-2 PB-3
Dep
th (
m)
Weathered fissured granite
Fissured granite
Saprolite
Shear zone
Compact granite
Sheet joint
Figure 9. 2D profile of weathering cross section of shear zone prepared based on the investigations.

Exploring deep potential aquifer in water scarce crystalline rocks 1467
has shown the existence of multi-aquifer set-upassociated with lineament in granitic hard rockterrain.
7. Summary and conclusion
In the present study, groundwater potential zoneat much deeper level was investigated using inte-grated geomorphological and geophysical inves-tigations. The deep aquifer system appears tohave multi-fractured zones with higher permeabil-ity than usually expected. As the area experi-enced several tectonic events and is associated withGodavari rift valley, it is supposed to create a wideshear zone.
The geomorphology played an important role inselecting suitable sites for carrying out deep geo-physical surveys with high degree of chances tomeet the objective. Brittle deformation features arewater bearing and are associated with the forma-tion of deep open cavities that enhance the perme-ability of the country rocks. The studies suggestthat the structures having a NW–SE strike direc-tion are more likely to be under extension andtherefore open, hence they are the primary hydro-geological targets.
Integrating all the factors, such as, the studyarea is the part of the NW–SE trending shear zone,SW fringe of the Godavari rift zone, major linea-ment traversing in NW–SE as well as conductivethick zone obtained at deeper level; the site wasconsidered favourable for deep water potential zoneand was recommended for drilling. The 270 m deepdrilling confirmed the geophysical anomalies. Amulti-aquifer system with two deep thick tectonicfracture zones at ∼110 and 180 m depths are firsttime encountered. Interconnectivity of differentwater bearing zones validated through change inhydrochemical concentration during the pumping.
The study also demonstrated that the transversepole–pole array is preferable over the collinearpole–pole array where remote electrodes are diffi-cult to plant at sufficiently far distance. The pre-vious array has lesser influence compared to laterone on the apparent resistivity measurement.
Although the geophysical, drilling and hydro-chemical results revealed either little different orsome additional information, the synthetic simu-lation incorporating all the information producequite close response to the field ERT. Hence thefield ERT supported the existence of the multi-aquifer system composed of fractures in thegranitic terrain at Nizamabad. Synthetic simula-tion study also alerts that the depth of the hydo-geological target should be carefully decided basedon the resistivity anomaly. The anomalous pat-tern is roughly seen continuing double the depth of
the hydrogeological target in pole–pole ERT withweaker anomaly below the target depth.
The integrated approach has finally helped inexploring deep thick fracture zones in granitic ter-rain at Nizamabad district in Andhra Pradesh.This is a potential aquifer, which is yielding copiouswater to fulfill the groundwater demand of APSPcampus.
Acknowledgements
The authors acknowledge the support providedby the Director, NGRI, Hyderabad to carry outthis work. They are also thankful to AndhraPradesh Special Police, 7th Battalion, Dichpally,Nizamabad for the financial and logistic supportto carry out this study. Special thanks to APSPofficers Sri T Vijay Kumar, Executive Engineer,Sri V Ravi Kumar, Deputy Executive Engineers,Sri Srinivas and Sri Devender, Assistant Engineersfor taking the extra care. Help extended by DrDewashish Kumar, Mr T Yellappa, NGRI in datacollection and their valuable suggestions in prepar-ing the manuscript are greatly acknowledged. Theconstructive comments and suggestions by anony-mous reviewers are greatly appreciated, which hastremendously improved the quality of the paper.
References
Acworth R I 1987 The development of crystalline basementaquifers in a tropical environment; Quart. J. Eng. Geol.20 265–272.
Barker R, Rao T V and Thangarajan M 2001 Delineation ofcontaminant zone through electrical imaging technique;Curr. Sci. 81(3) 277–283.
Chand R, Chandra S, Rao V A and Jain S C 2004 Estimationof natural recharge and its dependency on sub-surfacegeoelectric parameters; J. Hydrol. 299 67–83.
Chandra S, Rao V A and Singh V S 2004 A combinedapproach of Schlumberger and axial pole-dipole configu-rations for groundwater exploration in hard rock areas;Curr. Sci. 86(10) 1437–1443.
Chandra S, Rao V A, Krishnamurthy N S, Dutta S andAhmed S 2006a Integrated studies for characterization oflineaments to locate groundwater potential zones in hardrock region of Karnataka, India; Hydrogeol. J. 14 767–776.
Chandra S, Atal S, Murthy N S K, Subrahmanyam K,Rangarajan R, Reddy D V, Nagbhushanam P, Murthy JV S, Ahmed S and Dimri V P 2006b Oozing of water inparts of Andhra Pradesh, India; Curr. Sci. 90 1555–1560.
Chandra S, Atal S, Reddy D V, Nagabhushanam P, MurthyN S K, Subrahmanyam K, Rangarajan R, Ahmed S andDimri V P 2006c Explication of water sprouting phe-nomenon observed in parts of Andhra Pradesh; J. Geol.Soc. India 68 157–159.
Chandra S, Ahmed S, Ram A and Dewandel B 2008 Esti-mation of hard rock aquifers hydraulic conductivity fromgeoelectrical measurements: A theoretical developmentwith field application. J. Hydrol. 35 218–227.
Chandra S, Dewandel B, Dutta S and Ahmed S 2010 Geo-physical model of geological discontinuities in a granitic
1468 Subash Chandra et al.
aquifer: Analyzing small scale variability of electricalresistivity for groundwater occurrences; J. Appl. Geophys.71 137–148.
Chigira M 2001 Micro-sheeting of granite and its relation-ship with landsliding specially after the heavy rainstormin June 1999, Hiroshima Prefecture; Japan Eng. Geol. 59219–231.
Dewandel B, Gandolfi J-M, Zaidi F K, Ahmed S andSubrahmanyam K 2007 A decision support tool withvariable agroclimatic scenarios for sustainable groundwa-ter management in semi-arid hard rock areas; Curr. Sci.92(8) 1093–1102.
Dewandel B, Lachassagne P, Wyns R, Marechal J C andKrishnamurthy N S 2006 A generalized 3-D geologicaland hydrogeological conceptual model of granite aquiferscontrolled by single or multiphase weathering; J. Hydrol.330 260–284.
Dhakate R, Singh V S, Negi B C, Chandra S and RaoV A 2008 Geomorphological and geophysical approachfor locating favourable groundwater zones in granitic ter-rain, Andhra Pradesh, India; J. Environ. Manag. 88(4)1373–1383.
Dubbak M M 1990 Groundwater resource and develop-ment potential of Nizamabad district, Andhra Pradesh,CGWB-SR Technical Report.
Eggler D H, Larson E E and Bradley W C 1969 Gran-ites, gneisses and the Sherman erosion surface, SouthernLaramie Range, Colorado, Wyoming; American J. Sci.267 510–522.
Eswaran H and Bin W C 1978 A study of deep weather-ing profile on granite in peninsular Malaysia: I. Physico-chemical and micromorphological properties; J. Soil Sci.Soc. America 42 144–149.
Houston J F T and Lewis R T 1988 Victoria provincedraught relief project, II. Borehole yield relationships;Ground Water 26 418–426.
Howard K W F, Hughes M, Charlesworth D L and Ngobi G1992 Hydrogeologic evaluation of fracture hydraulic con-ductivity in crystalline basement aquifers of Uganda;Hydrogeol. J. 1 55–65.
Jain S C, Chand R, Rao V A, Chandra S, Prakash B A,Negi B C, Sharma M R K and Seth D P 2003 Evolutionof cost effective and sustainable management schemes ofwater resources in Bairasagara Watershed, Kolar District,Karnataka, NGRI-2003-GW-391, 46p.
Keller G V and Frischknecht F C 1966 Electrical methods ingeophysical prospecting; First edn, Pregamon Press Inc.
Kelly W E and Frohlich R K 1985 Relation between aquiferelectrical and hydraulic properties; Ground Water 23(2)182–189.
Krishnamurthy N S, Dutta S, Girard J F, Rao V A,Chandra S, Kumar D, Marc D, Gouez J M, BaltasatJ M, Dewandel B, Gandolfi J M, Voullamoz J M andAhmed S 2006 Electrical resistivity tomography and mag-netic resonance sounding studies for characterising theweathered-fractured aquifer in A.P., India, NGRI-2006-GW-529.
Lattman L H and Parizek R R 1964 Relationship betweenfracture traces and the occurrence of groundwater incarbonate rocks; J. Hydrol. 2 73–91.
Ledger E B and Rowe M W 1980 Release of uranium fromgranitic rocks during in situ weathering and initial erosion(central Texas); Chem. Geol. 29 227–248.
Loke M H 2000 Electrical imaging surveys for environmentaland engineering studies: A practical guide to 2-D and 3-Dsurveys, 67p.
Loke M H and Barker R D 1996 Rapid least-squares inver-sion of apparent resistivity pseudosections by a quasi-Newton method; Geophys. Pros. 44 131–152.
Mabee S B, Hardcastle K C and Wise D W 1994 A methodfor collecting and analyzing lineaments for regional scalefractured bed rock aquifer studies; Ground Water 32(6)884–894.
Magowe M and Carr J R 1999 Relationship between linea-ments and ground water occurrence in western Botswana;Ground Water 37 282–286.
Marechal J C, Dewandel B, Subrahmanyam K and TorriR 2003 Review of specific methods for the evaluationof hydraulic properties in fractured hard-rock aquifers;Curr. Sci. 85(4) 511–516.
Mazor E 1991 Applied chemical and isotopic groundwaterhydrology ; Open University Press, Milton Keynes, UK,274p.
Perraju P and Natarajan V 1977 Peninsular gneiss innorthern parts of A.P.; J. Geol. Soc. India 18(5).
Rao V A and Chandra S 2005 Delineation of aquifer geome-try in Bairasagara watershed, Kolar District, Karnataka;J. Appl. Hydrol. xviii 66–73.
Rao V A, Kumar D, Chandra S, Nagaiah E, Kumar A, Ali Sand Ahmed S 2008 High-resolution Electrical Resistiv-ity Tomography (HERT) Survey for Groundwater Explo-ration at APSP Campus, Dichpally, Nizamabad district,Andhra Pradesh, Tech. Rep. No. NGRI-2008-GW-626.
Sarma B S P and Rao M V R K 2005 Basement structure ofGodavari basin, India – geophysical modeling; Curr. Sci.88(7) 1172–1174.
Sharma A and Rajamani V 2000 Weathering of gneissicrocks in the upper reaches of Cauvery river, south India:Implications to neotectonics of the region; Chem. Geol.166 203–233.
Singhal D C, Sri Niwas, Shakeel M and Adam B M 1998Estimation of hydraulic characteristics of alluvial aquiferfrom electrical resistivity data; J. Geol. Soc. India 51461–470.
Solomon S and Quiel F 2006 Groundwater study usingremote sensing and geographical information systemsin the central highland of Eritrea; Hydrol. J. 14(6)1029–1041.
Sukhija B S, Reddy D V, Nagbhushanam P, BhattacharyaS K, Jani R A and Kumar D 2006 Characterization ofrecharge processes and groundwater flow mechanism inweathered-fractured granites of Hyderabad (India) usingisotopes; Hydrogeol. J. 14 663–674.
TERI’s report 2003 TERISCOPE at http://www.teriin.org/teriscope/resupdates/oasis.htm
Wyns R, Baltassat M, Lachassagne P, Legchenko A, VaironJ and Mathieu F 2004 Application of SNMR soundings forgroundwater reservoir mapping in weathered basementrocks (Brittany, France); Bull. Soc. Geol. Fr. 175(1)21–34.
MS received 25 January 2011; revised 17 January 2012; accepted 12 April 2012
Related Documents