Journal of Clinical Medicine Article Exploratory Study on Visual Acuity and Patient-Perceived Visual Function in Patients with Subretinal Drusenoid Deposits Manjot K. Grewal 1,2 , Shruti Chandra 1,2 , Sarega Gurudas 1 , Alan Bird 1 , Glen Jeffery 1 and Sobha Sivaprasad 1,2, * 1 Institute of Ophthalmology, University College London, London EC1V9EL, UK; [email protected] (M.K.G.); [email protected] (S.C.); [email protected] (S.G.); [email protected] (A.B.); g.jeff[email protected] (G.J.) 2 NIHR Moorfields Biomedical Research Centre, Moorfields Eye Hospital, London EC1V 2PD, UK * Correspondence: [email protected] Received: 18 July 2020; Accepted: 31 August 2020; Published: 1 September 2020 Abstract: Purpose: To investigate the value of visual acuity and patient-perceived visual function test when subretinal drusenoid deposits (SDD) are incorporated into the classification of age-related macular degeneration (AMD). A total of 50 participants were recruited into the study in these groups: healthy ageing (n = 11), intermediate AMD (iAMD) with no SDD (n = 17), iAMD with SDD (n = 11) and non-foveal atrophic AMD (n = 11) confirmed by two retinal imaging modalities. Best-corrected visual acuity (BCVA) and low luminance visual acuity (LLVA) were measured and low luminance deficit (LLD) was calculated. Participants were also interviewed with the low luminance questionnaire (LLQ). Linear regression was used to assess function–function relations. Compared with healthy participants, BCVA and LLVA scores were significantly reduced in the atrophic AMD group (p < 0.0001 and p = 0.00016, respectively) and in patients with SDD (p = 0.028 and p = 0.045, respectively). Participants with atrophy also had reduced BCVA (p = 0.001) and LLVA (p = 0.009) compared with the iAMD no SDD group. However, there were no differences in visual function tests between healthy aging and iAMD without SDD and between iAMD with SDD and atrophic AMD groups. The LLD score did not differ between groups. BCVA and LLVA correlated well. The LLQ did not correlate with visual function tests. This study shows that LLD is not a marker of disease severity as assessed clinically. Although LLQ is a good marker for disease severity using the current AMD classification, it does not differentiate between eyes with and without SDD. Eyes with non-macular geographic atrophy and SDD had lower function than eyes with no SDD and healthy controls. Keywords: subretinal drusenoid deposits; intermediate age related macular degeneration; retinal ageing; low-luminance questionnaire; low-luminance visual acuity; low-luminance deficit 1. Introduction Visual impairment due to advanced age-related macular degeneration (AMD) is a global public health burden, with an estimated 196 million people being affected world-wide [1]. The global prevalence of early/intermediate AMD is approximately 8% [1]. Several investigators are currently evaluating various options to prevent progression to advanced AMD. The typical inclusion criteria for these clinical trials are people with intermediate AMD characterised by the presence of large drusen >125 μm and/or pigmentary abnormalities. Recently, subretinal drusenoid deposits (SDD), otherwise termed reticular pseudodrusen (RPD), have been shown to co-exist with drusen in some eyes with early or intermediate AMD and these eyes J. Clin. Med. 2020, 9, 2832; doi:10.3390/jcm9092832 www.mdpi.com/journal/jcm

Welcome message from author
This document is posted to help you gain knowledge. Please leave a comment to let me know what you think about it! Share it to your friends and learn new things together.
Transcript

Journal of
Clinical Medicine
Article
Exploratory Study on Visual Acuity andPatient-Perceived Visual Function in Patientswith Subretinal Drusenoid Deposits
Manjot K. Grewal 1,2, Shruti Chandra 1,2 , Sarega Gurudas 1, Alan Bird 1, Glen Jeffery 1 andSobha Sivaprasad 1,2,*
1 Institute of Ophthalmology, University College London, London EC1V9EL, UK;[email protected] (M.K.G.); [email protected] (S.C.); [email protected] (S.G.);[email protected] (A.B.); [email protected] (G.J.)
2 NIHR Moorfields Biomedical Research Centre, Moorfields Eye Hospital, London EC1V 2PD, UK* Correspondence: [email protected]
Received: 18 July 2020; Accepted: 31 August 2020; Published: 1 September 2020�����������������
Abstract: Purpose: To investigate the value of visual acuity and patient-perceived visual functiontest when subretinal drusenoid deposits (SDD) are incorporated into the classification of age-relatedmacular degeneration (AMD). A total of 50 participants were recruited into the study in thesegroups: healthy ageing (n = 11), intermediate AMD (iAMD) with no SDD (n = 17), iAMD withSDD (n = 11) and non-foveal atrophic AMD (n = 11) confirmed by two retinal imaging modalities.Best-corrected visual acuity (BCVA) and low luminance visual acuity (LLVA) were measured and lowluminance deficit (LLD) was calculated. Participants were also interviewed with the low luminancequestionnaire (LLQ). Linear regression was used to assess function–function relations. Comparedwith healthy participants, BCVA and LLVA scores were significantly reduced in the atrophic AMDgroup (p < 0.0001 and p = 0.00016, respectively) and in patients with SDD (p = 0.028 and p = 0.045,respectively). Participants with atrophy also had reduced BCVA (p = 0.001) and LLVA (p = 0.009)compared with the iAMD no SDD group. However, there were no differences in visual function testsbetween healthy aging and iAMD without SDD and between iAMD with SDD and atrophic AMDgroups. The LLD score did not differ between groups. BCVA and LLVA correlated well. The LLQ didnot correlate with visual function tests. This study shows that LLD is not a marker of disease severityas assessed clinically. Although LLQ is a good marker for disease severity using the current AMDclassification, it does not differentiate between eyes with and without SDD. Eyes with non-maculargeographic atrophy and SDD had lower function than eyes with no SDD and healthy controls.
Keywords: subretinal drusenoid deposits; intermediate age related macular degeneration; retinalageing; low-luminance questionnaire; low-luminance visual acuity; low-luminance deficit
1. Introduction
Visual impairment due to advanced age-related macular degeneration (AMD) is a global publichealth burden, with an estimated 196 million people being affected world-wide [1]. The globalprevalence of early/intermediate AMD is approximately 8% [1]. Several investigators are currentlyevaluating various options to prevent progression to advanced AMD. The typical inclusion criteria forthese clinical trials are people with intermediate AMD characterised by the presence of large drusen>125 µm and/or pigmentary abnormalities.
Recently, subretinal drusenoid deposits (SDD), otherwise termed reticular pseudodrusen (RPD),have been shown to co-exist with drusen in some eyes with early or intermediate AMD and these eyes
J. Clin. Med. 2020, 9, 2832; doi:10.3390/jcm9092832 www.mdpi.com/journal/jcm
J. Clin. Med. 2020, 9, 2832 2 of 12
are at higher risk of progression to advanced AMD [2,3]. Unlike drusen, which are located betweenthe retinal pigment epithelium (RPE) and Bruch’s membrane, SDD are located internal to the RPEand are therefore in closer proximity to the photoreceptors when compared with drusen [4]. TheseSDDs have not been included in AMD classifications to date, although they have been found to have aprofound correlation with rod recovery time [5,6]. It is, therefore, not clear whether or not eyes withintermediate AMD should be stratified into those with and without SDD to better define the impact ofinterventions in this condition.
Several investigators have evaluated visual function tests in healthy ageing and AMD based onexisting classification. However, there is limited literature on the correlation of SDD with visual function.In particular, differences in visual function between healthy ageing, eyes with intermediate AMDwith and without SDD and eyes that have progressed to non-foveal atrophy have not been explored.Insights from such evaluations are critical for defining inclusion criteria for future preventive options.
The standard test of visual function is the high luminance and high contrast best corrected visualacuity (BCVA), which represents a pure foveal cone function test. This test is not usually affectedin early/intermediate AMD. However, when BCVA is assessed in low luminance (defined as lowluminance visual acuity; LLVA), the visual function deficits are reported to be more pronounced andmay even precede a decrease in BCVA [7–9].
The low-luminance deficit (LLD), or difference between LLVA and BCVA, has also been reportedto be a predictive sign of disease progression and visual function losses [7].
In any clinical trial, objective functional measures should ideally correlate with subjective changesin visual function. Although most patients with early/intermediate AMD are asymptomatic, somecomplain of difficulty in performing their activities in varying illumination and at night [10–12].These symptomatic patients may also be at higher risk of developing geographic atrophy, choroidalneovascularization (CNV) and three or more lines of visual acuity loss [13]. The low luminancequestionnaire (LLQ) has been validated previously and could be used as patient-perceived visualoutcome in AMD preventive trials [11]. However, the correlation of the measured visual acuity andsubjective assessment of low luminance using the LLQ in healthy aging and intermediate AMD withand without SDD also has not been fully investigated.
The aim of this exploratory study was to assess the value of routinely performed visual functiontests, BCVA, LLVA, and LLD, and subjective assessment by LLQ when SDD is introduced into theassessment of AMD severity and classification.
2. Experimental Section
The functional measures analysed are from the baseline data of a longitudinal study of visualfunction and structure done in Moorfields Eye Hospital from May 2017 to 2020. The study was approvedby the Camden and Kings Cross NRES Committee London REC 16/LO/1317. Written informed consentwas obtained from all participants and the study followed the tenets of the Declaration of Helsinki.
2.1. Participants
The participants in this study had to have BCVA better than 50 ETDRS letters and were groupedaccording to the fundus characteristics of the study eye:
(1) No AMD or presence of druplets(2) Intermediate AMD with no SDD (iAMD with no SDD)(3) Intermediate AMD with at least 5 SDD (SDD group)(4) Non-foveal atrophic AMD with intermediate AMD
Intermediate AMD was defined as having at least one large drusen (>125 µm), with or withoutpigmentary abnormalities. Diagnosis of these categories was based on at least two imaging methodsdone after mydriasis that included infrared reflectance, autofluorescence and spectral domain optical

J. Clin. Med. 2020, 9, 2832 3 of 12
coherence tomography (SD-OCT) on Spectralis OCT2 (Heidelberg Engineering, Heidelberg, Germany);and color fundus photography (CFP) of the macula (Topcon; Tokyo, Japan).
2.1.1. Exclusion Criteria
Participants were excluded if there was co-existent ocular disease (neovascular AMD, glaucomaor diabetic retinopathy, substantial cataract) in the study eye, significant systemic disease or historyof medication known to affect visual function, epilepsy, history of major ocular surgery in the last3 months or anticipated within the next 6 months following enrolment in the study eye and anyallergies to adhesives or any other component used.
2.1.2. Visual Function Tests
Participants first underwent a refraction protocol, followed by visual acuity measurement. BCVAwas measured using a standard Early Treatment in Diabetic Retinopathy Study (ETDRS) for each eye.LLVA was measured by placing a 2.0 log neutral density filter over the eye and having participantsread the same chart, with the aim of the filter to lower background luminance by 100-fold. These testswere performed monocularly with alternating charts for each eye at a 4 m distance. The differencebetween BCVA and LLVA in ETDRS letters was defined as the LLD score. The scores for the study eyewere used in the analysis.
2.1.3. Subjective Test
The LLQ is a 32-item questionnaire with six subscales related to low luminance settings: (1) extremelighting, (2) mobility, (3) general dim lighting, (4) peripheral vision, (5) driving and (6) emotionaldistress [11]. Each question is scored on a scale ranging from 0, or maximal difficulty, to 100, or nodifficulty. The questions are categorized into different subscales and averaged to generate one scoreper subscale. The weighted subscales are then averaged to produce a composite LLQ score.
2.1.4. Statistical Analysis
Descriptive statistics were performed to assess baseline demographic variables for the AMDgroups and controls using the chi squared test for categorical data or ANOVA/Kruskal Wallis test forcontinuous data. Applying the Shapiro-Wilk testing and using normal Q-Q plots revealed that thedata were not normally distributed within each severity grade and therefore, non-parametric testswere used for functional parameters analysis. The relationship of BCVA and LLVA was assessed ineach disease group. Pairwise differences of each AMD group were calculated using the nonparametricKruskal Wallis test followed by post hoc uncorrected Dunn’s test.
The LLQ scores in each group were also compared. The nonparametric Kruskal Wallis testwas carried out followed by Dunn’s uncorrected test for multiple comparisons to compare healthyageing, intermediate AMD with and without SDD and those with atrophy on their composite andsubscale scores on the LLQ. In each group, separate univariate linear regression models against theLLQ composite score were performed with BCVA, LLVA and LLD. Due to the exploratory nature ofthis study and small sample size, p-values were not adjusted for multiple comparisons. Inter-rateragreement for patient classification was assessed using Cohen’s kappa coefficient. Statistical analyseswere performed using the statistical software SPSS (SPSS Statistics 23.0, SPSS Statistics for Windows,R2011; IBM Corp., Armonk, NY, USA) p < 0.05 was considered statistically significant.
J. Clin. Med. 2020, 9, 2832 4 of 12
3. Results
3.1. Demographic and Clinical Characteristics of the Participants
A total of 50 participants were recruited; healthy ageing group (n = 11), iAMD no SDD (n = 17),iAMD with SDD (n = 11) and non-foveal atrophic AMD (n = 11). The mean age (±SD) of the cohortwas 69.3 (±7.6) years and there were more female participants (60%) than male (40%). The mean age ofthe healthy aging group, iAMD with no SDD, iAMD with SDD and non-foveal atrophic AMD were65.1 (±6.2) years, 66.3 (±8.1) years, 74.2 (±5.6) years and 73 (±6.0) years, respectively. The inter-rateragreement was high (Cohen’s kappa coefficient = 0.96) for evaluation and grading of colour fundusimages for AMD classification.
3.2. Age-Related Decline in Visual Function
The visual function outcomes were not age-adjusted as SDD and atrophic changes are associatedwith advancing disease and linear regression showed no significant relationship between age in thehealthy aging group and study-eye best-corrected visual acuity (p = 0.3170), low luminance acuity(p = 0.1115), low luminance deficit (p = 0.6165) and low luminance questionnaire (p = 0.7925).
3.3. Visual Acuity Assessments
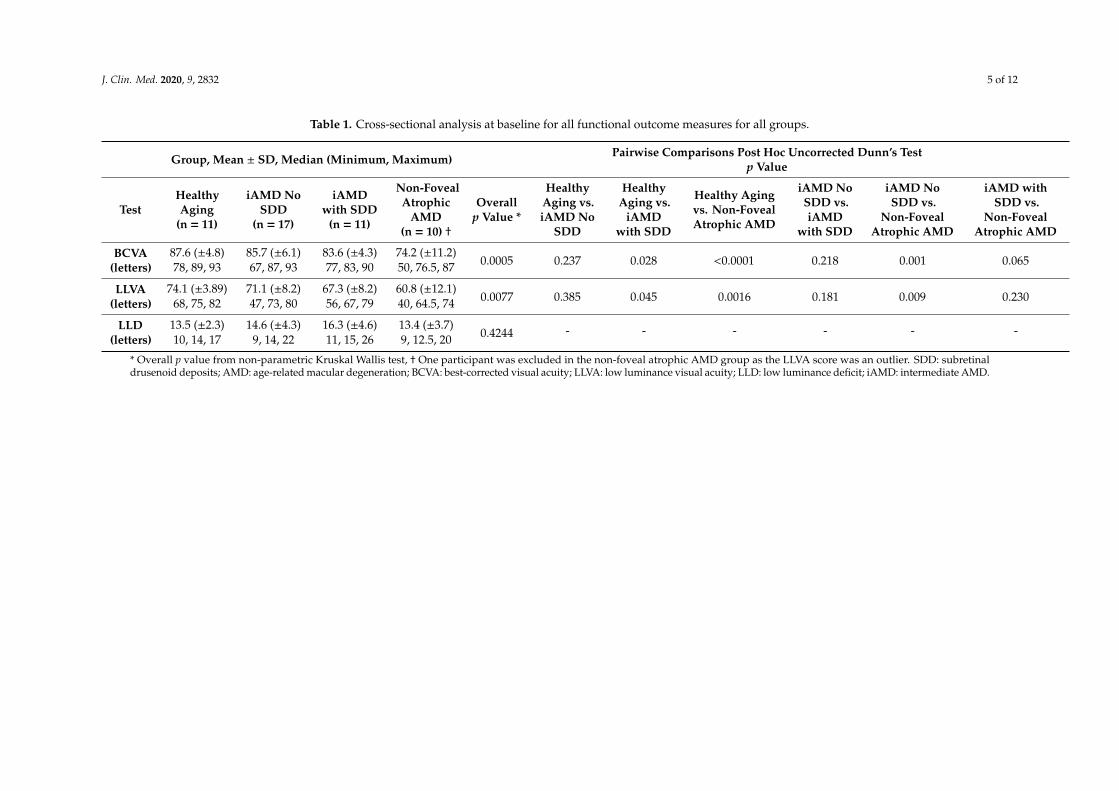
Table 1 shows that there was a statistical difference between groups in BCVA and LLVA. However,the LLD was very similar between groups. Pairwise comparison showed there were no differences ineither BCVA or LLVA between the healthy aging group and iAMD without SDD. BCVA and LLVAscores were significantly reduced in the non-foveal atrophic AMD group compared with the healthygroup (p < 0.0001 and p = 0.0016, respectively). Patients with atrophy also exhibited poorer BCVA(p = 0.001) and LLVA (p = 0.009) scores compared with patients with intermediate disease withoutSDD. In patients with SDD, BCVA and LLVA, scores were lower compared with healthy participants(p = 0.028 and p = 0.045, respectively). There was no statistically significant difference between iAMDwith SDD and non-foveal atrophic AMD.
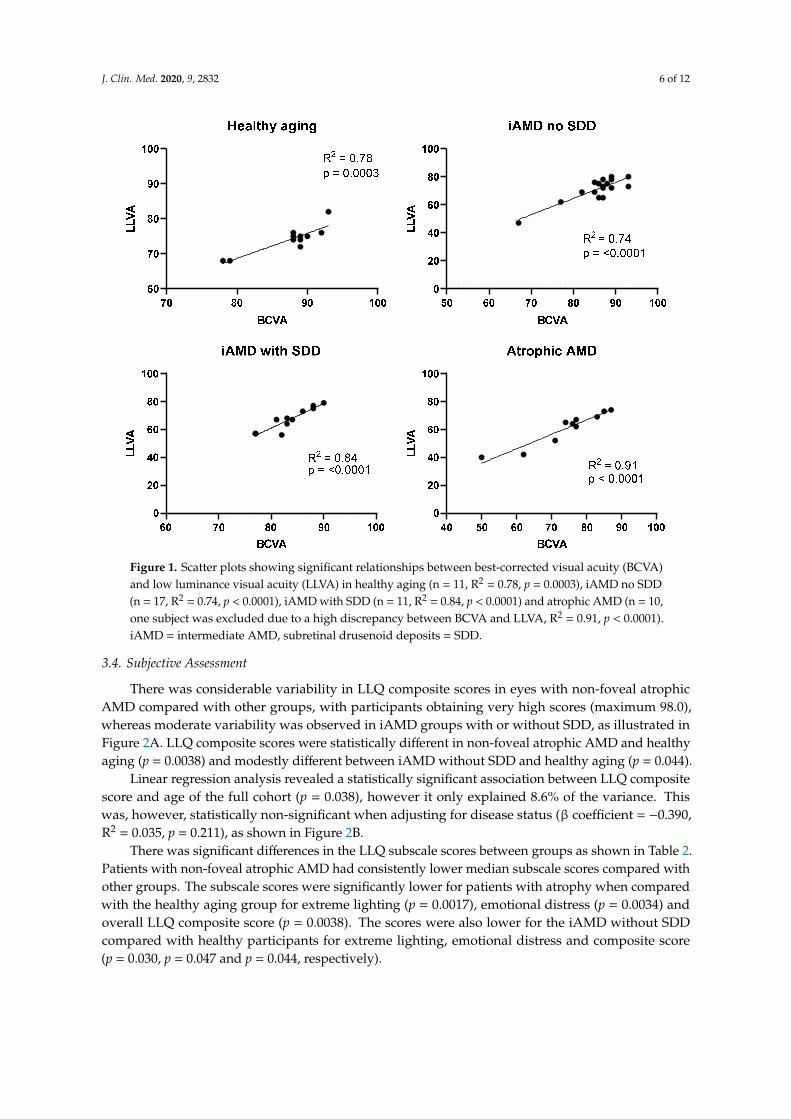
To understand the relationship between BCVA and LLVA, linear regression analysis of BCVAwas performed against LLVA. There was a strong linear association between the two; BCVA was asignificant predictor of LLVA in all disease groups, as shown in Figure 1. According to the R2 parameter,BCVA was able to explain 78% (p = 0.0003), 74% (p < 0.0001), 84% (p < 0.0001) and 91% (p < 0.0001)of the variance in LLVA for the healthy aging, iAMD no SDD, iAMD with SDD and atrophic AMDgroups, respectively.
J. Clin. Med. 2020, 9, 2832 5 of 12
Table 1. Cross-sectional analysis at baseline for all functional outcome measures for all groups.
Group, Mean ± SD, Median (Minimum, Maximum) Pairwise Comparisons Post Hoc Uncorrected Dunn’s Testp Value
TestHealthyAging
(n = 11)
iAMD NoSDD
(n = 17)
iAMDwith SDD
(n = 11)
Non-FovealAtrophic
AMD(n = 10) †
Overallp Value *
HealthyAging vs.iAMD No
SDD
HealthyAging vs.
iAMDwith SDD
Healthy Agingvs. Non-FovealAtrophic AMD
iAMD NoSDD vs.iAMD
with SDD
iAMD NoSDD vs.
Non-FovealAtrophic AMD
iAMD withSDD vs.
Non-FovealAtrophic AMD
BCVA(letters)
87.6 (±4.8) 85.7 (±6.1) 83.6 (±4.3) 74.2 (±11.2)0.0005 0.237 0.028 <0.0001 0.218 0.001 0.06578, 89, 93 67, 87, 93 77, 83, 90 50, 76.5, 87
LLVA(letters)
74.1 (±3.89) 71.1 (±8.2) 67.3 (±8.2) 60.8 (±12.1)0.0077 0.385 0.045 0.0016 0.181 0.009 0.23068, 75, 82 47, 73, 80 56, 67, 79 40, 64.5, 74
LLD(letters)
13.5 (±2.3) 14.6 (±4.3) 16.3 (±4.6) 13.4 (±3.7)0.4244 - - - - - -
10, 14, 17 9, 14, 22 11, 15, 26 9, 12.5, 20
* Overall p value from non-parametric Kruskal Wallis test, † One participant was excluded in the non-foveal atrophic AMD group as the LLVA score was an outlier. SDD: subretinaldrusenoid deposits; AMD: age-related macular degeneration; BCVA: best-corrected visual acuity; LLVA: low luminance visual acuity; LLD: low luminance deficit; iAMD: intermediate AMD.
J. Clin. Med. 2020, 9, 2832 6 of 12
J. Clin. Med. 2020, 9, x FOR PEER REVIEW 6 of 12
To understand the relationship between BCVA and LLVA, linear regression analysis of BCVA was performed against LLVA. There was a strong linear association between the two; BCVA was a significant predictor of LLVA in all disease groups, as shown in Figure 1. According to the R2
parameter, BCVA was able to explain 78% (p = 0.0003), 74% (p < 0.0001), 84% (p < 0.0001) and 91% (p < 0.0001) of the variance in LLVA for the healthy aging, iAMD no SDD, iAMD with SDD and atrophic AMD groups, respectively.
Figure 1. Scatter plots showing significant relationships between best-corrected visual acuity (BCVA) and low luminance visual acuity (LLVA) in healthy aging (n = 11, R2 = 0.78, p = 0.0003), iAMD no SDD (n = 17, R2 = 0.74, p < 0.0001), iAMD with SDD (n = 11, R2 = 0.84, p < 0.0001) and atrophic AMD (n = 10, one subject was excluded due to a high discrepancy between BCVA and LLVA, R2 = 0.91, p < 0.0001). iAMD = intermediate AMD, subretinal drusenoid deposits = SDD.
3.4. Subjective Assessment
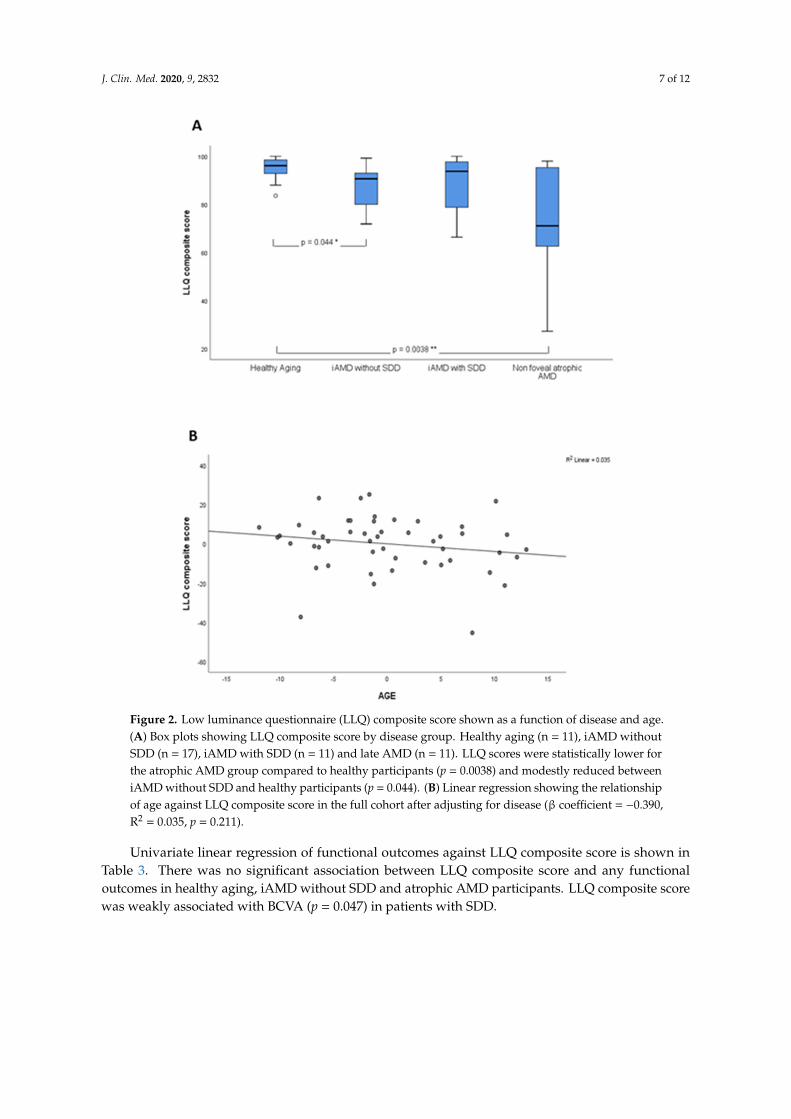
There was considerable variability in LLQ composite scores in eyes with non-foveal atrophic AMD compared with other groups, with participants obtaining very high scores (maximum 98.0), whereas moderate variability was observed in iAMD groups with or without SDD, as illustrated in Figure 2A. LLQ composite scores were statistically different in non-foveal atrophic AMD and healthy aging (p = 0.0038) and modestly different between iAMD without SDD and healthy aging (p = 0.044).
Linear regression analysis revealed a statistically significant association between LLQ composite score and age of the full cohort (p = 0.038), however it only explained 8.6% of the variance. This was, however, statistically non-significant when adjusting for disease status (β coefficient = −0.390, R2 = 0.035, p = 0.211), as shown in Figure 2B.
Figure 1. Scatter plots showing significant relationships between best-corrected visual acuity (BCVA)and low luminance visual acuity (LLVA) in healthy aging (n = 11, R2 = 0.78, p = 0.0003), iAMD no SDD(n = 17, R2 = 0.74, p < 0.0001), iAMD with SDD (n = 11, R2 = 0.84, p < 0.0001) and atrophic AMD (n = 10,one subject was excluded due to a high discrepancy between BCVA and LLVA, R2 = 0.91, p < 0.0001).iAMD = intermediate AMD, subretinal drusenoid deposits = SDD.
3.4. Subjective Assessment
There was considerable variability in LLQ composite scores in eyes with non-foveal atrophicAMD compared with other groups, with participants obtaining very high scores (maximum 98.0),whereas moderate variability was observed in iAMD groups with or without SDD, as illustrated inFigure 2A. LLQ composite scores were statistically different in non-foveal atrophic AMD and healthyaging (p = 0.0038) and modestly different between iAMD without SDD and healthy aging (p = 0.044).
Linear regression analysis revealed a statistically significant association between LLQ compositescore and age of the full cohort (p = 0.038), however it only explained 8.6% of the variance. Thiswas, however, statistically non-significant when adjusting for disease status (β coefficient = −0.390,R2 = 0.035, p = 0.211), as shown in Figure 2B.
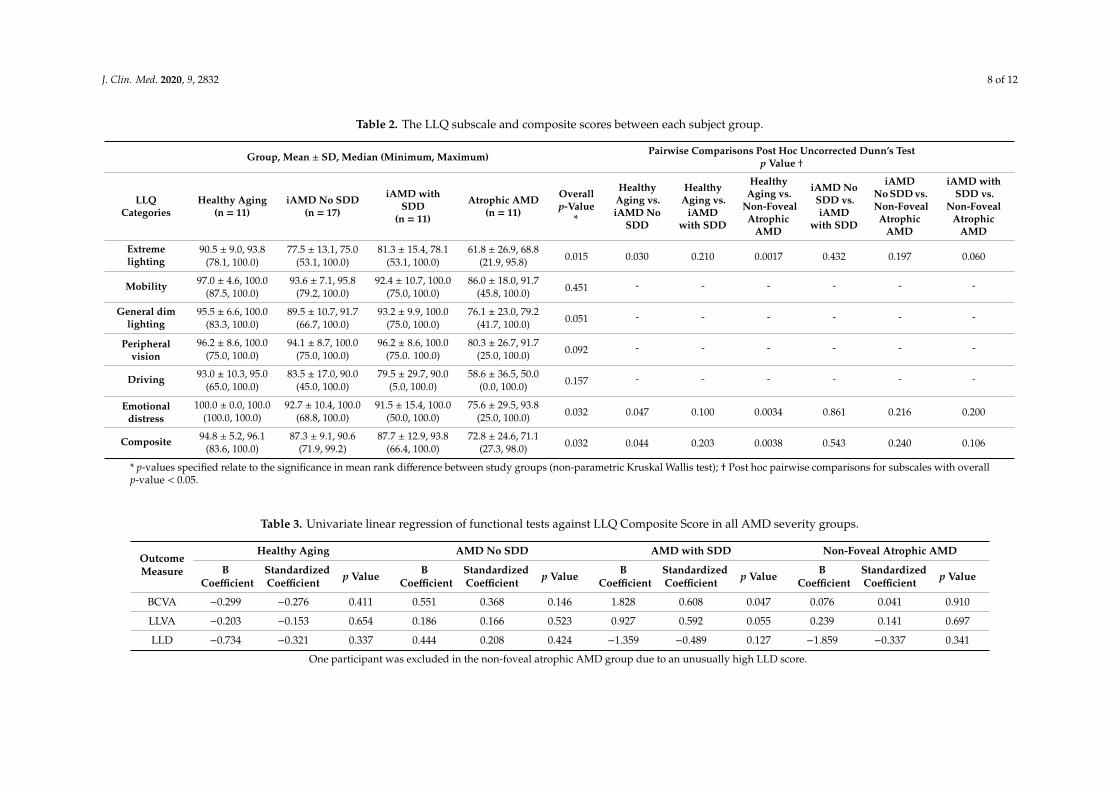
There was significant differences in the LLQ subscale scores between groups as shown in Table 2.Patients with non-foveal atrophic AMD had consistently lower median subscale scores compared withother groups. The subscale scores were significantly lower for patients with atrophy when comparedwith the healthy aging group for extreme lighting (p = 0.0017), emotional distress (p = 0.0034) andoverall LLQ composite score (p = 0.0038). The scores were also lower for the iAMD without SDDcompared with healthy participants for extreme lighting, emotional distress and composite score(p = 0.030, p = 0.047 and p = 0.044, respectively).
J. Clin. Med. 2020, 9, 2832 7 of 12
J. Clin. Med. 2020, 9, x FOR PEER REVIEW 7 of 12
Figure 2. Low luminance questionnaire (LLQ) composite score shown as a function of disease and age. (A) Box plots showing LLQ composite score by disease group. Healthy aging (n = 11), iAMD without SDD (n = 17), iAMD with SDD (n = 11) and late AMD (n = 11). LLQ scores were statistically lower for the atrophic AMD group compared to healthy participants (p = 0.0038) and modestly reduced between iAMD without SDD and healthy participants (p = 0.044). (B) Linear regression showing the relationship of age against LLQ composite score in the full cohort after adjusting for disease (β coefficient = −0.390, R2 = 0.035, p = 0.211).
There was significant differences in the LLQ subscale scores between groups as shown in Table 2. Patients with non-foveal atrophic AMD had consistently lower median subscale scores compared with other groups. The subscale scores were significantly lower for patients with atrophy when compared with the healthy aging group for extreme lighting (p = 0.0017), emotional distress (p = 0.0034) and overall LLQ composite score (p = 0.0038). The scores were also lower for the iAMD without SDD compared with healthy participants for extreme lighting, emotional distress and composite score (p = 0.030, p = 0.047 and p = 0.044, respectively).
Univariate linear regression of functional outcomes against LLQ composite score is shown in Table 3. There was no significant association between LLQ composite score and any functional outcomes in healthy aging, iAMD without SDD and atrophic AMD participants. LLQ composite score was weakly associated with BCVA (p = 0.047) in patients with SDD.
Figure 2. Low luminance questionnaire (LLQ) composite score shown as a function of disease and age.(A) Box plots showing LLQ composite score by disease group. Healthy aging (n = 11), iAMD withoutSDD (n = 17), iAMD with SDD (n = 11) and late AMD (n = 11). LLQ scores were statistically lower forthe atrophic AMD group compared to healthy participants (p = 0.0038) and modestly reduced betweeniAMD without SDD and healthy participants (p = 0.044). (B) Linear regression showing the relationshipof age against LLQ composite score in the full cohort after adjusting for disease (β coefficient = −0.390,R2 = 0.035, p = 0.211).
Univariate linear regression of functional outcomes against LLQ composite score is shown inTable 3. There was no significant association between LLQ composite score and any functionaloutcomes in healthy aging, iAMD without SDD and atrophic AMD participants. LLQ composite scorewas weakly associated with BCVA (p = 0.047) in patients with SDD.
J. Clin. Med. 2020, 9, 2832 8 of 12
Table 2. The LLQ subscale and composite scores between each subject group.
Group, Mean ± SD, Median (Minimum, Maximum) Pairwise Comparisons Post Hoc Uncorrected Dunn’s Testp Value †
LLQCategories
Healthy Aging(n = 11)
iAMD No SDD(n = 17)
iAMD withSDD
(n = 11)
Atrophic AMD(n = 11)
Overallp-Value
*
HealthyAging vs.iAMD No
SDD
HealthyAging vs.
iAMDwith SDD
HealthyAging vs.
Non-FovealAtrophic
AMD
iAMD NoSDD vs.iAMD
with SDD
iAMDNo SDD vs.Non-FovealAtrophic
AMD
iAMD withSDD vs.
Non-FovealAtrophic
AMD
Extremelighting
90.5 ± 9.0, 93.8 77.5 ± 13.1, 75.0 81.3 ± 15.4, 78.1 61.8 ± 26.9, 68.80.015 0.030 0.210 0.0017 0.432 0.197 0.060(78.1, 100.0) (53.1, 100.0) (53.1, 100.0) (21.9, 95.8)
Mobility 97.0 ± 4.6, 100.0 93.6 ± 7.1, 95.8 92.4 ± 10.7, 100.0 86.0 ± 18.0, 91.70.451 - - - - - -
(87.5, 100.0) (79.2, 100.0) (75.0, 100.0) (45.8, 100.0)
General dimlighting
95.5 ± 6.6, 100.0 89.5 ± 10.7, 91.7 93.2 ± 9.9, 100.0 76.1 ± 23.0, 79.20.051 - - - - - -
(83.3, 100.0) (66.7, 100.0) (75.0, 100.0) (41.7, 100.0)
Peripheralvision
96.2 ± 8.6, 100.0 94.1 ± 8.7, 100.0 96.2 ± 8.6, 100.0 80.3 ± 26.7, 91.70.092 - - - - - -
(75.0, 100.0) (75.0, 100.0) (75.0. 100.0) (25.0, 100.0)
Driving 93.0 ± 10.3, 95.0 83.5 ± 17.0, 90.0 79.5 ± 29.7, 90.0 58.6 ± 36.5, 50.00.157 - - - - - -
(65.0, 100.0) (45.0, 100.0) (5.0, 100.0) (0.0, 100.0)
Emotionaldistress
100.0 ± 0.0, 100.0 92.7 ± 10.4, 100.0 91.5 ± 15.4, 100.0 75.6 ± 29.5, 93.80.032 0.047 0.100 0.0034 0.861 0.216 0.200(100.0, 100.0) (68.8, 100.0) (50.0, 100.0) (25.0, 100.0)
Composite 94.8 ± 5.2, 96.1 87.3 ± 9.1, 90.6 87.7 ± 12.9, 93.8 72.8 ± 24.6, 71.10.032 0.044 0.203 0.0038 0.543 0.240 0.106(83.6, 100.0) (71.9, 99.2) (66.4, 100.0) (27.3, 98.0)
* p-values specified relate to the significance in mean rank difference between study groups (non-parametric Kruskal Wallis test); † Post hoc pairwise comparisons for subscales with overallp-value < 0.05.
Table 3. Univariate linear regression of functional tests against LLQ Composite Score in all AMD severity groups.
OutcomeMeasure
Healthy Aging AMD No SDD AMD with SDD Non-Foveal Atrophic AMD
BCoefficient
StandardizedCoefficient p Value B
CoefficientStandardizedCoefficient p Value B
CoefficientStandardizedCoefficient p Value B
CoefficientStandardizedCoefficient p Value
BCVA −0.299 −0.276 0.411 0.551 0.368 0.146 1.828 0.608 0.047 0.076 0.041 0.910
LLVA −0.203 −0.153 0.654 0.186 0.166 0.523 0.927 0.592 0.055 0.239 0.141 0.697
LLD −0.734 −0.321 0.337 0.444 0.208 0.424 −1.359 −0.489 0.127 −1.859 −0.337 0.341
One participant was excluded in the non-foveal atrophic AMD group due to an unusually high LLD score.
J. Clin. Med. 2020, 9, 2832 9 of 12
4. Discussion
This study evaluated the correlation of visual acuity tests and patient-perceived visual functionin healthy ageing and in different severity groups of AMD. We found no significant difference inBCVA or LLVA between iAMD with no SDD and healthy ageing. However, BCVA and LLVA werereduced significantly in eyes with iAMD with SDD compared to healthy ageing. This discrimination isimportant as it stratifies iAMD into those with and without functional loss based on the presence orabsence of SDD.
Previous reports have reported reduced LLVA in AMD patients with drusen >125 µm comparedwith healthy participants [8–10]. However, these studies used clinical severity scales of AMD based ontraditional classification, which does not include the presence of SDD as a distinct entity. In this study,we categorized eyes with SDD as a separate cohort and found that the reduced LLVA in iAMD eyesmay indeed be driven by the subgroup of patients with SDD.
On further comparison, eyes with non-foveal atrophy were found to have significantly worseBCVA and LLVA when compared with controls (healthy ageing) and eyes with iAMD without SDD.Interestingly, the iAMD group with SDD had similar functional outcomes as eyes with non-fovealatrophy, i.e., BCVA as well as LLVA were reduced in both groups. Previous studies by Sunness et al.have shown LLVA to be reduced in eyes with non-foveal geographic atrophy (GA) and also predictsubsequent vision loss [7,14]. However, we found that the presence of SDD results in functionaloutcomes similar to that of non-foveal atrophic AMD, suggesting that eyes with SDD is a marker ofadvanced disease, even though no structural changes of atrophy are visible on clinical examination orimaging. However, SDD may disturb overlaying photoreceptors, leading to outer segment shortening,inner segment deflection and eventual loss along with outer retinal layer gaps over large deposits,which are abnormalities commonly observed in histology and imaging around and ahead of GAprogression [15,16]. Specifically, in eyes with GA, shortening of outer segments and photoreceptor lossare seen distant from the GA [15].
These SDD go through a lifecycle of changes, finally resulting in regression [4]. Eyes withregression of SDD develop outer retinal atrophy associated with underlying choroidal thinning [16].This form of atrophy represents a late form of AMD and is structurally distinct from geographic atrophy(GA) in terms of loss of RPE in the latter [16]. Studies have also shown preferential rod dysfunctionin patients with SDD [3,5,6,17]. We hypothesize that functionally, eyes with SDD regression behavein an analogous manner as eyes with GA, consequently explaining the congruity in the BCVA andLLVA outcomes in these groups. Therefore, our study shows that the presence of SDD is an indicatorof severe disease and the functional outcomes are as poor as those with non-foveal atrophy.
There is discordance in literature regarding LLD measure. Our study found no statisticallysignificant difference in LLD between groups, which contrasts with results from Puell et al. who foundsignificant difference in LLD in the non-advanced AMD groups [8]. Wu et al. noted a difference inLLD between participants with non-foveal GA and control group only, but no significant difference inLLD between control and in the non-atrophic AMD groups [9]. However, Cocce and colleagues (2018)reported no mean difference in LLD between groups in their cohort [10]. This may be due to the factthat we divided our groups to include SDD as a separate group and the baseline visual acuity was goodacross all groups in our study. The heterogeneity in outcomes indicates that retinal function changesmay be independent of the currently used clinical grading scales based on structure. This finding mayin part be influenced by the presence of SDD, which is not currently included in the classification [9,18].
LLVA is a measure of mesopic function, predominantly cone-mediated in reducedillumination [8,14,19]. We found a strong correlation between BCVA and LLVA across all groupsand a likely explanation for this would be that both tests are inherently dependent on foveal conefunction, consequently resulting in a similar functional mechanism. Stockman and Sharpe explainedthat the visual acuity in a mesopic setting requires integrated cone function mediated by post-receptoralpathways and a disruption of this would lead to a drop in LLVA, worsening the LLD [20]. A similarreduction in both BCVA and LLVA could be secondary to mechanical disruption and disorientation of

J. Clin. Med. 2020, 9, 2832 10 of 12
photoreceptors, thereby reducing spatial resolution at both illuminance levels [21–23]. As LLD is adifference of BCVA and LLVA, any improvement or worsening in LLD has to be interpreted in thecontext of actual values of BCVA and LLVA [14]. For example, an improved LLD might be a result ofworsening foveal photopic vision, thereby lowering the BCVA, but LLVA may not be affected to thesame degree as parafoveal cones are less responsive to changes in illumination than foveal cones [14].Similarly, a parallel reduction in BCVA and LLVA could result in a non-significant difference in LLD,which probably explains the indiscriminate LLD result between groups. In our study, LLD rangedfrom 13.5 to 16.3 letters, a difference of 2.8 letters between groups, which is clinically not meaningfulwhen visual acuity variability ranges from 5 to 10 letters [24,25]. Therefore, our study suggests thatLLD is not a biomarker of increasing disease severity.
We also evaluated whether LLQ composite scores deteriorate with age and disease severity.Although our results showed a decrease in LLQ composite score with age, this was insignificant whenadjusted for disease severity. These results substantiate previous findings that age is not associatedwith LLQ [26,27].
However, LLQ composite score was found to be an accurate marker for disease severity, althoughit could not differentiate between iAMD with and without SDD. The subscales that were most affectedwere extreme lighting and emotional distress in iAMD no SDD and the non-foveal atrophy group.The subscale on difficulty in dim lighting did not reach statistical significance. Interestingly, therewas no difference in composite score between healthy controls and iAMD with SDD. This is difficultto interpret but it may be that eyes with SDD eyes are not affected by extreme lighting. There werelarge standard deviations in LLQ subscales in this small sample sized study, which could confoundour findings.
Univariate linear regression analysis showed no association between LLQ and LLVA and LLD.As LLQ was designed specifically to assess patient-perceived difficulty in low luminance, it is
more likely to elicit rod function, whilst LLVA is predominantly a cone-mediated test. It is reasonableto expect discordance between these two parameters [11]. Overall, no significant association was foundbetween BCVA and LLVA against LLQ. This is substantiated by another study where no significantassociations were found between BCVA, LLVA and LLQ in traditional visual acuity measurementwith ETDRS charts at 4 m [27]. However, Thompson et al. found a significant relationship betweencomputerized LLVA and LLD against the LLQ [27]. Previous studies that have shown a good correlationof LLD with subjective assessment assessed only the question specific to night vision. Given the smallsample size and variability within each AMD group, our sample size did not permit such a specificanalysis [9]. However, we believe that multiple visual function tests are required to encapsulate theextent of the LLQ questionnaire as some activities may involve more than just a rod mediated response.
The limitations in this study include the small sample size and the lack of SDD-only group, withthe latter being very challenging to recruit. However, given that the primary aim of this study wasto examine the value of visual function measures and the degree of self-reported difficulties in lowluminance conditions when subretinal drusenoid deposits (SDD) are incorporated into the clinicalAMD classification, the lack of an SSD-only group does not detract from our interpretation of the results.
Despite the small sample size in each group, the disease was very well characterised, with SDDconfirmed by at least two imaging techniques. There was high inter-rater agreement for patientclassification (Cohen’s kappa coefficient = 0.96). In addition, all assessments were highly standardizedand carried out by a single observer, limiting interobserver variability, indicating the validity of ourfindings for the cohort we examined, and can be extrapolated with caution. Although current findingscannot be directly applied in clinical practice due to the small sample size, these findings would beuseful for designing future clinical trial endpoints. We also cannot rule out that some eyes in the iAMDwith no SDD and non-foveal atrophy had regressed SDD. A surrogate for regressed SDD is to measurethe thickness of outer nuclear layer, however this is challenging to measure due to the undulationscaused by the presence of large drusen.
J. Clin. Med. 2020, 9, 2832 11 of 12
5. Conclusions
In conclusion, our study suggests that LLD is not a good marker of increasing disease severity.Our findings validate that LLVA is predominantly a foveal function test and accordingly, BCVA andLLVA show good correlation where the decrease in function is maximally seen in eyes with non-fovealatrophy. The LLQ that mainly assesses the subjective integrity of rod function did not correlatewith visual acuity parameters, which are cone-mediated tests. Our study results suggest the need tore-classify the AMD severity scale by incorporating SDD based on visual function tests. However, thispostulation needs to be validated by investigating the structural–function correlation in eyes withSDD in terms of the quantity and area covered by SDD. We also recommend that intervention trialsdesigned to decrease progression to advanced AMD exclude eyes with SDD and non-foveal atrophy ortake these characteristics into account when drawing conclusions.
Author Contributions: Conceptualization, S.S.; methodology, M.K.G. and S.S.; formal analysis, M.K.G., S.C. andS.G.; investigation, M.K.G.; resources, S.S. and A.B.; data curation, M.K.G.; writing—original draft preparation,S.S., M.K.G., S.C., A.B. and G.J.; writing—review and editing, S.S., M.K.G., S.C., G.J. and A.B.; supervision, S.S.and G.J.; funding acquisition, S.S. All authors have read and agreed to the published version of the manuscript.
Funding: This research was funded by Fight for Sight grant number: 1905b, Institute of Ophthalmology UCLgrant no: 522031.
Acknowledgments: The research was funded by Fight for Sight (Ref 1905b) and supported by the NIHR BiomedicalResearch Centre at Moorfields Eye Hospital NHS Foundation Trust and UCL Institute of Ophthalmology and theNIHR Moorfields Clinical Research Facility. The views expressed are those of the author(s) and not necessarilythose of the NHS, the NIHR or the Department of Health.
Conflicts of Interest: The authors declare no conflict of interest.
References
1. Wong, W.L.; Su, X.; Li, X.; Cheung, C.M.G.; Klein, R.; Cheng, C.-Y.; Wong, T.Y. Global prevalence ofage-related macular degeneration and disease burden projection for 2020 and 2040: A systematic review andmeta-analysis. Lancet Glob. Health 2014, 2, e106–e116. [CrossRef]
2. Marsiglia, M.; Boddu, S.; Bearelly, S.; Xu, L.; Breaux, B.E.; Freund, K.B.; Yannuzzi, L.A.; Smith, R.T. Associationbetween geographic atrophy progression and reticular pseudodrusen in eyes with dry age-related maculardegeneration. Investig. Opthalmol. Vis. Sci. 2013, 54, 7362–7369. [CrossRef] [PubMed]
3. Steinberg, J.S.; Göbel, A.P.; Fleckenstein, M.; Holz, F.G.; Schmitz-Valckenberg, S. Reticular drusen in eyes withhigh-risk characteristics for progression to late-stage age-related macular degeneration. Br. J. Ophthalmol.2015, 99, 1289–1294. [CrossRef] [PubMed]
4. Spaide, R.F.; Ooto, S.; Curcio, C.A. Subretinal drusenoid deposits AKA pseudodrusen. Surv. Ophthalmol.2018, 63, 782–815. [CrossRef]
5. Flynn, O.J.; Cukras, C.A.; Jeffrey, B.G. Characterization of rod function phenotypes across a range ofage-related macular degeneration severities and subretinal drusenoid deposits. Investig. Opthalmol. Vis. Sci.2018, 59, 2411–2421. [CrossRef]
6. Flamendorf, J.; Agrón, E.; Wong, W.T.; Thompson, D.; Wiley, H.E.; Doss, E.L.; Al-Holou, S.; Ferris, F.L.;Chew, E.Y.; Cukras, C.A. Impairments in dark adaptation are associated with age-related macular degenerationseverity and reticular pseudodrusen. Ophthalmology 2015, 122, 2053–2062. [CrossRef]
7. Sunness, J.S.; Rubin, G.S.; Applegate, C.A.; Bressler, N.M.; Marsh, M.J.; Hawkins, B.S.; Haselwood, D. Visualfunction abnormalities and prognosis in eyes with age-related geographic atrophy of the macula and goodvisual acuity. Ophthalmology 1997, 104, 1677–1691. [CrossRef]
8. Puell, M.C.; Barrio, A.R.; Palomo-Alvarez, C.; Gómez-Sanz, F.J.; Clement-Corral, A.; Pérez-Carrasco, M.J.Impaired mesopic visual acuity in eyes with early age-related macular degeneration. Investig. Opthalmol.Vis. Sci. 2012, 53, 7310. [CrossRef]
9. Wu, Z.; Ayton, L.N.; Guymer, R.H.; Luu, C.D. Low-luminance visual acuity and microperimetry in age-relatedmacular degeneration. Ophthalmology 2014, 121, 1612–1619. [CrossRef]
J. Clin. Med. 2020, 9, 2832 12 of 12
10. Stinnett, S.S.; Luhmann, U.F.; Vajzovic, L.; Horne, A.; Schuman, S.G.; Toth, C.A.; Cousins, S.W.; Lad, E.M.Visual function metrics in early and intermediate dry age-related macular degeneration for use as clinicaltrial endpoints. Am. J. Ophthalmol. 2018, 189, 127–138.
11. Owsley, C.; McGwin, G.; Scilley, K.; Kallies, K. Development of a questionnaire to assess vision problemsunder low luminance in age-related maculopathy. Investig. Opthalmol. Vis. Sci. 2006, 47, 528–535. [CrossRef]
12. Scilley, K.; Jackson, G.R.; Cideciyan, A.V.; Maguire, M.G.; Jacobson, S.G.; Owsley, C. Early age-relatedmaculopathy and self-reported visual difficulty in daily life. Ophthalmology 2002, 109, 1235–1242. [CrossRef]
13. Ying, G.-S.; Maguire, M.G.; Liu, C.; Antoszyk, A.N. Night vision symptoms and progression ofage-related macular degeneration in the complications of age-related macular degeneration prevention trial.Ophthalmology 2008, 115, 1876–1882. [CrossRef] [PubMed]
14. Sunness, J.S.; Rubin, G.S.; Broman, A.; Applegate, C.A.; Bressler, N.M.; Hawkins, B.S. Low luminance visualdysfunction as a predictor of subsequent visual acuity loss from geographic atrophy in age-related maculardegeneration. Ophthalmology 2008, 115, 1480–1488. [CrossRef]
15. Bird, A.C.; Phillips, R.L.; Hageman, G.S. Geographic atrophy: A histopathological assessment.JAMA Ophthalmol. 2014, 132, 338–345. [CrossRef] [PubMed]
16. Spaide, R.F. Outer retinal atrophy after regression of subretinal drusenoid deposits as a newly recognizedform of late age-related macular degeneration. Retina 2013, 33, 1800–1808. [CrossRef] [PubMed]
17. Tan, R.; Guymer, R.H.; Luu, C.D. Subretinal Drusenoid Deposits and the Loss of Rod Function in IntermediateAge-Related Macular Degeneration. Invest. Ophthalmol. Vis. Sci. 2018, 59, 4154–4161. [CrossRef]
18. Querques, G.; Massamba, N.; Srour, M.; Boulanger, E.; Georges, A.; Souied, E.H. Impact of reticularpseudodrusen on macular function. Retina 2014, 34, 321–329. [CrossRef]
19. Connolly, D.M.; Barbur, J.L. Low contrast acuity at photopic and mesopic luminance under mild hypoxia,normoxia, and hyperoxia. Aviat. Space Environ. Med. 2009, 80, 933–940. [CrossRef]
20. Stockman, A.; Sharpe, L.T. Into the twilight zone: The complexities of mesopic vision and luminous efficiency.Ophthalmic. Physiol. Opt. 2006, 26, 225–239. [CrossRef]
21. Gao, W.; Cense, B.; Zhang, Y.; Jonnal, R.S.; Miller, D.T. Measuring retinal contributions to the opticalstiles-crawford effect with optical coherence tomography. Opt. Express 2008, 16, 6486–6501. [CrossRef][PubMed]
22. Eckmiller, M.S. Defective cone photoreceptor cytoskeleton, alignment, feedback, and energetics can lead toenergy depletion in macular degeneration. Prog. Retin. Eye Res. 2004, 23, 495–522. [CrossRef] [PubMed]
23. Hartmann, K.I.; Gómez, M.L.; Bartsch, D.-U.G.; Schuster, A.K.; Freeman, W.R. Effect of change in drusenevolution on photoreceptor inner segment/outer segment junction. Retina 2012, 32, 1492–1499. [CrossRef][PubMed]
24. Patel, P.J.; Chen, F.K.; Rubin, G.S.; Tufail, A. Intersession repeatability of visual acuity scores in age-relatedmacular degeneration. Investig. Opthalmol. Vis. Sci. 2008, 49, 4347–4352. [CrossRef] [PubMed]
25. Rosser, D.A.; Cousens, S.N.; Murdoch, I.E.; Fitzke, F.W.; Laidlaw, D.A. How sensitive to clinical change areETDRS logMAR visual acuity measurements? Investig. Ophthalmol. Vis. Sci. 2003, 44, 3278–3281. [CrossRef][PubMed]
26. Yazdanie, M.; Alvarez, J.; Agrón, E.; Wong, W.T.; Wiley, H.E.; Ferris, F.L.; Chew, E.Y.; Cukras, C.A. Decreasedvisual function scores on a low luminance questionnaire is associated with impaired dark adaptation.Ophthalmology 2017, 124, 1332–1339. [CrossRef] [PubMed]
27. Thompson, A.C.; Luhmann, U.F.; Stinnett, S.S.; Vajzovic, L.; Horne, A.; Toth, C.A.; Cousins, S.W.; Lad, E.M.Association of low luminance questionnaire with objective functional measures in early and intermediateage-related macular degeneration. Investig. Opthalmol. Vis. Sci. 2018, 59, 289–297. [CrossRef]
© 2020 by the authors. Licensee MDPI, Basel, Switzerland. This article is an open accessarticle distributed under the terms and conditions of the Creative Commons Attribution(CC BY) license (http://creativecommons.org/licenses/by/4.0/).
Related Documents