Exploratory fishing by R.V. VARUNA BULLETIN NO. 12 C ENTRAL M ARINE F ISHERIES R ESEARCH I NSTITUTE J ULY 1969

Welcome message from author
This document is posted to help you gain knowledge. Please leave a comment to let me know what you think about it! Share it to your friends and learn new things together.
Transcript
Exploratory fishingby R.V. VARUNA
BULLETIN NO. 12
CENTRAL MARINE FISHERIES RESEARCH INSTITUTE
JULY 1969

I C A R
BULLETIN OF THE CENTRAL MARINE FISHERIES RESEARCH INSTITUTE(Abbr. Bull. cent. mar. Fish., Res. Inst.)
Number 12
EXPLORATORY FISHING BY R.V. VARUNA
ByE. G. Silas
July, 1969
CENTRAL MARINE FISHERIES RESEARCH INSTITUTEMarine Fisheries P.O.
Mandapam CampRamanathapuram District
India
THE BULLETIN OF THE CENTRAL MARINE FISHERIESRESEARCH INSTITUTE IS PUBLISHED AT IRREGULARINTERVALS AS AND WHEN INFORMATION OF A GENERALNATURE BECOMES AVAILABLE FOR DISSEMINATION.
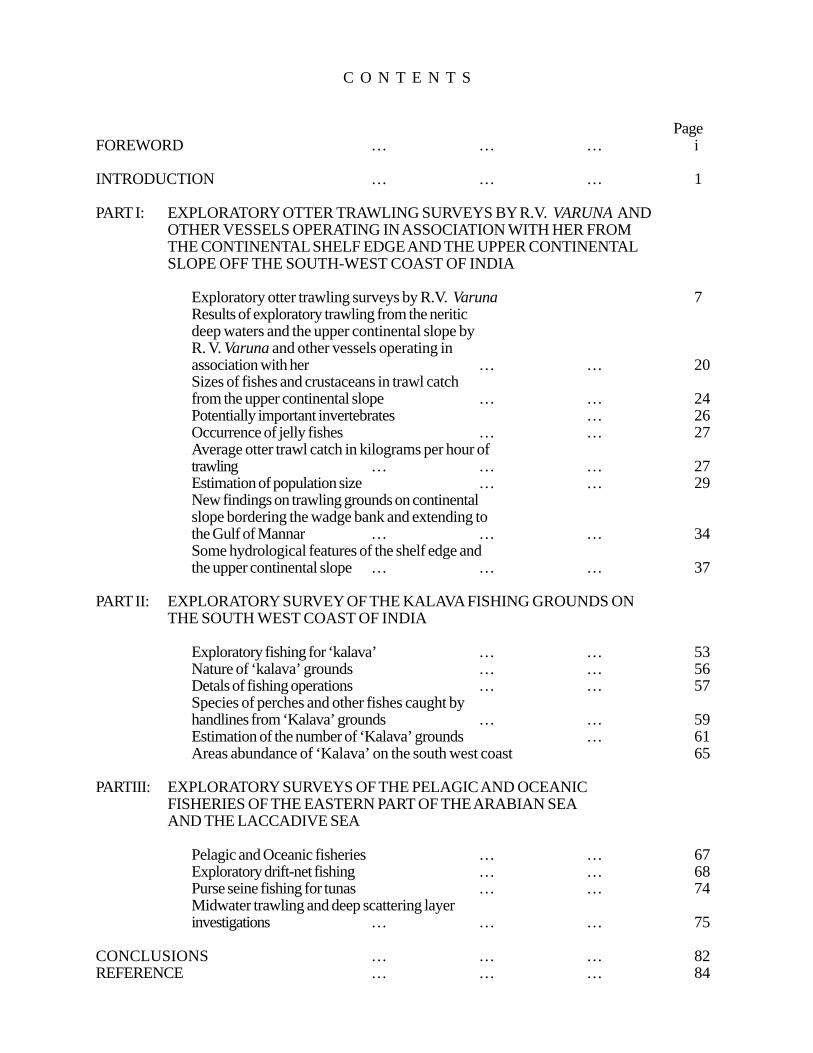
C O N T E N T S
PageFOREWORD … … … i
INTRODUCTION … … … 1
PART I: EXPLORATORY OTTER TRAWLING SURVEYS BY R.V. VARUNA ANDOTHER VESSELS OPERATING IN ASSOCIATION WITH HER FROMTHE CONTINENTAL SHELF EDGE AND THE UPPER CONTINENTALSLOPE OFF THE SOUTH-WEST COAST OF INDIA
Exploratory otter trawling surveys by R.V. Varuna 7Results of exploratory trawling from the neriticdeep waters and the upper continental slope byR. V. Varuna and other vessels operating inassociation with her … … 20Sizes of fishes and crustaceans in trawl catchfrom the upper continental slope … … 24Potentially important invertebrates … 26Occurrence of jelly fishes … … 27Average otter trawl catch in kilograms per hour oftrawling … … … 27Estimation of population size … … 29New findings on trawling grounds on continentalslope bordering the wadge bank and extending tothe Gulf of Mannar … … … 34Some hydrological features of the shelf edge andthe upper continental slope … … … 37
PART II: EXPLORATORY SURVEY OF THE KALAVA FISHING GROUNDS ONTHE SOUTH WEST COAST OF INDIA
Exploratory fishing for ‘kalava’ … … 53Nature of ‘kalava’ grounds … … 56Detals of fishing operations … … 57Species of perches and other fishes caught byhandlines from ‘Kalava’ grounds … … 59Estimation of the number of ‘Kalava’ grounds … 61Areas abundance of ‘Kalava’ on the south west coast 65
PARTIII: EXPLORATORY SURVEYS OF THE PELAGIC AND OCEANICFISHERIES OF THE EASTERN PART OF THE ARABIAN SEAAND THE LACCADIVE SEA
Pelagic and Oceanic fisheries … … 67Exploratory drift-net fishing … … 68Purse seine fishing for tunas … … 74Midwater trawling and deep scattering layerinvestigations … … … 75
CONCLUSIONS … … … 82REFERENCE … … … 84

FOREWORD
The long-felt need of suitable vessels for exploratory cum fisheries oceanographywork since the inception of the Central Marine Fisheries Research Institute in 1947was partially fulfilled first by the provision of the converted fishing trawlers M.O.KRISTENSEN and R.V. KALAVA in 1957 and subsequently in 1962 by the moresophisticated and specially built Research Vessel VARUNA through the courtesy ofthe Indo-Norwegian Project. Initially, for want of suitable fishing gear, onlyhydrographical data were collected, but after the later part of 1963 exploratory fishingwas integrated with the programmes of the hydrographical studies.
R.V. VARUNA being fully equipped with the modern auxillary fishing appliancessuch as the echosounder and the Asdic, enabled carrying out exploratory surveys onthe continental shelf and also on the continental slope, more particularly off the south-western coast of India, the fishery potential of which was hitherto very insufficientlyknown. The present report deals with the important findings in the exploratory surveyscarried out in the south –western region. A wide variety of fishing gears viz., ottertrawls, surface drift nets, handlines, purse-seines, long-lines, surface trolling andmidwater trawls has been used with encouraging results. The discovery of variedspecies of deep sea fishes and deep sea prawns and lobsters some of which occurringin dense concentrations on the sea bed has opened new vistas for prospectivecommercial exploitation. The exploratory survey of the KALAVA fishing groundsusing the echo-sounder in conjunction with the Asdic has furnished very valuableinformation on the nature, extent and the bathymetric distribution of these grounds.Certain characteristic echo-traces from deep scattering layers furnished evidence ofthe movements of the shoals of tuna and billfishes indicating their fair abundance in theregion. These and other important findings are presented in this Bulletin as a preliminaryreport to make them available sufficiently in advance to those interested pending thepublication of detailed accounts which is bound to take a considerable time.
i i
The cruises were carried out under the leadership of my colleague Dr. E.G. Silasand it gives me great pleasure to place on record my high appreciation of the veryarduous task he had undertaken and for furnishing very valuable information on thewell coordinated exploratory surveys carried out by him on the south west coast ofIndia in the form of this outstanding contribution. It may not be out of place to state inthis connection he had taken upon himself this intensive investigation in addition to hisregular programme of work mainly out of his initiative and interest. My thanks are alsoto other colleagues who participated in the exploratory cruises and extended all helpand co-operation to make these investigations yield fruitful results. It is with pleasurethat I express my thanks to the Indo-Norwegian Project for making available R.V.VARUNA and extending all possible help to the scientific staff of the Institute toconduct the research and exploratory cruises.
Mandapam CampJuly, 1969
S. JONESDirector
Central Marine FisheriesResearch Institute
EXPLORATORY FISHING BY R.V. VARUNA
By
E.G. Silas
Central Marine Fisheries Research Institute, Mandapam Camp.
INTRODUCTION
The rapid strides taken in the development of mechanised fishing fleet for fishing beyond the 5 to
10 kilometre traditional fishing limits in our waters are to some extent due to the encouraging results of
exploratory otter trawlings carried out in earlier years. As pathfinders in these exploratory surveys, special
mention should be made of the work done by the ‘GOLDEN CROWN’ (1908-11), “WILLIAM
CARRICK” (1921-22), and “LADY GOSCHEN” (1927-30). The results obtained from these and other
vessels have been documented on a number of reports (Anon. 1931, 1962; Chidambaram, 1953; Hefford,
`1949; John et al., 1959; Raj 1933; and Sorely, 1948). More recently, Rao (1969) has ably analysed
and summarised the results of exploratory fishing carried out by many vessels including those of the Deep
Sea Fishing Stations of the Government of India during the last 20 years.
Presently fishing by mechanised boats is almost exclusively for groundfish and in some place as off
Bombay trawling is carried out in depths upto about 75 metres. Beyond this, the continental shelf has
remained virtually a mare incognitum as regards the occurrence of fishing grounds, the types of species
present, as well as the quantities in which they may occur to permit commercial fishing. Practically no
trawls had been operated in the deep waters off the south west coast of India, but for some zoological
curiosities collected from the deeper waters (also from the deep waters of the Bay of Bengal and Andaman
Sea) by R.I.M.S. “INVESTIGATOR’ and reported on by Alcock and others at the turn of the century,
R.V. “CONCH” of the University of Kerala., and R.V. “KALAVA” of the Indo-Norwegian Project made
a few deep-water trawl hauls along the edge of the continental shelf off the kerala Coast between 1959
and 1961.
2
In January 1962.the Indo-Norwegian Project made available R.V. VARUNA for fishery
oceanographic work in the Indian Seas to be conducted by the Central Marine Fisheries Research Institute.
As the Project establishment at Cochin was still in its infancy, sufficient fishing gear had not been available
for carrying out any intensive exploratory surveys during the first two and half years, though the vessels was
continuously used for collection of valuable hydrographic data off the west and east coasts of India and the
Laccadive Sea as well as for participation in some of the cruises of the International Indian Ocean Expedition.
Perforce, most of the trawling operations carried out from R.V. VARUNA were from shallow inshore
waters. From the latter part of 1963 it has been possible to work out an integrated programme of hydrogrpahy
cum exploratory fishing, various fishing gears having been used for the latter. Several factors have intervened
on and off to, interrupt the programme. In spite of this with persistent effort it has been possible to collect
very useful data regarding bottom topography; demersal fishing grounds and potential fishery resources
and the hydrological features of the area, especially off the south west coast of India and the Laccadive
Sea. During the last two years, other larger vessels of the Indo-Norwegian Project, namely M.V. KLAUS
SUNNANAR (220 H.P), M.V. TUNA (480 H.P.) and M.V. VELAMEEN (480 H.P) have also been
closely associated with the exploratory survey programme of R.V.. VARUNA. This report embodies the
results of these surveys.
I take this opportunity to express my sincere thanks to Dr. S. Jones, Director, Central Marine
Fisheries Research Institute, and to Dr. R.R. Prasad, then Deputy Director, Central Marine Fisheries
Research Sub-station, Ernakulam for giving me all facilities for organizing and carrying out the exploratory
fishery survey programme of R.V. VARUNA. It gives me great pleasure to record here my sincere thanks
to Mr. G.N. Mitra, Joint Commissioner, Fisheries, Government of India for the active interest he has taken
in the exploratory cruises of R.V. VARUNA. To the Directors of the Indo-Norwegian Project, I wish to
express my thanks for the facilities extended to me and my colleagues from the Central Marine Fisheries
Research Institute. It gives me great pleasure to acknowledge the full hearted cooperation I received from
the skippers of R.V. VARUNA , namely Captain Sven M. Saetrae, Captain Haga, Captain Sankarankutty,
and Captain Joe Fernado, and crew who were always sympathetic to my request of
3
carrying out exploratory fishing whether it be night or day. I have received help from a number of my
colleagues at the Ernakulam Substation in the collection of data to which I am very thankful. I also wish to
record my appreciation and thanks to Mr. N.K. Prasad for the help rendered in the preparation of the
charts and to Mr. K. Virabhadra Rao and Mr. C. Mukundan for going through the manuscript and for
helpful suggestions.
OBJECTIVES OF THE EXPLORATORY SURVEY
Since the exploratory survey was planned as part of an integrated programme of hydrography
cum fishing, the scope of the survey was kept sufficiently comprehensive to obtain as much information as
possible on several problems. Often non-availability of gear or malfunctioning of shipboard equipment or
adverse weather conditions or unpredictable changes in cruise programme, or periods when the vessel
was dry docked or tied up did hamper work, but good use was made of available facilities to carry out
alternate types of fishing or conducting other observations when on cruise, besides completing on each
cruise the routine hydrographic programme.
Some of the salient characteristics of R.V. VARUNA, a 28.0 m (LOA), 182 GT vessel (Plate-I)
built in 1961 at a cost of about £ 61,000 at A/S Ankgrlokkenn, Floro, Norway, have been given by
Myrland (1962). Capable of a cruising range of 3400 nautical miles at a maximum speed of 9.5 knots, she
is provided with a Wichmann 4 AC, 400 HP 350 rpm main engine and two auxiliary engines- Volvo Penta
type MD 47A, 52 HP, 1500 rpm connected to two 220 AC generators, each of 20 kilowatts. Presently
her fuel capacity is 27 tons which gives her a maximum endurance at sea of about 25 days. She has one set
(3 blades 350 rpm) controllable pitch propeller which along with the engine is controlled from the wheel
house. In addition to a fish hold of 24 m3 capacity, she has two deep freezing holds (-32o C) and one cold
storage (+5o C). Freshwater capacity is 36.5 tons and in addition she has a Nirex evaporator which can
supply one ton of freshwater every 24 hours. She has hydraulic steering equipment, electric log, radio
direction finder (AVS Electriske Bureau 6 PMZ), and Decca type 404 radar with a range of 48 nautical
miles. The radio telephone, Simrad type TA3 is a 100 W. transmitter with 12 frequencies and an
4
approximate range of 500 miles. Her hydraulic two drum winch (Hydraulik type DLA8) can hold altogether2520 metres of trawl wire, and her two hydraulic hydrographic winches 4000 and 2000 metres of 4 mmsteel wire. She is also fitted with a line hauler and a puretic power block. There are about 50 m2 of opendeck space and one sampling laboratory and two analytical Laboratories (together 19 m2) There isaccommodation for 15 crew and 4 scientists.
In addition to the hydrographic equipments such as Nansen reversing bottles, bathythermographs,etc. the fish locating equipments are:
Echo sounders: Simrad type 513-3, range 1250 metres“ “ 513-1, range 12000 metres“ “ 516-13, range 180 metres
Asdic – Simrad ype 564-3 with horizontal range of 1500 metres.
The fishing gears used during the exploratory surveys were:
1. Otter trawls2. Surface drift nets3. Handlines4. Purse seine5. Longlines6. Surface troll lines7. Isaacs-Kidd midwater trawl
Thus, during the cruises of R.V. VARUNA the major Objectives were:
1. To investigate the hydrography of the shelf and oceanic waters (data on temperature, salinity anddissolved oxygen from standard depths; in situ measurements, at selected stations, of primaryorganic production using C14; phytoplankton and zoo plankton collections and collection of macro-zooplankton and nekton with the Isaacs-Kidd midwaters trawl.
2. To conduct echosurveys cum fishing;:a. For location of subsurface fish shoals and demersal fishing grounds especially in the depth
range 75 to 450 metres and assessment of demersal fishery resources of the shelf edge and theupper continental slope.
b. For obtaining information on bottom topography and bottom contours.c. For studying patterns of fish behaviour.
5
d. To find out the frequency of occurrence of perch fishing grounds in relation to depth range as
well as different latitudes.
e. To investigate the deep scattering layers, especially the upper layer where concentration of
forage for pelagic fishes such as tunas, marlins, and sharks as well as oceanic squids occur.
3. To carry out a systematic survey of the neritic deep water as well as upper continental slope fauna,
especially fishes and crustaceans to help in the resources survey as well as to, facilitate identification
of the fish eggs and larvae and the developmental stages of crustaceans in the plankton collections
made from various depths.
4. To carry out handline fishing for perches (“ Kalava”) in order to find out the species composition,
their respective abundance, patterns of distribution, behaviour and biology.
5. To carry out drift net (gill net) fishing from the shelf as well oceanic waters for obtaining information
on pelagic fishes, especially tunas and related species, their food, fecundity, spawning periods and
spawning grounds;and information on the occurrence, distribution and biology of such potential
resources as pelagic sharks and oceanic squids.
6. For carrying out purse seining for tunas and related species in the Laccadive Sea (especially for
the skipjack tuna and the yellowfin tuna) and in the neritic waters for coastal species of tunas, and
for testing the efficiency of the gear.
7. To observe and record fish shoals and also study concentrations of oceanic birds and their behaviour
which help considerably visual scouting for surface and subsurface tuna shoals.
8. To observe and record phytoplankton blooms and investigate any fish morality.
9. To observe and record marine mammals, turtles, etc. occurring in the areas of survey.

PART – I
EXPLORATORY OTTER TRAWLING SURVEYS BY R.V. VARUNAAND OTHER VESSELS OPERATING IN ASSOCIATIONWITH HER FROM THE CONTINENTAL SHELF EDGE
AND THE UPPER CONTINENTAL SLOPE OFFTHE SOUTH-WEST COAST OF INDIA

7
EXPLORATORY OTTER TRAWLING SURVEYS BY R.V. VARUNA
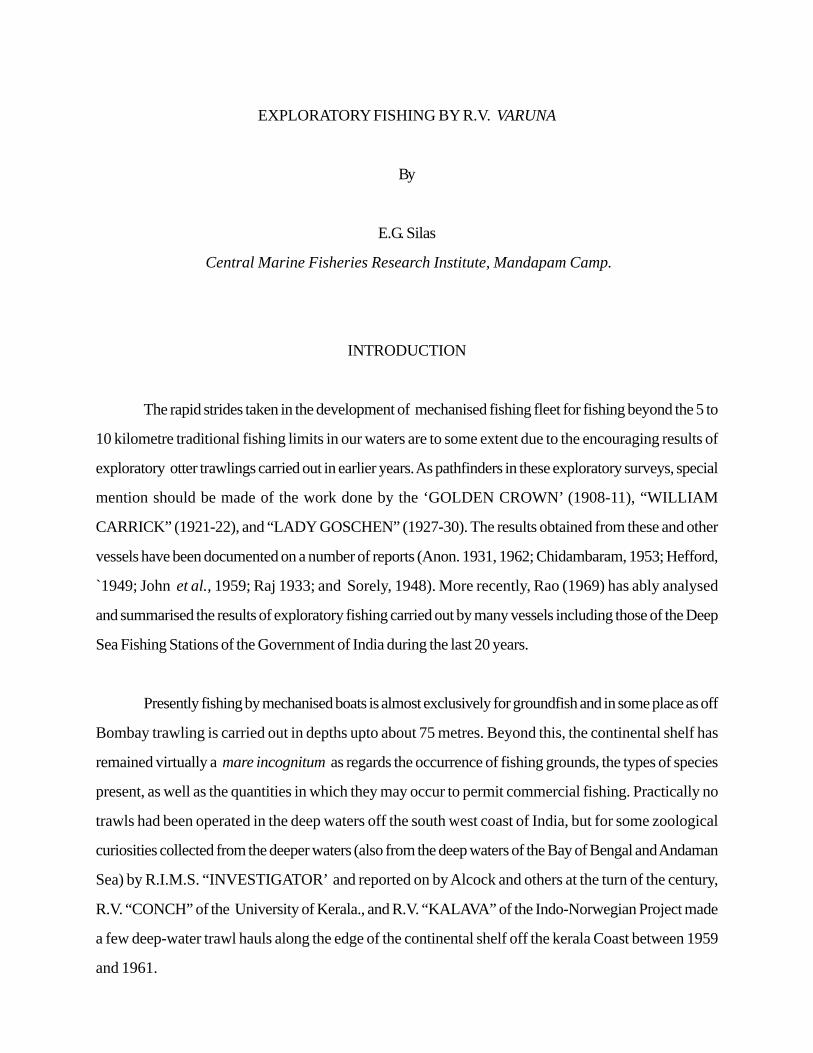
Between January 1962 and December 1968 R.V. VARUNA carried out 418 otter trawling
operations from various depths on the continental shelf and the continental slope to a maximum depth of
450 metres in a stretch of about 460 nautical miles between Karwar and Cape Comorin (Figure – 1.).
The exploited demersal fisheries of the 10-75 metre depth range of this region have been recently discussed
by Rao (1969). The fishes most commonly trawled in this depth range were: Scoliodon palasorrah
(Cuvier), Rhynchobatis djeddensis (Forskal). Pastinachus sephen (forskal), Himantura urnak
(Forskal), Kowala coval (Cuvier), Pellona ditchela Valenciennes, Opisthopterus tardoore (Cuvier),
Goniolosa manmina (Hamilton), Andaontostoma chacunda (Hamilton), Thrissocles mystax (Bloch
& Schneider), T. malabarica (Bloch), Saurida tumbil (Bolch), Synodus indicus (Day), Netuma
thalassinus (Ruppell), Holocentrum rubrum (Forskal), Myripristis murdjan (Forskal) Sillago
sihama (Forskal), Sphyraena acutipinnis Day, Nemipterus japonicus (Bloch), Leiognathus
spelendens (Cuvier), L. bindus (Valenciennes), Grammoplites scaber (Linnaeus), Suggrundus
tuberculatus (Cuvier), S. carbunculus (Valenciennes), Thysanophrys crocodilus (Tilesius), Selar
kalla (Cuvier,) Carangoides malabricus (Bloch). Megalaspis cordyla (Linnaeus), Decapterus
russelli (Rupell), Atropus atropus (Bloch), Lutjanua johni (Bloch), L. argentmaculatus (Forskal), L.
kasmira (Forskal), L. malabricus (Schneider), Pomadasys hasta (Bloch), Johnius
dussumieri (Cuvier), J. diacanthus (Lacepede), Otolithus argentatus Cuvier, Drepane punctata
(Linnaeus), Leptura canthus savala (Cuvier), Trichiurus lepturus Linnaeus, Pseudorhombus arsius
Brachirus orientalis (Bloch), Solea elongata Day, Cynoglossus bilineatus (Lacepede), C. semifasciatus
Day, Polynemus plebius (Broussonet), P. sexifilis Valenciennes, Lactarius lactarius (Schneider),
Parastromateus niger (Bloch), and Psenes indicus (Day). On a few occasions Sardinella longiceps
Valenciennes and Restrelliger kanagurta (Cuvier) have also ccurred in the trawl catches. Among prawns,
Metapenaeus dobsoni (Miers) was the dominant species in catches between 10 and 45 metres.
In view of the exploratory surveys being carried out by other agencies including the prawn
industry in the 10 to 75m depth range, especially for discovering new prawn fishing
8
grounds, no special trawling surveys were carried out by R.V. VARUNA with this as objective.
From 1965 the emphasis had been on trawling from deeper waters, especially beyond the 75-
metre depth contour. Thus for the first time in Indian seas an organized effort was initiated for surveying the
deeper waters along the edge of the continental, shelf as well as upper continental slope. Echosounders
were used continuously on cruises for obtaining information on bottom profiles and bottom conditions, and
noting demersal fish concentrations and seeking out trawlable grounds. On the basis of innumerable continuous
observations of echo traces as well as the results of fishing as reflected in the catch composition, it has been
possible to broadly demarcate three Depth zones beyond the 75 metre depth contour as follows:
1. Depth Zone: I. 75 to 100 metres: Bottom mostly rocky with out crops of rocks forming
ideal habitats for several species of sea perches and rock cods known locally as ‘Kalava’ and “Velameen’.
Trawlable grounds in this depth range are very patchy and restricted south of Mangalore. Invariably in all
successful trawl hauls the threadfin bream Nemipterus japonicus was found to be the most dominant
species, often forming over 75% of the catch. The other species which commonly occurred in the catch
were Trichiurus lepturus, Decapterus russelli, Psenes indicus Saurida undosguamis (Richardson)
and Synodus sp. On the whole, this depth zone is poor as far as trawling grounds go, but as will be
discussed in a later section of this report, it is very important on account of the perch fishing grounds or
“Kalava grounds’ it contains.
2. Depth Zone-II. 101 to179 metres: This depth zone has good trawlable grounds,
especially north of Cochin to Karwar. However, between Ponnani and South of Alleppey stray
occurrence of rocky outcrops has been detected on the echograms taken in the depth range 100 to 125
metres. In the trawl catches, among fishes Nemipterus and Synodus indicus predominate,
the other species commonly caught being Centropristis investigatoris Alcock, Emmelichthys sp. (a
new species being described elsewhere), Priacanthus sp. Callionymus sp. Peristendion spp.
Trigla spp. Holocentrus sp. Polymixia nobilis Lowe and Parascolopsis sp. Among
prawns, species of Metapenaeopsis occur in small quantities. It would seem that the
9
most important crustacean species to inhabit this depth range is the crab Charybdis (Goniohellenus)
edwardsi Leene & Buitendijk which was invariably present in all trawl catches and sometimes formed bulk
of the catch (Plate III). The occurrence, distribution, and abundance of this species and its importance as
a potential resource are dealt with in a later section in this report. Depth zones I and II also form part of the
neritic deep waters.
3. Depth zone-III. 180 to 450metres: This depth range covers part of the continental slope
and for convenience shall be termed the upper continental slope. The slope upto the 450 metre depth
contour varies considerably in width from the shelf edge. It is broadest off Quilon where it forms a fairly
extensive bank with an average depth of about 300 metres over the bank and having good trawling
grounds The species composition shows some difference depth-wise. On the whole, species trawled in
200 metres also occur at 400 metre depth though their relative abundance may vary at different depths.
Nearly 150 species of fishes have been identified from the trawl collections from the upper
continental slope. A few of the more important species are shown in Plates I & II. The
systematic position and nomenclature of several of these need clarification and revision. This work is
under progress. Several of the species are new distributional records for Indian seas,
previously having been reported from South African waters, or the Pacific or the Atlantic Ocean. From the
commercial point of view the bulk of these species will be classed as trash fish. One note
worthy feature is that unlike the species trawled in the continental shelf area, those from the
continental slope are relatively smaller in size. In addition, the water content in the meat being high, the
flesh in most of the species is not firm, which makes it break up on cooking. But for a few species such as
Cubiceps natalensis Gilchrist and von Bonde, Chlorophthalmus agassizi Bonaparte, C. corniger
Alcock, Chascanopsetta lugubris Alcock, Epinnula orientalis Gilchrist and von Bonde, Synagrops
japonicus (Steindachner and Doderlein), Polymixia nobilis Lowe, and Paseneopsis Cyanea (Alcock),
the bulk of the species will go towards supporting a fish meal or fish paste industry. Among the species
listed above, C. agassizi and C. natalensis are very important. Both occur in large shoals and form
10
the bulk of the fish catch within this depth range. The occurrence, depthwise abundance, size compositionin the catch, maturity, fecundity and spawning of the above species, as well as others occurring in this depthzone are under study.
The following species of penaeid and non-penaeid prawns have been obtained in the trawl catches fromthis zone:
Penaeid prawns:
*Aristeus semidentatus ( Bate)Aristeus alcocki RamadanAristaeomorpha wood-masoni CalmanMetapenaeopsis andamanensis (Wood Mason)*Penaeopsis rectacutus (Bate)Hymenopenaeus aquakis (Bate)Parapenaeus investigatoris Alcock and AndersonSolenocera hextii Wood-Mason
Non-Penaeid Prawns:*Heterocarpus gibbosus Bate*Heterocarpus wood-masoni Alcock*Parapandalus spinipes Bate*Plesionkia martia (A. Milne-Edwards)*Plesionkia ensisOplophorus sp.
The catch composition of the deep-sea prawns show that the species marked with an asterisk inthe above list are more important as they constitute the bulk of the prawn catch. Good concentration ofAristeus semidentatus, the most preferred among the deep-sea prawns on account of its large size, isfound to occur in the depth range 275-375 metres, especially around 100 41’N. to 100 53’ N and750 98’E. to 750 21’E.
The deep-sea lobster Puerulus sewelli Ramadan has been obtained inthe depth range 180 to 275 metres, though stray specimens have appeared in haulstaken as deep as 400 metres. This species is of special interest as it occurs in grounds wheretrawling is possible. Excellent lobster grounds were struck earlier this year in the depth range 180 to 225metres off Quilon when vessels of the Indo-Norwegian Project working in the
11
‘Varuna Programme’ were able to land about 59 tonnes of P. sewelli in the course of a few trips
undertaken between February and April. The training vessel BLUE FIN of the Central Institute of Fisheries
Operatives, Cochin, which was also temporarily engaged in deep-sea lobster fishing, was able to land 89
tones in the course of cruises undertaken during March-June 1969. The catch rates have been very high
and as much as two tones of lobsters have been taken in a single haul.
Among molluscs, the deep-sea octopod Berrya Kerlensis Oommen has occurred in small quantities
in trawl catches between 200 and 350 metres. The gastropod Pirula investigatoris Smith* (Plate IV)
which I consider as a potential resources occurs in small quantities in trawl catches especially in the depth
range 180 to 275 metres.
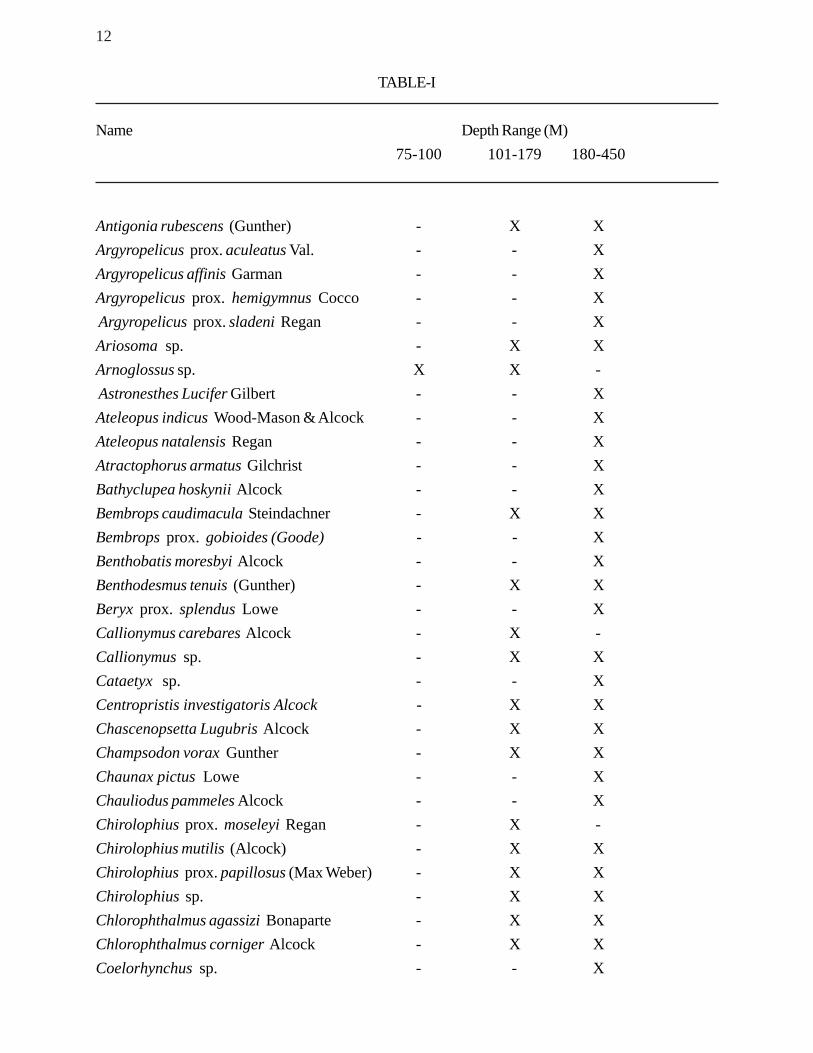
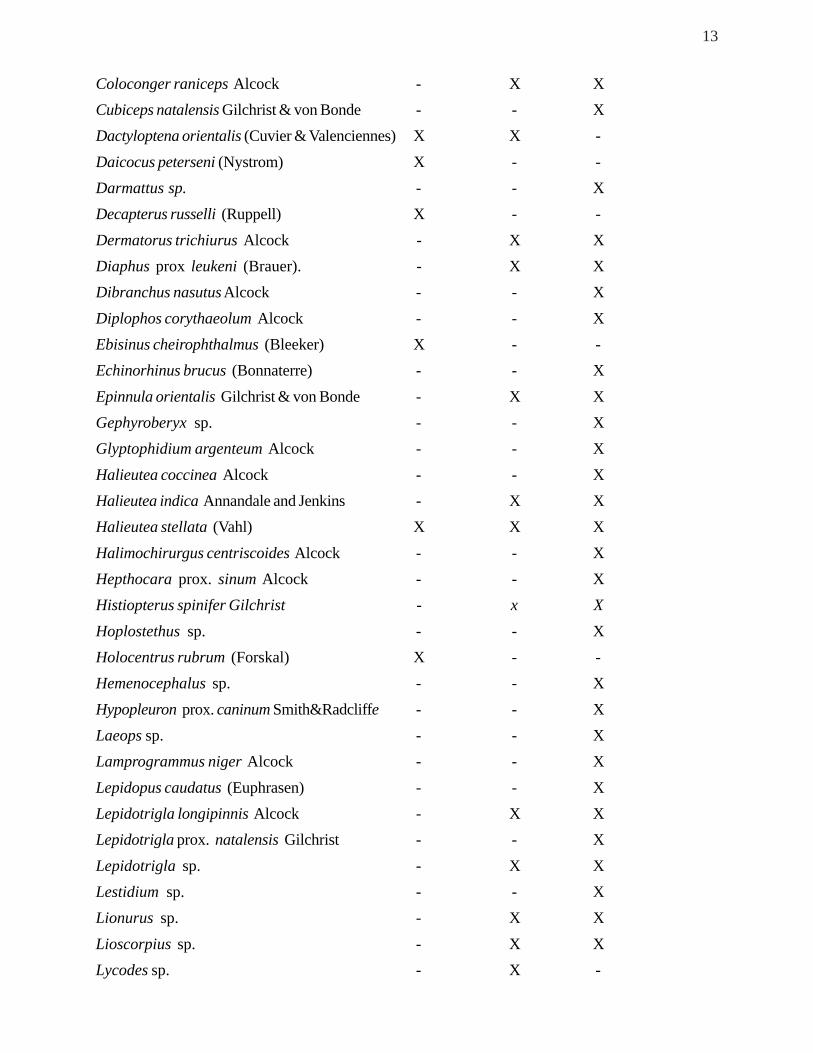
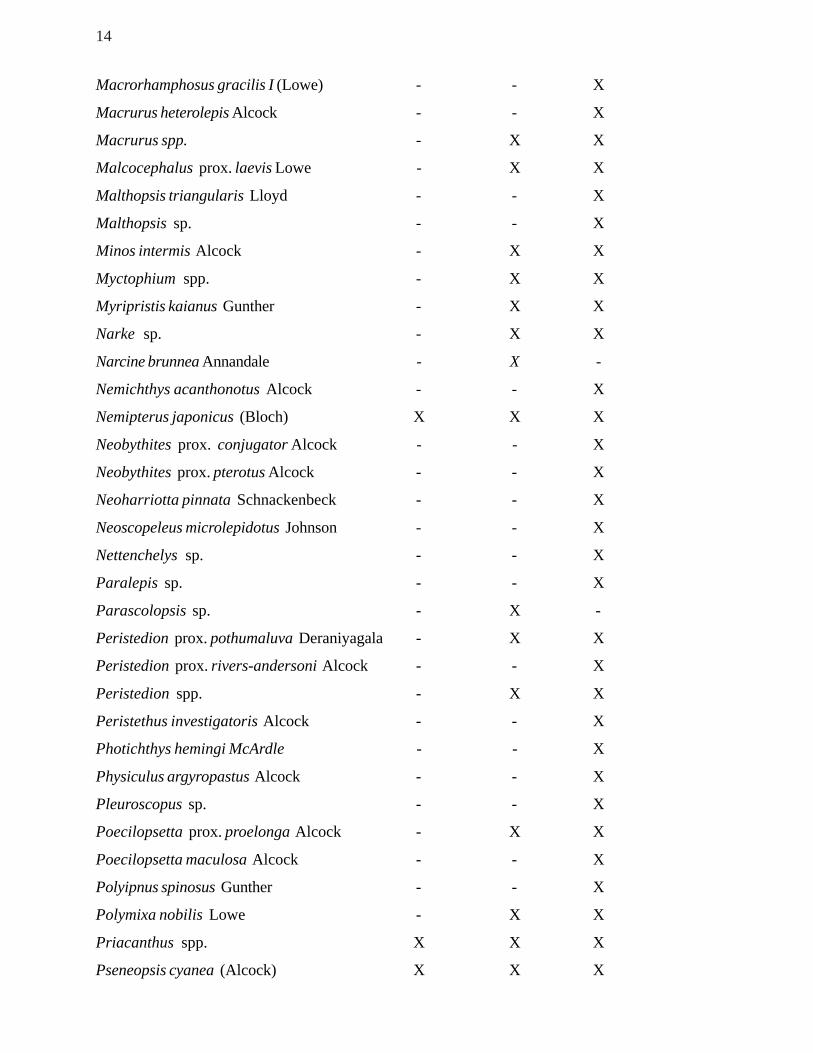
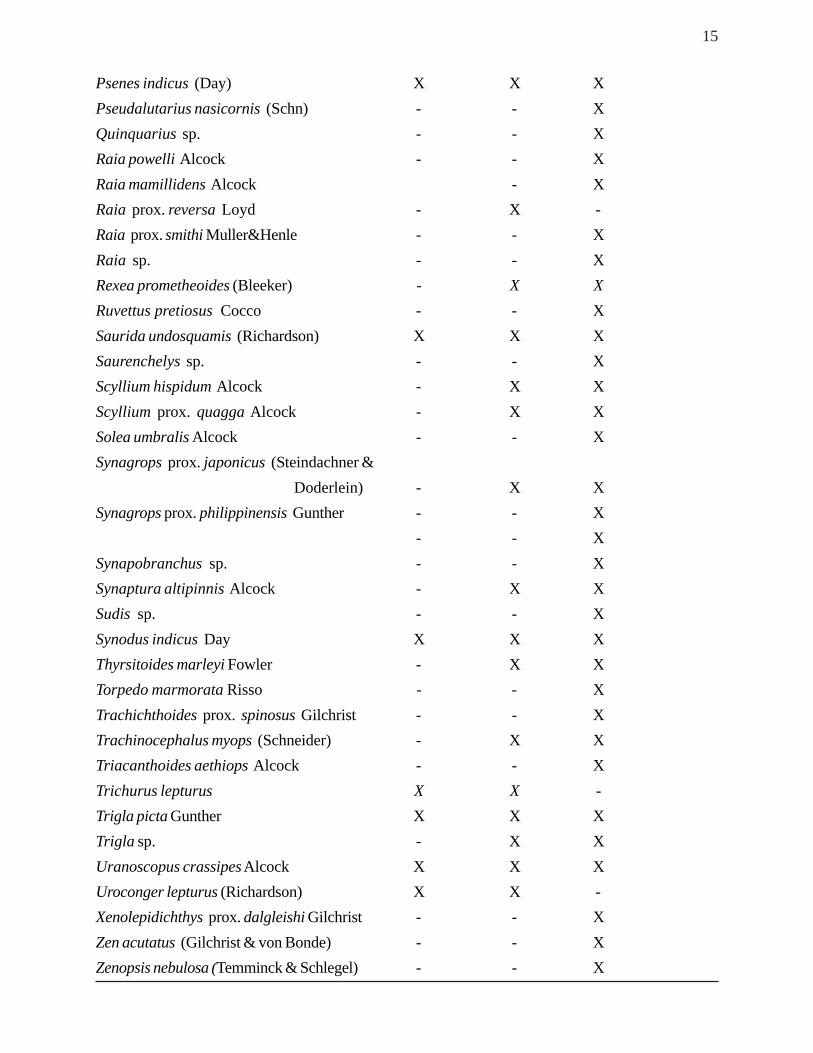
As already mentioned, the samples collected from the different depth zones are being analysed
and in view of the revisional studies under way, it is not possible to give the upto date names of all species
in the collections. The list of fishes in the collections given below is incomplete, as more species are likely
to be added in the course of future surveys, and specific names in some cases have not been indicated as
specific determination is not complete or nomenclature needs revision. However, this will give an idea of
the quality of the fish to be expected in the trawl catch from the neritic deep waters and upper continental
slope. The genera are arranged alphabetically and under each genus the species likewise (Table-I).
The information gained thus on the ichthyofauna of the shelf edge and the upper continental slope
has also gone a long way in helping in the proper identification of the fish larvae obtained in the plankton
collections during the research cruises of R.V. VARUNA. Since collections have been made from the
same grounds or the depth zones during different months of the year, detailed investigations on the biology
of the following species are under way:
Benthodesmus tenuis (Gunther), Centropristis investigatoris Alcock, Chascenopsetta
lugubris Alcock, Chlorophthalmus agassizi Bonaparte, Chlorophthalmus corniger Alcock, Cubiceps
natalensis Gilchrist and von Bonde, Epinnula orientalis Gilchrist and von Bonde, Lepidopus caudatus
(Euphrasen), Pseneopsis cyanea (Alcock), Rexea prometheoides (Bleeeker) and Scyllium hispidum
Alcock.
*Reidentified as Pyrula sewelli Prashad, 1927, Rec. Ind. Mus., p.230, pl. 22,
figs. 1, 2 & 4.
12
TABLE-I
Name Depth Range (M)75-100 101-179 180-450
Antigonia rubescens (Gunther) - X XArgyropelicus prox. aculeatus Val. - - XArgyropelicus affinis Garman - - XArgyropelicus prox. hemigymnus Cocco - - X Argyropelicus prox. sladeni Regan - - XAriosoma sp. - X XArnoglossus sp. X X - Astronesthes Lucifer Gilbert - - XAteleopus indicus Wood-Mason & Alcock - - XAteleopus natalensis Regan - - XAtractophorus armatus Gilchrist - - XBathyclupea hoskynii Alcock - - XBembrops caudimacula Steindachner - X XBembrops prox. gobioides (Goode) - - XBenthobatis moresbyi Alcock - - XBenthodesmus tenuis (Gunther) - X XBeryx prox. splendus Lowe - - XCallionymus carebares Alcock - X -Callionymus sp. - X XCataetyx sp. - - XCentropristis investigatoris Alcock - X XChascenopsetta Lugubris Alcock - X XChampsodon vorax Gunther - X XChaunax pictus Lowe - - XChauliodus pammeles Alcock - - XChirolophius prox. moseleyi Regan - X -Chirolophius mutilis (Alcock) - X XChirolophius prox. papillosus (Max Weber) - X XChirolophius sp. - X XChlorophthalmus agassizi Bonaparte - X XChlorophthalmus corniger Alcock - X XCoelorhynchus sp. - - X
13
Coloconger raniceps Alcock - X XCubiceps natalensis Gilchrist & von Bonde - - XDactyloptena orientalis (Cuvier & Valenciennes) X X -Daicocus peterseni (Nystrom) X - -Darmattus sp. - - XDecapterus russelli (Ruppell) X - -Dermatorus trichiurus Alcock - X XDiaphus prox leukeni (Brauer). - X XDibranchus nasutus Alcock - - XDiplophos corythaeolum Alcock - - XEbisinus cheirophthalmus (Bleeker) X - -Echinorhinus brucus (Bonnaterre) - - XEpinnula orientalis Gilchrist & von Bonde - X XGephyroberyx sp. - - XGlyptophidium argenteum Alcock - - XHalieutea coccinea Alcock - - XHalieutea indica Annandale and Jenkins - X XHalieutea stellata (Vahl) X X XHalimochirurgus centriscoides Alcock - - XHepthocara prox. sinum Alcock - - XHistiopterus spinifer Gilchrist - x XHoplostethus sp. - - XHolocentrus rubrum (Forskal) X - -Hemenocephalus sp. - - XHypopleuron prox. caninum Smith&Radcliffe - - XLaeops sp. - - XLamprogrammus niger Alcock - - XLepidopus caudatus (Euphrasen) - - XLepidotrigla longipinnis Alcock - X XLepidotrigla prox. natalensis Gilchrist - - XLepidotrigla sp. - X XLestidium sp. - - XLionurus sp. - X XLioscorpius sp. - X XLycodes sp. - X -
14
Macrorhamphosus gracilis I (Lowe) - - X
Macrurus heterolepis Alcock - - X
Macrurus spp. - X X
Malcocephalus prox. laevis Lowe - X X
Malthopsis triangularis Lloyd - - X
Malthopsis sp. - - X
Minos intermis Alcock - X X
Myctophium spp. - X X
Myripristis kaianus Gunther - X X
Narke sp. - X X
Narcine brunnea Annandale - X -
Nemichthys acanthonotus Alcock - - X
Nemipterus japonicus (Bloch) X X X
Neobythites prox. conjugator Alcock - - X
Neobythites prox. pterotus Alcock - - X
Neoharriotta pinnata Schnackenbeck - - X
Neoscopeleus microlepidotus Johnson - - X
Nettenchelys sp. - - X
Paralepis sp. - - X
Parascolopsis sp. - X -
Peristedion prox. pothumaluva Deraniyagala - X X
Peristedion prox. rivers-andersoni Alcock - - X
Peristedion spp. - X X
Peristethus investigatoris Alcock - - X
Photichthys hemingi McArdle - - X
Physiculus argyropastus Alcock - - X
Pleuroscopus sp. - - X
Poecilopsetta prox. proelonga Alcock - X X
Poecilopsetta maculosa Alcock - - X
Polyipnus spinosus Gunther - - X
Polymixa nobilis Lowe - X X
Priacanthus spp. X X X
Pseneopsis cyanea (Alcock) X X X
15
Psenes indicus (Day) X X XPseudalutarius nasicornis (Schn) - - XQuinquarius sp. - - XRaia powelli Alcock - - XRaia mamillidens Alcock - XRaia prox. reversa Loyd - X -Raia prox. smithi Muller&Henle - - XRaia sp. - - XRexea prometheoides (Bleeker) - X XRuvettus pretiosus Cocco - - XSaurida undosquamis (Richardson) X X XSaurenchelys sp. - - XScyllium hispidum Alcock - X XScyllium prox. quagga Alcock - X XSolea umbralis Alcock - - XSynagrops prox. japonicus (Steindachner & Doderlein) - X XSynagrops prox. philippinensis Gunther - - X
- - XSynapobranchus sp. - - XSynaptura altipinnis Alcock - X XSudis sp. - - XSynodus indicus Day X X XThyrsitoides marleyi Fowler - X XTorpedo marmorata Risso - - XTrachichthoides prox. spinosus Gilchrist - - XTrachinocephalus myops (Schneider) - X XTriacanthoides aethiops Alcock - - XTrichurus lepturus X X -Trigla picta Gunther X X XTrigla sp. - X XUranoscopus crassipes Alcock X X XUroconger lepturus (Richardson) X X -Xenolepidichthys prox. dalgleishi Gilchrist - - XZen acutatus (Gilchrist & von Bonde) - - XZenopsis nebulosa (Temminck & Schlegel) - - X
16
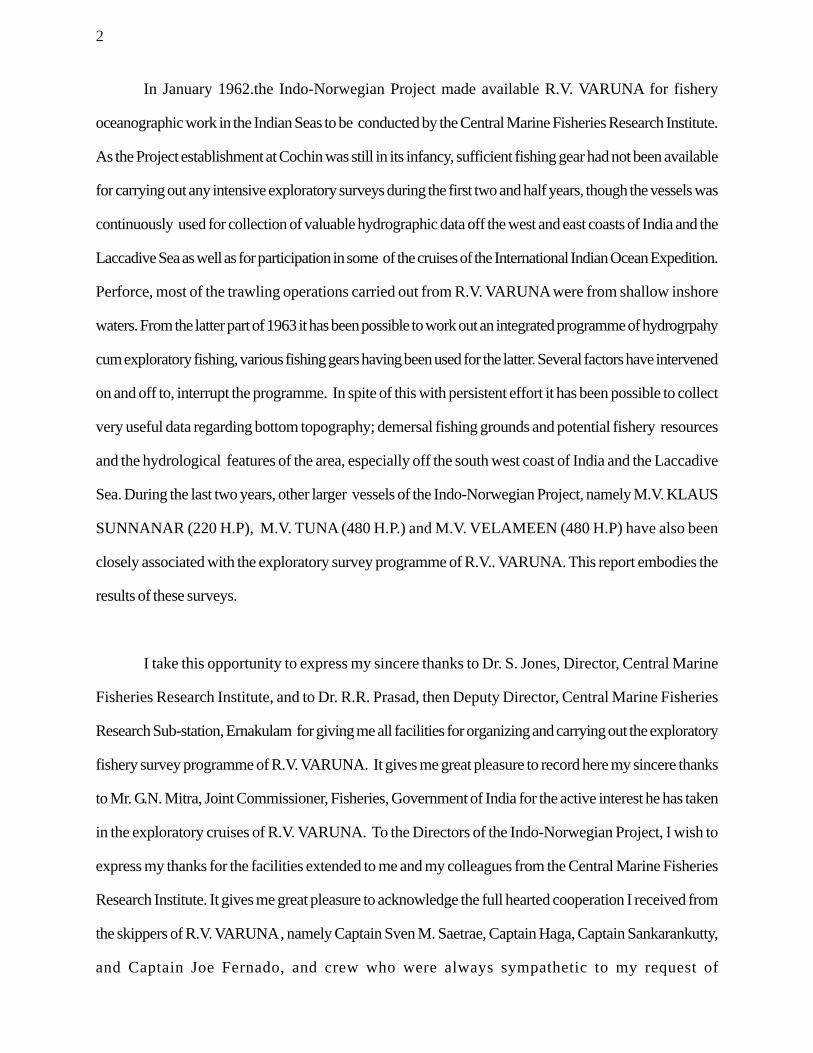
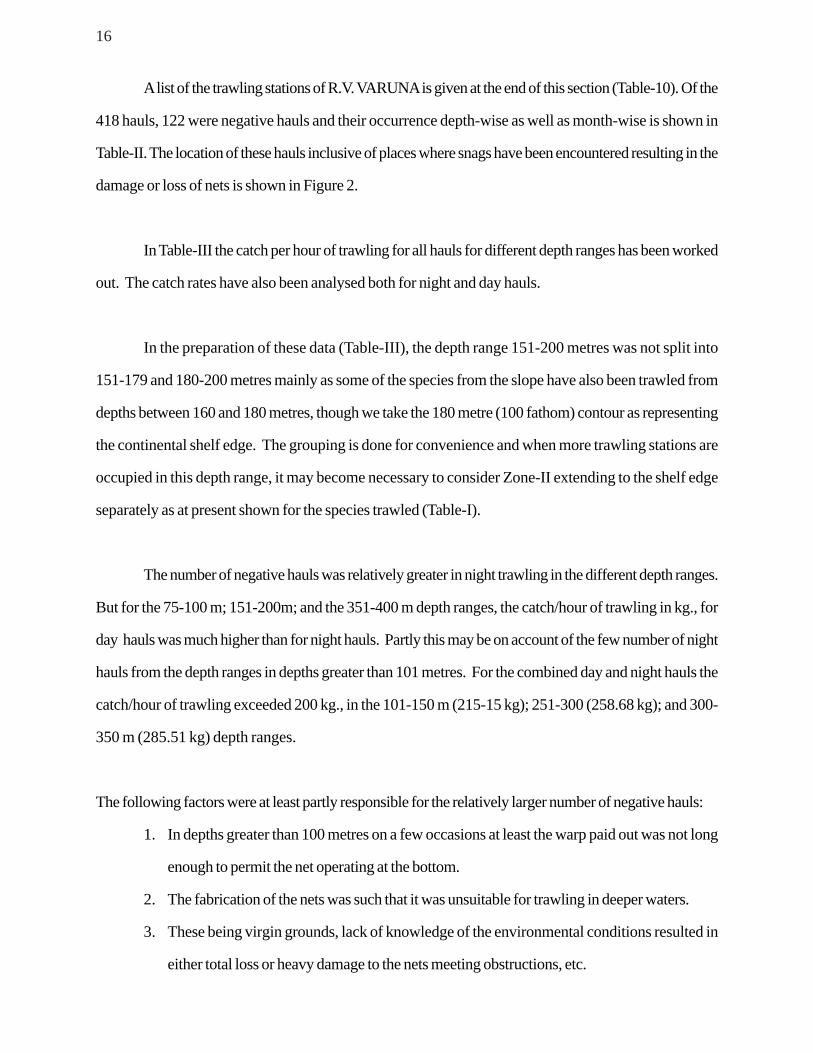
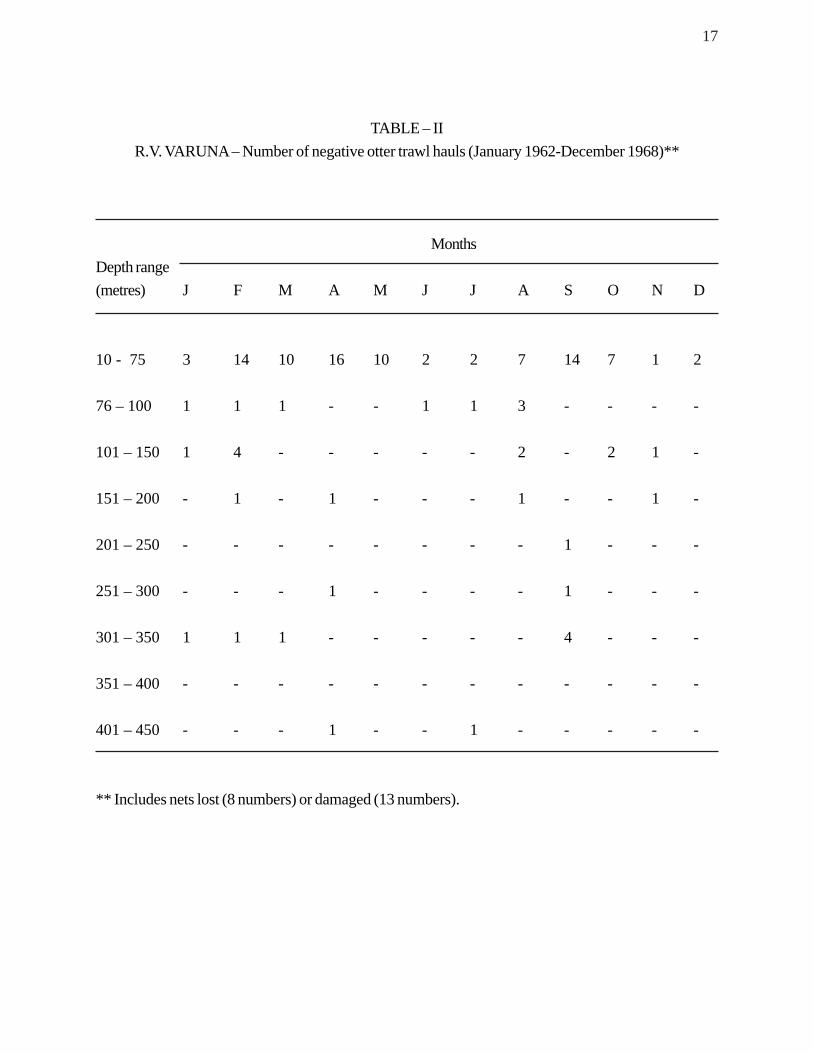
A list of the trawling stations of R.V. VARUNA is given at the end of this section (Table-10). Of the
418 hauls, 122 were negative hauls and their occurrence depth-wise as well as month-wise is shown in
Table-II. The location of these hauls inclusive of places where snags have been encountered resulting in the
damage or loss of nets is shown in Figure 2.
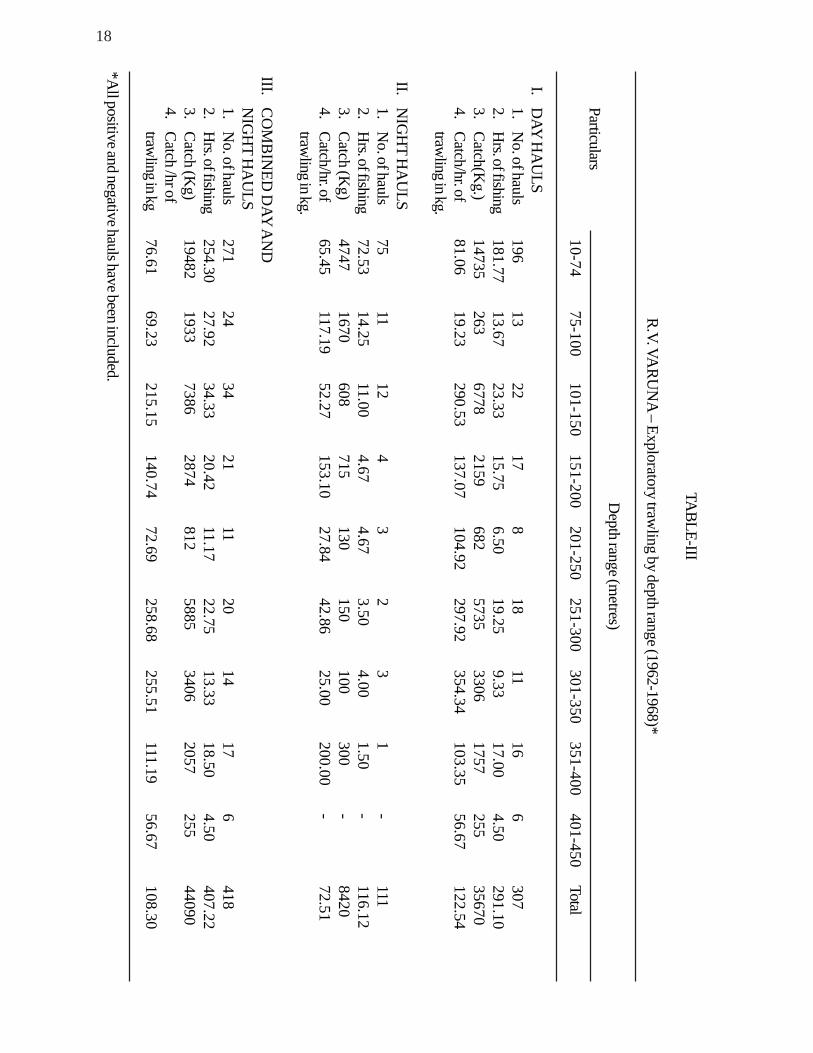
In Table-III the catch per hour of trawling for all hauls for different depth ranges has been worked
out. The catch rates have also been analysed both for night and day hauls.
In the preparation of these data (Table-III), the depth range 151-200 metres was not split into
151-179 and 180-200 metres mainly as some of the species from the slope have also been trawled from
depths between 160 and 180 metres, though we take the 180 metre (100 fathom) contour as representing
the continental shelf edge. The grouping is done for convenience and when more trawling stations are
occupied in this depth range, it may become necessary to consider Zone-II extending to the shelf edge
separately as at present shown for the species trawled (Table-I).
The number of negative hauls was relatively greater in night trawling in the different depth ranges.
But for the 75-100 m; 151-200m; and the 351-400 m depth ranges, the catch/hour of trawling in kg., for
day hauls was much higher than for night hauls. Partly this may be on account of the few number of night
hauls from the depth ranges in depths greater than 101 metres. For the combined day and night hauls the
catch/hour of trawling exceeded 200 kg., in the 101-150 m (215-15 kg); 251-300 (258.68 kg); and 300-
350 m (285.51 kg) depth ranges.
The following factors were at least partly responsible for the relatively larger number of negative hauls:
1. In depths greater than 100 metres on a few occasions at least the warp paid out was not long
enough to permit the net operating at the bottom.
2. The fabrication of the nets was such that it was unsuitable for trawling in deeper waters.
3. These being virgin grounds, lack of knowledge of the environmental conditions resulted in
either total loss or heavy damage to the nets meeting obstructions, etc.
17
TABLE – IIR.V. VARUNA – Number of negative otter trawl hauls (January 1962-December 1968)**
MonthsDepth range(metres) J F M A M J J A S O N D
10 - 75 3 14 10 16 10 2 2 7 14 7 1 2
76 – 100 1 1 1 - - 1 1 3 - - - -
101 – 150 1 4 - - - - - 2 - 2 1 -
151 – 200 - 1 - 1 - - - 1 - - 1 -
201 – 250 - - - - - - - - 1 - - -
251 – 300 - - - 1 - - - - 1 - - -
301 – 350 1 1 1 - - - - - 4 - - -
351 – 400 - - - - - - - - - - - -
401 – 450 - - - 1 - - 1 - - - - -
** Includes nets lost (8 numbers) or damaged (13 numbers).
18
TABLE-III
R.V. VARU
NA – Exploratory traw
ling by depth range (1962-1968)*
Depth range (m
etres)Particulars
10-7475-100
101-150151-200
201-250251-300
301-350351-400
401-450Total
I.D
AY H
AU
LS1.
No. of hauls
19613
2217
818
1116
6307
2.H
rs. of fishing181.77
13.6723.33
15.756.50
19.259.33
17.004.50
291.103.
Catch(Kg.)
14735263
67782159
6825735
33061757
25535670
4.Catch/hr. of
81.0619.23
290.53137.07
104.92297.92
354.34103.35
56.67122.54
trawling in kg.
II.N
IGH
T HA
ULS
1.N
o. of hauls75
1112
43
23
1-
1112.
Hrs. of fishing
72.5314.25
11.004.67
4.673.50
4.001.50
-116.12
3.C
atch (Kg)
47471670
608715
130150
100300
-8420
4.Catch/hr. of
65.45117.19
52.27153.10
27.8442.86
25.00200.00
-72.51
trawling in kg.
III.C
OM
BIN
ED D
AY A
ND
NIG
HT H
AU
LS1.
No. of hauls
27124
3421
1120
1417
6418
2.H
rs. of fishing254.30
27.9234.33
20.4211.17
22.7513.33
18.504.50
407.223.
Catch (K
g)19482
19337386
2874812
58853406
2057255
440904.
Catch /hr oftraw
ling in kg76.61
69.23215.15
140.7472.69
258.68255.51
111.1956.67
108.30
*All positive and negative hauls have been included.
19
4. At least on four occasions the cod-end of the net has not been properly tied by the inexperienced
deck hands (trainees).
5. Faulty manoeuvring of the vessel occurred while shooting the net or soon after.
6. A relatively larger number of negative hauls occurred in the inshore waters in the depth range 10-
74 metres. The data are being analysed to see whether some of these could be due to the effect
of hydrological factors such as a depletion in the dissolved oxygen at the bottom such as a depletion
in the dissolved oxygen at the bottom and the absence of fish in the area. It is likely that in such
places some other organisms could have been responsible for the echo traces obtained which led
to the trawl being operated.
In an exploratory survey where new grounds are being explored, such negative trends are not
unusual. In the present programme the results obtained from the successful hauls far outweigh such
shortcomings. It is these encouraging results that had led to the more intensive exploration of the deeper
waters by other vessels of the Indo-Norwegian Project mentioned earlier. A summary of the results of this
combined exploratory survey carried out under the ‘Varuna Programme’ is given in the ensuing section.
20
RESULTS OF EXPLORATORY TRAWLING FROM THE NERTIC DEEPWATERS
AND THE UPPER CONTINENTAL SLOPE BY R.V. VARUNA AND OTHER
VESSELS OPERATING IN ASSOCIATION WITH HER
Between 1966 and 1968 the Indo-Norwegian Project vessels R.V. KALAVA, M.V. TUNA,
M.V. VELAMEEN and M.V. KLAUS SUNNANA participating in the ‘Varuna Programme’ of exploratory
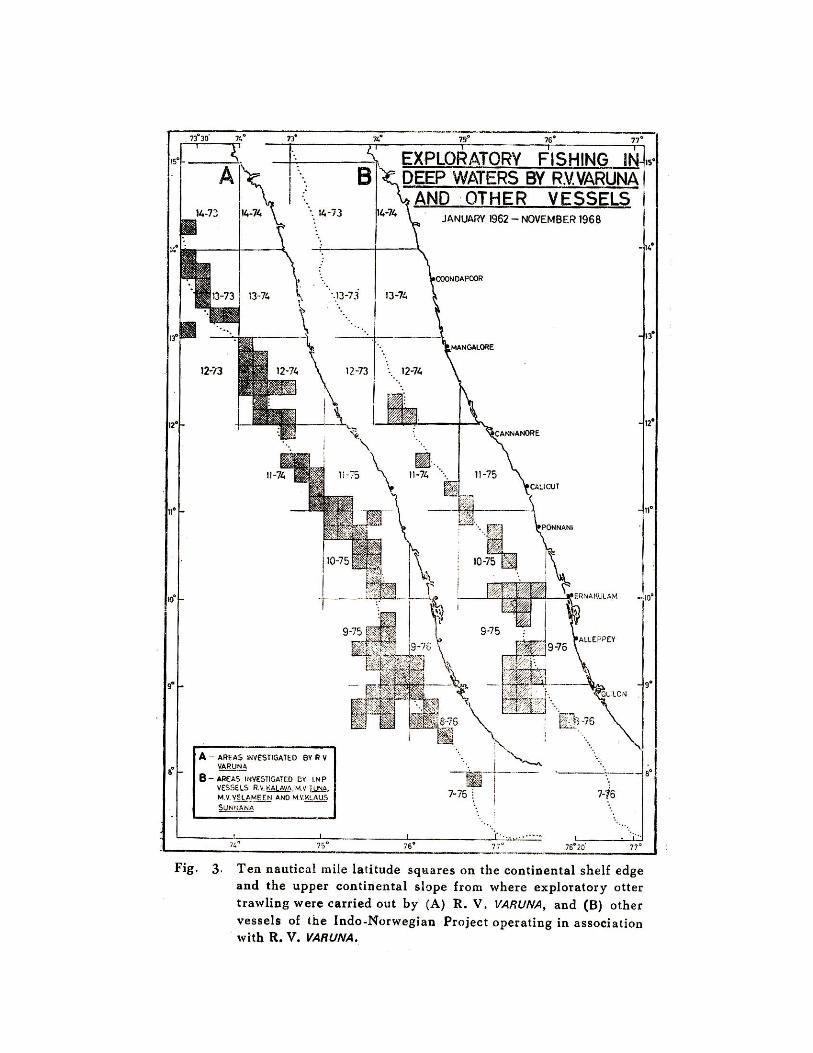
fishing made several deep-water trawling off the south- west coast. Figure 3A will show the extensive
areas marked in 10 nautical mile squares trawled by R.V. VARUNA (71 squares) and Figure 3B the areas
covered by the other vessels (30 squares). The operations from the other vessels were directed more
towards intensive fishing bordering commercial interest and the combined results have been remarkably
successful in helping to give an idea of the extent of some of the good fishing grounds on the upper
continental slope also in drawing attention to the potential resources available for commercial fishing.
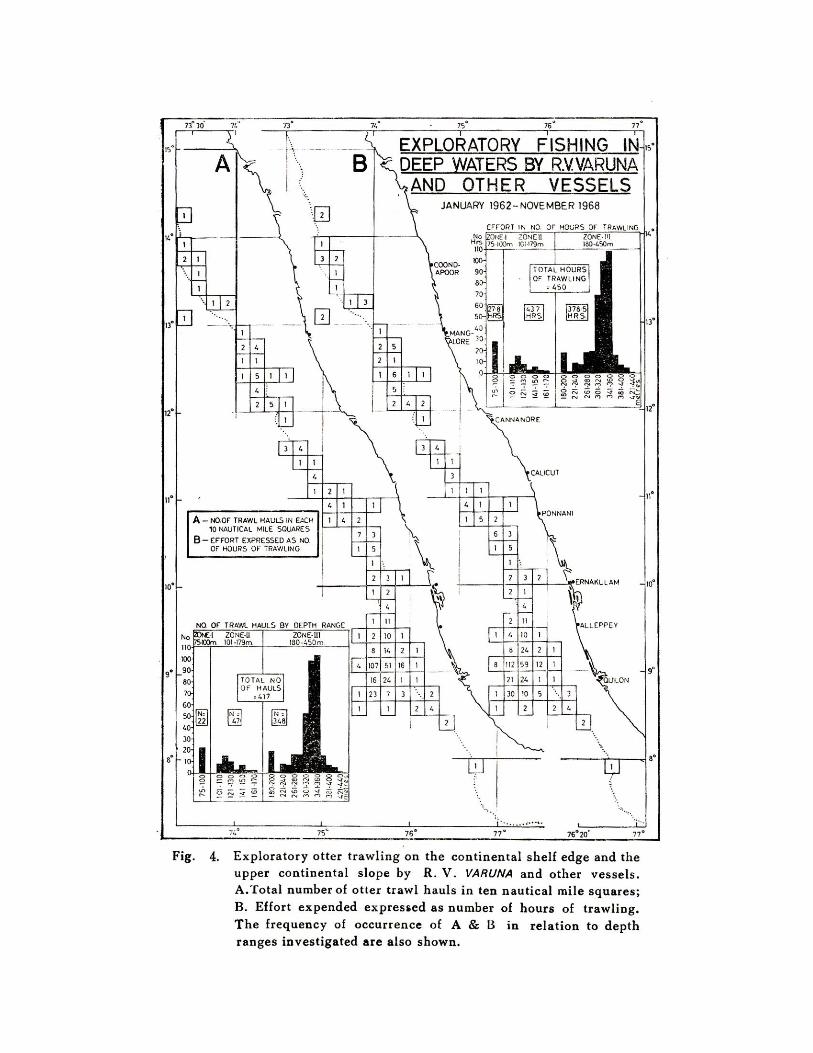
It will be seen from Figure 4, that a total 417 trawling operations have been carried out by all
vessels including R.V. VARUNA from the three depth zones of 75-100, 101-179 and 180-450 metres till
the end of November 1968. In effort, this will represent 450 hours of trawling. The number of trawl hauls
by depth range as well as effort in number of hours of trawling in the three depth zones are shown in Figure
4. It will be seen that the maximum number of hauls and consequently the maximum effort expended have
been in the depth range 301-360 metres. The effort in hours of trawling from the depth zones I-III in which
22, 47 and348 hauls were taken was 27.8, 43.7 and 378.5 hours respectively. Figure 4 also shows the
number of trawl hauls and the effort in hours for each 10 nautical mile square for the areas fished in the
three depth zones. More intensive fishing has been carried out off Quilon, wherein, in a single 10 nautical
mile square, 107 hauls have been taken representing in effort 112 hours of trawling.
The results of the combined investigations by all vessels have helped to confirm the findings
resulting from the R.V. VARUNA cruises, especially as to the presence of good trawling grounds
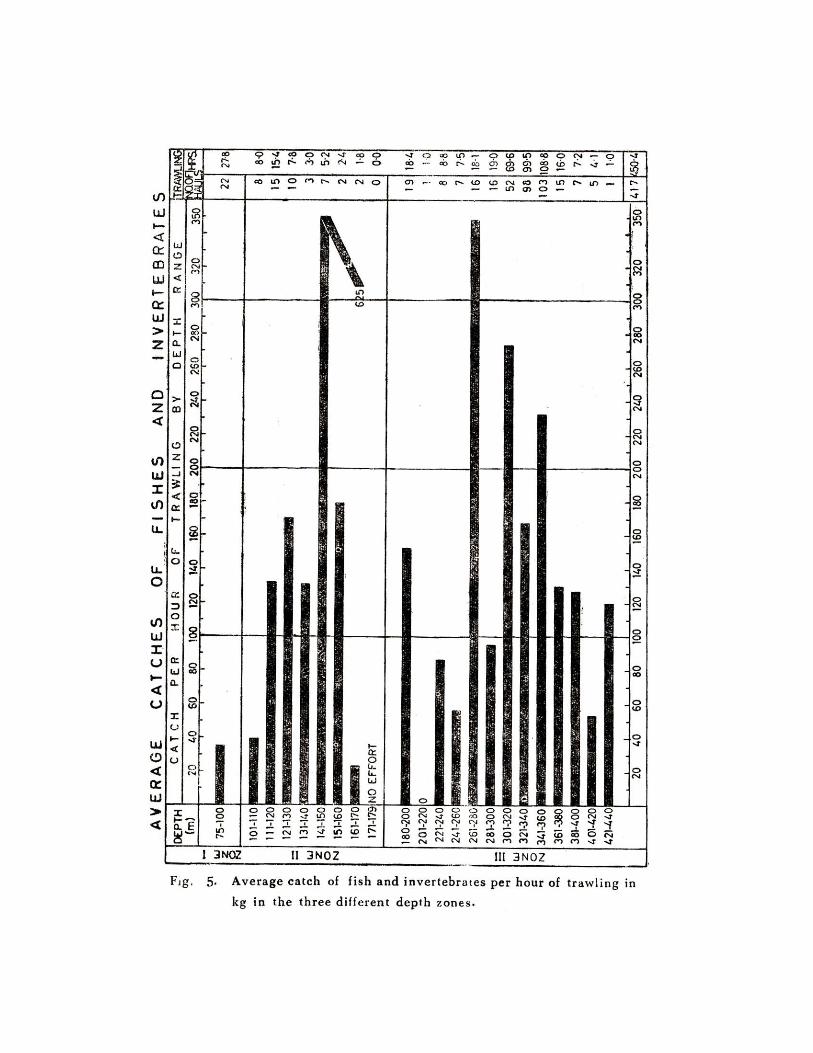
on the upper continental slope and their potential importance. In Figure 5 the average catches of
fishes and crustaceans have been shown for the different depth zones for different depth ranges. The
average catch was less than 40 kg/hr in Zone I. In Zone II it exceeded 130kg/hr in each of the
21
10-metre depth ranges between 111 and 160 metres, showing a maximum of 625 kg/hr (average) in the
depth range 141-150 metres wherein the total number of hauls and the effort expended were 7 and 5.2
respectively.
In Zone III the average catch for depth range 261 to 280 metres was about 350 kg/hr, while it was
between 220 and 280 kg/hr for the depth ranges 301-320, and 341-360 metres. It was between 120 and
170 kg/hr in the depth ranges 180-200, 321-340, 361-380, 381-400, and 421-440 metres
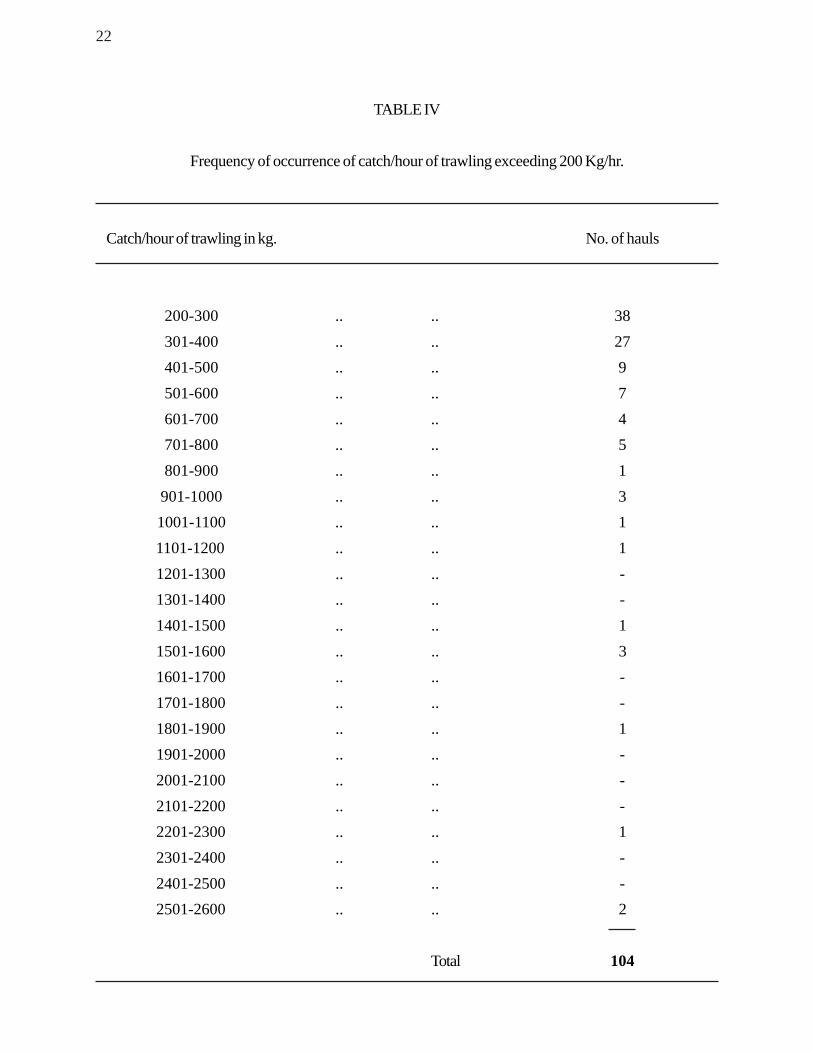
The catch data considered separately as to the frequency of occurrence of hauls with more than
200 kg/hr point to the potential richness of the grounds in Zones II and III. Of the 395 hauls from these two
zones, the catch/hour of trawling in as many as 104 hauls exceeded 200 kg/hr as shown in Table IV.
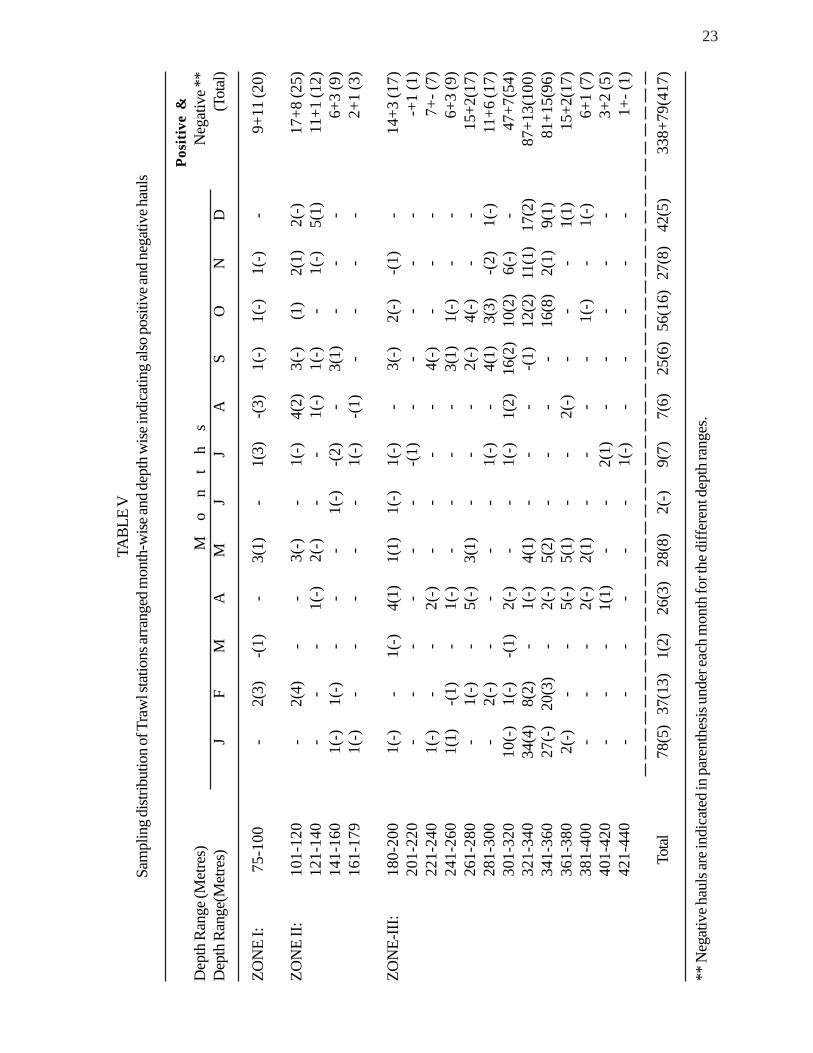
The frequency of sampling by otter trawl depth-wise as well as month-wise is given in Table V. The
total number of negative hauls for all vessels operating in the 75-450 depth range was 77 inclusive of 34 of
R.V. VARUNA. It will be clear that the negative hauls were more than the positive hauls in Depth Zone I
(11 out of 20). In Depth Zone II it was 13 out of 49 (36.1%), while in Depth Zone III it was 55 out of 348
(15.8%). The relatively lower number of negative hauls from the continental slope is noteworthy. This
combined with the catch rates expressed as kg./hr of trawling would show the richness of the grounds as
well as the feasibility of more intensive fishing on the upper continental slope.
22
TABLE IV
Frequency of occurrence of catch/hour of trawling exceeding 200 Kg/hr.
Catch/hour of trawling in kg. No. of hauls
200-300 .. .. 38301-400 .. .. 27401-500 .. .. 9501-600 .. .. 7601-700 .. .. 4701-800 .. .. 5801-900 .. .. 1901-1000 .. .. 31001-1100 .. .. 1
1101-1200 .. .. 1 1201-1300 .. .. - 1301-1400 .. .. - 1401-1500 .. .. 1 1501-1600 .. .. 3 1601-1700 .. .. - 1701-1800 .. .. - 1801-1900 .. .. 1 1901-2000 .. .. - 2001-2100 .. .. - 2101-2200 .. .. - 2201-2300 .. .. 1 2301-2400 .. .. - 2401-2500 .. .. - 2501-2600 .. .. 2
Total 104
23
TABL
E V
Sam
plin
g dist
ribut
ion o
f Tra
wl s
tatio
ns ar
rang
ed m
onth
-wise
and d
epth
wise
indi
catin
g also
posit
ive a
nd ne
gativ
e hau
ls
Posi
tive
&D
epth
Ran
ge (M
etre
s)M
on
th
sN
egat
ive *
*D
epth
Ran
ge(M
etre
s)J
FM
AM
JJ
AS
ON
D(T
otal)
ZON
E I:
75-1
00-
2(3)
-(1)
-3(
1)-
1(3)
-(3)
1(-)
1(-)
1(-)
-9+
11 (2
0)
ZON
E II:
101-
120
-2(
4)-
-3(
-)-
1(-)
4(2)
3(-)
(1)
2(1)
2(-)
17+8
(25)
121-
140
--
-1(
-)2(
-)-
-1(
-)1(
-)-
1(-)
5(1)
11+1
(12)
141-
160
1(-)
1(-)
--
-1(
-)-(
2)-
3(1)
--
-6+
3 (9
)16
1-17
91(
-)-
--
--
1(-)
-(1)
--
--
2+1
(3)
ZON
E-III
:18
0-20
01(
-)-
1(-)
4(1)
1(1)
1(-)
1(-)
-3(
-)2(
-)-(
1)-
14+3
(17)
201-
220
--
--
--
-(1)
--
--
--+
1 (1
)22
1-24
01(
-)-
-2(
-)-
--
-4(
-)-
--
7+- (
7)24
1-26
01(
1)-(
1)-
1(-)
--
--
3(1)
1(-)
--
6+3
(9)
261-
280
-1(
-)-
5(-)
3(1)
--
-2(
-)4(
-)-
-15
+2(1
7)28
1-30
0-
2(-)
--
--
1(-)
-4(
1)3(
3)-(
2)1(
-)11
+6 (1
7)30
1-32
010
(-)
1(-)
-(1)
2(-)
--
1(-)
1(2)
16(2
)10
(2)
6(-)
-47
+7(5
4)32
1-34
034
(4)
8(2)
-1(
-)4(
1)-
--
-(1)
12(2
)11
(1)
17(2
)87
+13(
100)
341-
360
27(-
)20
(3)
-2(
-)5(
2)-
--
-16
(8)
2(1)
9(1)
81+1
5(96
)36
1-38
02(
-)-
-5(
-)5(
1)-
-2(
-)-
--
1(1)
15+2
(17)
381-
400
--
-2(
-)2(
1)-
--
-1(
-)-
1(-)
6+1
(7)
401-
420
--
-1(
1)-
-2(
1)-
--
--
3+2
(5)
421-
440
--
--
--
1(-)
--
--
-1+
- (1)
Total
78(5
)37
(13)
1(2)
26(3
)28
(8)
2(-)
9(7)
7(6)
25(6
)56
(16)
27(8
)42
(5)
338+
79(4
17)
** N
egat
ive h
auls
are i
ndic
ated
in pa
rent
hesis
unde
r eac
h mon
th fo
r the
diffe
rent
dept
h ran
ges.
24
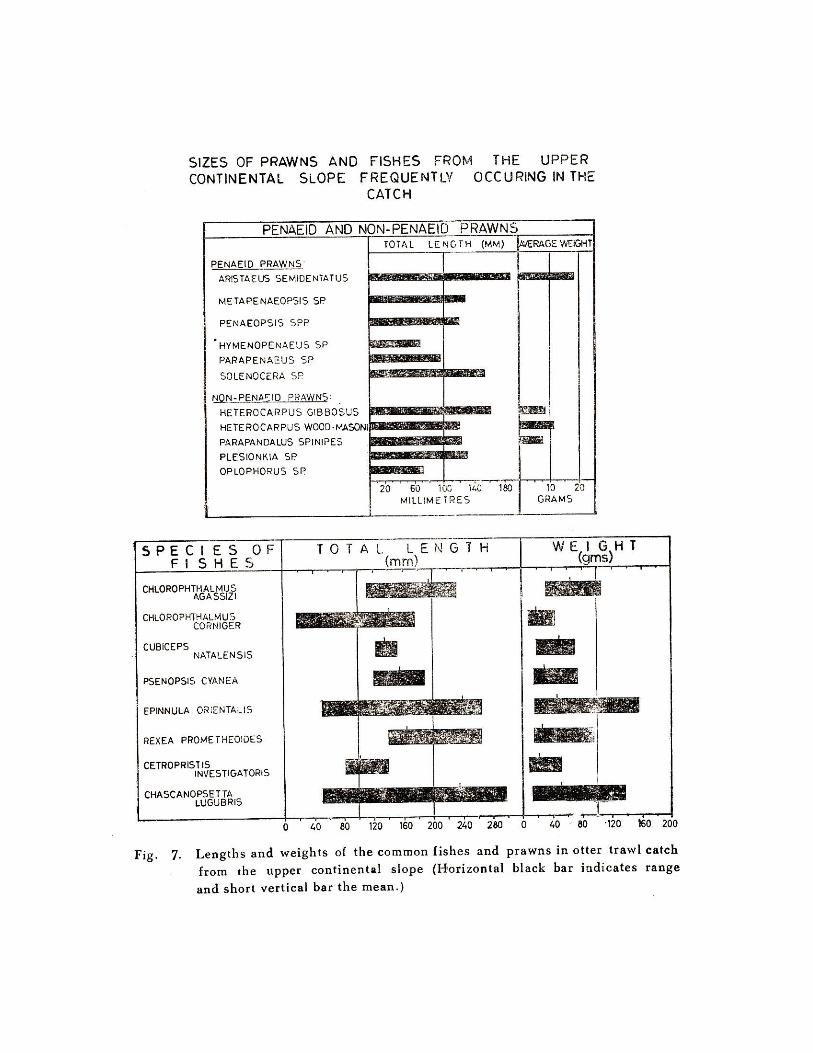
SIZES OF FISHES AND CRUSTACEANS IN TRAWL CATCH
FROM THE UPPER CONTINENTAL SLOPE
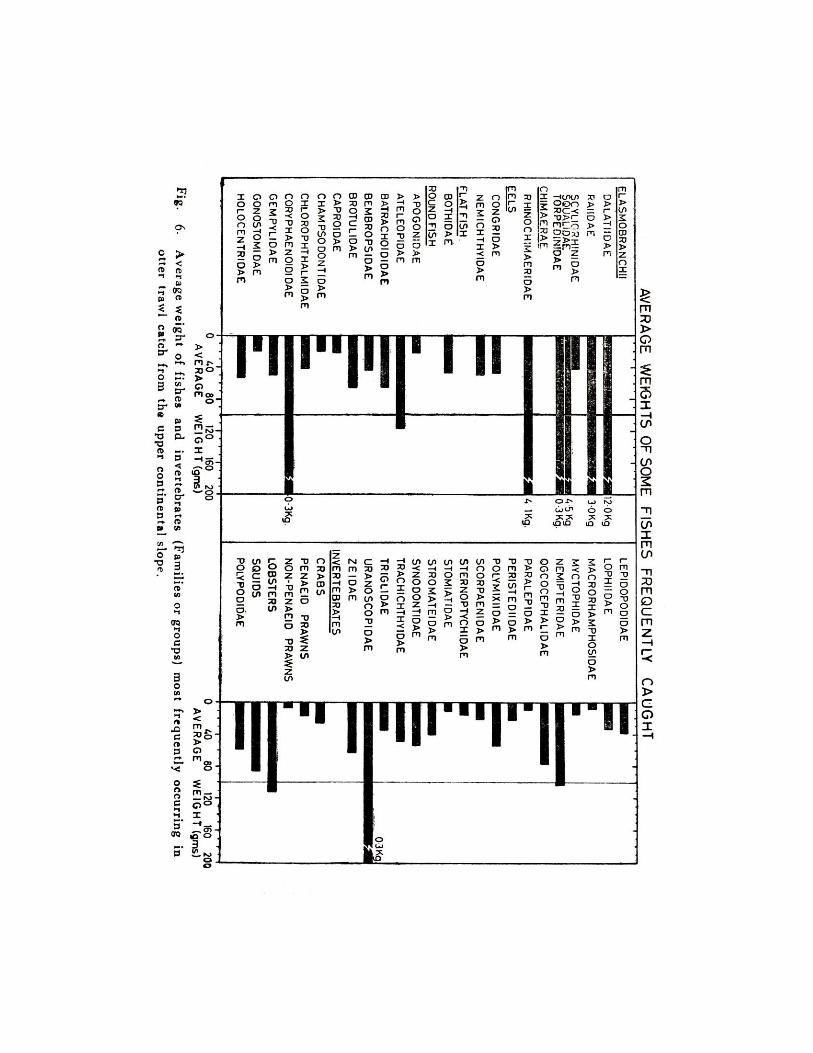
The average weight of some of the fishes frequently caught (Families of fishes) by trawling from the
shelf edge as well as the upper continental slope is shown in Figure 6. It will be seen that most of the
families are represented by species with average weights less than 100 gm. Exceptions are the deep-sea
sharks Echinorhinus brucus (Family Dalatiidae) and Atractophoris armatus (Family Squalidae); the
deep-sea rays, Raia spp. (Family Raiidae); and the Chimaeroid Neoharriotta pinnata (Family
Rhinochimaeridae), which were larger than any of the other species trawled from these depths. It is not
unlikely that a few similar large sized species could have escaped capture by avoiding the nets. However,
by and large the species of fishes and invertebrates (Prawns, lobsters, crabs, and cephalopods) caught are
relatively smaller in size and weight compared to those generally trawled in the shallower neritic waters.
With the exception of Aristeus and Heterocarpus, the sizes of most of the sepecies of prawns
as well as the species of fishes constituting the bulk of the catch from the upper continental slope shown in
Figure 7 would explain this. In the case of crustaceans, the black horizontal bar represents the average size
of the species in the catch. For the eight species of fishes, the length range in the catch represented by the
horizontal black bar, while the thin short vertical line on it represents the mean length. The maximum
weights attained by the species in grams (on basis of catch examined) as well as the mean weight are also
shown in the Figure.
On account of the small size and the relatively high moisture content of the meat of many of the fish
species trawled from the continental slope, most of the species qualify only as trash fish.
ANALYSIS OF FISH OIL AND MUSCLES OF THE LARGER SHARKS AND
CHIMAEROID FISH FROM THE UPPER CONTINENTAL SLOPE
Through the kindness of Dr. V.K. Pillai of the Central Institute of Fisheries Technology to whom
my sincere thanks are due, it was possible to have the analysis of the liver and muscles of two
species of deep-water sharks (Echinorhinus brucus and Atractophorus armatus) and
25
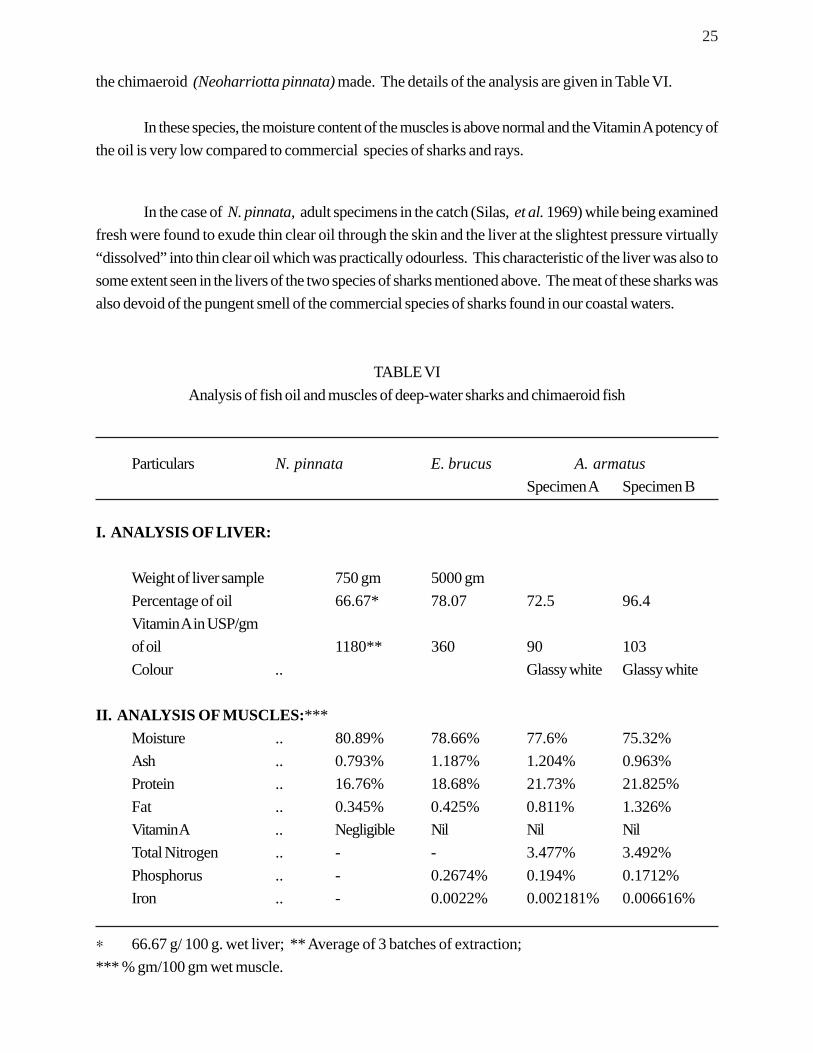
the chimaeroid (Neoharriotta pinnata) made. The details of the analysis are given in Table VI.
In these species, the moisture content of the muscles is above normal and the Vitamin A potency ofthe oil is very low compared to commercial species of sharks and rays.
In the case of N. pinnata, adult specimens in the catch (Silas, et al. 1969) while being examinedfresh were found to exude thin clear oil through the skin and the liver at the slightest pressure virtually“dissolved” into thin clear oil which was practically odourless. This characteristic of the liver was also tosome extent seen in the livers of the two species of sharks mentioned above. The meat of these sharks wasalso devoid of the pungent smell of the commercial species of sharks found in our coastal waters.
TABLE VIAnalysis of fish oil and muscles of deep-water sharks and chimaeroid fish
Particulars N. pinnata E. brucus A. armatusSpecimen A Specimen B
I. ANALYSIS OF LIVER:
Weight of liver sample 750 gm 5000 gmPercentage of oil 66.67* 78.07 72.5 96.4Vitamin A in USP/gmof oil 1180** 360 90 103Colour .. Glassy white Glassy white
II. ANALYSIS OF MUSCLES:***Moisture .. 80.89% 78.66% 77.6% 75.32%Ash .. 0.793% 1.187% 1.204% 0.963%Protein .. 16.76% 18.68% 21.73% 21.825%Fat .. 0.345% 0.425% 0.811% 1.326%Vitamin A .. Negligible Nil Nil NilTotal Nitrogen .. - - 3.477% 3.492%Phosphorus .. - 0.2674% 0.194% 0.1712%Iron .. - 0.0022% 0.002181% 0.006616%
∗ 66.67 g/ 100 g. wet liver; ** Average of 3 batches of extraction;*** % gm/100 gm wet muscle.
26
POTENTIALLY IMPORTANT INVERTERRATES
The importance of penaeid and non-penaeid prawns of the deep-waters of the continental slope
has already been stressed. The Indo-Norwegian Project has already found export market for these as
frozen product. Surplus catch is also sometimes sold locally through their Marketing Department.
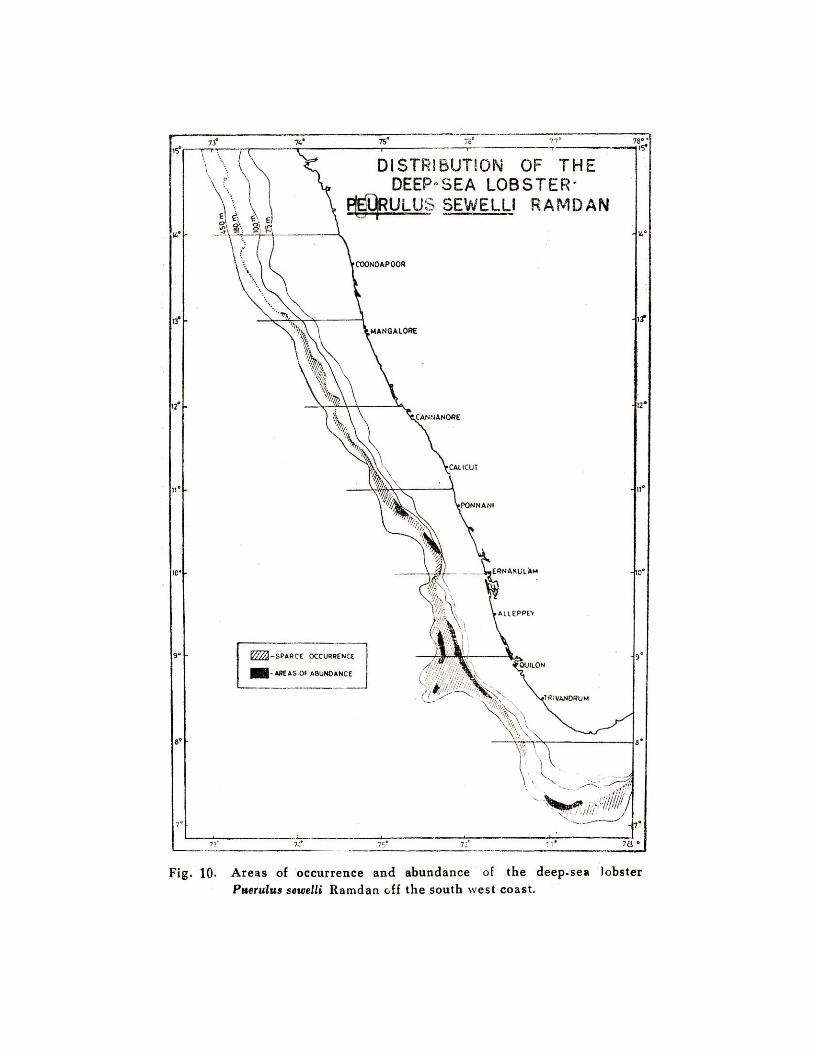
The discovery of excellent grounds for the deep sea lobster Puerulus sewelli between Quilon
and south of Alleppey earlier this year and the very high catch rates and the landing of about 150 tons of
this species at Cochin within a short time has fully justified views expressed earlier (Kurian, 1965) about its
potential importance.
Among the several species which are trawled from the deep waters at least two which deserve
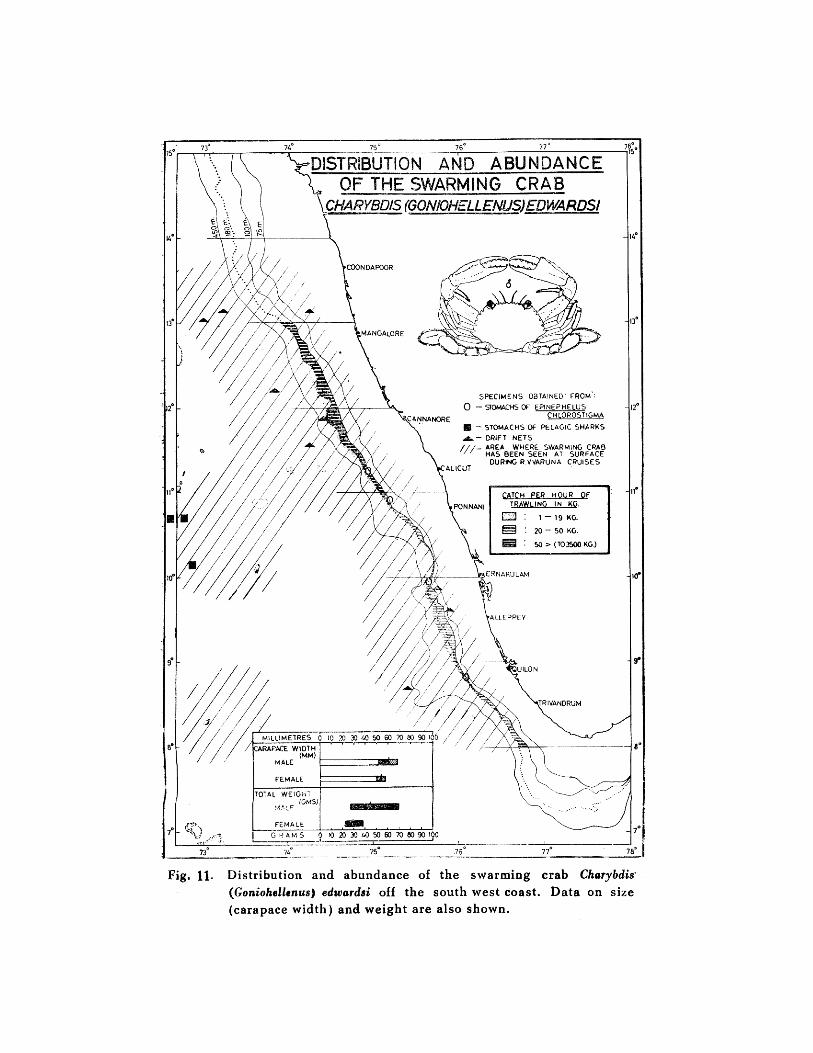
special attention are the swarming crab Charybdis (Goniohellenus) edwardsi and the gastropod Pirula
investigatoris Smith.
C. edwardsi is an ubiquitous species occurring in different situations, but at the same time found in
dense concentrations along the shelf edge, particularly in depth Zone. II. Details of the occurrence and
abundance of this species as observed during R.V. VARUNA cruises is shown in Figure 10. The largest
single haul of this species was made by R.V. VARUNA during her 71st cruise on 27-2-65’ at 11o34’ N.,
74o43’ E from 142 metres depth when over 3500 kg were caught. This species has also been observed at
night solitarily swimming at the surface or passively floating at several places off the south west coast and
the Laccadive Sea. It has also been taken in drift net where it gets caught while feeding on gilled fish (Plate
III C). On several occasions I have observed it in the stomachs of pelagic sharks and suckerfish (Echeneis
naucrates) caught in drift net, and also in the stomachs of perches (Epinephelus spp. and Pristipomoides
typus) caught by handlines. The abundance of this species as noted from trawl catch is indicated in Figure
10. The highest catch rates (50 kg/hr and more) were obtained in depth zone II between latitudes 11o N
and 130 N. Sexual segregation at least during some seasons is suspected in this species as often only males
or only females appear in the trawl catch. Males are larger than the females. The
percentage of meat weight in body weight was found to vary from 25.55 to 32.05 per cent (mean 28.5%).
In berried females with carapace width of 4.6 to 5.2 cm and weighing from 17.0 to 33.0 gm
the egg counts varied from 11363 to 29154 (mean 21956). Detailed investigations
27
on the biology of this species are being carried out. It is felt that if not as food, it could very well be usedfor the manufacture of crab meal.
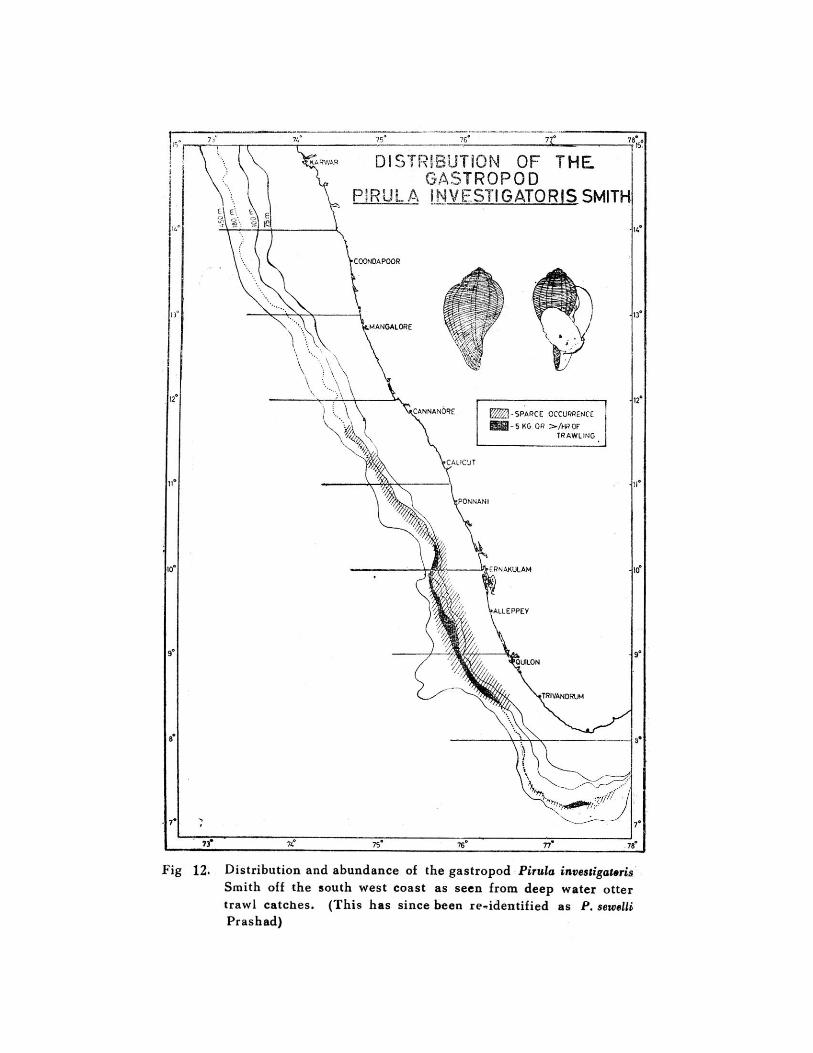
The second species of Pirula investigatoris (Figure 11 and Plate IVA) occurs in small quantitiesin most of the deep water trawl hauls from the continental edge and slope, and this or other species (Fucussp.?) have occasionally been trawled from the neritic deep waters. In view of its fairly regular occurrenceand its possible use as a source of food more information about this species will be desirable.
Among cephalopods, small quantities of the deep-sea octopod Berrya Keralensis Oommenoccurs along with catches of deep-sea prawns especially Heterocarpus and Penaeopsis from thecontinental slope. More data on this cephalopod and a few species of Sepia occurring between75-350 m are being collected in view of their possible utilization as food.
OCCURRENCE OF JELLY FISHES
During exploratory trawling from R.V. VARUNA sometimes jellyfishes constituted a real hindranceto fishing as large quantities were caught especially in depth zone III often badly clogging the trawl net,making cleaning the net a nuisance. When jellyfishes occurred in large quantities, sorting of prawns washandicapped. The largest catches of jellyfishes occurred in depth zone III between Mangalore and Quilonduring the months July-September. During this period, they were also found in depth zone II, but not inlarge quantities. Exceptionally large quantities of jellyfishes were noticed in 1964 and 1967. More informationon the species occurring, factors influencing or responsible for their periodic abundance, etc., will bedesirable.
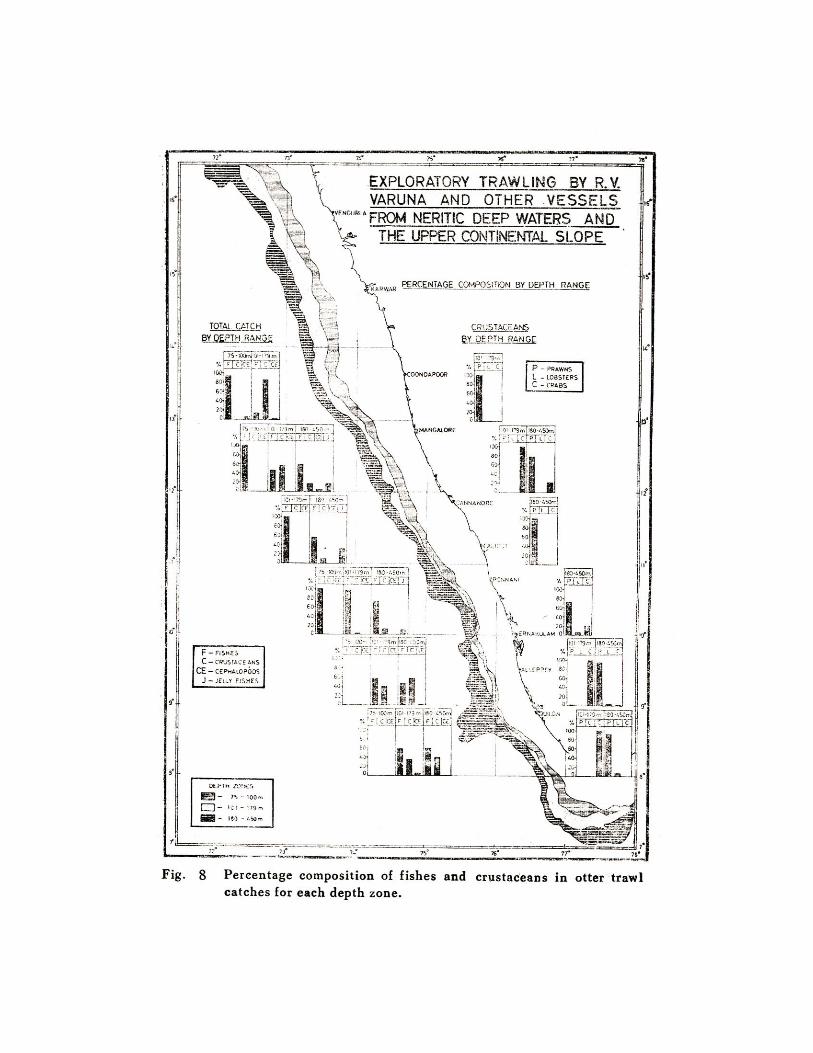
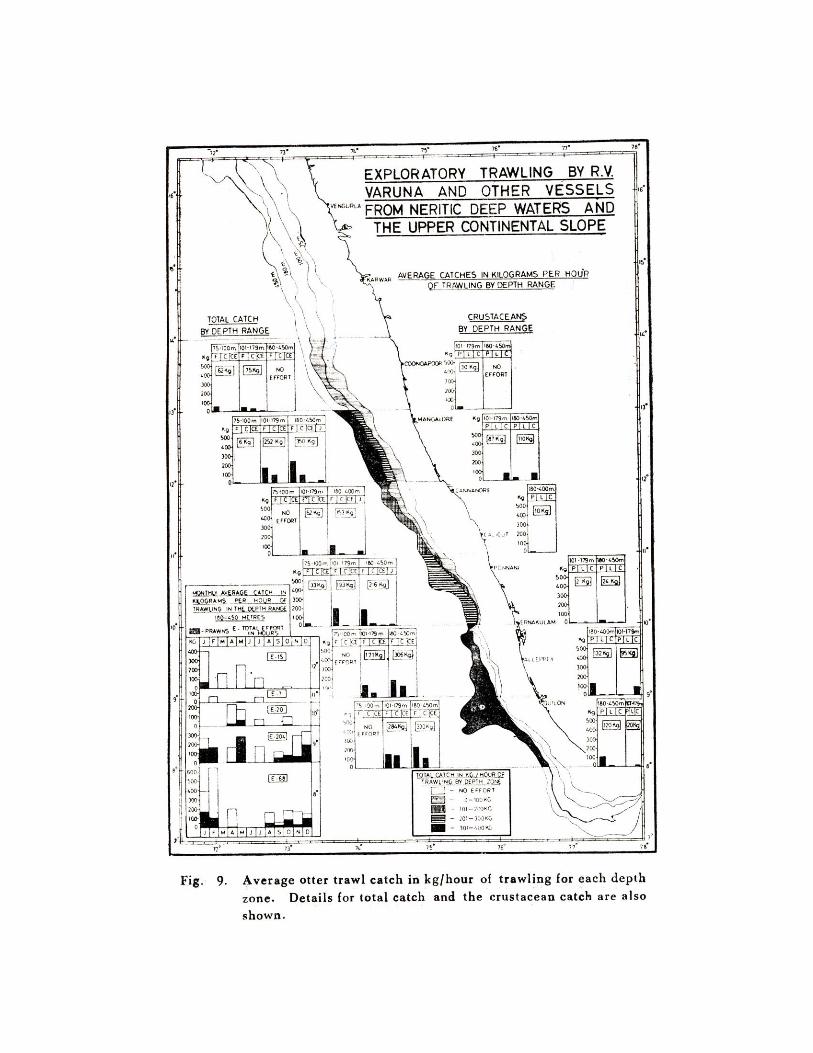
AVERAGE OTTER TRAWL CATCH IN KILOGRAMS PER HOUR OF TRAWLING
In Figure 8 the percentage composition of the fishes, crustaceans and cephalopods constituting thethree major groups in the catch has been shown for the three depth zones for each 10 latitude starting with80 N.latitude. Among crustaceans a similar breakdown is given for prawns, lobsters and crabs in the samefigure.
The average catch in kg/hr for the three depth zones is shown in Figure 9.In depth zone I (75-100 m) it is least, being less than 100 kg/hr
28
between latitudes 10o N to 11o N., and 12o N to 14o N.
In depth zone II (101-179 m), the average catch rate was 201-300 kg/hr between latitudes 12o N
and 13o N, while it was between 101-200 kg/hr between latitudes 10o N and 11o N. In the same zone, it
was less than 100 kg/hr between latitudes 11o N to 12o N, and 13o N to 14o N.
In depth zone III (180-450 m), the average catch was between 301-400 kg/hr in latitudes 8o N to
9o N, and 12o N to 13o N,. It was between 201-300 kg/hr between latitudes 10o N to 11o N and between
101-200 kg/hr between 11o N and 12o N.
At present there is no ready market for the fish caught from depth zone III, while the prawns are
processed and exported. However, these prawns are susceptiable to easy damage and relatively quick
deterioration if they are not ice-packed and stored properly in the ship’s refrigerated hold. On account of
these, some of the vessels trawling in depth zone III have dumped back into the sea the entire fish catch.
However, from R.V. VARUNA data, as well as from the skipper’s log of the other vessels it has been
possible to obtain the relevant data to enable estimation of the crustaceans in the total catch. On the upper
continental slope (depth zone III) it was 56% fishes, approximately 39% crustaceans and the rest
cephalopods, gastropods and other invertebrates.
The total effort in hours of trawling expended by all vessels in depth zone III up to the end of
November 1968 was 378.50 hrs (= 379 hrs), during which 348 trawling operations were
carried out, Of these, data are available for most of the hauls as to the quantity of
crustaceans in relation to total catch, but correct information about the proportion of prawn
catch in total catch is available for about 70% of the positive hauls. On the basis of these
data, the monthly average catch in kg/hr of trawling for the total as well as prawn catch
and the total effort expended in hours for each 10 latitudes is also shown in Figure 9. One significant
thing that emerges from this is the absence of prawns in some of the areas during some months.
There is indication that penaeid and non-penaeid prawns are found in greater concentration in some
depth ranges and this may show slight shifts with time suggesting periodic large scale bathymetric migrations
of these within the depth zone. Trawling at night on the slope has not resulted in good catches of prawns,
apparently as they may not be staying close to the bottom during night. However, much remains to be
29
known about the habits and behaviour of the deep-sea prawns and other organisms, the knowledge of
which will go a long way in the better exploitation of this new resources.
It is a well known fact that catch rates may be high in virgin grounds being commercially fished for
the first time. With my close association with the Varuna exploratory programme it may be stated that the
average catch rates obtained should be considered minimal due to several initial attempts involving trial and
error.
ESTIMATION OF POPULATION SIZE
An approximation of the standing crop for the shelf edge and the upper continental slope may be
obtained by utilizing the average exploratory catch rates, average trawling speed, average working gape of
the standard trawl and the area of the shelf considered. During the cruises of R.V. VARUNA and other
vessels, trawl nets of different sizes have been used, the three types mainly used having horizontal mouth
openings of 21.0m, 27.0 m, and28.1 m. At an average trawling speed of two knots, the area covered by
these nets during a one-hour haul would be 0.077833, 0.100071, and 0.104148 square kilometers
respectively. For the gross estimation of the population size, the mean of these (= 0.094017 sq.km) along
with the average catch per hour of trawling and estimated area of the shelf edge and the upper continental
slope to the 450 metre depth contour are considered. Assuming that the trawl captured all demersal fishes
(within the range of sizes retained) in its path to a height of about 2.5. metres above the ocean floor, the
population magnitude can be calculated by multiplying the number of 0.094017 sq.km units contained in
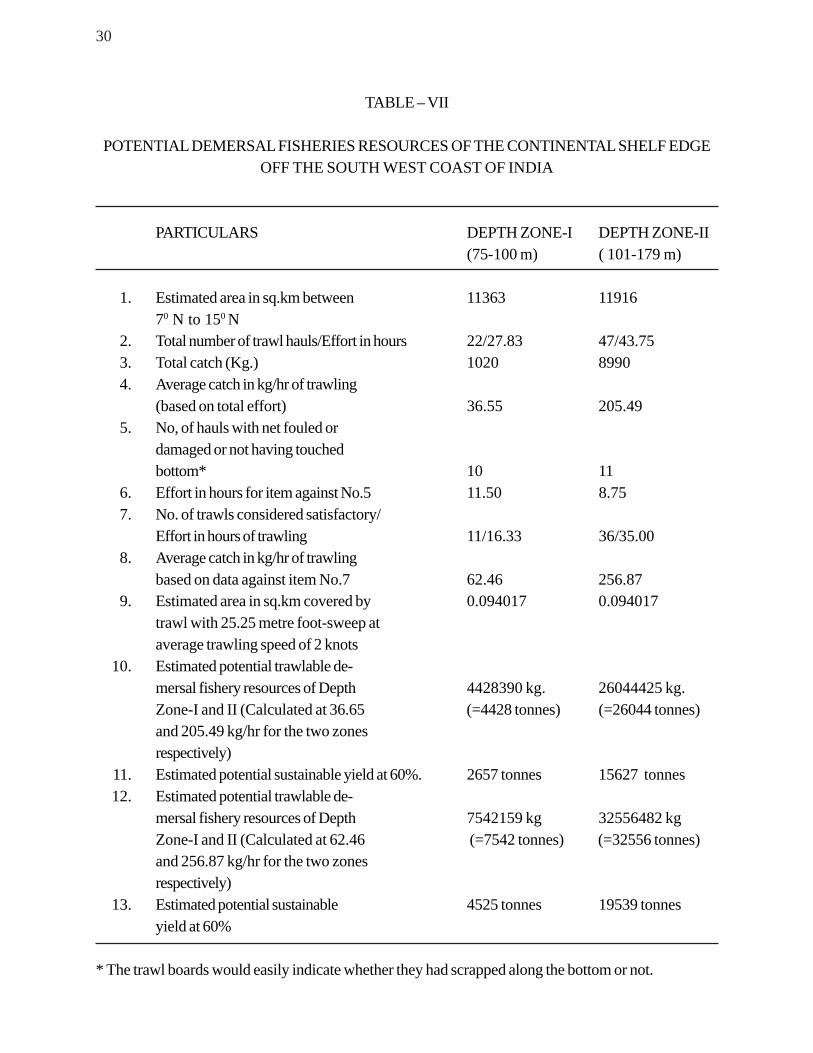
the depth zone by the yield in kg./hr of trawling. Estimates of the total standing crop ( all species combined)
as well as for crustaceans ( prawns, lobsters and crabs combined) calculated in this manner for the three
depth zones considered here are given below (Tables VII-IX).
30
TABLE – VII
POTENTIAL DEMERSAL FISHERIES RESOURCES OF THE CONTINENTAL SHELF EDGEOFF THE SOUTH WEST COAST OF INDIA
PARTICULARS DEPTH ZONE-I DEPTH ZONE-II(75-100 m) ( 101-179 m)
1. Estimated area in sq.km between 11363 1191670 N to 150 N
2. Total number of trawl hauls/Effort in hours 22/27.83 47/43.753. Total catch (Kg.) 1020 89904. Average catch in kg/hr of trawling
(based on total effort) 36.55 205.495. No, of hauls with net fouled or
damaged or not having touchedbottom* 10 11
6. Effort in hours for item against No.5 11.50 8.757. No. of trawls considered satisfactory/
Effort in hours of trawling 11/16.33 36/35.008. Average catch in kg/hr of trawling
based on data against item No.7 62.46 256.879. Estimated area in sq.km covered by 0.094017 0.094017
trawl with 25.25 metre foot-sweep ataverage trawling speed of 2 knots
10. Estimated potential trawlable de-mersal fishery resources of Depth 4428390 kg. 26044425 kg.Zone-I and II (Calculated at 36.65 (=4428 tonnes) (=26044 tonnes)and 205.49 kg/hr for the two zonesrespectively)
11. Estimated potential sustainable yield at 60%. 2657 tonnes 15627 tonnes12. Estimated potential trawlable de-
mersal fishery resources of Depth 7542159 kg 32556482 kgZone-I and II (Calculated at 62.46 (=7542 tonnes) (=32556 tonnes)and 256.87 kg/hr for the two zonesrespectively)
13. Estimated potential sustainable 4525 tonnes 19539 tonnesyield at 60%
* The trawl boards would easily indicate whether they had scrapped along the bottom or not.
31
TABLE-VIII
POTENTIAL DEMERSAL FISHERIES RESOURCE OF THE UPPER CONTINENTAL SLOPEOFF THE SOUTH WEST COAST OF INDIA
PARTICULARS DEPTH ZONE-III(180-450 m)
1. Estimated area of upper continental slope in sq.km. 20240between 70 N. and 150 N.
2. Total number of trawl hauls/Effort in hours of trawling 348/378.503. No. of hauls with net fouled or damaged/effort in hours
of trawling 34/29.504. No. of hauls considered satisfactory/Effort in 318/349.00
hours of trawling5. Total catch by all vessels from Depth-Zone III in Kg. 955056. Estimated quantity of Crustaceans (Prawns, Lobsters, 37288
and crabs) in total catch (Kg).7. Percentage of crustaceans in total catch 39.048. Average catch in kg/hr of trawling for all fish and crustaceans 273.659. Average catch in kg/hr of trawling for crustaceans 106.84
10. Estimated area in sq.km. covered by trawl with 0.09401725.25 m foot-sweep at average trawling speed of2 knots
11. Estimated potential demersal fisheries resources of thearea (at 273.65 kg/hr of trawling) 58891.142 Tonnes
12. Estimated potential sustainable yield at 60% 35334.685 “13. Estimated potential crustacean resource of the 23000.537 “
area (at 106.85 kg/hr of trawling)14. Estimated potential sustainable yield of crusta- 13800.322 “
ceans at 60%15. *Estimated demersal fishery resource (Total) at 86112.084 “
400 Kg/hr of trawling16. *Estimated potential sustainable yield at 60% 51667.250 “17. Estimated potential crustacean resource at avera-
ge catch of 200 kg/hr of trawling 43056.042 “18. *Estimated potential sustainable yield of crusta- 25833.336 “
ceans at 60%
* In commercial fishing the catch rates may be expected to be higher and as such estimates based on400 kg/hr for total catch as well as 200 kg/hr. for crustaceans are given here.
32
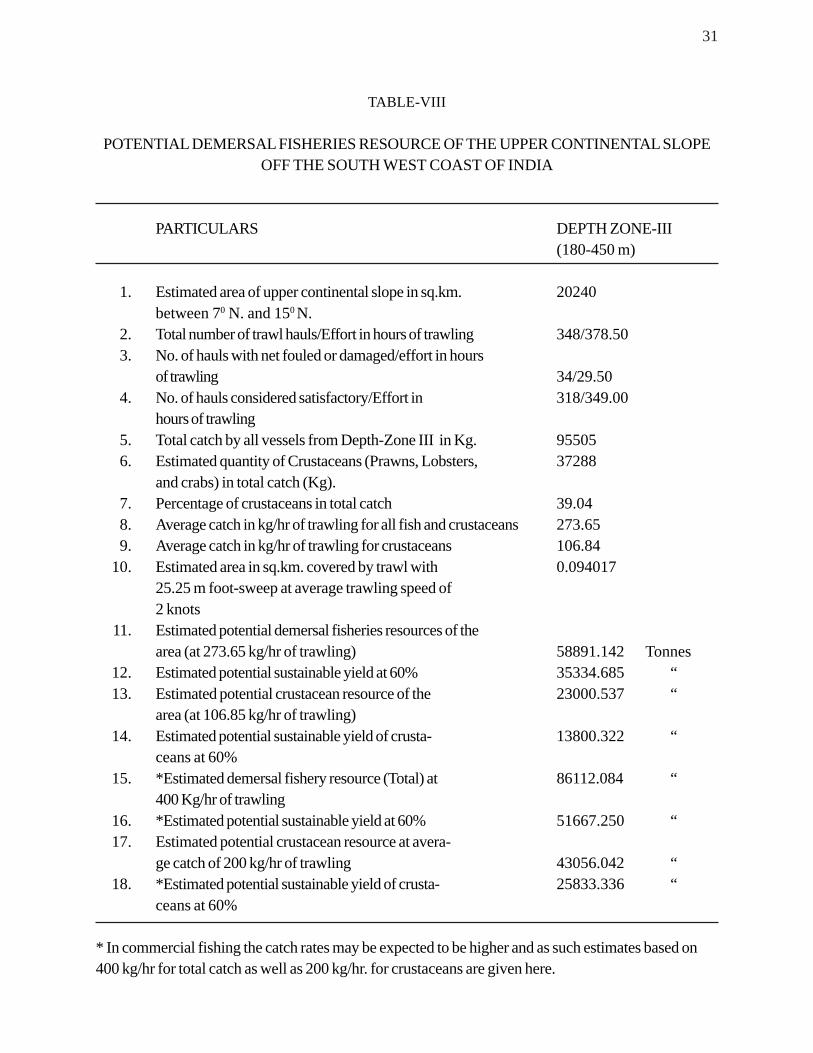
From Table VII it might appear that the trawling operations carried out in depth zone-I are few.However, as mentioned earlier, trawlable grounds are very few in this zone, especially between 80 N. and120 N. The perch fishery resource found chiefly in this depth zone, will be dealt with in a later section ofthis report.
Though in area depth zones I & II are more or less of the same extent, good trawling grounds arepresent in the latter and this is reflected in the average catch in kg/hr of trawling.
The details for the upper continental slope are given in Table-VIII.
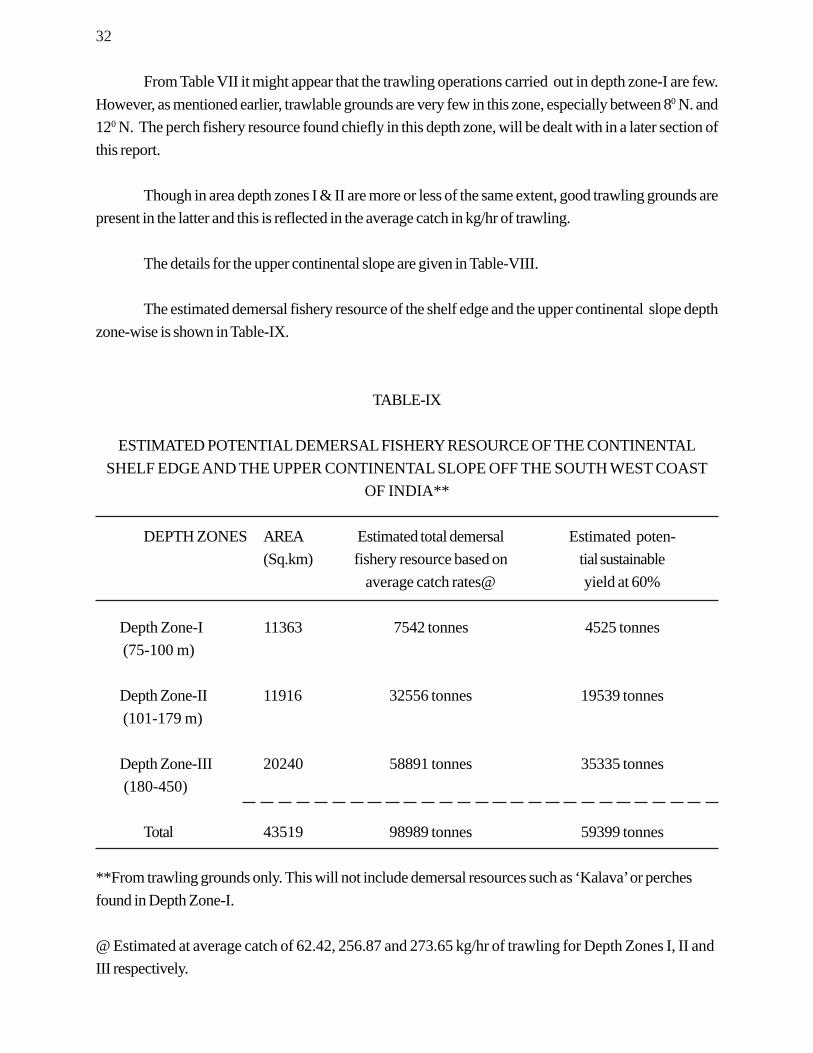
The estimated demersal fishery resource of the shelf edge and the upper continental slope depthzone-wise is shown in Table-IX.
TABLE-IX
ESTIMATED POTENTIAL DEMERSAL FISHERY RESOURCE OF THE CONTINENTALSHELF EDGE AND THE UPPER CONTINENTAL SLOPE OFF THE SOUTH WEST COAST
OF INDIA**
DEPTH ZONES AREA Estimated total demersal Estimated poten-(Sq.km) fishery resource based on tial sustainable
average catch rates@ yield at 60%
Depth Zone-I 11363 7542 tonnes 4525 tonnes (75-100 m)
Depth Zone-II 11916 32556 tonnes 19539 tonnes (101-179 m)
Depth Zone-III 20240 58891 tonnes 35335 tonnes (180-450)
Total 43519 98989 tonnes 59399 tonnes
**From trawling grounds only. This will not include demersal resources such as ‘Kalava’ or perchesfound in Depth Zone-I.
@ Estimated at average catch of 62.42, 256.87 and 273.65 kg/hr of trawling for Depth Zones I, II andIII respectively.
33
On the basis of exploratory trawl survey, for an area of approximately 43519sq.km the potential
demersal fishery resources is estimated to be around 99000 tones. Average catch rate of about 400 kg/hr
may be expected if depth zone-III is commercially fished. At this catch rate, the estimated total demersal
fishery resources for the shelf edge and the upper continental slope between 70 N and 150 N would be
around 1,26,210 tonnes and the estimated potential sustainable yield at 60% about 75,000 tonnes. Trawl-
ing for deep-sea shrimps should be possible on the continental slope even up to a depth of 800 metres. The
richness of the grounds as well as the fact that some of the constituents in the catch such as the deep sea
prawns and lobsters are exportable commodities should attract commercial trawling in these deep waters
on a large scale. The larger squaloid sharks ((Atractophorus armatus, Echinorhinus brucus) and other
fishes such as Cubiceps natalensis, Chlorophthalmus agassizi, C. corniger, Epinnula orientalis,
Pseneopsis cyanea and Chascenopsetta lugubris occurring at these great depths could be exploited
for being utilized as quality fishes. The possibilities of utilizing much of the trash fish catch from these waters
for manufacturing fish meal, fish paste or other products and Charybdis abundant along the shelf edge for
crab meal will have to be explored. It is a matter of gratification to say that this exploratory survey of the
demersal fishing grounds of the deep waters has thrown open new areas where commercial fishing could
be successful. At the same it has also given guide lines for future surveys of the deeper waters of our coasts.
34
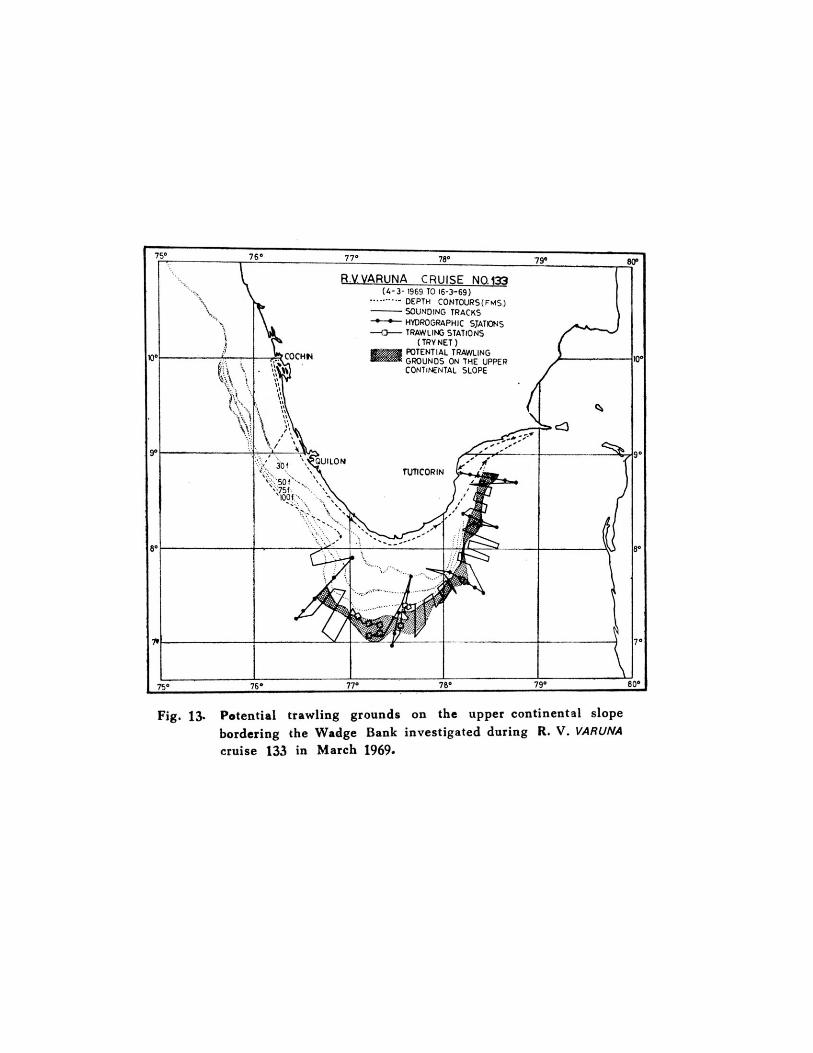
NEW FINDINGS ON TRAWLING GROUNDS ON THE CONTINENTAL SLOPEBORDERING THE WADGE BANK AND EXTENDING TO THE GULF OF MANNAR
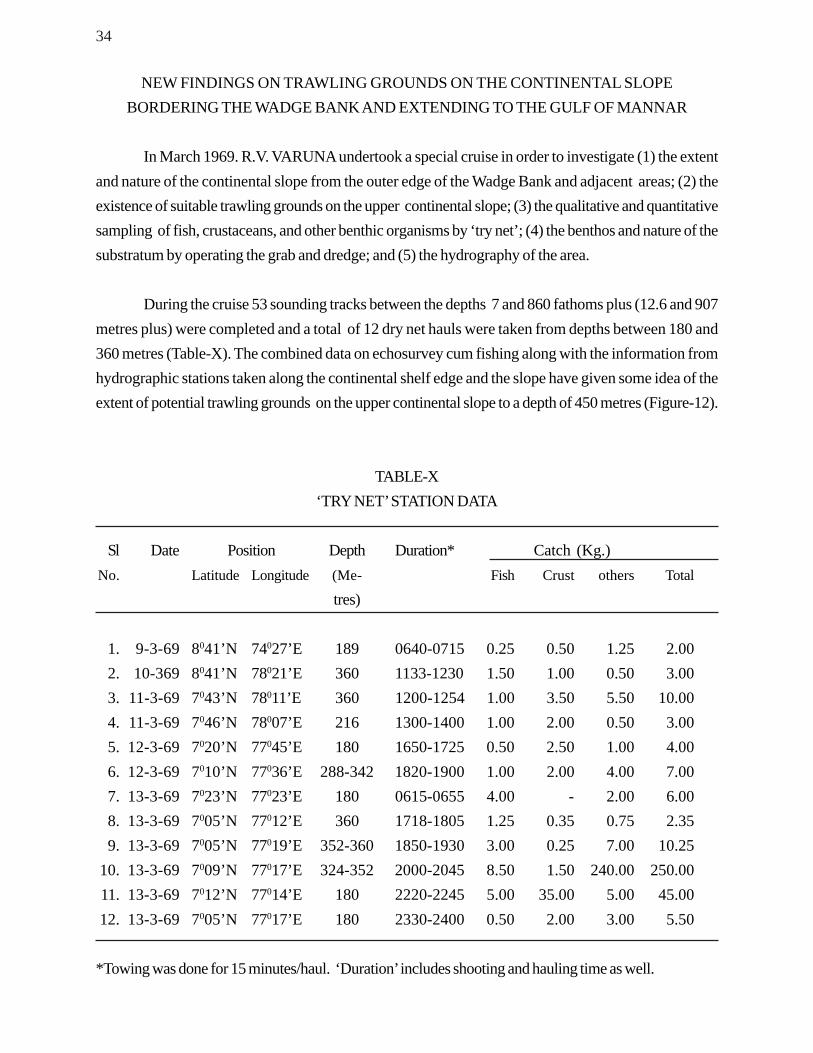
In March 1969. R.V. VARUNA undertook a special cruise in order to investigate (1) the extentand nature of the continental slope from the outer edge of the Wadge Bank and adjacent areas; (2) theexistence of suitable trawling grounds on the upper continental slope; (3) the qualitative and quantitativesampling of fish, crustaceans, and other benthic organisms by ‘try net’; (4) the benthos and nature of thesubstratum by operating the grab and dredge; and (5) the hydrography of the area.
During the cruise 53 sounding tracks between the depths 7 and 860 fathoms plus (12.6 and 907metres plus) were completed and a total of 12 dry net hauls were taken from depths between 180 and360 metres (Table-X). The combined data on echosurvey cum fishing along with the information fromhydrographic stations taken along the continental shelf edge and the slope have given some idea of theextent of potential trawling grounds on the upper continental slope to a depth of 450 metres (Figure-12).
TABLE-X‘TRY NET’ STATION DATA
Sl Date Position Depth Duration* Catch (Kg.)No. Latitude Longitude (Me- Fish Crust others Total
tres)
1. 9-3-69 8041’N 74027’E 189 0640-0715 0.25 0.50 1.25 2.002. 10-369 8041’N 78021’E 360 1133-1230 1.50 1.00 0.50 3.003. 11-3-69 7043’N 78011’E 360 1200-1254 1.00 3.50 5.50 10.004. 11-3-69 7046’N 78007’E 216 1300-1400 1.00 2.00 0.50 3.005. 12-3-69 7020’N 77045’E 180 1650-1725 0.50 2.50 1.00 4.006. 12-3-69 7010’N 77036’E 288-342 1820-1900 1.00 2.00 4.00 7.007. 13-3-69 7023’N 77023’E 180 0615-0655 4.00 - 2.00 6.008. 13-3-69 7005’N 77012’E 360 1718-1805 1.25 0.35 0.75 2.359. 13-3-69 7005’N 77019’E 352-360 1850-1930 3.00 0.25 7.00 10.25
10. 13-3-69 7009’N 77017’E 324-352 2000-2045 8.50 1.50 240.00 250.0011. 13-3-69 7012’N 77014’E 180 2220-2245 5.00 35.00 5.00 45.0012. 13-3-69 7005’N 77017’E 180 2330-2400 0.50 2.00 3.00 5.50
*Towing was done for 15 minutes/haul. ‘Duration’ includes shooting and hauling time as well.
35
The continental slope is widest along the south and south eastern edge of the Wadge Bank where
the slope is gentle and the distance between the 180 m and 450 m contour lines is as much as 10 nautical
miles. On the eastern side of the Wadge Bank and in the Gulf of Mannar, the slope is precipitous beyond
about 500 m, and in the 180 to 450 m depth range the bottom topography undulates.
The faunal element of the upper continental slope shows very great similarities to the earlier explored
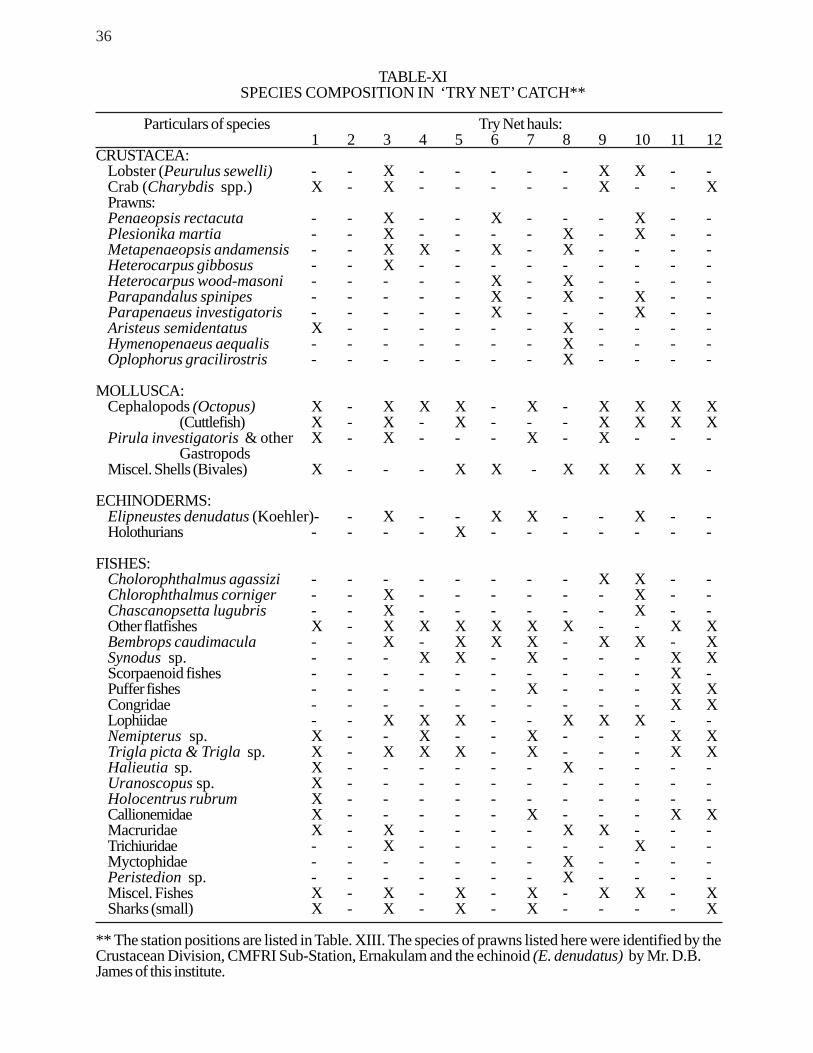
areas between 8oN and 15oN latitudes. The catch composition given in Table XI would explain this better.
However, one noteworthy feature, not observed in the ‘Quilon Bank’ was the occurrence of the deep sea
echinoid Elipneustes denudatus (Keehler) (Plate IV) in relatively large number in depths between 288
and 360 metres. In the specimens collected in March the gonads were not fully m
ature, but possibilities of utilizing fully developed ovaries of this species for the manufacture of ‘fish paste’
should be explored. On account of the apparent abundance of this species and its possible utility, this may
be considered a potentially important species which needs to be investigated further.
36
TABLE-XISPECIES COMPOSITION IN ‘TRY NET’ CATCH**
Particulars of species Try Net hauls:1 2 3 4 5 6 7 8 9 10 11 12
CRUSTACEA:Lobster (Peurulus sewelli) - - X - - - - - X X - -Crab (Charybdis spp.) X - X - - - - - X - - XPrawns:Penaeopsis rectacuta - - X - - X - - - X - -Plesionika martia - - X - - - - X - X - -Metapenaeopsis andamensis - - X X - X - X - - - -Heterocarpus gibbosus - - X - - - - - - - - -Heterocarpus wood-masoni - - - - - X - X - - - -Parapandalus spinipes - - - - - X - X - X - -Parapenaeus investigatoris - - - - - X - - - X - -Aristeus semidentatus X - - - - - - X - - - -Hymenopenaeus aequalis - - - - - - - X - - - -Oplophorus gracilirostris - - - - - - - X - - - -
MOLLUSCA:Cephalopods (Octopus) X - X X X - X - X X X X
(Cuttlefish) X - X - X - - - X X X XPirula investigatoris & other X - X - - - X - X - - -
GastropodsMiscel. Shells (Bivales) X - - - X X - X X X X -
ECHINODERMS:Elipneustes denudatus (Koehler)- - X - - X X - - X - -Holothurians - - - - X - - - - - - -
FISHES:Cholorophthalmus agassizi - - - - - - - - X X - -Chlorophthalmus corniger - - X - - - - - - X - -Chascanopsetta lugubris - - X - - - - - - X - -Other flatfishes X - X X X X X X - - X XBembrops caudimacula - - X - X X X - X X - XSynodus sp. - - - X X - X - - - X XScorpaenoid fishes - - - - - - - - - - X -Puffer fishes - - - - - - X - - - X XCongridae - - - - - - - - - - X XLophiidae - - X X X - - X X X - -Nemipterus sp. X - - X - - X - - - X XTrigla picta & Trigla sp. X - X X X - X - - - X XHalieutia sp. X - - - - - - X - - - -Uranoscopus sp. X - - - - - - - - - - -Holocentrus rubrum X - - - - - - - - - - -Callionemidae X - - - - - X - - - X XMacruridae X - X - - - - X X - - -Trichiuridae - - X - - - - - - X - -Myctophidae - - - - - - - X - - - -Peristedion sp. - - - - - - - X - - - -Miscel. Fishes X - X - X - X - X X - XSharks (small) X - X - X - X - - - - X
** The station positions are listed in Table. XIII. The species of prawns listed here were identified by theCrustacean Division, CMFRI Sub-Station, Ernakulam and the echinoid (E. denudatus) by Mr. D.B.James of this institute.

37
SOME HYDROLOGICAL FEATURES OF THE SHELF EDGE AND THE UPPER
CONTINENTAL SLOPE
The hydrographic data pertaining to the region along the south west coast of India between 75 and
500 metres depth from off Cape Comorin northwards to Karwar collected during the research cruises of
R.V. VARUNA, R.V. KALAVA and other vessels have been analysed for hydrographic parameters such
as temperature, salinity, dissolved oxygen and density (Sigma-T). The data has also been averaged out
month-wise for 10 latitude square pertaining to this investigational area. Surface and bottom temperatures
and samples for salinity and oxygen determinations were specially taken at some of the trawl stations on
the shelf edge and continental slope. Detailed comparison of the catch data with environmental data will be
published elsewhere (Silas, Rao and Ramamirtham, 1969).
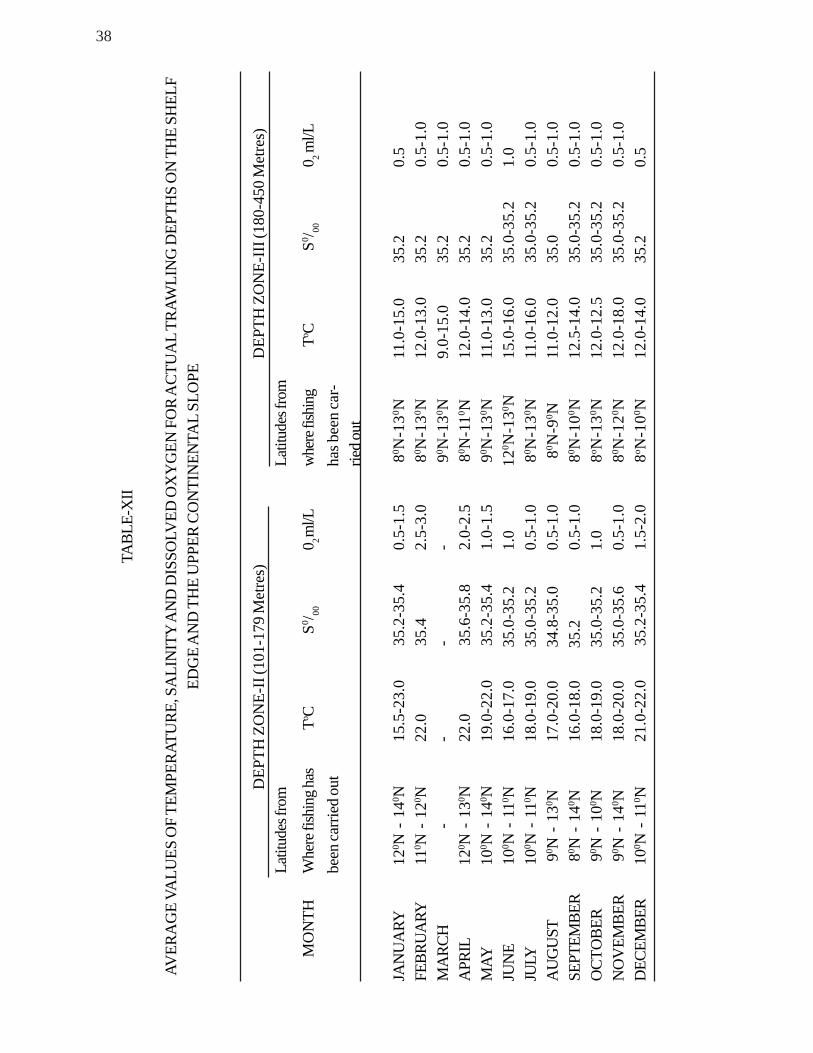
In Table XII data for three parameters, namely temperature, salinity and dissolved oxygen are
presented just to given an idea of the average conditions that may be expected in each of these depth zones
from depths which have been actually fished (the range given not being for the complete depth range of
each depth zone). For instance, if trawling had been done during the month of January in depth zone II
from 160 m at 120 N and from 110m at 140 N, the temperature range shown as 15.50C to 23.00C refers
to average values at the respective depths of fishing and not the average maximum and minimum values at
100m-179 m. As such, these figures will not give finer details, but only a gross picture of some of the
conditions which have obtained where trawling has been carried out.
This, in depth zone II the average temperature values in the depth fished may vary between 150C
and 230C decreasing with depth. The salinity differs very little, the range being 34.8 to 35.80/00. Oxygen
levels show some difference, being lowest during the months July August, September and November
(.5ml/L or slightly less) and highest during February/April (2.0 to 3.0 ml/L), the depths fished being repeated
during some of the months.
In depth zone III the difference in the average temperature which decrease with depths is between
90C and 180C for the fishing depths. Salinity showed hardly any variation being 35.0 to 35.20/00. Similarly
oxygen levels (average values) were also uniformly low being about 0.5 to 1.0 ml/L.
38
TABL
E-X
II
AVER
AG
E VA
LUES
OF
TEM
PERA
TURE
, SA
LIN
ITY
AN
D D
ISSO
LVED
OX
YG
EN F
OR
ACT
UA
L TR
AWLI
NG
DEP
THS
ON
TH
E SH
ELF
EDG
E A
ND
TH
E U
PPER
CO
NTI
NEN
TAL
SLO
PE
DEP
TH Z
ON
E-II
(101
-179
Met
res)
DEP
TH Z
ON
E-II
I (18
0-45
0 M
etre
s)La
titud
es fr
omLa
titud
es fr
om
MO
NTH
Whe
re fi
shin
g has
To CS0 / 00
0 2 ml/L
whe
re fi
shin
gTo C
S0 / 000 2 m
l/Lbe
en ca
rried
out
has b
een
car-
ried o
ut
JAN
UA
RY12
0 N -
140 N
15.5
-23.
035
.2-3
5.4
0.5-
1.5
80 N-1
30 N11
.0-1
5.0
35.2
0.5
FEBR
UA
RY11
0 N -
120 N
22.0
35.4
2.5-
3.0
80 N-1
30 N12
.0-1
3.0
35.2
0.5-
1.0
MA
RCH
--
--
90 N-1
30 N9.
0-15
.035
.20.
5-1.
0A
PRIL
120 N
- 13
0 N22
.035
.6-3
5.8
2.0-
2.5
80 N-1
10 N12
.0-1
4.0
35.2
0.5-
1.0
MAY
100 N
- 14
0 N19
.0-2
2.0
35.2
-35.
41.
0-1.
590 N
-130 N
11.0
-13.
035
.20.
5-1.
0JU
NE
100 N
- 11
0 N16
.0-1
7.0
35.
0-35
.21.
012
0 N-1
30 N15
.0-1
6.0
35.0
-35.
21.
0JU
LY10
0 N -
110 N
18.0
-19.
0
3
5.0-
35.2
0.5-
1.0
80 N-1
30 N11
.0-1
6.0
35.0
-35.
20.
5-1.
0A
UG
UST
90 N -
130 N
17.0
-20.
0
3
4.8-
35.0
0.5-
1.0
80 N-9
0 N11
.0-1
2.0
35.0
0.5-
1.0
SEPT
EMBE
R80 N
- 14
0 N16
.0-1
8.0
35.
20.
5-1.
080 N
-100 N
12.5
-14.
035
.0-3
5.2
0.5-
1.0
OCT
OBE
R90 N
- 10
0 N18
.0-1
9.0
35.
0-35
.21.
08o N
-130 N
12.0
-12.
535
.0-3
5.2
0.5-
1.0
NO
VEM
BER
90 N -
140 N
18.0
-20.
0
3
5.0-
35.6
0.5-
1.0
80 N-1
20 N12
.0-1
8.0
35.0
-35.
20.
5-1.
0D
ECEM
BER
100 N
- 11
0 N21
.0-2
2.0
35.2
-35.
41.
5-2.
08o N
-100 N
12.0
-14.
035
.20.
5
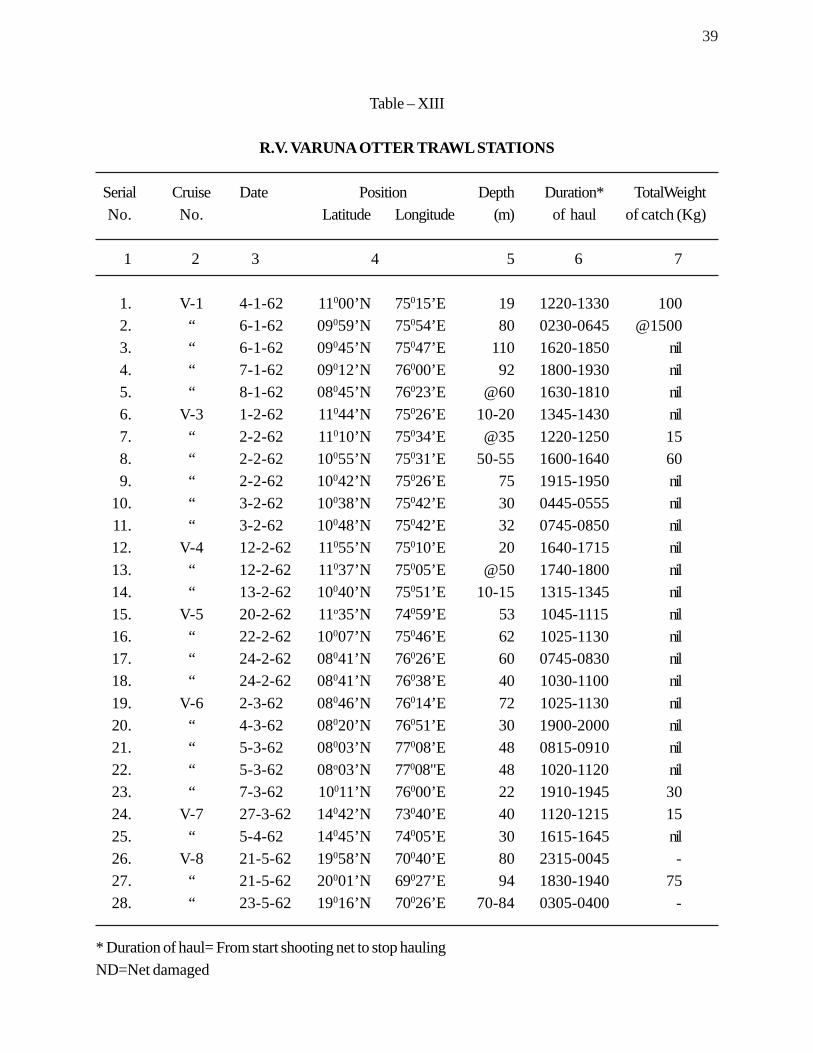
39
Table – XIII
R.V. VARUNA OTTER TRAWL STATIONS
Serial Cruise Date Position Depth Duration* TotalWeightNo. No. Latitude Longitude (m) of haul of catch (Kg)
1 2 3 4 5 6 7
1. V-1 4-1-62 11000’N 75015’E 19 1220-1330 1002. “ 6-1-62 09059’N 75054’E 80 0230-0645 @15003. “ 6-1-62 09045’N 75047’E 110 1620-1850 nil4. “ 7-1-62 09012’N 76000’E 92 1800-1930 nil5. “ 8-1-62 08045’N 76023’E @60 1630-1810 nil6. V-3 1-2-62 11044’N 75026’E 10-20 1345-1430 nil7. “ 2-2-62 11010’N 75034’E @35 1220-1250 158. “ 2-2-62 10055’N 75031’E 50-55 1600-1640 609. “ 2-2-62 10042’N 75026’E 75 1915-1950 nil
10. “ 3-2-62 10038’N 75042’E 30 0445-0555 nil11. “ 3-2-62 10048’N 75042’E 32 0745-0850 nil12. V-4 12-2-62 11055’N 75010’E 20 1640-1715 nil13. “ 12-2-62 11037’N 75005’E @50 1740-1800 nil14. “ 13-2-62 10040’N 75051’E 10-15 1315-1345 nil15. V-5 20-2-62 11o35’N 74059’E 53 1045-1115 nil16. “ 22-2-62 10007’N 75046’E 62 1025-1130 nil17. “ 24-2-62 08041’N 76026’E 60 0745-0830 nil18. “ 24-2-62 08041’N 76038’E 40 1030-1100 nil19. V-6 2-3-62 08046’N 76014’E 72 1025-1130 nil20. “ 4-3-62 08020’N 76051’E 30 1900-2000 nil21. “ 5-3-62 08003’N 77008’E 48 0815-0910 nil22. “ 5-3-62 08o03’N 77008"E 48 1020-1120 nil23. “ 7-3-62 10011’N 76000’E 22 1910-1945 3024. V-7 27-3-62 14042’N 73040’E 40 1120-1215 1525. “ 5-4-62 14045’N 74005’E 30 1615-1645 nil26. V-8 21-5-62 19058’N 70040’E 80 2315-0045 -27. “ 21-5-62 20001’N 69027’E 94 1830-1940 7528. “ 23-5-62 19016’N 70026’E 70-84 0305-0400 -
* Duration of haul= From start shooting net to stop haulingND=Net damaged
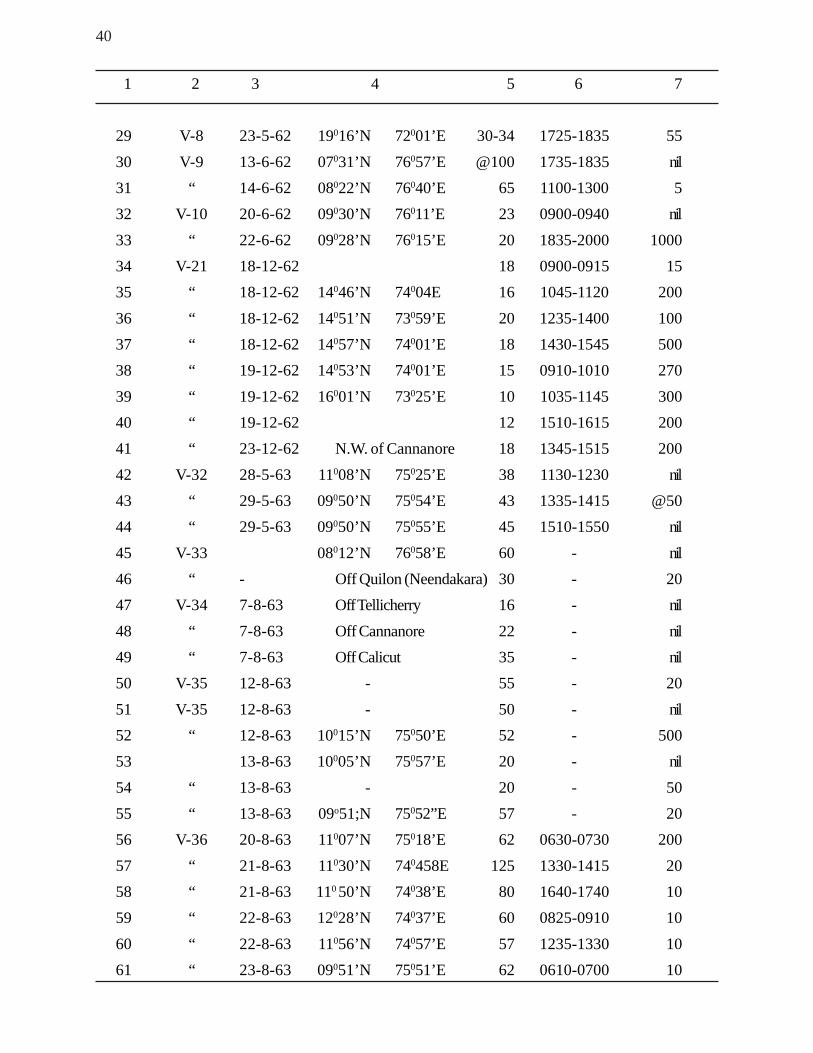
40
1 2 3 4 5 6 7
29 V-8 23-5-62 19016’N 72001’E 30-34 1725-1835 5530 V-9 13-6-62 07031’N 76057’E @100 1735-1835 nil31 “ 14-6-62 08022’N 76040’E 65 1100-1300 532 V-10 20-6-62 09030’N 76011’E 23 0900-0940 nil33 “ 22-6-62 09028’N 76015’E 20 1835-2000 100034 V-21 18-12-62 18 0900-0915 1535 “ 18-12-62 14046’N 74004E 16 1045-1120 20036 “ 18-12-62 14051’N 73059’E 20 1235-1400 10037 “ 18-12-62 14057’N 74001’E 18 1430-1545 50038 “ 19-12-62 14053’N 74001’E 15 0910-1010 27039 “ 19-12-62 16001’N 73025’E 10 1035-1145 30040 “ 19-12-62 12 1510-1615 20041 “ 23-12-62 N.W. of Cannanore 18 1345-1515 20042 V-32 28-5-63 11008’N 75025’E 38 1130-1230 nil43 “ 29-5-63 09050’N 75054’E 43 1335-1415 @5044 “ 29-5-63 09050’N 75055’E 45 1510-1550 nil45 V-33 08012’N 76058’E 60 - nil46 “ - Off Quilon (Neendakara) 30 - 2047 V-34 7-8-63 Off Tellicherry 16 - nil48 “ 7-8-63 Off Cannanore 22 - nil49 “ 7-8-63 Off Calicut 35 - nil50 V-35 12-8-63 - 55 - 2051 V-35 12-8-63 - 50 - nil52 “ 12-8-63 10015’N 75050’E 52 - 50053 13-8-63 10005’N 75057’E 20 - nil
54 “ 13-8-63 - 20 - 5055 “ 13-8-63 09o51;N 75052”E 57 - 2056 V-36 20-8-63 11007’N 75018’E 62 0630-0730 20057 “ 21-8-63 11030’N 740458E 125 1330-1415 2058 “ 21-8-63 110 50’N 74038’E 80 1640-1740 1059 “ 22-8-63 12028’N 74037’E 60 0825-0910 1060 “ 22-8-63 11056’N 74057’E 57 1235-1330 1061 “ 23-8-63 09051’N 75051’E 62 0610-0700 10
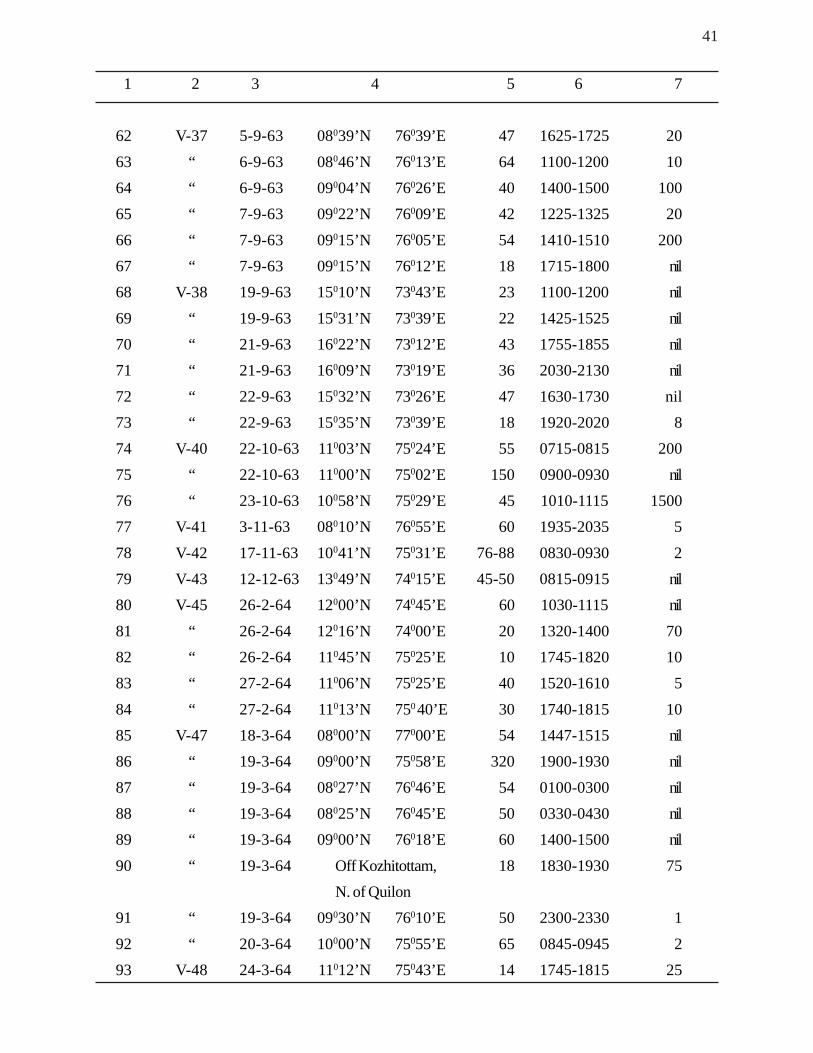
41
1 2 3 4 5 6 7
62 V-37 5-9-63 08039’N 76039’E 47 1625-1725 2063 “ 6-9-63 08046’N 76013’E 64 1100-1200 1064 “ 6-9-63 09004’N 76026’E 40 1400-1500 10065 “ 7-9-63 09022’N 76009’E 42 1225-1325 2066 “ 7-9-63 09015’N 76005’E 54 1410-1510 20067 “ 7-9-63 09015’N 76012’E 18 1715-1800 nil68 V-38 19-9-63 15010’N 73043’E 23 1100-1200 nil69 “ 19-9-63 15031’N 73039’E 22 1425-1525 nil70 “ 21-9-63 16022’N 73012’E 43 1755-1855 nil71 “ 21-9-63 16009’N 73019’E 36 2030-2130 nil72 “ 22-9-63 15032’N 73026’E 47 1630-1730 nil73 “ 22-9-63 15035’N 73039’E 18 1920-2020 874 V-40 22-10-63 11003’N 75024’E 55 0715-0815 20075 “ 22-10-63 11000’N 75002’E 150 0900-0930 nil76 “ 23-10-63 10058’N 75029’E 45 1010-1115 150077 V-41 3-11-63 08010’N 76055’E 60 1935-2035 578 V-42 17-11-63 10041’N 75031’E 76-88 0830-0930 279 V-43 12-12-63 13049’N 74015’E 45-50 0815-0915 nil80 V-45 26-2-64 12000’N 74045’E 60 1030-1115 nil81 “ 26-2-64 12016’N 74000’E 20 1320-1400 7082 “ 26-2-64 11045’N 75025’E 10 1745-1820 1083 “ 27-2-64 11006’N 75025’E 40 1520-1610 584 “ 27-2-64 11013’N 750 40’E 30 1740-1815 1085 V-47 18-3-64 08000’N 77000’E 54 1447-1515 nil86 “ 19-3-64 09000’N 75058’E 320 1900-1930 nil
87 “ 19-3-64 08027’N 76046’E 54 0100-0300 nil88 “ 19-3-64 08025’N 76045’E 50 0330-0430 nil89 “ 19-3-64 09000’N 76018’E 60 1400-1500 nil90 “ 19-3-64 Off Kozhitottam, 18 1830-1930 75
N. of Quilon91 “ 19-3-64 09030’N 76010’E 50 2300-2330 192 “ 20-3-64 10000’N 75055’E 65 0845-0945 293 V-48 24-3-64 11012’N 75043’E 14 1745-1815 25
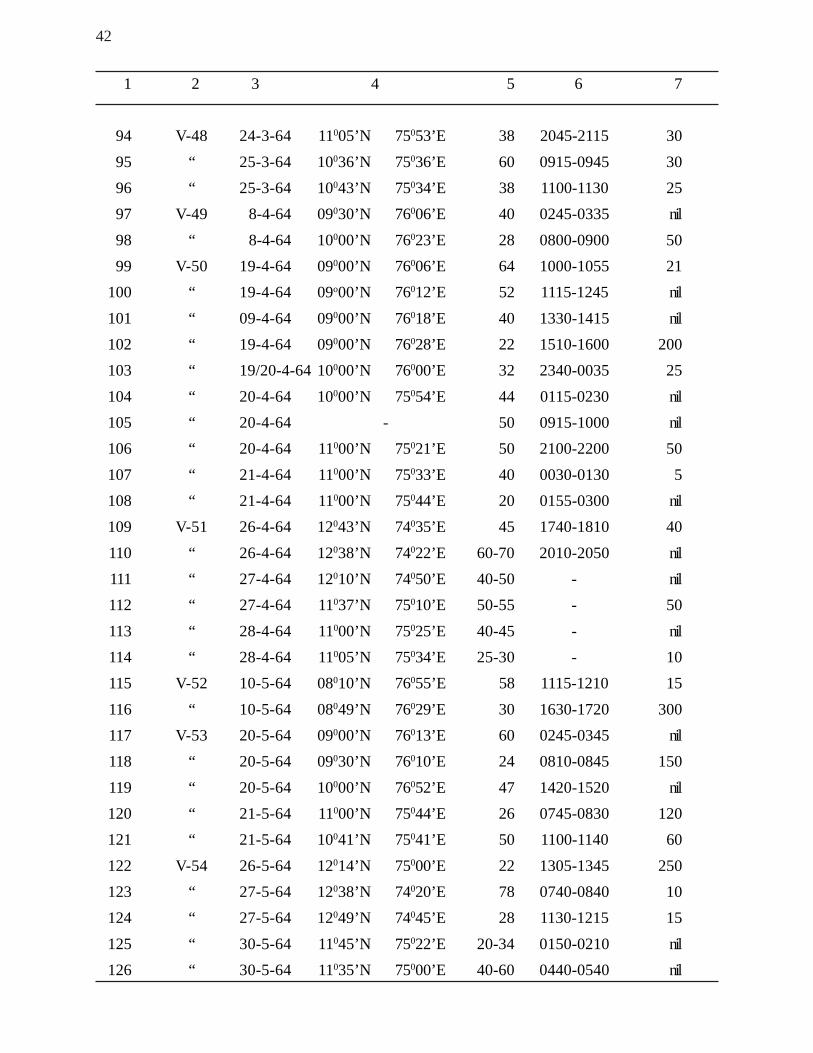
42
1 2 3 4 5 6 7
94 V-48 24-3-64 11005’N 75053’E 38 2045-2115 3095 “ 25-3-64 10036’N 75036’E 60 0915-0945 3096 “ 25-3-64 10043’N 75034’E 38 1100-1130 2597 V-49 8-4-64 09030’N 76006’E 40 0245-0335 nil98 “ 8-4-64 10000’N 76023’E 28 0800-0900 5099 V-50 19-4-64 09000’N 76006’E 64 1000-1055 21
100 “ 19-4-64 09o00’N 76012’E 52 1115-1245 nil101 “ 09-4-64 09000’N 76018’E 40 1330-1415 nil102 “ 19-4-64 09000’N 76028’E 22 1510-1600 200103 “ 19/20-4-64 10000’N 76000’E 32 2340-0035 25104 “ 20-4-64 10000’N 75054’E 44 0115-0230 nil105 “ 20-4-64 - 50 0915-1000 nil106 “ 20-4-64 11000’N 75021’E 50 2100-2200 50107 “ 21-4-64 11000’N 75033’E 40 0030-0130 5108 “ 21-4-64 11000’N 75044’E 20 0155-0300 nil109 V-51 26-4-64 12043’N 74035’E 45 1740-1810 40110 “ 26-4-64 12038’N 74022’E 60-70 2010-2050 nil111 “ 27-4-64 12010’N 74050’E 40-50 - nil112 “ 27-4-64 11037’N 75010’E 50-55 - 50113 “ 28-4-64 11000’N 75025’E 40-45 - nil114 “ 28-4-64 11005’N 75034’E 25-30 - 10115 V-52 10-5-64 08010’N 76055’E 58 1115-1210 15116 “ 10-5-64 08049’N 76029’E 30 1630-1720 300117 V-53 20-5-64 09000’N 76013’E 60 0245-0345 nil118 “ 20-5-64 09030’N 76010’E 24 0810-0845 150
119 “ 20-5-64 10000’N 76052’E 47 1420-1520 nil120 “ 21-5-64 11000’N 75044’E 26 0745-0830 120121 “ 21-5-64 10041’N 75041’E 50 1100-1140 60122 V-54 26-5-64 12014’N 75000’E 22 1305-1345 250123 “ 27-5-64 12038’N 74020’E 78 0740-0840 10124 “ 27-5-64 12049’N 74045’E 28 1130-1215 15125 “ 30-5-64 11045’N 75022’E 20-34 0150-0210 nil126 “ 30-5-64 11035’N 75000’E 40-60 0440-0540 nil
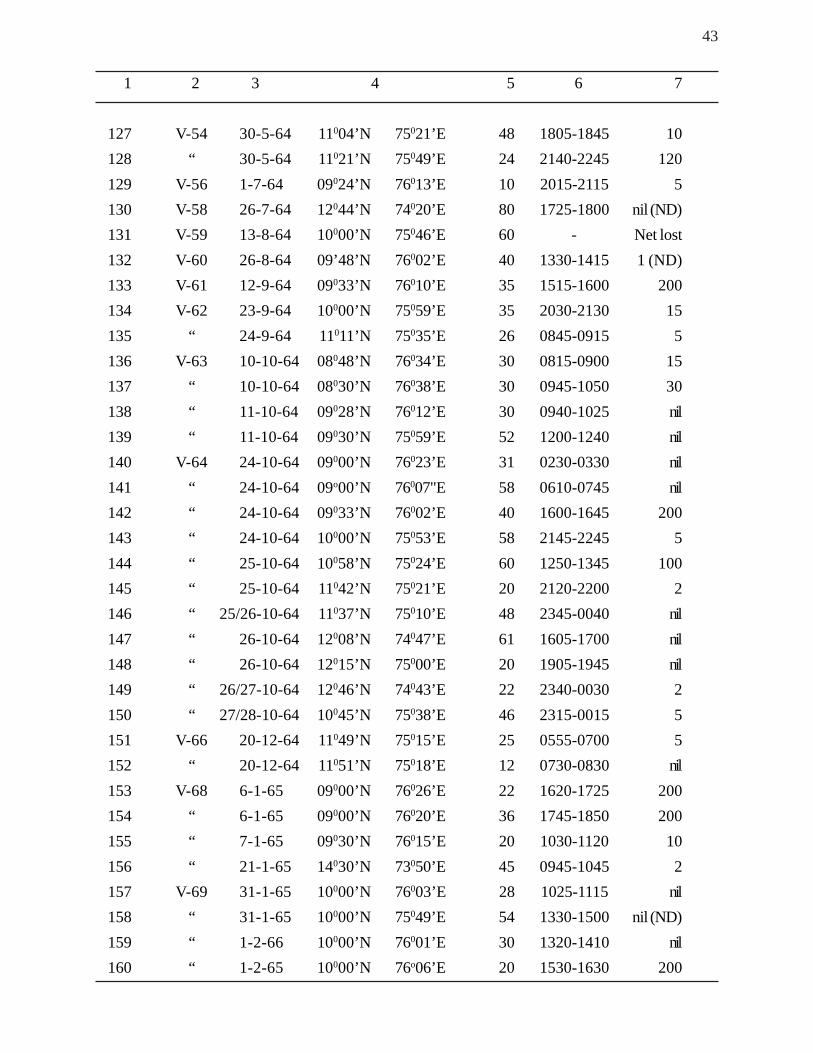
43
1 2 3 4 5 6 7
127 V-54 30-5-64 11004’N 75021’E 48 1805-1845 10128 “ 30-5-64 11021’N 75049’E 24 2140-2245 120129 V-56 1-7-64 09024’N 76013’E 10 2015-2115 5130 V-58 26-7-64 12044’N 74020’E 80 1725-1800 nil (ND)131 V-59 13-8-64 10000’N 75046’E 60 - Net lost132 V-60 26-8-64 09’48’N 76002’E 40 1330-1415 1 (ND)133 V-61 12-9-64 09033’N 76010’E 35 1515-1600 200134 V-62 23-9-64 10000’N 75059’E 35 2030-2130 15135 “ 24-9-64 11011’N 75035’E 26 0845-0915 5136 V-63 10-10-64 08048’N 76034’E 30 0815-0900 15137 “ 10-10-64 08030’N 76038’E 30 0945-1050 30138 “ 11-10-64 09028’N 76012’E 30 0940-1025 nil139 “ 11-10-64 09030’N 75059’E 52 1200-1240 nil140 V-64 24-10-64 09000’N 76023’E 31 0230-0330 nil141 “ 24-10-64 09o00’N 76007"E 58 0610-0745 nil142 “ 24-10-64 09033’N 76002’E 40 1600-1645 200143 “ 24-10-64 10000’N 75053’E 58 2145-2245 5144 “ 25-10-64 10058’N 75024’E 60 1250-1345 100145 “ 25-10-64 11042’N 75021’E 20 2120-2200 2146 “ 25/26-10-64 11037’N 75010’E 48 2345-0040 nil147 “ 26-10-64 12008’N 74047’E 61 1605-1700 nil148 “ 26-10-64 12015’N 75000’E 20 1905-1945 nil149 “ 26/27-10-64 12046’N 74043’E 22 2340-0030 2150 “ 27/28-10-64 10045’N 75038’E 46 2315-0015 5151 V-66 20-12-64 11049’N 75015’E 25 0555-0700 5152 “ 20-12-64 11051’N 75018’E 12 0730-0830 nil153 V-68 6-1-65 09000’N 76026’E 22 1620-1725 200154 “ 6-1-65 09000’N 76020’E 36 1745-1850 200155 “ 7-1-65 09030’N 76015’E 20 1030-1120 10156 “ 21-1-65 14030’N 73050’E 45 0945-1045 2157 V-69 31-1-65 10000’N 76003’E 28 1025-1115 nil
158 “ 31-1-65 10000’N 75049’E 54 1330-1500 nil (ND)159 “ 1-2-66 10000’N 76001’E 30 1320-1410 nil160 “ 1-2-65 10000’N 76o06’E 20 1530-1630 200
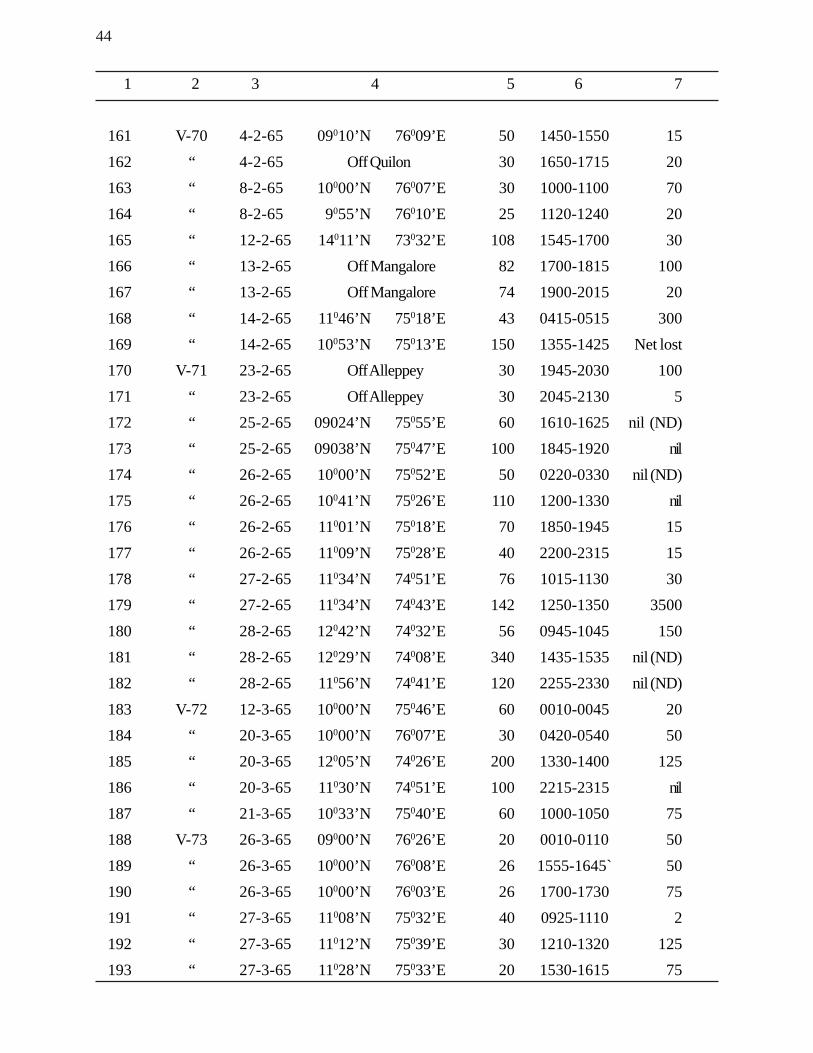
44
1 2 3 4 5 6 7
161 V-70 4-2-65 09010’N 76009’E 50 1450-1550 15162 “ 4-2-65 Off Quilon 30 1650-1715 20163 “ 8-2-65 10000’N 76007’E 30 1000-1100 70164 “ 8-2-65 9055’N 76010’E 25 1120-1240 20165 “ 12-2-65 14011’N 73032’E 108 1545-1700 30166 “ 13-2-65 Off Mangalore 82 1700-1815 100167 “ 13-2-65 Off Mangalore 74 1900-2015 20168 “ 14-2-65 11046’N 75018’E 43 0415-0515 300169 “ 14-2-65 10053’N 75013’E 150 1355-1425 Net lost170 V-71 23-2-65 Off Alleppey 30 1945-2030 100171 “ 23-2-65 Off Alleppey 30 2045-2130 5172 “ 25-2-65 09024’N 75055’E 60 1610-1625 nil (ND)173 “ 25-2-65 09038’N 75047’E 100 1845-1920 nil174 “ 26-2-65 10000’N 75052’E 50 0220-0330 nil (ND)175 “ 26-2-65 10041’N 75026’E 110 1200-1330 nil176 “ 26-2-65 11001’N 75018’E 70 1850-1945 15177 “ 26-2-65 11009’N 75028’E 40 2200-2315 15178 “ 27-2-65 11034’N 74051’E 76 1015-1130 30179 “ 27-2-65 11034’N 74043’E 142 1250-1350 3500180 “ 28-2-65 12042’N 74032’E 56 0945-1045 150181 “ 28-2-65 12029’N 74008’E 340 1435-1535 nil (ND)182 “ 28-2-65 11056’N 74041’E 120 2255-2330 nil (ND)183 V-72 12-3-65 10000’N 75046’E 60 0010-0045 20184 “ 20-3-65 10000’N 76007’E 30 0420-0540 50185 “ 20-3-65 12005’N 74026’E 200 1330-1400 125
186 “ 20-3-65 11030’N 74051’E 100 2215-2315 nil187 “ 21-3-65 10033’N 75040’E 60 1000-1050 75188 V-73 26-3-65 09000’N 76026’E 20 0010-0110 50189 “ 26-3-65 10000’N 76008’E 26 1555-1645` 50190 “ 26-3-65 10000’N 76003’E 26 1700-1730 75191 “ 27-3-65 11008’N 75032’E 40 0925-1110 2192 “ 27-3-65 11012’N 75039’E 30 1210-1320 125193 “ 27-3-65 11028’N 75033’E 20 1530-1615 75
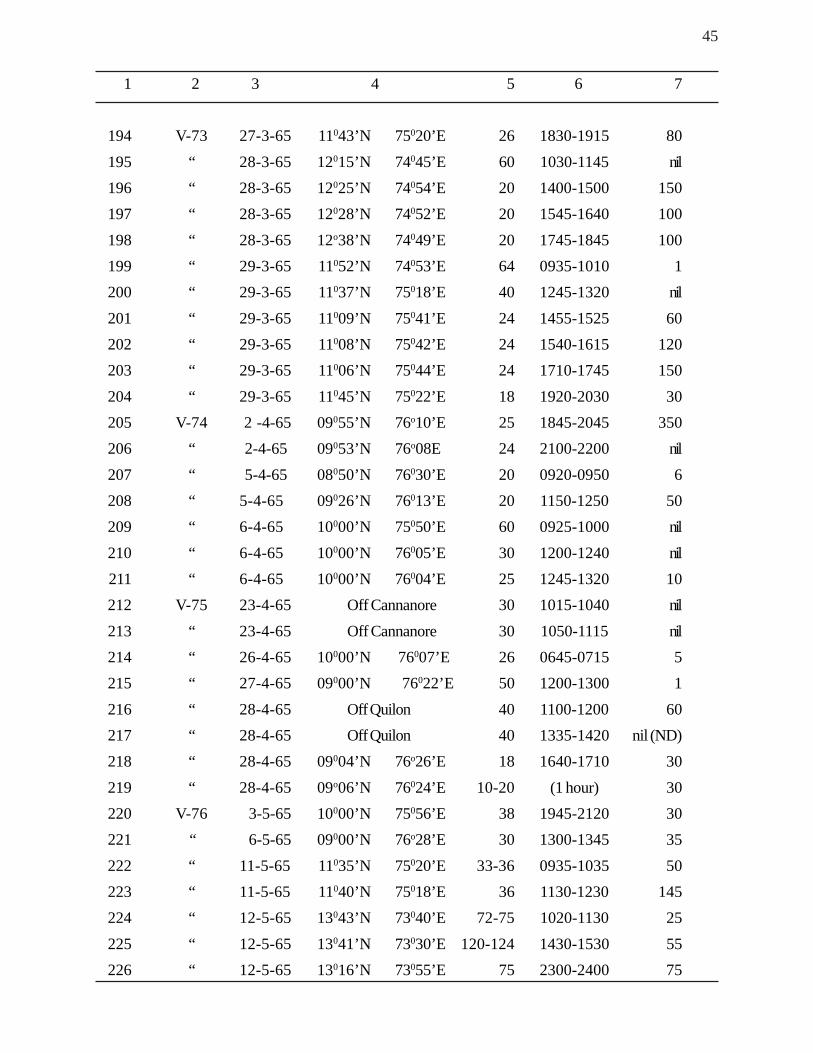
45
1 2 3 4 5 6 7
194 V-73 27-3-65 11043’N 75020’E 26 1830-1915 80195 “ 28-3-65 12015’N 74045’E 60 1030-1145 nil196 “ 28-3-65 12025’N 74054’E 20 1400-1500 150197 “ 28-3-65 12028’N 74052’E 20 1545-1640 100198 “ 28-3-65 12o38’N 74049’E 20 1745-1845 100199 “ 29-3-65 11052’N 74053’E 64 0935-1010 1200 “ 29-3-65 11037’N 75018’E 40 1245-1320 nil201 “ 29-3-65 11009’N 75041’E 24 1455-1525 60202 “ 29-3-65 11008’N 75042’E 24 1540-1615 120203 “ 29-3-65 11006’N 75044’E 24 1710-1745 150204 “ 29-3-65 11045’N 75022’E 18 1920-2030 30205 V-74 2 -4-65 09055’N 76o10’E 25 1845-2045 350206 “ 2-4-65 09053’N 76o08E 24 2100-2200 nil207 “ 5-4-65 08050’N 76030’E 20 0920-0950 6208 “ 5-4-65 09026’N 76013’E 20 1150-1250 50209 “ 6-4-65 10000’N 75050’E 60 0925-1000 nil210 “ 6-4-65 10000’N 76005’E 30 1200-1240 nil211 “ 6-4-65 10000’N 76004’E 25 1245-1320 10212 V-75 23-4-65 Off Cannanore 30 1015-1040 nil213 “ 23-4-65 Off Cannanore 30 1050-1115 nil214 “ 26-4-65 10000’N 76007’E 26 0645-0715 5215 “ 27-4-65 09000’N 76022’E 50 1200-1300 1216 “ 28-4-65 Off Quilon 40 1100-1200 60217 “ 28-4-65 Off Quilon 40 1335-1420 nil (ND)218 “ 28-4-65 09004’N 76o26’E 18 1640-1710 30
219 “ 28-4-65 09o06’N 76024’E 10-20 (1 hour) 30220 V-76 3-5-65 10000’N 75056’E 38 1945-2120 30221 “ 6-5-65 09000’N 76o28’E 30 1300-1345 35222 “ 11-5-65 11035’N 75020’E 33-36 0935-1035 50223 “ 11-5-65 11040’N 75018’E 36 1130-1230 145224 “ 12-5-65 13043’N 73040’E 72-75 1020-1130 25225 “ 12-5-65 13041’N 73030’E 120-124 1430-1530 55226 “ 12-5-65 13016’N 73055’E 75 2300-2400 75
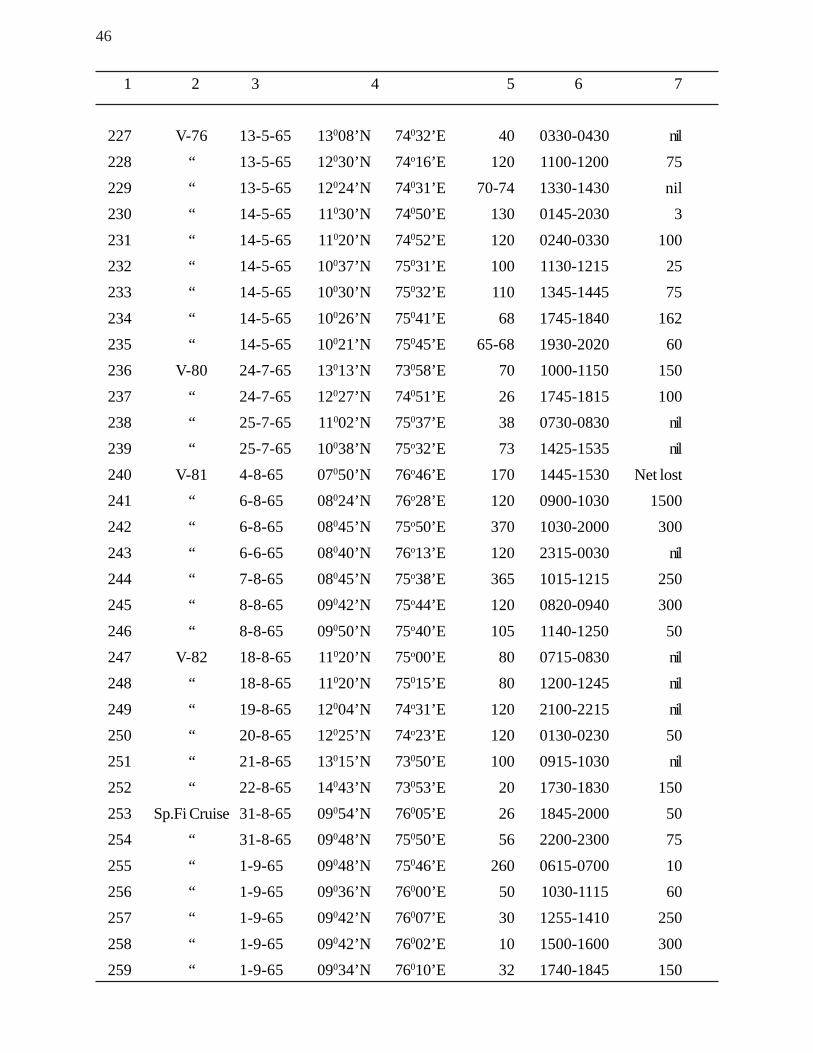
46
1 2 3 4 5 6 7
227 V-76 13-5-65 13008’N 74032’E 40 0330-0430 nil228 “ 13-5-65 12030’N 74o16’E 120 1100-1200 75229 “ 13-5-65 12024’N 74031’E 70-74 1330-1430 nil230 “ 14-5-65 11030’N 74050’E 130 0145-2030 3231 “ 14-5-65 11020’N 74052’E 120 0240-0330 100232 “ 14-5-65 10037’N 75031’E 100 1130-1215 25233 “ 14-5-65 10030’N 75032’E 110 1345-1445 75234 “ 14-5-65 10026’N 75041’E 68 1745-1840 162235 “ 14-5-65 10021’N 75045’E 65-68 1930-2020 60236 V-80 24-7-65 13013’N 73058’E 70 1000-1150 150237 “ 24-7-65 12027’N 74051’E 26 1745-1815 100238 “ 25-7-65 11002’N 75037’E 38 0730-0830 nil239 “ 25-7-65 10038’N 75o32’E 73 1425-1535 nil240 V-81 4-8-65 07050’N 76o46’E 170 1445-1530 Net lost241 “ 6-8-65 08024’N 76o28’E 120 0900-1030 1500242 “ 6-8-65 08045’N 75o50’E 370 1030-2000 300243 “ 6-6-65 08040’N 76o13’E 120 2315-0030 nil244 “ 7-8-65 08045’N 75o38’E 365 1015-1215 250245 “ 8-8-65 09042’N 75o44’E 120 0820-0940 300246 “ 8-8-65 09050’N 75o40’E 105 1140-1250 50247 V-82 18-8-65 11020’N 75o00’E 80 0715-0830 nil248 “ 18-8-65 11020’N 75015’E 80 1200-1245 nil249 “ 19-8-65 12004’N 74o31’E 120 2100-2215 nil250 “ 20-8-65 12025’N 74o23’E 120 0130-0230 50251 “ 21-8-65 13015’N 73050’E 100 0915-1030 nil
252 “ 22-8-65 14043’N 73053’E 20 1730-1830 150253 Sp.Fi Cruise 31-8-65 09054’N 76005’E 26 1845-2000 50254 “ 31-8-65 09048’N 75050’E 56 2200-2300 75255 “ 1-9-65 09048’N 75046’E 260 0615-0700 10256 “ 1-9-65 09036’N 76000’E 50 1030-1115 60257 “ 1-9-65 09042’N 76007’E 30 1255-1410 250258 “ 1-9-65 09042’N 76002’E 10 1500-1600 300259 “ 1-9-65 09034’N 76010’E 32 1740-1845 150
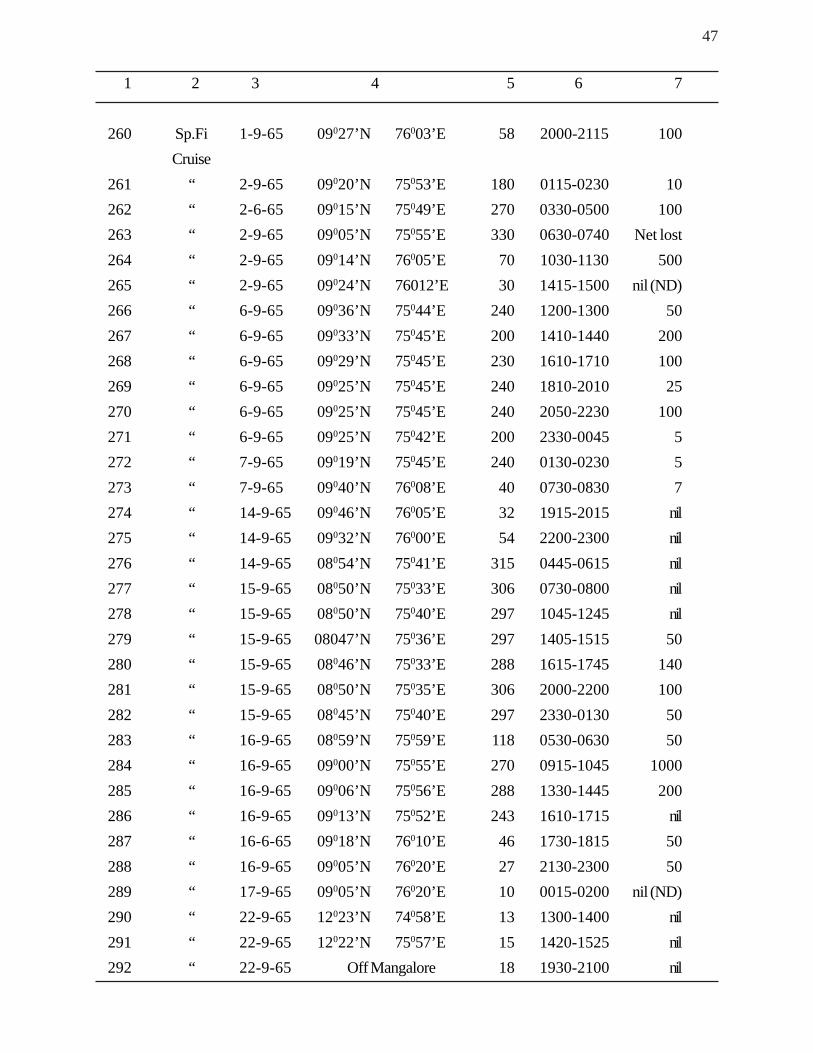
47
1 2 3 4 5 6 7
260 Sp.Fi 1-9-65 09027’N 76003’E 58 2000-2115 100Cruise
261 “ 2-9-65 09020’N 75053’E 180 0115-0230 10262 “ 2-6-65 09015’N 75049’E 270 0330-0500 100263 “ 2-9-65 09005’N 75055’E 330 0630-0740 Net lost264 “ 2-9-65 09014’N 76005’E 70 1030-1130 500265 “ 2-9-65 09024’N 76012’E 30 1415-1500 nil (ND)266 “ 6-9-65 09036’N 75044’E 240 1200-1300 50267 “ 6-9-65 09033’N 75045’E 200 1410-1440 200268 “ 6-9-65 09029’N 75045’E 230 1610-1710 100269 “ 6-9-65 09025’N 75045’E 240 1810-2010 25270 “ 6-9-65 09025’N 75045’E 240 2050-2230 100271 “ 6-9-65 09025’N 75042’E 200 2330-0045 5272 “ 7-9-65 09019’N 75045’E 240 0130-0230 5273 “ 7-9-65 09040’N 76008’E 40 0730-0830 7274 “ 14-9-65 09046’N 76005’E 32 1915-2015 nil275 “ 14-9-65 09032’N 76000’E 54 2200-2300 nil276 “ 14-9-65 08054’N 75041’E 315 0445-0615 nil277 “ 15-9-65 08050’N 75033’E 306 0730-0800 nil278 “ 15-9-65 08050’N 75040’E 297 1045-1245 nil279 “ 15-9-65 08047’N 75036’E 297 1405-1515 50280 “ 15-9-65 08046’N 75033’E 288 1615-1745 140281 “ 15-9-65 08050’N 75035’E 306 2000-2200 100282 “ 15-9-65 08045’N 75040’E 297 2330-0130 50283 “ 16-9-65 08059’N 75059’E 118 0530-0630 50284 “ 16-9-65 09000’N 75055’E 270 0915-1045 1000285 “ 16-9-65 09006’N 75056’E 288 1330-1445 200286 “ 16-9-65 09013’N 75052’E 243 1610-1715 nil287 “ 16-6-65 09018’N 76010’E 46 1730-1815 50288 “ 16-9-65 09005’N 76020’E 27 2130-2300 50289 “ 17-9-65 09005’N 76020’E 10 0015-0200 nil (ND)290 “ 22-9-65 12023’N 74058’E 13 1300-1400 nil291 “ 22-9-65 12022’N 75057’E 15 1420-1525 nil292 “ 22-9-65 Off Mangalore 18 1930-2100 nil
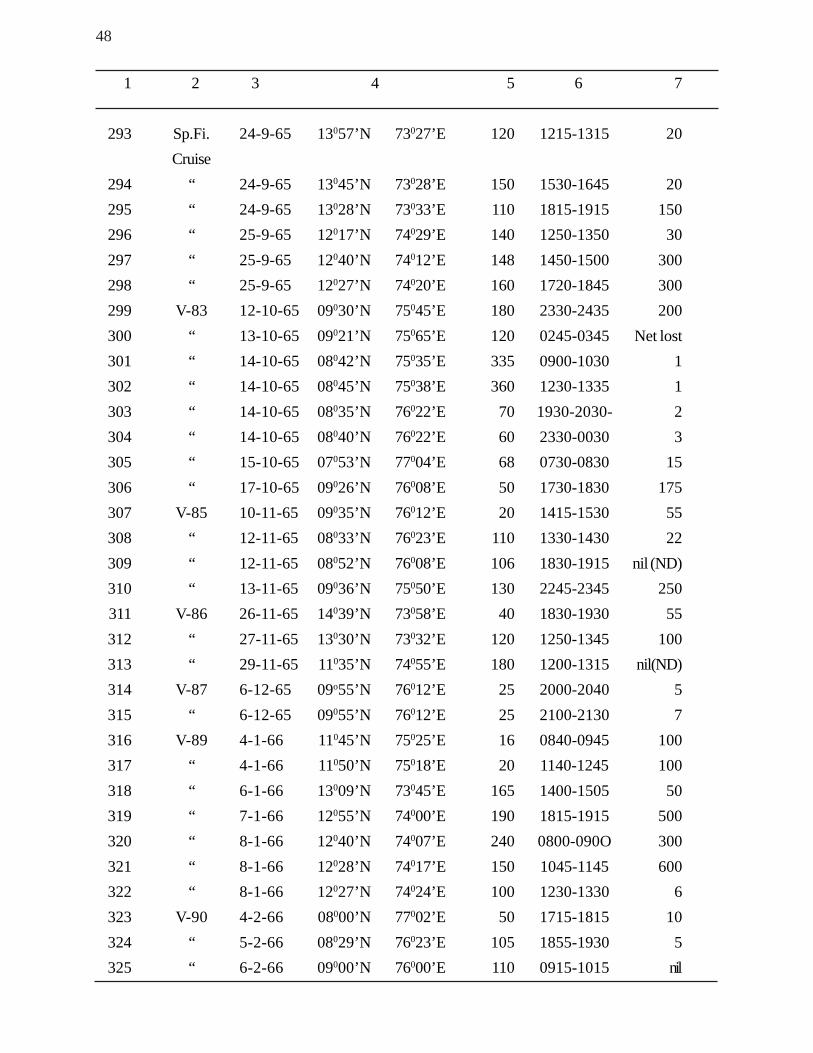
48
1 2 3 4 5 6 7
293 Sp.Fi. 24-9-65 13057’N 73027’E 120 1215-1315 20Cruise
294 “ 24-9-65 13045’N 73028’E 150 1530-1645 20295 “ 24-9-65 13028’N 73033’E 110 1815-1915 150296 “ 25-9-65 12017’N 74029’E 140 1250-1350 30297 “ 25-9-65 12040’N 74012’E 148 1450-1500 300298 “ 25-9-65 12027’N 74020’E 160 1720-1845 300299 V-83 12-10-65 09030’N 75045’E 180 2330-2435 200300 “ 13-10-65 09021’N 75065’E 120 0245-0345 Net lost301 “ 14-10-65 08042’N 75035’E 335 0900-1030 1302 “ 14-10-65 08045’N 75038’E 360 1230-1335 1303 “ 14-10-65 08035’N 76022’E 70 1930-2030- 2304 “ 14-10-65 08040’N 76022’E 60 2330-0030 3305 “ 15-10-65 07053’N 77004’E 68 0730-0830 15306 “ 17-10-65 09026’N 76008’E 50 1730-1830 175307 V-85 10-11-65 09035’N 76012’E 20 1415-1530 55308 “ 12-11-65 08033’N 76023’E 110 1330-1430 22309 “ 12-11-65 08052’N 76008’E 106 1830-1915 nil (ND)310 “ 13-11-65 09036’N 75050’E 130 2245-2345 250311 V-86 26-11-65 14039’N 73058’E 40 1830-1930 55312 “ 27-11-65 13030’N 73032’E 120 1250-1345 100313 “ 29-11-65 11035’N 74055’E 180 1200-1315 nil(ND)314 V-87 6-12-65 09o55’N 76012’E 25 2000-2040 5315 “ 6-12-65 09055’N 76012’E 25 2100-2130 7316 V-89 4-1-66 11045’N 75025’E 16 0840-0945 100317 “ 4-1-66 11050’N 75018’E 20 1140-1245 100318 “ 6-1-66 13009’N 73045’E 165 1400-1505 50319 “ 7-1-66 12055’N 74000’E 190 1815-1915 500320 “ 8-1-66 12040’N 74007’E 240 0800-090O 300321 “ 8-1-66 12028’N 74017’E 150 1045-1145 600322 “ 8-1-66 12027’N 74024’E 100 1230-1330 6323 V-90 4-2-66 08000’N 77002’E 50 1715-1815 10324 “ 5-2-66 08029’N 76023’E 105 1855-1930 5325 “ 6-2-66 09000’N 76000’E 110 0915-1015 nil
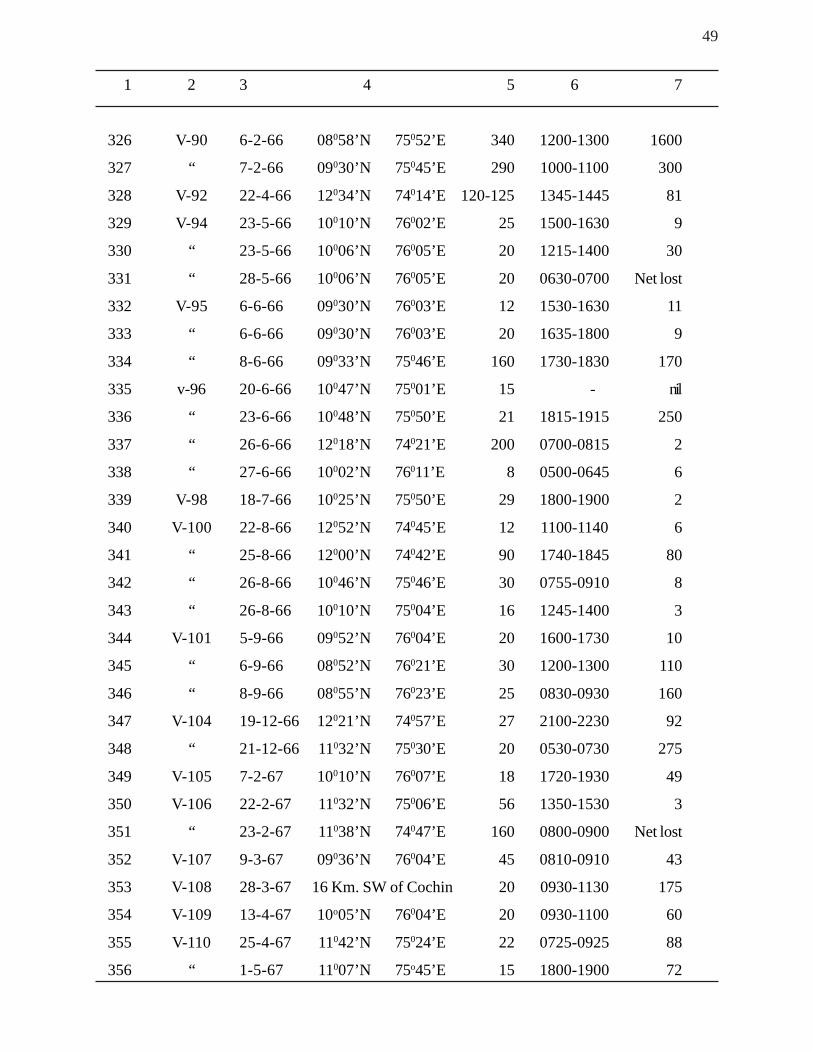
49
1 2 3 4 5 6 7
326 V-90 6-2-66 08058’N 75052’E 340 1200-1300 1600
327 “ 7-2-66 09030’N 75045’E 290 1000-1100 300
328 V-92 22-4-66 12034’N 74014’E 120-125 1345-1445 81
329 V-94 23-5-66 10010’N 76002’E 25 1500-1630 9
330 “ 23-5-66 10006’N 76005’E 20 1215-1400 30
331 “ 28-5-66 10006’N 76005’E 20 0630-0700 Net lost
332 V-95 6-6-66 09030’N 76003’E 12 1530-1630 11
333 “ 6-6-66 09030’N 76003’E 20 1635-1800 9
334 “ 8-6-66 09033’N 75046’E 160 1730-1830 170
335 v-96 20-6-66 10047’N 75001’E 15 - nil
336 “ 23-6-66 10048’N 75050’E 21 1815-1915 250
337 “ 26-6-66 12018’N 74021’E 200 0700-0815 2
338 “ 27-6-66 10002’N 76011’E 8 0500-0645 6
339 V-98 18-7-66 10025’N 75050’E 29 1800-1900 2
340 V-100 22-8-66 12052’N 74045’E 12 1100-1140 6
341 “ 25-8-66 12000’N 74042’E 90 1740-1845 80
342 “ 26-8-66 10046’N 75046’E 30 0755-0910 8
343 “ 26-8-66 10010’N 75004’E 16 1245-1400 3
344 V-101 5-9-66 09052’N 76004’E 20 1600-1730 10
345 “ 6-9-66 08052’N 76021’E 30 1200-1300 110
346 “ 8-9-66 08055’N 76023’E 25 0830-0930 160
347 V-104 19-12-66 12021’N 74057’E 27 2100-2230 92
348 “ 21-12-66 11032’N 75030’E 20 0530-0730 275
349 V-105 7-2-67 10010’N 76007’E 18 1720-1930 49
350 V-106 22-2-67 11032’N 75006’E 56 1350-1530 3
351 “ 23-2-67 11038’N 74047’E 160 0800-0900 Net lost
352 V-107 9-3-67 09036’N 76004’E 45 0810-0910 43
353 V-108 28-3-67 16 Km. SW of Cochin 20 0930-1130 175
354 V-109 13-4-67 10o05’N 76004’E 20 0930-1100 60
355 V-110 25-4-67 11042’N 75024’E 22 0725-0925 88
356 “ 1-5-67 11007’N 75o45’E 15 1800-1900 72
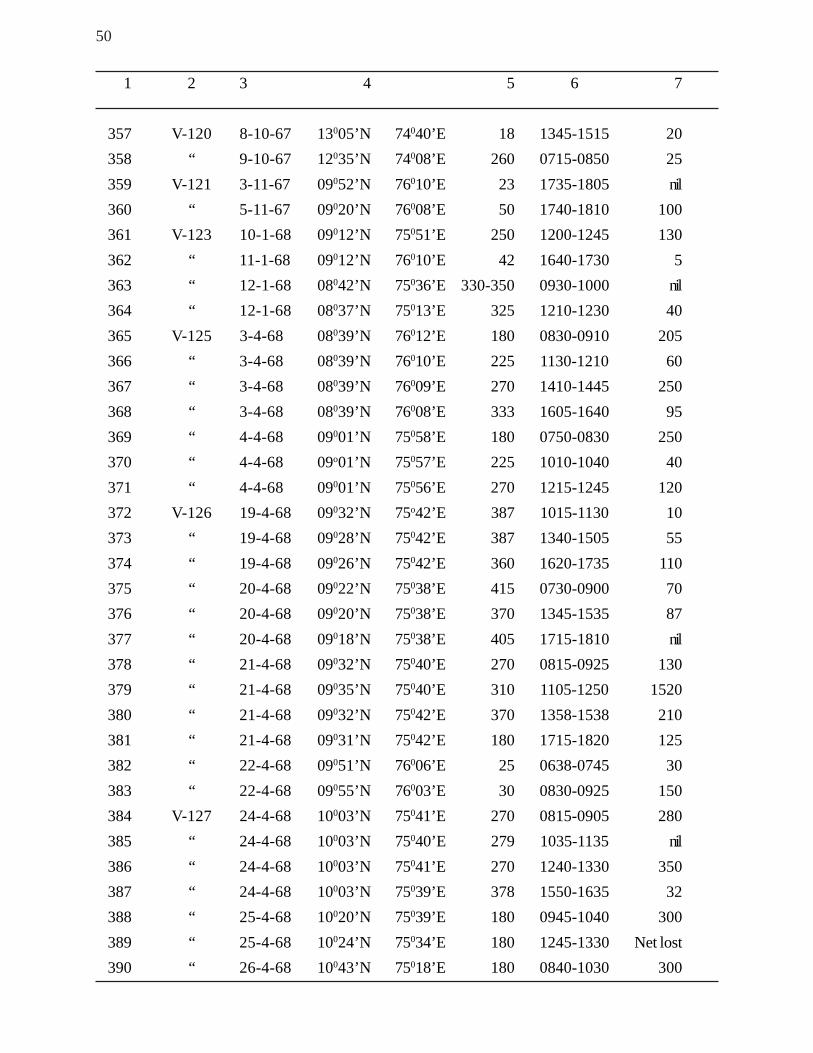
50
1 2 3 4 5 6 7
357 V-120 8-10-67 13005’N 74040’E 18 1345-1515 20358 “ 9-10-67 12035’N 74008’E 260 0715-0850 25359 V-121 3-11-67 09052’N 76010’E 23 1735-1805 nil360 “ 5-11-67 09020’N 76008’E 50 1740-1810 100361 V-123 10-1-68 09012’N 75051’E 250 1200-1245 130362 “ 11-1-68 09012’N 76010’E 42 1640-1730 5363 “ 12-1-68 08042’N 75036’E 330-350 0930-1000 nil364 “ 12-1-68 08037’N 75013’E 325 1210-1230 40365 V-125 3-4-68 08039’N 76012’E 180 0830-0910 205366 “ 3-4-68 08039’N 76010’E 225 1130-1210 60367 “ 3-4-68 08039’N 76009’E 270 1410-1445 250368 “ 3-4-68 08039’N 76008’E 333 1605-1640 95369 “ 4-4-68 09001’N 75058’E 180 0750-0830 250370 “ 4-4-68 09o01’N 75057’E 225 1010-1040 40371 “ 4-4-68 09001’N 75056’E 270 1215-1245 120372 V-126 19-4-68 09032’N 75o42’E 387 1015-1130 10373 “ 19-4-68 09028’N 75042’E 387 1340-1505 55374 “ 19-4-68 09026’N 75042’E 360 1620-1735 110375 “ 20-4-68 09022’N 75038’E 415 0730-0900 70376 “ 20-4-68 09020’N 75038’E 370 1345-1535 87377 “ 20-4-68 09018’N 75038’E 405 1715-1810 nil378 “ 21-4-68 09032’N 75040’E 270 0815-0925 130379 “ 21-4-68 09035’N 75040’E 310 1105-1250 1520380 “ 21-4-68 09032’N 75042’E 370 1358-1538 210381 “ 21-4-68 09031’N 75042’E 180 1715-1820 125382 “ 22-4-68 09051’N 76006’E 25 0638-0745 30383 “ 22-4-68 09055’N 76003’E 30 0830-0925 150384 V-127 24-4-68 10003’N 75041’E 270 0815-0905 280385 “ 24-4-68 10003’N 75040’E 279 1035-1135 nil386 “ 24-4-68 10003’N 75041’E 270 1240-1330 350387 “ 24-4-68 10003’N 75039’E 378 1550-1635 32388 “ 25-4-68 10020’N 75039’E 180 0945-1040 300389 “ 25-4-68 10024’N 75034’E 180 1245-1330 Net lost390 “ 26-4-68 10043’N 75018’E 180 0840-1030 300
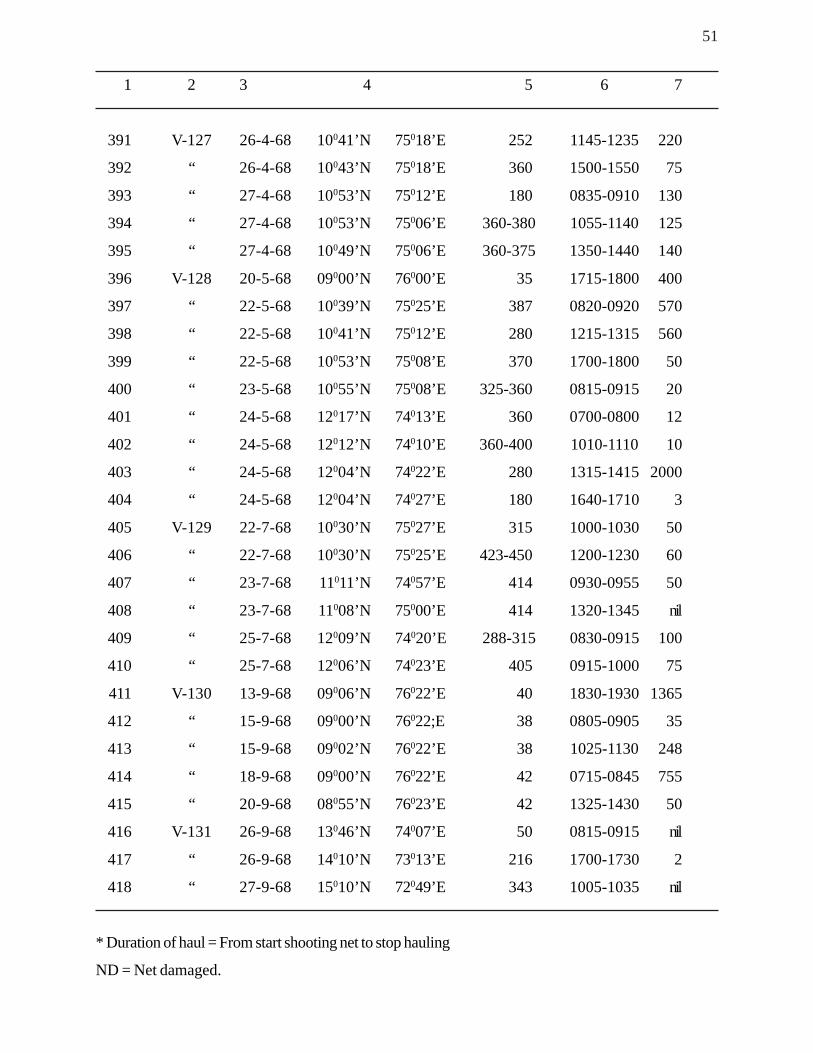
51
1 2 3 4 5 6 7
391 V-127 26-4-68 10041’N 75018’E 252 1145-1235 220
392 “ 26-4-68 10043’N 75018’E 360 1500-1550 75
393 “ 27-4-68 10053’N 75012’E 180 0835-0910 130
394 “ 27-4-68 10053’N 75006’E 360-380 1055-1140 125
395 “ 27-4-68 10049’N 75006’E 360-375 1350-1440 140
396 V-128 20-5-68 09000’N 76000’E 35 1715-1800 400
397 “ 22-5-68 10039’N 75025’E 387 0820-0920 570
398 “ 22-5-68 10041’N 75012’E 280 1215-1315 560
399 “ 22-5-68 10053’N 75008’E 370 1700-1800 50
400 “ 23-5-68 10055’N 75008’E 325-360 0815-0915 20
401 “ 24-5-68 12017’N 74013’E 360 0700-0800 12
402 “ 24-5-68 12012’N 74010’E 360-400 1010-1110 10
403 “ 24-5-68 12004’N 74022’E 280 1315-1415 2000
404 “ 24-5-68 12004’N 74027’E 180 1640-1710 3
405 V-129 22-7-68 10030’N 75027’E 315 1000-1030 50
406 “ 22-7-68 10030’N 75025’E 423-450 1200-1230 60
407 “ 23-7-68 11011’N 74057’E 414 0930-0955 50
408 “ 23-7-68 11008’N 75000’E 414 1320-1345 nil
409 “ 25-7-68 12009’N 74020’E 288-315 0830-0915 100
410 “ 25-7-68 12006’N 74023’E 405 0915-1000 75
411 V-130 13-9-68 09006’N 76022’E 40 1830-1930 1365
412 “ 15-9-68 09000’N 76022;E 38 0805-0905 35
413 “ 15-9-68 09002’N 76022’E 38 1025-1130 248
414 “ 18-9-68 09000’N 76022’E 42 0715-0845 755
415 “ 20-9-68 08055’N 76023’E 42 1325-1430 50
416 V-131 26-9-68 13046’N 74007’E 50 0815-0915 nil
417 “ 26-9-68 14010’N 73013’E 216 1700-1730 2
418 “ 27-9-68 15010’N 72049’E 343 1005-1035 nil
* Duration of haul = From start shooting net to stop hauling
ND = Net damaged.

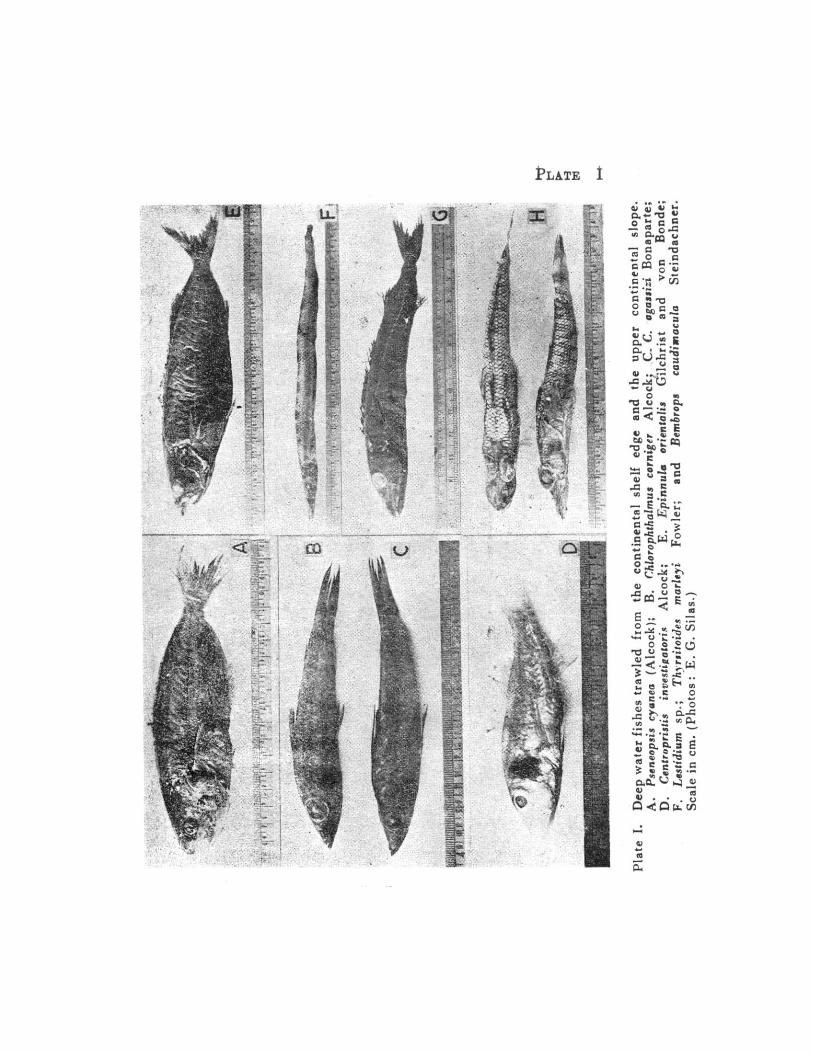
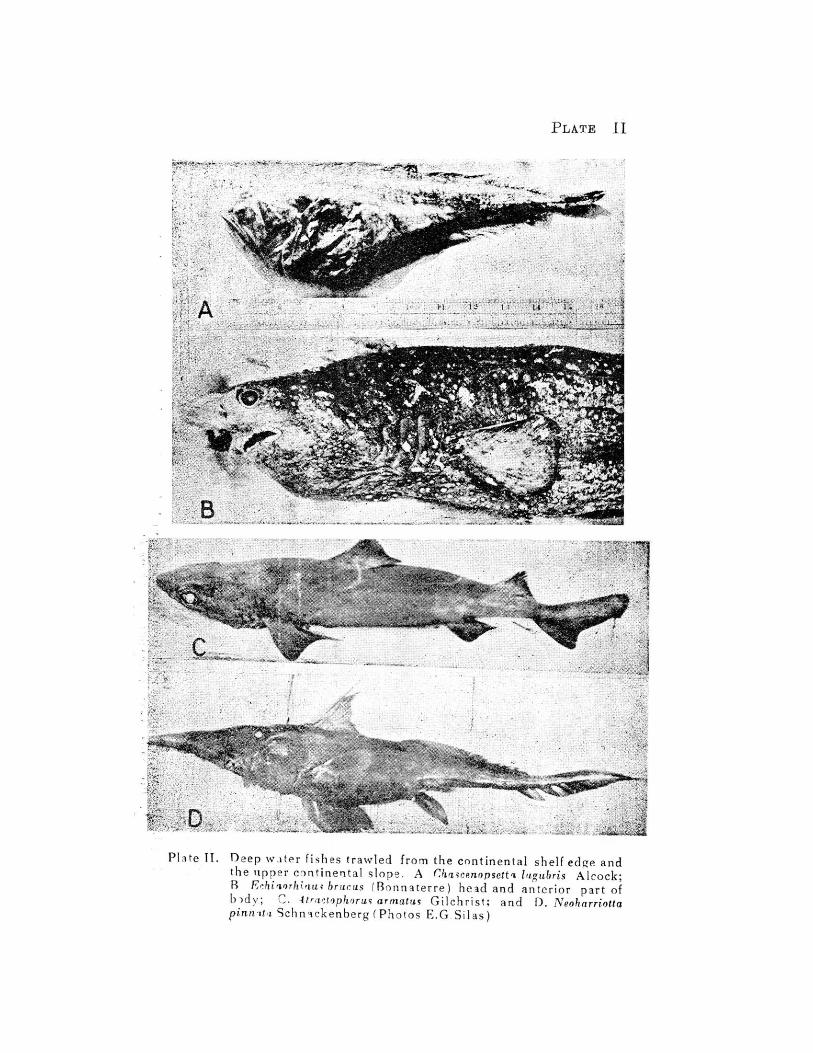
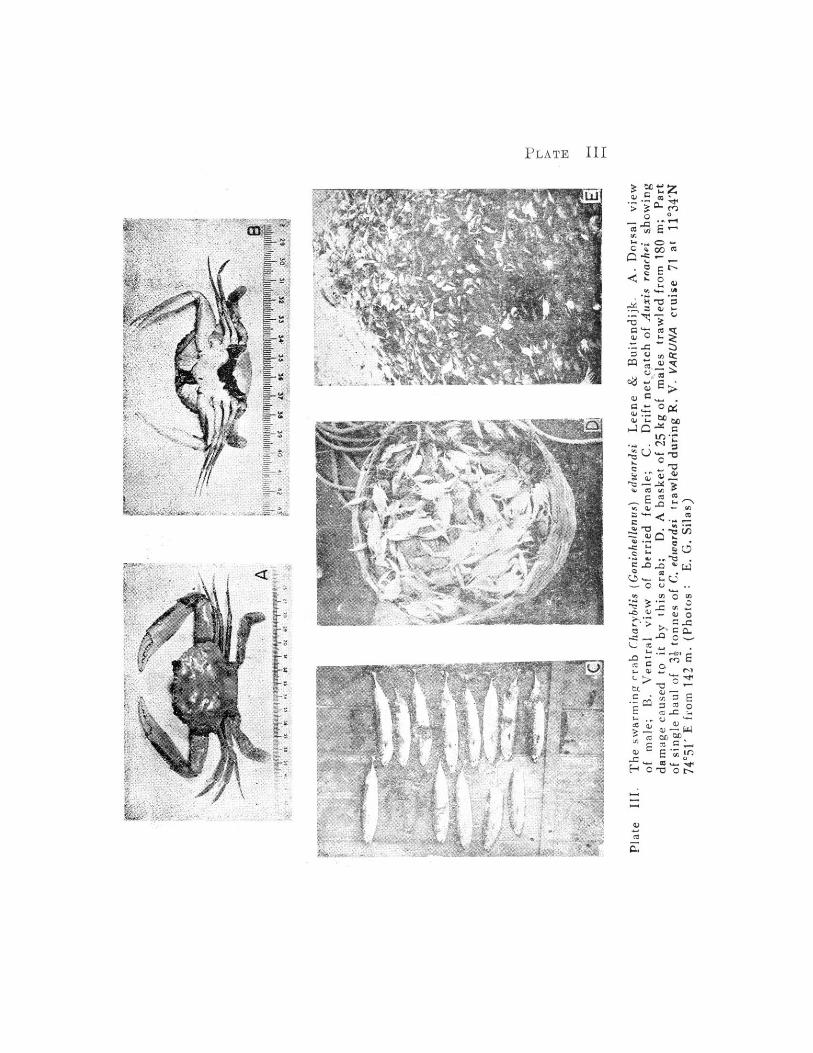
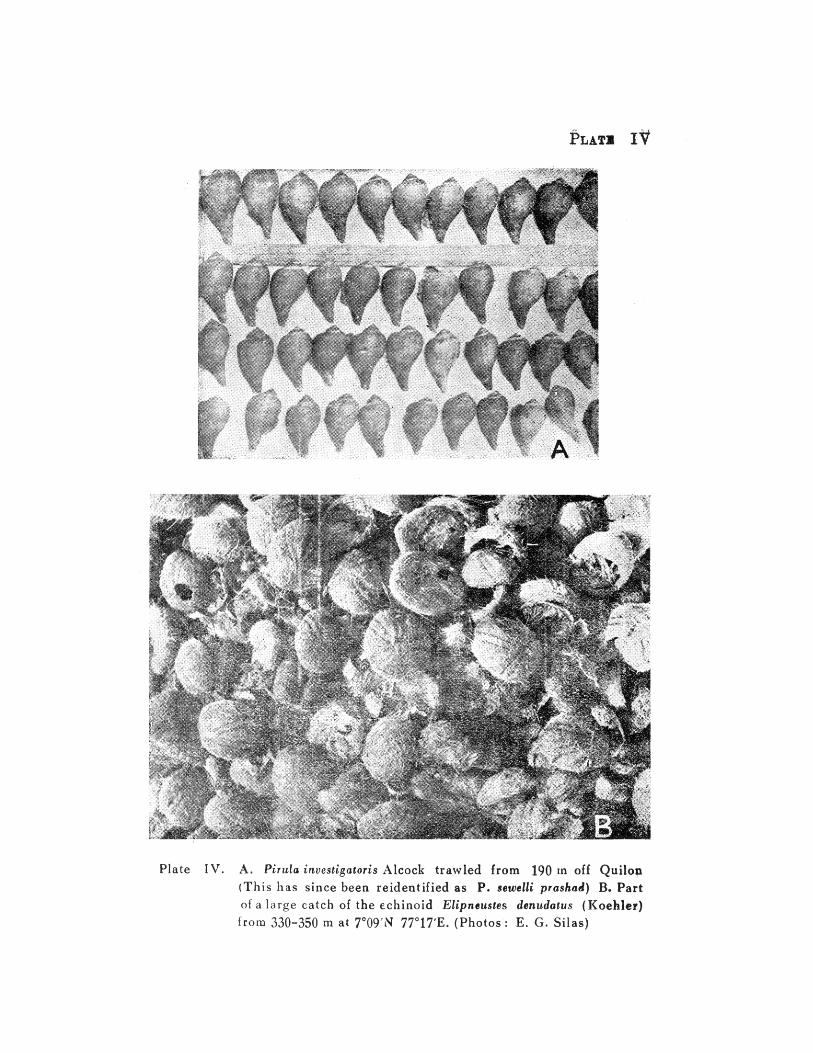
P A R T – II
EXPLORATORY SURVEY OF THE KALAVA FISHING GROUNDS ON THESOUTH WEST COAST OF INDIA

53
EXPLORATORY FISHING FOR ‘KALAVA’
The word ‘Kalava’ is used here to denote a heterogenous assemblage of percoid fishes popularly
known as rock cods (kalava) and snappers (velameen). Traditional handline fishing for perches 30 to 40
km off the coast has been in vogue along some area off the south-west coast as well as in the Wadge
Bank, and Hornell (1916) commented on the fishing grounds in the 25 to 40 fathom depths in the Wadge
Bank area. More recently, John (1948) indicated that the depths between 60 and 70 fathoms off Anjengo
and Chavara were good for line fishing, and trawling could not be carried out due to the rocky bottom.
Gopinath (1954) gave a preliminary account on perch fishery south of Alleppey and of the Wadge Bank.
During the cruises of R.V. VARUNA line fishing by indigenous craft has been observed off Alleppey, and
in several places south of Quilon and on the Wadge Bank.
From about October 1956, the Indo-Norwegian Project vessels M.F.V. COCHIN (re-christened
R.V. KALAVA), M.O. KRISTENSEN, and some of the medium boats were on and off engaged in
handline fishing off Cochin (Figure 15B). The most successful and well utilized vessel for this purpose was
R.V. KALAVA which in the course of about 200 days of fishing up to December 1966, landed approximately
75,000 kg of perches. Her line fishing activities were mainly concentrated on the ‘Kalava’ grounds between
Ponnani and Alleppey.
Though these early efforts indicated prospects for good line fishing, a systematic exploration of the
grounds had not been undertaken. One drawback has been the absence of any information as to the exact
location of these grounds in the different areas. The catch data alone may not allow for an estimation of the
potential perch resources available in the Kalva grounds. Besides, the ‘Kalava’ grounds off Kerala Coast
are different from the perch fishing grounds on the Wadge Bank where trawling for perches is possible
over a large portion of the Bank. Hence the information about the numerical occurrence of the ‘Kalava’
grounds in the different areas is necessary for any proper assessment. To gather such
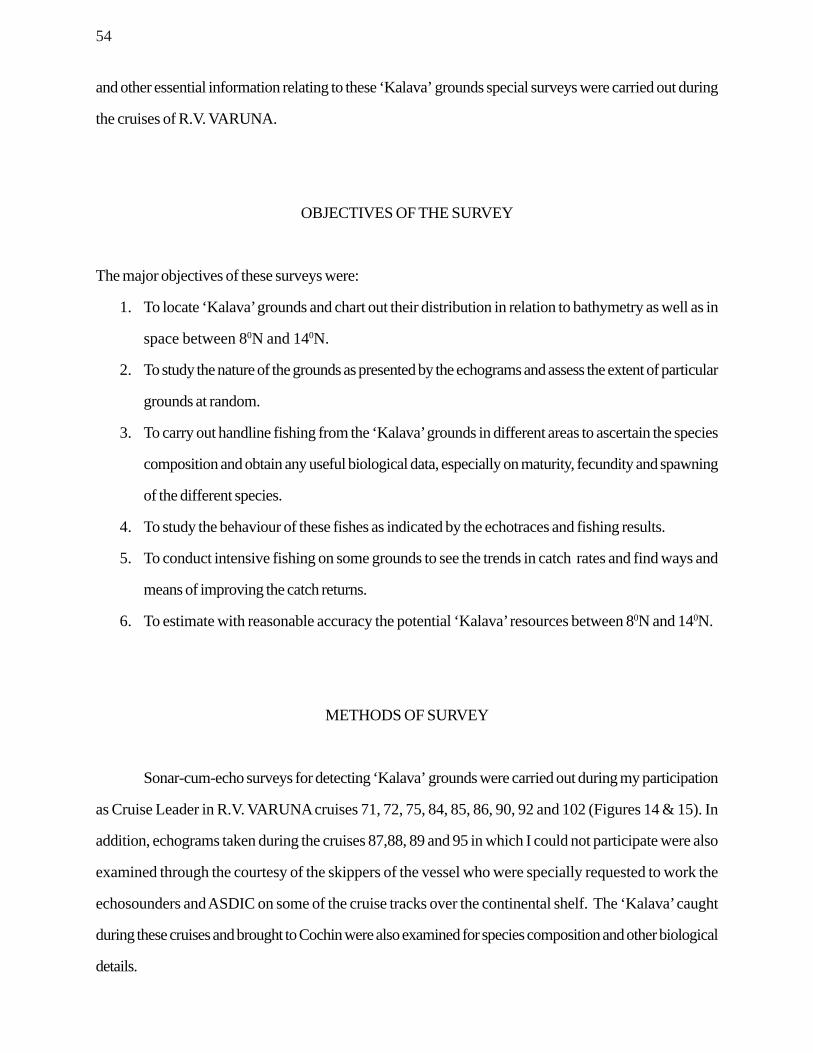
54
and other essential information relating to these ‘Kalava’ grounds special surveys were carried out during
the cruises of R.V. VARUNA.
OBJECTIVES OF THE SURVEY
The major objectives of these surveys were:
1. To locate ‘Kalava’ grounds and chart out their distribution in relation to bathymetry as well as in
space between 80N and 140N.
2. To study the nature of the grounds as presented by the echograms and assess the extent of particular
grounds at random.
3. To carry out handline fishing from the ‘Kalava’ grounds in different areas to ascertain the species
composition and obtain any useful biological data, especially on maturity, fecundity and spawning
of the different species.
4. To study the behaviour of these fishes as indicated by the echotraces and fishing results.
5. To conduct intensive fishing on some grounds to see the trends in catch rates and find ways and
means of improving the catch returns.
6. To estimate with reasonable accuracy the potential ‘Kalava’ resources between 80N and 140N.
METHODS OF SURVEY
Sonar-cum-echo surveys for detecting ‘Kalava’ grounds were carried out during my participation
as Cruise Leader in R.V. VARUNA cruises 71, 72, 75, 84, 85, 86, 90, 92 and 102 (Figures 14 & 15). In
addition, echograms taken during the cruises 87,88, 89 and 95 in which I could not participate were also
examined through the courtesy of the skippers of the vessel who were specially requested to work the
echosounders and ASDIC on some of the cruise tracks over the continental shelf. The ‘Kalava’ caught
during these cruises and brought to Cochin were also examined for species composition and other biological
details.
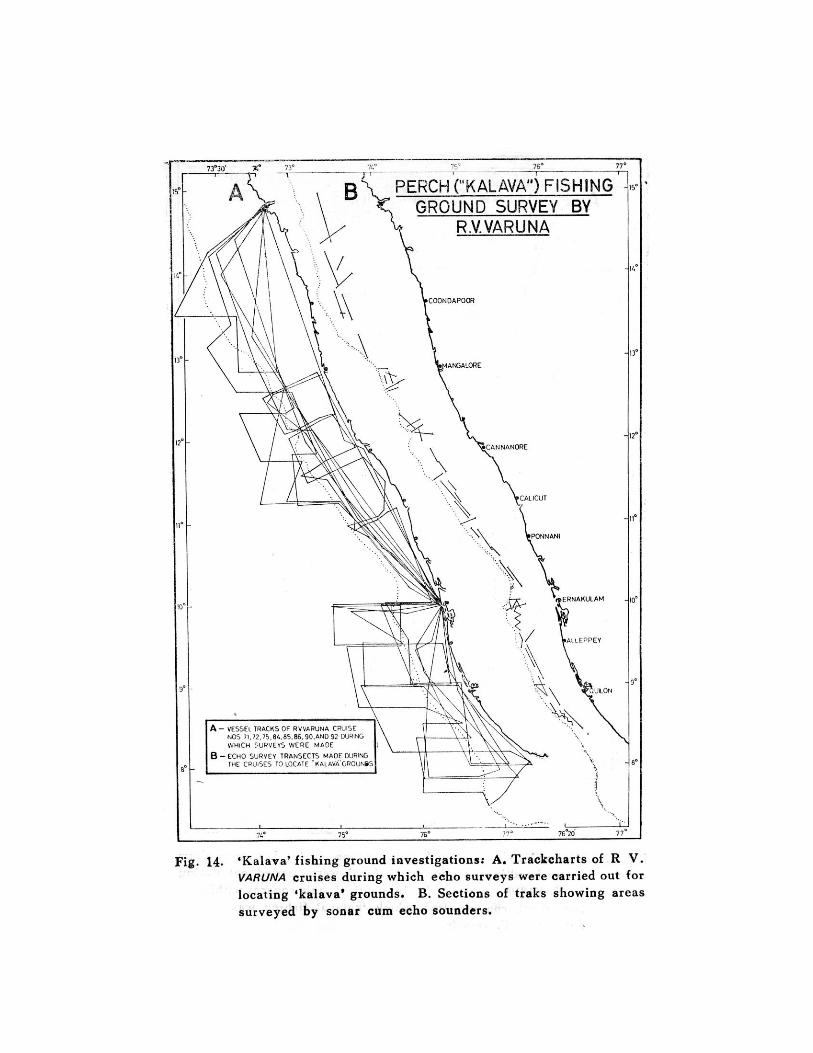
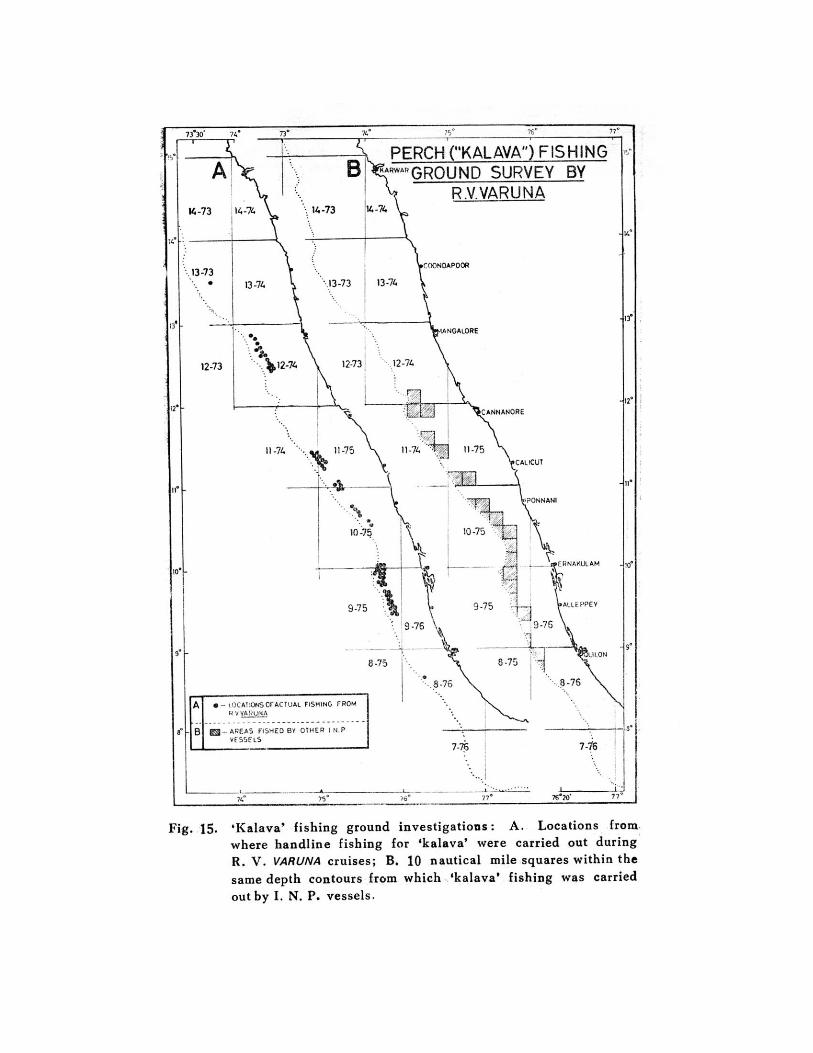
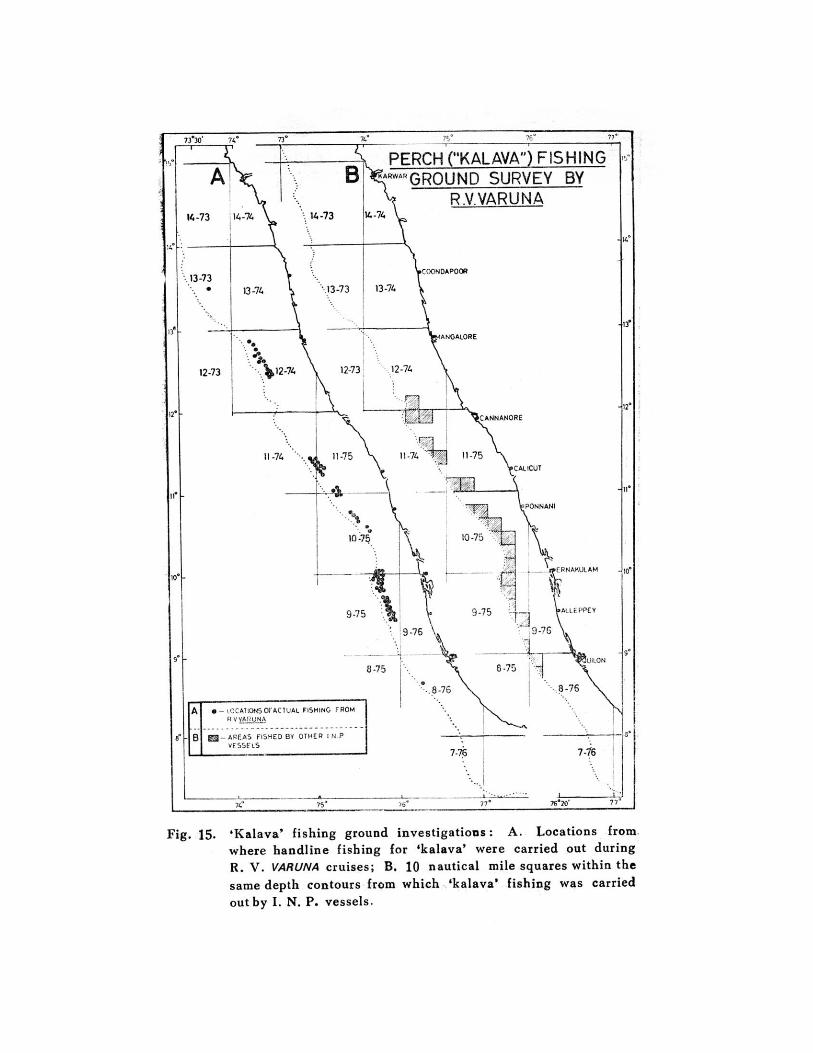

55
It was felt that use of the echo sounders alone may not help in making a rapid survey as this
instrument recorded only the grounds over which the vessel passed. However, the combined use of Sonar
(ASDIC) and the echo sounders greatly facilitated this work. The ASDIC on R.V. VARUNA which has
a horizontal range of 1500 metres could scan 1800, from broad on port beam to broad on starboard
beam. Once the sonar recorded any elevated formation above the bottom, the course of the vessel was
changed to pass over the detected feature and this was then automatically recorded by the echosounder.
Unlike traces of the coast line, or submerged reef or ships or boats in the vicinity, or surface or subsurface
fish shoals, the traces obtained of ‘Kalava’ grounds could be told apart by experience. Nevertheless, on
each track course, a few of the grounds detected by the sonar were checked by the echosounders for
confirmation. It may also be stated that these sonar traces of the ‘kalava’ grounds could be told apart from
traces resulting from interferences from the operation of shipboard equipment, such as echosounders
which may be simultaneously working. Plate VII B& C shows an area off Cochin where the grounds are
many and closely situated as seen from ASDIC trace. Figure A in the same plate shows the ASDIC
recordings as the vessels slowed down and approached the ground. Plates VIII B-C and IX shows
echograms (on wet and dry paper) while fishing is in progress.
In the case of the echosounders, air bubbles underneath the ships hull were observed to prevent
the efficient propagation of sound impulses. This could cause remarkable falling off in the efficiency of the
echosounder. This was very marked when the ship went astern, while trying manouvre against the vessel’s
drift away from the ground. The use of more than one echo sounder in the vessel at the same time also
caused interference marks on the echograms, but these were easily distinguishable. In plates VIII and IX,
the gaps in the bottom profile marked ‘G’ denote to periods when the vessel went astern to prevent drifting
away from the ground while fishing was in progress. It will also be seen from the echograms given in plate
VIII that the speed of the vessel has to be known correctly in order to get an idea of the width or length of
a ground over which the vessel passes.
The method of estimating the number of ‘kalava’ grounds with
the ASDIC was as follows. The horizontal range being 1500 metres, a strip
56
three kilometers wide can be scanned and if the vessel on a track course covers 10 km this would enable
an area of 30 sq.km. to be surveyed in this manner. The position, the track course, time at start, depth,
speed of the vessel were noted at commencement of each sonar cum sounding track and depth and time
were noted whenever grounds were detected. This gave an idea of the frequency of occurrence of the
grounds. When a ground was detected by the sonar on the portside or starboard side or ahead of the
vessel, the depth recorded at that time by the echo sounder did not indicate the actual depth where the
ground was located. However, this has been checked on several occasions and found to be never more
than plus or minus 5 metres. Generally it was one to two metres plus or minus in the depth range of 75 to
100 metres.
In the depth range 75 to 100 metres, the features detected by the Sonar and checked by the
echosounder have always turned out to be ‘Kalava’ grounds. On several occasions, the vessel after
passing over the ground has circled it to determine its extent. Often a floating buoy with sinkers tied to a
rope to anchor it was thrown out over the ground to mark the place and a few minutes fishing was done to
check the results. The methods outlined above indicated clearly the importance of using both sonar and
echo sounders for the detection of the grounds and their being surveyed rapidly. The work involved
continuous attention to the ASDIC and echo sounders for lengthy periods. Even so nothing would succeed
without the close understanding and full cooperation of the skipper of the vessels. In this I was fortunate to
work with Captain Sven M. Satrae and Captain Sankarankutty of the I.N.P., without whose help this
survey would not have been possible.
NATURE OF ‘KALAVA’ GROUNDS
Echo surveys of the 75-100 metre depth range showed that hard bottom was characteristic of
most places along the south-west coast, especially between 80 N and 130 N. The ‘kalava’ grounds here are
small areas of hard bottom with shallow ridge-like features or outcrops which rise two to five metres from
ground level and have a very irregular profile. This appears to be a peculiar geological feature of the
continental shelf off the south-west coast of India. Such outcrops do not form extensive
57
beds but occur in patches and in some places, such as off Cochin, several of these may appear in one track
of the vessel (Plate VIII, B&C). In area too, they show considerable differences some being hardly a few
metres across, while good grounds may be more extensive, often a hundred metres or so across. If the
ground is small, by the time the first cast is hauled, the vessel may have drifted away from it. The process
of getting back on to the ground may often involve circling the ground and echograms taken during such
searching have shown that each ground is separated from the adjacent one by ‘level hard bottom’. Again,
between 80 N to 90 N the grounds tend to be more in the form of less elevated boulders or boulder-like
formations, and their numbers are also relatively more than the disjunct outcrops seen further north. In fact,
the grounds seen around 80 N are smaller in area and more akin to those seen in the Wadge Bank.
The rock cods and other gregarious fish were found to congregate around such outcrops and
detection of ‘kalava’ grounds would be considerably facilitated if the fishing vessels are equipped with
Sonar (ASDIC)and echo sounders. Fortunately, R.V. VARUNA has been ideally equipped to undertake
such investigations.
DETAILS OF FISHING OPERATIONS
Three lines were used from the starboard side of R.V. VARUNA (Plate V, A-C) and one kept in
reserve and rarely used. The hooks were tied to 8 short snoods placed slightly apart at the end of line
which was weighted by a lead weight or an iron piece of approximately 2 kg. The bait used was any trash
fish or cut pieces of ‘Kalava’. However , fish have been landed even with cotton waste or rags
attached to the hooks. The time taken for the line to be reeled out and touch the bottom as well as hauling
time have been noted. The former took about 40 to 50 seconds when the depth was around 90 metres.
The hauling time varied depending on several factors. When three or more fish were hooked the
average time taken for reeling in a line from 90 metre depth was about 2 minutes at the start of fishing and
may be as much as three minutes after a couple of hours of good fishing. Thus as hauling in
was done manually a uniform level or efficiency could not be expected from the team of two
men operating each line. Usually a third man would help to remove the fish from
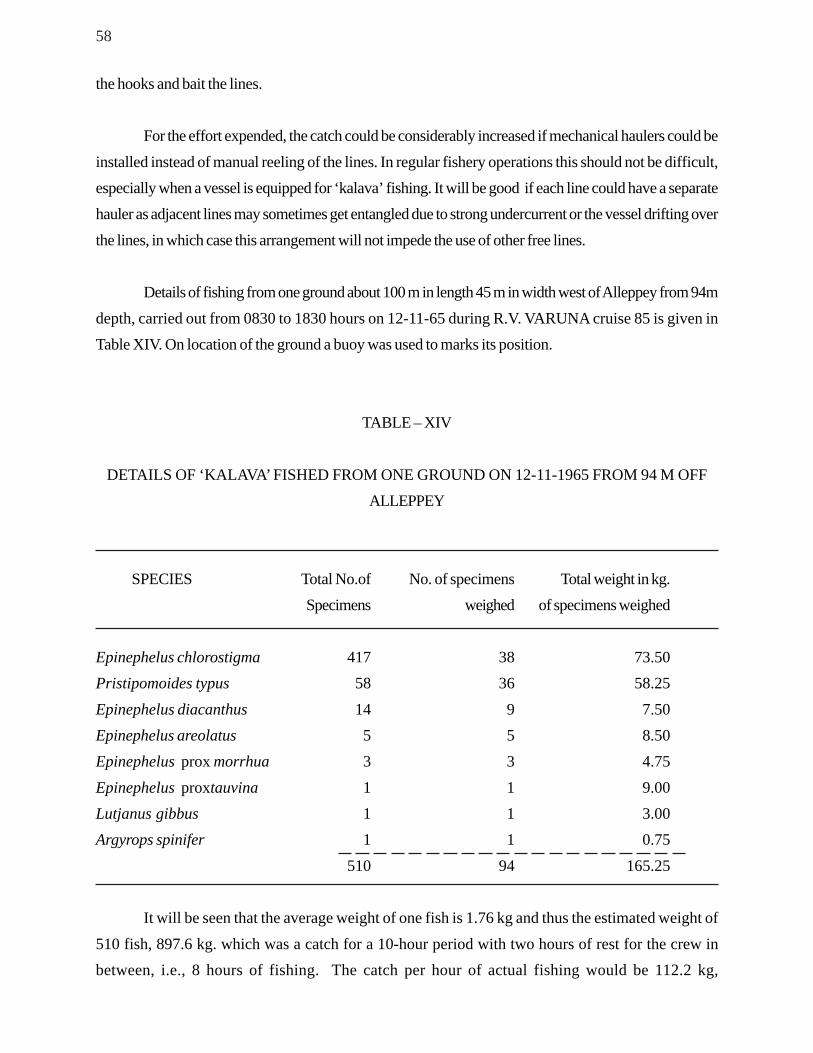
58
the hooks and bait the lines.
For the effort expended, the catch could be considerably increased if mechanical haulers could beinstalled instead of manual reeling of the lines. In regular fishery operations this should not be difficult,especially when a vessel is equipped for ‘kalava’ fishing. It will be good if each line could have a separatehauler as adjacent lines may sometimes get entangled due to strong undercurrent or the vessel drifting overthe lines, in which case this arrangement will not impede the use of other free lines.
Details of fishing from one ground about 100 m in length 45 m in width west of Alleppey from 94mdepth, carried out from 0830 to 1830 hours on 12-11-65 during R.V. VARUNA cruise 85 is given inTable XIV. On location of the ground a buoy was used to marks its position.
TABLE – XIV
DETAILS OF ‘KALAVA’ FISHED FROM ONE GROUND ON 12-11-1965 FROM 94 M OFFALLEPPEY
SPECIES Total No.of No. of specimens Total weight in kg.Specimens weighed of specimens weighed
Epinephelus chlorostigma 417 38 73.50Pristipomoides typus 58 36 58.25Epinephelus diacanthus 14 9 7.50Epinephelus areolatus 5 5 8.50Epinephelus prox morrhua 3 3 4.75Epinephelus proxtauvina 1 1 9.00Lutjanus gibbus 1 1 3.00Argyrops spinifer 1 1 0.75
510 94 165.25
It will be seen that the average weight of one fish is 1.76 kg and thus the estimated weight of510 fish, 897.6 kg. which was a catch for a 10-hour period with two hours of rest for the crew inbetween, i.e., 8 hours of fishing. The catch per hour of actual fishing would be 112.2 kg,
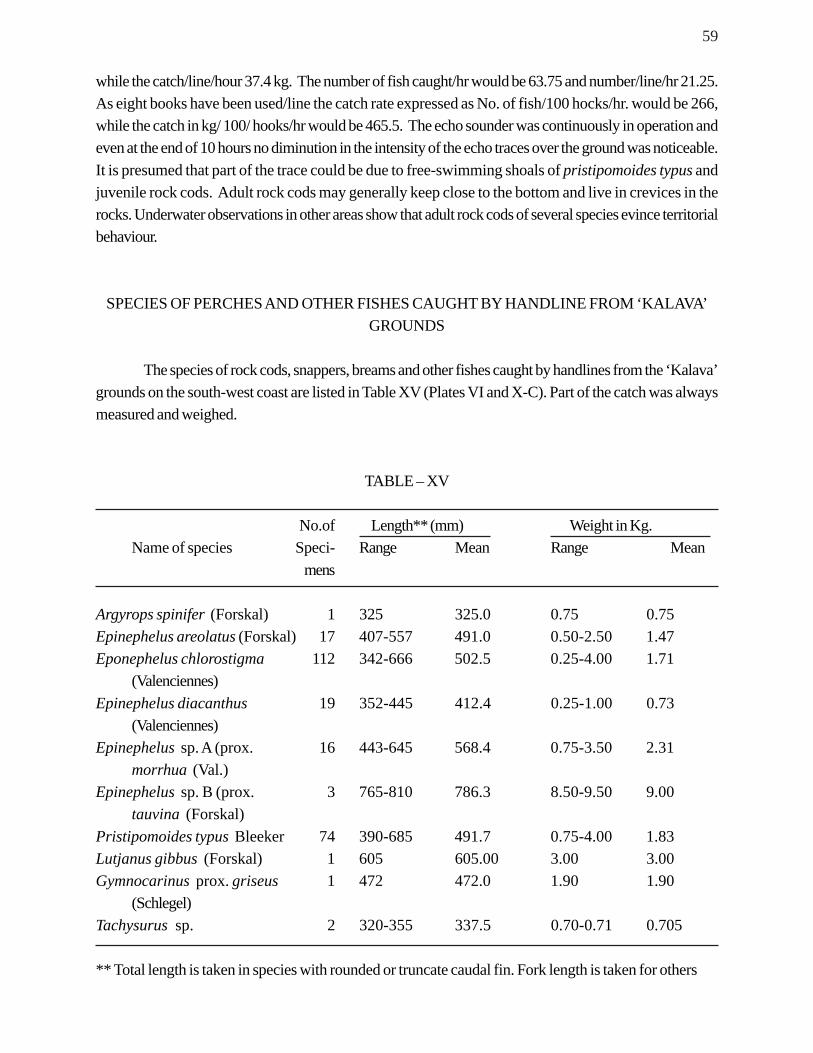
59
while the catch/line/hour 37.4 kg. The number of fish caught/hr would be 63.75 and number/line/hr 21.25.As eight books have been used/line the catch rate expressed as No. of fish/100 hocks/hr. would be 266,while the catch in kg/ 100/ hooks/hr would be 465.5. The echo sounder was continuously in operation andeven at the end of 10 hours no diminution in the intensity of the echo traces over the ground was noticeable.It is presumed that part of the trace could be due to free-swimming shoals of pristipomoides typus andjuvenile rock cods. Adult rock cods may generally keep close to the bottom and live in crevices in therocks. Underwater observations in other areas show that adult rock cods of several species evince territorialbehaviour.
SPECIES OF PERCHES AND OTHER FISHES CAUGHT BY HANDLINE FROM ‘KALAVA’GROUNDS
The species of rock cods, snappers, breams and other fishes caught by handlines from the ‘Kalava’grounds on the south-west coast are listed in Table XV (Plates VI and X-C). Part of the catch was alwaysmeasured and weighed.
TABLE – XV
No.of Length** (mm) Weight in Kg.Name of species Speci- Range Mean Range Mean
mens
Argyrops spinifer (Forskal) 1 325 325.0 0.75 0.75Epinephelus areolatus (Forskal) 17 407-557 491.0 0.50-2.50 1.47Eponephelus chlorostigma 112 342-666 502.5 0.25-4.00 1.71
(Valenciennes)Epinephelus diacanthus 19 352-445 412.4 0.25-1.00 0.73
(Valenciennes)Epinephelus sp. A (prox. 16 443-645 568.4 0.75-3.50 2.31
morrhua (Val.)Epinephelus sp. B (prox. 3 765-810 786.3 8.50-9.50 9.00
tauvina (Forskal)Pristipomoides typus Bleeker 74 390-685 491.7 0.75-4.00 1.83Lutjanus gibbus (Forskal) 1 605 605.00 3.00 3.00Gymnocarinus prox. griseus 1 472 472.0 1.90 1.90
(Schlegel)Tachysurus sp. 2 320-355 337.5 0.70-0.71 0.705
** Total length is taken in species with rounded or truncate caudal fin. Fork length is taken for others
60
As the samples measured and weighed had been caught from different grounds at different times,
a fair idea of the average length and weight of the more common species in the catch may be obtained from
the data given in Table XIV. This would show that for the species more frequently occurring in the catch (E.
aerolatus, E. chlorostigma, E. diacanthus, E. prox. morrhua and P. typus) the average length of a fish
in the catch would be 493.3 mm and the average weight 1.61 kg. If all species were taken into consideration
the average length would be 499.18 mm and the average weight 2.34 kg.
E. chlorostigma was the most common species in the catch occurring in almost all grounds. Next
in importance was Pristipomoides typus which was found to be predominant in the catch in some grounds
especially north of 110 N. E. prox. morrhua, another large species, which occurred regularly, but in fewer
numbers the E. chlorostigma, E. aerolatus and E. diacanthus, the last mentioned being the smallest of
the species of rock cods caught from these grounds.
Some aspects of the biology of the species, especially maturity, fecundity and spawning periodicity,
are under study. Investigations on the food of ‘kalava’ has not been very successful, as the stomachs in
most of the fish brought up from depths were everted (Plate V, C) or the contents of the stomach were
spewed out when the fish were removed from the hooks. Neverthless, it has been possible to gather some
information on the food of these fishes. Briefly stated, the species were found to feed on crustaceans
(Charybdis (G) edwardsi, Munidopsis spp., etc.) and fishes (Scorpaenidae) mainly.
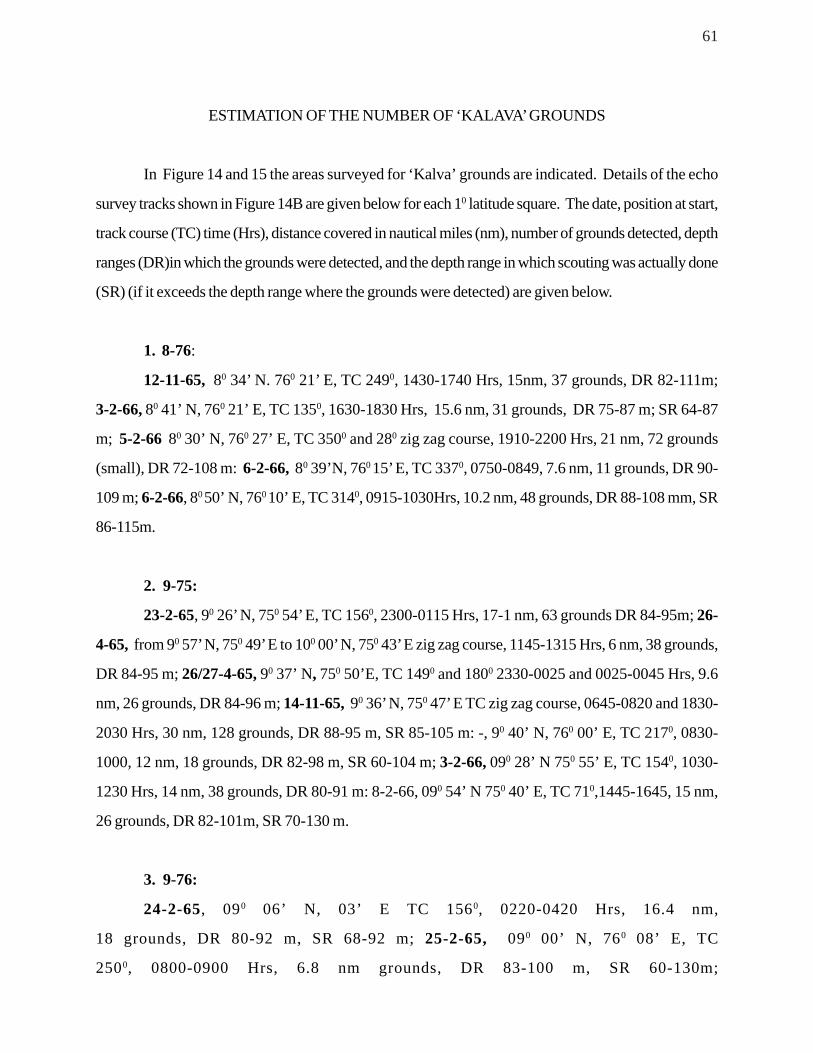
61
ESTIMATION OF THE NUMBER OF ‘KALAVA’ GROUNDS
In Figure 14 and 15 the areas surveyed for ‘Kalva’ grounds are indicated. Details of the echo
survey tracks shown in Figure 14B are given below for each 10 latitude square. The date, position at start,
track course (TC) time (Hrs), distance covered in nautical miles (nm), number of grounds detected, depth
ranges (DR)in which the grounds were detected, and the depth range in which scouting was actually done
(SR) (if it exceeds the depth range where the grounds were detected) are given below.
1. 8-76:
12-11-65, 80 34’ N. 760 21’ E, TC 2490, 1430-1740 Hrs, 15nm, 37 grounds, DR 82-111m;
3-2-66, 80 41’ N, 760 21’ E, TC 1350, 1630-1830 Hrs, 15.6 nm, 31 grounds, DR 75-87 m; SR 64-87
m; 5-2-66 80 30’ N, 760 27’ E, TC 3500 and 280 zig zag course, 1910-2200 Hrs, 21 nm, 72 grounds
(small), DR 72-108 m: 6-2-66, 80 39’N, 760 15’ E, TC 3370, 0750-0849, 7.6 nm, 11 grounds, DR 90-
109 m; 6-2-66, 80 50’ N, 760 10’ E, TC 3140, 0915-1030Hrs, 10.2 nm, 48 grounds, DR 88-108 mm, SR
86-115m.
2. 9-75:
23-2-65, 90 26’ N, 750 54’ E, TC 1560, 2300-0115 Hrs, 17-1 nm, 63 grounds DR 84-95m; 26-
4-65, from 90 57’ N, 750 49’ E to 100 00’ N, 750 43’ E zig zag course, 1145-1315 Hrs, 6 nm, 38 grounds,
DR 84-95 m; 26/27-4-65, 90 37’ N, 750 50’E, TC 1490 and 1800 2330-0025 and 0025-0045 Hrs, 9.6
nm, 26 grounds, DR 84-96 m; 14-11-65, 90 36’ N, 750 47’ E TC zig zag course, 0645-0820 and 1830-
2030 Hrs, 30 nm, 128 grounds, DR 88-95 m, SR 85-105 m: -, 90 40’ N, 760 00’ E, TC 2170, 0830-
1000, 12 nm, 18 grounds, DR 82-98 m, SR 60-104 m; 3-2-66, 090 28’ N 750 55’ E, TC 1540, 1030-
1230 Hrs, 14 nm, 38 grounds, DR 80-91 m: 8-2-66, 090 54’ N 750 40’ E, TC 710,1445-1645, 15 nm,
26 grounds, DR 82-101m, SR 70-130 m.
3. 9-76:
24-2-65, 090 06’ N, 03’ E TC 1560, 0220-0420 Hrs, 16.4 nm,
18 grounds, DR 80-92 m, SR 68-92 m; 25-2-65, 090 00’ N, 760 08’ E, TC
2500, 0800-0900 Hrs, 6.8 nm grounds, DR 83-100 m, SR 60-130m;
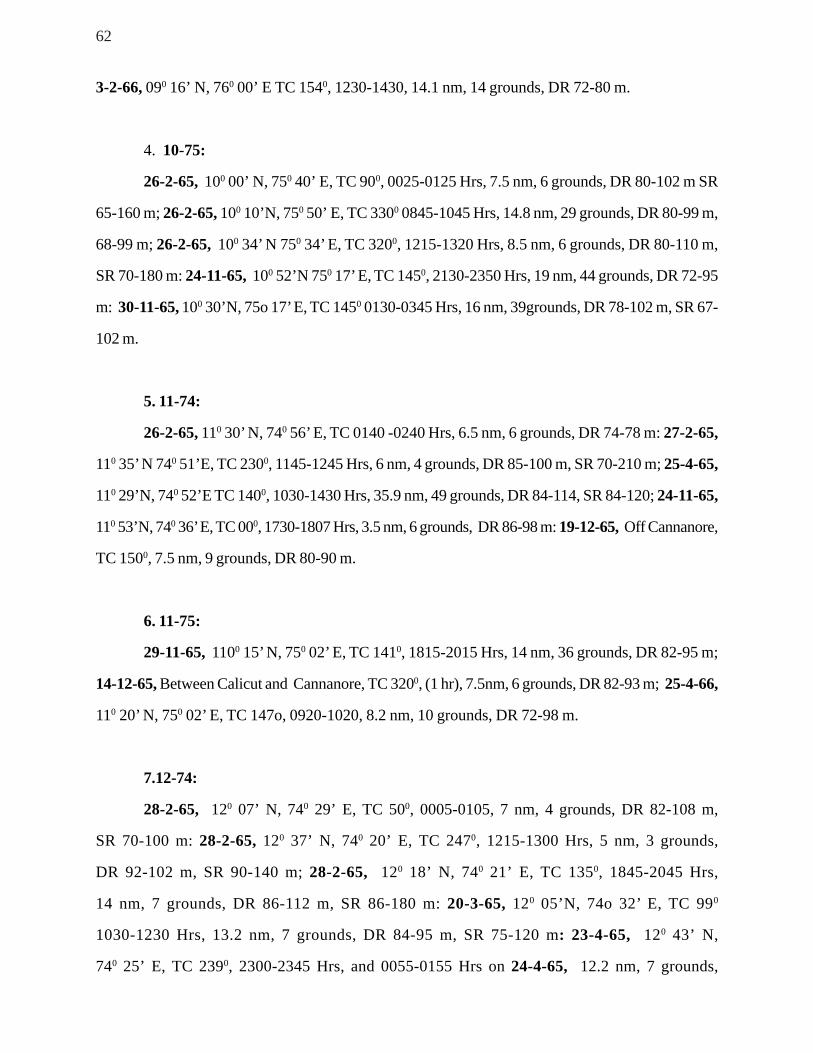
62
3-2-66, 090 16’ N, 760 00’ E TC 1540, 1230-1430, 14.1 nm, 14 grounds, DR 72-80 m.
4. 10-75:
26-2-65, 100 00’ N, 750 40’ E, TC 900, 0025-0125 Hrs, 7.5 nm, 6 grounds, DR 80-102 m SR
65-160 m; 26-2-65, 100 10’N, 750 50’ E, TC 3300 0845-1045 Hrs, 14.8 nm, 29 grounds, DR 80-99 m,
68-99 m; 26-2-65, 100 34’ N 750 34’ E, TC 3200, 1215-1320 Hrs, 8.5 nm, 6 grounds, DR 80-110 m,
SR 70-180 m: 24-11-65, 100 52’N 750 17’ E, TC 1450, 2130-2350 Hrs, 19 nm, 44 grounds, DR 72-95
m: 30-11-65, 100 30’N, 75o 17’ E, TC 1450 0130-0345 Hrs, 16 nm, 39grounds, DR 78-102 m, SR 67-
102 m.
5. 11-74:
26-2-65, 110 30’ N, 740 56’ E, TC 0140 -0240 Hrs, 6.5 nm, 6 grounds, DR 74-78 m: 27-2-65,
110 35’ N 740 51’E, TC 2300, 1145-1245 Hrs, 6 nm, 4 grounds, DR 85-100 m, SR 70-210 m; 25-4-65,
110 29’N, 740 52’E TC 1400, 1030-1430 Hrs, 35.9 nm, 49 grounds, DR 84-114, SR 84-120; 24-11-65,
110 53’N, 740 36’ E, TC 000, 1730-1807 Hrs, 3.5 nm, 6 grounds, DR 86-98 m: 19-12-65, Off Cannanore,
TC 1500, 7.5 nm, 9 grounds, DR 80-90 m.
6. 11-75:
29-11-65, 1100 15’ N, 750 02’ E, TC 1410, 1815-2015 Hrs, 14 nm, 36 grounds, DR 82-95 m;
14-12-65, Between Calicut and Cannanore, TC 3200, (1 hr), 7.5nm, 6 grounds, DR 82-93 m; 25-4-66,
110 20’ N, 750 02’ E, TC 147o, 0920-1020, 8.2 nm, 10 grounds, DR 72-98 m.
7.12-74:
28-2-65, 120 07’ N, 740 29’ E, TC 500, 0005-0105, 7 nm, 4 grounds, DR 82-108 m,
SR 70-100 m: 28-2-65, 120 37’ N, 740 20’ E, TC 2470, 1215-1300 Hrs, 5 nm, 3 grounds,
DR 92-102 m, SR 90-140 m; 28-2-65, 120 18’ N, 740 21’ E, TC 1350, 1845-2045 Hrs,
14 nm, 7 grounds, DR 86-112 m, SR 86-180 m: 20-3-65, 120 05’N, 74o 32’ E, TC 990
1030-1230 Hrs, 13.2 nm, 7 grounds, DR 84-95 m, SR 75-120 m: 23-4-65, 120 43’ N,
740 25’ E, TC 2390, 2300-2345 Hrs, and 0055-0155 Hrs on 24-4-65, 12.2 nm, 7 grounds,
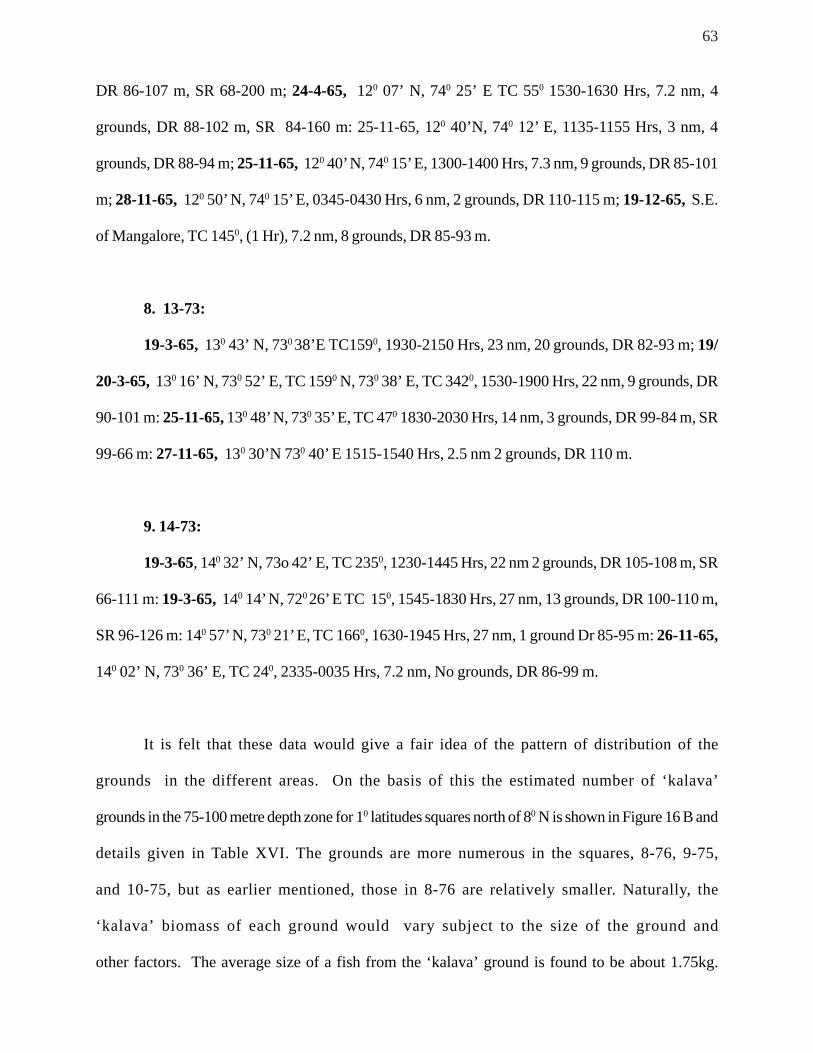
63
DR 86-107 m, SR 68-200 m; 24-4-65, 120 07’ N, 740 25’ E TC 550 1530-1630 Hrs, 7.2 nm, 4
grounds, DR 88-102 m, SR 84-160 m: 25-11-65, 120 40’N, 740 12’ E, 1135-1155 Hrs, 3 nm, 4
grounds, DR 88-94 m; 25-11-65, 120 40’ N, 740 15’ E, 1300-1400 Hrs, 7.3 nm, 9 grounds, DR 85-101
m; 28-11-65, 120 50’ N, 740 15’ E, 0345-0430 Hrs, 6 nm, 2 grounds, DR 110-115 m; 19-12-65, S.E.
of Mangalore, TC 1450, (1 Hr), 7.2 nm, 8 grounds, DR 85-93 m.
8. 13-73:
19-3-65, 130 43’ N, 730 38’E TC1590, 1930-2150 Hrs, 23 nm, 20 grounds, DR 82-93 m; 19/
20-3-65, 130 16’ N, 730 52’ E, TC 1590 N, 730 38’ E, TC 3420, 1530-1900 Hrs, 22 nm, 9 grounds, DR
90-101 m: 25-11-65, 130 48’ N, 730 35’ E, TC 470 1830-2030 Hrs, 14 nm, 3 grounds, DR 99-84 m, SR
99-66 m: 27-11-65, 130 30’N 730 40’ E 1515-1540 Hrs, 2.5 nm 2 grounds, DR 110 m.
9. 14-73:
19-3-65, 140 32’ N, 73o 42’ E, TC 2350, 1230-1445 Hrs, 22 nm 2 grounds, DR 105-108 m, SR
66-111 m: 19-3-65, 140 14’ N, 720 26’ E TC 150, 1545-1830 Hrs, 27 nm, 13 grounds, DR 100-110 m,
SR 96-126 m: 140 57’ N, 730 21’ E, TC 1660, 1630-1945 Hrs, 27 nm, 1 ground Dr 85-95 m: 26-11-65,
140 02’ N, 730 36’ E, TC 240, 2335-0035 Hrs, 7.2 nm, No grounds, DR 86-99 m.
It is felt that these data would give a fair idea of the pattern of distribution of the
grounds in the different areas. On the basis of this the estimated number of ‘kalava’
grounds in the 75-100 metre depth zone for 10 latitudes squares north of 80 N is shown in Figure 16 B and
details given in Table XVI. The grounds are more numerous in the squares, 8-76, 9-75,
and 10-75, but as earlier mentioned, those in 8-76 are relatively smaller. Naturally, the
‘kalava’ biomass of each ground would vary subject to the size of the ground and
other factors. The average size of a fish from the ‘kalava’ ground is found to be about 1.75kg.
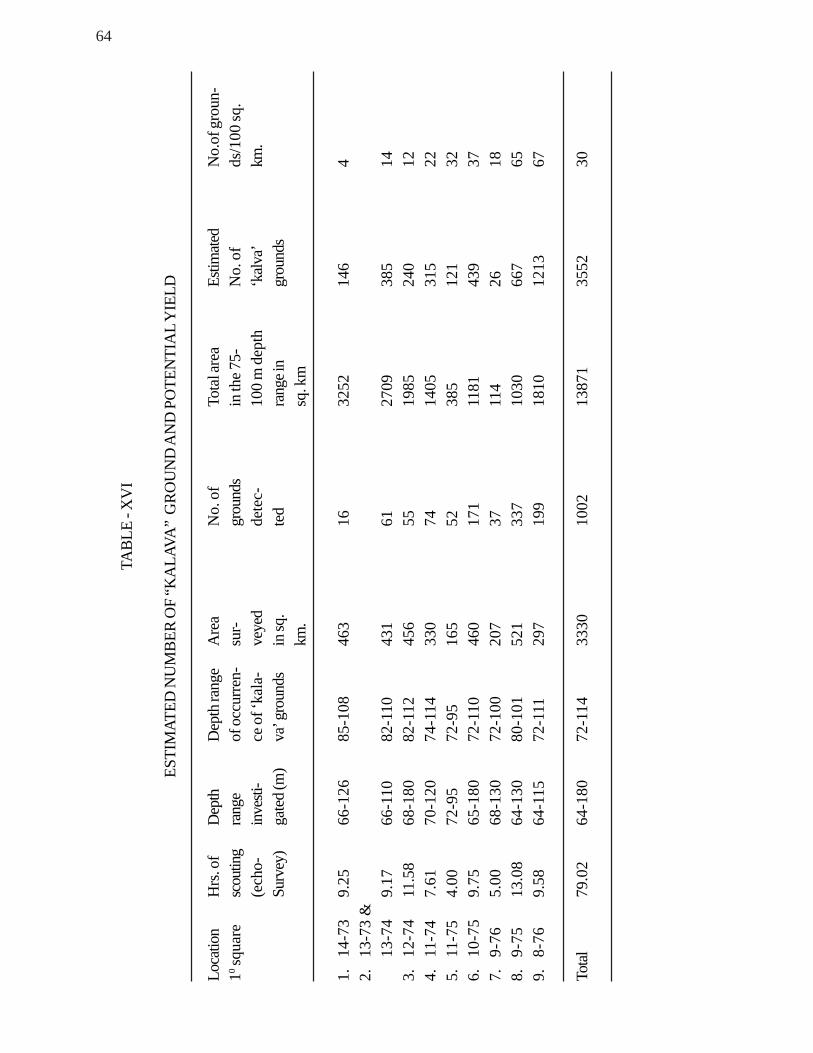
64
TABL
E - X
VI
ESTI
MAT
ED N
UM
BER
OF
“KA
LAVA
” G
ROU
ND
AN
D P
OTE
NTI
AL
YIE
LD
Loca
tion
Hrs
. of
Dep
thD
epth
rang
eA
rea
No.
of
Tota
l are
aEs
timate
dN
o.of
gro
un-
10 squ
are
scou
ting
rang
eof
occ
urre
n-su
r-gr
ound
sin
the 7
5-N
o. o
fds
/100
sq.
(ech
o-in
vesti
-ce
of ‘
kala
-ve
yed
dete
c-10
0 m
dep
th‘k
alva’
km.
Surv
ey)
gate
d (m
)va
’ gro
unds
in sq
.te
dra
nge i
ngr
ound
skm
.sq
. km
1.14
-73
9.25
66-1
2685
-108
463
1632
5214
64
2.13
-73
&13
-74
9.17
66-1
1082
-110
431
6127
0938
514
3.12
-74
11.5
868
-180
82-1
1245
655
1985
240
124.
11-7
47.
6170
-120
74-1
1433
074
1405
315
225.
11-7
54.
0072
-95
72-9
516
552
385
121
326.
10-7
59.
7565
-180
72-1
1046
017
111
8143
937
7.9-
765.
0068
-130
72-1
0020
737
114
2618
8.9-
7513
.08
64-1
3080
-101
521
337
1030
667
659.
8-76
9.58
64-1
1572
-111
297
199
1810
1213
67
Total
79.0
264
-180
72-1
1433
3010
0213
871
3552
30
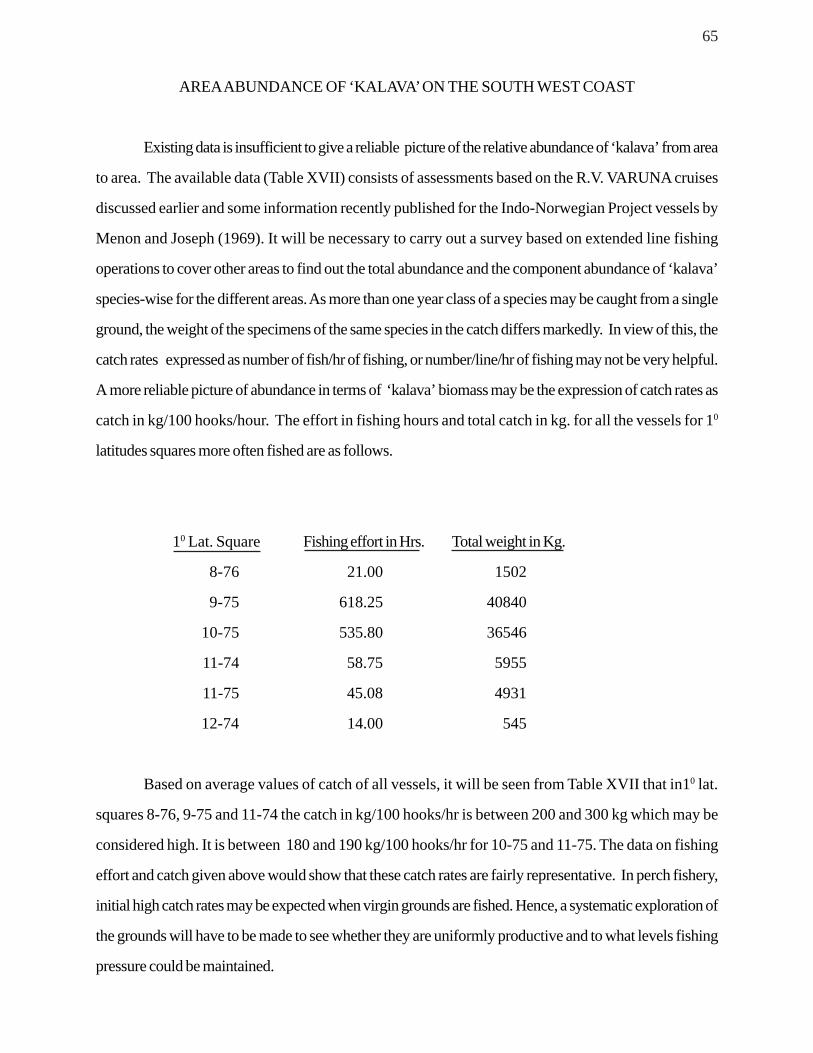
65
AREA ABUNDANCE OF ‘KALAVA’ ON THE SOUTH WEST COAST
Existing data is insufficient to give a reliable picture of the relative abundance of ‘kalava’ from area
to area. The available data (Table XVII) consists of assessments based on the R.V. VARUNA cruises
discussed earlier and some information recently published for the Indo-Norwegian Project vessels by
Menon and Joseph (1969). It will be necessary to carry out a survey based on extended line fishing
operations to cover other areas to find out the total abundance and the component abundance of ‘kalava’
species-wise for the different areas. As more than one year class of a species may be caught from a single
ground, the weight of the specimens of the same species in the catch differs markedly. In view of this, the
catch rates expressed as number of fish/hr of fishing, or number/line/hr of fishing may not be very helpful.
A more reliable picture of abundance in terms of ‘kalava’ biomass may be the expression of catch rates as
catch in kg/100 hooks/hour. The effort in fishing hours and total catch in kg. for all the vessels for 10
latitudes squares more often fished are as follows.
10 Lat. Square Fishing effort in Hrs. Total weight in Kg.
8-76 21.00 1502
9-75 618.25 40840
10-75 535.80 36546
11-74 58.75 5955
11-75 45.08 4931
12-74 14.00 545
Based on average values of catch of all vessels, it will be seen from Table XVII that in10 lat.
squares 8-76, 9-75 and 11-74 the catch in kg/100 hooks/hr is between 200 and 300 kg which may be
considered high. It is between 180 and 190 kg/100 hooks/hr for 10-75 and 11-75. The data on fishing
effort and catch given above would show that these catch rates are fairly representative. In perch fishery,
initial high catch rates may be expected when virgin grounds are fished. Hence, a systematic exploration of
the grounds will have to be made to see whether they are uniformly productive and to what levels fishing
pressure could be maintained.
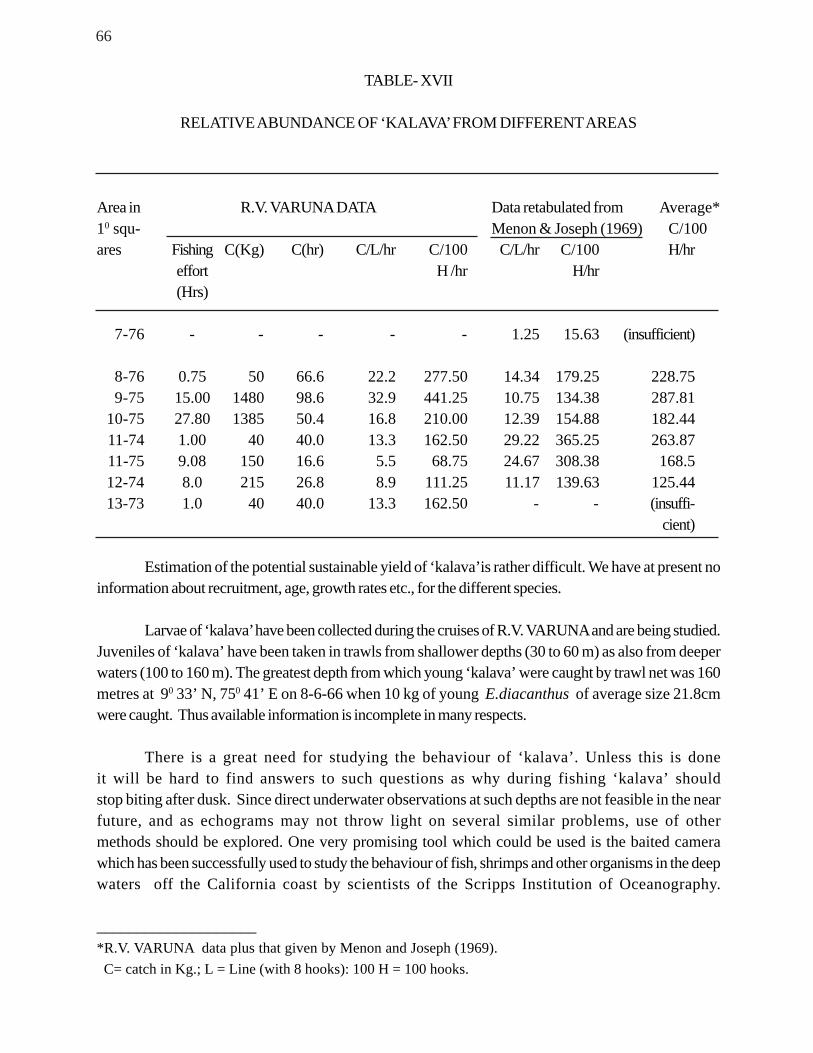
66
TABLE- XVII
RELATIVE ABUNDANCE OF ‘KALAVA’ FROM DIFFERENT AREAS
Area in R.V. VARUNA DATA Data retabulated from Average*10 squ- Menon & Joseph (1969) C/100ares Fishing C(Kg) C(hr) C/L/hr C/100 C/L/hr C/100 H/hr
effort H /hr H/hr(Hrs)
7-76 - - - - - 1.25 15.63 (insufficient)
8-76 0.75 50 66.6 22.2 277.50 14.34 179.25 228.759-75 15.00 1480 98.6 32.9 441.25 10.75 134.38 287.81
10-75 27.80 1385 50.4 16.8 210.00 12.39 154.88 182.4411-74 1.00 40 40.0 13.3 162.50 29.22 365.25 263.8711-75 9.08 150 16.6 5.5 68.75 24.67 308.38 168.512-74 8.0 215 26.8 8.9 111.25 11.17 139.63 125.4413-73 1.0 40 40.0 13.3 162.50 - - (insuffi-
cient)
Estimation of the potential sustainable yield of ‘kalava’is rather difficult. We have at present noinformation about recruitment, age, growth rates etc., for the different species.
Larvae of ‘kalava’ have been collected during the cruises of R.V. VARUNA and are being studied.Juveniles of ‘kalava’ have been taken in trawls from shallower depths (30 to 60 m) as also from deeperwaters (100 to 160 m). The greatest depth from which young ‘kalava’ were caught by trawl net was 160metres at 90 33’ N, 750 41’ E on 8-6-66 when 10 kg of young E.diacanthus of average size 21.8cmwere caught. Thus available information is incomplete in many respects.
There is a great need for studying the behaviour of ‘kalava’. Unless this is doneit will be hard to find answers to such questions as why during fishing ‘kalava’ shouldstop biting after dusk. Since direct underwater observations at such depths are not feasible in the nearfuture, and as echograms may not throw light on several similar problems, use of othermethods should be explored. One very promising tool which could be used is the baited camerawhich has been successfully used to study the behaviour of fish, shrimps and other organisms in the deepwaters off the California coast by scientists of the Scripps Institution of Oceanography.
____________________*R.V. VARUNA data plus that given by Menon and Joseph (1969). C= catch in Kg.; L = Line (with 8 hooks): 100 H = 100 hooks.
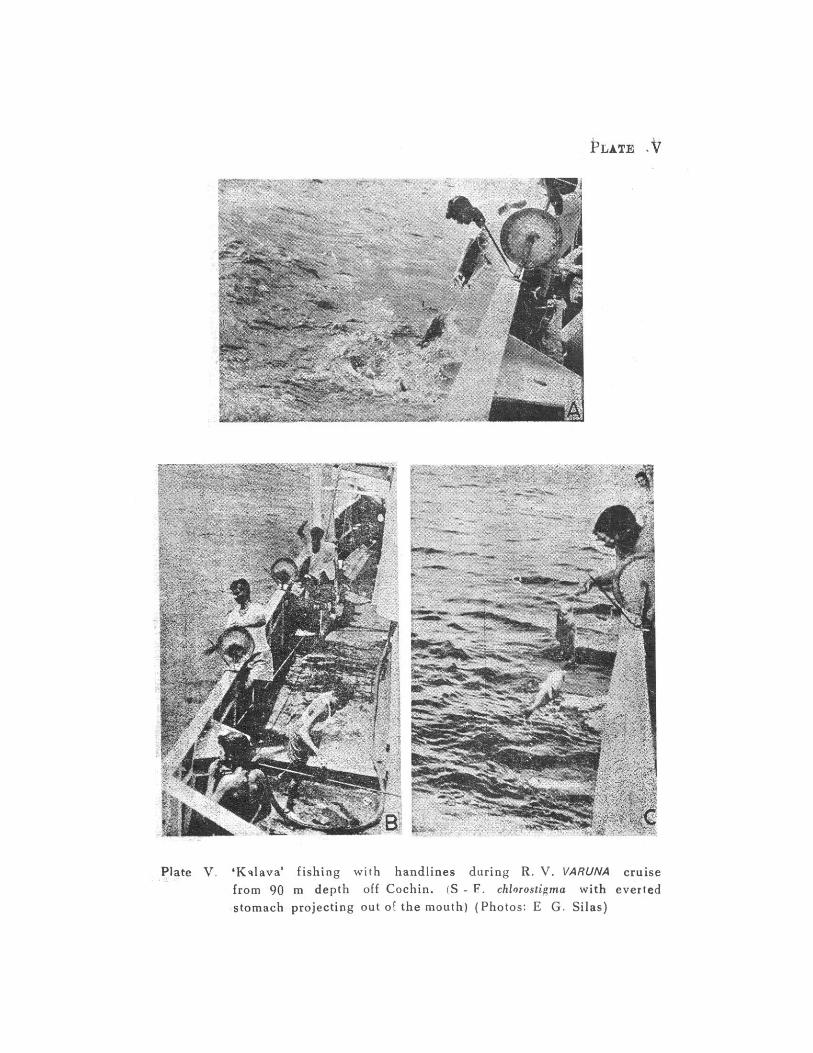
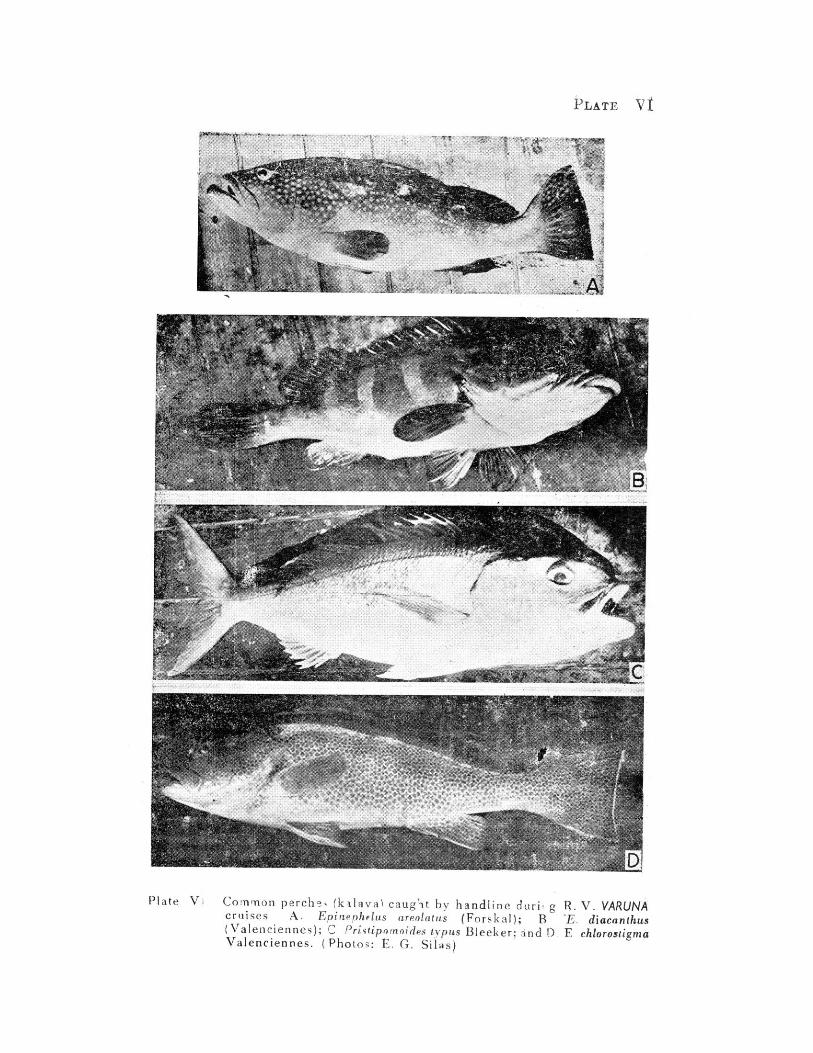
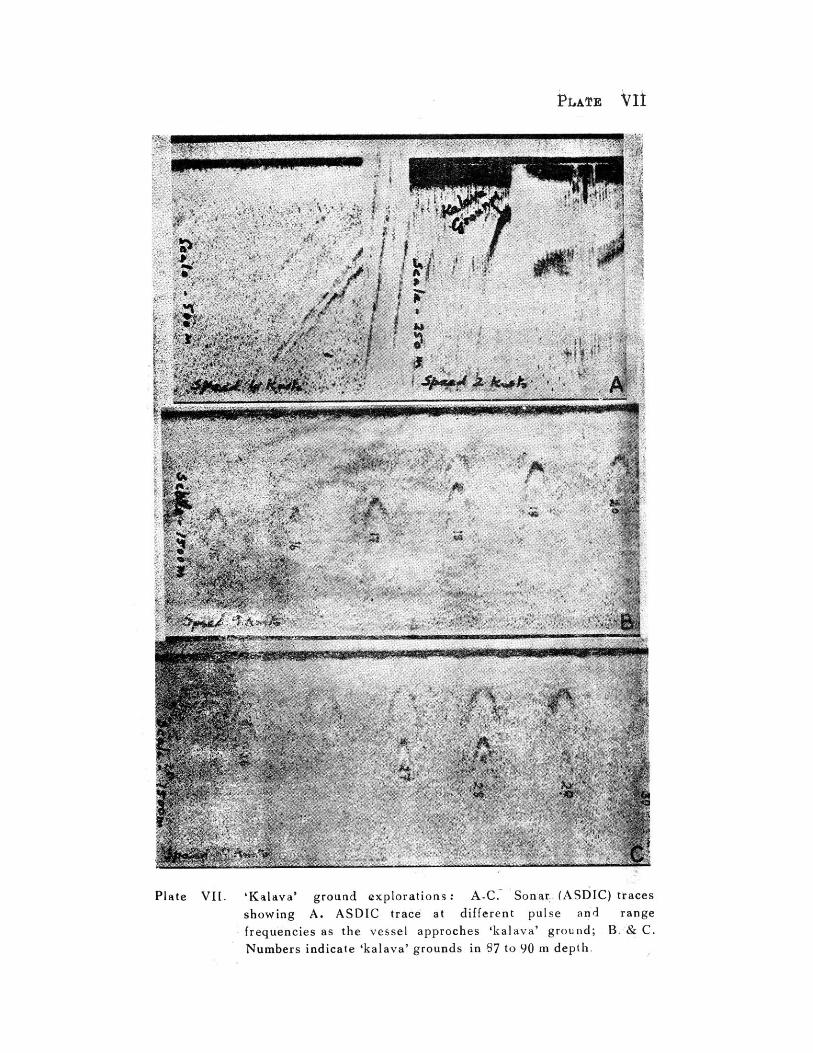
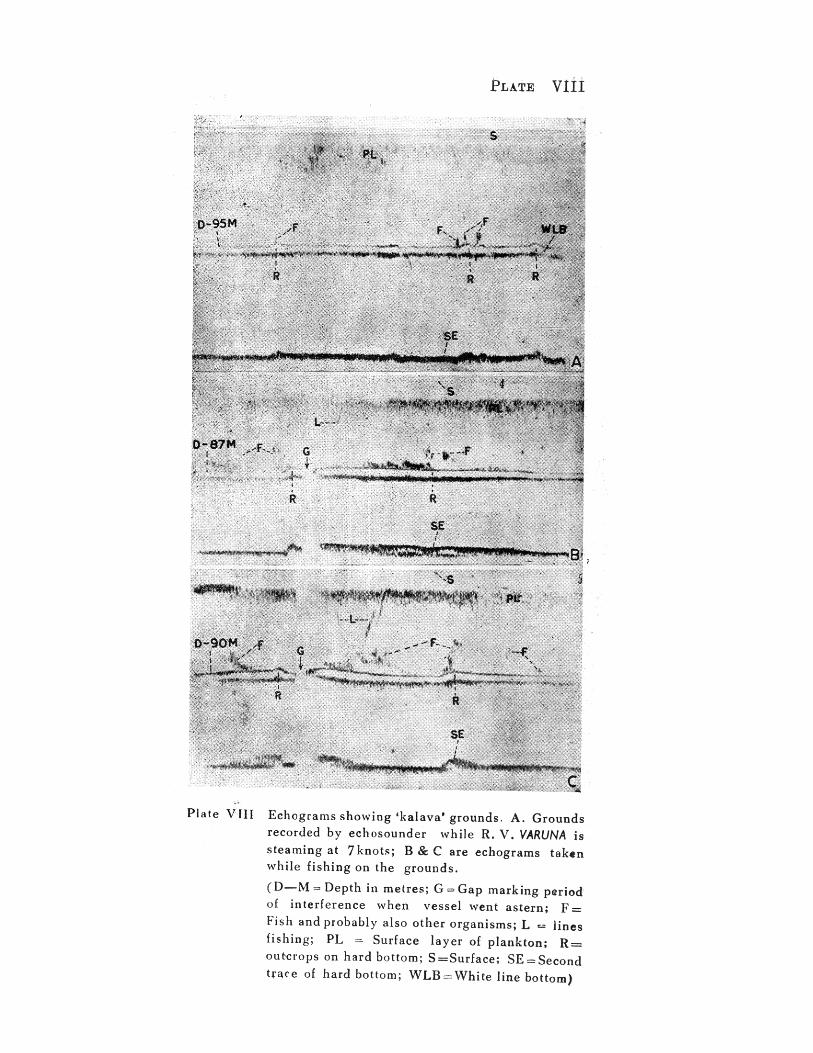
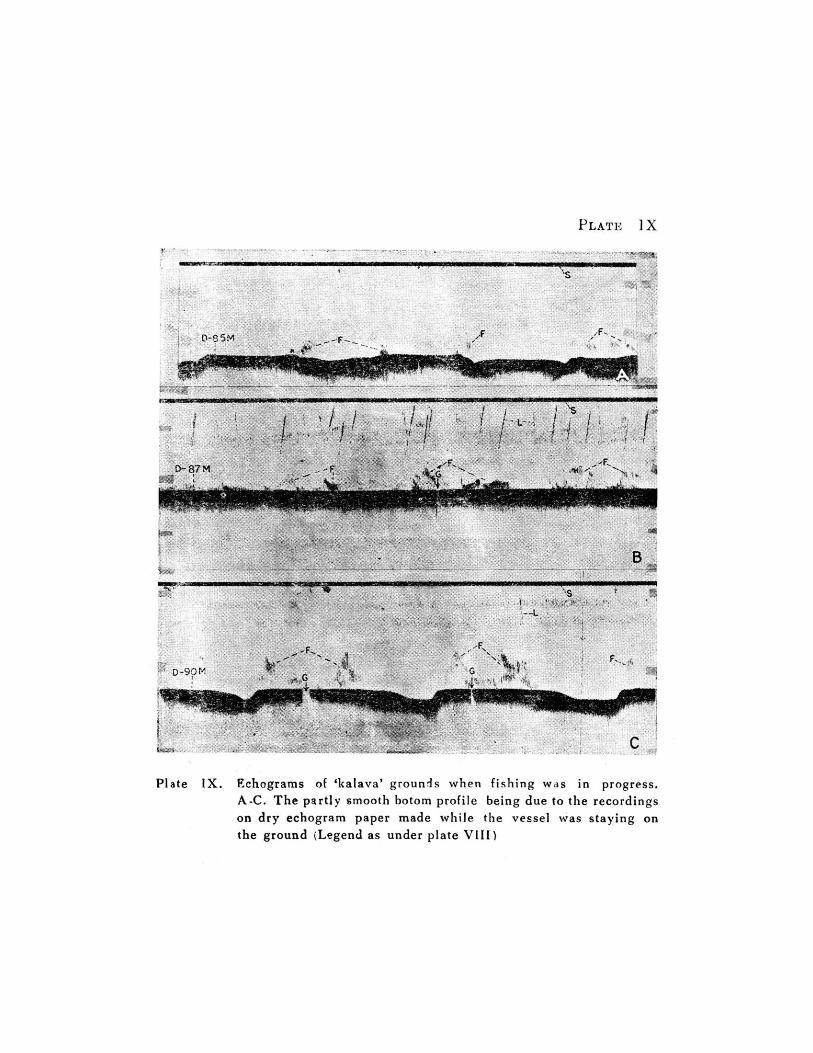

P A R T – III
EXPLORATORY SURVEYS OF THE PELAGIC AND OCEANIC FISHERIES OF THEEASTERN PART OF THE ARABIAN SEA AND THE LACCADIVE SEA

67
PELAGIC AND OCEANIC FISHERIES
Most of our investigations on pelagic fishes of the Indian Seas deal with studies on the mackerel
and sardine which come under the neritic-pelagic complex. Hardly any exploratory surveys have been
conducted in our offshore and oceanic waters for fishes and other animals which come under the oceanic-
pelagic-complex. The importance of tunas and related fishes, marlins, sailfish and swordfish and their
availability in our waters have been drawn attention to (Jones and Kumaran, 1959; Jones and Silas, 1964;
Silas, 1967: Silas and Rajagopalan 1967). It is well known that Japanese tuna longlines are regularly
operating in the oceanic waters around India. But longlining only taps a small portion of the wast potential
fishery resources of the high seas. Exploratory surveys aimed at discovering new resources or areas of
abundance, finding out the suitability of gears which would improve catches and understanding the
environmental factors effecting the concerned fisheries are essential for developing our oceanic fisheries.
During the cruises of R.V. VARUNA it was possible to plan out different types of exploratory
fishing in the offshore and oceanic areas of which two, namely the drift net fishing and purse-seining, need
special mention. Surface trolling and longlining (Norwegian type) were tried on only a few occasions and
hence are not discussed here. Drift net fishing was started in January 1965 and continued as and when
possible up to the end of January 1968. Purse-seining for tuna was tried by R.V. VARUNA as well as by
M.V. TUNA which worked in association with the research vessel. During the cruises scouting for tuna
with the sonar (ASDIC) (horizontal range 1500 metres) and echosounders were tried and though positive
results were obtained it was found that visual scouting was even more effective, when aided by flocks of
birds, diving or following tuna shoals, which could be spotted at a distance of several miles. The characteristic
sonic spires in the Deep Scattering layer between 300 and 450 meters have been recorded and it is
presumed that these could be caused by large tuna, namely the yellowfin or the big eye. The data
68
from these exploratory surveys are being processed. In the meantime, some of the details of the exploratory
surveys are dealt with under appropriate headings.
EXPLORATORY DRIFT-NET FISHING
A number of units of the drift-net made of nylon was used at a time, each unit being 25.85 metres
long and 6.10 metres broad. In a single unit the mesh size was the same and units with mesh sizes 2.5, 5.5,
10.0, 12.5 and 17.0 cm were used. The smaller mesh sizes were selected specially for obtaining information
about juvenile pelagic fishes of which we know very little. The station position, the number of units used for
each operation, the catch and other details are given in Table XXI. A summary of the details is given
below:
No. of fishing operations ..................... 86
Total soaking time inclusive of shooting
and hauling of net) ............................... 794.50 Hours
Total catch ......................................... 2,522.00 kg.
Mean No. of hrs/fishing operation ....... 9.24 Hours.
Average catch/fishing operation ........... 29.33 kg.
Number of positive operations ............. 72
The number of units of nets used varied from 14 to 45. Drift nets were operated in the Laccadive
Sea as well as on the continental shelf off the south-west coast. The maximum soaking time of the net for
a single operation was 15.00 hrs and the minimum 4 hrs 10 mts. It took approximately 30 to 45 minutes
to shoot 45 units and about 45 minutes to haul the same. Mostly hauling was done manually (Plate X,C).
But on a few cruises, the line hauler on portside was used connected to a drum which would be rotating
and thereby helping in hauling. The effective fishing depth was from surface to between four and five
metres. Consequently, very little or no fish were caught on the three or four days close to the full moon.
During some months, in some of the areas the net became conspicuous by the attachment of luminous
planktonic organisms on such occasions, the catch was invariably very meager.
In Table XVIII a list of the species caught by drift net is given. As the nets were operated in neritic
as well as oceanic waters, the areas of occurrence of the species are also included.
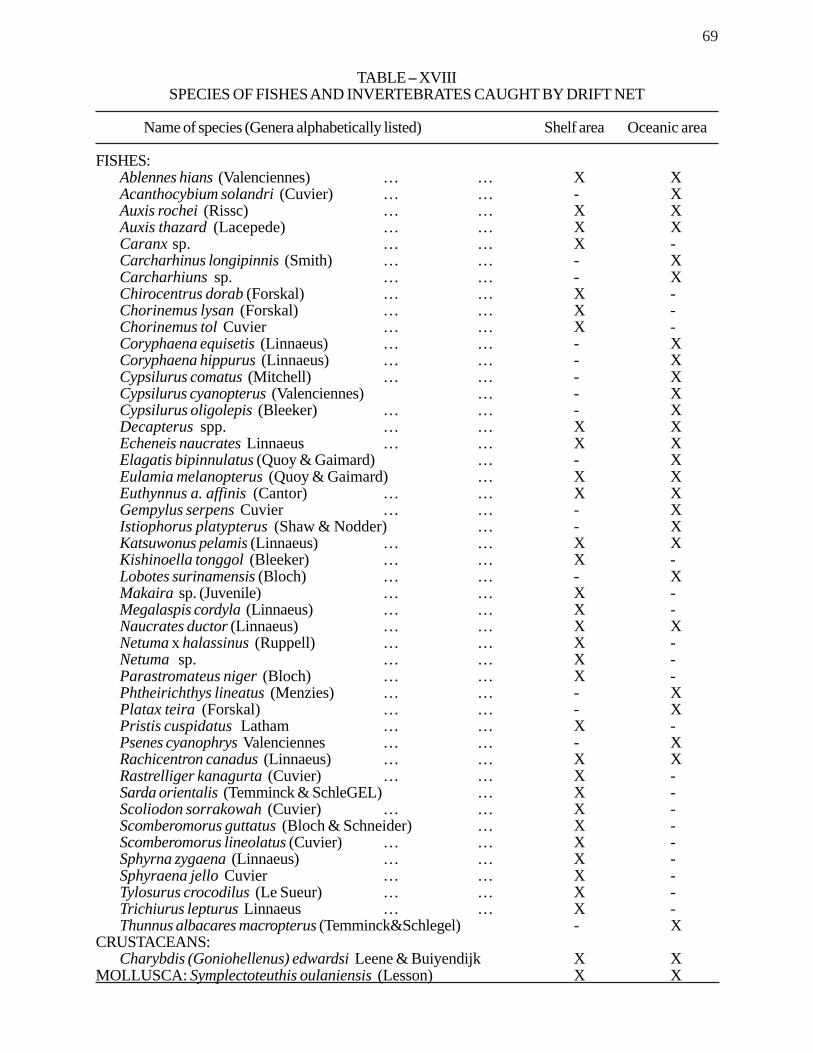
69
TABLE – XVIIISPECIES OF FISHES AND INVERTEBRATES CAUGHT BY DRIFT NET
Name of species (Genera alphabetically listed) Shelf area Oceanic area
FISHES:Ablennes hians (Valenciennes) … … X XAcanthocybium solandri (Cuvier) … … - XAuxis rochei (Rissc) … … X XAuxis thazard (Lacepede) … … X XCaranx sp. … … X -Carcharhinus longipinnis (Smith) … … - XCarcharhiuns sp. … … - XChirocentrus dorab (Forskal) … … X -Chorinemus lysan (Forskal) … … X -Chorinemus tol Cuvier … … X -Coryphaena equisetis (Linnaeus) … … - XCoryphaena hippurus (Linnaeus) … … - XCypsilurus comatus (Mitchell) … … - XCypsilurus cyanopterus (Valenciennes) … - XCypsilurus oligolepis (Bleeker) … … - XDecapterus spp. … … X XEcheneis naucrates Linnaeus … … X XElagatis bipinnulatus (Quoy & Gaimard) … - XEulamia melanopterus (Quoy & Gaimard) … X XEuthynnus a. affinis (Cantor) … … X XGempylus serpens Cuvier … … - XIstiophorus platypterus (Shaw & Nodder) … - XKatsuwonus pelamis (Linnaeus) … … X XKishinoella tonggol (Bleeker) … … X -Lobotes surinamensis (Bloch) … … - XMakaira sp. (Juvenile) … … X -Megalaspis cordyla (Linnaeus) … … X -Naucrates ductor (Linnaeus) … … X XNetuma x halassinus (Ruppell) … … X -Netuma sp. … … X -Parastromateus niger (Bloch) … … X -Phtheirichthys lineatus (Menzies) … … - XPlatax teira (Forskal) … … - XPristis cuspidatus Latham … … X -Psenes cyanophrys Valenciennes … … - XRachicentron canadus (Linnaeus) … … X XRastrelliger kanagurta (Cuvier) … … X -Sarda orientalis (Temminck & SchleGEL) … X -Scoliodon sorrakowah (Cuvier) … … X -Scomberomorus guttatus (Bloch & Schneider) … X -Scomberomorus lineolatus (Cuvier) … … X -Sphyrna zygaena (Linnaeus) … … X -Sphyraena jello Cuvier … … X -Tylosurus crocodilus (Le Sueur) … … X -Trichiurus lepturus Linnaeus … … X -Thunnus albacares macropterus (Temminck&Schlegel) - X
CRUSTACEANS:Charybdis (Goniohellenus) edwardsi Leene & Buiyendijk X X
MOLLUSCA: Symplectoteuthis oulaniensis (Lesson) X X
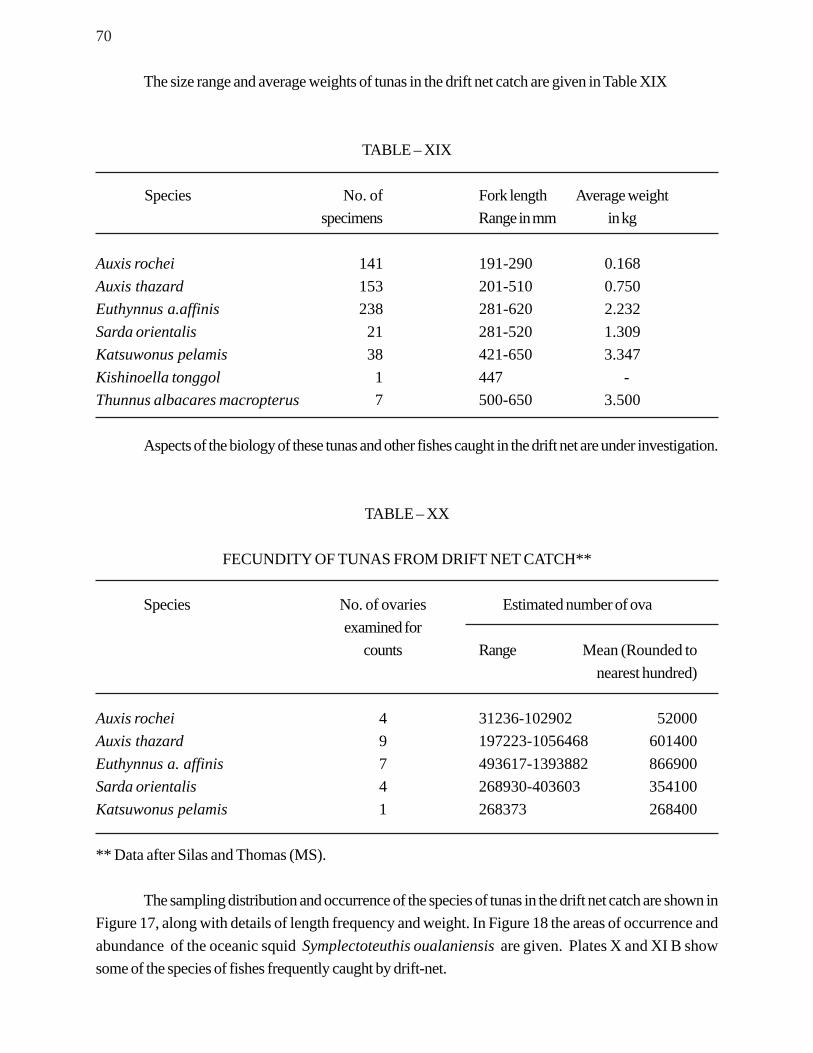
70
The size range and average weights of tunas in the drift net catch are given in Table XIX
TABLE – XIX
Species No. of Fork length Average weightspecimens Range in mm in kg
Auxis rochei 141 191-290 0.168Auxis thazard 153 201-510 0.750Euthynnus a.affinis 238 281-620 2.232Sarda orientalis 21 281-520 1.309Katsuwonus pelamis 38 421-650 3.347Kishinoella tonggol 1 447 -Thunnus albacares macropterus 7 500-650 3.500
Aspects of the biology of these tunas and other fishes caught in the drift net are under investigation.
TABLE – XX
FECUNDITY OF TUNAS FROM DRIFT NET CATCH**
Species No. of ovaries Estimated number of ovaexamined for
counts Range Mean (Rounded tonearest hundred)
Auxis rochei 4 31236-102902 52000Auxis thazard 9 197223-1056468 601400Euthynnus a. affinis 7 493617-1393882 866900Sarda orientalis 4 268930-403603 354100Katsuwonus pelamis 1 268373 268400
** Data after Silas and Thomas (MS).
The sampling distribution and occurrence of the species of tunas in the drift net catch are shown inFigure 17, along with details of length frequency and weight. In Figure 18 the areas of occurrence andabundance of the oceanic squid Symplectoteuthis oualaniensis are given. Plates X and XI B showsome of the species of fishes frequently caught by drift-net.
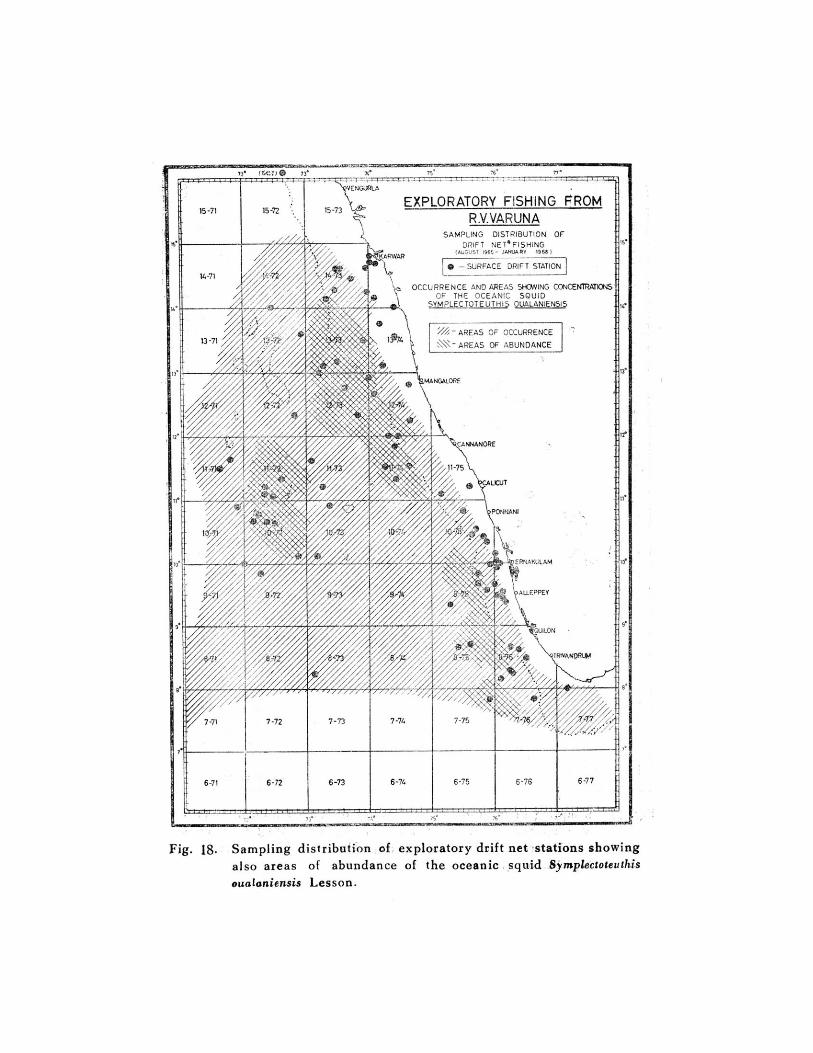
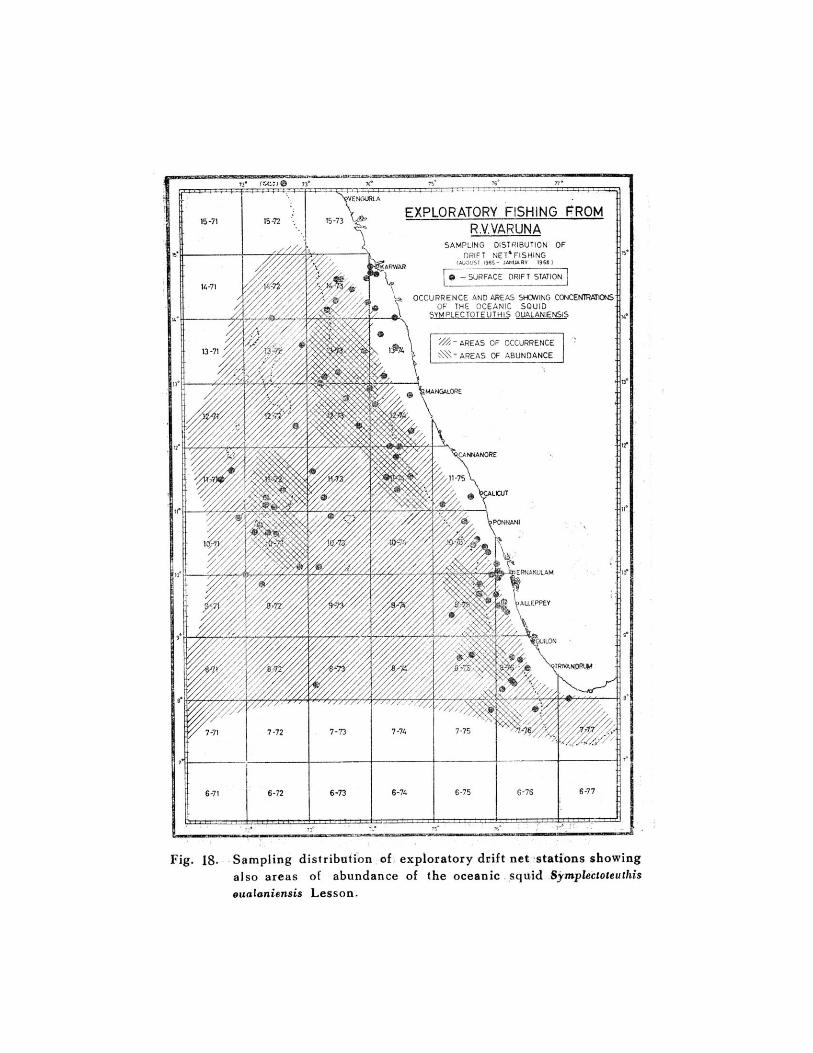
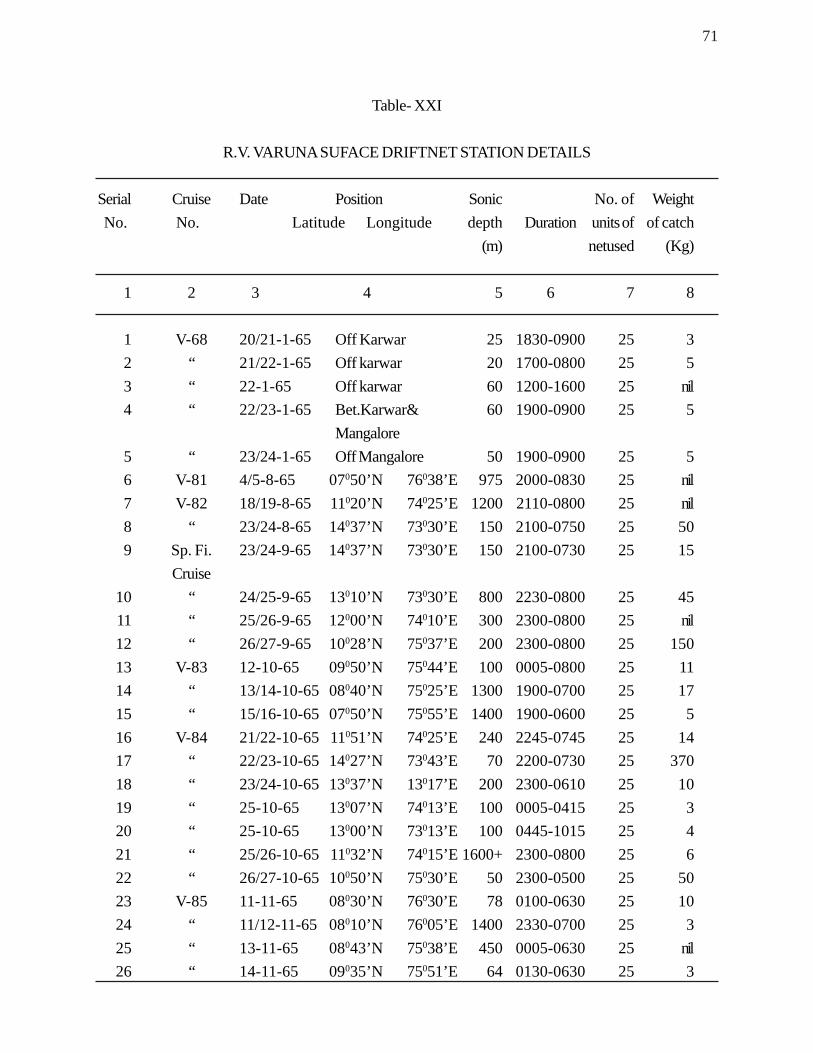
71
Table- XXI
R.V. VARUNA SUFACE DRIFTNET STATION DETAILS
Serial Cruise Date Position Sonic No. of Weight No. No. Latitude Longitude depth Duration units of of catch
(m) netused (Kg)
1 2 3 4 5 6 7 8
1 V-68 20/21-1-65 Off Karwar 25 1830-0900 25 32 “ 21/22-1-65 Off karwar 20 1700-0800 25 53 “ 22-1-65 Off karwar 60 1200-1600 25 nil4 “ 22/23-1-65 Bet.Karwar& 60 1900-0900 25 5
Mangalore5 “ 23/24-1-65 Off Mangalore 50 1900-0900 25 56 V-81 4/5-8-65 07050’N 76038’E 975 2000-0830 25 nil7 V-82 18/19-8-65 11020’N 74025’E 1200 2110-0800 25 nil8 “ 23/24-8-65 14037’N 73030’E 150 2100-0750 25 509 Sp. Fi. 23/24-9-65 14037’N 73030’E 150 2100-0730 25 15
Cruise10 “ 24/25-9-65 13010’N 73030’E 800 2230-0800 25 4511 “ 25/26-9-65 12000’N 74010’E 300 2300-0800 25 nil12 “ 26/27-9-65 10028’N 75037’E 200 2300-0800 25 15013 V-83 12-10-65 09050’N 75044’E 100 0005-0800 25 1114 “ 13/14-10-65 08040’N 75025’E 1300 1900-0700 25 1715 “ 15/16-10-65 07050’N 75055’E 1400 1900-0600 25 516 V-84 21/22-10-65 11051’N 74025’E 240 2245-0745 25 1417 “ 22/23-10-65 14027’N 73043’E 70 2200-0730 25 37018 “ 23/24-10-65 13037’N 13017’E 200 2300-0610 25 1019 “ 25-10-65 13007’N 74013’E 100 0005-0415 25 320 “ 25-10-65 13000’N 73013’E 100 0445-1015 25 421 “ 25/26-10-65 11032’N 74015’E 1600+ 2300-0800 25 622 “ 26/27-10-65 10050’N 75030’E 50 2300-0500 25 5023 V-85 11-11-65 08030’N 76030’E 78 0100-0630 25 1024 “ 11/12-11-65 08010’N 76005’E 1400 2330-0700 25 325 “ 13-11-65 08043’N 75038’E 450 0005-0630 25 nil26 “ 14-11-65 09035’N 75051’E 64 0130-0630 25 3
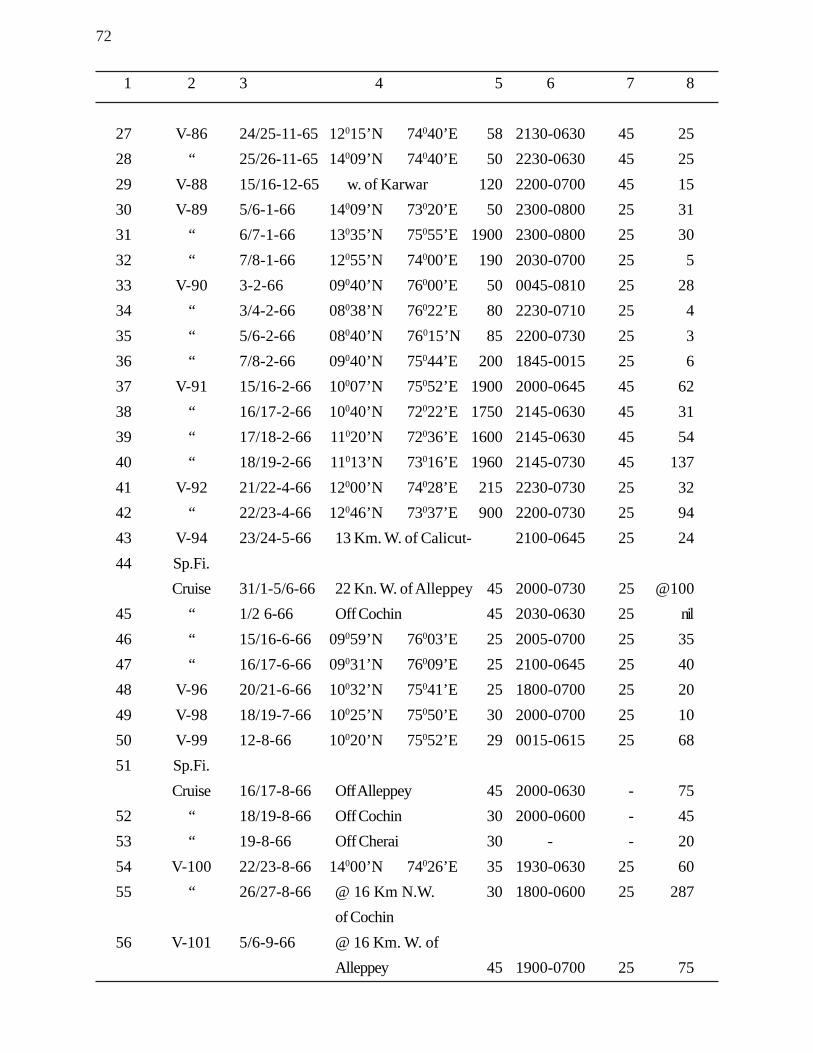
72
1 2 3 4 5 6 7 8
27 V-86 24/25-11-65 12015’N 74040’E 58 2130-0630 45 2528 “ 25/26-11-65 14009’N 74040’E 50 2230-0630 45 2529 V-88 15/16-12-65 w. of Karwar 120 2200-0700 45 1530 V-89 5/6-1-66 14009’N 73020’E 50 2300-0800 25 3131 “ 6/7-1-66 13035’N 75055’E 1900 2300-0800 25 3032 “ 7/8-1-66 12055’N 74000’E 190 2030-0700 25 533 V-90 3-2-66 09040’N 76000’E 50 0045-0810 25 2834 “ 3/4-2-66 08038’N 76022’E 80 2230-0710 25 435 “ 5/6-2-66 08040’N 76015’N 85 2200-0730 25 336 “ 7/8-2-66 09040’N 75044’E 200 1845-0015 25 637 V-91 15/16-2-66 10007’N 75052’E 1900 2000-0645 45 6238 “ 16/17-2-66 10040’N 72022’E 1750 2145-0630 45 3139 “ 17/18-2-66 11020’N 72036’E 1600 2145-0630 45 5440 “ 18/19-2-66 11013’N 73016’E 1960 2145-0730 45 13741 V-92 21/22-4-66 12000’N 74028’E 215 2230-0730 25 3242 “ 22/23-4-66 12046’N 73037’E 900 2200-0730 25 9443 V-94 23/24-5-66 13 Km. W. of Calicut- 2100-0645 25 2444 Sp.Fi.
Cruise 31/1-5/6-66 22 Kn. W. of Alleppey 45 2000-0730 25 @10045 “ 1/2 6-66 Off Cochin 45 2030-0630 25 nil46 “ 15/16-6-66 09059’N 76003’E 25 2005-0700 25 3547 “ 16/17-6-66 09031’N 76009’E 25 2100-0645 25 4048 V-96 20/21-6-66 10032’N 75041’E 25 1800-0700 25 2049 V-98 18/19-7-66 10025’N 75050’E 30 2000-0700 25 1050 V-99 12-8-66 10020’N 75052’E 29 0015-0615 25 6851 Sp.Fi.
Cruise 16/17-8-66 Off Alleppey 45 2000-0630 - 7552 “ 18/19-8-66 Off Cochin 30 2000-0600 - 4553 “ 19-8-66 Off Cherai 30 - - 2054 V-100 22/23-8-66 14000’N 74026’E 35 1930-0630 25 6055 “ 26/27-8-66 @ 16 Km N.W. 30 1800-0600 25 287
of Cochin56 V-101 5/6-9-66 @ 16 Km. W. of
Alleppey 45 1900-0700 25 75
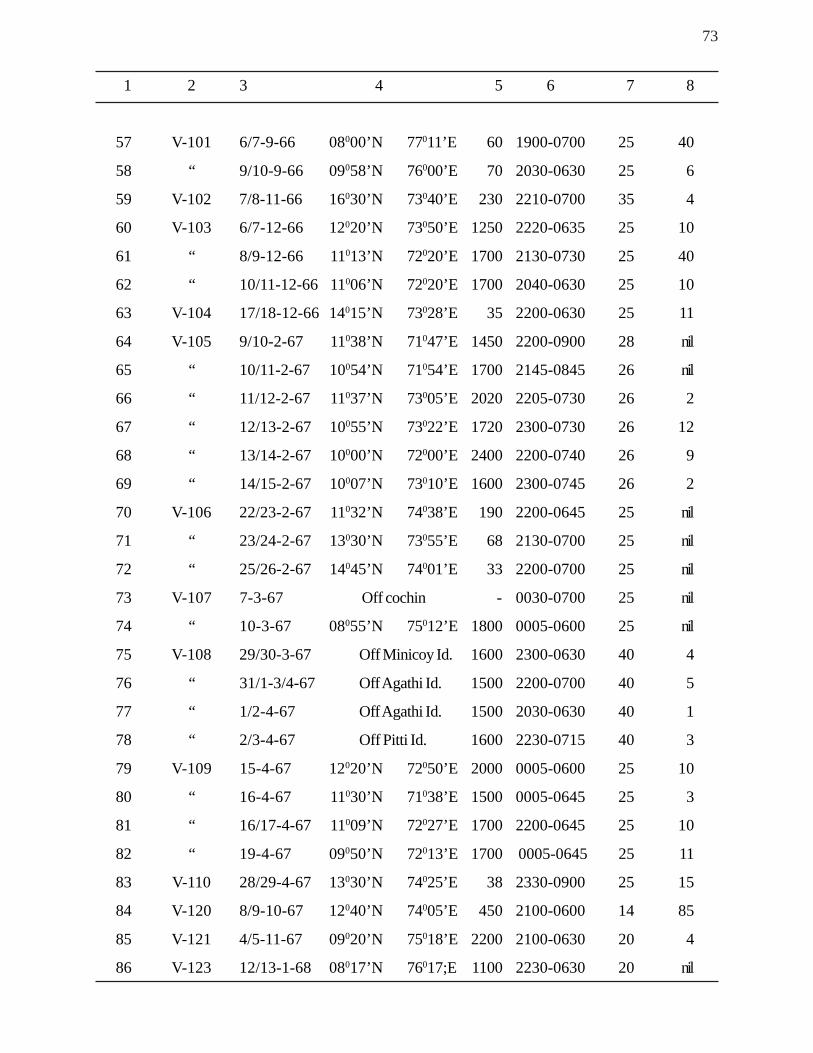
73
1 2 3 4 5 6 7 8
57 V-101 6/7-9-66 08000’N 77011’E 60 1900-0700 25 40
58 “ 9/10-9-66 09058’N 76000’E 70 2030-0630 25 6
59 V-102 7/8-11-66 16030’N 73040’E 230 2210-0700 35 4
60 V-103 6/7-12-66 12020’N 73050’E 1250 2220-0635 25 10
61 “ 8/9-12-66 11013’N 72020’E 1700 2130-0730 25 40
62 “ 10/11-12-66 11006’N 72020’E 1700 2040-0630 25 10
63 V-104 17/18-12-66 14015’N 73028’E 35 2200-0630 25 11
64 V-105 9/10-2-67 11038’N 71047’E 1450 2200-0900 28 nil
65 “ 10/11-2-67 10054’N 71054’E 1700 2145-0845 26 nil
66 “ 11/12-2-67 11037’N 73005’E 2020 2205-0730 26 2
67 “ 12/13-2-67 10055’N 73022’E 1720 2300-0730 26 12
68 “ 13/14-2-67 10000’N 72000’E 2400 2200-0740 26 9
69 “ 14/15-2-67 10007’N 73010’E 1600 2300-0745 26 2
70 V-106 22/23-2-67 11032’N 74038’E 190 2200-0645 25 nil
71 “ 23/24-2-67 13030’N 73055’E 68 2130-0700 25 nil
72 “ 25/26-2-67 14045’N 74001’E 33 2200-0700 25 nil
73 V-107 7-3-67 Off cochin - 0030-0700 25 nil
74 “ 10-3-67 08055’N 75012’E 1800 0005-0600 25 nil
75 V-108 29/30-3-67 Off Minicoy Id. 1600 2300-0630 40 4
76 “ 31/1-3/4-67 Off Agathi Id. 1500 2200-0700 40 5
77 “ 1/2-4-67 Off Agathi Id. 1500 2030-0630 40 1
78 “ 2/3-4-67 Off Pitti Id. 1600 2230-0715 40 3
79 V-109 15-4-67 12020’N 72050’E 2000 0005-0600 25 10
80 “ 16-4-67 11030’N 71038’E 1500 0005-0645 25 3
81 “ 16/17-4-67 11009’N 72027’E 1700 2200-0645 25 10
82 “ 19-4-67 09050’N 72013’E 1700 0005-0645 25 11
83 V-110 28/29-4-67 13030’N 74025’E 38 2330-0900 25 15
84 V-120 8/9-10-67 12040’N 74005’E 450 2100-0600 14 85
85 V-121 4/5-11-67 09020’N 75018’E 2200 2100-0630 20 4
86 V-123 12/13-1-68 08017’N 76017;E 1100 2230-0630 20 nil
74
PURSE SEINE FISHING FOR TUNAS
Purse seine fishing for tunas in the Laccadive Sea was first carried out by R.V. VARUNA in
February 1966, but was not successful. In March 1967, purse seining was again tried in the Laccadive
Sea, this time by M.V. TUNA (earlier known as M.V. HESSATRAL), with R.V. VARUNA going along to
scout for tuna shoals and carry out other investigations. The net used had the following dimension: Length
540 metrers; width 67 metres; mesh size 10 cm. The net had not been properly weighted and when shot
was not sinking fast as desired. The skipjack shoals which were completely encircled sounded much
faster and not a single fish was caught. To be more effective in the high seas, the net has to be of larger
diemensions, the length to be increased by at least another 250 metres and the depth doubled. The same
purse seine net was successfully operated on the shelf area when good catches were obtained, the maximum
exceeding ten tonnes in a single operation. Details of the areas fished, the lengths and weights of tunas
caught, etc., are shown in Figure 19. The catch was mainly composed of schools of Euthynnus a. affinis
and Auxis thazard. On three or four occasions the catch consisted of mixed schools of the two species.
Surface schools of tuna (skipjack shoals) are shown in plates XII and XIII.
Of a total number of 38 purse seine operations carried out by R.V. VARUNA
and M.V. TUNA, the number of positive stations with tuna were only 10 for which the effort
expended in hours was 39.50. The total catch amounted to 19,436 kg. The average duration
of the positive operations being 3.95 hours, the average catch in kg/positive fishing operation was
1943.8 kg. In other words, the catch/hour (for positive hauls) worked out to about 494 kg of tunas. Since
a training programme was undertaken to familiarize the crew with the use of the net, which also resulted in
several negative hauls, these were not considered in the above estimation. These investigations have
proven beyond doubt that in the coastal waters, nets of the type used could be successfully operated
and much higher catch rates could be expected. The greatest problem in this fishery is marketing the catch.
Canning tuna meat would be one answer, but the meat of the coastal species being red, this may not
have an export market. However, its utility towards manufacture of fish paste, or fish
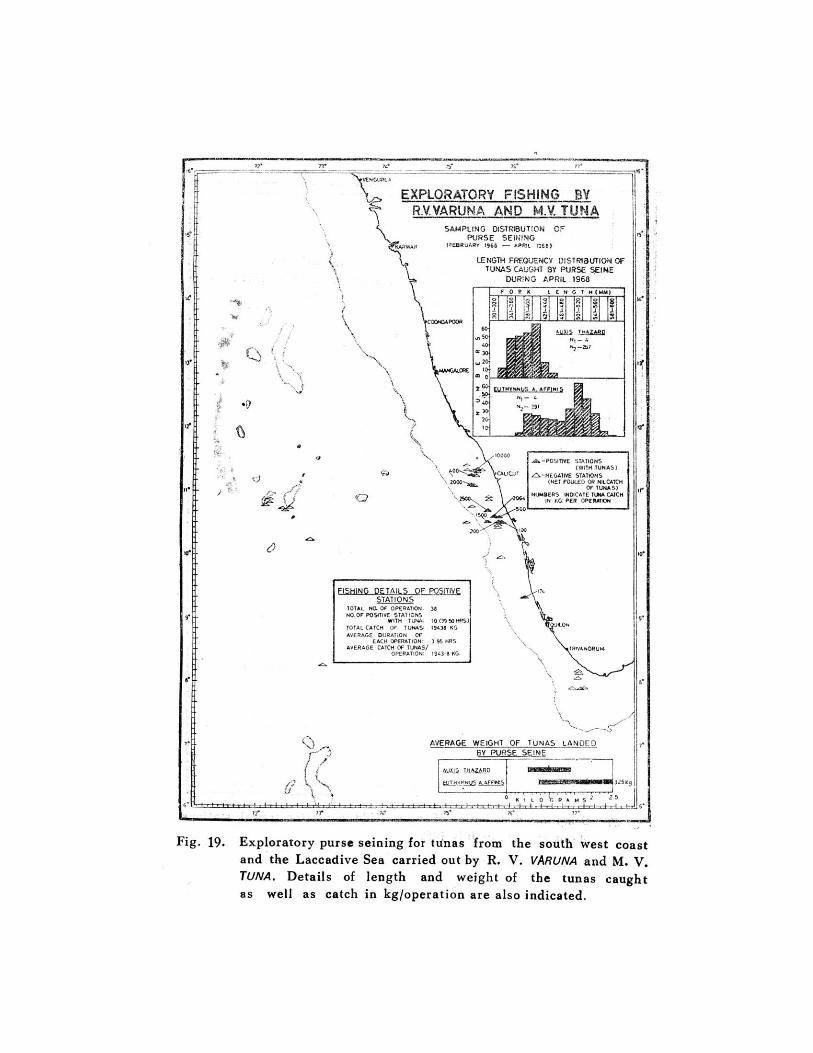
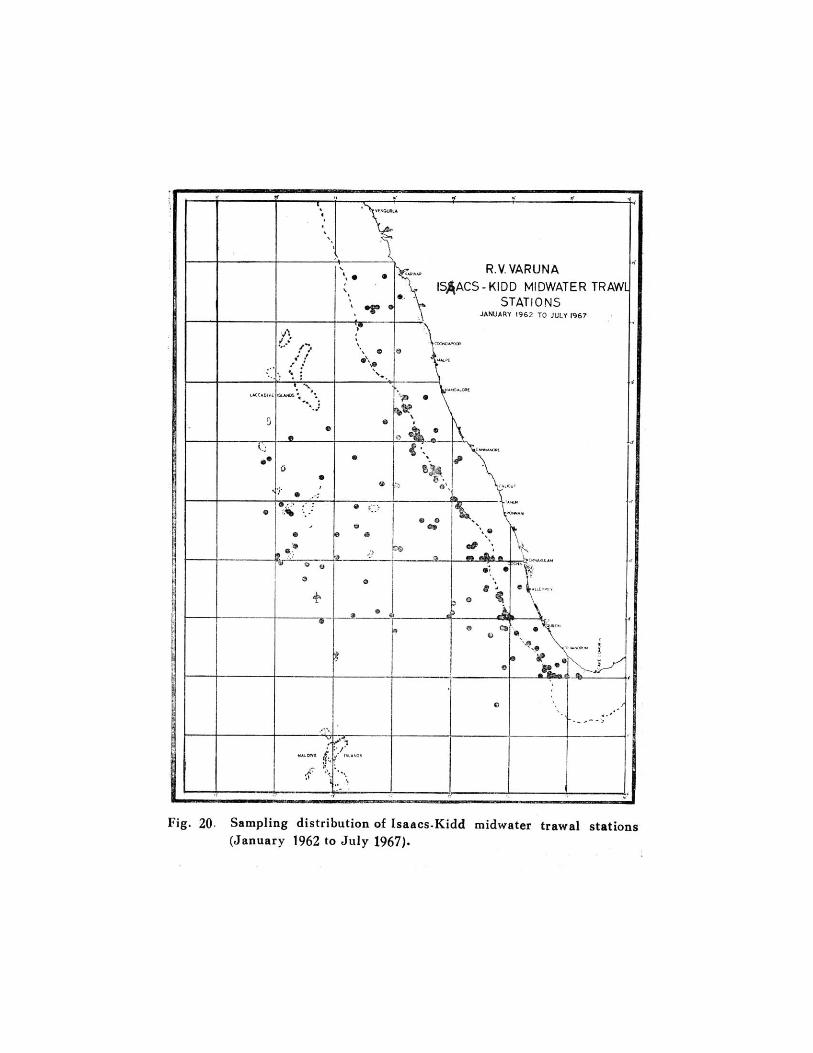
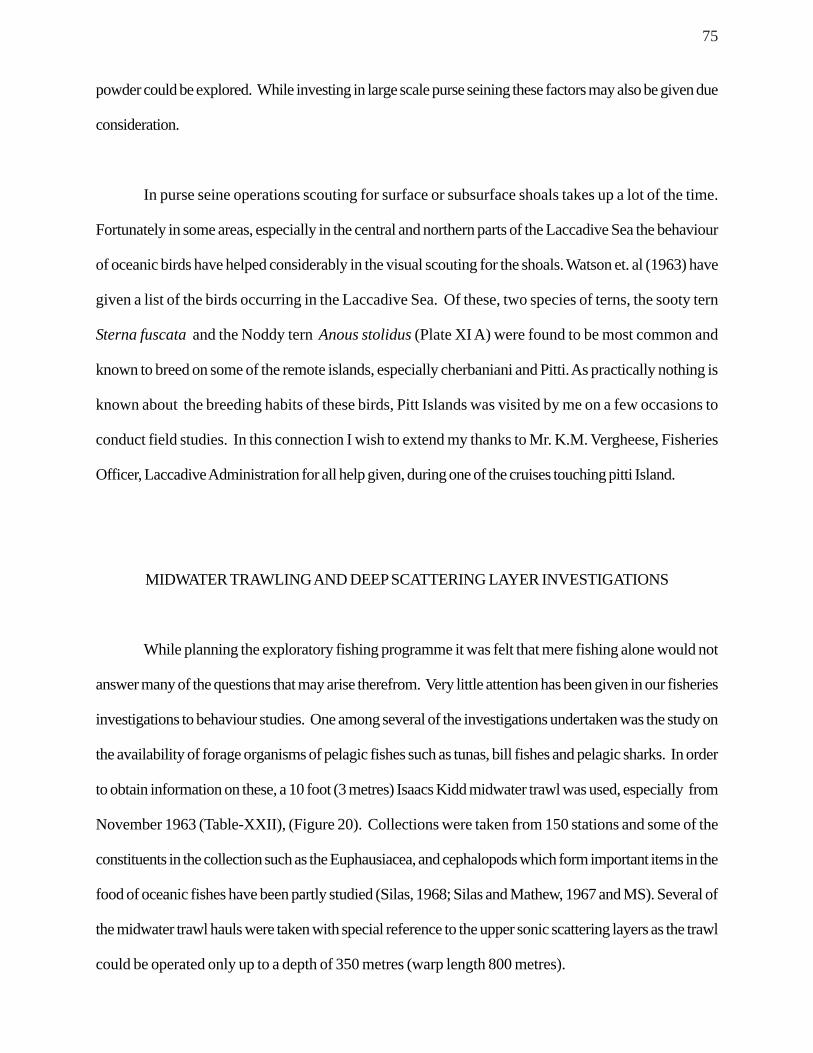
75
powder could be explored. While investing in large scale purse seining these factors may also be given due
consideration.
In purse seine operations scouting for surface or subsurface shoals takes up a lot of the time.
Fortunately in some areas, especially in the central and northern parts of the Laccadive Sea the behaviour
of oceanic birds have helped considerably in the visual scouting for the shoals. Watson et. al (1963) have
given a list of the birds occurring in the Laccadive Sea. Of these, two species of terns, the sooty tern
Sterna fuscata and the Noddy tern Anous stolidus (Plate XI A) were found to be most common and
known to breed on some of the remote islands, especially cherbaniani and Pitti. As practically nothing is
known about the breeding habits of these birds, Pitt Islands was visited by me on a few occasions to
conduct field studies. In this connection I wish to extend my thanks to Mr. K.M. Vergheese, Fisheries
Officer, Laccadive Administration for all help given, during one of the cruises touching pitti Island.
MIDWATER TRAWLING AND DEEP SCATTERING LAYER INVESTIGATIONS
While planning the exploratory fishing programme it was felt that mere fishing alone would not
answer many of the questions that may arise therefrom. Very little attention has been given in our fisheries
investigations to behaviour studies. One among several of the investigations undertaken was the study on
the availability of forage organisms of pelagic fishes such as tunas, bill fishes and pelagic sharks. In order
to obtain information on these, a 10 foot (3 metres) Isaacs Kidd midwater trawl was used, especially from
November 1963 (Table-XXII), (Figure 20). Collections were taken from 150 stations and some of the
constituents in the collection such as the Euphausiacea, and cephalopods which form important items in the
food of oceanic fishes have been partly studied (Silas, 1968; Silas and Mathew, 1967 and MS). Several of
the midwater trawl hauls were taken with special reference to the upper sonic scattering layers as the trawl
could be operated only up to a depth of 350 metres (warp length 800 metres).
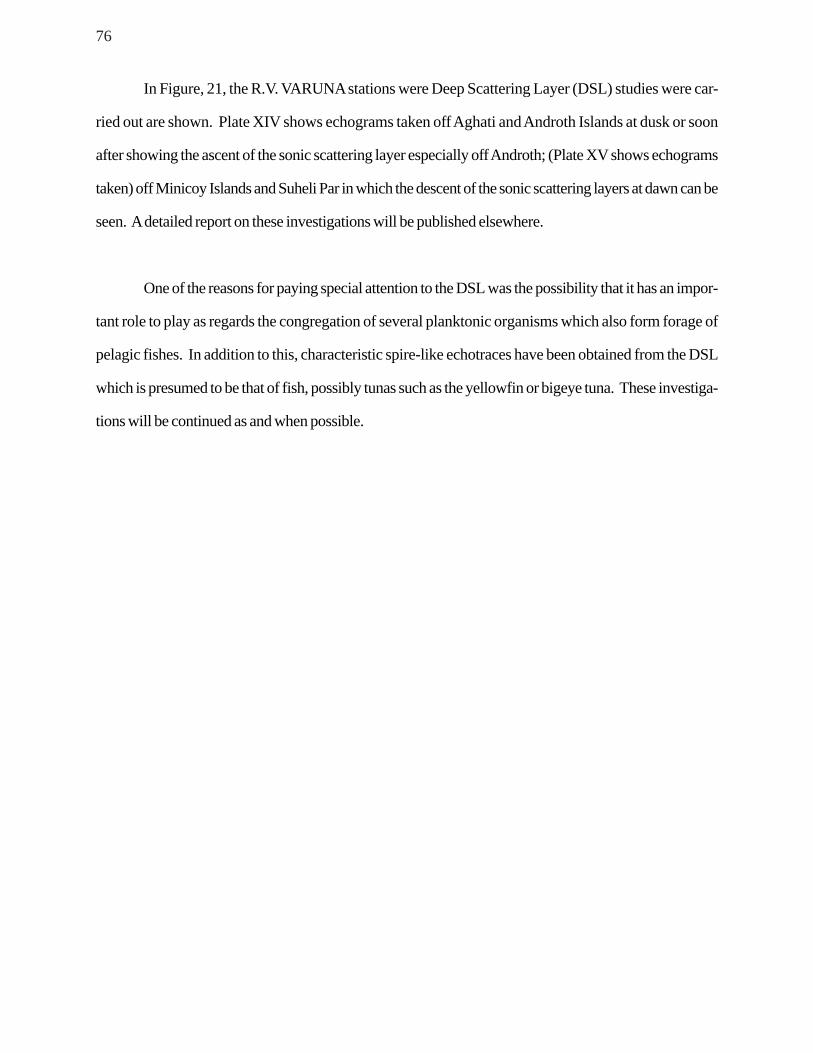
76
In Figure, 21, the R.V. VARUNA stations were Deep Scattering Layer (DSL) studies were car-
ried out are shown. Plate XIV shows echograms taken off Aghati and Androth Islands at dusk or soon
after showing the ascent of the sonic scattering layer especially off Androth; (Plate XV shows echograms
taken) off Minicoy Islands and Suheli Par in which the descent of the sonic scattering layers at dawn can be
seen. A detailed report on these investigations will be published elsewhere.
One of the reasons for paying special attention to the DSL was the possibility that it has an impor-
tant role to play as regards the congregation of several planktonic organisms which also form forage of
pelagic fishes. In addition to this, characteristic spire-like echotraces have been obtained from the DSL
which is presumed to be that of fish, possibly tunas such as the yellowfin or bigeye tuna. These investiga-
tions will be continued as and when possible.
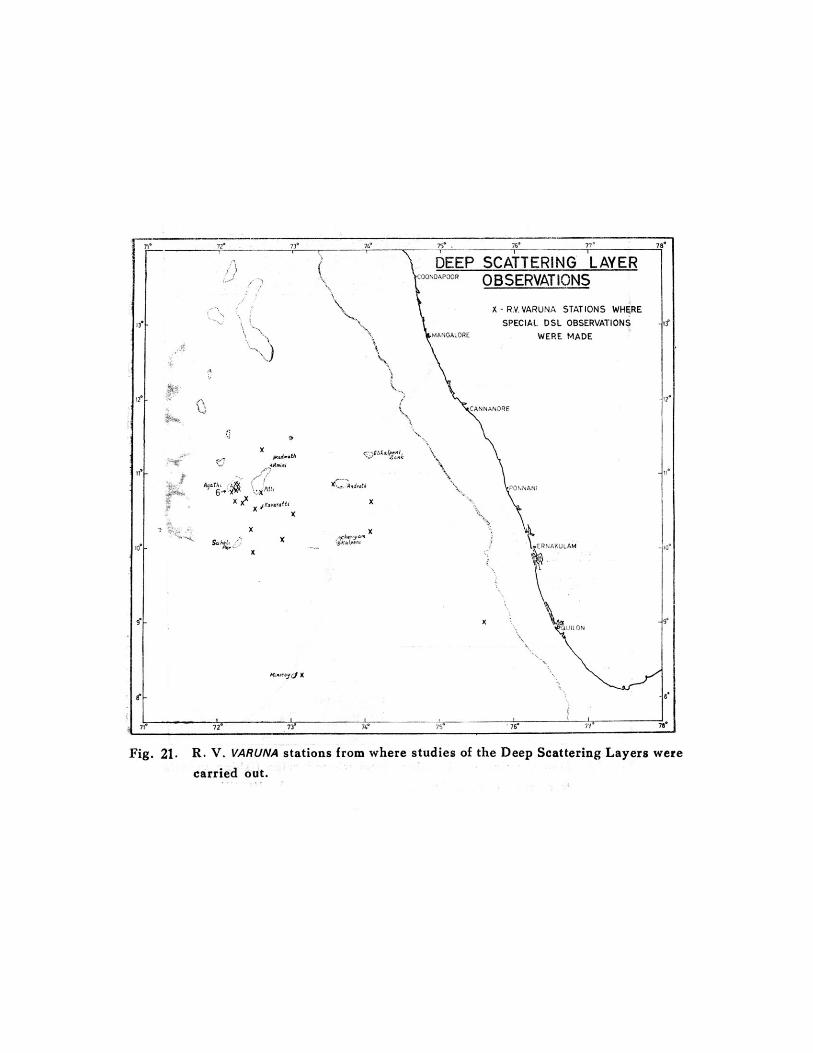
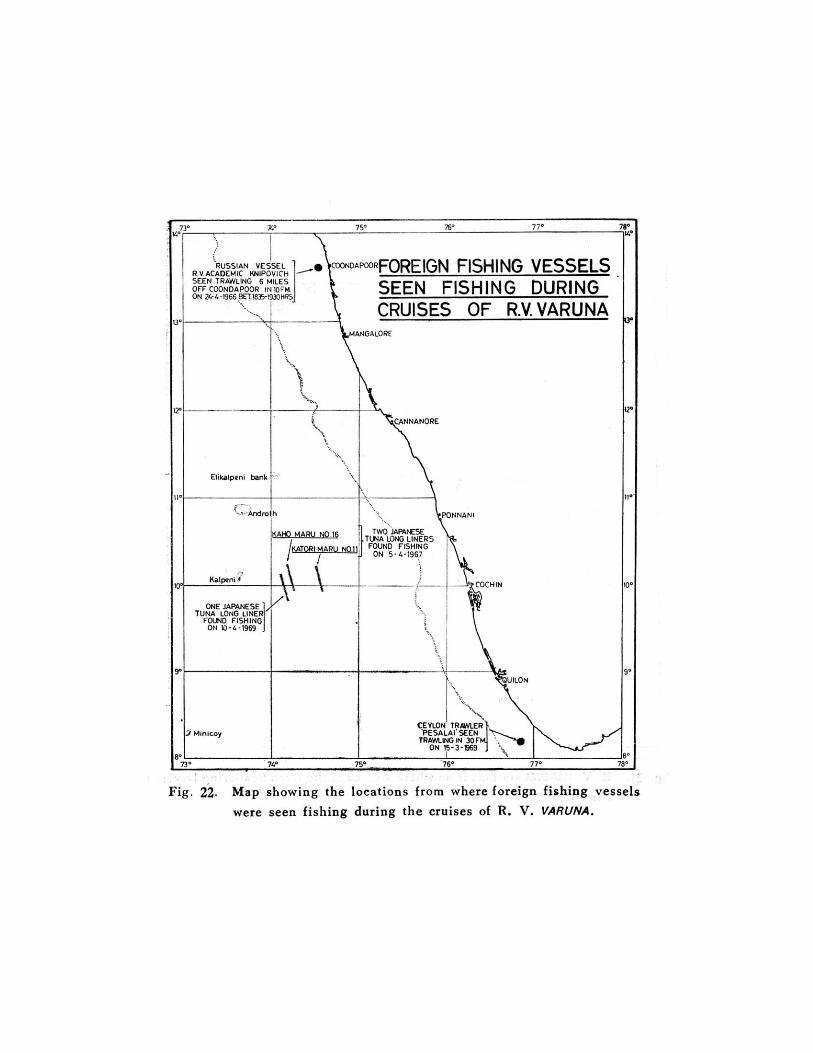
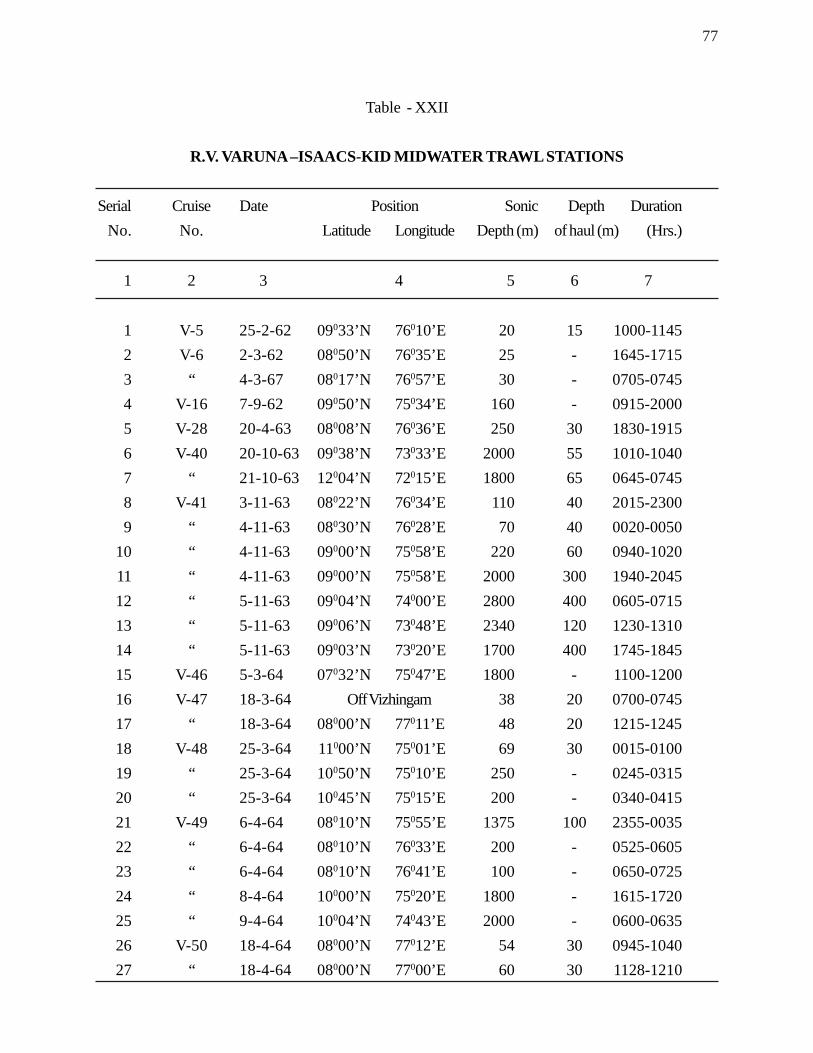
77
Table - XXII
R.V. VARUNA –ISAACS-KID MIDWATER TRAWL STATIONS
Serial Cruise Date Position Sonic Depth DurationNo. No. Latitude Longitude Depth (m) of haul (m) (Hrs.)
1 2 3 4 5 6 7
1 V-5 25-2-62 09033’N 76010’E 20 15 1000-11452 V-6 2-3-62 08050’N 76035’E 25 - 1645-17153 “ 4-3-67 08017’N 76057’E 30 - 0705-07454 V-16 7-9-62 09050’N 75034’E 160 - 0915-20005 V-28 20-4-63 08008’N 76036’E 250 30 1830-19156 V-40 20-10-63 09038’N 73033’E 2000 55 1010-10407 “ 21-10-63 12004’N 72015’E 1800 65 0645-07458 V-41 3-11-63 08022’N 76034’E 110 40 2015-23009 “ 4-11-63 08030’N 76028’E 70 40 0020-0050
10 “ 4-11-63 09000’N 75058’E 220 60 0940-102011 “ 4-11-63 09000’N 75058’E 2000 300 1940-204512 “ 5-11-63 09004’N 74000’E 2800 400 0605-071513 “ 5-11-63 09006’N 73048’E 2340 120 1230-131014 “ 5-11-63 09003’N 73020’E 1700 400 1745-184515 V-46 5-3-64 07032’N 75047’E 1800 - 1100-120016 V-47 18-3-64 Off Vizhingam 38 20 0700-074517 “ 18-3-64 08000’N 77011’E 48 20 1215-124518 V-48 25-3-64 11000’N 75001’E 69 30 0015-010019 “ 25-3-64 10050’N 75010’E 250 - 0245-031520 “ 25-3-64 10045’N 75015’E 200 - 0340-041521 V-49 6-4-64 08010’N 75055’E 1375 100 2355-003522 “ 6-4-64 08010’N 76033’E 200 - 0525-060523 “ 6-4-64 08010’N 76041’E 100 - 0650-072524 “ 8-4-64 10000’N 75020’E 1800 - 1615-172025 “ 9-4-64 10004’N 74043’E 2000 - 0600-063526 V-50 18-4-64 08000’N 77012’E 54 30 0945-104027 “ 18-4-64 08000’N 77000’E 60 30 1128-1210
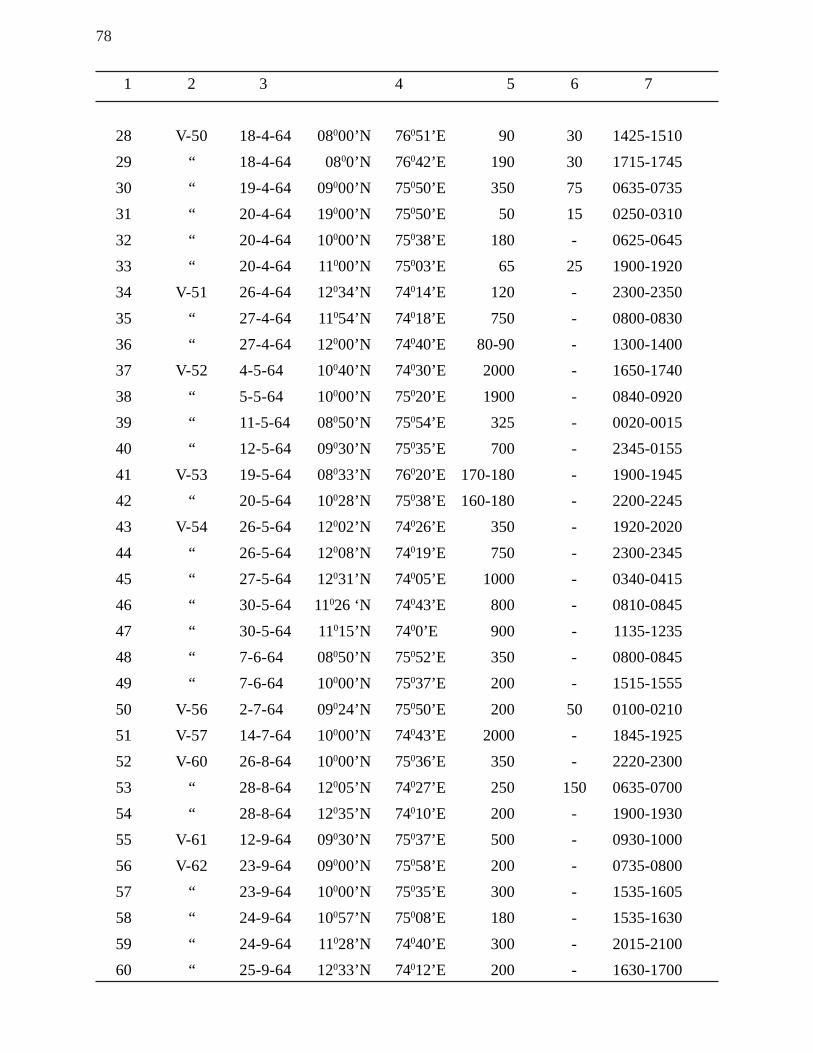
78
1 2 3 4 5 6 7
28 V-50 18-4-64 08000’N 76051’E 90 30 1425-151029 “ 18-4-64 0800’N 76042’E 190 30 1715-174530 “ 19-4-64 09000’N 75050’E 350 75 0635-073531 “ 20-4-64 19000’N 75050’E 50 15 0250-031032 “ 20-4-64 10000’N 75038’E 180 - 0625-064533 “ 20-4-64 11000’N 75003’E 65 25 1900-192034 V-51 26-4-64 12034’N 74014’E 120 - 2300-235035 “ 27-4-64 11054’N 74018’E 750 - 0800-083036 “ 27-4-64 12000’N 74040’E 80-90 - 1300-140037 V-52 4-5-64 10040’N 74030’E 2000 - 1650-174038 “ 5-5-64 10000’N 75020’E 1900 - 0840-092039 “ 11-5-64 08050’N 75054’E 325 - 0020-001540 “ 12-5-64 09030’N 75035’E 700 - 2345-015541 V-53 19-5-64 08033’N 76020’E 170-180 - 1900-194542 “ 20-5-64 10028’N 75038’E 160-180 - 2200-224543 V-54 26-5-64 12002’N 74026’E 350 - 1920-202044 “ 26-5-64 12008’N 74019’E 750 - 2300-234545 “ 27-5-64 12031’N 74005’E 1000 - 0340-041546 “ 30-5-64 11026 ‘N 74043’E 800 - 0810-084547 “ 30-5-64 11015’N 7400’E 900 - 1135-123548 “ 7-6-64 08050’N 75052’E 350 - 0800-084549 “ 7-6-64 10000’N 75037’E 200 - 1515-155550 V-56 2-7-64 09024’N 75050’E 200 50 0100-021051 V-57 14-7-64 10000’N 74043’E 2000 - 1845-192552 V-60 26-8-64 10000’N 75036’E 350 - 2220-2300
53 “ 28-8-64 12005’N 74027’E 250 150 0635-070054 “ 28-8-64 12035’N 74010’E 200 - 1900-193055 V-61 12-9-64 09030’N 75037’E 500 - 0930-100056 V-62 23-9-64 09000’N 75058’E 200 - 0735-080057 “ 23-9-64 10000’N 75035’E 300 - 1535-160558 “ 24-9-64 10057’N 75008’E 180 - 1535-163059 “ 24-9-64 11028’N 74040’E 300 - 2015-210060 “ 25-9-64 12033’N 74012’E 200 - 1630-1700
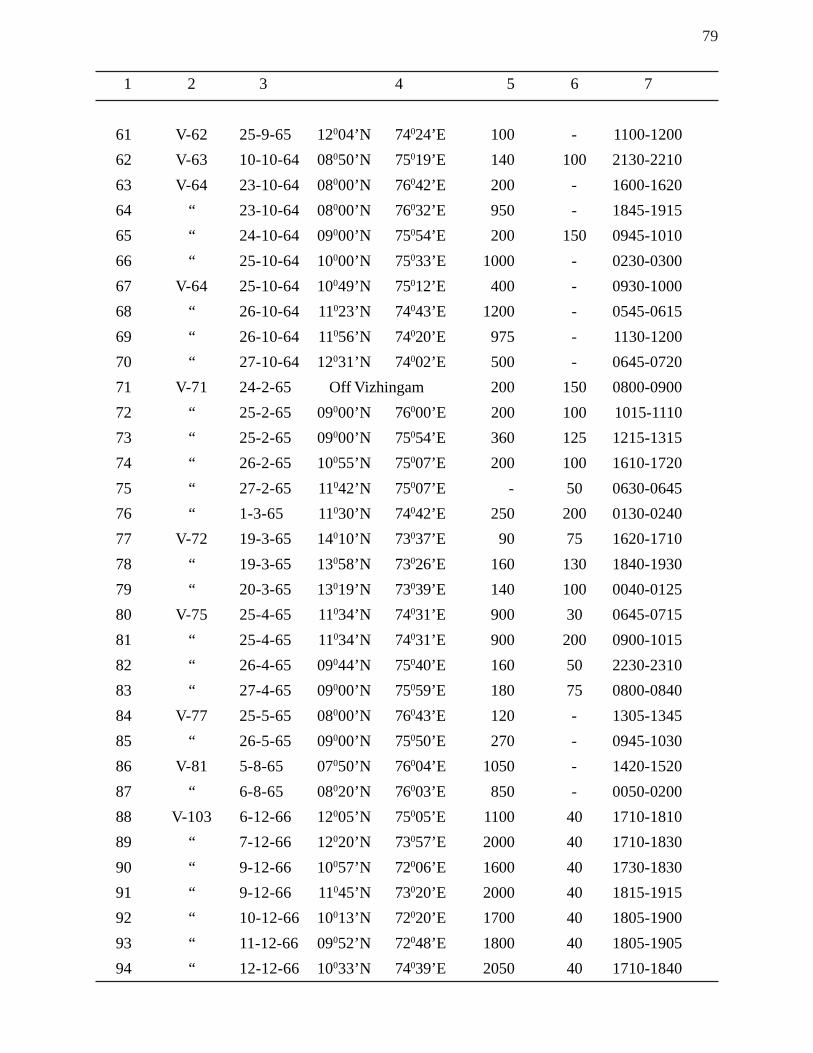
79
1 2 3 4 5 6 7
61 V-62 25-9-65 12004’N 74024’E 100 - 1100-120062 V-63 10-10-64 08050’N 75019’E 140 100 2130-221063 V-64 23-10-64 08000’N 76042’E 200 - 1600-162064 “ 23-10-64 08000’N 76032’E 950 - 1845-191565 “ 24-10-64 09000’N 75054’E 200 150 0945-101066 “ 25-10-64 10000’N 75033’E 1000 - 0230-030067 V-64 25-10-64 10049’N 75012’E 400 - 0930-100068 “ 26-10-64 11023’N 74043’E 1200 - 0545-061569 “ 26-10-64 11056’N 74020’E 975 - 1130-120070 “ 27-10-64 12031’N 74002’E 500 - 0645-072071 V-71 24-2-65 Off Vizhingam 200 150 0800-090072 “ 25-2-65 09000’N 76000’E 200 100 1015-111073 “ 25-2-65 09000’N 75054’E 360 125 1215-131574 “ 26-2-65 10055’N 75007’E 200 100 1610-172075 “ 27-2-65 11042’N 75007’E - 50 0630-064576 “ 1-3-65 11030’N 74042’E 250 200 0130-024077 V-72 19-3-65 14010’N 73037’E 90 75 1620-171078 “ 19-3-65 13058’N 73026’E 160 130 1840-193079 “ 20-3-65 13019’N 73039’E 140 100 0040-012580 V-75 25-4-65 11034’N 74031’E 900 30 0645-071581 “ 25-4-65 11034’N 74031’E 900 200 0900-101582 “ 26-4-65 09044’N 75040’E 160 50 2230-231083 “ 27-4-65 09000’N 75059’E 180 75 0800-084084 V-77 25-5-65 08000’N 76043’E 120 - 1305-134585 “ 26-5-65 09000’N 75050’E 270 - 0945-103086 V-81 5-8-65 07050’N 76004’E 1050 - 1420-152087 “ 6-8-65 08020’N 76003’E 850 - 0050-020088 V-103 6-12-66 12005’N 75005’E 1100 40 1710-181089 “ 7-12-66 12020’N 73057’E 2000 40 1710-183090 “ 9-12-66 10057’N 72006’E 1600 40 1730-183091 “ 9-12-66 11045’N 73020’E 2000 40 1815-191592 “ 10-12-66 10013’N 72020’E 1700 40 1805-190093 “ 11-12-66 09052’N 72048’E 1800 40 1805-190594 “ 12-12-66 10033’N 74039’E 2050 40 1710-1840
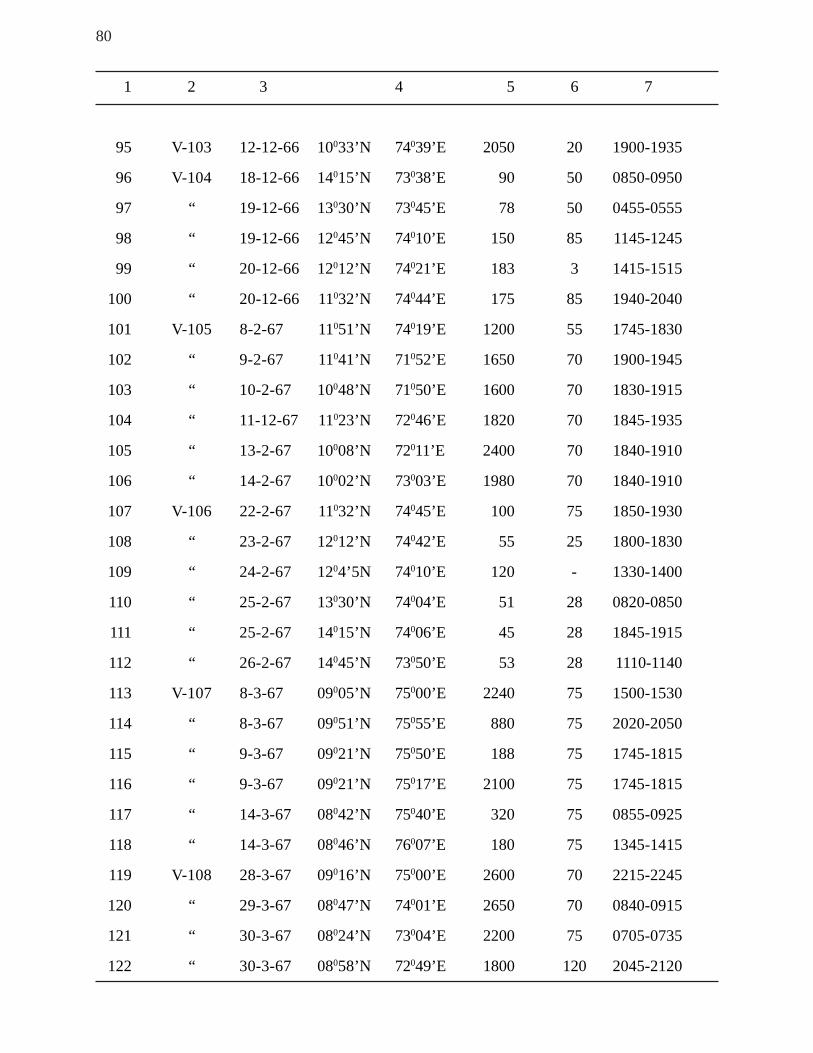
80
1 2 3 4 5 6 7
95 V-103 12-12-66 10033’N 74039’E 2050 20 1900-1935
96 V-104 18-12-66 14015’N 73038’E 90 50 0850-0950
97 “ 19-12-66 13030’N 73045’E 78 50 0455-0555
98 “ 19-12-66 12045’N 74010’E 150 85 1145-1245
99 “ 20-12-66 12012’N 74021’E 183 3 1415-1515
100 “ 20-12-66 11032’N 74044’E 175 85 1940-2040
101 V-105 8-2-67 11051’N 74019’E 1200 55 1745-1830
102 “ 9-2-67 11041’N 71052’E 1650 70 1900-1945
103 “ 10-2-67 10048’N 71050’E 1600 70 1830-1915
104 “ 11-12-67 11023’N 72046’E 1820 70 1845-1935
105 “ 13-2-67 10008’N 72011’E 2400 70 1840-1910
106 “ 14-2-67 10002’N 73003’E 1980 70 1840-1910
107 V-106 22-2-67 11032’N 74045’E 100 75 1850-1930
108 “ 23-2-67 12012’N 74042’E 55 25 1800-1830
109 “ 24-2-67 1204’5N 74010’E 120 - 1330-1400
110 “ 25-2-67 13030’N 74004’E 51 28 0820-0850
111 “ 25-2-67 14015’N 74006’E 45 28 1845-1915
112 “ 26-2-67 14045’N 73050’E 53 28 1110-1140
113 V-107 8-3-67 09005’N 75000’E 2240 75 1500-1530
114 “ 8-3-67 09051’N 75055’E 880 75 2020-2050
115 “ 9-3-67 09021’N 75050’E 188 75 1745-1815
116 “ 9-3-67 09021’N 75017’E 2100 75 1745-1815
117 “ 14-3-67 08042’N 75040’E 320 75 0855-0925
118 “ 14-3-67 08046’N 76007’E 180 75 1345-1415
119 V-108 28-3-67 09016’N 75000’E 2600 70 2215-2245
120 “ 29-3-67 08047’N 74001’E 2650 70 0840-0915
121 “ 30-3-67 08024’N 73004’E 2200 75 0705-0735
122 “ 30-3-67 08058’N 72049’E 1800 120 2045-2120
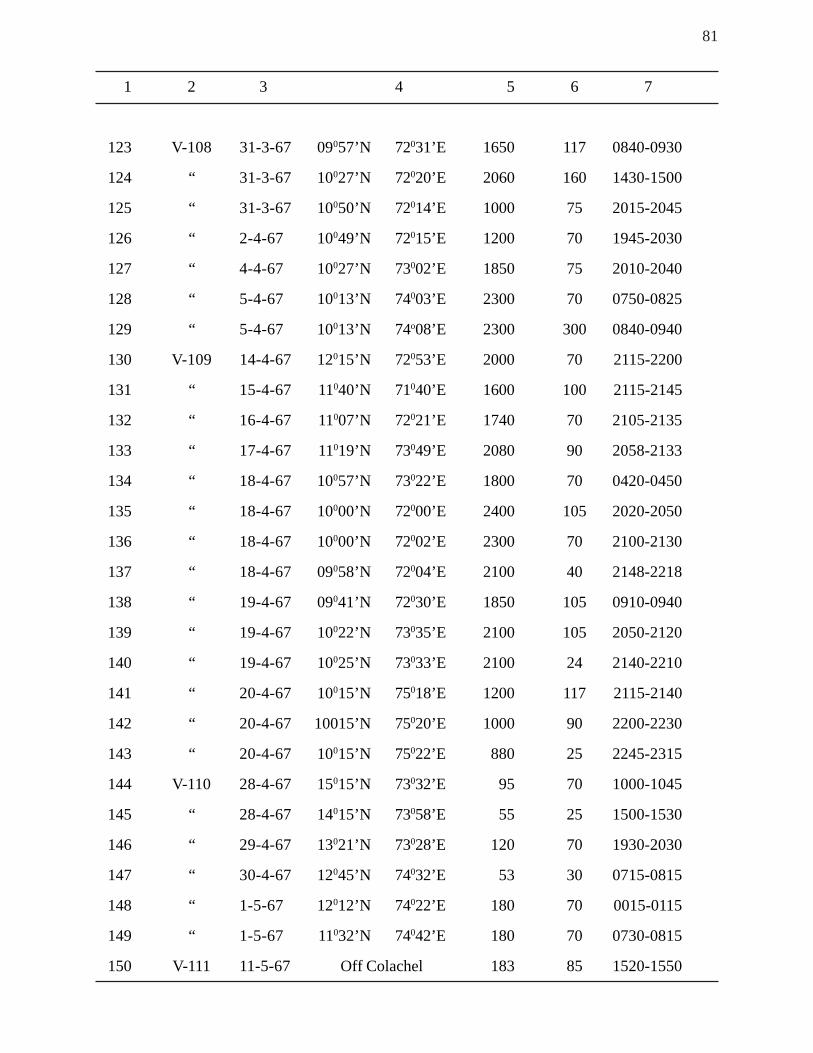
81
1 2 3 4 5 6 7
123 V-108 31-3-67 09057’N 72031’E 1650 117 0840-0930
124 “ 31-3-67 10027’N 72020’E 2060 160 1430-1500
125 “ 31-3-67 10050’N 72014’E 1000 75 2015-2045
126 “ 2-4-67 10049’N 72015’E 1200 70 1945-2030
127 “ 4-4-67 10027’N 73002’E 1850 75 2010-2040
128 “ 5-4-67 10013’N 74003’E 2300 70 0750-0825
129 “ 5-4-67 10013’N 74o08’E 2300 300 0840-0940
130 V-109 14-4-67 12015’N 72053’E 2000 70 2115-2200
131 “ 15-4-67 11040’N 71040’E 1600 100 2115-2145
132 “ 16-4-67 11007’N 72021’E 1740 70 2105-2135
133 “ 17-4-67 11019’N 73049’E 2080 90 2058-2133
134 “ 18-4-67 10057’N 73022’E 1800 70 0420-0450
135 “ 18-4-67 10000’N 72000’E 2400 105 2020-2050
136 “ 18-4-67 10000’N 72002’E 2300 70 2100-2130
137 “ 18-4-67 09058’N 72004’E 2100 40 2148-2218
138 “ 19-4-67 09041’N 72030’E 1850 105 0910-0940
139 “ 19-4-67 10022’N 73035’E 2100 105 2050-2120
140 “ 19-4-67 10025’N 73033’E 2100 24 2140-2210
141 “ 20-4-67 10015’N 75018’E 1200 117 2115-2140
142 “ 20-4-67 10015’N 75020’E 1000 90 2200-2230
143 “ 20-4-67 10015’N 75022’E 880 25 2245-2315
144 V-110 28-4-67 15015’N 73032’E 95 70 1000-1045
145 “ 28-4-67 14015’N 73058’E 55 25 1500-1530
146 “ 29-4-67 13021’N 73028’E 120 70 1930-2030
147 “ 30-4-67 12045’N 74032’E 53 30 0715-0815
148 “ 1-5-67 12012’N 74022’E 180 70 0015-0115
149 “ 1-5-67 11032’N 74042’E 180 70 0730-0815
150 V-111 11-5-67 Off Colachel 183 85 1520-1550
82
C O N C L U S I O N S
1. The intensive surveys of R.V. VARUNA on the south west coast have very clearly indicated the
existence of rich potential resources of certain deep sea fish species (Chlorophthalmus, Cubiceps,
Pseneopsis etc.) and prawns (Parapandalus spinipes, Heterocarpus gibbosus, H. wood-masoni
and others) etc. on the upper continental slope about which very little or practically no information
was available hitherto, although the occurrence of the deep sea lobster Puerulus sewelli, the seep
sea prawns Penaeopsis rectacutus, Aristeus semidentatus, etc., were earlier recorded from
catches by R.V. CONCH and R.V. KALAVA (Kurian, 1963, 1964; Samuel, 1963 George and
Vedavyasa Rao, 1966; Tholasilingam et al., 1964). Some of these recent discoveries of prawns
and deep sea fishes such as the rhinchimaeroid Neoharriotta pinnata, the squaloid sharks
Atractophorus armatus, Echinorhinus brucus and several other fishes show the inadequacy of
our knowledge about the natural distribution of these deep sea forms. The fully equipped and large
vessels of the Indo-Norwegian Project viz.,M.V. KLAUS SUNNANA, M.V. VELAMEEN and
M.V. TUNA have proved within a short time the feasibility of fishing on a commercial scale in the
deep waters of the shelf edge and the upper continental slope. These vessels should be fully
utilized for further explorations of the continental slope.
2. The existence of ‘kalava’ grounds was well known especially through the fairly intensive fishing of
some of the grounds off Cochin by R.V. KALAVA. The importance of the present cruises lies in
the fact that the surveys carried out by them have proved adequate to give an idea of the pattern
of distribution of the ‘kalava’ grounds on the south west coast. It is for the first time that sonar has
been used in our water in conjuction with echosounders with the result that a fuller knowledge of
the locations and distribution of the grounds is now available.
3. Traditional fishing of surface shoals of tuna by pole and line using live bait is being rapidly
replaced in the Pacific Ocean by countries such as the United States and Japan taking to
purse seining with remarkable success. Purse seining for tuna tried in our oceanic
waters have failed so far because of the unsuitability of the particular net for
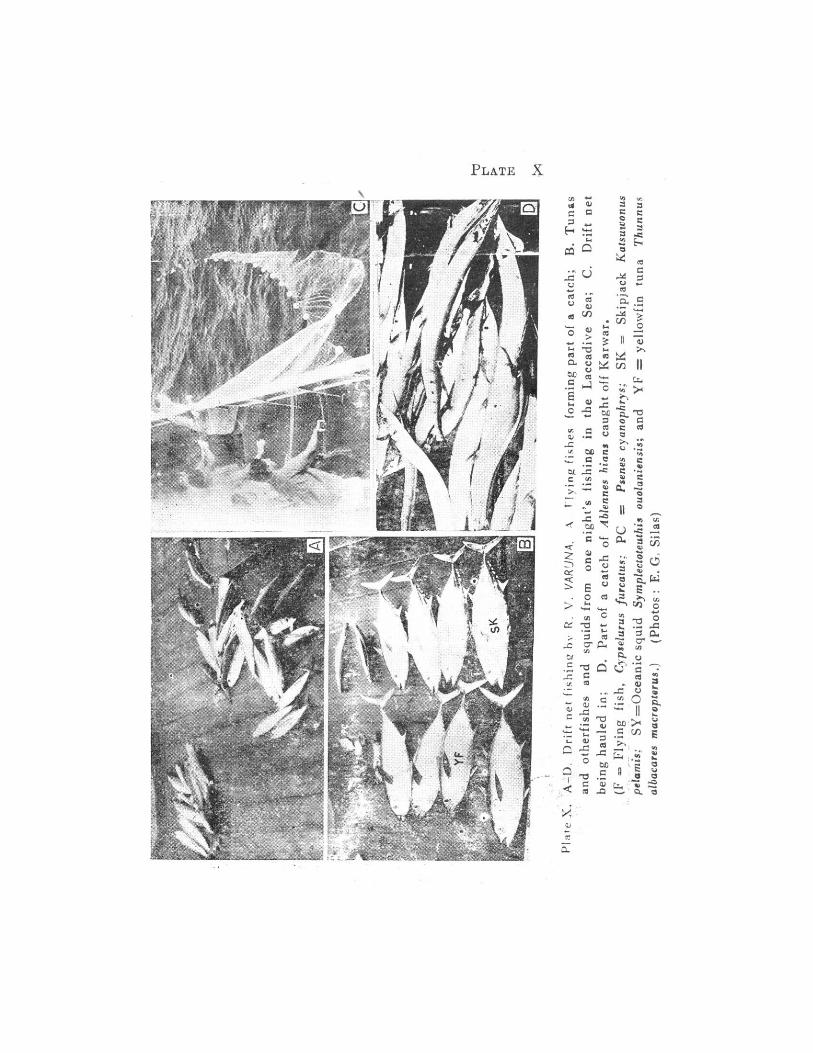
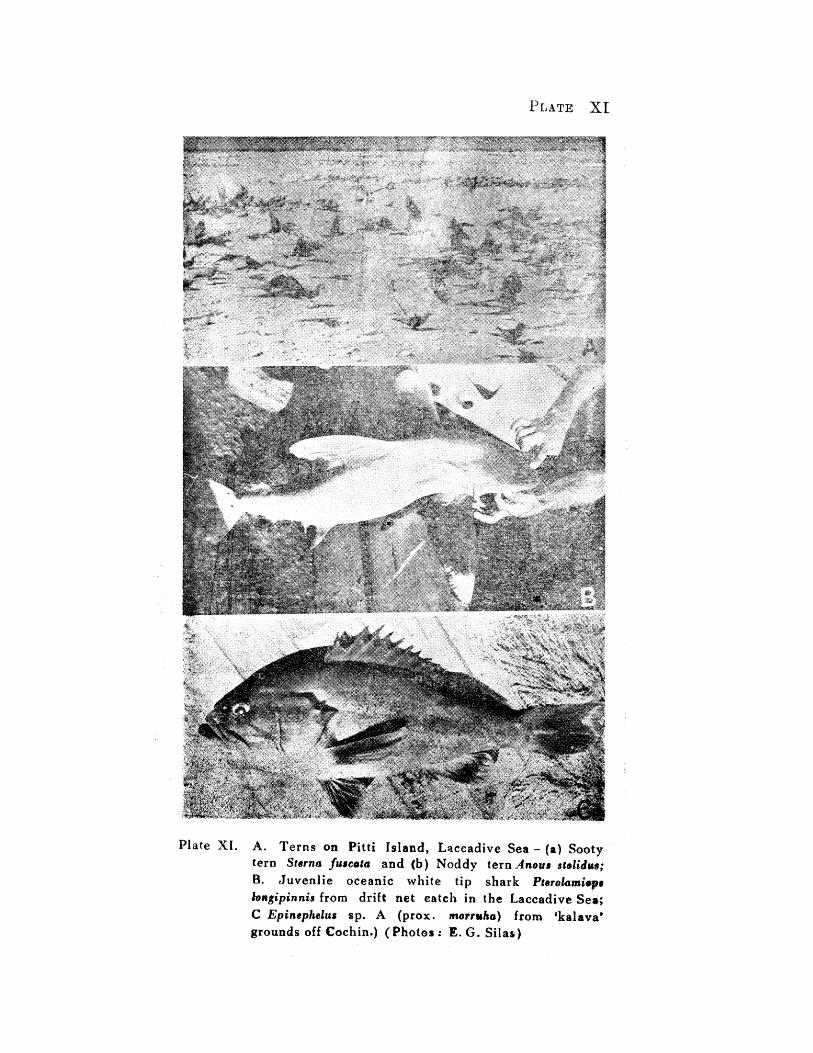
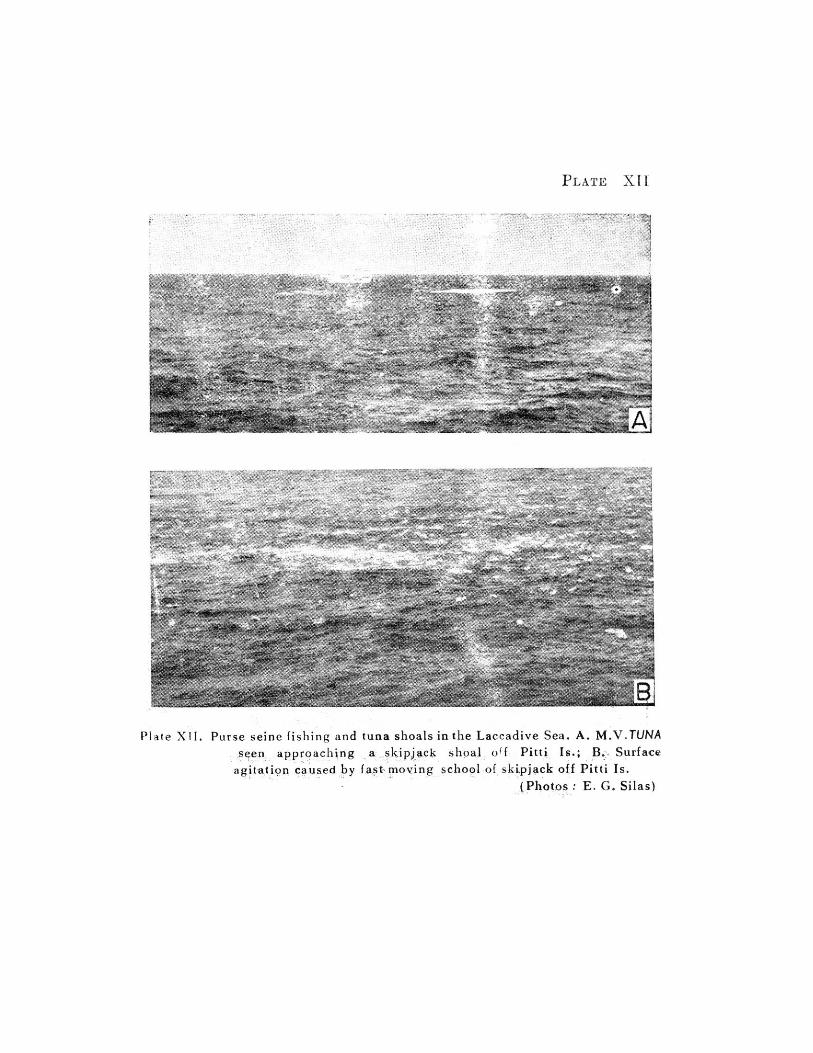
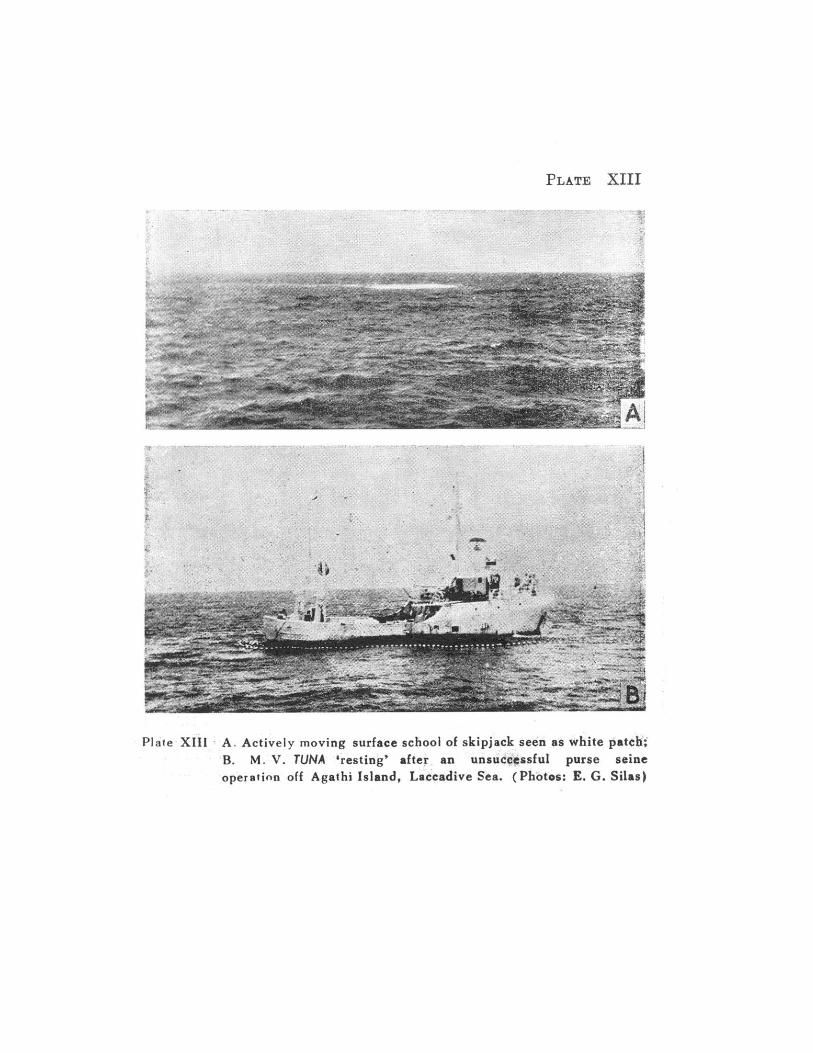
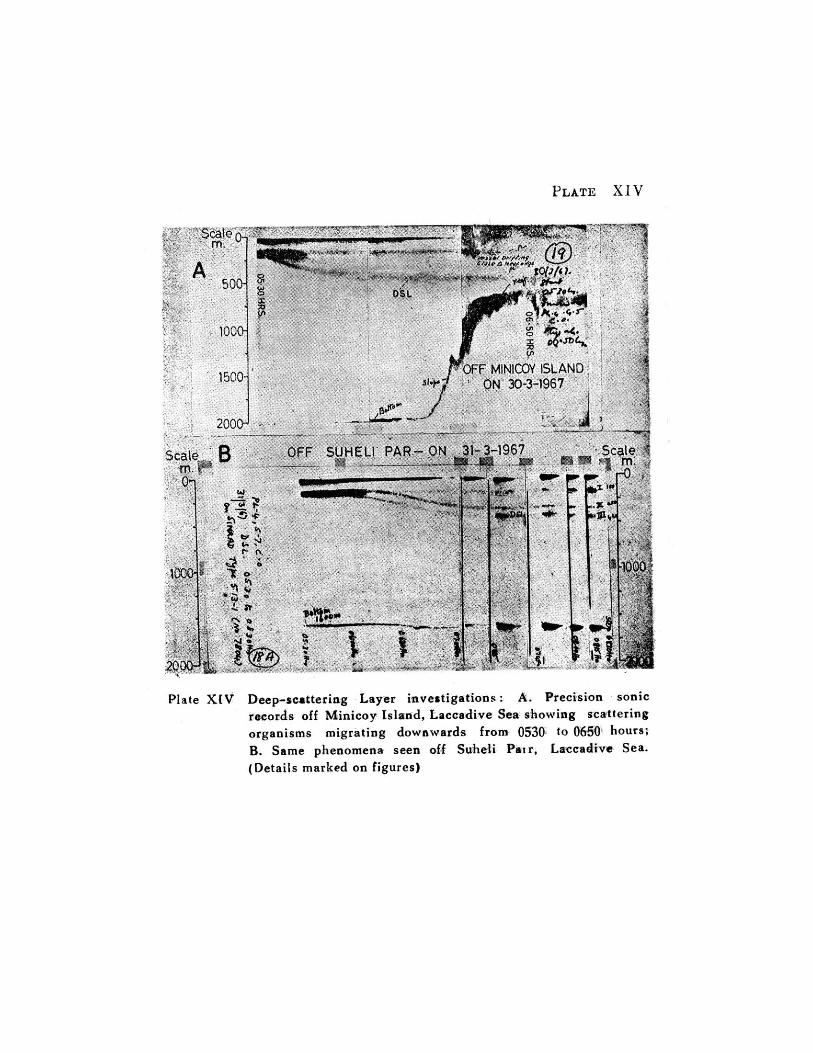
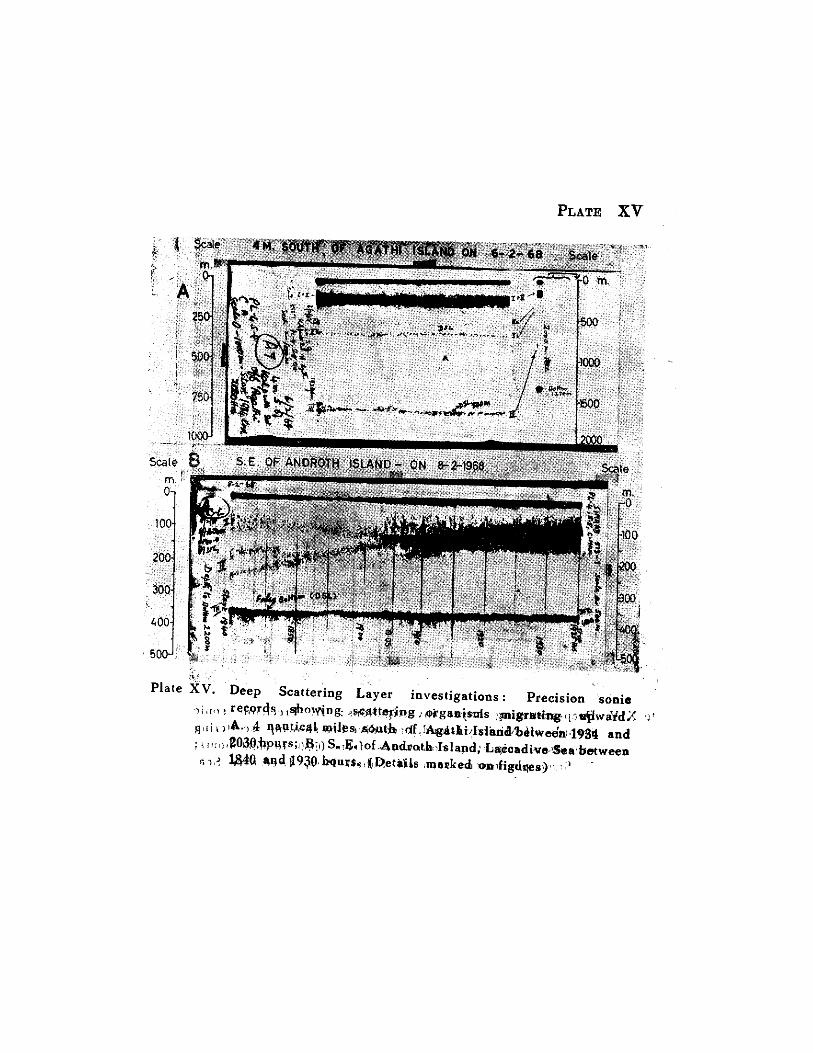
83
successful operation in the oceanic areas as well as the inexperience in using the gear. These being the first
attempts at purse seining for tunas in our waters, the failure met with should not deter us from intensifying
explorations.
4. Two significant results were obtained by drift-fishing. The frigate mackerel Auxis thazard and A.
rochei were earlier reported to occur sporadically along our coast. By drift net fishing and actual
observations during the research cruises it was found that both these species occur in fair abundance
in our offshore and oceanic waters, a fact which was little known hitherto.”Silent’ surface shoals of
A. rochei were very frequently encountered at dusk over the shelf edge.
Another finding is the abundance of oceanic squids, particularly Symplectoteuthis oualaniensis
schools of which were invariably attracted by light to the ship’s side at night and found to feed on smaller
planktonic organisms and fish thus attracted. This is one of the commercially important species fished in
the Pacific. There is need for collecting more information on oceanic squids and exploring the possibilities
of develpiong a fishery for these.
At the same time, the introduction of monofilament nylon gill nets for tunas on the Laccadive Sea
and other areas also need to be considered.
5. The vertical migration of organisms causing sonic scattering has been regularly observed during the
cruises of R.V. VARUNA. Tuna occurring in depths may also be detectable by the echo sounder.
Very characterstic spire-like echo traces have been recorded from the Deep Scattering Layer
between 300 and 450 metres as well as in the subsurface scattering layer generally between 50
and 150 metres during day time. There is a good amount of indirect evidence from the catch
composition of Isaacs-Kidd midwater trawl operated in the Deep Scattering Layers, as well as
from the information available on the food of oceanic tunas to presume that such spire-like echo
traces could possibly represent tunas, especially the larger species such as yellowfin and bigeye
tunas or perhaps also billfishes. These investigations need to be intensified in order to understand
more about the habits of tunas and billfishes to enable use of suitable gear at proper depths for
fishing them.
84
6. A number of devices are used for detecting and following pelagic fish shoals, the recent innovations
being the sonar, and aerial survey by spotter planes and helicopters. However, visual scouting is
still relied on by skippers of pole-and-line fishing boats and purse-seiners and in this connection
very useful indicators of shoals and their habits are oceanic birds. During the present cruises,
positions of surface and even subsurface tuna sholes have been very easily detected at a distance
of several miles in the Laccadive Sea by observing the movements and behaviour of bird flocks.
Chiefly the sooty tern Sterna fuscata and the noddy tern Anous stolidus, both known to breed
on Pitti Island and Cherbaniani Island in the Laccadives. These birds indirectly help the skippers
to avoid unnecessary scouting, thus saving on ship’s fuel and time. More attention should be given
to the study of the living habits of these birds which breed on some of the uninhabited islands.
7. Foreign vessels have been sighted fishing off our coasts and from the Laccadive Sea, which also
indicates the richness of our waters (Figure, 22). In conclusion it may be stated that the indications
of the possible existence of very rich fish and prawn resources in the deep water grounds and the
continental slope are so strong and the need for stepping up food production to meet the food
shortage so imminent that we cannot afford to neglect any longer the urgent need to explore these
resources adequarely and exploit them in a satisfactory manner.
R E F E R E N C E C S
Anonymous, 1931. A systematic survey of the Madras Deep-sea fishing grounds by S.T.”Lady Goschen”
1927-28. Rept. No.3 of 1929: Madras Fish. Bull., No. 23: 153-187.
Anonymous, 1962. Report on a systematic survey of the Madras Deep-Sea fishing grounds by S.T. “Lady
Goschen” 1930. Ibid., No. 28: 27-95.
Chidambaram, K. 1953. The experimental introduction of powered fishing vessels within India and Ceylon.
Proc. Indo-Pacific. Fish. Coun., (ivth meeting, 1952), Sect. 2: 225-233.
85
George, M.J. and P. Vedavyasa Rao 1966. On some decapod crustaceans from the south west coast ofIndia. Proc. Symposium on Crustacea, Part I: 327-346.
Gopinath, K. 1954. Anote on some deep sea fishing experiments off the south western coast of India.Indian J. Fish., 1 (1&2): 163-216.
Hefford, C.F. 1949. Report on the work of “William Carrick”. Govt. Press, Bombay.
Hornell, J. 1916. Notes on two exploring cruises in search of trawl grounds off the Indian and Ceyloncoasts. Madras Fish. Bull., No.14: 33-70.
John,C.C. 1948. Progress Report of the Fisheries Development Schemes Central Research Institute,Travancore University Division of Marine Biology and Fisheries, 1-8.
John, V., P.I. Chacko, R. Venkataraman and A.T. Sherif 1959. Report of fishing experiments in the offshorewaters of the Madras State Fish. Stn. Repts & Year Book, Dept. Fisheries Govt. of Madras, 106-138.
Jones, S. and M. Kumaran 1959. The fishing industry at Minicoy Island with special reference to the tunafishery. Indian J. Fish., 6(1): 30-57.
Jones, S. and E.G. Silas 1964. A systematic review of the scombroid fishes of India. Symposium onScombroid Fishes, MandapamCamp, pt. 1: 1-105.
Kurian, C.V. 1963. Further observations on the deep water lobster Peurulus sewelli Ramadan offKerala Coast. Bull. Dept. Mar. Biol. Oceanogr. Univ. Kerala, 1: 122-127.
Kurian, C.V. 1964. On the occurrence of deep-water prawn Penaeopsis rectacutus (Spence Bate) offKerala coast. Curr. Sci., 33 (7): 216-217.
Kurian, C.V. 1965. Deep water prawns and lobsters off the Keralas Coast. Fish. Tech., 2 (1): 51-53.
Menon, M.D. and K.M. Joseph 1969. Development of kalava (Rock Cod) fishery off south west coast ofIndia-A prospectus. Seafood Export Journl, 1 (2): 7-28.
Myrland, Per 1962. Research Vessel VARUNA. J. mar. Biol. Ass. India, 4 (2): 224-225.Rao, K. Virabhadra 1969. Distribution pattern of the major exploited marine fishery resources of India.Bull. cent. mar. Fish. Res. Inst., No.6: 1-69.
Raj, B.S. 1933. Report on a systematic survey of Deep Sea fishing grounds by S.T. “Lady Goschen” for1928-29. Rept. No.3 of 130: Madras Fish. Bull., No.24: 199-232.
86
Samuel, C.T. 1963. Bottom fishes collected by R.V. Conch off Kerala Coast. Bull. Dept. Mar. biol.Oceanogr. Univ. Kerala,1: 97-121.
Silas, E.G. 1967. Tuna fishery of the Tinnevelly Coast, Gulf of Mannar. Proc. Symposium on ScombroidFishes, Mandapam Camp, pt. 3: 1083-1118.
Silas, E.G. 1968. Cephalopoda of the west coast of India collected during the cruises of the ResearchVessel VARUNA, with a catalogue of the species known from the indian ocean. Proc. Symposium onMollusca, Pt. 1:27-361.
Silas, E.G. and K.J. Mathew 1967. Stylocheiron indicus, a new euphausiid (Crustacea: Euphausiacea)from Indian Seas. Curr. Sci., 36 (7): 196-172.
Silas, E.G. and K.J. Mathew (MS). Euphausiacea of the South Eastern Arabian Sea and the LaccadiveSea from the deepwater plankton and Isaacs-Kidd Midwater Trawl collections made during the cruise ofR.V. VARUNA.
Silas, E.G. and M.S. Rajagopalan 1967. The sailfish and marlins of the Tuticorin coast. Proc. Symposiumon Scombroid fishes, Mandapam Camp, pt. 3: 1119-1131.
Silas, E.G., D. Sadananda Rao and C.P. Ramamirtham 1968. Potential demersal fisheries of the uppercontinental slope and the shelf edge in relation to the hydrological features. Symposium on the LivingResources of the Seas around India, CMFRI, Mandapam Camp, Dec. 1968, Abstract, p. 15 (Underpublication).
Silas, E.G., G.S.D. Selvaraj and A. Regunathan 1969. Rare chimaeroid and elasmobranch fishes from thecontinental slope off the west coast of India. Curr. Sci., 38(5): 105-106.
Silas, E.G. and P.A. Thomas (MS). Maturation, fecundity and spawning of tunas of the south easternArabian Sea and the Laccadive Sea.
Sorley, H.T. 1948. The Marine Fisheries of the Bombay Presidency. pp. 1-174.
Tholasilingam, T., G. Venkataraman and K.N. Krishna Kartha 1964. On some bathypelagic fishes takenfrom the continental slope of the south west coast of India. J.mar.biol.Ass. India, 6(2): 268-284.
Watson, G.E. R.L. Zusi and R.E. Storer 1963. Preliminary field guide to the birds of the Indian Ocean.Smithsonian Institution, Washington, pp. i-x, 1-214.

Related Documents