EXPLORATORY AND CONFIRMATORY FACTOR ANALYSIS OF THE ABERRANT BEHAVIOR CHECKLIST-COMMUNITY IN AN AUTISM SPECTRUM DISORDER SAMPLE WITH RATNGS COMPLETED BY SPECIAL EDUCATION STAFF By Richard Birnbaum A DISSERTATION Submitted to Michigan State University in partial fulfillment of the requirements for the degree of School Psychology—Doctor of Philosophy 2019

Welcome message from author
This document is posted to help you gain knowledge. Please leave a comment to let me know what you think about it! Share it to your friends and learn new things together.
Transcript

EXPLORATORY AND CONFIRMATORY FACTOR ANALYSIS OF THE ABERRANT
BEHAVIOR CHECKLIST-COMMUNITY IN AN AUTISM SPECTRUM DISORDER
SAMPLE WITH RATNGS COMPLETED BY SPECIAL EDUCATION STAFF
By
Richard Birnbaum
A DISSERTATION
Submitted to
Michigan State University
in partial fulfillment of the requirements
for the degree of
School Psychology—Doctor of Philosophy
2019

ABSTRACT
EXPLORATORY AND CONFIRMATORY FACTOR ANALYSIS OF THE ABERRANT
BEHAVIOR CHECKLIST-COMMUNITY IN AN AUTISM SPECTRUM DISORDER
SAMPLE WITH RATNGS COMPLETED BY SPECIAL EDUCATION STAFF
By
Richard Birnbaum
Although there are established measures to diagnose Autism Spectrum Disorder (ASD),
there are no currently comparable measurement tools available to assess outcomes for core and
associated features for ASD interventions. One scale, the Aberrant Behavior Checklist-
Community (ABC-C; Aman & Singh, 2017), originally developed to assess intervention research
outcomes for problematic behavior and associated features in individuals with intellectual
disability (ID), appears to be a promising option for this purpose. The 58-item ABC-C rating
scale has become a popular choice amongst ASD intervention researchers (Bolte & Diehl, 2013).
Many of the core and associated features of ASD, the prime targets of intervention, are
represented within the scale. However, ABC-C validity research in the ASD population
specifically is still limited. Previously, three exploratory factor analyses (EFA; Brinkley et al.,
2007; Kaat, Lecavalier, & Aman, 2014; Mirwis, 2011) and two confirmatory factor analyses
(CFA; Brinkley et al., 2007; Kaat et al., 2014) have been performed on the ABC-C in ASD
samples. These analyses have yielded inconsistent factor solutions across studies, with
marginally fitting models upon testing. This has left questions about the rigor or thoroughness of
the analytic strategies, including the range of factor solutions examined, the logic behind the
selection of the factor solutions retained, and possible differences due to rater type. Thus,
additional thorough and independent factor analyses were warranted for the purpose of
determining whether the ABC-C authors’ posited five-subscale interpretive structure is the most
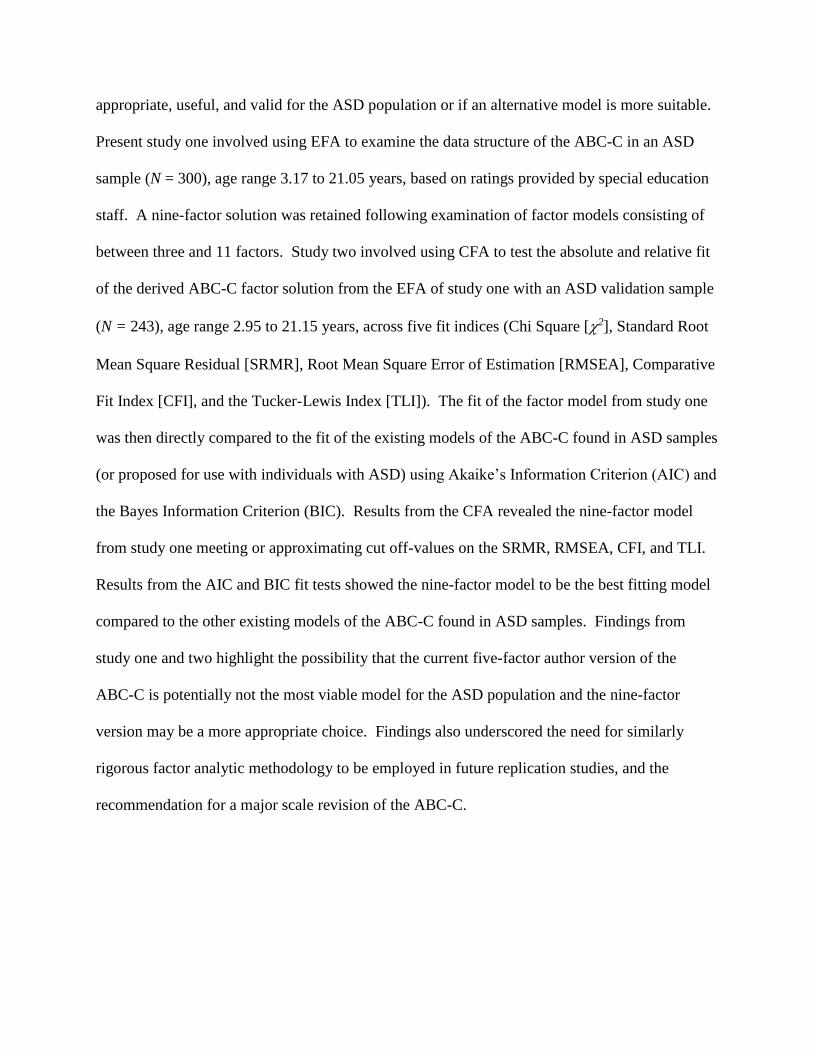
appropriate, useful, and valid for the ASD population or if an alternative model is more suitable.
Present study one involved using EFA to examine the data structure of the ABC-C in an ASD
sample (N = 300), age range 3.17 to 21.05 years, based on ratings provided by special education
staff. A nine-factor solution was retained following examination of factor models consisting of
between three and 11 factors. Study two involved using CFA to test the absolute and relative fit
of the derived ABC-C factor solution from the EFA of study one with an ASD validation sample
(N = 243), age range 2.95 to 21.15 years, across five fit indices (Chi Square [2], Standard Root
Mean Square Residual [SRMR], Root Mean Square Error of Estimation [RMSEA], Comparative
Fit Index [CFI], and the Tucker-Lewis Index [TLI]). The fit of the factor model from study one
was then directly compared to the fit of the existing models of the ABC-C found in ASD samples
(or proposed for use with individuals with ASD) using Akaike’s Information Criterion (AIC) and
the Bayes Information Criterion (BIC). Results from the CFA revealed the nine-factor model
from study one meeting or approximating cut off-values on the SRMR, RMSEA, CFI, and TLI.
Results from the AIC and BIC fit tests showed the nine-factor model to be the best fitting model
compared to the other existing models of the ABC-C found in ASD samples. Findings from
study one and two highlight the possibility that the current five-factor author version of the
ABC-C is potentially not the most viable model for the ASD population and the nine-factor
version may be a more appropriate choice. Findings also underscored the need for similarly
rigorous factor analytic methodology to be employed in future replication studies, and the
recommendation for a major scale revision of the ABC-C.

Copyright by
RICHARD BIRNBAUM
2019

v
For my wife, Amy.
For my parents, Mel and Joan.

vi
ACKNOWLEDGEMENTS
There are countless people to thank for all their help, support, and guidance before,
during, and after my dissertation experience. But most directly I want to thank the members of
my dissertation committee: Dr. Martin Volker, Dr. Jodene Fine, Dr. Gloria Lee, and Dr. Connie
Sung. Thank you all so much for mentoring me through the process. I am forever grateful.
vii
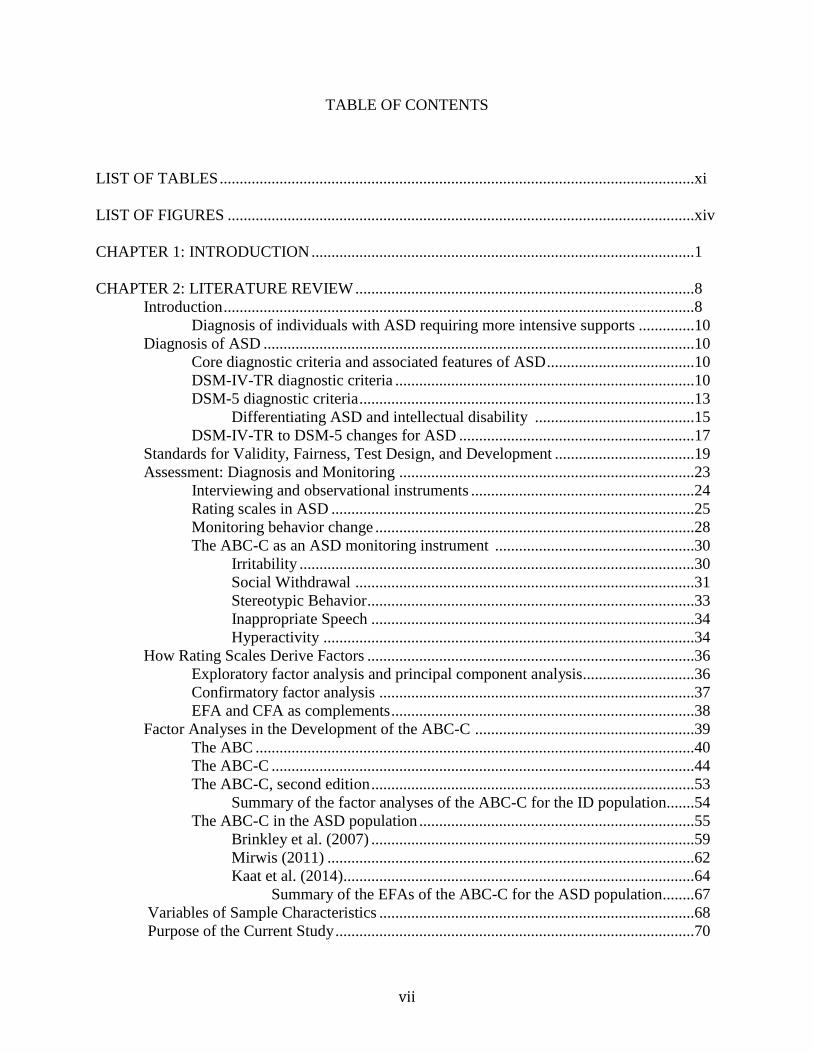
TABLE OF CONTENTS
LIST OF TABLES .......................................................................................................................xi
LIST OF FIGURES .....................................................................................................................xiv
CHAPTER 1: INTRODUCTION ................................................................................................1
CHAPTER 2: LITERATURE REVIEW .....................................................................................8
Introduction ......................................................................................................................8
Diagnosis of individuals with ASD requiring more intensive supports ..............10
Diagnosis of ASD ............................................................................................................10
Core diagnostic criteria and associated features of ASD .....................................10
DSM-IV-TR diagnostic criteria ...........................................................................10
DSM-5 diagnostic criteria ....................................................................................13
Differentiating ASD and intellectual disability ........................................15
DSM-IV-TR to DSM-5 changes for ASD ...........................................................17
Standards for Validity, Fairness, Test Design, and Development ...................................19
Assessment: Diagnosis and Monitoring ..........................................................................23
Interviewing and observational instruments ........................................................24
Rating scales in ASD ...........................................................................................25
Monitoring behavior change ................................................................................28
The ABC-C as an ASD monitoring instrument ..................................................30
Irritability ...................................................................................................30
Social Withdrawal .....................................................................................31
Stereotypic Behavior ..................................................................................33
Inappropriate Speech .................................................................................34
Hyperactivity .............................................................................................34
How Rating Scales Derive Factors ..................................................................................36
Exploratory factor analysis and principal component analysis............................36
Confirmatory factor analysis ...............................................................................37
EFA and CFA as complements ............................................................................38
Factor Analyses in the Development of the ABC-C .......................................................39
The ABC ..............................................................................................................40
The ABC-C ..........................................................................................................44
The ABC-C, second edition .................................................................................53
Summary of the factor analyses of the ABC-C for the ID population.......54
The ABC-C in the ASD population .....................................................................55
Brinkley et al. (2007) .................................................................................59
Mirwis (2011) ............................................................................................62
Kaat et al. (2014)........................................................................................64
Summary of the EFAs of the ABC-C for the ASD population ........67
Variables of Sample Characteristics ...............................................................................68
Purpose of the Current Study ..........................................................................................70

viii
Research Questions ........................................................................................................73
Research question 1 .............................................................................................73
Research question 2 .............................................................................................73
Research question 3 ............................................................................................73
Research question 4 .............................................................................................73
Research question 5 .............................................................................................73
CHAPTER 3: METHOD .............................................................................................................75
Research Design...............................................................................................................75
Extant Data Collection .....................................................................................................75
Raters ...................................................................................................................76
Procedures ............................................................................................................76
Inclusion/exclusion criteria ..................................................................................77
Study One: EFA ...............................................................................................................79
Research questions, rationales, and hypotheses ...................................................79
Research question 1 ..................................................................................79
Research rationale and hypothesis 1 ................................................79
Research question 2 ..................................................................................80
Research rationale and hypotheses 2a, 2b, and 2c ...........................80
Research question 3 ..................................................................................81
Research rationale and hypothesis 3 ................................................81
Research question 4 ..................................................................................82
Research rationale and hypothesis 4 ................................................82
Study one sample demographics ..........................................................................85
Measure for study one ..........................................................................................86
ABC-C reliability ......................................................................................87
ABC-C validity .........................................................................................89
Data analysis for study one ..................................................................................92
Pre-analysis data cleaning and missing data ........................................................92
Data matrix sufficiency for factoring ..................................................................92
Extraction methods ..............................................................................................93
Number of factors to retain .................................................................................94
Rotation ................................................................................................................94
Interpreting the solution .......................................................................................94
Internal consistency ............................................................................................95
Comparing five-factor solutions .........................................................................96
Study Two: CFA ..........................................................................................................................96
Research question, rationale, and hypotheses ......................................................96
Research question 5 ..................................................................................96
Research rationale and hypotheses 5a and 5b ...................................96
Study two sample demographics .........................................................................98
Data analysis for study two .................................................................................99
Pre-analysis: Data cleaning and missing data ......................................................100
Data matrix sufficiency for factoring ..................................................................100
Model specification ..............................................................................................102
Model identification .............................................................................................103

ix
Model estimation ................................................................................................105
Model fit...............................................................................................................105
Model modification .............................................................................................109
CHAPTER 4: RESULTS .............................................................................................................110
Analysis............................................................................................................................110
Study One.........................................................................................................................110
Data cleaning and missing data............................................................................110
Data matrix sufficiency for factoring ..................................................................110
Research question 1 ..................................................................................114
Initial extraction ...............................................................................114
Summary of initial extraction results ...............................................124
Research question 2 ..................................................................................125
Rotation ............................................................................................125
Interpretation ....................................................................................126
Factor I: Hyperactivity .....................................................................133
Factor II: Stereotypic Behavior .......................................................134
Factor III: Self-Injury/Aggressiveness .............................................134
Factor IV: Social Withdrawal .........................................................134
Factor V: Inappropriate Speech .......................................................135
Factor VI: Lethargy..........................................................................135
Factor VII: Irritability/Tantrums ......................................................135
Factor VIII: Noncompliance ...........................................................136
Factor IX: Oppositionality ..............................................................136
Research question 2 summary ........................................................136
Research question 3 ..................................................................................137
Research question 4 ..................................................................................139
Research question 4 summary .........................................................145
Study Two .......................................................................................................................145
Data cleaning and missing data............................................................................145
Model specification ..............................................................................................145
Model identification .............................................................................................146
Model estimation .................................................................................................147
Model fit...............................................................................................................147
Research question 5 ..................................................................................149
Research question 5 hypothesis 5a summary ...................................153
AIC and BIC fit indices ...................................................................153
Research question 5 hypothesis 5b summary ..................................154
CHAPTER 5: DISCUSSION .......................................................................................................171
Overview of Study One and Study Two .........................................................................171
Summary and Interpretation of Findings for Study One .................................................176
Research question 1 and hypothesis 1 .................................................................176
Research question 2 and hypotheses 2a, 2b, and 2c ...........................................178
Research question 3 and hypothesis 3 .................................................................184
Research question 4 and hypothesis 4 .................................................................189

x
Study One Implications....................................................................................................191
Theoretical ..........................................................................................................191
Research methodology ........................................................................................194
Practice .................................................................................................................197
Study One Limitations .....................................................................................................199
Sample and raters .................................................................................................199
External validity and generalizability .................................................................200
Rotation ................................................................................................................201
Extraction criteria ................................................................................................201
Study One Future Research Implications .......................................................................202
Summary and Interpretations of Findings for Study Two ...............................................206
Research question 5 and hypotheses 5a and 5b ...................................................206
Study Two Implications ...................................................................................................210
Theoretical ..........................................................................................................210
Research methodology ........................................................................................214
Practice .................................................................................................................216
Study Two Limitations ..................................................................................................217
Sample size and potential moderators .................................................................218
Generalizability ...................................................................................................219
Measurement and analyses ..................................................................................220
Study Two Future Research Implications .......................................................................222
APPENDICES .............................................................................................................................226
APPENDIX A: EFA Model 1 ..............................................................................227
APPENDIX B: EFA Model 2 ..............................................................................228
APPENDIX C: EFA Model 3 ..............................................................................229
APPENDIX D: EFA Model 4 ..............................................................................230
APPENDIX E: EFA Model 5 ..............................................................................231
APPENDIX F: EFA Model 6 ..............................................................................232
APPENDIX G: Inter-Item Polychoric Correlation Matrix ..................................233
APPENDIX H: Nine-Factor Solution Structure Matrix ......................................239
APPENDIX I: Brinkley et al. (2007) Four-Factor Model Study Two CFA
Statistics ...............................................................................................................242
APPENDIX J: Brinkley et al. (2007) Five-Factor Model Study Two CFA
Statistics ...............................................................................................................244
APPENDIX K: Aman et al. (1985a) Five-Factor Model Study Two CFA
Statistics ...............................................................................................................246
APPENDIX L: Sansone et al. (2012) Six-Factor Model Study Two CFA
Statistics ...............................................................................................................248
APPENDIX M: Mirwis (2011) Seven-Factor Model Study Two CFA
Statistics ...............................................................................................................250
REFERENCES ............................................................................................................................252
xi
LIST OF TABLES
Table 1. Examples of Standards for Validity .................................................................
20
Table 2. Examples of Standards for Fairness .................................................................
21
Table 3. Examples of Standards for Test Design and Development ..............................
21
Table 4. Summary of Exploratory Factor Analyses of the Aberrant Behavior
Checklist (ABC) ...............................................................................................
41
Table 5. Item Changes Between the ABC and ABC-C ..................................................
45
Table 6. Summary of Exploratory Factor Analyses of the Aberrant Behavior
Checklist–Community (ABC-C) with ID and Alternative Populations ...........
49
Table 7. Summary of Confirmatory Factor Analyses of the Aberrant Behavior
Checklist–Community (ABC-C) with ID and Alternative Populations ...........
52
Table 8. Subscale Name Changes in the ABC-C Second Edition Manual ....................
53
Table 9. Summary of Exploratory Factor Analyses of the Aberrant Behavior
Checklist–Community (ABC-C) with ASD Samples ......................................
56
Table 10. Summary of Confirmatory Factor Analyses of the Aberrant Behavior
Checklist–Community (ABC-C) with ASD Samples ......................................
57
Table 11. Summary of Study One Research Questions ...................................................
84
Table 12. Demographic Characteristics of Study One Sample ........................................
85
Table 13. Summary of Study Two Research Questions ...................................................
98
Table 14. Demographic Characteristics of Study Two Sample .......................................
98
Table 15. Descriptive Statistics of the EFA Dataset ........................................................
111
Table 16. Eigenvalues for the Guttman-Kaiser Criterion .................................................
115
Table 17. Parallel Analysis with Observed and Random Eigenvalues at the 95th
Percentile ..........................................................................................................
118
Table 18. Velicer’s MAP Test Depicting Squared Average and Fourth Average Partial
Correlations ......................................................................................................
121

xii
Table 19.
Summary of Factor Retention Test Results ...................................................... 125
Table 20. Nine-Factor Solution Pattern Matrix ................................................................
130
Table 21. EFA Inter-Factor Correlation Matrix Nine-Factor Solution ............................
137
Table 22. Ordinal Alpha and Cronbach’s Alpha for the Nine-Factor ABC-C
Solution ............................................................................................................
138
Table 23. Factor Names from the Aman and Singh (2017) Five-Factor Solution and
the Five-Factor Solution from Study One ........................................................
140
Table 24. Highest Loading Items in the Aman and Singh (2017) Five-Factor Solution
and the Five-Factor Solution from Study One .................................................
142
Table 25.
Percentage of Overlapping Items from the Five-Factor Solution from Study
One Compared to the Aman and Singh (2017) Five-Factor Solution ..............
143
Table 26. CFA Model Results: Absolute Fit Indices ......................................................
150
Table 27.
CFA Model Results: RMSEA Parsimony Correction Index ............................
151
Table 28. CFA Model Results: Comparative Fit Indices ................................................
152
Table 29. CFA Model Results: AIC and BIC Parsimony Correction Indices ..................
153
Table 30. Study Two CFA Nine-Factor Model Parameter Estimates, Standard Errors,
Two-Tailed p-Value, R2, Residual Variance ....................................................
155
Table 31.
CFA Inter-Factor Correlation Matrix Nine-Factor Solution ............................
170
Table 32.
Study One Inter-Item Polychoric Correlation Matrix (N= 300).......................
233
Table 33. Study One EFA Nine-Factor Solution Structure Matrix .................................
239
Table 34.
Brinkley et al. (2007) Four-Factor Model Parameter Estimates, Standard
Errors, Two Tailed p-Value, R2, Residual Variance ........................................
242
Table 35. Brinkley et al. (2007) Five-Factor Model Parameter Estimates, Standard
Errors, Two Tailed p-Value, R2, Residual Variance ........................................
244
Table 36. Aman et al. (2007) Five-Factor Model Parameter Estimates, Standard
Errors, Two Tailed p-Value, R2, Residual Variance ........................................
246

xiii
Table 37. Sansone et al. (2012) Six-Factor Model Parameter Estimates, Standard
Errors, Two-Tailed p-Value, R2, Residual Variance ........................................
248
Table 38.
Mirwis (2011) Seven-Factor Model Parameter Estimates, Standard Errors,
Two Tailed p-Value, R2, Residual Variance ....................................................
250

xiv
LIST OF FIGURES
Figure 1. Scree plot with eigenvalues generated from SPSS R programming
language plugin ................................................................................................
117
Figure 2. Graphic depiction of parallel analysis with observed and random
eigenvalues at the 95th percentile generated from the SPSS R programming
language plugin ............................................................................................... Scree Plot with Eigenvalues Generated from SPSS R Programming Language Plugin
120
Figure 3. Close-up graphic depiction of parallel analysis with observed and random
eigenvalues at the 95th percentile generated from the SPSS R programming
language plugin ................................................................................................
120
Figure 4. Illustration of Velicer’s MAP test depicting squared average and fourth
average partial correlations ..............................................................................
123
Figure 5. Close-Up illustration of Velicer’s MAP test depicting squared average and
fourth average partial correlations ...................................................................
124
Figure 6. Path diagram of the Hyperactivity factor from the nine-factor model with
factor loadings and residuals (i.e., random error and unique variation) ..........
161
Figure 7. Path diagram of the Stereotypic Behavior factor from the nine-factor
model with factor loadings and residuals (i.e., random error and unique
variation) ..........................................................................................................
162
Figure 8. Path diagram of the Self-Injury/Aggressiveness factor from the nine-factor
model with factor loadings and residuals (i.e., random error and unique
variation) ..........................................................................................................
163
Figure 9. Path diagram of the Social Withdrawal factor from the nine-factor model
with factor loadings and residuals (i.e., random error and unique
variation) ..........................................................................................................
164
Figure 10. Path diagram of the Inappropriate Speech factor from the nine-factor
model with factor loadings and residuals (i.e., random error and unique
variation) ..........................................................................................................
165
Figure 11. Path diagram of the Lethargy factor from the nine-factor model with factor
loadings and residuals (i.e., random error and unique variation) .....................
166
Figure 12. Path diagram of the Irritability/Tantrums factor from the nine-factor model
with factor loadings and residuals (i.e., random error and unique
variation) ..........................................................................................................
167
xv
Figure 13. Path diagram of the Noncompliance factor from the nine-factor model with
factor loadings and residuals (i.e., random error and unique variation) ..........
168
Figure 14. Path diagram of the Oppositionality factor from the nine-factor model with
factor loadings and residuals (i.e., random error and unique variation) ..........
169
Figure 15. Brinkley et al. (2007) four-factor model ..........................................................
227
Figure 16. Brinkley et al. (2007) five-factor model ..........................................................
228
Figure 17. Mirwis (2011) seven-factor model ...................................................................
229
Figure 18. Aman et al. (1985a) five-factor model .............................................................
230
Figure 19. Sansone et al. (2012) six-factor model .............................................................
231
Figure 20. Study one nine-factor model ...........................................................................
232

1
CHAPTER 1: INTRODUCTION
Autism Spectrum Disorder (ASD) is classified as a neurodevelopmental disorder in the
Diagnostic and Statistical Manual of Mental Disorders, Fifth Edition (DSM-5; American
Psychiatric Association; APA, 2013). It consists of two core diagnostic criteria: (a) deficits in
social communication and social interaction, and (b) circumscribed, repetitive actions and
interests (APA, 2013). According to Baio et al. (2018), ASD is currently estimated to affect 1 in
59 children and shows a higher prevalence in boys than girls (i.e., 4.5:1 ratio). As individual,
familial, economic, political, and social costs associated with ASD continue to rise (Lavelle et
al., 2014; Leigh & Du, 2015), it is becoming increasingly necessary to develop the most effective
and efficient instruments to evaluate and support the best possible outcomes.
One of the current challenges with regard to ASD is finding appropriate measurement
tools to assess outcomes in core and associated features of ASD within the intervention context
(Lord et al., 2005). Although there are established measures used to diagnose ASD, such as the
Autism Diagnostic Interview-Revised (ADI-R; LeCouteur, Lord, & Rutter, 2003) and the Autism
Diagnostic Observation Schedule, Second Edition (ADOS-2; Lord, Rutter, DiLavore et al.,
2012), there are no comparable measures to assess core and associated features targeted in
behavioral ASD interventions (Bolte & Diehl, 2013). This is because of the broad range of
symptom manifestation and associated features found in ASD, beyond the more narrow core
diagnostic criteria (Brinkley et al., 2007), makes it challenging to effectively measure treatment
effects between individuals with such varying symptom presentations. Additionally, ASD
diagnostic instruments such as the ADI-R (LeCouteur et al., 2003), and the ADOS-2 (Lord,
Rutter, DiLavore et al., 2012) require specific expertise and an extended time frame to
administer (Lord, Corsello, & Gradzinski, 2014). They are also expensive, time consuming, and

2
were not designed to be sensitive enough to measure short-term changes in behavior (Bolte &
Diehl, 2013; Brinkley et al., 2007; Lord et al., 2014).
Without established tools to measure treatment effects (i.e., intervention outcomes),
researchers often resort to inappropriately using ASD diagnostic instruments and those not
specifically designed for the ASD population to measure short-term behavior, symptom, or skills
changes (Brinkley et al., 2007; Lord et al., 2014). One particular measure, the Aberrant
Behavior Checklist-Community (ABC-C; Aman & Singh, 2017), has emerged as one of the most
popular and possibly useful instruments to measure behavior change in children and adults with
ASD (Aman & Singh, 2017; Bolte & Diehl, 2013), although it was not initially designed for the
ASD population. Intellectual disability (ID) was the population of interest and development for
the ABC-C (Aman & Singh, 2017) but it has since been widely adopted for use with individuals
with ASD as well.
ASD researchers became intrigued with the ABC-C because its content seemed to reflect
a variety of core and associated problematic behaviors found in ASD that are typically the main
targets of treatment. However, the ABC-C was put into use by ASD researchers prior to being
been factor analyzed for the ASD population. For example, a key psychopharmacological study
examining the effects of Risperidone on individuals with ASD (McCracken, 2002) used the
ABC-C Irritability subscale as the primary outcome measure. McCracken et al. (2002) was one
of the major studies used as justification for the Food and Drug Administration’s (FDA) decision
to approve Risperidone usage with individuals with ASD in 2006 (Aman & Singh, 2017). Yet,
the first factor analytic study of the ABC-C for the ASD population occurred in 2007 (Brinkley
et al., 2007).
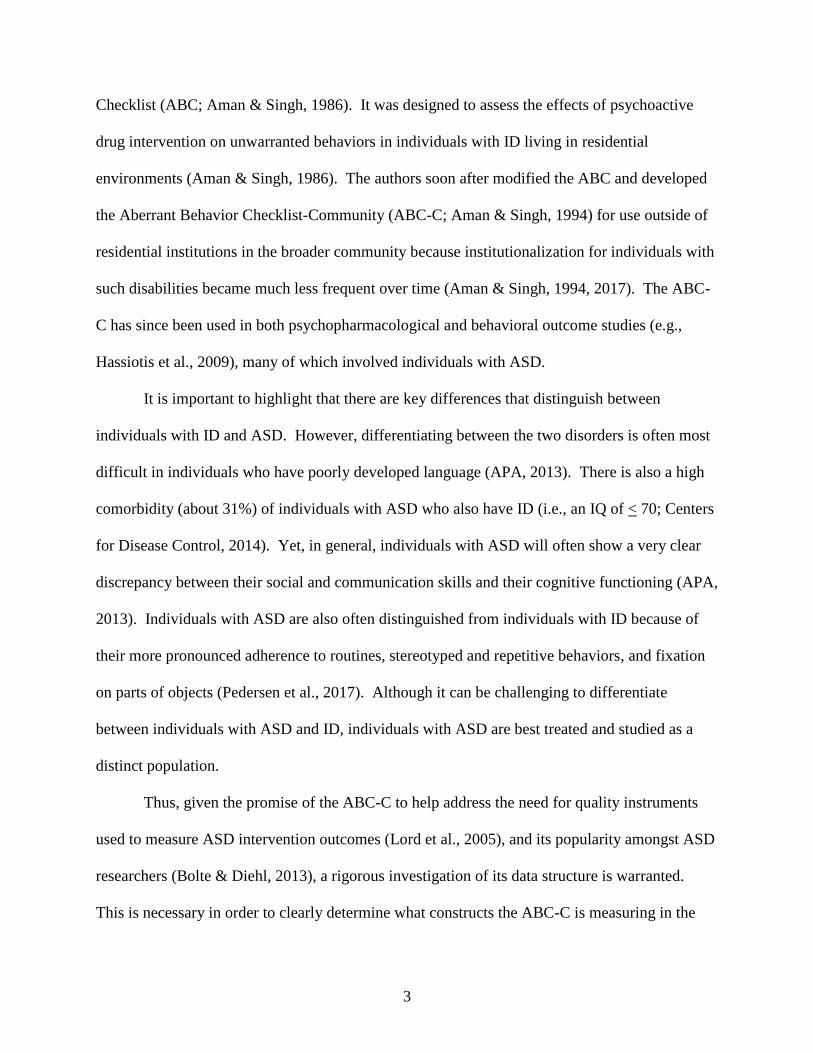
Prior to the ABC-C, there was an initial version of the scale, The Aberrant Behavior
3
Checklist (ABC; Aman & Singh, 1986). It was designed to assess the effects of psychoactive
drug intervention on unwarranted behaviors in individuals with ID living in residential
environments (Aman & Singh, 1986). The authors soon after modified the ABC and developed
the Aberrant Behavior Checklist-Community (ABC-C; Aman & Singh, 1994) for use outside of
residential institutions in the broader community because institutionalization for individuals with
such disabilities became much less frequent over time (Aman & Singh, 1994, 2017). The ABC-
C has since been used in both psychopharmacological and behavioral outcome studies (e.g.,
Hassiotis et al., 2009), many of which involved individuals with ASD.
It is important to highlight that there are key differences that distinguish between
individuals with ID and ASD. However, differentiating between the two disorders is often most
difficult in individuals who have poorly developed language (APA, 2013). There is also a high
comorbidity (about 31%) of individuals with ASD who also have ID (i.e., an IQ of < 70; Centers
for Disease Control, 2014). Yet, in general, individuals with ASD will often show a very clear
discrepancy between their social and communication skills and their cognitive functioning (APA,
2013). Individuals with ASD are also often distinguished from individuals with ID because of
their more pronounced adherence to routines, stereotyped and repetitive behaviors, and fixation
on parts of objects (Pedersen et al., 2017). Although it can be challenging to differentiate
between individuals with ASD and ID, individuals with ASD are best treated and studied as a
distinct population.
Thus, given the promise of the ABC-C to help address the need for quality instruments
used to measure ASD intervention outcomes (Lord et al., 2005), and its popularity amongst ASD
researchers (Bolte & Diehl, 2013), a rigorous investigation of its data structure is warranted.
This is necessary in order to clearly determine what constructs the ABC-C is measuring in the

4
ASD population, in contrast to the ID population for which the ABC-C was initially designed. It
is essential to understand how best to organize and score the subtest structures of the instrument
so that it can be most effectively implemented with individuals with ASD.
With regard to analyzing a data structure, factor analysis has emerged as a primary
method for evaluating, summarizing, and understanding the multifaceted patterns and
relationships found in psychological measures (Fabrigar & Wegener, 2012; Floyd & Widaman,
1995) like the ABC-C. These factor analytic techniques are used to discern the underlying
constructs in instruments in the form of factors (Fabrigar & Wegener, 2012). Exploratory factor
analysis (EFA) is regarded as the most useful technique for uncovering these latent constructs in
the early stages of instrument development or instrument validation (Osborne & Banjanovic,
2016). Confirmatory factor analysis (CFA) is used to test theorized factor structures that are
typically derived from an EFA (Fabrigar & Wegener, 2012). EFA is meant to be exploratory,
meaning that it enables one to produce various potential solutions without forcing any strong
assumptions about the relationships into the data (Fabrigar & Wegener, 2012). CFA is more
limiting and meant to assess the fit of a hypothesized factor structure (Pett, Lackey, & Sullivan,
2003). However, factor analyses in the developmental disability literature have historically had
many shortcomings (Norris & Lecavalier, 2010). This is true for the ABC-C as well, as multiple
EFAs and CFAs have been performed on the scale yielding varying factor solutions, raising
many questions regarding the instrument’s most appropriate subscale or score structure.
More specifically, there have only been three EFAs and two CFAs on the ABC-C in
samples of those with ASD (i.e., Brinkley et al., 2007; Kaat, Lecavalier, & Aman, 2014; Mirwis,
2011). These three EFAs have resulted in differing factor solutions across the existing studies,
with four-, five-, and seven-factor structures. In one of the EFAs, a study by Brinkley et al.

5
(2007), only four-and five-factor structures were considered as possible solutions, limiting
exploration of other interpretable solutions that could have emerged from the data. In Kaat et al.,
(2014) it appears that a questionable factor solution selection rationale resulted in retention of a
five-factor solution consistent with expectations of the ABC-C authors. Further, only one study,
Mirwis (2011), used agency/special educational staff to rate participants, as the other two factor
analytic studies used parents/caregivers as raters. This is potentially important as the rater brings
her own unique perspectives to ratings and can influence outcomes (Hoyt, 2000). Raters from a
special education environment might interpret questions differently than parents or caregivers
who know their children in a separate context. Additionally, as research has shown, context can
influence rater behavior as well (Tziner, Murphy, & Cleveland, 2005).
With regard to the two CFAs on samples of those with ASD (Brinkley et al., 2007; Kaat
et al., 2014), only Kaat et al. (2014) examined multiple factor solutions (four-, five-, and six-
factor solutions). Neither Kaat et al. (2014) nor Brinkley et al. (2007) found a strong model fit
with the solutions they examined. Additionally, the seven-factor solution found in Mirwis
(2011) was not included in the analysis by Kaat et al. (2014). Thus, performing a rigorous EFA
analysis and generating a robust model first, followed by performing a CFA on this new model
and examining all previous theorized models—including the solution generated by Mirwis
(2011)—will enable the best factor structure, in terms of absolute and relative fit, to emerge for
the ABC-C for individuals with ASD.
Overall, the purpose of this study is to examine the factor structure of the ABC-C using
an ASD sample rated by special education staff members to address the following four gaps in
the literature: a lack of sufficient research performed on the factor structure of the ABC-C with
ASD samples; a failure in the current literature to explore alternative factor structures in the

6
EFAs of the ABC-C and in turn to examine more of these models in a CFA; only one study
(Mirwis, 2011) has used special education staff members as raters with an ASD sample resulting
in a unique seven-factor structure, raising the question about whether raters in this environment
can influence a different factor structure; and no study has performed a CFA on the ABC-C
directly comparing all the models generated with ASD samples (i.e., Brinkley et al., 2007 Kaat et
al., 2014; Mirwis, 2011).
The exploratory portion of the study will investigate a range of possible factor
structures—giving a better sense of what degree the five-subscale interpretative structure
proposed by the ABC-C authors is suitably generalizable to individuals with ASD or if an
alternative structure would better capture variation in item ratings among those with ASD. The
confirmatory part of the study will test the fit of the factor model generated in the EFA against
the existing proposed factor models for individuals with ASD. Performing both an EFA and
CFA, this study will address existing methodological shortcomings in the ABC-C psychometric
literature and contribute another exploratory and confirmatory analysis to the currently limited
number of rigorous factor analytic studies of the ABC-C for individuals with ASD. The study is
particularly important for individuals within the ASD population who require the most intensive
levels of support (i.e., individuals with impaired verbal and nonverbal communication with little
to no intelligible speech and severe restricted, repetitive behaviors) who would most benefit from
a measure that is able to assess changes in their behavior over time. Thus, given the role the
ABC-C has played as a key outcome measure in various behavioral and psychopharmacological
studies for individuals with ASD and its popularity amongst ASD researchers (Bolte & Diehl,
2013), it is critical to illuminate the most suitable factor structure for the ASD population. This
will help to address the concern that the default scoring structure of the ABC-C may not be

7
appropriate for, or fully represent the range of constructs assessed by the ABC-C in those with
ASD.

8
CHAPTER 2: LITERATURE REVIEW
Introduction
Autism Spectrum Disorder (ASD) is estimated to affect 1 in 59 children, with rates
higher in boys than girls (4.5:1; Baio et al., 2018). Leigh and Du (2015) estimated that societal
costs for ASD (i.e., medical and non-medical interventions and productivity loss for caregivers
and individuals with ASD) were approximately $268.3 billion in 2015 or 1.5% of United States
gross domestic product (GDP). The authors projected that the societal cost for ASD will rise to
$460.8 billion, or 1.6% of GDP, by 2025, becoming a greater economic expenditure than
Attention-deficit/hyperactivity disorder (ADHD) and diabetes (Leigh & Du, 2015). Further,
Lavelle et al. (2014) found that taking care of a child with ASD, factoring in a variety of
associated care expenses, resulted in an estimated extra $17,081 per year. In addition, political
and social complexities associated with individuals with ASD have arisen as well, such as
disability rights issues and inclusionary challenges (Ripamonti, 2016). Put simply, individuals
with ASD have had a tangible impact on the economic, political, and social elements of US
society.
ASD is classified as a neurodevelopmental disorder, with symptoms typically apparent
early in development (APA, 2013). Core characteristics of ASD involve deficits with regard to
social communication and interaction as well as the presence of “restricted, repetitive patterns of
behavior, interests, or activities” (APA, 2013, p. 31). ASD is conceptualized as a spectrum of
behaviors that can manifest in various ways depending upon the severity of an individual’s
particular deficits, stage of development, and the presence of certain associated features.
Conceptualization of ASD has evolved since the original description by Kanner (1943), as
experts have attempted to grasp the heterogeneity of symptomology (Volkmar, Reichow,
9
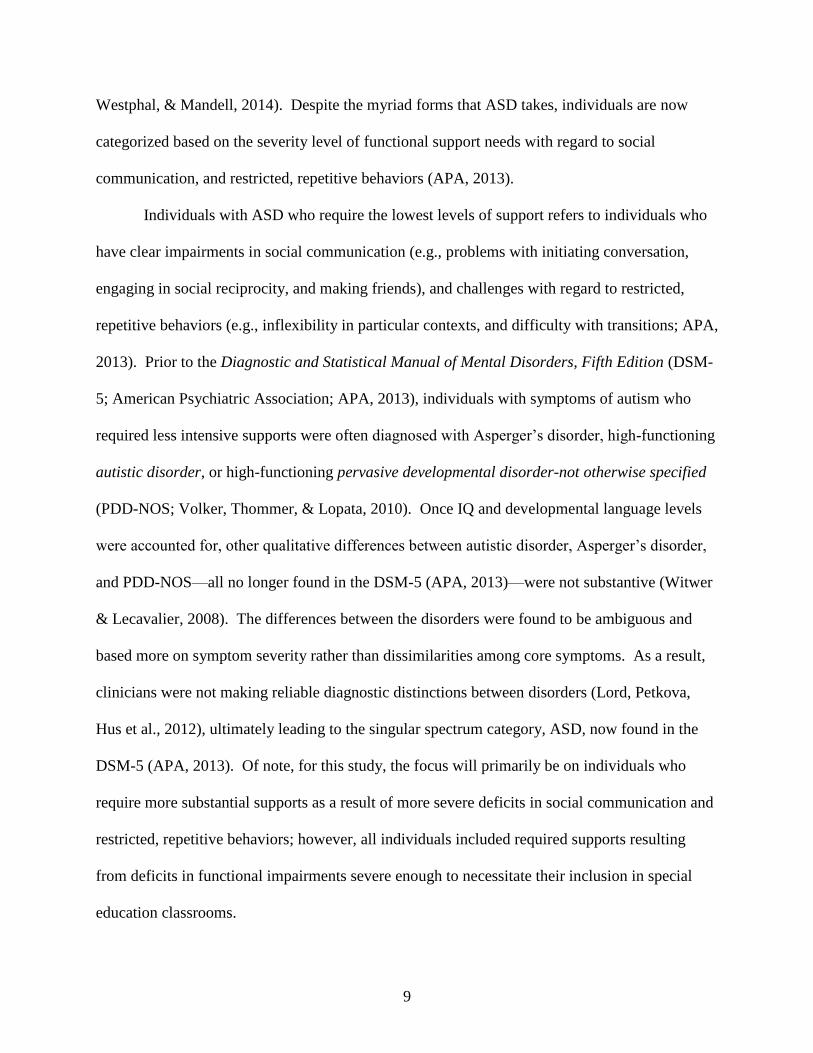
Westphal, & Mandell, 2014). Despite the myriad forms that ASD takes, individuals are now
categorized based on the severity level of functional support needs with regard to social
communication, and restricted, repetitive behaviors (APA, 2013).
Individuals with ASD who require the lowest levels of support refers to individuals who
have clear impairments in social communication (e.g., problems with initiating conversation,
engaging in social reciprocity, and making friends), and challenges with regard to restricted,
repetitive behaviors (e.g., inflexibility in particular contexts, and difficulty with transitions; APA,
2013). Prior to the Diagnostic and Statistical Manual of Mental Disorders, Fifth Edition (DSM-
5; American Psychiatric Association; APA, 2013), individuals with symptoms of autism who
required less intensive supports were often diagnosed with Asperger’s disorder, high-functioning
autistic disorder, or high-functioning pervasive developmental disorder-not otherwise specified
(PDD-NOS; Volker, Thommer, & Lopata, 2010). Once IQ and developmental language levels
were accounted for, other qualitative differences between autistic disorder, Asperger’s disorder,
and PDD-NOS—all no longer found in the DSM-5 (APA, 2013)—were not substantive (Witwer
& Lecavalier, 2008). The differences between the disorders were found to be ambiguous and
based more on symptom severity rather than dissimilarities among core symptoms. As a result,
clinicians were not making reliable diagnostic distinctions between disorders (Lord, Petkova,
Hus et al., 2012), ultimately leading to the singular spectrum category, ASD, now found in the
DSM-5 (APA, 2013). Of note, for this study, the focus will primarily be on individuals who
require more substantial supports as a result of more severe deficits in social communication and
restricted, repetitive behaviors; however, all individuals included required supports resulting
from deficits in functional impairments severe enough to necessitate their inclusion in special
education classrooms.

10
Diagnosis of individuals with ASD requiring more intensive supports. Although
diagnosis of ASD is challenging across the spectrum, given the wide range of core and comorbid
symptom presentation and intensity (Huerta & Lord, 2012), individuals who require more
significant supports are more likely to be identified according to the DSM-5 (APA, 2013) ASD
criteria than individuals who require less significant supports (McPartland, Reichow, Volkmar,
2012). Early signs of individuals with more severe symptomology with ASD can often be seen
in the first or second year of life through developmental delays in language, and social
interaction (APA, 2013). These symptoms, though typically screened for in pediatric checkup
visits (and then further assessed more intensively if necessary), are still often under-identified
given the wide range of individual presentation and intensity (Huerta & Lord, 2012).
Diagnosis of ASD
Core diagnostic criteria and associated features of ASD. Assessing ASD is
complicated (Huerta & Lord, 2012). Different types of instruments have been developed
specifically for that undertaking, including observational systems, behavior rating scales,
retrospective rating scales, and structured interviews for current and past functioning. All of
these instruments are ultimately tied to the DSM-5 (APA, 2013), considered the central
diagnostic resource used by clinicians and researchers. Because the scope of this study
encompasses a change from an earlier version of the Diagnostic and Statistical Manual of
Mental Disorders, fourth edition, text revision (DSM-IV-TR; APA, 2000) to the current version
(DSM-5; APA, 2013), criteria for diagnosing ASD for both versions are presented here.
DSM-IV-TR diagnostic criteria. The DSM-IV-TR (APA, 2000) lists five disorders
with symptoms of autism under the Pervasive Developmental Disorders (PDDs) category: Rett’s
disorder, childhood disintegrative disorder (CDD), Asperger’s disorder, PDD-NOS, and autistic
11
disorder (APA, 2000). Rett’s disorder, which involves a number of distinctive features, was
found to have a genetic basis (Amir et al., 1999) setting it apart from the autism spectrum and is
now considered a distinct progressive neurological disorder (Volkmar, et al., 2014). CDD,
included in the DSM-IV-TR (APA, 2000) essentially for research purposes (Volkmar et al.,
2014), has also been removed from the DSM-5 (APA, 2013) given disputes about its validity as a
disorder that is different from ASD (Volker et al., 2010). Asperger’s disorder was the diagnostic
classification typically applied to individuals with symptoms of autism (i.e., challenges with
social interactions) but intact cognitive, linguistic, and adaptive skills (Volker et al., 2010).
PDD-NOS was the diagnosis applied to individuals who did not meet full criteria for any of the
other PDDs but still exhibited significant symptoms of autism (Volker et al., 2010). Individuals
diagnosed with autistic disorder, Asperger’s disorder, or PDD-NOS under the Diagnostic and
Statistical Manual of Mental Disorders, fourth edition (DSM-IV APA, 1994) and the DSM-IV-
TR (APA, 2000) were subsequently subsumed under the criteria for ASD in the DSM-5 (APA,
2013). As such, only the core diagnostic features of autistic disorder will be highlighted in this
section, as research has shown (e.g., Witwer & Lecavalier, 2008) Asperger’s disorder and PDD-
NOS to be essentially indistinguishable.
In order to have obtained a diagnosis of autistic disorder in the DSM-IV-TR (APA,
2000), three core features must have been met: “qualitative impairment in social interaction” and
“communication”, as well as evidence of “restricted repetitive and stereotyped patterns of
behavior, interests, and activities” (APA, 2000, p. 75). A diagnosis must also have included
developmental delays or atypical behavior prior to age three with regard to “social interaction,”
or “language as used in social communication,” or “symbolic or imaginative play” (APA, 2000,
p. 75)

12
To have met diagnostic criteria for “impairment in social interaction” in the DSM-IV-TR
(APA, 2000), individuals must have demonstrated at least two of the following symptoms:
noticeable challenges with various nonverbal behaviors (e.g., eye gaze, physical posture); lack of
success in creating age-appropriate, peer relationships; absence of “spontaneous seeking to share
enjoyment, interests, or achievements” with others, and a lack of “social or emotional
reciprocity” (APA, 2000, p. 75). To have met diagnostic criteria for “qualitative impairments in
communication,” individuals must have shown only one of the following symptoms: “delay in,
or total lack of, the development of spoken language,” without attempting to communicate via
other non-verbal behaviors; challenges for individuals with “adequate speech” with regard to
their skills in initiating or maintaining dialogue; “stereotyped and repetitive use of language or
idiosyncratic language”; and lack of or limited “spontaneous make-believe play or social
imitative play” suitable for the individual’s “developmental level” (APA, 2000, p. 75). To have
met diagnostic criteria for “restricted repetitive and stereotyped patterns of behavior, interests,
and activities,” individuals must have displayed at least one of the following symptoms: fixation
“with one or more stereotyped and restricted patterns of interest” considered to be atypical
“either in intensity or focus”; seemingly rigid observance to particular, “nonfunctional routines
or rituals”; “stereotyped and repetitive motor mannerisms”; and “persistent” fixation with “parts
of objects” (APA, 2000, p. 75).
Thus, the DSM-IV-TR (APA, 2000) established that difficulties with social interaction,
communication, and restricted, repetitive and stereotyped patterns of behavior were essential to
the autistic disorder diagnosis—which was viewed as the full manifestation of a syndrome, or
extreme end of a spectrum, which the other ASDs among the PDDs appeared to only partially
manifest. However, as subsequent research on the autism spectrum population progressed, it

13
became apparent that diagnostic parameters needed to be modified and broadened to allow the
other ASD-related diagnoses (i.e., Asperger’s Disorder, and PDD-NOS) to be included with
autistic disorder under a larger diagnostic umbrella.
DSM-5 diagnostic criteria. The DSM-5 (APA, 2013), released in 2013, changed the
emphasis of core features for the diagnoses of ASD. In order to obtain a diagnosis of ASD in the
DSM-5 (APA, 2013), two core features must be met: “persistent deficits in social
communication and social interaction across multiple contexts” and “restricted, repetitive
patterns of behavior, interests, or activities” (APA, 2013, p. 50). Each of these core criteria is
also to be assigned one of three increasingly intensive levels of current severity. Level one
signifies “requiring support,” level two signifies “requiring substantial support,” and level three
signifies “requiring very substantial support” (APA, 2013, p. 52). Individuals require supports to
be in place to accommodate for impairments if they have a level one severity in social
communication (e.g., initiating social interactions, making friends, and challenges with social
reciprocity), and with restricted, repetitive behaviors (e.g., inflexibility in particular contexts,
difficulties with organization and planning; APA, 2013). Individuals require more significant
supports to be in place to accommodate for impairments if they have a level two severity in
social communication (e.g., noticeable deficits in verbal and nonverbal social communication
even with supports, atypical nonverbal communication and lack of social initiation) and with
restricted, repetitive behaviors (e.g., challenges dealing with change, restricted or stereotypic
behaviors that are readily apparent and hinder functioning in multiple environments; APA,
2013). Individuals require the most intensive level of support in place to accommodate for
impairments if they have a level three severity in social communication (e.g., intensive deficits in
verbal and nonverbal communication that result in major impairments in functioning such as an

14
individual with little to no intelligible speech) and with restricted, repetitive behaviors (e.g.,
major challenges coping with change and restricted or stereotypic behavior that negatively
affects functioning in all contexts; APA, 2013). Diagnosis must also include the fact that
symptomology had to exist during the “early developmental period” even if it may not be greatly
pronounced “until social demands exceed limited capacities, or may be masked by learned
strategies later in life,” and the fact that symptomology has to result in “clinically significant
impairment in social, occupational, or other important areas of current functioning” (APA, 2013,
p. 50). The DSM-5 (APA, 2013) also specifies that individuals who received diagnoses under
the DSM-IV-TR (APA, 2000) of autistic disorder, Asperger’s disorder, or PDD-NOS would now
assume an ASD diagnosis (APA, 2013, p. 51).
To meet diagnostic criteria for “persistent deficits in social communication and social
interaction across multiple contexts” individuals must demonstrate all three of the following
behaviors either presently or historically. First individuals must have “deficits in social-
emotional reciprocity” that can span from exhibiting atypical social interaction and lack of
typical conversational exchange to portraying limited “sharing of interests, emotions, or affect,”
and even displaying a failure to originate or respond to social exchanges (APA, 2013, p. 50).
Second, individuals must have “deficits in nonverbal communicative behaviors used for social
interaction” that can span from having inadequate verbal and nonverbal communication skills to
irregularities with regard to “eye contact and body language” and challenges in comprehending
and utilizing gestures, and a complete absence of “facial expression and nonverbal
communication” (APA, 2013, p. 50). Third, individuals must have “deficits in developing,
maintaining, and understanding relationships” spanning from challenges adapting behavior to be

15
appropriate in different social environments to “difficulties in sharing imaginative play or in
making friends” to a lack of curiosity in peers (APA, 2013, p. 50).
To meet diagnostic criteria for “restricted, repetitive patterns of behavior, interests, or
activities” individuals must demonstrate at least two of four specific behaviors—either presently
or historically. First, demonstrating “stereotyped or repetitive motor movements, use of objects,
or speech” (APA, 2013, p. 50). Second, portraying an “insistence on sameness, inflexible
adherence to routines, or ritualized patterns of verbal or nonverbal behavior” (APA, 2013, p. 50).
Third, displaying extremely limited and “fixated interests” that are atypical in “intensity or
focus” (APA, 2013, p. 50). Fourth, exhibiting “hyper-or hyporeactivity to sensory input or
unusual interest in sensory aspects of the environment” (APA, 2013, p. 50).
In addition to core features, discussed above, the DSM-5 (APA, 2013) highlights various
associated or comorbid features that are often present in individuals with ASD. These include,
cognitive and linguistic deficits, motor impairments, anxiety, depression, and catatonic motor
behavioral occurrences (e.g., “mutism, posturing, grimacing, and waxy flexibility”; APA, 2013,
p. 55). The DSM-5 (APA, 2013) also indicates that self-injury (“e.g., head banging, biting the
wrist”) is found in some individuals with ASD, with “disruptive/challenging behaviors more
common in children and adolescents with ASD than other disorders, including intellectual
disability” (APA, 2013, p. 55).
Differentiating ASD and intellectual disability. The DSM-5 (APA, 2013) highlights a
differential diagnosis between intellectual disability (ID) and ASD by noting that ASD is the
more suitable diagnosis when there is a clear incongruity “between the level of social-
communicative skills and other intellectual skills” (p. 58). However, as pointed out in the DSM-
5 (APA, 2013), differentiating between ASD and ID can be especially difficult in individuals

16
who have poorly developed language and “symbolic skills” because stereotypic behavior is often
common with individuals with both disorders (p. 58). According to the Centers for Disease
Control (CDC; 2014), 31% of individuals with ASD had IQ scores < 70 (in the ID range) and
23% had IQ scores between 71-85 (in the borderline range). Thus, there is a common
comorbidity between ASD and ID; yet, despite these high rates, researchers have found distinct
differences between individuals with ASD and ID.
Pedersen et al. (2017) performed and area under the curve analysis to determine which
specific diagnostic differences could be distinguished between individuals with ASD and ID.
The authors found that adherence to routines, stereotyped and repetitive behaviors, and fixation
on parts of objects were most discriminatory between the two groups. Spoken language and
conversation difficulties were less distinctive between the diagnoses (Pedersen et al., 2017).
Kraper, Kenworthy, Popal, Martin, & Wallace (2017) found adaptive behavior skills in
individuals with ASD with IQ’s > 70 to be significantly lower than normative peers. Further, the
authors found an inverse relationship between IQ and adaptive behavior in individuals with ASD
in that the greater the differences between IQ and adaptive functioning (e.g., higher IQ, lower
adaptive functioning), the higher the levels of depression, anxiety, and social challenges.
Kurzius-Spencer et al. (2018) looked at behavior issues in children with ASD with and without a
comorbid ID. They found that children with comorbid ASD and ID were at a higher risk of self-
injurious behavior, atypical fear reactions, and eating issues, but also found decreases in issues
with mood in individuals with lower IQ. Further, Kurzius-Spencer et al. (2018) found that in
children with ASD, the level of cognitive impairment was not related to the chance of
“inattention/hyperactivity, aggression, argumentative/oppositional behavior, temper tantrums, or
unusual sensory responses” (p. 67). Of note, research is mixed with regard to the effects of
17
comorbid ID and ASD with some recent studies (e.g., Goldin, Matson, & Cervantes, 2014) also
showing no significant effects on various behaviors (e.g., tantrums, stereotypic behavior,
depression/anxiety, conduct issues) compared to individuals with ASD only.
Overall, despite certain overlapping similarities between the disorders, research has
shown that there are distinct differences between individuals with ASD and ID. Nevertheless, it
remains challenging to distinguish between persons with ASD and ID, particularly from a
measurement perspective amongst individuals requiring the most extensive supports. As such,
the disorders themselves warrant further studying both separately and when they occur in a
comorbid fashion.
DSM-IV-TR to DSM-5 changes for ASD. Changes from the DSM-IV-TR (APA, 2000)
to DSM-5 (APA, 2013) have engendered a variety of research and clinical implications due to
differences in emphasis of core features and the broadening to a spectrum nosology that now
captures several other diagnostic categories present in the DSM-IV-TR (APA, 2000; Lecavalier,
2013; Volkmar et al., 2014). The major modifications included reducing the core symptom
domains from social, communication, and restricted, repetitive behavior to social-communication
(without requiring language delay) and restricted, repetitive behavior; expanding the diagnostic
options with greater developmental sensitivity such that diagnostic symptomology could be met
historically and did not need to be currently present; using specifiers (e.g., symptom severity,
intellectual impairment) instead of the previous DSM-IV-TR (APA, 2000) axial system; and,
perhaps the most fundamental of all the changes, removing the PDD category completely in
favor of an overarching category of Autism Spectrum Disorder (ASD). In essence, three of the
five PDD subcategories (Asperger’s disorder, autistic disorder, PDD-NOS) were subsumed
under the ASD classification in DSM-5 (APA, 2013). Rett’s disorder was subsequently removed

18
from the DSM-5 and childhood disintegrative disorder (CDD) was conceptualized as a later-
onset ASD (Lord & Jones, 2012; Volker, 2012).
According to Volkmar et al. (2014), justification for condensing the three core symptom
domains to two included factor analyses (e.g., Norris, Lecavalier, & Edwards, 2012) showing the
DSM-5 (APA, 2013) two-symptom model performing as well as the DSM-IV (APA, 1994) three-
symptom model. According to Lai, Lombardo, Chakrabarti, and Baron-Cohen (2013) the expansion
of ASD symptom criteria in DSM-5 (APA, 2013) to meet a historical standard rather than be
currently present resulted from a desire to improve diagnostic reliability (e.g., Lord & Jones, 2012).
Clinicians and researchers determined that while ASD is understood as a lifelong disorder,
symptomology may not be recognized for all individuals until environmental demands exceed
individual skill level. The move in DSM-5 (APA, 2013) to include specifiers (e.g., language
impairment and symptom severity) for the ASD diagnosis added pertinent clinical information to the
diagnostic category to inform both research and practice (Happé, 2011; Lai et al., 2013). Thus, as
Happé (2011) explained, the large symptom variability exhibited by individuals now falling within
the new, broad, spectrum diagnostic category in the DSM-5 would be accounted for alongside the
“essential shared features of the autism spectrum” diagnosis as well (p. 541). Overall, research
support for the changes from DSM-IV-TR (APA, 2000) to DSM-5 (APA, 2013) included evidence
of increased sensitivity and a slight decrease in specificity for an ASD diagnosis (e.g., Frazier et al.,
2012; Huerta, Bishop, Duncan, Hus, & Lord, 2012; Mazefsky, McPartland, Gastgeb, & Minshew,
2013; Volkmar et al., 2014).
The conceptual changes that occurred in the APA’s official diagnosis of ASD from DSM-IV-
TR (APA, 2000) to DSM-5 (APA 2013) meant that clinicians and researchers had to adapt their
understanding and practices to accommodate for the new disorder. Part of this change involved
19
assessing whether the associated instruments that they used with regard to ASD would still be
appropriate and effective. Although no instrument is ever perfectly constructed, standards and
guidelines have been established to assist developers in making the highest possible quality
measures. These standards are also helpful in assessing whether developers of existing instruments
have taken the necessary steps to produce measures that are effective for the way that they are
currently used.
Standards for Validity, Fairness, Test Design and Development
The Standards for Educational and Psychological Testing (SEPT; 2014) offers guidelines
for test development and usage. Authored by the American Educational Research Association,
the APA, and the National Council on Measurement in Education, the SEPT was developed in
order to establish a solid foundation by which to examine the validity of test outcomes. It is
intended for both test developers and users as well as for researchers who examine test
properties. Although these standards are most appropriately applied to standardized measures
(e.g., cognitive or achievement tests), the authors highlight that they can still be helpful with
regard to a wide range of instruments (SEPT, 2014).
The SEPT addresses key testing topics including validity, reliability, fairness, design and
development, scores and norms, administration, and rights and responsibilities of test takers and
users (SEPT, 2014). As the authors point out, the SEPT is not meant to be a checklist nor is it
expected for every test to satisfy every standard in the SEPT, but rather that the spirit of the
standards be maintained. The authors highlight the fact that the field of testing is constantly
developing and that the SEPT requires periodic revision (SEPT, 2014). Examples of SEPT
standards most relevant to this study for validity, fairness, and test design and development are
provided in Table 1, Table 2 and Table 3.

20
Table 1. Examples of Standards For Validity
Cluster Standard
Number
Standard
Establishing
Intended Uses
and
Interpretations
1.1 The test developer should set forth clearly how test scores are intended to be
interpreted and consequently used. The population(s) for which a test is intended
should be delimited clearly and the construct or constructs that the test is intended to
assess should be described clearly.
Establishing
Intended Uses
and
Interpretations
1.3 If validity for some common or likely interpretation for a given use has not been
evaluated, or if such an interpretation is inconsistent with available evidence, that fact
should be made clear and potential users should be strongly cautioned about making
unsupported interpretations.
Establishing
Intended Uses
and
Interpretations
1.4 If a test score is interpreted for a given use in a way that has not been validated, it is
incumbent on the user to justify the new interpretation for that use, providing a
rationale and collecting new evidence if necessary.
Examples of the SEPT with regard to Validity in Table 1 highlight the importance of tests
to make clear the populations with which they are intended to be used. These selected standards
with regard to Establishing Intended Uses and Interpretations seem to emphasize the fact that
tests are developed with particular populations in mind. Thus, if users implement a test with a
different population, the validity of the test outcome is called into question. This is not to say
that a test can never be given or even valid with a different population than it was originally
intended, but rather, that interpretations of testing outcomes are potentially different for different
populations. Assuming or generalizing outcome interpretability across populations without
appropriate evidence is unfounded. Moreover, as is suggested in standard 1.4, if a test is used in
a different way or used in a different situation, then expert judgment is necessary to determine
whether the existing validity information can be appropriately used in the new situation. That
new situation could certainly affect the validity of the instrument and thus, as the standard
shows, new evidence may be necessary to collect.
21
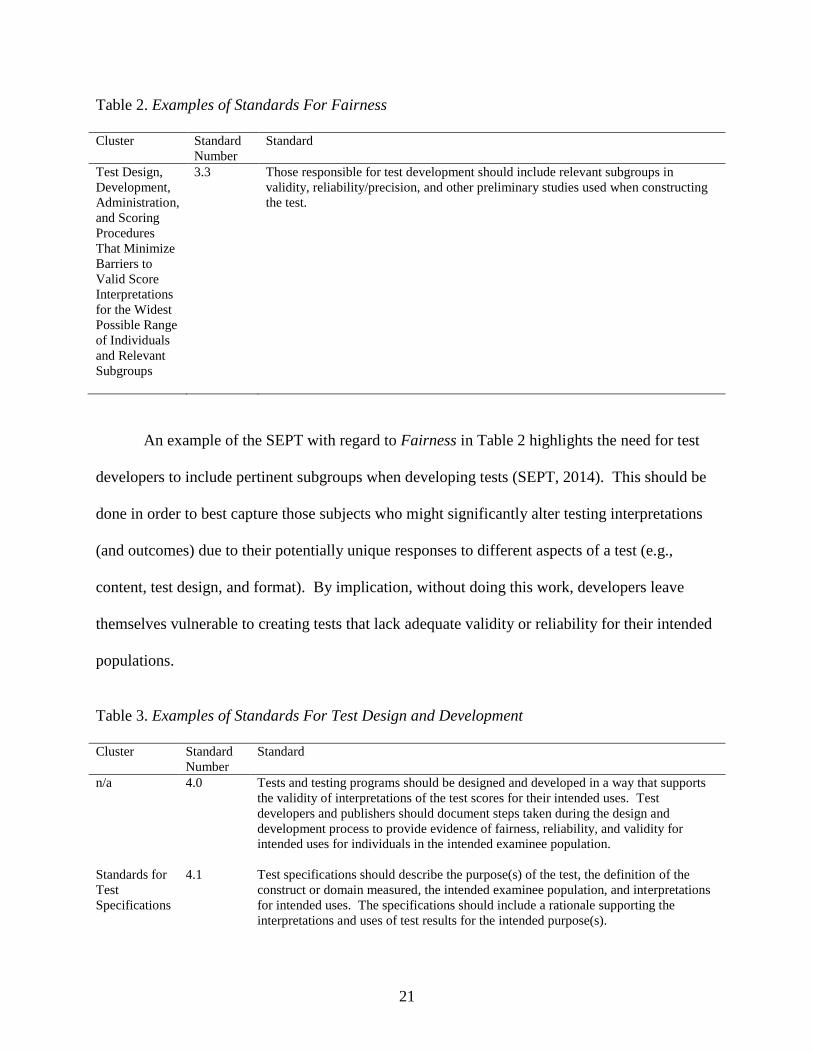
Table 2. Examples of Standards For Fairness
Cluster Standard
Number
Standard
Test Design,
Development,
Administration,
and Scoring
Procedures
That Minimize
Barriers to
Valid Score
Interpretations
for the Widest
Possible Range
of Individuals
and Relevant
Subgroups
3.3 Those responsible for test development should include relevant subgroups in
validity, reliability/precision, and other preliminary studies used when constructing
the test.
An example of the SEPT with regard to Fairness in Table 2 highlights the need for test
developers to include pertinent subgroups when developing tests (SEPT, 2014). This should be
done in order to best capture those subjects who might significantly alter testing interpretations
(and outcomes) due to their potentially unique responses to different aspects of a test (e.g.,
content, test design, and format). By implication, without doing this work, developers leave
themselves vulnerable to creating tests that lack adequate validity or reliability for their intended
populations.
Table 3. Examples of Standards For Test Design and Development
Cluster Standard
Number
Standard
n/a 4.0 Tests and testing programs should be designed and developed in a way that supports
the validity of interpretations of the test scores for their intended uses. Test
developers and publishers should document steps taken during the design and
development process to provide evidence of fairness, reliability, and validity for
intended uses for individuals in the intended examinee population.
Standards for
Test
Specifications
4.1 Test specifications should describe the purpose(s) of the test, the definition of the
construct or domain measured, the intended examinee population, and interpretations
for intended uses. The specifications should include a rationale supporting the
interpretations and uses of test results for the intended purpose(s).

22
Table 3 (cont’d)
Standards for
Test
Specifications
4.6 When appropriate to documenting the validity of test score interpretations for
intended uses, relevant experts external to the testing program should review the test
specifications to evaluate their appropriateness for intended uses of the test scores and
fairness for intended test takers. The purpose of the review, the process by which the
review is conducted, and the results of the review should be documented. The
qualifications, relevant experiences, and demographic characteristics of expert judges
should also be documented.
Standards for
Test Revision
4.24 Test specifications should be amended or revised when new research data, significant
changes in the domain represented, or newly recommended conditions of test use may
reduce the validity of test score interpretations. Although a test that remains useful
need not be withdrawn or revised simply because of the passage of time, test
developers and test publishers are responsible for monitoring changing conditions and
for amending, revising, or withdrawing the test as indicated.
Examples of the SEPT with regard to Test Design and Development in Table 3 highlight
some similar ideas as found in the SEPT with regard to Validity, though they focus more
specifically on test development (SEPT, 2014). For instance standard 4.24 highlights the
importance of re-examining and potentially revising a test as the need arises, particularly if new
data becomes available that potentially calls into question a test’s existing interpretations. The
authors point out that this is not to say that an older version of a test is always invalid, rather, that
it is incumbent upon the user to justify the use of an older version of a test in spite of the
existence of a newer version (SEPT, 2014). The authors also seem to imply with this standard
the need for test developers and users to embrace one of the core ideals of the SEPT that tests
must evolve as populations and conditions change over time in order to maintain their level of
rigor.
Overall, the SEPT (2014) is a valuable tool to help developers and users achieve high
standards with regard to test development and usage. Following the SEPT (2014) however does
not ensure that a test will always be of the best possible quality. Multiple factors can complicate
this process. This is particularly true with regard to ASD and the difficulties that developers,

23
researchers, and users encounter given the wide-range of symptoms and varying presentations
associated with the disorder.
Assessment: Diagnosis and Monitoring
Given the broad range of possible behaviors associated with ASD, differential diagnosis
can be complicated (Trammell, Wilczynski, Dale, & McIntosh, 2013). Clinicians often struggle
to determine whether particular symptom presentations result from core social-communication
deficits and repetitive behaviors, or whether behaviors are better explained by other disorders, or
if the behavior presentation reflects a combination of ASD and one or more comorbid disorders.
The DSM-5 (APA, 2013) lists various differential diagnoses for ASD: Rett syndrome, selective
mutism, language disorders and social communication disorder, intellectual disability,
stereotypic movement disorder, ADHD, and schizophrenia (APA, 2013). Yet, there are no
objective measures specifically designed to address comorbidity for individuals with ASD
(Trammell et al., 2013). The key factors that complicate an ASD diagnosis include different
symptom presentations at various ages and developmental levels (Huerta & Lord, 2012; Matson,
Beighley, & Turygin, 2012), a wide range of cognitive levels (Huerta & Lord, 2012), the
challenge of assessing the impact of language delays (Lord et al., 2014), a lack of diagnostic
measures available specifically designed for adolescents and adults (Trammell et al., 2013), and
difficulties with deriving appropriate normative groups (e.g., chronological age is an insufficient
comparison variable given the range of cognitive differences in ASD; Lord et al., 2014). As
Lord et al. (2014) stated, overall, assessment tools for ASD have been relatively accurate for
identifying ASD in “somewhat verbal, mildly to moderately intellectually disabled, school age
children” (p. 612). The authors argued that assessing individuals outside of the “4 to 12 year-
old” age group “with some but not fluent speech” is still challenging (Lord et al., 2014, p. 612).
24
According to the DSM-5 (APA, 2013) using input from a variety of data sources is the
most valid and defensible way to assess for ASD. Such data can include information obtained
through clinical observations, caretaker perspectives, and even from individual self-report. As
Huerta and Lord (2012) explained, caretaker perspectives enable a clinician to understand an
individual’s functioning both historically and in multiple environments, while observation allows
a clinician to directly assess the presence of specific skills and deficits. Yet, as Falkmer,
Anderson, Falkmer, and Horlin (2013) stated, because an ASD diagnosis can only be determined
through assessment of behavior symptoms, there will inevitably be weaknesses and biases with
regard to individual source interpretations (Falkmer et al., 2013). Key to the methods and
instruments that are ultimately chosen are the goals of assessment, such as for general
information, screening, diagnostic input, or to determine the intensity of intervention needs (Lord
et al., 2014). An ASD diagnosis typically involves an initial screening, using less time-
consuming and more cost-effective methods (e.g., a brief parent rating scale), followed by a
more extensive diagnostic confirmation process involving multiple assessment methods
(Hampton & Strand, 2015). Common assessment methods include interviews, observations, and
rating scales (Lord et al., 2014).
Interviewing and observational instruments. Interviewing, both formally and
informally, enables a clinician to obtain both contextual and historical information concerning an
individual’s behavior and development (Huerta & Lord, 2012). Additionally, interviewing offers
a clinician the opportunity to be flexible and spontaneous, or maintain a structured or semi-
structured format (Merrell, 2001). The most often currently used diagnostic interview instrument
for ASD is the Autism Diagnostic Interview-Revised (ADI-R; LeCouteur, Lord, & Rutter, 2003).
It is a semi-structured interview for caregivers, capturing behaviors currently and at the time

25
most likely to have displayed ASD-like symptoms, around age four to five years. The
instrument is found to have good psychometric properties, but limited sensitivity with
individuals with very low IQ and mental age (Lord et al., 2014; Ozonoff, Goodlin-Jones,
Solomon, 2005). In addition, the administration time can be too time consuming for many
clinicians (Ozonoff et al., 2005).
The ADI-R (LeCouteur et al., 2003) is often used in conjunction with an observational
system, the Autism Diagnostic Observation Schedule, Second Edition (ADOS-2; Lord, Rutter,
DiLavore et al., 2012). Clinicians use a protocol of structured or semi-structured interaction
involving “social interaction, communication, and play,” which takes around 30-45 minutes.
The protocol is then scored according to diagnostic algorithms (Lord et al., 2014, p. 644).
Considerable experience with and knowledge about individuals with ASD are necessary in order
to effectively administer and score the assessment (Lord et al., 2014). When used in
combination, both the ADOS-2 (Lord, Rutter, DiLavore et al., 2012) and the ADI-R (LeCouteur
et al., 2003) are considered the most sensitive and specific diagnostic instruments for ASD
(Falkmer et al., 2013), but drawbacks include difficulty in differential diagnosis of ASD and ID
for children with limited verbalizations.
Although interview and observational instruments are more comprehensive, there is also
a place for rating scales, which unlike interviews and observations, are quick and do not require
extensive training. Most often, rating scales are used as screeners in advance of a more
comprehensive assessment (Norris & Lecavalier, 2010a). Yet, rating scales have an additional
utility in that they can be used to track behavior changes over time.
Rating scales in ASD. Rating scales are used for various purposes. For instance, they
can be used for diagnostic reasons and screen for atypical development using a broad-based
26
approach (e.g., the ‘atypicality’ scale on the Behavior Assessment Rating Scale for Children,
Third Edition [BASC-3; Reynolds & Kamphaus, 2015]), or they can be used to identify
symptoms of a particular disorder like ASD, such as with the Gilliam Autism Rating Scale,
Second Edition (GARS-2; Gilliam, 2006). Rating scales are efficient with regard to
administration time and training, and give voice to multiple stakeholders (Merrill, 2001).
However, they do have some disadvantages as well, as ratings are ultimately more subjective
appraisals and limited in terms of their validity with various populations, including individuals of
different ages and levels of functioning (Lord et al., 2014; Norris & Lecavalier, 2010a).
A key aspect of any rating scale involves the performance of the rater herself (Portney &
Watkins, 2000). The rater is responsible for making a subjective assessment based upon some
standardized parameters (e.g., a particular scoring scale). Portney and Watkins (2000) highlight
the fact that raters must be consistent in the way that they make their judgments otherwise they
can negatively affect a scale’s validity. That said, as Hoyt (2000) explains, rater bias, or
incongruities between raters, is a common problem as raters often bring their own unique
perspectives to ratings and can understand questions differently or have distinctive
individualized responses to particular stimuli. Depending upon the rated constructs, the raters’
training, and the extent of the possibilities of interpretation can result in a range of conceivable
impacts on rated outcomes (Hoyt, 2000). Further, research has also shown that context can
influence rater behavior (Tziner, Murphy, & Cleveland, 2005) and that various other facets must
be examined, such as the environment in which ratings take place, before reliability of a rating
scale can be generalized (Portney & Watkins, 2000).
Hoyt (2000) states that ratings performed by multiple raters on the same subject can
result in different outcomes for various reasons. This could include discrepancies in the focus

27
different raters have on particular aspects of a subject, or distinctive occasions under which their
ratings occurred (Hoyt, 2000). For instance parents who rate a child’s behavior at home might
result in a very different rating than if the same child was rated at school by his teacher. A
child’s behavior could be vastly different in these separate contexts, especially on different days.
Parents and teachers might also appraise similar behaviors in dissimilar ways as each rater might
be attuned to distinct aspects of the child’s behavior in their respective environments.
An example of a commonly used broad-based rating scale that is useful for initially
screening individuals at risk for ASD is the Social Responsiveness Scale, Second Edition (SRS-
2; Constantino & Gruber, 2012). It is filled out by a caretaker or teacher and is designed to
assess social as well as more general behavioral impairments, many of which are associated with
core features of ASD. It has strong psychometric properties and is quickly implemented, though
it has been found that behavior problems in both individuals with and without ASD result in
more of the variance in scores than core symptoms of autism or even social deficits (Lord et al.,
2014). In contrast, the Childhood Autism Rating Scale (CARS; Schopler, Reichler, & Renner,
1986) is an example of a commonly used rating scale that was developed to assess for behaviors
specifically associated with ASD (Lord et al., 2014). It was designed to be completed by
clinicians after observing an individual suspected of ASD. The CARS (Schopler et al., 1986) is
particularly good with differentiating between individuals with and without ASD, though it has
been found to have difficulties in identifying individuals requiring fewer supports with ASD
(Lord et al., 2014).
Rating scales are also relied upon to measure changes in behavior—to track symptoms in
response to developmental or intervention-driven change (Bolte & Diehl, 2013). These scales
are used to help to determine whether interventions have directly or indirectly had successful

28
effects on particular skills (Lord et al., 2005). However, despite the large number of instruments
used to measure ASD symptomology, there is still a great challenge in effectively assessing
treatment affects (Bolt & Diehl, 2013).
Monitoring behavior change. Researchers have used a number of different instruments
in attempting to measure core and associated behaviors related to ASD (McConachie et al.,
2015). For instance, McConachie et al. (2015) performed a systematic review of assessment
tools for young children with ASD and classified 41 instruments in multiple conceptual domains
including “autism symptom severity,” “global measure of outcome,” “social awareness,”
“restricted and repetitive behaviour and interests,” “sensory processing,” “language,” “cognitive
ability,” “emotional regulation,” “play,” “behaviour problems,” “global measure of functioning,”
and “parent stress” (p. xxvi-xxvii). Further, Bolte and Diehl (2013) found 289 “unique
measurement tools” and developed 14 conceptual categories, in an approach similar to
McConachie et al. (2015). Thus, the large number of instruments used to assess ASD
symptomology reflects one of the major challenges associated with the disorder, meaning that
the wide range of symptoms and their varying intensities (consisting of both core and associated
features) found underneath an umbrella-like classification such as ASD, makes it difficult to
effectively measure treatment effects (Bolte & Diehl, 2013). This has lead researchers to try
multiple unique ways to address this challenge (Bolte & Diehl, 2013).
As Bolte and Diehl (2013) illustrated, one of the core ASD symptoms, “restricted,
repetitive patterns of behavior, interests, or activities,” can present in vastly different ways across
individuals (APA, 2013, p. 51). This can be exhibited in the form of rigid routines and
schedules, speech repetition, repetitive physical movement, or even a circumscribed interest in a
certain subject (Bolte & Diehl, 2013). Thus, researchers have had to develop and employ

29
multiple instruments in order to try and address their specific intervention outcome measurement
needs. In fact, Bolte and Diehl (2013) found that from 2001 to 2010, 61.6% of the instruments
used to measure outcomes were used in only one study. This makes comparing results across
studies more difficult, with so many different measures being employed (Bolte & Diehl, 2013).
Unlike the two most acclaimed instruments used to diagnose ASD, the ADOS-2 (Lord,
Rutter, DiLavore et al., 2012) and the ADI-R (LeCouteur et al., 2003), there are no equivalent,
established measures to assess behavioral outcomes for ASD interventions (Bolte & Diehl,
2013). As Lord et al. (2014) elucidated, the ASD diagnostic instruments were not developed to
be sensitive to short-term behavior changes and were not designed to measure changes in
behavior particularly as individuals get older and their environments and behavioral expectations
change. Brinkley et al. (2007) pointed out that using ASD diagnostic measures to assess
intervention efforts is also limited, given the more targeted scope of behaviors found in
diagnostic instruments such as the ADI-R (LeCouteur et al., 2003). Moreover, researchers have
used instruments that assess similar behaviors relevant to ASD, though many of these tools were
not designed specifically for the ASD population (and thus have issues with regard to comparing
scores to a normative population) and are not truly appropriate for measuring changes in
behavior (Brinkley et al., 2007; Lord et al., 2014). However, the Aberrant Behavior Checklist-
Community (ABC-C; Aman & Singh, 2017) is one of the few tools that has been
psychometrically examined to assess treatment outcomes for individuals with ASD, despite not
being designed originally for the ASD population (Lord et al., 2014).
In their review, Bolte and Diehl (2013) determined that the ABC-C, the instrument of
interest in this study, was the most-often used outcome instrument in ASD intervention research.
It has been implemented in nearly 5% of all ASD intervention studies (Bolte & Diehl, 2013). By

30
category, the ABC-C was the most used instrument to measure changes in ASD pharmacological
studies (10.1% of all studies) as well as in ASD alternative medicine studies (4.7% of all studies;
Bolte & Diehl, 2013). Bolte and Diehl (2013) also found that the ABC-C was the most used
measure to analyze hyperactivity symptomology and was implemented in 56.5% of all ASD
intervention studies where hyperactivity was assessed as an outcome. Thus, despite the
challenges with measuring ASD intervention outcomes and the great variety of instruments
researchers have used, the ABC-C has emerged as one of the more popular and useful measures.
Therefore, it is critical to thoroughly validate the ABC-C as a potential high quality instrument
for ASD symptom monitoring.
The ABC-C as an ASD monitoring instrument. The ABC-C, although not designed
specifically for individuals with ASD, has become very popular in ASD intervention research
(Bolte & Diehl, 2013), including in both pharmacological and behavior studies (e.g., Hassiotis et
al., 2009; Loebel et al., 2016). This is because both core and associated features of ASD are
represented in the five subscales of the ABC-C: Irritability, Hyperactivity, Social Withdrawal,
Stereotypic Behavior, and Inappropriate Speech. The following section will focus on some of
those features of the ABC-C, although it is important to note that this is far from exhaustive and
that the range of behaviors and all their potential effects is well beyond the scope of this brief
overview.
Irritability. Irritability and severe mood problems are common in individuals with ASD
(Simonoff et al. 2012); however, there has not been much research on the causes of irritability
(Mikita et al. 2015). Further, according to Mikita et al. (2015), the very definition of irritability
is often inconsistent. As Mikita et al. (2015) explained, in research on individuals with ASD,
irritability often refers to particular externalized behaviors such as verbal and physical

31
aggression, self-injurious behavior, and even destruction of property; while in research with
neurotypical children, irritability often refers to mood presentations that do not always result in
aggressive behaviors. In fact, as Mikita et al. (2015) pointed out, the ABC (and ABC-C),
Irritability subscale includes many of the aforementioned externalized behaviors (e.g., self-
injurious behavior, verbal and physical aggression). Yet, as Stringaris (2011) argued, irritability
can manifest in mood states as well as in aggressive behaviors, but the drivers of those behaviors
could be dissimilar. For instance, with regard to self-injurious behavior, prevalence is estimated
to be around 30% of individuals with ASD, more prevalent than in individuals with other
developmental disabilities (Soke et al., 2016). In addition, as Minshawi et al. (2014) indicated,
self-injurious behavior can manifest for biomedical, genetic, and even behavioral reasons.
Oliver and Richards (2015) highlighted research that argued that self-injury may occur as a result
of operant learning, pain and discomfort, and even from a potential movement disorder. They
emphasized that self-injury in ASD is often correlated with ID, with prevalence rates estimated
between 33%-71% (Oliver & Richards, 2015). Overall, despite the complicated nature of the
irritability construct, it is clear that irritability is thought to have influence on the behaviors of
many individuals with ASD. Medications such as Risperidone and Aripiprazole are prescribed
to help mitigate self-injury (Mahatmya, Zobel, & Valdovinos, 2008; Stachnik & Gabay, 2010),
and the ABC-C Irritability subscale has been instrumental in research demonstrating the efficacy
of pharmacological intervention (Aman & Singh, 2017).
Social Withdrawal. Part of the core diagnostic criteria in ASD concerns deficits in social
communication and interaction (APA, 2013). These deficits, which are found in individuals with
ASD regardless of cognitive abilities and often throughout the lifespan (Davis & Carter, 2014),
include a lack of social-emotional reciprocity (e.g., limited sharing of thoughts and feelings, lack
32
of initiation or response in social interaction), lack of eye contact, and difficulty in relationship
building (e.g., challenges in making friends and lack of interest in others; APA, 2013). There
can also be symptoms of “catatonic-like motor behavior . . . mutism, posturing, grimacing, and
waxy flexibility” (APA, 2013, p. 55). In addition, individuals with ASD can also maintain both
high and low responsiveness to sensory stimuli (e.g., textures, sounds, tastes, smells, sights).
Thus, ASD symptoms can present as sometimes withdrawn or lethargic behaviors.
Researchers have explored the relations of these core social deficits of ASD with their
resulting internalized and externalized behavioral presentations. For instance, in a review of
depression in children with ASD, Magnuson and Constantino (2011) argued that depression in
ASD is often difficult to assess given the varied social-communication and cognitive deficits
common to individuals with the disorder. They maintained that there can appear to be an overlap
of symptomology or that ASD symptoms can mask a potential comorbid disorder. The authors
stressed that difficulties with social situations and regulating emotions can also lead to
internalizing challenges. They asserted that individuals with ASD requiring less substantial
supports are often more susceptible to depression and anxiety as well and that signs such as
mood lability, catatonia, hyperactivity, self-injurious behavior, and aggression can all be
potential signs of depression. This is worthy of attention given the fact that these various
symptoms are often found in items across the factors of the ABC-C. There may also be an
increased risk for symptoms of depression and withdrawal in toddlers with ASD with high or
low sensory thresholds, according to a study by Ben-Sasson et al. (2008). Thus, the signs and
symptoms of social withdrawal and lethargy are complex in ASD and research is needed to
better understand and detect them.
33
Stereotypic Behavior. Stereotypic behavior in the ABC-C specifically refers to motor
stereotypic behaviors, which are considered to be core diagnostic features of ASD manifested as
expressions of restricted, repetitive behaviors (APA, 2013). Motor stereotypic behavior is
defined as repetitive motor and oral replies that offer no clear adaptive purpose (MacDonald et
al., 2007). These behaviors include “repetitive, rhythmic, often bilateral movements with a fixed
pattern (e.g., hand flapping, waving, or rotating) and regular frequency” (Péter, Oliphant, &
Fernandez, 2017, p. 1). Interestingly, stereotypic behaviors are not uncommon in typically
developing children as well; however, if they persist after age two with intensity and regularity,
and also negatively affect daily functioning, they are often cause for concern (Chebli, Martin, &
Lanovaz, 2016). With regard to affecting daily functioning, stereotypic behavior can hinder skill
development and social relationships (Chebli, et al., 2016; Goldman et al. 2009). The etiology of
stereotypic behaviors is unclear. Some suggest that the behaviors are psychological in origin and
performed in accordance with behavioral functions such as self-gratification or escape (e.g.,
Goldman et al., 2009), while others believe there are biologically driven causes (Péter et al.,
2017).
Chebli et al. (2016) showed that the vast majority of individuals with developmental
disabilities, including both children and adults, perform at least one type of stereotypic behavior
such as whole body movements, head, hand/finger, locomotion, sensory, vocal, or object
manipulation behaviors. More specifically, the authors found prevalence rates for stereotypic
behaviors of 88% in individuals with ASD compared to 61% among other developmental
disabilities. Specific stereotypic movement types are more common than others, for example,
sensory stereotypies are most often observed (73%), while head stereotypies are least common
(30%; Chebli et al., 2016). Similarly, in a study by Goldman et al. (2009), it was found that

34
children with autism requiring substantial and less substantial supports had the highest
percentage of stereotypic behaviors (70.6% and 63.6%) compared to children who had
developmental language disorders (18.3%) and low IQ (30.9%) in the absence of autism.
Goldman et al. (2009) also discovered that stereotypic behavior was strongly associated with
autism, regardless of IQ; however, lower IQ did increase the amount and array of stereotypies.
Inappropriate Speech. One of the core diagnostic criteria for individuals with ASD
involves deficits in communication and social interaction (APA, 2013). These deficits can
include expressive and receptive language impairments such as severe language delays, poor
speech comprehension, echolalia, affected (i.e., stilted and unusual intonation) and hyper-literal
communication, repetitive speech, or idiosyncratic speech (APA, 2013). They can also involve
deficits in conversational speech as well, such as poor social reciprocity and highly one-sided
conversations. Of note, there can be similarities in communication deficits between individuals
with ASD and ID (APA, 2013). However, a differential diagnosis is made between ASD and ID
wherein within ASD an individual can have a distinct incongruity between social communication
skills and interaction competencies compared to the individual’s developmental level and
nonverbal skills (APA, 2013). Ultimately, challenges with social and communication skills in
individuals with ASD have been linked to increases in loneliness, social isolation and rejection,
poorer academic and professional achievement, as well as mood challenges (White, Keonig, &
Scahill, 2007).
Hyperactivity. A major revision in the DSM-5 (APA, 2013) from the DSM-IV-TR
(APA, 2000) included changing ADHD from a rule out for ASD to recognizing it as a common
comorbid disorder. In fact, a review of ADHD and ASD comorbidity by Matson, Rieske, and
Williams (2013) found prevalence rate estimates of ADHD within the context of ASD to be
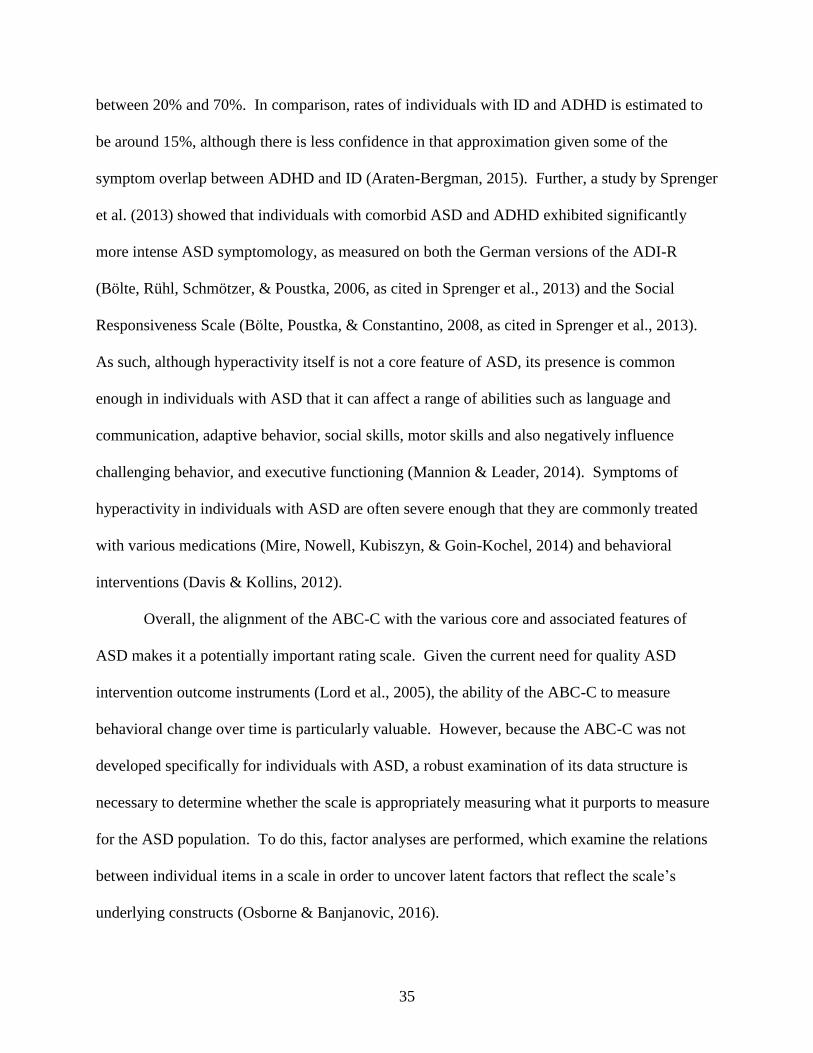
35
between 20% and 70%. In comparison, rates of individuals with ID and ADHD is estimated to
be around 15%, although there is less confidence in that approximation given some of the
symptom overlap between ADHD and ID (Araten-Bergman, 2015). Further, a study by Sprenger
et al. (2013) showed that individuals with comorbid ASD and ADHD exhibited significantly
more intense ASD symptomology, as measured on both the German versions of the ADI-R
(Bölte, Rühl, Schmötzer, & Poustka, 2006, as cited in Sprenger et al., 2013) and the Social
Responsiveness Scale (Bölte, Poustka, & Constantino, 2008, as cited in Sprenger et al., 2013).
As such, although hyperactivity itself is not a core feature of ASD, its presence is common
enough in individuals with ASD that it can affect a range of abilities such as language and
communication, adaptive behavior, social skills, motor skills and also negatively influence
challenging behavior, and executive functioning (Mannion & Leader, 2014). Symptoms of
hyperactivity in individuals with ASD are often severe enough that they are commonly treated
with various medications (Mire, Nowell, Kubiszyn, & Goin-Kochel, 2014) and behavioral
interventions (Davis & Kollins, 2012).
Overall, the alignment of the ABC-C with the various core and associated features of
ASD makes it a potentially important rating scale. Given the current need for quality ASD
intervention outcome instruments (Lord et al., 2005), the ability of the ABC-C to measure
behavioral change over time is particularly valuable. However, because the ABC-C was not
developed specifically for individuals with ASD, a robust examination of its data structure is
necessary to determine whether the scale is appropriately measuring what it purports to measure
for the ASD population. To do this, factor analyses are performed, which examine the relations
between individual items in a scale in order to uncover latent factors that reflect the scale’s
underlying constructs (Osborne & Banjanovic, 2016).

36
How Rating Scales Derive Factors
Factor analysis has become one of the most frequently used methods to both develop and
evaluate the psychometric properties of psychological instruments (Floyd & Widaman, 1995).
Factor analytic techniques were developed because of the inherent complexity in discerning
patterns and relationships in sets of data (Fabrigar & Wegener, 2012). Common factors
comprise these relationships via specific correlational patterns. Such factors are attributed to
constructs underlying the items in a measure. Factor analytic techniques are used to determine
the number and types of factors inherent in a measurement scale, which helps provide
researchers and clinicians with information about the measurement attributes of an instrument.
This information is given in the form of estimates regarding the strength and direction of
influence each of the individual factors places on each of the items (Fabrigar & Wegener, 2012).
These estimates are referred to as factor loadings (Fabrigar & Wegener, 2012). Two core factor
analytic methods are employed to discern the nature of these factor loadings: Exploratory Factor
Analysis (EFA) and Confirmatory factor analysis (CFA; Fabrigar & Wegener, 2012).
Exploratory factor analysis and principal component analysis. EFA is used to
discern the factor structure in a data set, i.e., a way to detect the number and type of latent factors
that account for data covariation (O’Rourke & Hatcher, 2013). EFA is similar to Principal
Components Analysis (PCA) in that both are methods used to condense the number of variables
in a data set. Although PCA and EFA both aim to derive the supposed underlying constructs
inherent in a set of variables, they critically differ in how those factors are statistically derived
and in the theoretical direction of influence between factors and indicators.
In PCA, derived components (or factors) are made up of linear combinations of observed
variables with each variable contributing a different weight or percentage to the components

37
(O’Rourke & Hatcher, 2013; Osborne & Banjanovic, 2016). PCA maintains the assumption that
all observed variables are measured without error, meaning it elicits a total variance, subsuming
common variance, unique variance, and random error variance in its solutions (Pedhazur &
Schmelkin, 1991). As a result, a PCA analysis could result in overestimated levels of variance in
the variables of the derived factors (Gorsuch, 1997; Osborne & Banjanovic, 2016).
On the other hand in EFA, observed variables function as linear combinations of the
latent factors (O’Rourke & Hatcher, 2013). Unlike PCA, EFA solutions account for shared or
common variance only. EFA also accounts for both unique and error variance in the overall
model (O’Rourke & Hatcher, 2013; Osborne & Banjanovic, 2016).
In general, EFA is considered to be most useful in uncovering the latent constructs within
data (Osborne & Banjanovic, 2016). However, EFA is best employed when a researcher
maintains few to no strong assumptions about the nature of the relationships in a dataset and is
known as an “unrestricted factor analysis” (Fabrigar & Wegener, 2012, p. 4). It is a data-based
approach that, as Long (1983) explained, enables a researcher to generate a wide range of
possible solutions with a dataset given the lack of “substantively meaningful constraints” (p. 12).
Once hypothesized factor models (based on theory or prior data-based results) are available, then
Confirmatory factor analysis (CFA) is typically used to assess the fit of such models.
Confirmatory factor analysis. CFA is used to test a theorized factor structure, often
derived from a previously performed EFA (Fabrigar & Wegener, 2012). As a “restricted factor
analysis” (Fabrigar & Wegener, 2012, p. 4) it imposes specific constraints on the data, thereby
limiting the number of possible solutions (Long, 1983). This method is used to substantiate or
refute particular hypothesized factor structures (Pett, Lackey, Sullivan, 2003).

38
Unlike with EFA, a CFA provides a researcher the ability to apply more detailed
restraints on the data to determine the structure of a hypothesized model (Byrne, 2005). For
instance in an EFA, factors are either all correlated or independent, whereas in a CFA the
researcher can indicate which correlations she believes are meaningfully related as well as the
extent of those relationships (Byrne, 2005; Pedhazur & Schmelkin, 1991). In CFA a researcher
can indicate which items load on which particular factors, whereas in EFA, all items, at differing
levels of strength, load on every factor (Pedhazur & Schmelkin, 1991). This level of flexibility
in CFA even provides researchers the ability to correlate different item errors, unlike in EFA
where item errors are always uncorrelated (Pedhazur & Schmelkin, 1991). Overall, the
differences between EFA and CFA ultimately enable them to be complimentary in factor
analytic studies.
EFA and CFA as complements. As Gerbing and Hamilton (1996) demonstrated, EFA
and CFA are complimentary in that EFA is highly effective as a first step in discovering a latent
factor structure in a model, whereby CFA can then be used to evaluate the strength of that model.
As Fabrigar, Wegener, MacCallum, and Strahan (1999) argued, EFA is a more logical method to
use compared to a CFA when there is a lack of data or a weak empirical foundation to make
robust assumptions about the number and nature of common factors. The authors contend that
using a more restrained CFA approach without an EFA makes it highly likely that researchers
will potentially not recognize the existence of other possible theoretical models. Further, as
Church and Burke (1994) stated, reproducing a particular EFA structure with various samples
offers strong evidence of the viability of that structure because that model has been generated
repeatedly without any particular limiting parameters. Once there is a solid basis for identifying

39
a particular model, a CFA is the more appropriate method, thus making EFA and CFA
particularly effective when used together (Fabrigar et al., 1999).
It is important to point out that historically EFAs in the developmental disability
literature have often not been performed with the highest levels of rigor (Norris & Lecavalier,
2010b). Norris and Lecavalier (2010b) performed a study on EFAs from 1997 to 2008 amongst
five of the most popular journals for developmental disabilities. Looking at 66 different studies,
the authors found that 66% of studies used PCA instead of EFA (35%), 59% used orthogonal
rotations instead of oblique rotations (33%), and with regard to factor retention criteria—
although most reported the use of multiple methods— clinical meaningfulness (82%) was the
most popular followed by the use of the eigenvalues > 1 criteria (76%), scree plots (56%),
parallel analysis (4%), and Velicer’s MAP test (2%). These findings reflect a contrast to the
expert recommendations made by Norris and Lecavalier (2010b), including using EFA instead of
PCA, and using oblique instead of orthogonal rotations. Overall, Norris and Lecavalier (2010b)
highlight the fact that EFAs in the developmental disability literature have often not been
performed according to best practices. This is also evident when analyzing many of the factor
analyses performed on the Aberrant Behavior Checklist (ABC; Aman, Singh, Stewart, & Field,
1985a and the Aberrant Behavior Checklist-Community (ABC-C; Aman & Singh, 2017).
Factor Analyses in the Development of the ABC-C
From the initial development of the ABC (Aman et al., 1985a) to its current version, the
ABC-C (Aman & Singh, 2017) has undergone many factor analyses. These analyses have varied
with regard to their level of rigor. Across the different iterations of the scale, the numerous
factor analyses have resulted in solutions that have both confirmed and differed from the authors’
derived structures. In particular, with regard to the three factor analyses of the ABC-C

40
performed specifically with the ASD population, there have been distinct inconsistencies, raising
important questions. The following section will provide a brief historical overview of each of
the different iterations of the ABC-C along with the important findings from the related factor
analytic studies. Further, a more intensive examination of the three particular factor analyses of
the ABC-C with ASD samples will be provided.
The ABC. The original development of the scale by Aman et al. (1985a) resulted in a
five-factor solution (I = Irritability, Agitation, Crying; II = Lethargy, Social Withdrawal; III =
Stereotypic Behavior; IV = Hyperactivity, Noncompliance; V = Inappropriate Speech) using a
PCA (M. Aman, personal communication, February 2, 2018), chosen through an eigenvalue
criterion and author judgment, and included examining multiple factor solutions (i.e., three- to
seven- factor solutions). The PCA was conducted using a sample of adults with intellectual
disabilities who were rated by institutional staff members. According to the authors, solutions
that included fewer factors resulted in subscales that were too wide-ranging while solutions that
included more than five factors resulted in suspected overlapping constructs. Subsequent factor
analyses of the ABC (Aman & Singh, 1986) with similar samples of individuals with intellectual
disabilities (e.g., Aman, Richmond, Stewart, Bell & Kissel, 1987; Bihm & Poindexter, 1991;
Freund & Reiss, 1991, Newton & Sturmey, 1988; Rojahn & Helsel, 1991) generally did not
examine multiple factor solutions—but focused only on the degree to which a five-factor
solution matched expectations. This means that the five-factor structure derived by Aman et al.
(1985a) appeared to be what most authors expected to find a priori. As a result, additional
alterative factor structures were not thoroughly explored (see Table 4 for details).

41
Table 4. Summary of Exploratory Factor Analyses of the Aberrant Behavior Checklist (ABC)
Research Study Source N Sample Rater Factor
Analysis
Method/Factor
Retention
Process
Factor
Solution(s)
Examined
Chosen Factor
Solution/ Names
% of
Variance
Explained
by Factor
Solution
Aman, Richmond,
Stewart, Bell, & Kissel
(1987)
Residential
facility
531 Male: 61%
Moderate ID: 7
%
Severe ID: 27%
Profound ID
67%
Deaf: 6%
Epilepsy 35%
CP: 13 %
Psychosis: 8%
Mean age: 33.5
All ambulent
British sample
Residential
staff
Principle Axis
Factoring with
Varimax &
Promax
rotations/
Predetermined
5-factor 5-factor
I: Irritability, Agitation
Crying
II: Lethargy, Social
Withdrawal
III: Stereotypic
Behavior
IV: Hyperactivity ,
Non-Compliance
V: Inappropriate
Speech
n/a
Newton & Sturmey
(1988)
Residential
facility
209 Female: 43%
All individuals
ID
45% Non-
ambulent,
Mean age: not
provided
Residential
staff
Principle Axis
Factoring with
Varimax &
Promax
rotations/
Predetermined
5-factor 5-factor
Not named, authors
reported that factors
best “corresponded to”
the following:
I: Lethargy, Social
Withdrawal)
II: Irritability,
Agitation, Crying
III: Hyperactivity, Non-
compliance
IV: Inappropriate
Speech
V: Stereotyped
Behavior
55.1%

42
Table 4 (cont’d)
Bihm & Poindexter
(1991)
Residential
facility
470 53% Male
Profound ID:
72%
Severe ID: 21%
Moderate: 7%
Mean age: 27
27% Non-
ambulent
Residential
Staff
Principal Axis
Factoring with
Varimax
rotation/
Predetermined
5-factor 5-factor
I: Irritability, Agitation
Crying
II: Lethargy, Social
Withdrawal
III: Stereotypic
Behavior
IV: Hyperactivity ,
Non-Compliance
V: Inappropriate
Speech
n/a
Freund & Reiss (1991) a b Center for
individuals
with
disabilities
110 69% male
Mean IQ: 54
Borderline ID:
14%
Mild ID: 37%
Moderate ID:
25%
Severe ID: 24%
Mean age: 11
Parents Principal Axis
Factoring with
Varimax &
Promax
rotations/
Scree test
5-factor 5-factor
I: Irritability
II: Withdrawal
III: Hyperactivity
IV: Stereotypies
V: Inappropriate
Speech
55%
Freund & Reiss (1991) b Center for
individuals
with
disabilities
94 69% Male
Mean IQ: 52
Mean age: 11
Teachers Principal Axis
Factoring with
Varimax &
Promax
rotations/
Scree test
5-factor 5-factor
I: Irritability
II: Withdrawal
III: Hyperactivity
IV: Stereotypies
V: Inappropriate
Speech
60%

43
Table 4 (cont’d)
Rojahn & Helsel (1991) Inpatient
psychiatric
unit
199 77% Male
92% With ID
8% Untestable
Mild ID: 29%
Moderate ID:
30%
Severe ID: 17%
Profound
ID:10%
Mean age: 8
Staff Principal Axis
Factoring with
Varimax &
Promax
rotations/
Predetermined
5-factor 5-factor
I: Irritability
II: Lethargy/Social
Withdrawal
III: Stereotypic
Behavior
IV: Hyperactivity
V: Inappropriate
Speech
32%
a Four items were also excluded in the factor analysis because of loadings below .30 on all 5 factors. b Modified version of the ABC items and the descriptors for “clarity and reduced reading level” (p.439). Descriptors from the ABC manual were
reworded for each questionnaire form and added to each question.

44
Also of note, in the factor analysis by Freund and Reiss (1991), the authors developed
two versions of the scale (a parent-ABC and a teacher-ABC) and incorporated different altered
item descriptors for each version to the rating form derived from item descriptions found in the
original ABC manual (Aman & Singh, 1986). This could be perceived as a fundamental change
in the items and result in differences in the way that participants understand the items without
altered descriptors, making it problematic to compare the results of this augmented form of the
ABC (Freund & Reiss, 1991) to the original ABC (Aman & Singh, 1986). Unfortunately, this
was the only study of the original ABC that included teachers and parents as raters, rather than
direct care staff.
The ABC-C. According to Aman and Singh (1994), revision of the original ABC was
necessary given the fact that deinstitutionalization had become much more commonplace. As
such, Marshburn and Aman (1992) performed an EFA of the original ABC with the intent of
seeing how robust it would be when used outside of an institutional setting, and instead within
the community (i.e., special education classrooms), rated by teachers. To do this, Marshburn and
Aman (1992) altered the wording of various items to make the scale more appropriate for this
different population. In a subsequent analysis by Aman, Burrow, and Wolford (1995), item
wordings were further revised and the scale was then tested with a sample of individuals (n =
1,024) living in group homes, rated by the staff. As a result a community version of the ABC
was created (i.e., the ABC-C; Aman & Singh, 1994). This involved changing both instructions
on protocols and the wording of items to reflect an instrument flexible enough to be used in
various environments. In total, 17 of the 58 items on the scale were altered from the original
ABC (see Table 5 for details).

45
Table 5. Item Changes Between the ABC and ABC-C
Item Number ABCa Item ABC-Cb Item
1 Excessively active on ward Excessively active at home, school,
work, or elsewhere
2 Injures self Injures self on purpose
4 Aggressive to other patients and
staff
Aggressive to other children or
adults (verbally or physically)
7 Boisterous Boisterous (inappropriately noisy
and rough)
10 Temper tantrums Temper tantrums/outbursts
11 Stereotyped, repetitive movements Stereotyped behavior; abnormal,
repetitive movements
13 Impulsive. Acts without thinking Impulsive (acts without thinking)
14 Irritable Irritable and whiny
16 Withdrawn Withdrawn; prefers solitary
activities
20 Fixed facial expression; lacks
emotional reactivity
Fixed facial expression; lacks
emotional responsiveness
27 Moves or rolls head back and forth Moves or rolls head back and forth
repetitively
37 Unresponsive to ward activities
(does not react).
Unresponsive to structured activities
(does not react)
38 Does not stay in seat during lesson
period
Does not stay in seat (e.g., during
lesson or learning periods, meals,
etc.)
40 Is difficult to reach or contact Is difficult to reach, contact, or get
through to
47 Stamps feet while banging objects or
slamming doors
Stamps feet or bangs objects or
slams doors
49 Rocks body back and forth Rocks body back and forth
repeatedly
57 Throws temper tantrums when
he/she does not get own way
Has temper outbursts or tantrums
when he/she does not get own way a Items from the original ABC (Aman & Singh, 1986) b Items from the ABC-C (Aman & Singh, 1994)

46
Aman and Singh (1994) acknowledged that making these changes could have led to a
different factor structure. However, they insisted that the subsequently published contemporary
studies of the altered scale showed that the community version maintained the original five-
factor structure. This argument made by Aman and Singh (1994) is perplexing given that the
first iteration of the ABC-C, in the study by Marshburn and Aman (1992), with subjects aged six
to 21 years (M = 12.5) who were rated by teachers in special education classrooms, resulted in a
four-factor solution, excluding the Inappropriate Speech factor from the original ABC (Aman &
Singh, 1986). In the subsequent analysis by Aman et al. (1995), which further iterated on the
item wording changes made in Marshburn and Aman (1992), only the original five-factor
solution was considered for this study without testing the four-factor solution identified with the
younger population. Results of this analysis led the test authors to conclude that the newly
revised wording on the scale did not alter the five-factor structure from the original ABC (Aman
& Singh, 1994). Aman et al. (1995) also found that 95% of the items loaded as on the original
ABC factors. They argued that that the new ABC-C version was valid for rating adults with
intellectual disabilities residing in the community.
Further, Aman and Singh (1994) provided updated reference group data, based upon the
Aman et al. (1995) and Marshburn and Aman (1992) studies. Reference group data were
available for teacher ratings of children in special education, ages six to 21 years (M = 12.5) and
health professional ratings of adults in group homes, ages 18 to 89 years (M = 42.46, SD = 14.2),
both using the same five-factor solution despite finding a four-factor solution for youngsters.
The authors also clarified that the scale was not just intended for adults, but children and
adolescents as well. The original scale’s name was modified to the ABC-Residential (ABC-R)
and the new scale was referred to the ABC-Community (ABC-C).

47
A follow up study of the ABC-C by Brown, Aman, and Havercamp (2002) examined a
four-and five-factor solution to further to assess the factor structure of the ABC-C for children
and adolescents in special education as rated by their parents. Using the scree plot method
(Cattell, 1966) and the eigenvalue > 1 criterion (Guttman, 1954; Kaiser, 1960) to determine the
likely number of factors, Brown et al. (2002) chose a four-factor solution (I = Irritable,
Uncooperative; II = Lethargy/Withdrawal; III = Hyperactivity; IV = Stereotypy, Self-Injury),
excluding the Inappropriate Speech factor found on the ABC-C. However, Brown et al. (2002)
argued that coefficients of congruence used to compare the overlap between their chosen four-
factor solution on the ABC-C and the original ABC ranged from moderate to high (Irritability =
.85; Lethargy/Withdrawal = .91; Stereotypic Behavior = .62; Hyperactivity/Noncompliance =
.85). As such, the authors reasoned that despite their own differing results, the original item
assignment (and factor structure) from the ABC should be maintained. Brown et al. (2002)
asserted that prior factor analyses performed with children and adolescents (e.g., Freund & Reiss,
1991; Marshburn & Aman 1992; Rojahn & Helsel, 1991) had been “remarkably consistent” with
the original ABC factor structure (p. 51). This is a perplexing argument given that Freund and
Reiss (1991) and Rojahn and Helsel (1991) both pre-specified and examined only a five-factor
structure in their analyses and Marshburn and Aman (1992) arrived at a four-factor solution.
Brown et al. (2002) also argued that a different scoring system would only be necessary if there
was strong evidence that a factor structure was different for a particular population, which they
claimed was not appropriate in this case. Brown et al. (2002) also performed a CFA to further
examine their EFA results with the original ABC factor structure and found a modest fit with an
RMSEA of .088. Further, attempting to justify their decision, Brown et al. (2002) reported that
overlap with their current solution and the original ABC showed strong internal consistency with

48
regard to item assignment (Irritability = .91; Lethargy/Withdrawal = .90; Stereotypic Behavior =
.84; Hyperactivity = .95; Inappropriate Speech = .77), with 41 out of 58 items loading the same
way or 71% congruent over all (Brown et al., 2002; Aman & Singh, 2017).
A variety of other factor analyses (EFAs and CFAs) of the ABC-C with ID and
alternative populations were also performed. For instance, two other examples of studies that
used EFAs with ID samples include Ono (1996), who developed a Japanese translation of the
ABC-C, and Zeilinger, Weber, and Haveman (2011) who developed a German version of the
ABC-C (See Table 6 for a summary of EFAs of the ABC-C with ID and alternative populations).

49
Table 6. Summary of Exploratory Factor Analyses of the Aberrant Behavior Checklist-Community (ABC-C) with ID and Alternative
Populations
Research Study Source N Sample Rater Factor Analysis
Method/Factor
Retention
Process
Factor
Solutions
Examined
Chosen Factor
Solution/Names
% of
Variance
Explaine
d by
Factor
Solution
Marshburn & Aman
(1992)a
Special
education
classrooms
666 64% with IQ < 80
and deficits in
adaptive behavior,
27% with multiple
handicaps,
5% with IQ < 70
and severe
handicaps,
5% from
unspecified special
education classes,
Mean age: 13
Teachers Principal Axis
Factoring with
Promax rotation/
Scree test
4-factor
5-factor
6-factor
4-factor
I: Hyperactivity
II: Irritability
III: Lethargy, Social
Withdrawal
IV: Stereotypic Behavior
52%
Aman, Burrow, &
Wolford (1995)
Group
homes
1024 59% male
Mild ID: 3%
Moderate ID: 17%
Severe ID: 25 %
Profound ID: 44%
Mean age: 43
Staff Principle Axis
Factoring with
Varimax &
Direct Oblimin
rotations/
Predetermined
5-factor 5-factor
I: Hyperactivity/Non-
Compliance
II: Lethargy/Withdrawal
III: Stereotypic Behavior
IV: Irritability
V: Inappropriate Speech
55%
Ono (1996) b Residential
institutions
322 Profound ID: 22%
Severe ID: 48%
Moderate ID: 30%
Mean age: 30
Staff Principal Axis
Factoring with
Oblique rotation/
Predetermined
5-factor 5-factor
I: Hyperactivity,
Noncompliance
II: Lethargy
III: Stereotypy
IV: Inappropriate Speech
V: Irritability
n/a

50
Table 6 (cont’d)
Brown, Aman, &
Havercamp (2002)c
Special
education
classes
601 56% male
Mean age: 13
51% with IQ < 80
and adaptive
behavior issues,
22% with
developmental
disabilities
Parents Principle Axis
Factoring with
Promax rotation/
Scree test
4-factor
5-factor
4-factor
I: Irritable, Uncooperative
II: Lethargy/Withdrawal
III: Hyperactivity
IV: Stereotypy, Self-Injury
48%
Zeilinger, Weber,
Haveman (2011)d
Various
individuals
in the
community
270 All with ID,
Mild or
Moderate ID: 77%
Severe or
Profound ID: 23%
Mean age: 40
Caregivers Principal
Component
Analysis with
Oblique rotation/
Parallel analysis
5-factor 5-factor
1: Hyperactivity
II: Lethargy
III: Stereotypic Behavior
IV: Inappropriate Speech
V: Irritability
51%
Sansone et al.
(2012)e
Fragile X
treatment
and
research
centers
315 All with Fragile X
syndrome,
Mean age: 11
Males: 73%
Mean IQ: 58
Caregivers EFA using
Ordinary Least
Squares
estimation with
Promax rotation/
Scree test,
Parallel analysis
5-factor
6-factor
7-factor
6-factor
I: Irritability
II: Hyperactivity
III: Socially
Unresponsive/Lethargic
IV: Social Avoidance
V: Stereotypy
VI: Inappropriate Speech
n/a
a = Authors report modifications made to item wordings on the ABC to make the scale appropriate for use with children in the community. b = Japanese translation of the ABC-C c = A CFA was also run in this study. d = German translation of the ABC-C e = Item parceling was used to condense the three self-injurious behavior items. A CFA was also run in this study.

51
Studies employing CFAs include Lehotkay et al. (2015), who developed an Indian translation of
the ABC-C in Telugu; Sansone et al. (2012, who also used an EFA) and Wheeler et al. (2014)
who both explored the factor structure of the ABC-C with Fragile-X Syndrome samples; and
Schmidt, Huete, Fodstad, Chin, and Kurtz (2013) who sampled a small population of children
under age five (n = 97), with a sample age mean of 2.79 years that Aman and Singh (2017)
claimed had not been an adequately validated age range for the ABC-C (see Table 7 for a
summary of all CFAs of the ABC-C with ID and alternative populations). Each of these
aforementioned analyses have merit with regard to examining the utility of the ABC-C with
various populations; however, given their samples’ inherent differences, these studies are not
similar (or comprehensive enough in many cases) to use as evidence to either support or refute
the ABC-C factor structure currently promoted by the test authors.

52
Table 7. Summary of Confirmatory Factor Analyses of the Aberrant Behavior Checklist-Community (ABC-C) with ID and Alternative
Populations
Research
Study
Source N Sample Rater Cross
Validation
Sample Used
Factor Solutions
Examined
Factor
Solution
Chosen
Parameter Metrics Cited
Brown et al.
(2002)a
Special
education
classrooms
601 56% male
Mean age: 13
Parents No Aman et al. (1985)
5-factor
5-factor RMSEA = .088
Sansone et al.
(2012)
Fragile X
treatment
and
research
centers
315 All with Fragile
X syndrome,
Mean age: 11
Males: 73%
Mean IQ: 58
Caregivers Yes Sansone et al. (2012)
1-factor,
Sansone et al. (2012)
5-factor,
Sansone et al. (2012)
6-factor
6-factor
+ 3 item
Self-
injury
item
parcel
RMSEA: .045
TLI: .98
SRMR: .03
SB 2: < .001
Schmidt et al.
(2013)
Hospital
outpatient
clinc &
home-based
research
study
97 Males: 73%
DD or ID: 45%
ASD: 13%
Mean age: 3
Caregivers No Aman & Singh (1994)
5-factor
5-factor RMSEA: .12
CFI: .55
2/df: 2.36
Wheeler et al.
(2014)
Research
registry
292 All with Fragile
X syndrome,
Mean age: 20
Males: 100%
Families No Aman & Singh (1994)
5-factor,
Sansone et al. (2012) 6-
factor
6-factor CFI: .94
TLI: .93
RMSEA: .05
RMSEA= Root Mean Square Error of Approximation, TLI = Tucker Lewis Index, SRMR =Standard Root Mean Square Residual, SB 2 = Satorra-Bentler Chi
Square, 2/df = Chi Square/degrees of freedom, CFI = Comparative Fit Index a A CFA was also conducted using an EFA of the ABC-C that was scored with a dichotomous rating, meaning the presence or absence of a particular symptom.
Because this represents a major change to the scoring of the scale, this was not included in this table.

53
The ABC-C, second edition. Aman and Singh (2017) made clear that the ABC-C,
Second Edition (ABC-C2) is not in fact a second edition of the scale, but rather a second edition
of the manual. However, some slight changes were made to the instrument. Scale items all
remained the same, but some subscale names were slightly modified (see Table 8 for details).
Table 8. Subscale Name Changes in the ABC-C Second Edition Manual
ABC-C Subscale Namea
ABC-C Subscale Name (Second Edition Manual)b
Irritability, Agitation, Crying
Irritability
Lethargy, Social Withdrawal
Social Withdrawal
Stereotypic Behavior
Stereotypic Behavior
Hyperactivity, Noncompliance
Hyperactivity/Noncompliance
Inappropriate Speech Inappropriate Speech a Subscale names from the ABC-C (Aman & Singh, 1994) b Subscale names from the ABC-C, Second Edition manual (Aman & Singh, 2017)
Changes in subscale naming include truncating the Irritability, Agitation, Crying subscale to just
Irritability, replacing the comma in the Hyperactivity, Noncompliance subscale with a virgule to
read as Hyperactivity/Noncompliance; and changing the Lethargy, Social Withdrawal subscale
to Social Withdrawal. No specific explanation or justification was provided in the manual for
the name changes.
The recent changes to the ABC-C factor names in the ABC-C2 manual seem to be minor,
except perhaps for the change from the Lethargy, Social Withdrawal factor to just Social
Withdrawal. This change signals either a removal of the shared importance of the Lethargy
construct from the factor or subsumes it under the Social Withdrawal conceptual umbrella.
Either way, the change could be conceptually and clinically significant with regard to other
populations, including the ASD population.
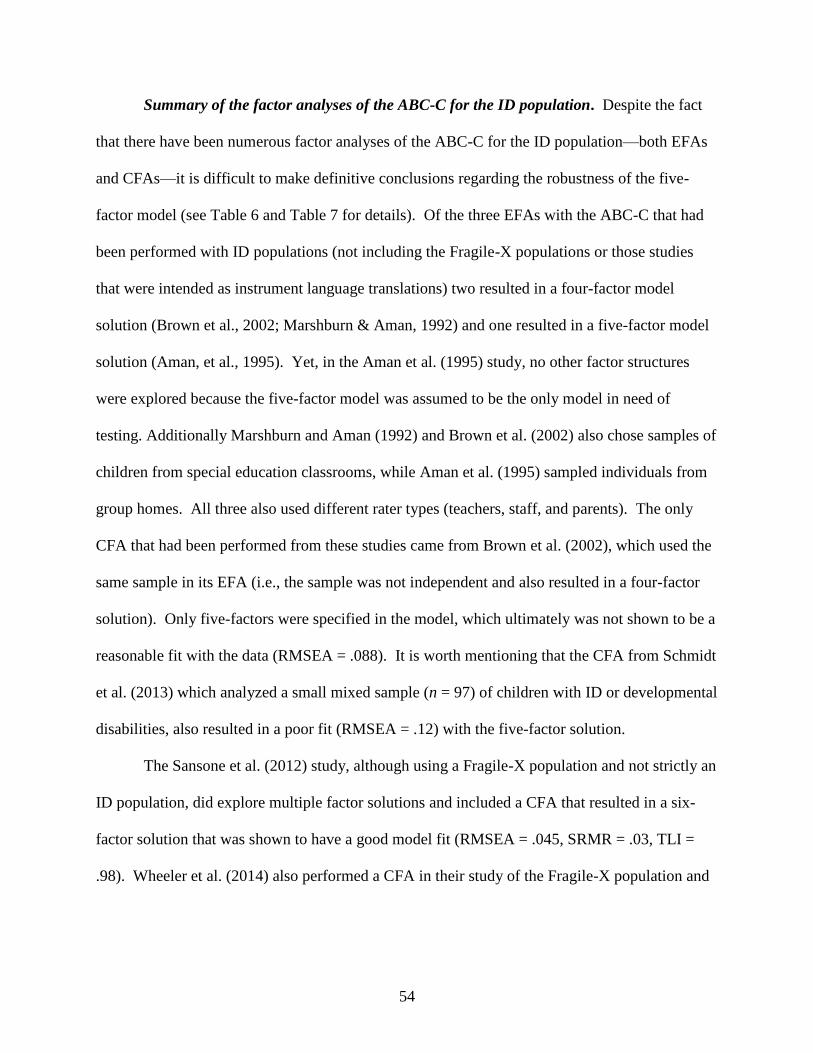
54
Summary of the factor analyses of the ABC-C for the ID population. Despite the fact
that there have been numerous factor analyses of the ABC-C for the ID population—both EFAs
and CFAs—it is difficult to make definitive conclusions regarding the robustness of the five-
factor model (see Table 6 and Table 7 for details). Of the three EFAs with the ABC-C that had
been performed with ID populations (not including the Fragile-X populations or those studies
that were intended as instrument language translations) two resulted in a four-factor model
solution (Brown et al., 2002; Marshburn & Aman, 1992) and one resulted in a five-factor model
solution (Aman, et al., 1995). Yet, in the Aman et al. (1995) study, no other factor structures
were explored because the five-factor model was assumed to be the only model in need of
testing. Additionally Marshburn and Aman (1992) and Brown et al. (2002) also chose samples of
children from special education classrooms, while Aman et al. (1995) sampled individuals from
group homes. All three also used different rater types (teachers, staff, and parents). The only
CFA that had been performed from these studies came from Brown et al. (2002), which used the
same sample in its EFA (i.e., the sample was not independent and also resulted in a four-factor
solution). Only five-factors were specified in the model, which ultimately was not shown to be a
reasonable fit with the data (RMSEA = .088). It is worth mentioning that the CFA from Schmidt
et al. (2013) which analyzed a small mixed sample (n = 97) of children with ID or developmental
disabilities, also resulted in a poor fit (RMSEA = .12) with the five-factor solution.
The Sansone et al. (2012) study, although using a Fragile-X population and not strictly an
ID population, did explore multiple factor solutions and included a CFA that resulted in a six-
factor solution that was shown to have a good model fit (RMSEA = .045, SRMR = .03, TLI =
.98). Wheeler et al. (2014) also performed a CFA in their study of the Fragile-X population and

55
found a better fit (RMSEA = .05) with the six-factor model found in Sansone et al. (2012)
compared to the Aman and Singh (1994) five-factor model.
Overall, based upon the numerous factor analyses that have been performed with the ID
population with the ABC and ABC-C, there are legitimate questions that can be raised regarding
the robustness of the five-factor model. A review of this historical literature appears to
strengthen the need to further examine the factor structure of the ABC-C, particularly when it is
used with an ASD population, as it may not be prudent to assume that the authors’ chosen five-
factor solution is definitively appropriate.
The ABC-C in the ASD population. At the time of this writing, three EFAs and two
CFAs of the ABC-C have been performed specifically with an ASD sample (Brinkley et al.,
2007; Kaat et al., 2014; Mirwis, 2011). Brinkley et al. (2007) arrived at a four-and a five-factor
solution, Kaat et al. (2014) arrived at a five-factor solution, while Mirwis (2011) retained a
seven-factor solution. Each of the studies used slightly different methods to perform their
analyses. Brinkley et al. (2007) and Kaat et al. (2014) also ran CFAs to assess their model fit,
though only Kaat et al. (2014) cross-validated their factor model in a separate sample. Table 9
includes a summary of EFAs of the ABC-C with ASD samples and Table 10 contains a summary
of CFAs of the ABC-C with ASD samples.
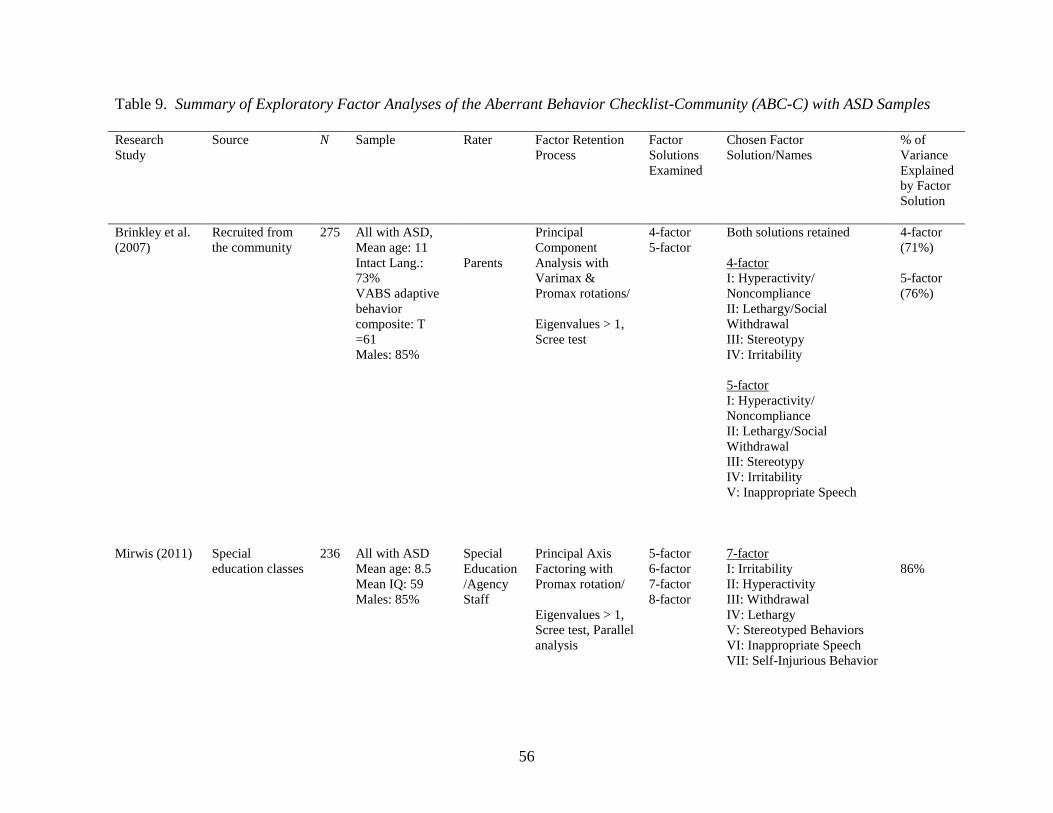
56
Table 9. Summary of Exploratory Factor Analyses of the Aberrant Behavior Checklist-Community (ABC-C) with ASD Samples
Research
Study
Source N Sample Rater Factor Retention
Process
Factor
Solutions
Examined
Chosen Factor
Solution/Names
% of
Variance
Explained
by Factor
Solution
Brinkley et al.
(2007)
Recruited from
the community
275 All with ASD,
Mean age: 11
Intact Lang.:
73%
VABS adaptive
behavior
composite: T
=61
Males: 85%
Parents
Principal
Component
Analysis with
Varimax &
Promax rotations/
Eigenvalues > 1,
Scree test
4-factor
5-factor
Both solutions retained
4-factor
I: Hyperactivity/
Noncompliance
II: Lethargy/Social
Withdrawal
III: Stereotypy
IV: Irritability
5-factor
I: Hyperactivity/
Noncompliance
II: Lethargy/Social
Withdrawal
III: Stereotypy
IV: Irritability
V: Inappropriate Speech
4-factor
(71%)
5-factor
(76%)
Mirwis (2011) Special
education classes
236 All with ASD
Mean age: 8.5
Mean IQ: 59
Males: 85%
Special
Education
/Agency
Staff
Principal Axis
Factoring with
Promax rotation/
Eigenvalues > 1,
Scree test, Parallel
analysis
5-factor
6-factor
7-factor
8-factor
7-factor
I: Irritability
II: Hyperactivity
III: Withdrawal
IV: Lethargy
V: Stereotyped Behaviors
VI: Inappropriate Speech
VII: Self-Injurious Behavior
86%

57
Table 9 (cont’d)
Kaat et al.
(2014)
Children’s
hospitals
(Autism
Treatment
Network)
113
0
All with ASD
Mean age: 6
Males: 84%
IQ < 70: 47%
Parents Principal Axis
Factoring with
Crawford-
Ferguson
Quartimax
rotation/
Eigenvalues > 1,
Scree test,
Clinical
meaningfulness
4-factor
5-factor
6-factor
5-factor
I: Irritability
II: Lethargy/Social
Withdrawal
III: Stereotypic Behavior
IV: Hyperactivity/
Noncompliance
V: Inappropriate Speech
n/a
Table 10. Summary of Confirmatory Factor Analyses of the Aberrant Behavior Checklist-Community (ABC-C) with ASD
Samples
Research
Study
Source N Sample Rater Cross Validation
Sample Used
Factor Solutions
Examined
Factor
Solution
Chosen
Parameter Metrics
Cited
Brinkley
et al.
(2007)a
Recruited
from
community
275 All with ASD
Mean age: 11
Intact language: 73%
VABS adaptive
behavior composite:
T = 61
Males: 85%
Parents No Aman & Singh (1994) 5-factor RMSEA: .091
NFI: .089
NNFI: .92
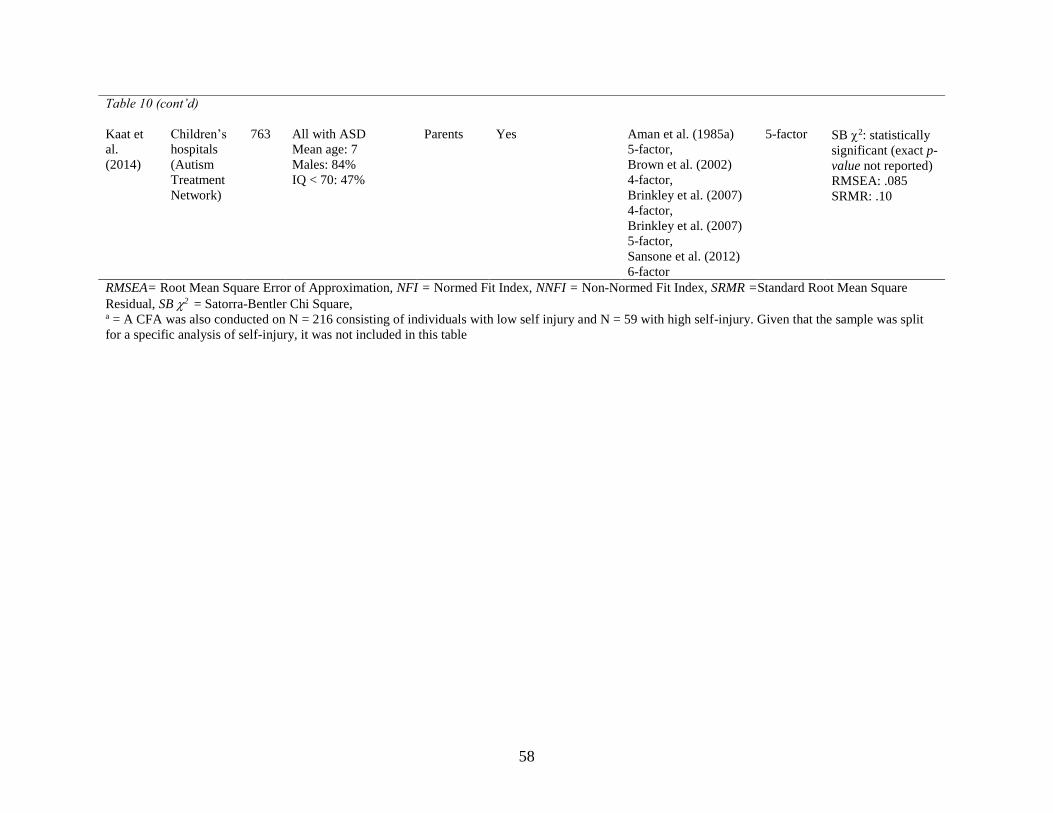
58
Table 10 (cont’d)
Kaat et
al.
(2014)
Children’s
hospitals
(Autism
Treatment
Network)
763 All with ASD
Mean age: 7
Males: 84%
IQ < 70: 47%
Parents Yes Aman et al. (1985a)
5-factor,
Brown et al. (2002)
4-factor,
Brinkley et al. (2007)
4-factor,
Brinkley et al. (2007)
5-factor,
Sansone et al. (2012)
6-factor
5-factor SB 2: statistically
significant (exact p-
value not reported)
RMSEA: .085
SRMR: .10
RMSEA= Root Mean Square Error of Approximation, NFI = Normed Fit Index, NNFI = Non-Normed Fit Index, SRMR =Standard Root Mean Square
Residual, SB 2 = Satorra-Bentler Chi Square, a = A CFA was also conducted on N = 216 consisting of individuals with low self injury and N = 59 with high self-injury. Given that the sample was split
for a specific analysis of self-injury, it was not included in this table

59
Brinkley et al. (2007). Brinkley et al. (2007) was the first study to assess the factor
structure of the ABC-C with an ASD sample. The authors cited the lack of existing rigorous
instruments to measure associated features of ASD and the importance of potentially using these
features to help identify existing ASD subgroups—which in turn could indicate the existence of
varying biological causes for the range of behaviors currently subsumed under the broad ASD
diagnosis. Further, they stated that assessing the ABC-C factor structure for the ASD population
could help to inform ASD treatment and further research.
To perform this analysis, Brinkley et al. (2007) sampled 275 individuals with ASD from
three to 21 years old (M =10.6; SD = 4.4), with 79% of the sample white, 85% male, and 24%
with impaired language (i.e., a 1 or 2 score on the ADI-R LeCouteur et al., [2003]). Subjects
were recruited via advertisements, support groups, and from clinical and educational
environments. Inclusion criteria were comprised of the aforementioned age range and a DSM-IV
(APA, 1994) clinical diagnosis of ASD (i.e., autistic disorder, Asperger’s disorder, and PDD-
NOS, although this was not clearly articulated in the study and only referred to as ASD from a
DSM-IV diagnosis). Individuals with severe physical or neurological disorders were excluded.
Parents completed all ABC-C ratings.
A PCA was used as the factor analytic method with varimax (Kaiser, 1958) and promax
(Hendrickson & White, 1964) rotations. To determine the number of factors to retain, the
eigenvalue-greater-than-one criterion along with the scree test method were employed. A CFA
was also used to assess the factor solution with the ABC-C structure to determine the quality of
model fit. Results were not cross-validated with an independent sample. Four-and five-factor
solutions were considered and a further stratification of groups was performed to explore the

60
factor structure of individuals with low and high self-injurious behavior characteristics—based
on outcomes from the ABC-C.
Brinkley et al. (2007) presented two solutions, a five-factor solution, which accounted for
76% of the variation in the data and a four-factor solution which accounted for 71% of the
variance in the data. The CFA for the five-factor solution yielded a root mean square error
approximation (RMSEA) of .091, which placed the model fit in a range between reasonable (<
.08) and poor (> .10; Brown & Cudeck, 1993 in Brinkley et al., 2007), and a normed fit index
(NFI) of .089 and non-normed fit index (NNFI) of .92, showing moderate fit (Stevens, 2002 in
Brinkley et al., 2007). In the five-factor solution, 96% of the variables on the Stereotypic
Behavior, Inappropriate Speech, and Lethargy, Withdrawal factors loaded on the same factors as
the ABC-C. The biggest difference between the ABC-C and the Brinkley et al. (2007) five-
factor solution concerned the shifting of all the items from the Irritability, Agitation, Crying
factor to the Hyperactivity, Noncompliance factor except for the three items which focused on
self-injurious behavior. With the four-factor solution, the Inappropriate Speech factor was
dropped and items were distributed between the Stereotypic Behavior and the Hyperactivity,
Noncompliance factors. Also, similar to the five-factor solution, the four-factor solution
maintained the Irritability scale but only with the same three items focused on self-injurious
behavior.
To further explore the emergence of the Self-Injurious Behavior factor, Brinkley et al.
(2007) separated out individuals with no or low self-injury profiles (based upon whether the sum
of the three self-injury items added up to scores < 3) and medium or high self-injurious behavior
profiles (based upon whether the sum of the three self-injury items added up to scores > 3). The
low-self injury group (N = 216) and the high-self injury group (N = 59) were then compared

61
across each of the different factors with data showing the high-self injury group scoring
significantly higher on average across all of the original ABC-C scales except the Inappropriate
Speech factor. Brinkley et al. (2007) then measured the factor structure differences between the
two groups, despite the potentially small sample size (N = 50) of the high-self injury group. The
authors found a five-factor solution similar to that of the ABC-C for the low self-injury group,
though they did not find any significant loadings (all < .2) for any of the self-injurious behavior
items. The RMSEA was a .088 indicating a model fit ranging between reasonable and poor
(Brown & Cudeck, 1993 in Brinkley et al., 2007) and an NFI and NNFI of .85 and .90
suggesting a borderline fit (Brinkley et al., 2007). For the high-self injury group a five-factor
solution was also found however all of the self-injurious behavior items shifted to the Stereotypic
Behavior factor. The CFA revealed a very poor fit with an RMSEA = .12 (Brown & Cudeck,
1993 in Brinkley et al., 2007) with the solution accounting for only 54% of variance. On the
whole, Brinkley et al. (2007) asserted that the presence of a significant subgroup of individuals
who were highly self-injurious likely accounted for some of the major differences between the
ABC-C factor structure and the results generated in the Brinkley et al. (2007) study.
Overall, Brinkley et al. (2007) maintained that both their four-and five-factor solutions
for ASD were similar to those found in previous factor analyses for non-ASD populations.
However, divergent findings that arose from their analyses concerned the movement of most of
the items on the original Irritability, Agitation, Crying factor to the Hyperactivity,
Noncompliance factor and the emergence of a self-injurious behavior subset (which then
encompassed the entire Irritability factor). The authors stated that this separate self-injurious
behavior factor was also found in Marshburn and Aman (1992) and is worthy of further
exploration (Marshburn & Aman, 1992 in Brinkley et al., 2007). Additionally, the authors
62
pointed out that because the ABC-Cs Irritability factor has been used to justify effects in
psychopharmacology trials for ASD, it also merits more intensive analysis because it includes
the self-injurious behavior items.
Mirwis (2011). In a published dissertation, Mirwis (2011) performed an EFA with an
ASD population in order to assess the factor structure of the ABC-C for individuals with autism.
The rationale for the dissertation stemmed from two key arguments. First, only one study,
Brinkley et al. (2007), had assessed the ABC-C factor structure in an ASD sample at that point in
time, so additional studies were clearly warranted. Second, Mirwis (2011) had methodological
concerns with the basic approach that Brinkley et al. (2007) used in their analysis (i.e., PCA
rather than an EFA for factor extraction). Mirwis (2011) argued that the PCA approach that
Brinkley et al. (2007) used was conceptually inappropriate in that the PCA method derives
factors from measured or observed variables only. Rather, Mirwis (2011) asserted that Brinkley
et al. (2007) should have used the EFA method, which would have better uncovered the latent
variable constructs in the ABC-C. Further, because Brinkley et al. (2007) also found a somewhat
different factor structure from the ABC-C, even though the same number of factors, five, was
retained in the final solution, Mirwis (2011) remarked that this potentially opened up more
questions about how the ABC-C might function for individuals with ASD.
To perform the study, Mirwis (2011) sampled 236 individuals with ASDs (i.e., autistic
disorder or PDD-NOS) ranging in age from three to 21 years old (M = 8.5, SD = 4.5) who
attended a special education agency that served individuals with significant developmental
disabilities. Inclusion criteria comprised the three to 21-year age range and an autistic disorder
or PDD-NOS diagnosis. Students in agency classrooms presented with significant functional
impairment as reflected in delays in cognition, adaptive behavior, and social and communication

63
skills. Mean IQ for the sample was 59. Special education staff members rated all individuals in
the sample.
An EFA was performed using the principal axis factoring (PAF) extraction method on the
Pearson correlation matrix, followed by three tests to determine the number of likely
interpretable factors and whether the factors were correlated or not (i.e., the eigenvalue-greater-
then-one rule, scree plot, and parallel analysis [Horn, 1965]), along with an oblique, promax
(Hendrickson & White, 1964) rotation. Four different factor solutions were considered (five, six,
seven, and eight). Following the EFA, concurrent validity analyses (convergent and divergent
validity) were performed using the Pervasive Development Disorder Behavior Inventory
(PDDBI; Cohen & Sudhalter, 2005) and the GARS-2 (Gilliam, 2006) as external criterion
measures.
Mirwis (2011) ultimately decided on a seven-factor solution. Three of the factors clearly
matched those found in prior ABC-C factor analyses. These were retained as Stereotyped
Behaviors, Inappropriate Speech, and Hyperactivity, Noncompliance. However, four other
factors resulted from the standard Irritability, Agitation, Crying and Lethargy factor and Social
Withdrawal factor, each splitting into two factors. A separate Lethargy factor split off from the
Social Withdrawal factor of the ABC-C, and a Self-Injurious Behavior factor split off from the
Irritability, Agitation, Crying factor of the ABC-C. Interestingly, Mirwis (2011), like Brinkley et
al. (2007), also found a cluster of three items that seemed to indicate an underlying self-injurious
behavior factor. However, Brinkley et al. (2007) chose to retain the variables under the
Irritability factor rather than split it off into a distinct factor like Mirwis (2011). Finally, Mirwis
(2011) found moderate to strong evidence of convergent validity for several of the factors with
similar conceptual scales on the PDDBI (Cohen & Sudhalter, 2005) and the GARS-2 (Gilliam,
64
2006) and evidence of divergent validity with those scales conceptually dissimilar. However, the
PDDBI and GARS-2 did not allow for equivalent criterion constructs for some of the factors.
Overall, Mirwis (2011) concluded that the factor structure of the ABC-C may be different
for individuals with ASD. Mirwis (2011) emphasized the need for more EFAs to better assess
possible variability in the ABC-C factor structure for the ASD population. Mirwis (2011) also
highlighted the continual emergence of the items that seem to underlie a Self-Injurious Behavior
factor. These items, having been highlighted (at that point) in Brinkley et al. (2007) and also in
Marshburn and Aman (1992)—although in that study with a non-ASD sample—point to a
construct that may be particularly relevant for ASD populations and potentially non-ASD
populations as well. Mirwis (2011) emphasized the need for further EFAs with large sample
sizes to more thoroughly examine the existence of this factor.
Kaat et al. (2014). Kaat et al. (2014) conducted both an EFA and a CFA with an ASD
population in order to assess the factor structure of the ABC-C for individuals with ASD. The
impetus for performing the study centered around the fact that the ABC-C had become popular
for individuals with ASD but still lacked a thorough psychometric analysis for the ASD
population. Kaat et al. (2014) also took advantage of the large sample size they accessed for the
study and cross-validated the results using split samples.
To perform the study, Kaat et al. (2014) sampled 1,893 individuals total between two and
18 years old (M = 6.5, SD = 3.6) culled from a network consisting of 17 children’s hospitals in
the US and Canada. Participants had all met criteria for autism or ASD based on the ADOS
(Lord, Rutter, DiLavore, & Risi, 2000). Parents rated children on the ABC-C. The EFA
included 1,130 participants while the CFA validation sample included 763 participants. Forty-
seven percent of participants had an IQ of < 70.
65
An EFA was performed using ordinary least squares estimation with an oblique
quartimax rotation (Neuhaus & Wrigley, 1954) on the polychoric correlation matrix (Pearson,
1900) for the extraction method, followed by three methods to determine the number of factors
that best fit the data (i.e., eigenvalue-greater-than-one rule, scree plot, and clinical
meaningfulness). For the CFA, three previous factor models potentially relevant for ASD were
analyzed—including Brinkley et al. (2007), as the only other model that was based on an ASD
sample. The CFA was conducted using diagonally-weighted least squares estimation on the
polychoric correlation matrix and sample-estimated asymptotic covariance matrix. Concurrent
validity analyses were conducted using relevant scales from the ADOS (Lord et al., 2000), the
Vineland Adaptive Behavior Scales-Second Edition (VABS-II; Sparrow, Cicchetti, & Balla,
2005), the Stanford Binet-Fifth Edition (SB-5; Roid, 2003), and the Child Behavior Checklist
(CBCL; Achenbach & Rescorla, 2000, 2001).
Kaat et al. (2014) examined a four-, five-, and six-factor solution. Ultimately, they
decided on a five-factor solution and found 90% of the ABC-C items loaded on the same factors
as found for the original scale. The CFA analyzed the fit of the four-factor solution used by
Brown et al. (2002), who sampled 601 children ages 6-22 (M = 13.2) with developmental
disabilities in special education classes, rated by caregivers; the four- and five-factor solutions
proposed by Brinkley et al. (2007); the six-factor solution by Sansone et al. (2012), who sampled
315 children and adults ages 3-25 (M =11.07) with Fragile X syndrome, rated by caregivers; and
the original five-factor solution of the ABC by Aman et al. (1985a), which maintained the same
factor structure and item loadings as the ABC-C (Aman & Singh, 1994). The four-factor model
by Brown et al. (2002) resulted in a weak fit (RMSEA = .12), but the other four-, five-, and six-
factor models all yielded a somewhat better and similar degree of fit, with RMSEAs ranging

66
from .081 to .086. Notably, Kaat et al. (2014) remarked that they decided upon retaining the
five-factor solution of the ABC after the CFA, despite an RMSEA = .086, because of the
“historical basis and widespread use of the original factor structure and results of other factor
analytic studies” on the ABC-C citing a “historical and pragmatic perspective” (p. 1107).
Further, Kaat et al. (2014) found that participant age, sex, and IQ were mostly “unrelated” to the
ABC-C scale scores (p. 1107). In general, appropriate convergent and divergent validity was
found between the newly factor analyzed ABC-C scores and the different external measures used
for comparison—though the external criterion measures were not able to exactly or closely
represent some of constructs required by the ABC-C factors.
Overall Kaat et al. (2014) concluded that the original, five-factor structure of the ABC-C
was likely strong for the ASD population. The authors did acknowledge the “less-than-optimal
model fit” of the model with the RMSEA above .08; a Standard Root Mean Square Residual
(SRMR) at .10, rather than the more ideal < .05 (Browne & Cudeck, 1992 in Kaat et al., 2014, p.
1112); and the Satorra-Bentler Chi-square (SB 2) statistic that was statistically significant,
meaning that there is a statistically significant difference between the actual and proposed
models. Kaat et al. (2014) remarked that a few “item pairs or triplets evidence a high degree of
residual covariance” could allow for a more complicated factor structure but that they chose to
maintain the current model because it was more “practical” and “parsimonious” (p. 1112). This
residual (unmodeled) covariance could also provide evidence of more factors or, as the authors
maintain, a more complicated factor solution.
Three other results are important to note. First, Kaat et al. (2014) highlighted the fact that
two items that previously loaded on the Hyperactivity/Noncompliance factor loaded on the
Irritability, Agitation, and Crying subscale—although high cross-loadings were found as well.
67
Kaat et al. (2014) dismissed this as “due to sample artifacts” and not evidence of a problem with
the model (p. 1112). Second, Kaat et al. (2014) remarked that a three-item Self-injurious
behavior (SIB) factor emerged in the six-factor solution. The authors stated: “when present, the
SIB is often highly clinically significant” although they asserted that it is not core to ASD
diagnostic symptomology (Kaat et al., 2014, 1112). They argued that including a sixth factor did
not greatly improve the model fit. Finally, the authors addressed the fact that the Lethargy,
Social Withdrawal factor remained intact in their model though it was split into two factors in
Sansone et al. (2012), one of the models used in the CFA. Kaat et al. (2014) highlighted the fact
that the Sansone et al. (2012) model was based on a sample of individuals with Fragile-X
syndrome and overall did not result in a model that was greatly superior to their five-factor
solution. However, Kaat et al. (2014) did raise the question as to whether there is a justification
for “an alternative scoring method” for individuals with particular syndromes, although
ultimately Aman and Singh (2017), the original test authors, emphatically advised against it
(Aman & Singh, 2017, p. 1113).
Summary of the EFAs of the ABC-C for the ASD population. Both Aman and Singh
(2017) and Mirwis (2011) reviewed the various factor analyses of the ABC and ABC-C.
However, both developed distinctly different conclusions about the robustness of their factor
structures. According to Aman and Singh (2017), the factor structure of the ABC-C has been
replicated multiple times, regardless of changes in age range, environments, types of raters, and
even language translations. The authors also claimed that there was a high level consistency
among items loading on the same factors across the various factor analytic studies of the ABC
and the ABC-C (i.e., average overlap across 14 studies was 85% of all 58 items; Aman & Singh,
2017). Further, they stated that coefficient alphas and Harman’s coefficient of congruence were
68
consistently strong across these 14 studies, despite the fact that the CFAs performed on the ABC
and ABC-C were not found to result in strong model fits (Aman & Singh, 2017). Overall, Aman
and Singh (2017) concluded that taken together, the various factor analytic studies of the ABC
and ABC-C consistently supported the five-factor structure.
On the other hand, Mirwis (2011) argued that there have been various methodological
flaws across the different factor analytic studies that make it inappropriate to reach strong
conclusions. In particular, Mirwis (2011) contended that many of the factor analytic studies
failed to examine solutions greater than or less than five factors. In those studies that did so, the
authors often chose different solutions (Mirwis, 2011).
Overall, there is disagreement between the test authors (Aman & Singh, 2017) and
Mirwis (2011) regarding the robustness of the factor structure for the ABC-C. Thus, there is a
clear need for analyses using new samples and employing rigorous methods to examine the
factor structure of the ABC-C in persons with ASD. This dissertation will take a step toward
meeting that need by examining the factor structure of the ABC-C with samples of individuals
with ASD as rated by special education staff members
Variables of Sample Characteristics
Given the variety of participants measured with the ABC-C—and in particular the
subjects to be focused on in this study—it is necessary to address the influence that certain
variables may have on outcomes for individuals with ASD. Mayes and Calhoun (2011) looked
into the influence of age, SES, gender, race, and IQ on ASD symptomology. The authors found
no significant effects of race, SES, and gender but found that IQ and age did affect the severity
of symptoms. In the three EFAs performed of the ABC-C with individuals with ASD (Brinkley

69
et al., 2007; Kaat et al., 2014; Mirwis, 2011), only Kaat et al. (2014) addressed the influence of
demographic variables on their results.
Kaat et al. (2014) looked at the correlations between ABC-C subscale scores and external
variables including sex, IQ, and age, and concluded that the effects were relatively minor. They
found no major effects with regard to sex, similar to Mayes and Calhoun (2011). They did find
that an increase in age was associated with decreases in Irritability (r = -.13) and Hyperactivity
(r = -.16). Lower IQ scores were associated with increases in Stereotypic Behavior (r = -.19),
Social/Withdrawal (-.12), and Inappropriate speech (-.09). Results also showed that adaptive
behavior, particularly with regard to communication, was more highly correlated than IQ with
regard to ABC-C scores. Kaat et al. (2014) also found minor effects for the influence of age and
IQ when their reference group was divided into groups < 6 years old, 6 to < 12 years old, > 12
years old, and split between individuals with IQ scores of < 70 and > 70, though the authors
highlight the fact that all the effects were small. Effects were found for age on the Irritability,
Social Withdrawal, and Hyperactivity/Noncompliance subscales with ω2 ranging from .001 to
.003. IQ was found to affect Social Withdrawal (ω2 = .007) and Stereotypic Behavior (ω2 =
.001), and a significant interaction was found between IQ and age for Inappropriate Speech (ω2 =
.005). Overall, as shown in Kaat et al. (2014), there are some variables that have minor effects
on the mean scores for particular factors. Mean score differences (e.g., for age and sex) are
addressed in reference group scoring data for the ABC-C in the manual (Aman & Singh, 2017).
Kaat et al. (2014) also explored whether particular variables could have substantial
effects on the factor structure of the ABC-C. Kaat et al. (2014) divided their calibration sample
for their CFA by age at 6 years (older and younger), IQ at 70 (above and below) and by ADOS
comparison score (above and below 7) to see whether or not these variables had significantly

70
influenced the model fit. A marginal fit was found across all samples with RMSEAs ranging
from .081 to .092 and Standard Root Mean Square Residuals (SRMR) ranging from .10 to .11,
with little difference found between the different groups. As such, these demographic variables
did not seem to have a great effect on the model fit of the five-factor structure and thus, did not
seem to have great influence on the overall five-factor solution.
The effects of certain demographic variables on the ABC-C subscale scores found in
Kaat et al. (2014) indicated small effect sizes that could be explored in future studies once the
factor structure of the ABC-C is clearer for the ASD population. However, although these
variables are included in the sample description, the relative influence of certain demographic
variables on outcomes is not a focus of this study. Thus, no specific hypotheses will be included
on the topic. The purpose of this study will be more limited to examining the factor structure of
the ABC-C with an ASD sample.
Purpose of the Current Study
The purpose of the current study is to examine the psychometric properties of the ABC-C
with an ASD sample as rated by special education staff. There are four specific gaps in the
research literature that this study will help to address. First, despite the instrument’s immense
popularity within the ASD research community, there has not been sufficient research performed
on the factor structure of the ABC-C with ASD samples. As such, there is still ambiguity and a
lack of evidence regarding the most appropriate factor structure for the ABC-C when used with
the ASD population. Of note, a strong argument could be made regarding the lack of evidence
for an appropriate factor structure for the ID population as well, the scale’s initially intended
population, though this study will not explore that line of argument. Second, the factor analyses
that have been performed with the ABC-C have not been as rigorous as they could be according
71
to current best practices (e.g., Norris & Lecavalier, 2010b), most notably that alternative factor
structures were often not fully and appropriately explored in EFA nor tested in CFA. Third, as
mentioned previously, only one study, Mirwis (2011), used special education staff to rate
participants with ASD. As indicated, his solution currently exists as an outlier compared to the
other EFAs. This could indicate that raters from this environment are bringing a unique
perspective to their ratings compared to caregivers, and could, in turn, affect outcomes. Thus, it
is important to explore the robustness of the findings by Mirwis (2011) with a similar sample of
subjects and raters as well as try and improve upon the rigor of his analysis. Fourth, no study has
performed a CFA on the ABC-C directly comparing all the models generated with ASD samples
(Brinkley et al., 2007 Kaat et al., 2014; Mirwis, 2011). This study provides an opportunity to do
so and also will include a model generated through the EFA in this study as well.
Of note, there is an argument to make for excluding an EFA analysis altogether and
performing only a CFA to test the different solutions that have been found amongst the three
available studies for the ASD population. However, given the lack of methodological rigor in
Brinkley et al. (2007), and the suspect factor solution selection criteria used by Kaat et al. (2014),
there is a strong possibility that a different factor solution could exist that has not been
appropriately explored. Constraining the CFA to the existing models only without first
performing a more thorough EFA prior could potentially result in having to accept a less
rigorous model. Thus, it is likely more advantageous to perform due diligence with the EFA first
and complement it with a more effective CFA.
Further justification for the study is also noted in the aforementioned SEPT (2014)
standards with regard to validity, fairness, and test design and development (see Tables 1, 2, and
3 for details). With regard to validity, Standards 1.1, and 1.3 highlight the fact that a test is not

72
valid for “all purposes or in all situations” and that when a new situation arises validation is
required (SEPT, 2014, p.23). It is argued herein that adequate validity has not been satisfactorily
established for the ASD population with the ABC-C and further validation is necessary. In
addition, according to Standard 1.4, with regard to the use of the ABC-C in a different way that
has not been thoroughly validated, further exploration is also necessary to help determine
whether the choice of using raters from a special education environment might result in a
different factor structure, as was found in Mirwis (2011).
With regard to the SEPT standards for fairness, Standard 3.3 highlights the importance
for relevant subgroups to have been included when developing the ABC-C. The ABC-C was
initially intended for the ID population, not for the ASD-population. The ABC-C has now been
used in very consequential studies by multiple ASD researchers despite the fact that this
population was not assessed during the initial development. Aman and Singh (2017) seem to
imply in the ABC-C2 manual that because the ASD population falls under the ID/developmental
disabilities population, it is unnecessary to explore whether there is potentially a different factor
structure (p. 54). Recent research (e.g., Kurzius-Spencer et al., 2018) has shown that there are
distinctive behavioral differences between the ID and ASD populations, despite an overlap of
symptomology and common comorbidity. Therefore, it is argued that it is most sensible to
further assess the factor structure of the ABC-C for the ASD population.
Finally, with regard to the SEPT standards for test design and development, Standards
4.0, 4.1, and 4.6 maintain a similar spirit to the standards provided for validity, though with a
more specific focus on test development processes. Once again, the ABC-C was not initially
developed for the ASD population and it is the contention herein that adequate evidence for the
structure of the ABC-C with an ASD population has not been shown, thereby requiring further

73
analysis. Standard 4.24 goes one step further however and highlights the fact that when new data
arises, test specifications may need to be amended or revised. It was argued previously that the
factor analyses by Brinkley et al. (2007), Mirwis (2011), and Kaat et al. (2014) revealed data that
called into question both the current factor structure of the ABC-C for the ASD population and
the conclusions arrived at by the ABC-C test authors (Aman & Singh, 2017). Thus, following
the essence of this standard, it is necessary to further explore the ABC-C factor structure with the
ASD population to determine whether the scale requires revision for this population.
Specifically, the following five questions will be addressed. (Note that research
questions, hypotheses, and associated justifications are covered in more detail within the method
section. Research questions one through four will be covered within the method subsection for
study one and research question five will be covered within the method subsection for study
two.)
Research Questions
Questions one through four, described below, will be investigated via exploratory factor
analytic techniques. Question five will be investigated via confirmatory factor analytic
techniques.
Research question 1. Based upon ratings of a sample of individuals with ASD by
special education staff, how many possible or likely interpretable ABC-C factors are available
for retention consideration?
Research question 2. How many factors should be retained in order to derive the most
interpretable factor solution?
Research question 3. Does the most interpretable factor structure yield substantive
correlations amongst the factors?

74
Research question 4. If a five-factor solution is interpretable (and even if it is not the
retained solution), to what extent does the solution correspond to the five factors hypothesized by
the test authors?
Research question 5. How does the factor solution generated in a sample of individuals
with ASD rated by special education staff members for the ABC-C compare in terms of absolute
and relative fit to previous ABC-C factor models found in ASD samples or proposed for use with
individuals with ASD?
75
CHAPTER 3: METHOD
Two studies were performed in this dissertation. The first study consisted of an
exploratory factor analysis (EFA), encompassing research questions one through four. The
second study was a confirmatory factor analysis (CFA), which was dependent upon the outcome
of study one and addresses research question five. The research design and procedures used to
collect extant data will be discussed. This will be followed by the hypotheses and method for
study one, and the hypothesis and method for study two.
Research Design
The focus of study one and study two is on instrument validation, in terms of internal
structure and model fit, with an ASD sample and special education staff raters. From a design
perspective (e.g., Kazdin, 2017), such studies are observational, correlational, and cross-sectional
in nature, and involve multivariate statistical techniques intended to examine latent structures
and their meaning. Factor analytic techniques were used to reduce derived inter-item
correlations to the most useful and interpretable number of potential explanatory variables.
Factor-based scales were constructed and the model was tested against existing competing
models to determine the best structural fit.
Extant Data Collection
Data for study one were extracted from a large existing data set of special education staff
ratings of individuals with ASD from a center-based, special education agency in western New
York State that serves students with developmental disabilities. Data for study two comes from
the same center-based special education agency in western New York State. Though many of the
cases used in study two overlap with the larger sample to be used for the EFA, some cases come
from program evaluation periods other than those used for the EFA.

76
Of note, extant data collection methods for these two studies were similar to those used in
the ABC-C EFA study by Mirwis (2011), as well as the EFA of the SRS-2 (Constantino &
Gruber, 2012) by Nelson (2015), and the EFA of the GARS-2 (Gilliam, 2006) by Dua (2014).
This includes similar recruitment procedures and subject participation from a comparable
population as well as analogous procedures for data entry and analysis.
Raters. Data in the extant datasets consist of participant ratings made by special
education staff members, which comprised individuals working in the special education
classroom environment who have intimate knowledge of students in this context. Special
education staff members include special education teachers, teaching assistants, speech
pathologists, physical therapists, occupational therapists, behavior technicians, individual student
aides, whole classroom aides, and trained volunteer assistants associated with the agency
described above. A multitude of raters were chosen by the agency to ensure that there would be
a one-to-one correspondence with regard to rater and student. Ratings occurred on an annual
basis as part of the agency’s regular program evaluation process from 2005 through 2018. Staff
psychologists assigned raters to particular students. Each rater was assigned a single student to
rate, which maintained independence across ratings. Rater familiarity with each student ranged
in time from six weeks to twenty-eight months of interaction. Despite familiarity with the
students, raters were not typically aware of formal, individual student diagnoses, although the
majority of raters were aware of the nature of ASD symptomology as a result of their experience
working in the special education environment.
Procedures. Procedures for obtaining rating scale data in the extant data set were
developed by the special education agency for their annual program evaluation process. Each
case was assigned a packet of rating measures to be completed by the designated rater. Each

77
packet contained between three and five rating instruments. Measures were counter-balanced at
random within each packet and staff members were instructed to complete them in the order
given. All possible instrument orders were represented.
Each completed protocol was checked by a program evaluation staff member in order to
detect missing item responses or items with additional mistaken responses. Problematic items
were resolved by contacting the rater. Once measure forms were determined to be complete, two
program evaluation staff members independently scored each one. Scoring discrepancies were
resolved by a third program evaluation staff member.
Each case in the dataset was assigned a unique ID code by the director of program
evaluation at the agency. Only the director of program evaluation at the agency had the list of
identifying information linked to each code. The investigator for these studies did not have
access to any individual identifying information beyond the case ID code.
Inclusion/exclusion criteria. Participant suitability for study inclusion was determined
by a three-stage screening process including (a) chronological age parameters between three and
21 years old; (b) a clinical diagnosis of autistic disorder or PDD-NOS based on DSM-IV-TR
(APA, 2000) criteria or an ASD diagnosis based on DSM-5 (APA, 2013) criteria as determined
by a licensed psychologist or licensed medical professional, or an ASD special education
eligibility designation as determined by the participants’ school-based special education
committee; and (c) current participation in special education classrooms appropriate for students
with substantial functional impairment (e.g., individuals with significant delays in cognitive,
social, and communication domains with Intelligence Quotient [IQ] typically in the cognitive
impairment/intellectual disability range). Cognitive data for participants were derived from a
variety of measures, including: the Bayley Scales of Infant Development, (Bayley, 1969), Bayley

78
Scales of Infant Development, Second Edition (Bayley, 1993), Bayley Scales of Infant
Development, Third Edition (Bayley, 2006), Stanford-Binet Intelligence Test, Fourth Edition
(Thorndike, Hagen, & Sattler, 1986), Stanford-Binet Intelligence Test, Fifth Edition (Roid,
2003), the Comprehensive Test of Nonverbal Intelligence (Hammill, Pearson, & Wiederholt,
1996), the Cognitive Assessment System, Second Edition (Naglieri, Das, & Goldstein, 2014), the
Differential Ability Scales (Elliott, 1990), the Differential Ability Scales, Second Edition (Elliott,
2007), the Kaufman Assessment Battery for Children (Kaufman & Kaufman, 1983), the
Kaufman Brief Intelligence Test (Kaufman & Kaufman, 1990), the Learning Accomplishment
Profile-Diagnostic Standardized Assessment (Nehring, Nehring, Bruni, & Randolph, 1992), the
McCarthy Scales of Children’s Abilities (McCarthy, 1972), the Universal Nonverbal Intelligence
Test (Bracken & McCallum, 1998), the Wechsler Abbreviated Scale of Intelligence (Wechsler,
1999), the Wechsler Abbreviated Scale of Intelligence, Second Edition (Wechsler, 2011), the
Wechsler Adult Intelligence Scale, Third Edition (Wechsler, 1997), the Wechsler Intelligence
Scale for Children, Revised (Wechsler, 1974), the Wechsler Intelligence Scale for Children,
Third Edition (Wechsler, 1991), the Wechsler Preschool and Primary Scale of Intelligence,
Revised (Wechsler, 1989), the Wechsler Preschool and Primary Scale of Intelligence, Third
Edition (Wechsler, 2002), and the Wechsler Preschool and Primary Scale of Intelligence, Fourth
Edition (Wechsler, 2012). No single measure was used consistently for all participants due to
variable ages, behavioral challenges, and communication skills of the participants. All cognitive
scores were set to a deviation quotient (DQ) metric, with a normative mean of 100, and a
standard deviation of 15, in order to allow for some limited comparability of participants’
cognitive scores. Only the most recent cognitive test information available for each participant
was used.
79
Study One: EFA
Research questions, rationales, and hypotheses. Research questions one through four
were addressed through the EFA. Table 11 contains a summary of the four research questions
for study one and the EFA statistics that were used to determine their outcomes.
Research question 1. Based upon ratings of a sample of individuals with ASD by special
education staff, how many possible or likely interpretable ABC-C factors are available for
retention consideration?
Research rationale and hypothesis 1. Among the three prior factor analyses that were
performed on the ABC-C with an ASD population (Brinkley et al., 2007; Kaat et al., 2014;
Mirwis, 2011) between four and eight interpretable factors were found to be available for
retention. Brinkley et al. (2007) considered a four-factor and a five-factor solution, which they
stated were based closely upon previous analyses performed with the ABC and ABC-C. Results
from the Guttman-Kaiser criterion and scree test—the analyses they used to help determine the
number of factors to retain—were not provided and no explanation was offered as to why they
did not examination other possible factor solutions. Kaat et al. (2014) considered a four-, five-,
and six-factor solution, although they found 11 eigenvalues > 1. The authors also reported that a
scree plot analysis supported a five-factor solution—which is what they ultimately retained.
Mirwis (2011) considered between five and eight factors in his analysis and retained a seven-
factor solution. Therefore, based upon previous factor analyses with the ABC-C with an ASD
population, it is hypothesized that there will be between four and seven interpretable factors
available for retention. Possible factor solutions for further examination will be determined
using Principal Axis Factoring (PAF) along with the Guttman-Kaiser criterion (Guttman, 1954;
Kaiser, 1960), the scree test (Cattell, 1966), parallel analysis (Horn, 1965) and the minimum
80
average partial test (MAP; Velicer, 1976). Depending upon the level of agreement amongst the
various criteria, a range of factor solutions will be explored (e.g., solutions consisting of the
consensus number of factors plus or minus two factors will denote the range to be examined for
interpretability).
Research question 2. How many factors should be retained in order to derive the most
interpretable factor solution?
Research rationale and hypotheses 2a, 2b, and 2c. Previous factor analyses with the
ABC-C performed with an ASD population (i.e., Brinkley et al., 2007; Kaat et al., 2014; Mirwis
2011) have resulted in four-, five-, and seven-factor solutions. Brinkley et al. (2007) found both
a four-factor solution (Hyperactivity, Lethargy, Stereotypy, Irritability) and a five-factor solution
(Hyperactivity, Lethargy, Stereotypy, Irritability, Inappropriate Speech). Mirwis (2011) chose a
seven-factor solution (Irritability, Hyperactivity, Withdrawal, Lethargy, Stereotyped Behaviors,
Inappropriate Speech, and Self-Injurious Behavior), which included splitting the Lethargy,
Social Withdrawal factor on the ABC-C into two separate factors and included a separate Self-
Injurious Behavior factor consisting of three items usually assigned to the Irritability factor.
Kaat et al. (2014) selected a five-factor solution (Irritability, Lethargy, Social Withdrawal,
Stereotypic Behavior, Hyperactivity/Noncompliance, and Inappropriate Speech) consistent with
the standard five subscales posited by the authors of the ABC-C. Across the three studies,
factors consistent with Hyperactivity, Lethargy, Stereotypy, and Irritability constructs have all
been retained. Each of the studies also discovered evidence of a self-injurious behavior factor,
with Mirwis (2011) choosing to retain it, Brinkley et al. (2007) simply keeping the Irritability
factor name—though only self-injurious behavior items loaded on the factor in both the four-and
five-factor solutions—and Kaat et al. (2014) deciding to discard it. Only the factor analysis by

81
Mirwis (2011) used ABC-C ratings completed by special education staff for an ASD population.
Therefore, based upon previous factor analyses, three hypotheses will be made: a) at least four
factors will likely be retained, b) an Inappropriate Speech factor will appear, and c) a Self-
Injurious Behavior factor will also appear. All three hypotheses will be determined by
examining the pattern and structure matrices (resulting from oblique direct oblimin rotation
[Jennrich & Sampson, 1966]) for interpretability of factors across the range of possible factor
solutions (i.e., possible factor solutions suggested by the combination of the Guttman-Kaiser
criterion, the scree test, parallel analysis, and the MAP test).
Research question 3. Does the most interpretable factor structure yield substantive
correlations amongst the factors?
Research rationale and hypothesis 3. Analyzing correlations amongst factors helps to
elucidate the nature of the underlying constructs within the data (Fabrigar et al., 1999). The
degree to which factors are correlated is often indicative of the strength of the conceptual
relations among the factors. Depending upon the nature of the scale, certain constructs should be
more correlated (e.g., Hyperactivity and Irritability) or less correlated (Inappropriate Speech and
Lethargy, Social Withdrawal). This can provide further evidence for the validity of factor-
naming choices. If substantive enough, such correlations could also reveal the presence of
higher-order factors, which could represent the statistical and conceptual basis for one or more
composite scores. Aman and Singh (2017) argued that an overall composite score for the ABC-
C would be “a mish-mash of problem behaviors that have no clinical or empirical meaning,” (p.
56). Brinkley et al. (2007) did not report inter-factor correlations. Kaat et al. (2014) reported
inter-factor correlations ranging from .09 (Inappropriate Speech and Stereotypic Behavior) to .50
(Hyperactivity/Noncompliance and Irritability) but did not fully explore their potential

82
implications. Mirwis (2011) reported inter-factor correlations ranging from .05 (Inappropriate
Speech and Self-Injurious Behavior) to .55 (Irritability and Hyperactivity), but also did not
comment on any potential implications. Therefore, based upon the EFAs by both Mirwis (2011)
and Kaat et al. (2014), it is hypothesized that there will be substantive correlations (i.e., > .30;
Beavers et al., 2013) among at least some factors. This will be determined by analyzing the
relations in the inter-factor correlation matrix of the chosen factor solution after the oblique
rotation.
Research question 4. If a five-factor solution is interpretable (and even if it is not the
retained solution), to what extent does the solution correspond to the five-factors hypothesized
by the test authors?
Research rationale and hypothesis 4. Aman and Singh (2017), the ABC-C test authors,
insist that the five-factor solution of the ABC-C has now been continuously supported by prior
factor analyses. The authors also argued that the development of syndrome-specific scales (such
as for ASD) is counterproductive because it would open up the possibility of having to develop
various scales for the different syndrome populations. It is beyond the scope of this dissertation
to debate the extent to which arguments that Aman and Singh (2017) make regarding this issue
have merit, but it is worthwhile to determine whether or not their preferred factor solution is
actually most appropriate for the ASD population. Curiously, the CFA that Kaat et al. (2014)
performed showed little difference between the strength of a five-and six-factor model, yet they
continued to maintain the five-factor solution, based on historical precedent. Mirwis (2011)
found a five-factor solution that was similar to the ABC-C factor structure (Irritability, Lethargy,
Stereotypic Behavior, Hyperactivity, and Inappropriate Speech), though reasoned that a seven-
factor solution was more conceptually meaningful and the most appropriate. Thus, in order to

83
maintain an open and generally exploratory approach to the analysis, and limit any preconceived
outcomes, it is necessary to rigorously assess the strength of all derived solutions—keeping in
mind that the retained solution may differ from the long maintained five-factor solution.
Furthermore, it is important to analyze any derived five-factor solution from the present study
data to examine the extent to which it corresponds to the test authors’ expectations. This
solution has become a traditional, interpretative framework for the instrument despite the fact
that the majority of studies of the ABC and ABC-C have not broadly explored nor examined a
large range of potential factor solutions. Therefore, based on previous factor analyses, it is
hypothesized that the five-factor solution, from among the possible EFA solutions, will closely
match the test-authors’ proposed five-factor solution. (Though assessed through an EFA
procedure open to any five factors appearing, this hypothesis is conceptually confirmatory in its
expectation that the five-factor solution emerging from the EFA will closely resemble the
traditional ABC-C five factors. However, the traditional five-factor model is not being pre-
specified and assessed for fit as it would through a CFA conducted via structural equation
modeling.) This hypothesis will be examined in three ways. First, by qualitatively comparing
the factor construct names of the test authors’ five-factor solution and this study’s derived five-
factor solution. Second, qualitatively comparing the highest loading items that are instrumental
in defining each factor on the test author’s solution and this study’s derived solution. Third, by
calculating a percentage of overlapping items between the factors from the derived five-factor
solution and the ABC-C authors’ version. (This hypothesis should in no way be interpreted as
assuming that the five-factor model will likely be retained as the most interpretable and
meaningful EFA solution. It is possible that other interpretable factor solutions may be more
conceptually meaningful and account for more variation.)

84
Table 11. Summary of Study One Research Questions
Research Question
Number
Research Question Hypothesis Analysis Method(s)
1 How many possible
or likely interpretable
factors?
Between four and
seven factors
Guttman-Kaiser criterion, scree test, MAP test, parallel
analysis
EFA with principal
axis factoring
2
How many factors
should be retained?
2a) At least four
factors will be
retained
2b) There will be an
inappropriate speech
factor
2c) There will be a
self-injurious
behavior factor
Examine the interpretability of the pattern and structure
matrices for the range of solutions suggested by the factor
retention methods above (i.e., Guttman-Kaiser, scree,
MAP, parallel analysis)
EFA with oblique
rotation, pattern and
structure matrices
3 Are there substantive
correlations amongst
the factors
Yes, among some of
the factors
Analyze the relations in the inter-factor correlation matrix
of the chosen factor solution
EFA with oblique
rotation
4 How well does the
obtained five-factor
solution correspond
to the test authors’
five-factor model?
It will closely match
the test authors’
solution
Qualitatively compare factor names and highest loading
items between the ABC-C authors’ five-factor solution
and the derived five-factor solution in this study, and
calculate a percentage overlap in items between the
obtained solution and the ABC-C authors’ model for each
factor
Qualitative
comparison,
percentage item
overlap calculation per
factor

85
Study one sample demographics. The sample for study one consisted of 300 ASD
cases. Sample participants included 80.0% males (n = 240) and 20.0% females (n = 60), ranging
in age from 3.17 to 21.05 years (M = 9.17, SD = 4.38; See Table 12). Note that the obtained
sample male-to-female ratio of 4:1 is similar to the best available population-level estimate of the
ratio in ASD of 4.5:1 (see Baio et al., 2018). Ethnic identification included 76.3% white/non-
Hispanic (n = 229), 11.0% black/African-American (n = 33), 5.3% Hispanic (n = 16), 2.0%
Asian American (n = 6), 2.3 % other (n = 7), 3.0% unknown (n = 9). Socioeconomic data were
not consistently available in individual participants’ records; however, agency-level data
indicated that 29%-36% of students qualified for free or reduced lunch (FRL)—depending on the
program evaluation year. FRL is often used as a proxy for socioeconomic status despite the fact
that there are various acknowledged issues with the correlation (e.g., Harwell & LeBeau, 2010;
Nicholson, Slater, Chriqui, & Chaloupka, 2014; Snyder & Musu-Gillette, 2015).
Cognitive deviation quotient scores (DQ) ranged from 12 to 112 (M = 56.49, SD =
18.25), with 74.6% of the sample with DQ scores < 70 (i.e., at least two standard deviations
below the mean), and 93.2% < 85 (i.e., at least one standard deviation below the mean). Of note,
previous researchers have included individuals with higher IQ scores in factor analyses of the
ABC-C with an ASD sample (e.g., Kaat et al., 2014, had 53% of their sample [n = 1893] with
IQ’s > 70). Nonetheless, all individuals included in the sample in this study had substantial
functional impairments in the cognitive, social, or communication domains (or some
combination of the three) severe enough to warrant participation in special education classrooms.
Table 12. Demographic Characteristics of Study One Sample
Sample N (%) Mean (SD) Range
Participant Gender
Male 240 (80.0)
Female 60 (20.0)
Participant Race/Ethnicity

86
Table 12 (cont’d)
White/Non-Hispanic 229 (76.3)
Black/African-American 33 (11.0)
Hispanic, No Race Specified 16 (5.3)
Asian American 6 (2.0)
Other 7 (2.3)
Unknown 9 (3.0)
Participant Age 300 (100) 9.17 (4.38) 3.17-21.05
Participant Deviation Quotient Score 295 (98.3) 56.49 (18.25) 12-112
Unknown 5 (1.7)
Note: All cognitive scores were set to a deviation quotient (DQ) metric (i.e., normative mean of 100, standard
deviation of 15) in order to allow for some limited comparability of participants’ cognitive scores.
Measure for study one. The Aberrant Behavior Checklist-Community, Second Edition
(ABC-C2; Aman & Singh, 2017) represents the third iteration of the original ABC (Aman &
Singh, 1986), and the second edition of the original ABC-C manual. The ABC-C2 manual
maintains that the current, third iteration of the ABC-C has the same number of items, item
wording, and item scales as the second iteration of the ABC-C, although with minor updates on
the subscale names (Aman & Singh, 2017). Despite the new manual and updated subscale
names, the scale is still referred to as the ABC-C.
The ABC-C is designed to be administered by “anyone who has a good knowledge of the
individual’s behavior” (i.e., any stakeholder, be they a relative, teacher, care staff, or other
professional) and who is familiar with the individual under various circumstances (Aman &
Singh, 2017, p. 42). No specific time frame for knowing the individual is provided. Each of the
58 items on the ABC-C is rated on a four-point problem severity scale ranging from zero to
three. Scale response anchors are not at all a problem = 0, the behavior is a problem but slight
in degree = 1, the problem is moderately serious = 2, and the problem is severe in degree = 3.
The most recent iteration of the ABC-C includes five subscales based on the Principle
Components Analysis (PCA) from the original ABC: Irritability (containing 15 items), Social
Withdrawal (containing 16 items), Stereotypic Behavior (containing 7 items),

87
Hyperactivity/Noncompliance (16 items), and Inappropriate Speech (4 items; Aman & Singh,
2017). According to the test authors in the ABC-C2 manual, these subscale names have been
updated from the previous iterations of the ABC and ABC-C, though no explanation is provided
to clarify what prompted the name changes (Aman & Singh, 2017).
ABC-C reliability. Internal consistency reliability is reported in the manual for the first
iteration of the ABC (Aman & Singh, 1986), though not in the supplemental manual for the
ABC-C (Aman & Singh, 1994) or the ABC-C2 manual (Aman & Singh, 2017). The internal
consistency statistics (i.e., Cronbach’s alpha; Cronbach, 1951) as reported for the ABC,
calculated for a sample from institutional settings with intellectual disabilities, were as follows:
Irritability, Agitation, Crying (α = .92); Lethargy, Social Withdrawal (α = .91); Stereotypic
Behavior (α = .90); Hyperactivity/Noncompliance (α = .95); and Inappropriate Speech (α = .86;
Aman & Singh, 1986; Aman et al., 1985a). Additionally, in the Kaat et al. (2014) study of the
ABC-C with a large sample of individuals with ASD, internal consistency reliability statistics
were calculated within the CFA framework for both the calibration and validation samples:
Irritability (α = .90, .92); Lethargy/Social Withdrawal (α = .88, .89); Stereotypic Behavior (α =
.87, .85); Hyperactivity/Noncompliance (α = .94, .93); and Inappropriate Speech (α = .77, .77).
Reliability for the ABC-C is reported in the ABC-C2 manual (Aman & Singh, 2017) in
only two specific ways: (a) interrater reliability and (b) test-retest reliability. Summarizing
across reported Pearson’s r, Spearman’s rho, and Intraclass correlation coefficients from the
various ABC-C studies indicated the following: interrater coefficients for the Irritability subscale
ranged from .53 to .90 (Mdn = .64), for the Social Withdrawal subscale they ranged from .12 to
.88 (Mdn = .69), for the Stereotypic Behavior subscale they ranged from .42 to .76 (Mdn = .71),
for the Hyperactivity/Noncompliance subscale they ranged from .45 to .81 (Mdn = .68), and for

88
the Inappropriate Speech subscale they ranged from .58 to .89 (Mdn = .74; Aman & Singh, 2017,
p. 36-37).
Aman and Singh (2017) provided multiple reasons why the reliability coefficients for
each scale vary widely. This included ratings performed by raters who held different roles or
were in different settings (e.g., teacher vs. parent), and even an example where one of the studies
assessed behavior over an 8-hour time frame—which is too brief a time interval to assess
behavior for the way the scale was intended to be used. Miller, Fee, and Netterville (2004)
looked at interrater reliability for teachers and teaching assistants (n = 22) using the ABC-C.
They found that reliability coefficients ranged from .72 on the Stereotypic Behavior subscale to
.80 on the Hyperactivity/Noncompliance subscale, though they did not provide coefficients for
the other three subscales.
With regard to test-retest reliability, Aman and Singh (2017) highlighted four studies
with the ABC-C with differences in test-retest intervals ranging between two weeks and four
weeks (Miller et al., 2004; Ono, 1996; Schroeder et al., 1997; Siegfrid, 2000, as cited in Aman &
Singh, 2017). Summarizing across reported Pearson’s r, Spearman’s rho, and Intraclass
correlation coefficients from the studies based on the ABC-C indicated the following: Irritability
subscale test-retest coefficients ranged from .59 to .98, Social Withdrawal subscale ranged from
.76 to .96, Stereotypic Behavior subscale ranged from .75 to 1.00, Hyperactivity/Noncompliance
subscale ranged from .75 to .94, and Inappropriate Speech subscale ranged from .52 to .98
(Aman & Singh, 2017).
Given that this study involves ratings by teaching staff members, a study with a similar
group of raters using the ABC-C, such as in Miller et al. (2004), is useful for comparison.
Across n = 47 cases rated by teachers with a two week test-retest interval, Miller et al. (2004)
89
found correlation coefficients of .68 for Inappropriate Speech, .77 for Stereotypic Behavior, .84
for Lethargy/Social Withdrawal, and .85 for Hyperactivity/Noncompliance and Irritability.
Miller et al. (2004) also reported that across n = 22 cases rated by teaching assistants with a two-
week test-retest interval, correlation coefficients were .74 for Inappropriate Speech, .81 for
Hyperactivity/Noncompliance, .84 for Lethargy/Social Withdrawal, .89 for Irritability, and 1.00
for Stereotypic Behavior. Referencing guidelines for conceptualizing reliability provided by
Cicchetti and Sparrow, Aman and Singh (2017) asserted that there was strong evidence that test-
retest reliability was highly acceptable for the ABC-C subscales in most cases (Cicchetti &
Sparrow, 1981, as cited in Aman & Singh, 2017).
ABC-C validity. Evidence concerned with the internal structure, concurrent validity,
discriminant validity, and criterion-related relationships with behavioral observations of the
ABC-C were reported in the ABC-C2 test manual (Aman & Singh, 2017). With regard to
internal structure, a variety of factor analytic studies with individuals with intellectual disabilities
have suggested a five-factor structure for the ABC-C (e.g., Aman et al., 1985a; Aman et al.,
1995). However, the generalizability of this factor structure to other groups, such as individuals
with ASD, is in question (e.g., Mirwis, 2011) and the main subject of this study. (See extended
explication in Chapter 2.)
In general, evidence of concurrent validity was found as expected among the various
instruments as well as across the multiple outside research studies that have been performed on
the ABC and the ABC-C. For instance, Kaat et al. (2014) found evidence of divergent validity in
an ASD sample, consisting of children between ages two and 18 years rated by parents, for the
five ABC-C subscales when compared to the Vineland Adaptive Behavior Scales, Second
Edition (VABS-II; Sparrow et al., 2005) Adaptive Behavior composite. Correlations ranged

90
from negative negligible (-.05 for Inappropriate Speech) to mildly negative (-.33 for
Lethargy/Social withdrawal), with a median negative correlation of -.22. Relative to the Child
Behavior Checklist (CBCL; Achenbach & Rescorla, 2001) form for ages six to 18 years old,
convergent correlations were .43 between the ABC-C Lethargy, Social Withdrawal subscale and
the CBCL Internalizing Problems score; .64 between ABC-C Irritability and CBCL
Externalizing Problems score; and .58 between ABC-C Hyperactivity and CBCL Externalizing
Problems score. Divergent relationships were reflected in correlations all less than .40 (most less
than .30) between the CBCL Internalizing or Externalizing Problems scales with all other ABC-
C subscales (see Kaat et al., 2014).
From a discriminant perspective, the ABC-C test authors highlight the analyses with the
original ABC, which was found to yield significant mean differences between groups of subjects
with intellectual disabilities who do and do not take psychotropic medications (e.g.,
antipsychotics, hypnotics, anticonvulsants, antihistamines, antidepressants; Aman & Singh,
2017; Aman et al., 1985b). According to Aman and Singh (2017) these findings provide further
evidence of construct validity, as the ABC (and ABC-C) appears to be sensitive to differences
between subjects who are taking medication (scoring higher on average, presumably with more
extreme presenting externalizing and internalizing behaviors) and those who are not. From a
treatment sensitivity perspective, the ABC-C has also been shown to be effective in documenting
significant changes and differences, as an outcome measure, in behavioral intervention studies
(Aman & Singh, 2017, p. 33).
Criterion-related relationships were assessed between the original ABC and direct
behavioral observations (Aman et al., 1985b). Graduate students observed a group of 36
individuals in an institution using 10-second time intervals, for one hour total, in 15-minute
91
blocks (before, during, and after dinner). They recorded the subjects’ behavior frequencies using
categories consistent with the behaviors found in the ABC subscales (i.e., crying/irritability, self-
injury, withdrawal/apathy, stereotypy, noncompliance, gross body movements, off-task behavior,
repetitive speech, and repetitive vocalizations) with raters unaware of any of the individuals’
previous scores on the ABC—as rated independently by institutional nurses (Aman et al.,
1985b). Average agreement among raters was 91.3% (Aman & Singh, 2017; Aman et al.,
1985b). Observed subjects were then assigned into either a “high” score group or a “low” score
group depending upon whether their ABC subscale scores fell at least one standard deviation
above or below the mean. The mean levels of the high and low groups for each of the different
observation categories were then compared. Results showed statistically significant differences
between the groups for the withdrawal/apathy, stereotypy, noncompliance, gross body
movements, off-task behavior, and repetitive speech categories (Aman & Singh, 2017; Aman et
al., 1985b). Nonsignificant results were found between the high and low groups on the
crying/irritability, self-injury, and repetitive vocalization categories (Aman & Singh, 2017;
Aman et al., 1985b). Aman and Singh (2017) attributed the non-significant findings between the
low and high groups on the crying/irritable and self-injury categories to the low frequency and
high variability of the behaviors represented in these categories. The authors also attributed the
nonsignificant findings between the low and high groups on the repetitive vocalizations category
to raters only rating intelligible speech rather than vocalizations that included sounds other than
words (Aman & Singh, 2017). Overall, Aman and Singh (2017) concluded that this study
provided further support for the ABC’s construct validity as the more extreme cases established
by independent, direct behavioral observations also tended to differ according to the nurses’
ABC ratings.

92
Data analysis for study one. Analyses for study one were performed using several
statistical programs. These programs included SAS Version 9.4 (SAS Institute Inc., 2013) and
SPSS Version 25 (IBM Corp, 2017) along with an R programming language plugin for SPSS
(Basto & Pereira, 2012; R Core Team, 2013).
SPSS Version 25 was used as the primary data management system for inputting item
data from the ABC-C. Descriptive statistics were calculated using SPSS Version 25. The SPSS
R plugin was used to generate the inter-item polychoric correlation matrix (for polychoric
correlation, see Pearson [1900]) for the ABC-C, conducting a parallel analysis, and for deriving
Cronbach’s alpha, and ordinal alpha (Zumbo, Gadermann, & Zeisser, 2007) coefficients. SAS
Version 9.4 was used to run the EFA using the ABC-C inter-item polychoric correlation matrix,
generated from the SPSS R plugin, as input.
Pre-analysis data cleaning and missing data. For study one, data cleaning procedures
as articulated by Osborne and Banjanovic (2016) were followed. Missing data were expected to
be rare—given the procedures in place for catching and fixing missing ratings. However, in
instances where missing ratings did occur, expectation-maximization (Allison, 2002) was used.
The frequency of missing item data was not high enough to warrant bias analyses concerning
missing data (e.g., evaluating data for missing completely at random, missing at random, etc.).
Data matrix sufficiency for factoring. For study one, the input matrix contained
correlations rather than covariances. Given that the ABC-C item data are ordinal in nature, a
polychoric correlation matrix was used instead of a Pearson correlation matrix (Holgado-Tello,
Chacón-Moscoso, Barbero-García, & Vila-Abad, 2010). Pearson correlations would likely
undervalue the strength of the relationships between ordinal rating variables and bias factor
loadings. Based upon previous EFAs of the ABC-C with an ASD sample (i.e., Brinkley et al.,

93
2007; Kaat et al., 2014; Mirwis, 2011) which had variable/indicator to factor ratio solutions
between 58:4 and 58:7 and using the moderate to high prior communality estimates reported by
Mirwis (2011; M = .744, ranging from .534 to .918) as a guide, the sample size n = 300 cases for
the present study was likely sufficient to confidently assess the factor structure of the ABC-C
(see MacCallum et al., 1999, Table 1, p. 93).
The Bartlett’s Test of Sphericity (Bartlett, 1950) was used to assess whether the observed
correlation matrix is significantly different from what would be expected by chance from an
identity matrix (Pedhazur & Schmelkin, 1991). Additionally, because an EFA was used in this
study—with its emphasis on common rather than total variance (O’Rourke & Hatcher, 2013)—it
was helpful to determine whether the amount of common variance present reflected a sufficient
likelihood of common factors being present in the inter-variable correlation matrix (Kaiser,
1970; Kaiser & Rice, 1974). For this purpose, the Kaiser-Meyer-Olkin (KMO; Kaiser, 1970;
Kaiser & Rice, 1974) test was performed on the correlation matrix. Following criteria outlined
by Kaiser and Rice (1974), a KMO value above .8 would indicate a very suitable data matrix and
values below .5 would indicate a matrix not acceptable for an EFA. More specifically, Kaiser
and Rice (1974) characterized KMO values in the .90s as “marvelous,” values in the .80s as
“meritorious,” values in the .70s as “middling,” values in the .60s as “mediocre,” values in the
.50s as “miserable,” and values < .50 as “unacceptable” (p. 112).
Extraction methods. It was anticipated, based on previous EFAs with the ABC-C with
the ASD population (e.g., Mirwis, 2011), that the data would violate univariate and multivariate
normality. Under such conditions, principle axis factoring (PAF) is the more robust extraction
method compared to maximum likelihood (ML), which strongly assumes normality/multivariate
94
normality (Floyd & Widaman, 1995; Osborne & Costello, 2005). Therefore, for study one the
PAF method was used as the primary extraction method.
Number of factors to retain. For study one, a combination of the Guttman-Kaiser
criterion (i.e., minimum eigenvalue greater than one criterion), the scree test, parallel analysis,
and the MAP test, were used to help determine the most appropriate number of factors to retain–
with interpretability of the factors guiding final retention decisions. For the scree test, factor
solutions were analyzed based upon the perceived elbow(s) in the scree plot. Per the
recommendations for parallel analysis made by Glorfield (1995), factors were considered for
retention if their obtained eigenvalues exceeded the 95th percentile of the random data matrix
eigenvalues. With regard to the MAP test, per recommendations by Osborne and Banjanovic
(2016), common variance was partialed out for each successive factor until only unique variance
was left (i.e., common variance is reduced to a minimum).
Rotation. For study one an oblique rotation was used as it was expected that factors
would be correlated based upon previous EFAs (e.g., Kaat, et al., 2014; Mirwis 2011) with the
ABC-C. Experts also contend that oblique rotations are equally effective for both correlated and
uncorrelated factors (Fabrigar & Wegener, 2012; Osborne, 2015). As a result, a direct oblimin
rotation was used as the primary method.
Interpreting the solution. For study one, factor loadings < .30 were considered
significant (Beavers et al., 2013). Items found to load between .30 and .45 were considered
significant though questionably substantive. Using the criteria outlined by Comrey and Lee (as
cited in Pett et al., 2003), factor loadings > .45 were considered fair, > .55 were considered good,
> .63 were considered very good, and > .71 were considered excellent. Crossloadings (i.e., items
that load at > .30 on more than one factor) were examined to determine which factor loading best

95
reflected the underlying concept (Osborne & Costello, 2005). With these rules in place, factor
naming then occurred. Pett et al. (2003) stated that the highest loaded item, especially if it is >
.90, should offer a strong indication of the essence of that factor. If the highest loadings are <
.60, then interpretation might be less robust (Pett et al., 2003). Thus, factor naming for this study
took into account the recommendations provided by Pett et al. (2003), relevant symptomology
and associated features in the ASD population, and prior theoretical constructs articulated for the
ABC-C. Finally, in order to provide greater confidence in factor solutions for this study, factor
solutions and their subsequent factor names were independently interpreted by four qualified
researchers and consensus was established.
Internal consistency. For study one, internal consistency reliability estimates were
measured for the original ABC-C scales. To measure internal consistency reliability in this
study, both ordinal alpha and Cronbach’s original coefficient alpha were used. Ordinal alpha
was chosen to be the primary estimate of internal consistency reliability, because it replaces the
Pearson correlations with polychoric correlations in the original alpha formula (Gadermann,
Guhn, & Zumbo, 2012). Thus, it is theoretically similar to Cronbach’s alpha, but is better suited
to estimating internal consistency in the context of ordinal item scales (Gadermann et al., 2012).
Cronbach’s coefficient alpha estimates were also generated in order to maintain a common
standard for comparison with previous studies, as many did not use ordinal alpha. The criteria
provided by Murphy and Davidshofer (as cited in Sattler, 2008) were used to evaluate the
strength of reliability estimates. Estimates were considered as having very low or very poor
reliability (.00 to .59), low to poor reliability (.60 to .69), moderate or fair reliability (.70 to .79),
moderately high or good reliability (.80 to .89), or high or excellent reliability (.90 to .99).
However, adequate reliability is ultimately relative to the intended purpose for which a particular

96
scale or score is ultimately used. Nunnally (1978) suggested a minimum reliability of .70 for
research purposes.
Comparing five-factor solutions. An interpretable five-factor solution in the present
study was compared to the five subscales and associated constructs currently endorsed in the
ABC-C2 manual by the test authors (Aman & Singh, 2017). Factor constructs were initially
qualitatively compared by assessing the similarities and dissimilarities between the factor names
for the derived constructs. Next, the highest loading items (that are key to defining and naming
the factors) were compared to determine whether they were similar between the different
solutions. Finally, a percentage of overlapping items between the factors from the obtained five-
factor solution and those from the five-subscale structure currently endorsed by the authors of the
ABC-C were assessed.
Study Two: CFA
Research question, rationale, and hypotheses.
Research question 5. How does the factor solution generated in a sample of individuals
with ASD rated by special education staff members for the ABC-C compare in terms of absolute
and relative fit to previous ABC-C factor models found in ASD samples or proposed for use with
individuals with ASD?
Research rationale and hypotheses 5a and 5b. Kaat et al. (2014) found relative parity
amongst the factor models they tested (i.e., the Aman et al., 1985a, five-factor model; the
Brinkley et al., 2007, four-and-five factor models; the Brown et al., 2002, four-factor model; the
Sansone et al., 2012, six-factor model), all of which resulted in a generally marginal fit (i.e.,
RMSEA ranged from .081 to .12, SRMR ranged from .09 to .12). The authors concluded that
because no specific model could be clearly distinguished as the best fit amongst the models they

97
tested with their validation sample, the original Aman et al. (1985a) structure should be
maintained for individuals with ASD. It has been argued in the present study that the factor
solution retained through EFA in study one will be the most robust when compared to the
existing factor models for the ABC-C, as a result of the thoroughness (i.e., using the most
effective factor selection criterion methods, analyzing a range of potential factor solutions) of the
analyses performed. Consequently, two hypotheses will be tested.
First, it is hypothesized that the ABC-C factor model determined in the study one EFA,
when appropriately constrained for CFA (e.g., with parameters for theoretically non-loading
items fixed to zero), will adequately fit the ABC-C variance-covariance matrix of the second
ASD sample. This will be determined using a combination of absolute, complexity-adjusted, and
relative fit indices (i.e., weighted least squares mean and variance adjusted estimator [WLSMV;
Muthén & Muthén, 1998-2017], adjusted chi square [2], Root Mean Square Error of Estimation
[RMSEA], Comparative Fit Index [CFI], Tucker-Lewis Index [TLI], and Standard Root Mean
Square Residual [SRMR]). Second, the ABC-C factor model determined in the study one EFA,
when appropriately constrained for CFA (e.g., with parameters for theoretically non-loading
items fixed to zero), will demonstrate a better fit to the second ASD sample ABC-C variance-
covariance matrix than previous ABC-C factor models found in ASD samples or proposed for
use with individuals with ASD. Because of the non-nested nature of the CFA models to be
compared, Akaike’s Information Criterion (AIC) and the Bayes Information Criterion (BIC) fit
indices (available through the Mplus robust maximum likelihood [MLR] estimator) will be used
for this purpose. Though the Mplus WLSMV estimator does offer an adjusted likelihood ratio
test (i.e., DIFFTEST) to compare nested models, this test cannot be used to assess differences
between non-nested models. In addition, the WLSMV estimator does not allow for the

98
calculation of AIC and BIC indices. Thus, AIC and BIC will be estimated using the MLR
estimator.
Study two sample demographics. The sample for study two consists of 243 ASD
cases. Sample participants include 80.2% males (n = 195) and 19.8% females (n = 48), ranging
in age from 2.95 to 21.15 years (M = 10.79, SD = 4.53; See Table 14). Note that the obtained
sample male-to-female ratio is similar to the best available population-level estimate of the ratio
in ASD of 4.5:1 (see Baio et al., 2018). Ethnic identification includes 77.0% white/non-Hispanic
(n = 187), 12.8% black/African-American (n = 31), 4.5% Hispanic (n = 11), 1.2% Asian
American (n = 3), 1.6 % other (n = 4), 2.9% unknown (n = 7). Socioeconomic data is the same
as in study one.
Table 13. Summary of Study Two Research Questions
Research
Question
Number
Research Question Hypothesis Analysis Method(s)
5 How do the existing
factor solutions for the
ABC-C compare in
terms of absolute and
relative fit?
5a: The model
generated in Study one
will adequately fit the
matrix of the second
ASD sample
2, SRMR, RMSEA, CFI,
TLI for evaluating
adequacy of fit
Confirmatory
Factor Analysis
5b: The model
generated in Study one
will demonstrate a
better relative fit to the
matrix of the second
ASD sample compared
to previous models of
the ABC-C with an
ASD sample
Primarily AIC and BIC
for direct comparison of
non-nested models
Confirmatory
Factor Analysis
Table 14. Demographic Characteristics of Study Two Sample
Sample N (%) Mean (SD) Range
Participant Gender
Male 195 (80.2)

99
Cognitive deviation quotient scores (DQ) ranged from 12 to 123 (M = 56.69, SD =
18.71), with 78.1% of the sample with DQ scores < 70 (i.e., at least two standard deviations
below the mean), and 93.8% < 85 (i.e., at least one standard deviation below the mean).
Nonetheless, like study one, all individuals included in the sample in this study had substantial
functional impairments in the cognitive, social, or communication domains (or some
combination of the three) severe enough to warrant participation in special education classrooms.
The sample for study two contained 179 cases (74%) also found in study one, with 64
cases (26%) not overlapping. The data from the 179 overlapping cases between study one and
study two were collected at different time points and ratings were completed by different special
education staff members. The average time between ratings for the same case across the two
studies was 879 days (2.41 years).
Data analysis for study two. Analyses for study two were performed using two
statistical programs in order to carry out the various required calculations. These programs
included SPSS Version 25 (IBM Corp, 2017) as well as Mplus Version 8.2 (Muthén & Muthén,
1998-2017).
Table 14 (cont’d)
Female 48 (19.8)
Participant Race/Ethnicity
White/Non-Hispanic 187 (77.0)
Black/African-American 31 (12.8)
Hispanic, No Race Specified 11 (4.5)
Asian American 3 (1.2)
Other 4 (1.6)
Unknown 7 (2.6)
Participant Age 243 (100) 10.79 (4.53) 2.95-21.15
Participant Deviation Quotient Score 242 (99.6) 56.69 (18.71) 12-123
Unknown 1 (.4)
Note: All cognitive scores were set to a deviation quotient (DQ) metric (i.e., normative mean of 100, standard
deviation of 15) in order to allow for some limited comparability of participants’ cognitive scores

100
SPSS Version 25 was used as the primary data management system for inputting item
data from the ABC-C. Descriptive statistics were calculated using SPSS Version 25. Mplus
Version 8.2 was used to assess the factorial validity of first-order confirmatory factor analytic
models for the ABC-C. (The Mplus WLSMV estimator was used as the primary estimation
strategy given the ordinal and non-normal ABC-C item data.) The primary model of interest was
based on the study one EFA results, but this model was also compared to several others from the
literature based on findings in other ASD samples or suggested for use with ASD. Information
criteria indices (AIC and BIC), used for cross-model comparisons, were derived using the robust
maximum likelihood (MLR) estimator in Mplus.
Pre-analysis: Data cleaning and missing data. For study two, data cleaning procedures
were the same as for study one. Like study one, missing data were expected to be rare. As such,
expectation-maximization (Allison, 2002) was used to estimate and replace any missing values.
As in study one, the frequency of missing item data was not high enough to warrant bias analyses
concerning missing data (e.g., missing completely at random, missing at random, etc.).
Data matrix sufficiency for factoring. Harrington (2009) asserts that although there are
disagreements as to the required sample size for a CFA, “the larger the sample size, the better for
CFA” (p. 45). According to MacCallum et al. (1999), the same ratio of variables to factors with
moderate to high communality estimates acceptable for EFA (see study one) should be
acceptable for CFA as well, meaning a sample of size between 100 and 200 would likely be
sufficient to achieve convergent solutions for anticipated ABC-C structures. Yet, in a Monte
Carlo study focused on sample size by Muthén and Muthén (2002), a sample size of 150 was
sufficient when data were normally distributed, but a sample of 265 was necessary for data that
were non-normal. The sample size in the present study (n = 243) is of moderate size and item

101
distributions are anticipated to be non-normal in an ASD sample. These issues were taken into
account when deriving conclusions.
In order to choose the most appropriate estimation method for the CFA, the dataset
needed to be examined to determine the type of distribution the data follow (i.e., multivariate
normal or multivariate non-normal). According to Curran, West, and Finch (1996), if univariate
skewness or kurtosis is substantial (i.e., skewness > 2, kurtosis > 7) then it is likely that the
multivariate distribution will be non-normal as well. Performing probability-probability (P-P)
plot analyses in SPSS revealed consistent long-tails among the item data indicating a potential
non-normal distribution. Further, skewness and kurtosis statistics revealed three items with a
skewness > 2 and no items with a kurtosis > 7. Though only three items appeared sufficiently
non-normal to be of concern according to the criteria by Curran et al. (1996), the ordinal nature
of the item data and non-normal visual appearance of most of the item distributions suggested
the need for a robust estimation procedure.
As noted previously, the four-point scale for ABC-C items is ordinal in nature. In
addition, experience with prior data sets and analyses of other measures from ASD samples that
require more intensive supports (e.g., Mirwis, 2011) suggested that the item data would be non-
normal. Given the ordinal nature of the data, a robust diagonally-weighted procedure was most
appropriate. Within Mplus, the weighted least squares mean and variance adjusted estimator
(WLSMV) addressed this issue well (DiStefano & Morgan, 2014). However, more extreme non-
normality in the data or model misspecification can impact standard errors and statistical power
(see DiStefano & Morgan, 2014). Despite these issues, DiStefano and Morgan (2014) noted that
a) average RMSEA and CFI values did not appear to be sensitive to differences (e.g., in
normality) in their simulation study conditions involving diagonally-weighted procedures with

102
ordinal data and, b) the Mplus WLSMV procedure appeared preferable to LISREL’s diagonally-
weighted estimation option in the presence of moderate non-normality, few scaling categories,
and smaller sample sizes. It should be noted, however, that their study conditions all assumed a
correctly specified model.
Model specification. In CFA, model specification involves detailing the specific models
that are to be tested (Harrington, 2009). This entails specifying the observed and latent variables,
the unique variances (i.e., the error variance in each item not accounted for by the latent
factor[s]), the correlations between factors, and the directional paths from factors (latent
variables) to items (observed variables). A graphical structure is used to denote the paths and
parameters for these relationships. Observed variables (i.e., the specific items) are represented
by rectangles and latent variables (i.e., the factors) are represented by ovals. Directional paths
between latent and observed variables are represented by single-headed arrows, and correlations
between latent variables are represented by double-headed arrows (Harrington, 2009). Arrows
from latent to observed variables denote latent variable constructs affecting observed variables.
Factor loadings for each variable are also provided which are the equivalent of regression
coefficients predicting the observed variables from the unobserved factors (Harrington, 2009).
Each observed variable has a direct path arrow pointing to it from an associated error term. This
error term, in the case of observed variables, reflects measurement error (i.e., a combination of
random error and unique variance not accounted for by factors). These error terms (also referred
to as residuals in Mplus) usually have their paths fixed to 1.0 (in order to provide a scale for the
error term based on the observed variable) and have their variances freely estimated (Byrne,
2012).
103
For the CFA in study two, multiple models were assessed. The model derived and settled
upon in the EFA in study one was of primary interest. It was assessed along with the models
derived from previous factor analyses of the ABC-C. These included the four-and five-factor
models from Brinkley et al. (2007) from an ASD sample with parent raters, and the seven-factor
model from Mirwis (2011), from an ASD sample with special education staff raters. The five-
factor model derived by Kaat et al. (2013) from an ASD sample with parent raters was not
included. Instead the original five-factor model from Aman et al. (1985a) was used, which was
derived from an ID population rated by institutional staff members. Per advice from Aaron Kaat
(A. Kaat, personal communication, January 30, 2018), the Aman et al. (1985a) model was very
similar to the Kaat et al. (2013) model, and the differences between them are not likely to be
meaningful and may be mostly resulting from sampling error. Additionally, the six-factor model
derived in Sansone et al. (2012) from a Fragile X population rated by caregivers was also
assessed given the strong model fit reported in their study and the known co-morbidity between
ASD and Fragile X (e.g., Abbeduto, McDuffie, & Thurman, 2014). However, because Sansone
et al. (2012) used parceling in their model it could not be directly compared to the other models
that used all 58 items as observed variables. See Appendix A, B, C, D, E, and F for Model 1 and
Model 2 (Brinkley et al., 2007), Model 3 (Mirwis, 2011), Model 4 (Aman et al., 1985a), Model 5
(Sansone et al., 2012), and Model 6 (the study one, nine-factor model).
Model identification. Model identification refers to setting two important conditions in
a CFA model: a) ensuring that the degrees of freedom (df) in the model are > 0, and b) providing
a scale for each latent variable in the model (i.e., establishing a unit of measurement for the latent
variables; Harrington, 2009). In order for both the model parameters to be estimated in the CFA,
and for the fit of the model to be determined, there must be more unique information elements in

104
the variance-covariance matrix (i.e., total number of covariances and variances in the matrix)
than there are unknown parameters to be estimated in the factor model. If there are more
unknown parameters to be estimated than there are elements in the variance-covariance matrix,
then a situation arises where the model cannot be properly estimated due to insufficient degrees
of freedom (df). The df represent the difference between the total information elements available
in the inter-item variance-covariance matrix and the unknown parameters to be freely estimated.
Models can be underidentified (i.e., when there are more freely estimated parameters than there
are unique information elements in the variance-covariance matrix, resulting in df < 0), just-
identified (i.e., the number of unknown parameters to be estimated in the model equals the
number of elements in the variance-covariance matrix, resulting in 0 df), or overidentified (i.e.,
where there are fewer unknown parameters to be estimated in the model than there are elements
in the variance-covariance matrix, resulting in df > 0; Harrington, 2009). All models evaluated
in study two were overidentified.
Scaling latent variables is necessary in CFA because factors have no inherent scale of
their own; meaningful units of measurement for latent variables do not exist prior to
identification (Harrington, 2009). According to Byrne (2012) there are three possible ways to
provide a scale for latent variables: a) units of measurement can be set for a factor relative to one
of its observed item variables, typically accomplished by fixing the factor loading path to 1.0 for
that observed variable (i.e., the reference variable method); b) factor variances can all be set to
1.0, thereby allowing all factor loadings to be freely estimated using factor variance units (i.e.,
the fixed factor method); or c) constraining factor loadings and indicator intercepts (i.e., effects
coding). According to Byrne (2012), there are debates in the literature regarding the most
effective method as each has its strengths and weaknesses. For the CFA in study two, the fixed

105
factor method was used to allow for all factor loadings to be freely estimated and to enhance the
interpretability of inter-factor covariances—which can be interpreted as correlation coefficients
when factor variances are standardized.
Model estimation. The core purpose of CFA is to determine whether a particular
hypothesized model is congruent with or “fits” the variance-covariance data (Harrington, 2009).
To accomplish this all parameters in the CFA model (e.g., factor loadings and error variances for
each item) need to be estimated to determine the quality of the data fit. The estimation process is
iterative in that calculations are performed repeatedly with increasing precision until the
convergence criterion is reached and the model is estimated as precisely as possible (Harrington,
2009). There are several different methods that can be used to estimate parameters in a CFA—
with each method more or less appropriate based upon the nature of the data.
For study two a weighted least squares mean and variance adjusted (WLSMV; Muthén,
1993; Muthén, du Toit, & Spisic, 1997; Muthén & Muthén, 2017) approach with the polychoric
correlation matrix and sample estimated asymptomtic covariance matrix as input was used given
the fact that the item data are both ordinal and non-normal. This is similar to the diagonally-
weighted least squares (DWLS) method found in LISREL (Jöreskog and Sörbom as cited in Kaat
et al., 2007) that Kaat et al. (2014) used in their CFA analysis of the ABC-C. WLSMV was
adapted from the weighted least squares (WLS) estimation method (DiStefano & Morgan, 2014).
In WLSMV a diagonal weight matrix is used along with “robust-standard errors and a mean-and
variance adjusted 2, test statistic” (Muthén & Muthén, in Brown, 2006, p. 388).
Model fit. Once the estimation method is run on the hypothesized model(s), it is
necessary to assess how well the models fit the data. There is no consensus on exactly which fit
indices to use (Brown, 2006; Iacobucci, 2010; Jackson, Gillaspy, & Purc-Stephensonm 2009)

106
and what exact values signify a satisfactory fit (e.g., Brown, 2006; Hu & Bentler, 1999). As
such, Brown (2006) recommends that researchers use at least one fit index from each of three
different fit index categories: absolute fit indices, fit adjusting for model parsimony, and
comparative (or incremental) fit indices. Jackson et al. (2009) stated that although there is not a
universally accepted number of indices to use they recommend that at least a chi-square value
with degrees of freedom and probability value, an incremental fit index (a.k.a., a comparative fit
index), and a residuals-based measure (e.g., RMSEA) should be included.
Absolute fit indices examine whether the predicted variance-covariance matrix is
equivalent to the sample variance-covariance matrix (Harrington, 2009). In this study the
WLSMV-adjusted Chi-Square (2) absolute fit index and the Standardized Root Mean Square
Residual (SRMR) were used. Chi-square examines whether the model of interest satisfactorily
replicates the variances and covariances found in the sample data (Brown, 2006). A statistically
significant 2 value (α < .05) indicates that the model does not entirely fit the data (Brown,
2006). As Brown (2006) pointed out, this statistic is common in CFA research but infrequently
used on its own given the fact that its result is vulnerable to issues regarding sample size (both
large and small), non-normal data, and the fact that the core hypothesis of the index is highly
restricted. The SRMR examines the average differences between the correlations found in the
data matrix and the correlations that are predicted by the hypothesized model (Brown, 2006;
Harrington, 2009). Thus, the SRMR outcome is a measure of how discrepant the model is from
a perfect fit of 0. Values of the SRMR statistic can range from 0 to 1. Hu and Bentler (1999)
recommend a cutoff value of “close to .08” for the SRMR (p. 27).
Parsimony correction indices are similar to absolute fit indices except that with
parsimony correction indices, the number of df are taken into consideration in a particular way

107
(i.e., incorporating an increasing fit penalty as the number of freely estimated parameters
increases; Brown, 2006). This means that, all other things being equal, more complex models
are less likely to result in a good fit using these indices (Harrington, 2009). In this study the
Root Mean Square Error of Estimation (RMSEA; Steiger, 2016; Steiger & Lind, 1980), the
Akaike’s Information Criterion (AIC; Akaike, 1987), and the Bayes Information Criterion (BIC;
Rafferty, 1993) parsimony correction indices were used. The RMSEA is deemed an “error of
approximation” because it estimates the degree of model mis-fit relative to the population
(Brown, 2006, p. 83). It was selected for this study because it is not greatly affected by sample
size. As Brown (2006) explained, a perfect fit for RMSEA is 0, and the statistic is assessed
based upon how close to 0 the model fit occurs. RMSEA values articulated by Browne and
Cudeck (1993) will be used. This includes values < .05 considered a “close fit,” values > .05 and
< .08 considered “reasonable” fit, and values > .10 would signify a model that should not be used
(p. 144). Of note, Hu and Bentler (1999) maintain an RMSEA cut-off number of approximately
.06. Additionally, MacCallum, Browne, and Sugawara (1996) urge the use of confidence
intervals when using fit indices. Mplus provides a 90% confidence interval for RMSEA values
(Byrne, 2012).
The AIC and BIC parsimony correction indices were also chosen for this study because
they enable a comparison to be made between two non-nested models on the same set of data
(Byrne, 2012). The various models that were tested in this study were non-nested. All but one
of the models (Sansone et al., 2012) were based on the same numbers of observed variables but
some models differed in terms of numbers of factors and combinations of variable loadings on
the factors between each model. Like the RMSEA, the AIC and the BIC allocate penalties with
regard to model fit based on model complexity. The BIC allocates a larger penalty than the AIC

108
and therefore is more likely to favor more parsimonious models over more complex models. As
Harrington (2009) explains, because the AIC and BIC are used specifically to compare different
models, there are no quantifiable parameters to determine what constitutes a satisfactory model
fit. As such, the lower the value of the AIC and BIC, the better the fit of the hypothesized
model—with the advantage given to the model with the lower value (Byrne, 2012). (As noted
previously, AIC and BIC values needed to be estimated through another Mplus estimation
procedure [e.g., a robust maximum likelihood variant], as WLSMV does not produce AIC and
BIC estimates.)
Comparative (or incremental) fit indices assess the fit of a hypothesized model relative to
a restricted, nested model (i.e., a parent model that encompasses another model; Brown, 2006).
The restricted model in a comparative fit index has the covariance between observed variables
removed so that the variables remain independent (Brown, 2006). Thus, with comparative fit
indices, a hypothesized model is compared to a simpler version of the model where there are no
correlations between variables (Brown, 2006; Iacobucci, 2010). In the present study the
Comparative Fit Index (CFI; Bentler, 1990) and the Tucker-Lewis Index (TLI; Tucker & Lewis,
1973) were chosen. Like the RMSEA, the CFI maintains a range of potential values from 0 to 1
(Brown, 2006). According to Brown (2006) CFI values > or close to .95 are considered
reasonably well fitting. Brown (2006) indicated that there is a range between .90 and .95 that
should be considered “marginal,” but that one must ultimately judge the fit based upon the
outcomes of the other indices as well and not just in isolation (p. 87). Hu and Bentler (1999)
recommend a cutoff number close to .95. The TLI is different from the CFI in two distinct ways.
Unlike the CFI, it is considered a nonnormed index, meaning that its values can range from 0 to
109
above 1 (Byrne, 2012) and it includes a penalty for more complex models. Similarly to CFI,
values closer to 1 are considered an acceptable model fit (Brown, 2006).
Model modification. Hypothesized models do not always result in acceptable fit. This
can occur for multiple reasons, but ultimately in a CFA, one has the opportunity to examine the
modification indices for a model to determine what modifications could improve its fit
(Harrington, 2009). However, this involves going back into exploratory mode and risking model
modifications that may have been suggested due to sampling error. Thus, any such post hoc
model modifications would need to be confirmed through a CFA in another sample (Sörbom,
1989). Given the purely confirmatory nature of study two, model modification did not occur.
The various hypothesized models were tested only as originally hypothesized to assess the
adequacy of each one—and determine which model offered the best fit to the data.

110
CHAPTER 4: RESULTS
Study one involved analyzing the factor structure of the of the Aberrant Behavior
Checklist–Community (ABC-C, Aman & Singh, 2017) with a sample of individuals with ASD
using a polychoric correlation matrix for an exploratory factor analysis (EFA) with principal axis
factoring (PAF) and a direct oblimin rotation. Internal consistency reliability estimates were
obtained using ordinal alpha, as the primary estimate, and Cronbach’s alpha, in order to provide
a standard of comparison with other studies. Study two focused on examining the absolute fit, fit
adjusting for model parsimony, and comparative fit of the factor structure of the ABC-C
generated in study one against other existing models of the ABC-C using a confirmatory factor
analysis (CFA).
Analysis
Results are reported relative to each research question. Given the nature of the EFA
analysis of study one, research questions 1 through 3 were answered using overlapping outcome
data. Thus, outcome data will be reported in the initial questions and then referenced as needed
in subsequent questions.
Study One
Data cleaning and missing data. The dataset for study one was scanned for missing
values before performing the EFA. Results showed less than 1% of the 300 cases had missing
values. An expectation-maximization (i.e., a mean item replacement; Allison, 2002) was used so
that the cases with missing data could be included in the analyses. A more intensive multiple
imputation process was deemed unnecessary.
Data matrix sufficiency for factoring. The mean and standard deviation of each item
used in the data set for the EFA can be found in Table 15. The inter-item polychoric correlation

111
matrix can be found in Appendix G. This matrix includes estimates of how each item relates to
all others in the dataset. Prior communalities are located on the diagonal of the polychoric
correlation matrix. Of note, because the polychoric matrix was found to be non-positive definite
(i.e., with eigenvalues < 0), the maximum correlation method was used to estimate prior
communalities (i.e., communalities estimated before the oblique rotation).
Table 15. Descriptive Statistics of the EFA Dataset
Percent of Sample Responses for Each Item Scale
Point (N = 300)
Item #
Stem
Mean
Standard
Deviation
0
Not at all
a
problem
1
The
behavior
is a
problem
but slight
in degree
2
The
problem is
moderately
serious
3
The
problem is
severe in
degree
1 Excessively active at home,
school, work, or elsewhere
0.95 1.025 45.7 23.0 22.0 9.3
2 Injures self on purpose 0.69 1.019 62.3 16.0 12.0 9.7
3 Listless, sluggish, inactive 0.49 0.832 68.3 18.3 9.0 4.3
4 Aggressive to other children
or adults (verbally or
physically)
0.97 1.074 46.7 22.0 19.0 12.3
5 Seeks isolation from others 0.73 0.946 54.0 27.3 10.7 8.0
6 Meaningless, recurring body
movements
1.09 1.092 40.0 26.3 18.3 15.3
7 Boisterous (inappropriately
noisy and rough)
1.12 1.121 40.0 25.3 17.3 17.3
8 Screams inappropriately 1.04 1.110 44.7 22.0 18.3 15.0
9 Talks excessively 0.63 0.974 64.3 16.0 11.7 8.0
10 Temper tantrums / outbursts 1.36 1.135 30.3 25.3 22.0 22.3
11 Stereotyped behavior;
abnormal, repetitive
movements
1.33 1.128 29.7 30.3 17.3 22.7
12 Preoccupied; stares into
space
1.10 1.070 38.7 27.0 20.3 14.0
13 Impulsive (acts without
thinking)
1.29 1.113 31.7 27.0 21.7 19.7
14 Irritable and whiny 0.98 0.954 38.3 33.3 20.3 8.0
15 Restless, unable to sit still 1.17 1.075 36.3 25.0 24.3 14.3
16 Withdrawn; prefers solitary
activities
0.91 1.024 46.0 27.7 15.3 11.0
17 Odd, bizarre in behavior 1.08 1.117 42.7 23.0 18.3 16.0

112
Table 15 (cont’d)
18 Disobedient; difficult to
control
1.02 1.013 39.7 29.7 20.0 10.7
19 Yells at inappropriate times 1.03 1.069 42.7 25.0 19.3 13.0
20 Fixed facial expression;
lacks emotional
responsiveness
0.57 0.829 62.0 22.7 12.0 3.3
21 Disturbs others 1.18 1.002 30.0 34.7 22.7 12.7
22 Repetitive speech 0.86 1.035 50.7 23.3 15.3 10.7
23 Does nothing but sit and
watch others
0.34 0.688 75.7 16.7 5.3 2.3
24 Uncooperative 0.96 0.930 38.7 32.7 22.3 6.3
25 Depressed mood 0.28 0.629 80.0 13.7 4.7 1.7
26 Resists any form of physical
contact
0.37 0.659 71.7 21.7 5.0 1.7
27 Moves or rolls head back
and forth repetitively
0.34 0.725 79.0 10.7 8.0 2.3
28 Does not pay attention to
instructions
1.20 0.953 25.7 40.7 22.0 11.7
29 Demands must be met
immediately
0.91 1.024 47.0 24.7 18.3 10.0
30 Isolates himself/herself from
other children or adults
0.69 0.951 59.0 20.0 14.3 6.7
31 Disrupts group activities 1.13 0.986 32.7 31.3 26.0 10.0
32 Sits or stands in one
position for a long time
0.32 0.697 78.7 13.3 5.3 2.7
33 Talks to self loudly 0.63 0.954 64.3 14.7 14.7 6.3
34 Cries over minor
annoyances and hurts
0.82 0.980 50.3 26.0 15.3 8.3
35 Repetitive hand, body, or
head movements
1.09 1.115 41.0 26.3 15.7 17.0
36 Mood changes quickly 1.10 1.072 37.7 29.3 18.0 15.0
37 Unresponsive to structured
activities (does not react)
0.57 0.837 61.7 23.7 10.7 4.0
38 Does not stay in seat (e.g.,
during lesson or training
periods, meals, etc.)
0.86 0.982 47.3 28.0 16.0 8.7
39 Will not sit still for any
length of time
0.71 0.931 55.3 24.3 14.0 6.3
40 Is difficult to reach, contact,
or get through to
0.91 1.028 46.0 28.0 14.7 11.3
41 Cries and screams
inappropriately
1.09 1.115 42.0 23.3 18.7 16.0
42 Prefers to be alone 0.79 0.968 51.7 26.0 14.3 8.0
43 Does not try to
communicate by words or
gestures
0.66 0.991 62.7 18.3 9.7 9.3
44 Easily distractible 1.35 1.057 26.0 31.7 24.0 18.3
45 Waves or shakes the
extremities repeatedly
0.93 1.086 49.0 22.0 15.7 13.3
46 Repeats a word of phrase
over and over
0.89 1.105 52.3 21.0 12.0 14.7
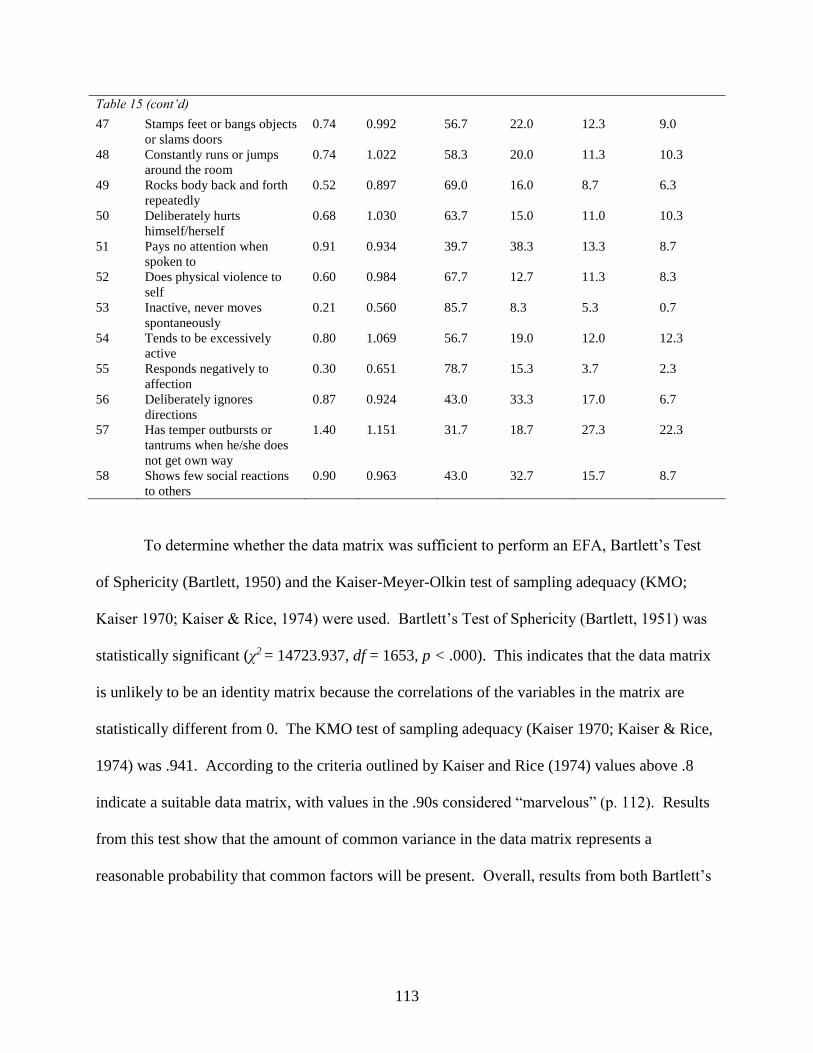
113
Table 15 (cont’d)
47 Stamps feet or bangs objects
or slams doors
0.74 0.992 56.7 22.0 12.3 9.0
48 Constantly runs or jumps
around the room
0.74 1.022 58.3 20.0 11.3 10.3
49 Rocks body back and forth
repeatedly
0.52 0.897 69.0 16.0 8.7 6.3
50 Deliberately hurts
himself/herself
0.68 1.030 63.7 15.0 11.0 10.3
51 Pays no attention when
spoken to
0.91 0.934 39.7 38.3 13.3 8.7
52 Does physical violence to
self
0.60 0.984 67.7 12.7 11.3 8.3
53 Inactive, never moves
spontaneously
0.21 0.560 85.7 8.3 5.3 0.7
54 Tends to be excessively
active
0.80 1.069 56.7 19.0 12.0 12.3
55 Responds negatively to
affection
0.30 0.651 78.7 15.3 3.7 2.3
56 Deliberately ignores
directions
0.87 0.924 43.0 33.3 17.0 6.7
57 Has temper outbursts or
tantrums when he/she does
not get own way
1.40 1.151 31.7 18.7 27.3 22.3
58 Shows few social reactions
to others
0.90 0.963 43.0 32.7 15.7 8.7
To determine whether the data matrix was sufficient to perform an EFA, Bartlett’s Test
of Sphericity (Bartlett, 1950) and the Kaiser-Meyer-Olkin test of sampling adequacy (KMO;
Kaiser 1970; Kaiser & Rice, 1974) were used. Bartlett’s Test of Sphericity (Bartlett, 1951) was
statistically significant (χ2 = 14723.937, df = 1653, p < .000). This indicates that the data matrix
is unlikely to be an identity matrix because the correlations of the variables in the matrix are
statistically different from 0. The KMO test of sampling adequacy (Kaiser 1970; Kaiser & Rice,
1974) was .941. According to the criteria outlined by Kaiser and Rice (1974) values above .8
indicate a suitable data matrix, with values in the .90s considered “marvelous” (p. 112). Results
from this test show that the amount of common variance in the data matrix represents a
reasonable probability that common factors will be present. Overall, results from both Bartlett’s

114
Test of Sphericity (Bartlett, 1950) and the KMO test of sampling adequacy (Kaiser, 1970; Kaiser
& Rice, 1974) establish that the data matrix is sufficient to perform an EFA.
The sample size of the polychoric data matrix was also analyzed according to the
standards described in MacCallum et al. (1999). Communality estimates for the 58 items (M =
.802, Min = .637, Max = .958) were considered high (i.e., values > .600). Additionally, the
anticipated variable-to-factor ratio between 58:4 and 58:7 and a sample of 300 subjects, meets
the standards of the percentages of admissible and convergent solution rates at 100% for sample
sizes > 60. Therefore, according to the standards described in MacCallum et al. (1999), the 300-
subject sample size used in this analysis is sufficient.
Research question 1: Based upon ratings of a sample of individuals with ASD by special
education staff, how many possible or likely interpretable ABC-C factors are available for
retention consideration? Hypothesis: there will be between four and seven interpretable factors
available for retention. This was determined using Principal Axis Factoring (PAF), the
Guttman-Kaiser Criterion (Guttman, 1954; Kaiser, 1960), the scree-test (Cattell, 1966), parallel
analysis (Horn, 1965), and the minimum average partial test (MAP; Velicer, 1976).
Initial extraction. PAF was chosen based upon the assumption that the dataset would
likely violate univariate and multivariate normality. PAF works by substituting the diagonal
components of the correlation matrix with initial communality estimates (Osborne & Banjanovic,
2016). Initial communalities represent estimates of the variance in each item that is accounted
for by all factors. The Guttman-Kaiser Criterion, scree test, parallel analysis, and the MAP test
were used to decide how many possible factors would be available for interpretation. It is
important to note that EFA analyses were performed on both SAS and SPSS with the R plugin.
Slightly different formulas are used to calculate eigenvalues on each program resulting in
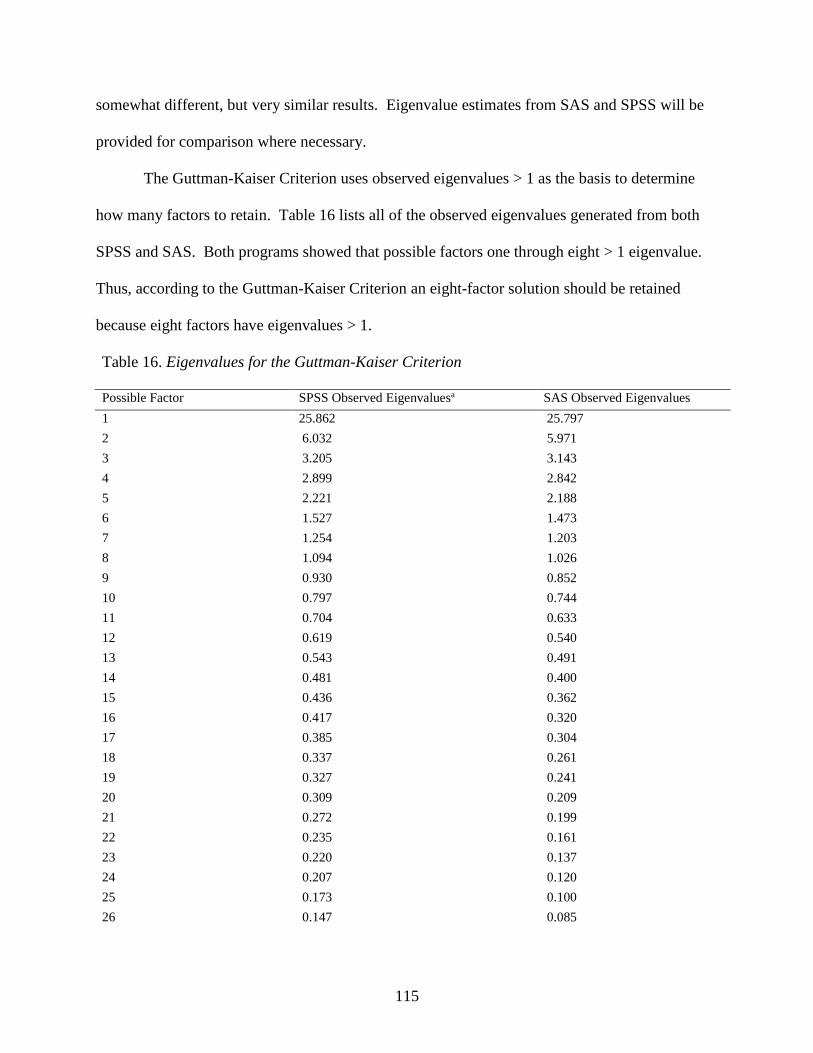
115
somewhat different, but very similar results. Eigenvalue estimates from SAS and SPSS will be
provided for comparison where necessary.
The Guttman-Kaiser Criterion uses observed eigenvalues > 1 as the basis to determine
how many factors to retain. Table 16 lists all of the observed eigenvalues generated from both
SPSS and SAS. Both programs showed that possible factors one through eight > 1 eigenvalue.
Thus, according to the Guttman-Kaiser Criterion an eight-factor solution should be retained
because eight factors have eigenvalues > 1.
Table 16. Eigenvalues for the Guttman-Kaiser Criterion
Possible Factor SPSS Observed Eigenvaluesa SAS Observed Eigenvalues
1 25.862 25.797
2 6.032 5.971
3 3.205 3.143
4 2.899 2.842
5 2.221 2.188
6 1.527 1.473
7 1.254 1.203
8 1.094 1.026
9 0.930 0.852
10 0.797 0.744
11 0.704 0.633
12 0.619 0.540
13 0.543 0.491
14 0.481 0.400
15 0.436 0.362
16 0.417 0.320
17 0.385 0.304
18 0.337 0.261
19 0.327 0.241
20 0.309 0.209
21 0.272 0.199
22 0.235 0.161
23 0.220 0.137
24 0.207 0.120
25 0.173 0.100
26 0.147 0.085

116
Table 16 (cont’d)
27 0.129 0.069
28 0.121 0.052
29 0.098 0.024
30 0.089 0.017
31 0.071 0.011
32 0.043 -0.018
33 0.042 -0.022
34 0.030 -0.025
35 0.021 -0.037
36 0.009 -0.044
37 -0.002 -0.059
38 -0.014 -0.060
39 -0.020 -0.068
40 -0.028 -0.070
41 -0.032 -0.096
42 -0.043 -0.111
43 -0.051 -0.111
44 -0.063 -0.114
45 -0.067 -0.130
46 -0.075 -0.133
47 -0.079 -0.142
48 -0.091 -0.150
49 -0.095 -0.162
50 -0.095 -0.166
51 -0.104 -0.175
52 -0.120 -0.190
53 -0.129 -0.201
54 -0.129 -0.205
55 -0.144 -0.230
56 -0.159 -0.231
57 -0.208 -0.241
58 -0.212 -0.251
a Generated through the SPSS R programming language plugin (Basto & Pereira, 2012; R Core Team, 2013)
The scree test using eigenvalues generated from the SPSS R plugin can be found in
Figure 1. The scree test shows a downward curving line with circle-points indicating
eigenvalues. The first 25 out of 58 eigenvalues were provided in the figure. The scree test is
interpreted by visually inspecting the slope of the line to determine when it becomes level. It

117
appears that there is a leveling of the slope of the line after the third and fifth eigenvalues. This
suggests that a three- and five-factor solution should be considered for retention. The scree plot
using eigenvalues from SAS resulted in a similar outcome.
Figure 1. Scree plot with eigenvalues generated from the SPSS R programming language plugin.
A parallel analysis was performed using SPSS with the R programming language plugin.
Eigenvalues were generated based on 100 randomly-generated samples resulting from the
random arrangement of the 300 cases from the data matrix. Observed eigenvalues were then
compared to randomly-generated eigenvalues. Parallel analysis criteria involve retaining
observed factors with eigenvalues above the 95th percentile of the randomly generated
eigenvalues (Glorfield, 1995). Table 17 shows both the observed and randomly generated
eigenvalues above the 95th percentile. Figure 2 provides a graphic depiction of the observed and
randomly generated eigenvalues for twenty potential factors and Figure 3 provides a close-up
0123456789
101112131415161718192021222324252627
1 2 3 4 5 6 7 8 9 10 11 12 13 14 15 16 17 18 19 20 21 22 23 24 25
Eig
env
alu
e
SPSS
Observed
Eigenvalues

118
version of the section of the plot where the observed and randomly generated eigenvalues cross.
The first six factors show observed eigenvalues above the random eigenvalues at the 95th
percentile with the seventh factor eigenvalue falling below the random eigenvalue at the 95th
percentile. Therefore, based upon selection criteria for parallel analysis, six factors should be
retained.
Table 17. Parallel Analysis with Observed and Random Eigenvalues at the 95th Percentile
Potential Factor Observed Eigenvalue SPSSa Random Eigenvalue 95th Percentile SPSS
1 25.862 2.007
2 6.032 1.802
3 3.205 1.755
4 2.899 1.624
5 2.221 1.536
6 1.527 1.480
7 1.254 1.397
8 1.094 1.317
9 0.930 1.278
10 0.797 1.256
11 0.704 1.213
12 0.619 1.119
13 0.543 1.081
14 0.481 1.044
15 0.436 0.974
16 0.417 0.928
17 0.385 0.894
18 0.337 0.871
19 0.327 0.799
20 0.309 0.750
21 0.272 0.740
22 0.235 0.698
23 0.220 0.658
24 0.207 0.610
25 0.173 0.594
26 0.147 0.533
27 0.129 0.510
28 0.121 0.477
29 0.098 0.457
30 0.089 0.404

119
Table 17 (cont’d)
31 0.071 0.372
32 0.043 0.359
33 0.042 0.318
34 0.030 0.288
35 0.021 0.279
36 0.009 0.240
37 -0.002 0.170
38 -0.014 0.159
39 -0.020 0.125
40 -0.028 0.118
41 -0.032 0.090
42 -0.043 0.062
43 -0.051 0.044
44 -0.063 -0.025
45 -0.067 -0.050
46 -0.075 -0.071
47 -0.079 -0.079
48 -0.091 -0.088
49 -0.095 -0.113
50 -0.095 -0.137
51 -0.104 -0.173
52 -0.120 -0.221
53 -0.129 -0.235
54 -0.129 -0.261
55 -0.144 -0.268
56 -0.159 -0.294
57 -0.208 -0.322
58 -0.212 -0.361
a Generated through the SPSS R programming language plugin (Basto & Pereira, 2012; R Core Team, 2013)

120
Figure 2. Graphic depiction of parallel analysis with observed and random eigenvalues at the
95th percentile generated from the SPSS R programming language plugin.
Figure 3. Close-up graphic depiction of parallel analysis with observed and random eigenvalues
at the 95th percentile generated from the SPSS R programming language plugin.
The MAP test (Velicer, 1976) was performed using SPSS with the R programming
language plugin. With the MAP test, common variance is partialed out for each successive
0
0.5
1
1.5
2
2.5
3
3.5
4 5 6 7 8
Eig
env
alu
e
Possible Factor
Observed
Eigenvalue SPSS
Random Eigenvalue
95th Percentile
SPSS
0123456789
1011121314151617181920212223242526
1 2 3 4 5 6 7 8 9 10 11 12 13 14 15 16 17 18 19 20
Eig
env
alu
es
Observed
Eigenvalue
SPSS
Random
Eigenvalue 95th
Percentile SPSS
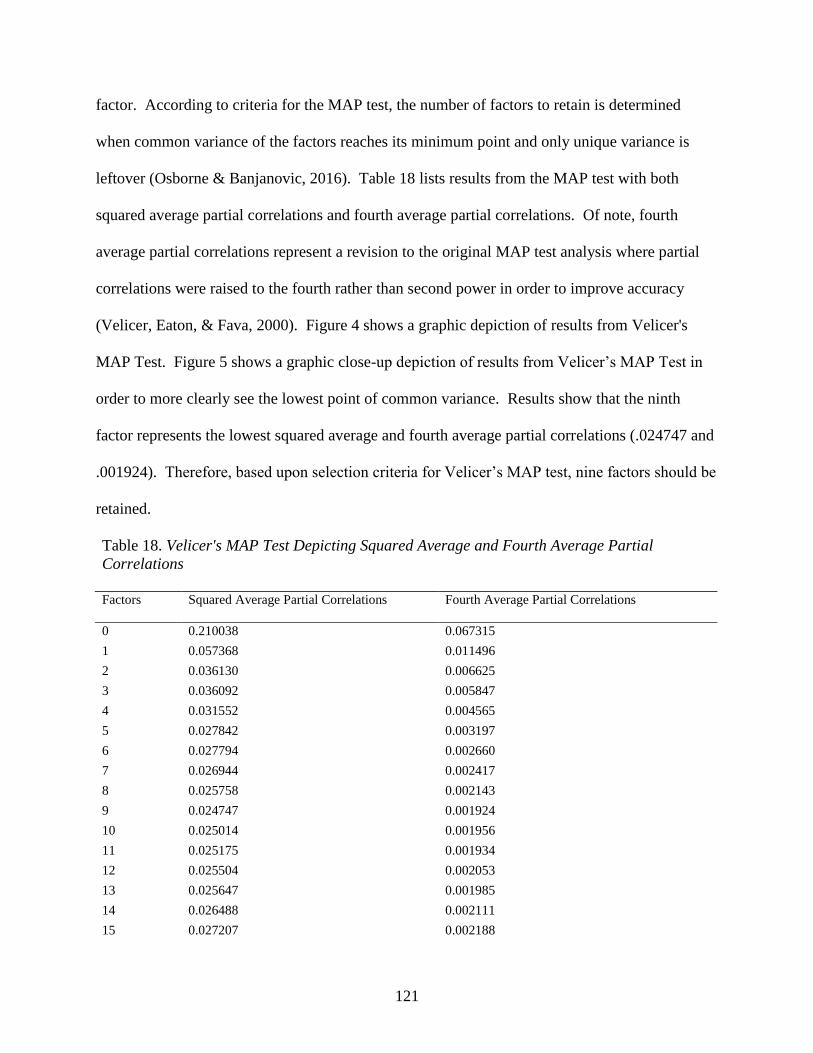
121
factor. According to criteria for the MAP test, the number of factors to retain is determined
when common variance of the factors reaches its minimum point and only unique variance is
leftover (Osborne & Banjanovic, 2016). Table 18 lists results from the MAP test with both
squared average partial correlations and fourth average partial correlations. Of note, fourth
average partial correlations represent a revision to the original MAP test analysis where partial
correlations were raised to the fourth rather than second power in order to improve accuracy
(Velicer, Eaton, & Fava, 2000). Figure 4 shows a graphic depiction of results from Velicer's
MAP Test. Figure 5 shows a graphic close-up depiction of results from Velicer’s MAP Test in
order to more clearly see the lowest point of common variance. Results show that the ninth
factor represents the lowest squared average and fourth average partial correlations (.024747 and
.001924). Therefore, based upon selection criteria for Velicer’s MAP test, nine factors should be
retained.
Table 18. Velicer's MAP Test Depicting Squared Average and Fourth Average Partial
Correlations
Factors Squared Average Partial Correlations Fourth Average Partial Correlations
0 0.210038 0.067315
1 0.057368 0.011496
2 0.036130 0.006625
3 0.036092 0.005847
4 0.031552 0.004565
5 0.027842 0.003197
6 0.027794 0.002660
7 0.026944 0.002417
8 0.025758 0.002143
9 0.024747 0.001924
10 0.025014 0.001956
11 0.025175 0.001934
12 0.025504 0.002053
13 0.025647 0.001985
14 0.026488 0.002111
15 0.027207 0.002188

122
Table 18 (cont’d)
16 0.028621 0.002426
17 0.029897 0.002695
18 0.030843 0.002831
19 0.031370 0.002975
20 0.032785 0.003260
21 0.034085 0.003599
22 0.036093 0.003872
23 0.037705 0.004396
24 0.039461 0.004687
25 0.041632 0.005258
26 0.043012 0.005568
27 0.045810 0.006063
28 0.048094 0.006600
29 0.051437 0.007517
30 0.054607 0.008419
31 0.058213 0.009740
32 0.062627 0.010923
33 0.067090 0.012248
34 0.071661 0.014384
35 0.075109 0.015361
36 0.082869 0.017988
37 0.088717 0.020249
38 0.097853 0.023948
39 0.104711 0.026402
40 0.116717 0.032614
41 0.123776 0.036685
42 0.140867 0.045068
43 0.163285 0.058459
44 0.192270 0.077660
45 0.214888 0.096727
46 0.257332 0.131721
47 0.332690 0.199973
48 0.505133 0.377962
49 0.949247 0.917868
50 0.115296 0.033543
51 0.135269 0.044262
52 0.160501 0.059686
53 0.195696 0.082345
54 0.242632 0.118233
55 0.326929 0.193942
56 0.493159 0.367982

123
Figure 4. Illustration of Velicer's MAP test depicting squared average and fourth average partial
correlations.
0
0.1
0.2
0.3
0.4
0.5
0.6
0.7
0.8
0.9
1
0 2 4 6 8 10 12 14 16 18 20 22 24 26 28 30 32 34 36 38 40 42 44 46 48 50 52 54 56
Pa
rti
al C
orrela
tion
s
Factors
Squared
Average
Partial
Correlations
Fourth
Average
Partial
Correlations

124
Figure 5. Close-up illustration of Velicer's MAP test depicting squared average and fourth
average partial correlations
Summary of initial extraction results. Table 19 summarizes results of the four different
factor retention tests. Differing results were found across the four methods. The most weight
was provided to the parallel analysis and MAP test given their reputations for greater accuracy
(Osborne & Banjanovic, 2016). However, a conservative approach was taken in order to ensure
that a thorough examination of all potential solutions would occur. Previous factor analyses of
the ABC-C with an ASD sample resulted in 4-, 5-, and 7-factor solutions, with Kaat et al. (2013)
also examining a 6-factor solution and Mirwis (2011) examining 7- and 8-factor solutions.
Additionally, solutions plus or minus two factors at the highest and lowest range were considered
based upon the differing levels of agreement of the factor retention tests. Thus, it was
determined to examine the 11-factor solution as well (i.e., plus two above the 9 factor solution
suggested by the MAP test). Based upon results from the factor retention tests and previously
analyzed factor solutions in the existing literature, 3-, 4-, 5-, 6-, 7-, 8-, 9-, and 10-, and 11-factor
solutions were examined for possible retention.
0
0.005
0.01
0.015
0.02
0.025
0.03
0.035
4 5 6 7 8 9 10 11 12 13 14 15 16 17 18 19 20
Pa
rti
al C
orrela
tion
s
Factors
Squared Average Partial
Correlations
Fourth Average Partial
Correlations
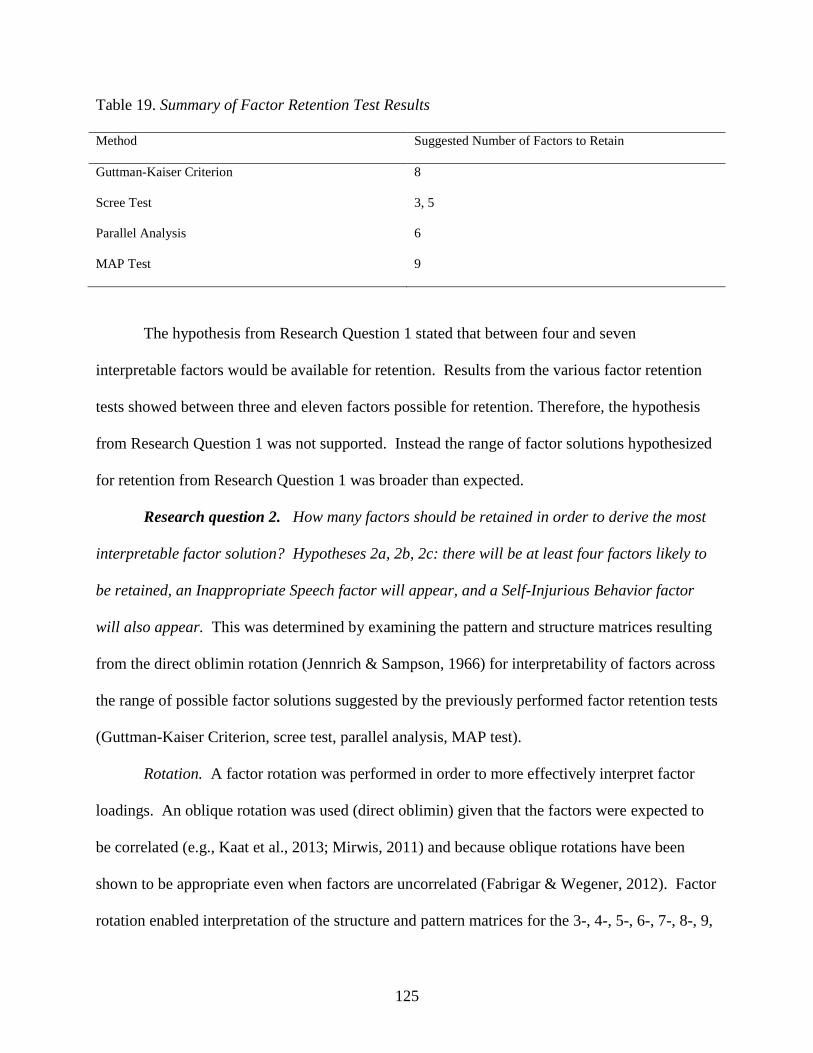
125
Table 19. Summary of Factor Retention Test Results
Method Suggested Number of Factors to Retain
Guttman-Kaiser Criterion 8
Scree Test 3, 5
Parallel Analysis 6
MAP Test 9
The hypothesis from Research Question 1 stated that between four and seven
interpretable factors would be available for retention. Results from the various factor retention
tests showed between three and eleven factors possible for retention. Therefore, the hypothesis
from Research Question 1 was not supported. Instead the range of factor solutions hypothesized
for retention from Research Question 1 was broader than expected.
Research question 2. How many factors should be retained in order to derive the most
interpretable factor solution? Hypotheses 2a, 2b, 2c: there will be at least four factors likely to
be retained, an Inappropriate Speech factor will appear, and a Self-Injurious Behavior factor
will also appear. This was determined by examining the pattern and structure matrices resulting
from the direct oblimin rotation (Jennrich & Sampson, 1966) for interpretability of factors across
the range of possible factor solutions suggested by the previously performed factor retention tests
(Guttman-Kaiser Criterion, scree test, parallel analysis, MAP test).
Rotation. A factor rotation was performed in order to more effectively interpret factor
loadings. An oblique rotation was used (direct oblimin) given that the factors were expected to
be correlated (e.g., Kaat et al., 2013; Mirwis, 2011) and because oblique rotations have been
shown to be appropriate even when factors are uncorrelated (Fabrigar & Wegener, 2012). Factor
rotation enabled interpretation of the structure and pattern matrices for the 3-, 4-, 5-, 6-, 7-, 8-, 9,

126
10-, and 11-factor solutions. Factor rotation showed that factors were oblique in all interpretable
factor solutions and not orthogonal.
Pattern and structure matrices were generated after an oblique rotation was performed.
Pattern matrices contain factor loadings and consist of row statistics of standardized regression
coefficients which represent correlations between items and factors. Structure matrices provide
the correlations between all pairs of factors in the dataset. Given the distinct nature of the factor
loadings in the pattern matrices, the structure matrices were not analyzed for interpretability.
Interpretation. Following extraction and rotation of factors, each of the possible factor
solutions were analyzed and named to determine the most interpretable factor solution. Two
qualified researchers independently analyzed all factor solutions. Two factor solutions were
determined to be the most interpretable of the nine solutions analyzed. Two additional qualified
researchers then independently interpreted these two solutions and a consensus final solution was
reached among the four researchers.
The three-factor solution was considered given its appearance in the scree test. It
represents the most parsimonious possible factor solution of those that were analyzed. Concepts
such as tantrums, self-injury, hyperactivity, and impulsivity loaded highly on the first factor.
Withdrawal, lethargy, and some elements of stereotypic behavior loaded onto the second factor.
Inappropriate speech items along with a stereotypic behavior item loaded on the third factor.
Overall, factor constructs in all three of the factors were difficult to interpret; therefore this
solution was not chosen.
The four-factor solution was considered given its presence in Brinkley et al. (2007) as
well as it being in the range of possible solutions (plus or minus two) based upon the parallel
analysis. Factors included an Externalizing Behavior factor (consisting of concepts such as

127
tantrums, irritability, self-injury, agitation, and hyperactivity), a Lethargy/Withdrawal factor, a
Stereotypic Behavior/Hyperactivity factor, and an Inappropriate Speech factor. The
Externalizing Behavior factor as well as the Stereotypic Behavior/Hyperactivity factors seemed
to combine multiple constructs making them challenging to cleanly define. The Inappropriate
Speech factor and the Lethargy/Withdrawal factor were much more interpretable. However,
because two of the factors were too conceptually difficult to adequately interpret, the four-factor
solution was not chosen.
The five-factor solution was considered given its appearance in the scree test, the fact that
it consisted of the same number of factors as the current author version of the ABC-C (Aman &
Singh, 2017) and one of the Brinkley et al. (2007) solutions, and because it was in the range of
possible solutions based upon the parallel analysis. A fair number of crossloadings occurred
across all factors though most crossloadings were < .40. Three distinct factors emerged: a
Stereotypic Behavior factor, an Inappropriate Speech factor, and a Hyperactivity factor. The two
other factors that appeared were more conceptually dense. A Self-injury/Irritability factor
emerged with the three self-injury items loading the highest (.94, .92, .90) and the next highest
loadings including tantrums and aggressive behavior items (.83, .74, .70). A Social
Withdrawal/Noncompliance factor also arose as the largest factor with 22 items. Overall, the
two factors with multiple constructs seemed to likely be more interpretable if they were further
narrowed. Additionally, the five-factor solution was not specifically suggested by the parallel
analysis or the MAP test. Therefore, the five-factor solution was not chosen.
The seven-factor solution was considered given that Mirwis (2011) settled on a seven-
factor solution in his study and it was in the range of possible solutions based on the parallel
analysis, and the MAP test. Three factors emerged that were relatively distinct: a Lethargy

128
factor, an Inappropriate Speech factor, and a Stereotypic Behavior factor. Two other factors
appeared (a Hyperactivity factor and a Withdrawal/Noncompliance factor) that each shared one
exact crossing loading with the Irritability/Agitation factor. A Self-Injury/Aggressiveness factor
also emerged, which shared two equal loadings with the Irritability/Agitation factor. Overall,
given the fact that the various crossloadings raised questions regarding the strength of the
Irritability/Agitation factor, and the fact that this solution was not identified in the parallel
analysis, or the MAP test, the seven-factor solution was therefore not chosen.
The eight-factor solution was considered as a result of the Guttman-Kaiser Criterion,
which specified eight-factors, and it was in the range of possible solutions based on the parallel
analysis and the MAP test. Immediately apparent was the eighth factor, which included only two
items with loadings respectively at .58 and .56. These two items seem to signify a physical
withdrawal construct. However, with only two items and each with moderate loadings, it was
not enough to maintain a complete factor. The other factors that emerged were readily
interpretable. They included an Irritability factor, a Hyperactivity factor, a
Withdrawal/Noncompliance factor, a Stereotypic Behavior factor, a Lethargy factor, a Self-
Injury/Aggressiveness factor, and an Inappropriate Speech factor. Overall, given the lack of a
complete eighth factor, this solution was not chosen.
The ten-factor solution was considered because it was in the range of possible solutions
of the MAP test. The tenth factor that appeared maintained four items with moderate to low
loadings (.50, .46, .38, .32). These items were conceptually difficult to conceptualize into a
meaningful construct. As a result this factor solution was not chosen.
The eleven-factor solution was also considered as a result of it being in the range of
possible solutions of the MAP test. The tenth factor emerged with only two loadings. The

129
eleventh factor emerged with four very weak loadings (.42, .38, .37, and .35) making it
challenging to appropriately interpret. Overall, given these two problematic factors, this factor
solution was not selected.
Both the six-factor and nine-factor solutions were deemed to be the two best solutions out
of all solutions that were analyzed. In order to choose between them, a consensus opinion was
sought across four qualified raters who rated the two solutions independently. Three of the four
raters agreed upon the same final solution.
The six-factor solution was considered as a result of the parallel analysis. It emerged
with three relatively distinct factors: Hyperactivity, Inappropriate speech, and Stereotypic
Behavior. It also had two other distinct factors (a Social Withdrawal/Noncompliance factor and
a Lethargy factor) that shared a weaker crossloading item (.38). Finally a Self-
Injury/Tantrums/Irritability factor emerged with the three highest loadings (.95, .95, and .91)
representing all self-injurious behavior items and the next highest loadings (.77, .69, .68)
regarding tantrums and aggressive behavior.
The nine-factor solution was considered as a result of the MAP test. Three similar factors
as the six-factor solution emerged: a Hyperactivity factor, an Inappropriate Speech factor, and a
Stereotypic Behavior factor. The Social Withdrawal/Noncompliance factor in the six-factor
solution was split into two distinct factors (a Social Withdrawal factor and a Noncompliance
factor). The Self-Injury/Tantrums/Irritability factor in the six-factor solution was split into two
factors: a Self-Injury/Aggressiveness factor, and an Irritability/Tantrums factor. Two other
factors also emerged: a Lethargy factor and an Oppositionality factor.
The question emerged whether the six-factor, Self-Injury/Tantrums/Irritability factor was
too conceptually crowded and whether a more expanded factor structure, such as the nine-factor
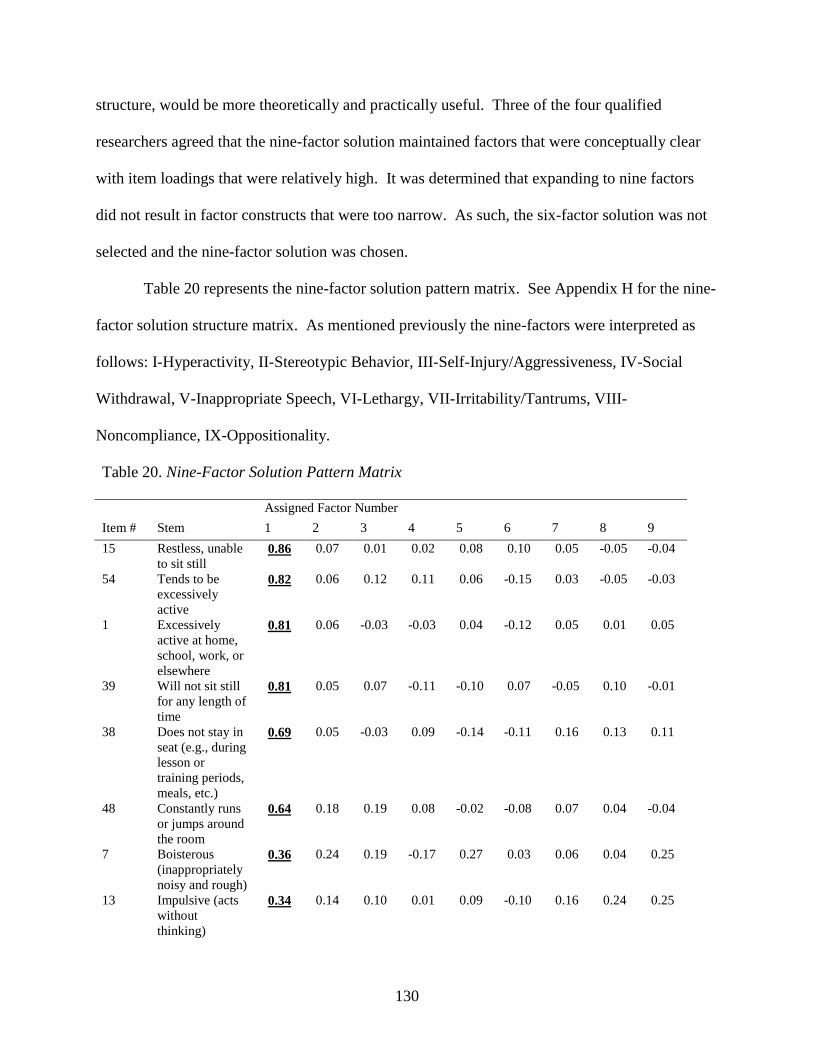
130
structure, would be more theoretically and practically useful. Three of the four qualified
researchers agreed that the nine-factor solution maintained factors that were conceptually clear
with item loadings that were relatively high. It was determined that expanding to nine factors
did not result in factor constructs that were too narrow. As such, the six-factor solution was not
selected and the nine-factor solution was chosen.
Table 20 represents the nine-factor solution pattern matrix. See Appendix H for the nine-
factor solution structure matrix. As mentioned previously the nine-factors were interpreted as
follows: I-Hyperactivity, II-Stereotypic Behavior, III-Self-Injury/Aggressiveness, IV-Social
Withdrawal, V-Inappropriate Speech, VI-Lethargy, VII-Irritability/Tantrums, VIII-
Noncompliance, IX-Oppositionality.
Table 20. Nine-Factor Solution Pattern Matrix
Assigned Factor Number
Item # Stem 1 2 3 4 5 6 7 8 9
15 Restless, unable
to sit still 0.86 0.07 0.01 0.02 0.08 0.10 0.05 -0.05 -0.04
54 Tends to be
excessively
active
0.82 0.06 0.12 0.11 0.06 -0.15 0.03 -0.05 -0.03
1 Excessively
active at home,
school, work, or
elsewhere
0.81 0.06 -0.03 -0.03 0.04 -0.12 0.05 0.01 0.05
39 Will not sit still
for any length of
time
0.81 0.05 0.07 -0.11 -0.10 0.07 -0.05 0.10 -0.01
38 Does not stay in
seat (e.g., during
lesson or
training periods,
meals, etc.)
0.69 0.05 -0.03 0.09 -0.14 -0.11 0.16 0.13 0.11
48 Constantly runs
or jumps around
the room
0.64 0.18 0.19 0.08 -0.02 -0.08 0.07 0.04 -0.04
7 Boisterous
(inappropriately
noisy and rough)
0.36 0.24 0.19 -0.17 0.27 0.03 0.06 0.04 0.25
13 Impulsive (acts
without
thinking)
0.34 0.14 0.10 0.01 0.09 -0.10 0.16 0.24 0.25
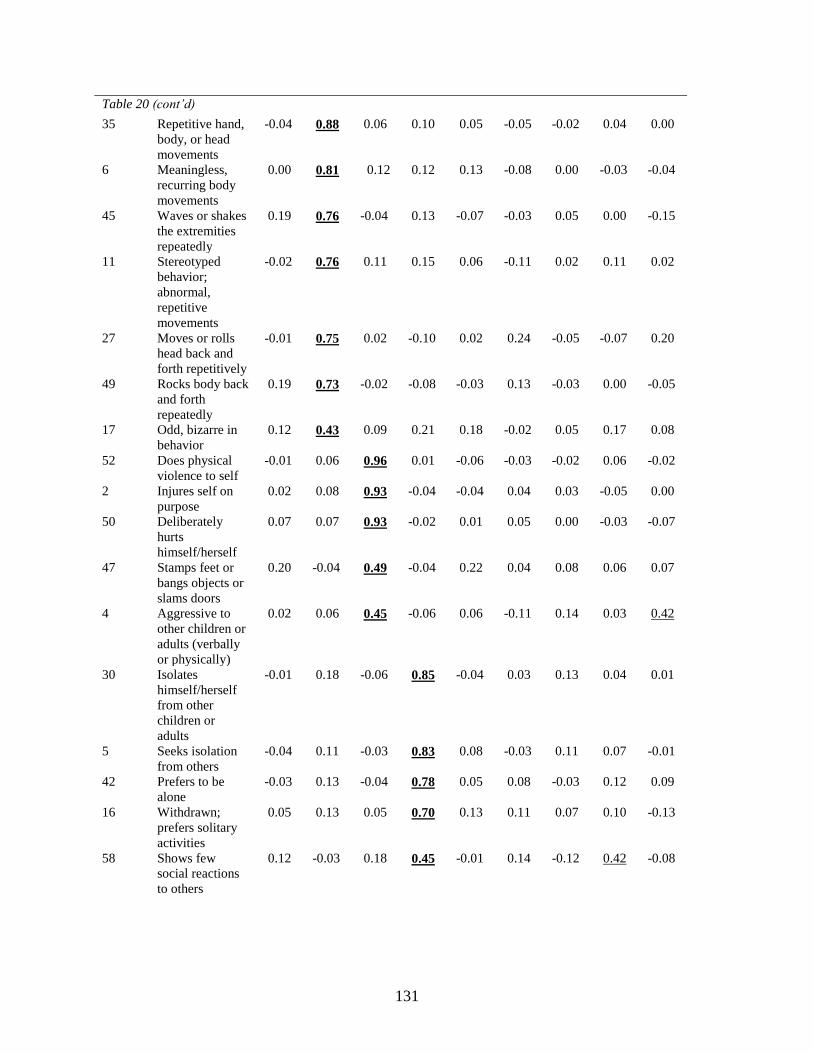
131
Table 20 (cont’d)
35 Repetitive hand,
body, or head
movements
-0.04 0.88 0.06 0.10 0.05 -0.05 -0.02 0.04 0.00
6 Meaningless,
recurring body
movements
0.00 0.81 0.12 0.12 0.13 -0.08 0.00 -0.03 -0.04
45 Waves or shakes
the extremities
repeatedly
0.19 0.76 -0.04 0.13 -0.07 -0.03 0.05 0.00 -0.15
11 Stereotyped
behavior;
abnormal,
repetitive
movements
-0.02 0.76 0.11 0.15 0.06 -0.11 0.02 0.11 0.02
27 Moves or rolls
head back and
forth repetitively
-0.01 0.75 0.02 -0.10 0.02 0.24 -0.05 -0.07 0.20
49 Rocks body back
and forth
repeatedly
0.19 0.73 -0.02 -0.08 -0.03 0.13 -0.03 0.00 -0.05
17 Odd, bizarre in
behavior
0.12 0.43 0.09 0.21 0.18 -0.02 0.05 0.17 0.08
52 Does physical
violence to self
-0.01 0.06 0.96 0.01 -0.06 -0.03 -0.02 0.06 -0.02
2 Injures self on
purpose
0.02 0.08 0.93 -0.04 -0.04 0.04 0.03 -0.05 0.00
50 Deliberately
hurts
himself/herself
0.07 0.07 0.93 -0.02 0.01 0.05 0.00 -0.03 -0.07
47 Stamps feet or
bangs objects or
slams doors
0.20 -0.04 0.49 -0.04 0.22 0.04 0.08 0.06 0.07
4 Aggressive to
other children or
adults (verbally
or physically)
0.02 0.06 0.45 -0.06 0.06 -0.11 0.14 0.03 0.42
30 Isolates
himself/herself
from other
children or
adults
-0.01 0.18 -0.06 0.85 -0.04 0.03 0.13 0.04 0.01
5 Seeks isolation
from others
-0.04 0.11 -0.03 0.83 0.08 -0.03 0.11 0.07 -0.01
42 Prefers to be
alone
-0.03 0.13 -0.04 0.78 0.05 0.08 -0.03 0.12 0.09
16 Withdrawn;
prefers solitary
activities
0.05 0.13 0.05 0.70 0.13 0.11 0.07 0.10 -0.13
58 Shows few
social reactions
to others
0.12 -0.03 0.18 0.45 -0.01 0.14 -0.12 0.42 -0.08

132
Table 20 (cont’d)
55 Responds
negatively to
affection
0.25 -0.08 0.24 0.41 0.07 0.24 -0.32 -0.08 0.34
22 Repetitive
speech
-0.07 0.06 0.05 0.03 0.91 -0.01 -0.08 0.01 0.02
46 Repeats a word
or phrase over
and over
-0.12 0.01 0.02 0.02 0.85 0.05 0.07 0.08 -0.01
9 Talks
excessively
0.11 -0.03 -0.19 -0.09 0.84 0.04 0.07 -0.04 0.00
33 Talks to self
loudly
-0.03 0.08 0.08 0.15 0.82 -0.10 -0.03 -0.08 -0.03
53 Inactive, never
moves
spontaneously
-0.05 0.05 0.04 -0.04 0.01 0.80 0.06 0.25 -0.06
3 Listless,
sluggish,
inactive
-0.12 0.09 0.14 0.09 -0.04 0.75 0.19 -0.11 -0.09
23 Does nothing but
sit and watch
others
0.01 0.06 -0.12 0.14 0.07 0.70 -0.08 0.17 -0.08
32 Sits or stands in
one position for
a long time
-0.04 0.11 -0.08 0.07 -0.03 0.58 0.03 0.10 0.22
20 Fixed facial
expression; lacks
emotional
responsiveness
0.12 0.04 0.12 0.14 0.15 0.47 0.01 0.16 0.03
25 Depressed mood -0.10 0.05 0.04 0.18 -0.05 0.46 0.23 -0.01 0.32
12 Preoccupied;
stares into space
-0.02 0.28 0.08 0.14 0.09 0.36 0.03 0.35 -0.17
34 Cries over minor
annoyances and
hurts
0.07 0.08 -0.02 0.10 0.17 0.18 0.66 -0.04 -0.04
14 Irritable and
whiny
0.21 0.01 0.01 0.05 -0.06 0.24 0.64 -0.08 0.11
41 Cries and
screams
inappropriately
0.18 -0.03 0.22 0.06 0.19 0.02 0.62 0.13 -0.08
10 Temper tantrums
/ outbursts
0.01 0.01 0.42 0.08 0.03 -0.08 0.53 -0.04 0.24
8 Screams
inappropriately
0.14 -0.03 0.18 -0.06 0.26 0.04 0.50 0.15 0.06
57 Has temper
outbursts or
tantrums when
he/she does not
get own way
0.03 -0.04 0.37 0.17 0.03 -0.11 0.50 0.05 0.24
19 Yells at
inappropriate
times
0.19 -0.08 0.24 -0.04 0.33 0.05 0.44 0.18 0.01
29 Demands must
be met
immediately
0.10 0.10 0.13 0.16 -0.06 -0.14 0.41 0.15 0.33

133
Table 20 (cont’d)
36 Mood changes
quickly
0.09 0.20 0.31 0.00 -0.06 0.09 0.34 0.10 0.18
51 Pays no attention
when spoken to
0.06 0.07 0.05 0.14 0.06 0.15 -0.05 0.67 0.09
28 Does not pay
attention to
instructions
0.14 0.16 -0.06 0.19 0.14 0.09 0.05 0.50 0.10
43 Does not try to
communicate by
words or
gestures
0.14 0.03 0.16 0.20 -0.21 0.29 0.00 0.46 -0.07
37 Unresponsive to
structured
activities (does
not react)
0.02 0.13 0.09 0.07 -0.13 0.40 -0.02 0.46 0.14
56 Deliberately
ignores
directions
0.07 0.03 -0.03 0.24 0.08 -0.10 0.13 0.44 0.34
44 Easily
distractible
0.29 0.14 -0.15 0.06 0.18 0.12 0.20 0.40 -0.07
40 Is difficult to
reach, contact, or
get through to
0.13 0.08 0.04 0.37 0.02 0.19 0.04 0.39 0.04
21 Disturbs others 0.20 0.15 0.08 -0.10 0.30 -0.08 0.09 0.18 0.51
24 Uncooperative 0.02 0.01 0.10 0.14 0.02 0.12 0.25 0.17 0.51
18 Disobedient;
difficult to
control
0.18 0.03 0.21 0.05 0.03 -0.05 0.29 0.11 0.45
31 Disrupts group
activities
0.19 0.14 0.07 -0.05 0.15 -0.11 0.25 0.26 0.41
26 Resists any form
of physical
contact
0.25 -0.12 -0.05 0.37 0.05 0.37 -0.16 -0.13 0.39
Note: Loadings formatted in bold denote assigned factor loading and underlined loadings denote factor
loading > 0.30.
Factor I: Hyperactivity. Factor I, Hyperactivity, was composed of the following items: 1,
7, 13, 15, 38, 39, 48, and 54. The highest loading items (15, 54, 1, and 39) best described the
factor construct including being restless and unable to sit still (factor loading = .86), being
excessively active (.82), being excessively active in multiple environments (.81), and not being
able to sit still for any length of time (.81). The two lowest loading items (7 and 13) included
being boisterous (.36) and impulsive (.34). No items > .30 crossloaded on this factor.

134
Factor II: Stereotypic Behavior. Factor II, Stereotypic Behavior, comprised the
following items: 6, 11, 17, 27, 35, 45, and 49. The first six loadings are all > .73, which,
according to criteria outlined by Comrey and Lee (as cited in Pett et al., 2003) are considered
excellent loadings. These items helped to best characterize this factor as one consisting of
repetitive movements (.88), recurring body movements (.81), stereotyped behavior (.76), and
repeated body rocking (.73). The lowest loading item was item 17: odd, bizarre in behavior
(.43). No items > .30 crossloaded on this factor.
Factor III: Self-Injury/Aggressiveness. Factor III, Self-Injury/Aggressiveness, was
composed of the following items: 2, 4, 47, 50, and 52. The first three loadings, all > .93, are the
highest loading items in the entire matrix and best describe this factor as doing physical violence
to oneself (.96), injuring oneself on purpose (.93), and deliberately hurting oneself (.93). The
last two loadings (items 2 and 4) are fair in strength and do not directly support a self-injurious
behavior construct. These two items best represent an aggressiveness construct including
stomping feet, banging objects and slamming doors (.49), and being verbally or physically
aggressive to others (.45). Item 4 (.45) also maintains a crossloading (.42) with factor IX.
Factor IV: Social Withdrawal. Factor IV, Social Withdrawal, comprised the following
items: 5, 16, 30, 42, 55, and 58. The first four loadings, all > .70, are the highest loading items in
the factor and characterize the factor as isolating oneself from others (.85), seeking isolation
from others (.83), preferring to be alone (.78) and preferring solitary activities (.70). The two
remaining items (58 and 55) are weaker loadings (.45 and .41) and appear somewhat divergent
with regard to the social withdrawal construct. They include showing few social reactions to
others (.45) and responding negatively to affection (.41). Item 58 (.45) maintains a crossloading
on factor VIII (.42), and item 55 (.41) maintains a crossloading on factor IX (.34).

135
Factor V: Inappropriate Speech. Factor V, Inappropriate Speech was composed of the
four following items: 9, 22, 33, and 46. All loadings are > .82 and describe the factor as
consisting of different aspects of inappropriate speech such as repetitive speech (.91), repeating a
word or phrase over and over (.85), talking excessively (.84), and talking loudly to self (.82). No
items > .30 crossloaded on this factor.
Factor VI: Lethargy. Factor VI, Lethargy, was composed of the following items: 3, 12,
20, 23, 25, 32, and 53. The three highest loading items are > .70 and best characterize the factor
by never moving spontaneously (.80), sluggish and inactive (.75), and doing nothing but sitting
and watching others (.70). Item 32 (.58) maintains a similar description with regard to
maintaining a single position for a long period of time while item 20 (.47) highlights a lack of
emotional responsiveness. Item 25 (.46) describes a depressed mood, while item 12 (.36)
illustrates one being preoccupied and staring into space. Item 25 maintains a crossloading with
Factor IX (.32) and item 12 maintains a crossloading with factor VIII (.35).
Factor VII: Irritability/Tantrums. Factor VII, Irritability/Tantrums, was composed of the
following items: 8, 10, 14, 19, 29, 34, 36, 41, and 57. The three highest loading items (34, 14,
and 41) describe the irritability aspect of the factor by crying over minor annoyances (.66),
irritable and whiny (.64), and crying and screaming inappropriately (.62). The next four highest
loading items (10, 8, 57, and 19) characterize the tantrum construct of the factor by temper
tantrums and outbursts (.53), screaming inappropriately (.50), tantrums when one does not get
her way (.50), and yelling at inappropriate times (.44). The two lowest loading items (item 29
and 36) involve demands needing to be met immediately (.41) and quickly changing mood (.34).
Item 10 (.53) maintains a crossloading with Factor III (.42), item 57 (.50) maintains a

136
crossloading with Factor III (.37), item 29 (.41) maintains a crossloading with Factor IX (.33),
and item 36 (.34) maintains a crossloading with Factor III (.31).
Factor VIII: Noncompliance. Factor VIII, Noncompliance, comprised the following
items: 28, 37, 40, 43, 44, 51, and 56. The highest three loading items (51, 28, 43, 37, and 56)
characterize the factor best by not paying attention when spoken to (.67), not paying attention to
instructions (.50), not communicating by words or gestures (.46), unresponsive to structured
activities (.46), and deliberately ignoring directions (.44). The lowest loading items (44 and 40)
do not directly characterize the factor, consisting of being easily distractible (.40) and being
difficult to reach, contact, or get through to (.39). Item 37 (.46) maintains a crossloading with
Factor VI (.40), item 56 (.44) maintains a crossloading with factor IX (.34), and item 40 (.39)
maintains a cross loading with Factor IV (.37).
Factor IX: Oppositionality. Factor IX, Oppositionality, consists of the following items:
18, 21, 24, 26, and 31. The four highest loading items (21, 24, 18, and 31) describe the factor by
disturbing others (.51) and being uncooperative (.51), being disobedient and difficult to control
(.45), and disrupting group activities (.41). The final item (26) is characterized by resisting any
form of physical contact (.39). Item 21 (.51) maintains a crossloading with Factor V, and item
26 (.39) maintains a crossloading with Factor IV (.37) and Factor VI (.37).
Research question 2 summary. Once the nine-factor solution was fully interpreted,
Hypotheses 2a, 2b, and 2c could be assessed. Hypothesis 2a was supported (at least four factors
would be retained) because nine factors were retained. Hypothesis 2b was also supported (an
Inappropriate Speech factor would appear) because an Inappropriate Speech Factor appeared as
Factor V. Hypothesis 2c was not fully supported (a Self-Injurious Behavior factor would
appear). Although the highest loading items in Factor III consisted of the self-injurious behavior

137
items, the remaining items were deemed as a related but separate construct, thus resulting in the
factor being labeled Self-Injurious Behavior/Aggressiveness.
Research question 3. Does the most interpretable factor structure yield substantive
correlations amongst the factors? Hypothesis: there will be substantive correlations (i.e., > .30;
Beavers et al., 2013) amongst at least some factors. This was determined by analyzing the
relations in the inter-factor correlation matrix of the chosen factor solution after the oblique
rotation (i.e., direct oblimin). Correlations between the factors of the nine-factor solution were
evaluated. Table 21 contains the inter-factor correlations.
Table 21. EFA Inter-Factor Correlation Matrix Nine-Factor Solution
Factor
I II III IV V VI VII VIII IX
Fac
tor
I:
Hyperactivity 1.000
II:
Stereotypic Behavior
0.641 1.000 II:
Stereotypic Behavior 0.43 1.000
III:
Self-Injury/Aggressiveness 0.41 0.36 1.000
IV:
Social Withdrawal 0.26 0.39 0.21 1.000
V:
Inappropriate Speech 0.24 0.28 0.18 0.19 1.000
VI:
Lethargy 0.09 0.28 0.09 0.45 0.02 1.000
VII:
Irritability/Tantrums 0.35 0.25 0.41 0.15 0.29 0.10 1.000
VIII:
Noncompliance 0.38 0.38 0.25 0.43 0.19 0.31 0.29 1.000
IX:
Oppositionality 0.35 0.12 0.34 0.27 0.19 0.16 0.30 0.20 1.000
Non-identity values that are > 0.30 are presented in bold print.
Factor I, Hyperactivity, had a moderate correlation with Factor II, Stereotypic Behavior
(.43), Factor III, Self-Injury/Aggressiveness (.41), Factor VII, Irritability/Tantrums (.35), Factor
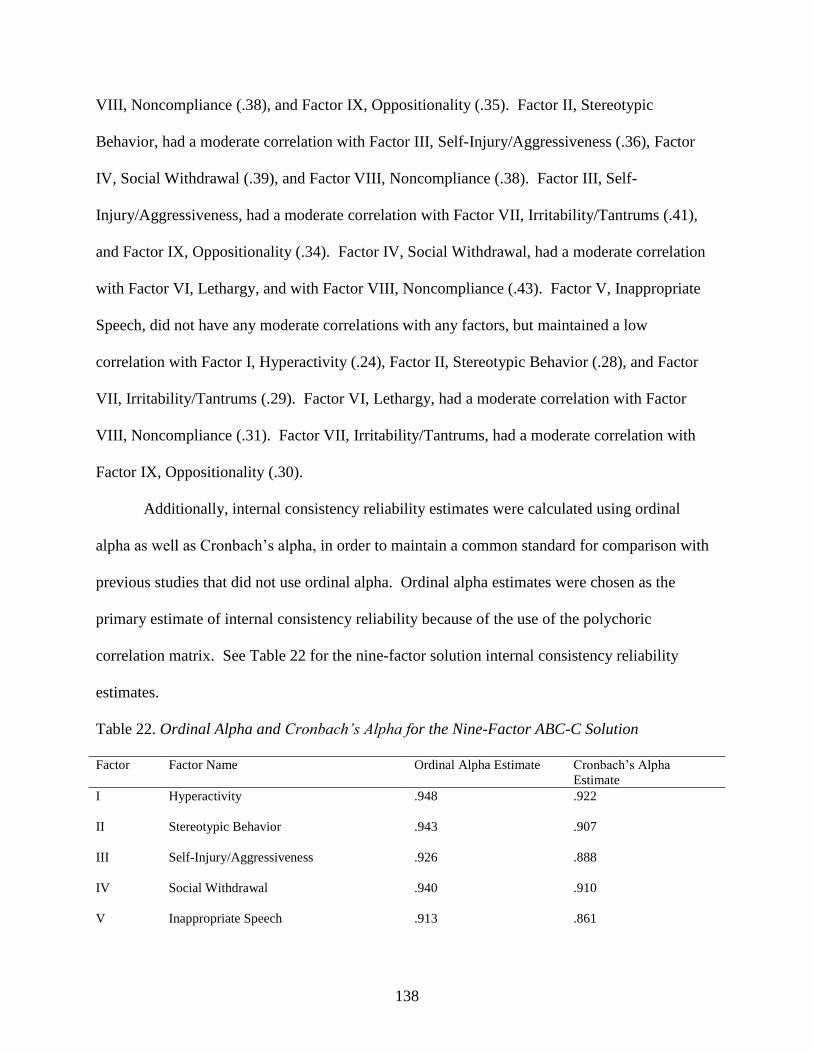
138
VIII, Noncompliance (.38), and Factor IX, Oppositionality (.35). Factor II, Stereotypic
Behavior, had a moderate correlation with Factor III, Self-Injury/Aggressiveness (.36), Factor
IV, Social Withdrawal (.39), and Factor VIII, Noncompliance (.38). Factor III, Self-
Injury/Aggressiveness, had a moderate correlation with Factor VII, Irritability/Tantrums (.41),
and Factor IX, Oppositionality (.34). Factor IV, Social Withdrawal, had a moderate correlation
with Factor VI, Lethargy, and with Factor VIII, Noncompliance (.43). Factor V, Inappropriate
Speech, did not have any moderate correlations with any factors, but maintained a low
correlation with Factor I, Hyperactivity (.24), Factor II, Stereotypic Behavior (.28), and Factor
VII, Irritability/Tantrums (.29). Factor VI, Lethargy, had a moderate correlation with Factor
VIII, Noncompliance (.31). Factor VII, Irritability/Tantrums, had a moderate correlation with
Factor IX, Oppositionality (.30).
Additionally, internal consistency reliability estimates were calculated using ordinal
alpha as well as Cronbach’s alpha, in order to maintain a common standard for comparison with
previous studies that did not use ordinal alpha. Ordinal alpha estimates were chosen as the
primary estimate of internal consistency reliability because of the use of the polychoric
correlation matrix. See Table 22 for the nine-factor solution internal consistency reliability
estimates.
Table 22. Ordinal Alpha and Cronbach’s Alpha for the Nine-Factor ABC-C Solution
Factor Factor Name Ordinal Alpha Estimate Cronbach’s Alpha
Estimate
I Hyperactivity .948 .922
II Stereotypic Behavior .943 .907
III Self-Injury/Aggressiveness .926 .888
IV Social Withdrawal .940 .910
V Inappropriate Speech .913 .861

139
Table 22 (cont’d)
VI Lethargy .904 .816
VII Irritability/Tantrums .951 .931
VIII Noncompliance .933 .901
IX Oppositionality .889 .856
Ordinal alpha estimates ranged from .889 to .951 with eight of the nine factors > .90.
Cronbach’s alpha estimates ranged from .816 to .931 with five of the nine factors > .90. Based
upon criteria provided by Murphy and Davidshofer (as cited in Sattler, 2008) estimates from .80
to .89 are considered to be moderately high or good reliability, while estimates from .90 to .99
are considered excellent. Thus, internal consistency reliability estimates for the nine-factor
solution were mostly in the excellent range.
Overall, eight of the nine factors maintained substantive correlations between them. Only
Factor V, Inappropriate Speech, failed to generate a substantive correlation with the other
factors. Therefore, Hypothesis 3 was fully supported because nearly all of the factors maintained
substantive correlations between them.
Research question 4. If a five-factor solution is interpretable, to what extent does the
solution correspond to the five-factors hypothesized by the test authors? Hypothesis: the five-
factor solution, from among the EFA solutions, will closely match the test-authors’ proposed
five-factor solution. This was determined by a) qualitatively comparing the factor construct
names of the test authors’ five-factor ABC-C solution and this study’s derived five-factor
solution, b) qualitatively comparing the highest loading items that are instrumental in
defining/naming each factor on the test author’s solution and this study’s derived solution, and c)

140
calculating a percentage of overlapping items between the factors from the derived five-factor
solution and the ABC-C authors’ version.
Table 23 compares factor names for the Aman and Singh (2017) five-factor solution and
the five-factor solution that was generated (though not ultimately chosen) from the EFA in this
study (FFSEFA). Similar factor constructs were derived from both analyses although they did
not occur in the same factor order. Chosen factor names for the constructs in the FFSEFA were
comparable to the names chosen by Aman and Singh (2017). Inappropriate Speech and
Stereotypic Behavior factor names were exactly the same in both solutions. The Irritability
factor in Aman and Singh (2017) was named Self-Injury/Irritability in the FFSEFA because the
three self-injury items were the highest loading items in the factor. The noncompliance construct
was found in both Aman and Singh (2017) and in the FFSEFA, although it paired with the social
withdrawal construct in the FFSEFA instead of with the hyperactivity construct as it did in Aman
and Singh (2017). The hyperactivity construct constituted a separate factor in the FFSEFA and
the social withdrawal construct constituted a separate factor in Aman and Singh (2017). Overall,
factor constructs and thus factor names were deemed similar between the two five-factor
solutions.
Table 23. Factor Names From the Aman and Singh (2017) Five-Factor Solution and
the Five-Factor Solution From Study One
Factor Factor Names Aman and Singh (2017)
Five-Factor Solution
Factor Names Five-Factor Solution Study
One
I Irritability Social Withdrawal/Noncompliance
II Social Withdrawal Self-Injury/Irritability
III Stereotypic Behavior Hyperactivity
IV Hyperactivity/Noncompliance Inappropriate Speech
V Inappropriate Speech Stereotypic Behavior

141
Table 24 compares the highest loading items that were instrumental in naming each
factor found in Aman and Singh (2017) and the FFSEFA. Both the Inappropriate Speech and
Stereotypic Behavior factors in the Aman and Singh (2017) model and the FFSEFA are nearly
identical in terms of their highest loading items. Only one item is reversed in position (Item 11)
in the Stereotypic Behavior factor in Aman and Singh (2017) and the FFSEFA. The highest
loadings in the Self Injury/Irritability factor in the FFSEFA differs primarily from the highest
loadings in the Aman and Singh (2017) model because all three self-injury items represent the
highest loading items on the factor in the FFSEFA. The first appearance of a self-injury item
occurs in the fifth highest loading in the Irritability factor in the Aman and Singh (2017) model
and its actual loading (.68) is lower than the other self-injury item loadings in the FFSEFA. Four
of the highest loading items in the Hyperactivity/Noncompliance factor in the Aman and Singh
(2017) model are in the Hyperactivity factor in the FFSEFA except they have differing loading
positions. Three of the highest loading items in the Social Withdrawal factor in Aman and Singh
(2017) were found in the Social Withdrawal/Noncompliance factor in the FFSEFA (23, 42, and
37), although all loading in different orders. The two different items (item 53 and item 30) in the
FFSEFA and in Aman and Singh (item16 and item 32) are also high loading items found in each
of the different factors, though with different loading levels. Overall, a qualitative comparison of
the highest loading items among similar factors in the Aman and Singh (2017) model and the
FFSEFA showed a great number of item similarities though differences in the order and strength
of the loadings.

142
Table 24. Highest Loading Items in the Aman and Singh (2017) Five-Factor Solution and the
Five-Factor Solution From Study One
Factor Names
Aman and Singh
(2017) Five-Factor
Solution
Highest Loading Items
Aman and Singh (2017)
Five-Factor Solution
Factor Names
Five-Factor
Solution Study
One
Highest Loading Items
Five-Factor Solution Study One
(loading)
Social Withdrawal Item 16: Withdrawn; prefers
solitary activities (.64)
Item 37: Unresponsive to
structured activities (does not
react; 63)
Item 32: Sits or stands in one
position for a long time (.63)
Item 42: Prefers to be alone (.63)
Item 23: Does nothing but sit
and watch others (.62)
Social
Withdrawal
/Noncompliance
Item 23: Does nothing but sit and
watch others (.85)
Item 53: Inactive, never moves
spontaneously (.84)
Item 42: Prefers to be alone (.82)
Item 30: Isolates himself/herself
from other children or adults (.78)
Item 37: Unresponsive to
structured activities (does not
react) (.75)
Irritability Item 10: Temper
tantrums/outburst (.81)
Item 57: Throws temper
outbursts or tantrums when he/she
does not get own way (.78)
Item 29: Demands must be met
immediately (.70)
Item 14: Irritable and whiny
(.70)
Item 52: Does physical violence
to self (.68)
Self-
Injury/Irritability
Item 2: Injures self on purpose
(.94)
Item 52: Does physical violence
to self (.92)
Item 50: Deliberately hurts
himself/herself (.90)
Item 10: Temper
Tantrums/outbursts (.83)
Item 57: Has temper outbursts or
tantrums when he/she does not get
own way (.74)
Hyperactivity
/Noncompliance
Item 39: Will not sit still for any
length of time (.71)
Item 48: Constantly runs or
jumps around the room (.67)
Item 54: Tends to be excessively
active (.67)
Item 38: Does not stay in seat
(e.g., during lesson or learning
periods, meals, etc.; .63)
Item 1: Excessively active at
home, school, work, or elsewhere
(.61)
Hyperactivity Item 1: Excessively active at
home, school, work, or elsewhere
(.83)
Item 54: Tends to be excessively
active (.80)
Item 38: Does not stay in seat
(.79)
Item 39: Will not sit still for any
length of time (.79)
Item 15: Restless, unable to sit
still (.77)
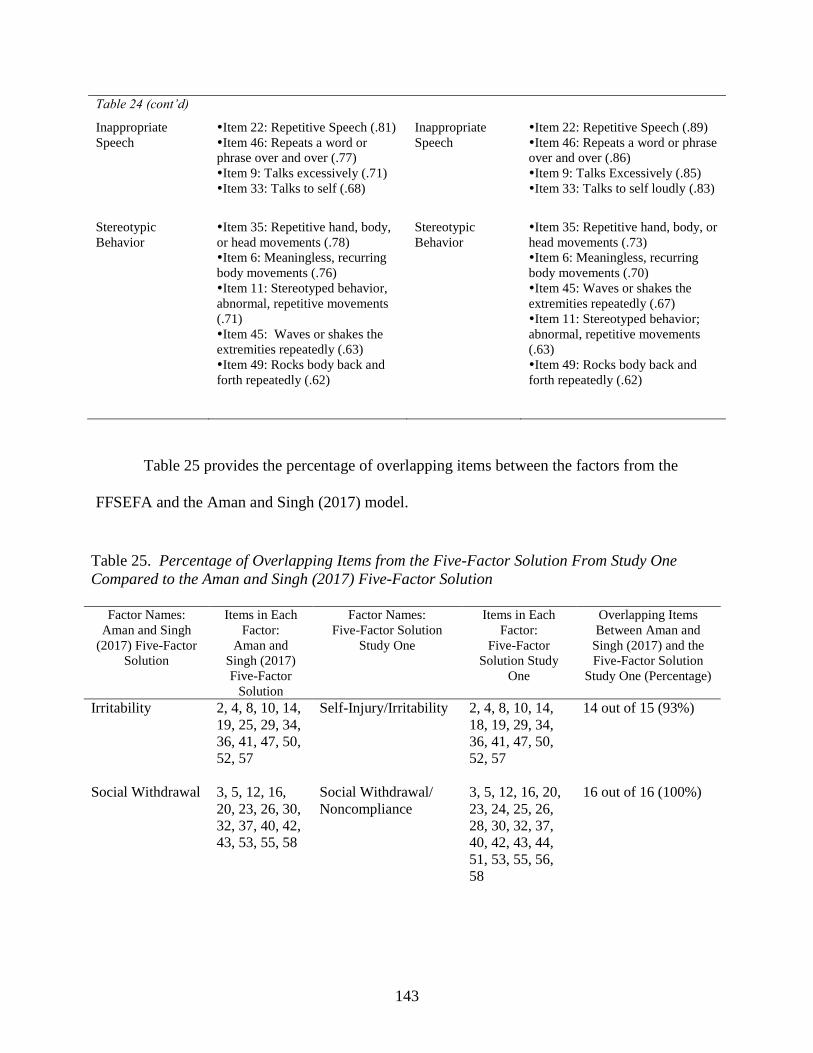
143
Table 24 (cont’d)
Inappropriate
Speech
Item 22: Repetitive Speech (.81)
Item 46: Repeats a word or
phrase over and over (.77)
Item 9: Talks excessively (.71)
Item 33: Talks to self (.68)
Inappropriate
Speech
Item 22: Repetitive Speech (.89)
Item 46: Repeats a word or phrase
over and over (.86)
Item 9: Talks Excessively (.85)
Item 33: Talks to self loudly (.83)
Stereotypic
Behavior
Item 35: Repetitive hand, body,
or head movements (.78)
Item 6: Meaningless, recurring
body movements (.76)
Item 11: Stereotyped behavior,
abnormal, repetitive movements
(.71)
Item 45: Waves or shakes the
extremities repeatedly (.63)
Item 49: Rocks body back and
forth repeatedly (.62)
Stereotypic
Behavior
Item 35: Repetitive hand, body, or
head movements (.73)
Item 6: Meaningless, recurring
body movements (.70)
Item 45: Waves or shakes the
extremities repeatedly (.67)
Item 11: Stereotyped behavior;
abnormal, repetitive movements
(.63)
Item 49: Rocks body back and
forth repeatedly (.62)
Table 25 provides the percentage of overlapping items between the factors from the
FFSEFA and the Aman and Singh (2017) model.
Table 25. Percentage of Overlapping Items from the Five-Factor Solution From Study One
Compared to the Aman and Singh (2017) Five-Factor Solution
Factor Names:
Aman and Singh
(2017) Five-Factor
Solution
Items in Each
Factor:
Aman and
Singh (2017)
Five-Factor
Solution
Factor Names:
Five-Factor Solution
Study One
Items in Each
Factor:
Five-Factor
Solution Study
One
Overlapping Items
Between Aman and
Singh (2017) and the
Five-Factor Solution
Study One (Percentage)
Irritability 2, 4, 8, 10, 14,
19, 25, 29, 34,
36, 41, 47, 50,
52, 57
Self-Injury/Irritability 2, 4, 8, 10, 14,
18, 19, 29, 34,
36, 41, 47, 50,
52, 57
14 out of 15 (93%)
Social Withdrawal 3, 5, 12, 16,
20, 23, 26, 30,
32, 37, 40, 42,
43, 53, 55, 58
Social Withdrawal/
Noncompliance
3, 5, 12, 16, 20,
23, 24, 25, 26,
28, 30, 32, 37,
40, 42, 43, 44,
51, 53, 55, 56,
58
16 out of 16 (100%)

144
Ninety-three percent or 14 out of 15 items in the Irritability factor in Aman and Singh (2017) and
the Self-Injury/Irritability factor in the FFSEFA overlapped between them. The FFSEFA Self-
Injury/Irritability factor contained one additional item (item 18) and was missing one item (item
25) compared to the Aman and Singh (2017) Irritability factor. The FFSEFA Social
Withdrawal/Noncompliance factor contained 100% of the items, or 16 out of 16, found in the
Aman and Singh (2017) Social Withdrawal factor; however the FFSEFA also included items 5,
24, 25, 28, and 44. One hundred percent of the items, or seven out of seven, were found in the
Aman and Singh (2017) Stereotypic Behavior factor and the FFSEFA Stereotypic Behavior
factor. One hundred percent of items, or four out of four, were found in the Aman and Singh
(2017) Inappropriate Speech factor and the FFSEFA Inappropriate Speech factor. The
Hyperactivity factor in the FFSEFA maintained 63% of the items in the
Hyperactivity/Noncompliance factor in the Aman and Singh (2017) model. The items that were
not in the FFSEFA Hyperactivity factor (18, 24, 28, 44, 51, 56) were all found in the FFSEFA
Social Withdrawal/Noncompliance factor except for item 18, which, as stated previously, was
found in the Self Injury/Irritability factor. In total 51 out of 58 items (88%) from the Aman and
Singh (2017) model were found in the same factors as in the FFSEFA.
Table 25 (cont’d)
Stereotypic
Behavior
6, 11, 17, 27,
35, 45, 49
Stereotypic Behavior 6, 11, 17, 27, 35,
45, 49
7 out of 7 (100%)
Hyperactivity/
Noncompliance
1, 7, 13, 15,
18, 21, 24, 28,
31, 38, 39, 44,
48, 51, 54, 56,
Hyperactivity 1, 7, 13, 15, 21,
31, 38, 39, 48,
54
10 out of 16 (63%)
Missing Items 18, 24,
28, 44, 51, 56
Inappropriate
Speech
9, 22, 33, 46 Inappropriate Speech 9, 22, 33, 46 4 out of 4 (100%)
145
Research question 4 summary. A quantitative benchmark was not created to specifically
assess the degree to which the five-factor solution derived in the study one EFA matched the
ABC-C test authors’ five-factor solution. However, a qualitative examination revealed a high
degree of similarity in terms of factor names, highest loading items that helped to name the
factor, and the number of overlapping items that were found in each factor. Therefore, it appears
that hypothesis 4 was fully supported in that the two, five-factor solutions were largely similar.
Study Two
Data cleaning and missing data. The dataset for study two was scanned for missing
values and extreme outliers before performing the CFA. No unusual values (e.g., values outside
of the scaling) or extreme outlier cases were present. All item distributions were non-normal, as
expected. Like the dataset in study one, less than 1% of the 243 cases had any missing values—
and no case had more than two item values missing. Missing data met the assumption of missing
completely at random. As a result, an expectation-maximization method (Allison, 2002) was
implemented and missing values were replaced without having to use more rigorous missing data
procedures.
Model specification. Multiple CFA models were tested in the CFA analysis. These
included a) the nine-factor model derived in study one, b) the four-and five-factor models from
Brinkley et al. (2007), originally derived from an ASD sample with parents as raters, c) the
seven-factor model from Mirwis (2011), originally derived from an ASD sample with special
education staff as raters, and d) the original five-factor model of the ABC from Aman et al.
(1985a), which maintains the same factor loadings and factor structure as in the ABC-C
supplemental manual from Aman and Singh (1994) and the updated ABC-C2 manual from
Aman and Singh (2017) and was originally derived from an institutionalized ID sample rated by

146
institutional staff members. The six-factor model from Sansone et al. (2012), originally derived
from a Fragile X sample rated by caregivers, was also included. In all, the fit of six different
CFA models total was assessed (see Appendices A, B, C, D, E, and F for the path diagrams of
the tested CFA models).
Model identification. All models in study two were overidentified (see Table 26 for df
for each model). The fixed factor method was used (i.e., setting all factor variances to 1.0 and
allowing factor loadings to be freely estimated using factor variance units). Of note, one item in
each model generated a negative residual. This issue was dealt with in the following way. First,
each model was assessed with the problematic item loading fixed to 1.0, which set the residual to
0. Second, the item was deleted from the model and the CFA was run a second time. Whether
or not the item remained in the model, the difference in fit for the RMSEA, CFI, and TLI was <
than .001 (i.e., differing by no more than one in the third decimal place). Thus, keeping the item
in the model with a fixed loading of 1.0 or deleting the item from the model did not substantively
alter model fit. The fit statistics reported here in the results were from the models that included
the item. This involved fixing item 46 (repeats a word or phrase over and over) in the Aman et
al. (1985a) five-factor model, the Mirwis (2011) seven-factor model, the six-factor Sansone et al.
(2012) model, and in the nine-factor model from study one. The item 34 loading (cries over
minor annoyances and hurts) was also set to 1.0 for the Brinkley et al (2007) four- and five-
factor models. Fixing the item 46 loading did not result in a change to the model fit outcomes
for the Aman et al. (1985a) model, the Mirwis (2011) model, the Sansone et al. (2012) model or
the nine-factor model from study one—when compared to the same model in each case with no
fixed factor loadings. Fixing item 34 in the four- and five-factor models in Brinkley et al. (2007)
had a negative impact on fit index outcomes; however, the impact was not substantive enough
147
that it resulted in a markedly different assessment of the models’ viability. Follow-up regression
analyses suggested that the issue with item 46 and 34 likely resulted from multicollinearity.
Model estimation. Model estimation was conducted using Mplus version 8.2. Due to
the ordinal and non-normal nature of the item data distributions, the weighted least squares mean
and variance adjusted (WLSMV) estimation approach on the polychoric correlation matrix and
sample estimated asymptotic covariance matrix was used in order to assess the fit of the various
models. Indices available through WLSMV do not allow for direct comparison of non-nested
CFA models in terms of fit. Therefore, for model comparison purposes, the Akaike’s
Information Criterion (AIC) and the Bayes Information Criterion (BIC), which allow for the
assessment of the relative fit of non-nested CFA models within the same variance-covariance
matrix, were calculated using the Mplus Robust Maximum Likelihood (MLR) estimator. The
WLSMV estimator does not enable generation of the AIC or the BIC fit indices and therefore the
MLR estimator was necessary to produce these two fit index outputs. Of note, the Sansone et al.
(2012) six-factor model could not be assessed with AIC and BIC fit statistics because of its use
of a three-item parcel. The item parcel altered the number of total items in the Sansone et al.
(2012) model, rendering the model non-comparable to the other models.
Model fit. Multiple fit indices were generated in order to determine the fit of each
individual model to the data and in order to compare the relative fit of five of the six models to
each other. (The six-factor model by Sansone et al. [2012] could not be directly compared to the
other models because it is based on a different number of observed variables—making the
variance-covariance matrix non-equivalent to the one used for the other five models. This
occurred because the Sansone et al. six-factor model contains a three-item parcel [made up of the
148
three self-injury items], which combines the three items into a single observed
variable/indicator.)
In this study, three different fit index categories were used, which are often referred to as
a) absolute fit indices, b) indices fit adjusted for model parsimony, and c) comparative
(incremental) fit indices (Brown, 2006; Byrne, 2012). For the absolute fit indices (as classified
by Brown, 2006), a Chi-Square (2) and Standardized Root Mean Square Residual (SRMR)
were used. For the parsimony correction indices, as classified by Brown (2006), the Root Mean
Square Error of Estimation (RMSEA) was used and, as classified by Byrne (2012) the Akaike’s
Information Criterion (AIC) and the Bayes Information Criterion (BIC) were used. The AIC and
BIC were specifically selected because they are information criterion indices which allow for a
direct comparison between two non-nested models using the same set of data (i.e., same
variance-covariance matrix). For the comparative fit indices, as classified by Brown (2006), the
Comparative Fit Index (CFI) and the Tucker-Lewis Index (TLI) were used. In all, no single
index was given more weight than any other. Quality of fit for the various models was
ultimately judged based upon the totality of the outcomes from the seven different fit indices.
However, only the AIC and BIC were used to directly compare the models to each other in terms
of parsimony-corrected relative fit.
Within Mplus version 8.2, WLSMV makes available several fit indices for assessing the
fit of individual models (e.g., WLSMV adjusted 2, RMSEA, CFI, TLI, SRMR, etc.). However,
these fit indices cannot be used for direct model comparison. For model comparison, WLSMV
in Mplus offers the DIFFTEST option, which allows assessing the difference between nested
models for statistical significance using adjusted likelihood ratios. Given that the CFA models
examined in the current study could not strictly be considered nested variants of each other, it
149
was not legitimate to examine differences in fit between them using the DIFFTEST. For
comparing the relative fit of non-nested models within the same data set and using the same
observed variables (i.e., same variance-covariance matrix), the AIC and BIC indices are
recommended (Byrne, 2012). These indices are not available through WLSMV estimation, but
are available in Mplus through the Robust Maximum Likelihood (MLR) estimation method.
Evidence from simulation studies clearly indicates that WLSMV is superior to MLR under data
conditions present in the current study sample (Li, 2016). This was evident when data from the
present study were run through both estimation procedures. Under MLR, the primary fit indices
(i.e., 2, RMSEA, CFI, TLI, and SRMR) were suggestive of much poorer fit relative to
values yielded by the WLSMV algorithm. This made it clear that MLR adjustment was
insufficient and would not be useful for this purpose. However, given that AIC and BIC were
likely to retain their relative rank across different CFA models for the same variance-covariance
matrix, and that these two indices are not available through WLSMV, it was decided to derive
primary fit indices through WLSMV but then derive AIC and BIC values through MLR for the
present study.
Research question 5. How does the factor solution generated in a sample of individuals
with ASD rated by special education staff members for the ABC-C compare in terms of absolute
and relative fit to previous ABC-C factor models found in ASD samples or proposed for use with
individuals with ASD? Hypotheses 5a, 5b: the nine-factor ABC-C factor model selected in study
one will adequately fit the ABC-C variance-covariance matrix of the second ASD sample, and it
will demonstrate a better fit to the second ASD sample than previous ABC-C factor models found
in ASD samples or proposed for use with individuals with ASD. Hypothesis 5a was assessed
using the Mplus WLSMV estimator via the WLSMV-adjusted 2, SRMR, RMSEA, CFI, and

150
TLI. (The adequacy of each of the other five CFA models was assessed using this strategy as
well.) Hypothesis 5b was assessed primarily by comparing AIC and BIC values across models.
AIC and BIC values were generated through the Mplus MLR estimation procedure.
Results for all six models examined across absolute fit indices can be found in Table 26.
Absolute fit indices assess if the predicted variance-covariance matrix is equivalent to the sample
variance-covariance matrix (Harrington, 2009). A statistically significant result with the
WLSMV adjusted 2 statistic (p < .05) signifies that the hypothesized model does not exactly fit
the data. The 2 statistic for the nine-factor model was statistically significant (p < .001) and thus
did not meet criteria for an exact model fit. In addition, all five other models in this study
assessed with the 2 statistic were also statistically significant (p < .001) and therefore failed to
meet criteria for model fit. (This result is not unusual in CFA nor in broader structural equation
modeling, as 2 strictly assesses exact fit and larger sample sizes can render significant what may
be trivial model discrepancies [Byrne, 2012]). The Standardized Root Mean Square Residual
(SRMR) was also used to determine absolute fit. The SRMR measures how incongruent the
hypothesized model is from a perfect fit of 0, with values ranging from 0 to 1. According to Hu
Table 26. CFA Model Results: Absolute Fit Indices
Model
2 df p SRMR
Brinkley et al. (2007) four-factor model
4674.801 1590 <.001 0.116
Brinkley et al. (2007) five-factor model
3925.658 1586 <.001 0.104
Aman et al. (1985a) five-factor model
3854.660 1586 <.001 0.107
Sansone et al. (2012) six-factor model
3246.261 1469 <.001 0.093
Mirwis (2011) seven-factor model
3627.982 1575 <.001 0.099
Study one nine-factor model
3021.420 1560 <.001 0.083

151
and Bentler (1999), a cutoff value of “close to .08” for the SRMR is recommended (p. 27). The
SRMR of the nine-factor model was > .08 but was near the threshold approaching an acceptable
fit. The SRMR values of the five other models examined were also > .08, ranging from .99 to
.116, although not close enough to the cut-off to fit satisfactorily.
Results for all six models examined across the RMSEA parsimony correction fit index
can be found in Table 27. The parsimony correction indices are comparable to absolute fit
indices except that degrees of freedom (df) are taken into account, resulting in an increasing
penalty as the number of freely estimated parameters increases. The Root Mean Square Error of
Estimation (RMSEA) was one of the three parsimony correction indices used in study two. The
RMSEA measures the level of mis-fit relative to the population, with a perfect fit equivalent to 0.
According to Browne and Cudek (1993) values < .05 are considered a “close fit,” values > .05
and < .08 considered a “reasonable” fit, and values > .10 are not considered acceptable (p. 144).
Hu and Bentler (1999) suggest an RMSEA cut off value close to .06. A 90% confidence interval
(CI) was also included for the RMSEA values.
Table 27. CFA Model Results: RMSEA Parsimony Correction Index
Model
RMSEA 90% Confidence Interval (CI)
Brinkley et al. (2007) four-factor model
.089 .086- .092
Brinkley et al. (2007) five-factor model
.078 .075- .081
Aman et al. (1985a) five-factor model
.077 .074- .080
Sansone et al. (2012) six-factor model
.071 .067- .074
Mirwis (2011) seven-factor model
.073 .070- .076
Study one nine-factor model
.062 .059- .065
The nine-factor model resulted in an RMSEA of .062 and a CI between .059 and .065.
According to Browne and Cudeck (1993) this would be considered a reasonable fitting model,
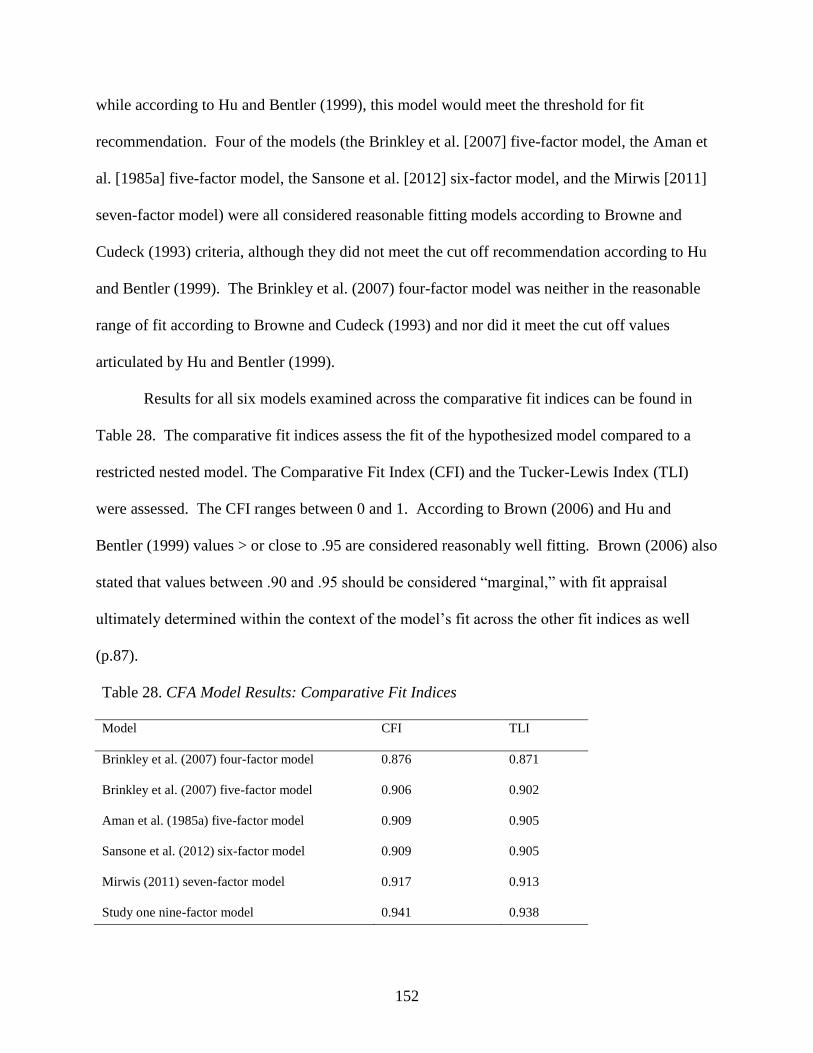
152
while according to Hu and Bentler (1999), this model would meet the threshold for fit
recommendation. Four of the models (the Brinkley et al. [2007] five-factor model, the Aman et
al. [1985a] five-factor model, the Sansone et al. [2012] six-factor model, and the Mirwis [2011]
seven-factor model) were all considered reasonable fitting models according to Browne and
Cudeck (1993) criteria, although they did not meet the cut off recommendation according to Hu
and Bentler (1999). The Brinkley et al. (2007) four-factor model was neither in the reasonable
range of fit according to Browne and Cudeck (1993) and nor did it meet the cut off values
articulated by Hu and Bentler (1999).
Results for all six models examined across the comparative fit indices can be found in
Table 28. The comparative fit indices assess the fit of the hypothesized model compared to a
restricted nested model. The Comparative Fit Index (CFI) and the Tucker-Lewis Index (TLI)
were assessed. The CFI ranges between 0 and 1. According to Brown (2006) and Hu and
Bentler (1999) values > or close to .95 are considered reasonably well fitting. Brown (2006) also
stated that values between .90 and .95 should be considered “marginal,” with fit appraisal
ultimately determined within the context of the model’s fit across the other fit indices as well
(p.87).
Table 28. CFA Model Results: Comparative Fit Indices
Model
CFI TLI
Brinkley et al. (2007) four-factor model
0.876 0.871
Brinkley et al. (2007) five-factor model
0.906 0.902
Aman et al. (1985a) five-factor model
0.909 0.905
Sansone et al. (2012) six-factor model
0.909 0.905
Mirwis (2011) seven-factor model
0.917 0.913
Study one nine-factor model 0.941 0.938

153
The CFI for the nine-factor model approached the .95 cutoff value at .941. The other five
models were below the .95 cut off value ranging from .876 to .917. The TLI is similar to the CFI
although it includes a penalty for more complex models. The cutoff values are similar to the CFI
(Brown, 2006; Hu & Bentler, 1999). The TLI value for the nine-factor model failed to reach to
the .95 cutoff value but approached the cutoff at .938, and according to Brown (2006), was
within the marginal range of fit. The TLI for the other five models also failed to meet the .95
cutoff value ranging from .871 to .913. The Brinkley et al. (2007) model, the Aman et al.
(1985a) model, the Sansone et al. (2012) model, and the Mirwis (2011) model were all within the
marginal range of fit according to Brown (2006), although they should all be appraised based
upon outcomes across the other fit indices as well.
Research question 5 hypothesis 5a summary. No single fit index was considered
determinative of what constituted a reasonable model fit for the nine-factor solution selected in
study one. Thus, multiple indices were chosen in order to help gain a thorough picture of how
the nine-factor model fared across varying analyses. Based upon results across all three types of
fit indices (absolute, parsimony correction, and comparative) it was determined that the nine-
factor solution adequately fit the ABC-C variance-covariance matrix of the second sample, thus
supporting hypothesis 5a.
AIC and BIC fit indices. Results for the five models examined across the AIC and BIC
parsimony correction fit indices can be found in Table 29.
Table 29. CFA Model Results: AIC and BIC Parsimony Correction Indices
Model
AIC BIC
Brinkley et al. (2007) four-factor model
31096.262 31725.013
Brinkley et al. (2007) five-factor model
30710.149 31352.872
Aman et al. (1985a) five-factor model
30936.966 31579.689

154
Table 29 (cont’d)
Sansone et al. (2012) six-factor model
* *
Mirwis (2011) seven-factor model
30173.515 30854.662
Study one nine-factor model
29622.523 30356.066
* AIC and BIC could not be calculated for Sansone et al. (2012) because of the use of an item parcel in its
model.
Unlike the other fit indices examined in this study, the AIC and BIC indices enable one to make
a direct comparison between non-nested models on the same set of data. The lower the value of
the AIC and BIC, the better the fit of the model. The nine-factor model resulted in the lowest
value for both the AIC and the BIC compared to all other models with the seven-factor model by
Mirwis (2011) the next best fitting model. As previously noted, the Sansone et al. (2012) six-
factor model could not be meaningfully compared to the other models using any fit statistics
because the use of an item parcel in this model rendered its variance-covariance matrix non-
identical to that of the other models. Models based on different variance-covariance matrices for
their observed variables cannot be meaningfully compared.
Research question 5 hypothesis 5b summary. To primarily assess hypothesis 5b, AIC and
BIC values, generated through the Mplus MLR estimation procedure, were directly compared
across five models. Secondarily, although models across the different fit indices generated via
the Mplus WLSMV estimator (2, SRMR, RMSEA, CFI, and TLI) could not be directly
compared, certain models distinguished themselves as coming closer to meeting adequacy
standards than others. Results from the AIC and BIC analysis showed the nine-factor model
with the lowest AIC and BIC scores across the five models tested. The nine-factor model also
distinguished itself across the other indices as it met or approached cut off values in four of the
five fit tests. Thus, it appeared that the nine-factor model demonstrated a better fit than
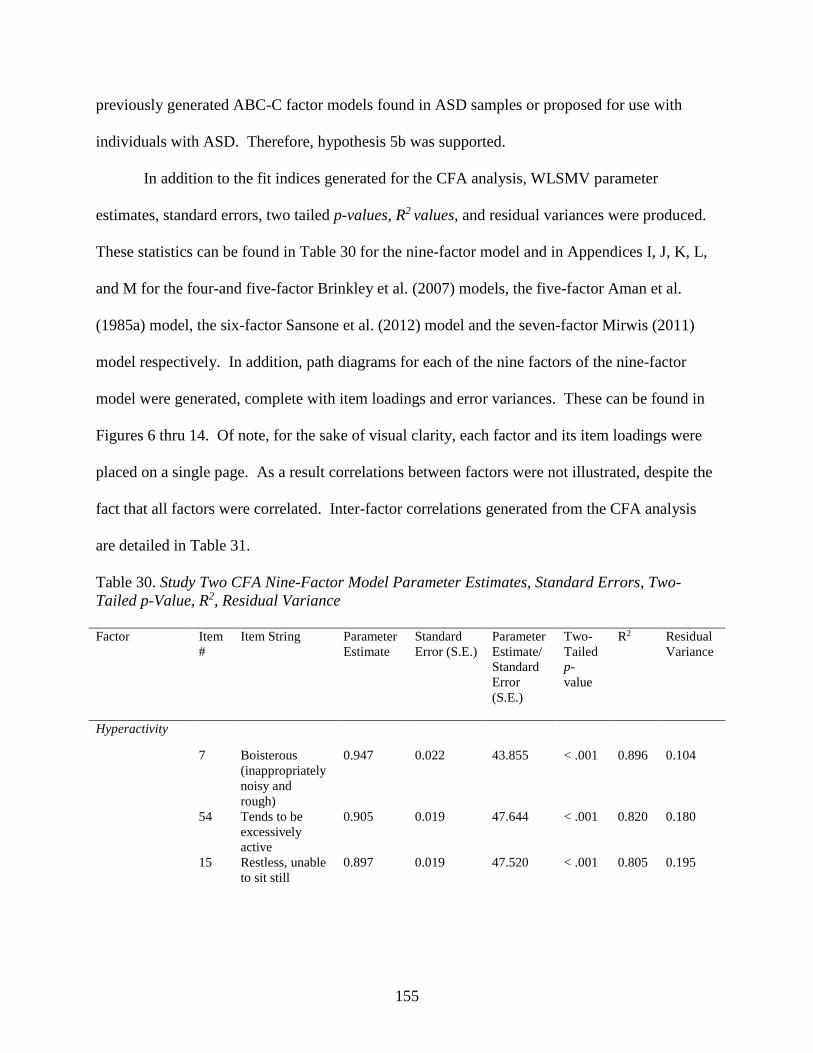
155
previously generated ABC-C factor models found in ASD samples or proposed for use with
individuals with ASD. Therefore, hypothesis 5b was supported.
In addition to the fit indices generated for the CFA analysis, WLSMV parameter
estimates, standard errors, two tailed p-values, R2 values, and residual variances were produced.
These statistics can be found in Table 30 for the nine-factor model and in Appendices I, J, K, L,
and M for the four-and five-factor Brinkley et al. (2007) models, the five-factor Aman et al.
(1985a) model, the six-factor Sansone et al. (2012) model and the seven-factor Mirwis (2011)
model respectively. In addition, path diagrams for each of the nine factors of the nine-factor
model were generated, complete with item loadings and error variances. These can be found in
Figures 6 thru 14. Of note, for the sake of visual clarity, each factor and its item loadings were
placed on a single page. As a result correlations between factors were not illustrated, despite the
fact that all factors were correlated. Inter-factor correlations generated from the CFA analysis
are detailed in Table 31.
Table 30. Study Two CFA Nine-Factor Model Parameter Estimates, Standard Errors, Two-
Tailed p-Value, R2, Residual Variance
Factor Item
#
Item String Parameter
Estimate
Standard
Error (S.E.)
Parameter
Estimate/
Standard
Error
(S.E.)
Two-
Tailed
p-
value
R2 Residual
Variance
Hyperactivity
7 Boisterous
(inappropriately
noisy and
rough)
0.947 0.022 43.855 < .001 0.896 0.104
54 Tends to be
excessively
active
0.905 0.019 47.644 < .001 0.820 0.180
15 Restless, unable
to sit still
0.897 0.019 47.520 < .001 0.805 0.195

156
Table 30 (cont’d)
38 Does not stay in
seat (e.g.,
during lesson or
training periods,
meals, etc.)
0.897 0.022 40.064 < .001 0.804 0.196
48 Constantly runs
or jumps around
the room
0.885 0.025 35.392 < .001 0.784 0.216
39 Will not sit still
for any length
of time
0.875 0.026 33.996 < .001 0.766 0.234
1 Excessively
active at home,
school, work, or
elsewhere
0.867 0.023 38.121 < .001 0.751 0.249
13 Impulsive (acts
without
thinking)
0.864 0.030 29.201 < .001 0.747 0.253
Stereotypic
Behavior
17 Odd, bizarre in
behavior
0.965 0.030 32.338 < .001 0.931 0.069
11 Stereotyped
behavior;
abnormal,
repetitive
movements
0.929 0.018 52.640 < .001 0.863 0.137
6 Meaningless,
recurring body
movements
0.915 0.018 51.175 < .001 0.837 0.163
35 Repetitive hand,
body, or head
movements
0.868 0.021 41.203 < .001 0.754 0.246
27 Moves or rolls
head back and
forth
repetitively
0.814 0.047 17.490 < .001 0.663 0.337
45 Waves or
shakes the
extremities
repeatedly
0.811 0.033 24.799 < .001 0.657 0.343
49 Rocks body
back and forth
repeatedly
0.770 0.047 16.552 < .001 0.594 0.406
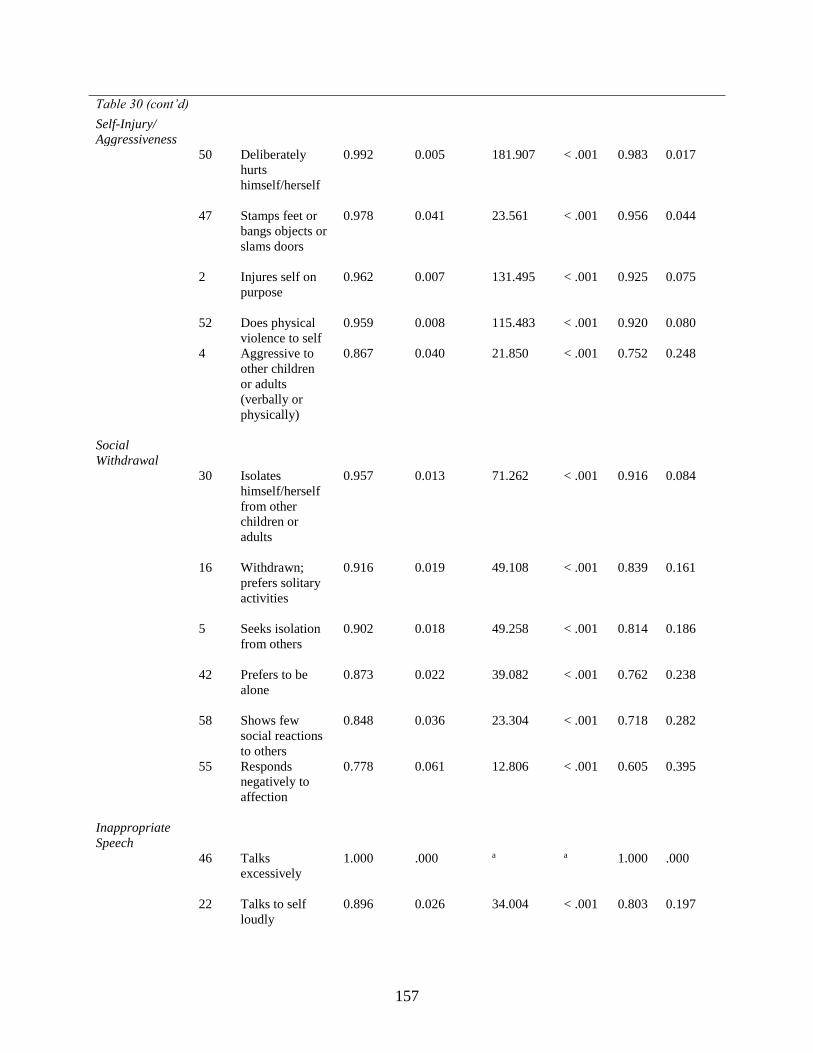
157
Table 30 (cont’d)
Self-Injury/
Aggressiveness
50 Deliberately
hurts
himself/herself
0.992 0.005 181.907 < .001 0.983 0.017
47 Stamps feet or
bangs objects or
slams doors
0.978 0.041 23.561 < .001 0.956 0.044
2 Injures self on
purpose
0.962 0.007 131.495 < .001 0.925 0.075
52 Does physical
violence to self
0.959 0.008 115.483 < .001 0.920 0.080
4 Aggressive to
other children
or adults
(verbally or
physically)
0.867 0.040 21.850 < .001 0.752 0.248
Social
Withdrawal
30 Isolates
himself/herself
from other
children or
adults
0.957 0.013 71.262 < .001 0.916 0.084
16 Withdrawn;
prefers solitary
activities
0.916 0.019 49.108 < .001 0.839 0.161
5 Seeks isolation
from others
0.902 0.018 49.258 < .001 0.814 0.186
42 Prefers to be
alone
0.873 0.022 39.082 < .001 0.762 0.238
58 Shows few
social reactions
to others
0.848 0.036 23.304 < .001 0.718 0.282
55 Responds
negatively to
affection
0.778 0.061 12.806 < .001 0.605 0.395
Inappropriate
Speech
46 Talks
excessively
1.000 .000 a a 1.000 .000
22 Talks to self
loudly
0.896 0.026 34.004 < .001 0.803 0.197

158
Table 30 (cont’d)
33 Repeats a word
or phrase over
and over
0.831 0.053 15.772 < .001 0.690 0.310
9 Repetitive
speech
0.705 0.056 12.663 < .001 0.497 0.503
Lethargy
12 Preoccupied;
stares into space
0.868 0.038 22.587 < .001 0.753 0.247
32 Sits or stands in
one position for
a long time
0.816 0.042 19.536 < .001 0.666 0.334
20 Fixed facial
expression;
lacks emotional
responsiveness
0.809 0.043 18.829 < .001 0.654 0.346
25 Depressed
mood
0.729 0.062 11.685 < .001 0.532 0.468
53 Inactive, never
moves
spontaneously
0.700 0.067 10.488 < .001 0.489 0.511
23 Does nothing
but sit and
watch others
0.609 0.062 9.905 < .001 0.371 0.629
3 Listless,
sluggish,
inactive
0.537 0.066 8.106 < .001 0.288 0.712
Irritability/
Tantrums
10 Temper
tantrums /
outbursts
0.921 0.016 57.968 < .001 0.849 0.151
36 Mood changes
quickly
0.908 0.022 41.164 < .001 0.825 0.175
19 Yells at
inappropriate
times
0.893 0.021 43.042 < .001 0.797 0.203
57 Has temper
outbursts or
tantrums when
he/she does not
get own way
0.889 0.020 44.941 < .001 0.790 0.210

159
Table 30 (cont’d)
41 Cries and
screams
inappropriately
0.876 0.024 36.108 < .001 0.768 0.232
8 Screams
inappropriately
0.873 0.023 38.469 < .001 0.762 0.238
29 Demands must
be met
immediately
0.871 0.024 35.669 < .001 0.759 0.241
14 Irritable and
whiny
0.828 0.028 29.571 < .001 0.685 0.315
34 Cries over
minor
annoyances and
hurts
0.731 0.038 19.250 < .001 0.535 0.465
Noncompliance
56 Deliberately
ignores
directions
0.887 0.028 31.326 < .001 0.786 0.214
51 Pays no
attention when
spoken to
0.879 0.020 43.699 < .001 0.772 0.228
28 Does not pay
attention to
instructions
0.873 0.024 36.542 < .001 0.761 0.239
37 Unresponsive to
structured
activities (does
not react)
0.855 0.031 27.824 < .001 0.731 0.269
40 Is difficult to
reach, contact,
or get through
to
0.815 0.033 24.777 < .001 0.665 0.335
43 Does not try to
communicate by
words or
gestures
0.764 0.044 17.506 < .001 0.583 0.417
44 Easily
distractible
0.734 0.040 18.580 < .001 0.539 0.461
Oppositionality
24 Uncooperative
0.918 0.016 56.586 < .001 0.843 0.157

160
Table 30 (cont’d)
18 Disobedient;
difficult to
control
0.909 0.018 50.521 < .001 0.826 0.174
31 Disrupts group
activities
0.880 0.019 46.179 < .001 0.774 0.226
21 Disturbs others
0.837 0.026 32.175 < .001 0.700 0.300
26 Resists any
form of physical
contact
0.687 0.053 13.085 < .001 0.472 0.528
a Indicates a factor loading fixed to 1.0 because of a near zero, negative residual.

161
Figure 6. Path diagram of the Hyperactivity factor from the nine-factor model with factor
loadings and residuals (i.e., random error and unique variation)

162
Figure 7. Path diagram of the Stereotypic Behavior factor from the nine-factor model with factor
loadings and residuals (i.e., random error and unique variation)
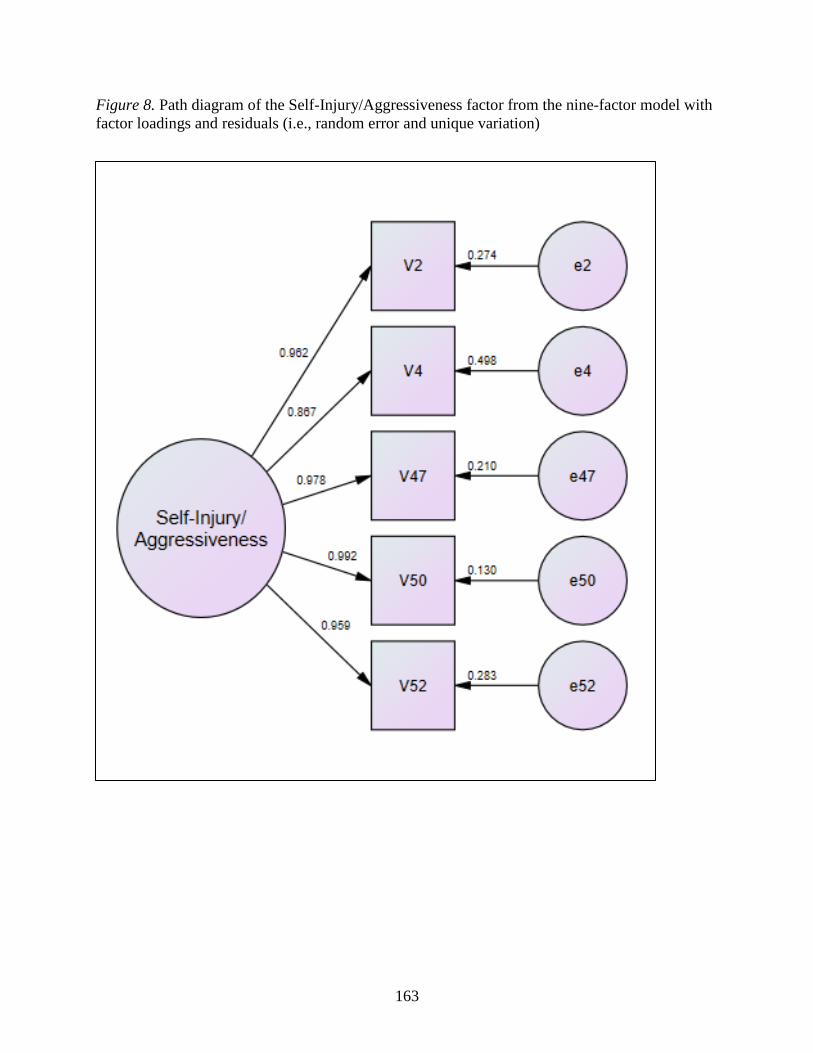
163
Figure 8. Path diagram of the Self-Injury/Aggressiveness factor from the nine-factor model with
factor loadings and residuals (i.e., random error and unique variation)
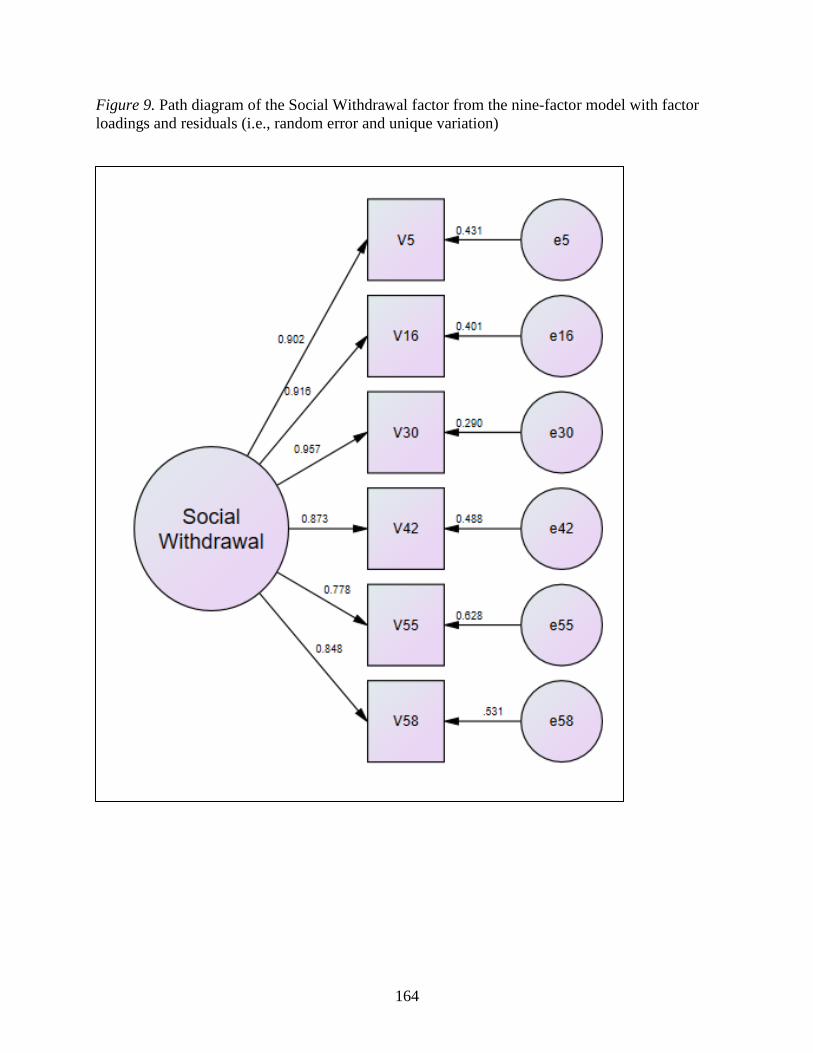
164
Figure 9. Path diagram of the Social Withdrawal factor from the nine-factor model with factor
loadings and residuals (i.e., random error and unique variation)
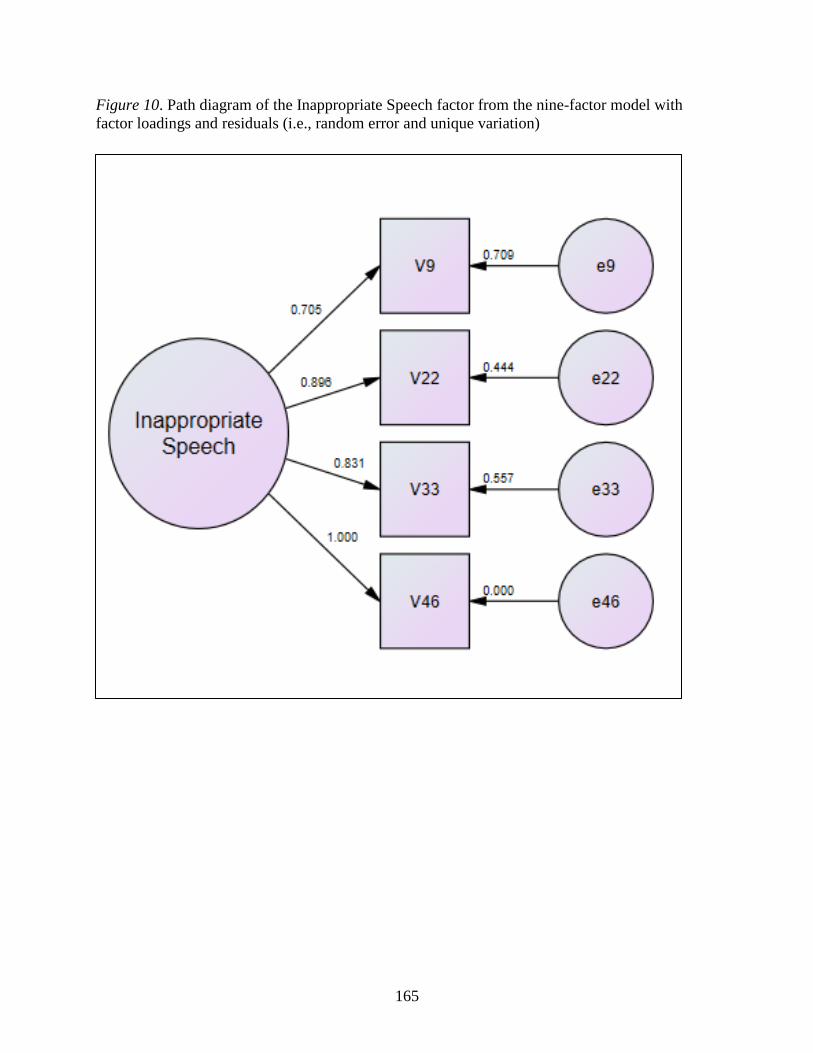
165
Figure 10. Path diagram of the Inappropriate Speech factor from the nine-factor model with
factor loadings and residuals (i.e., random error and unique variation)

166
Figure 11. Path diagram of the Lethargy factor from the nine-factor model with factor loadings
and residuals (i.e., random error and unique variation)

167
Figure 12. Path diagram of the Irritability/Tantrums factor from the nine-factor model with
factor loadings and residuals (i.e., random error and unique variation)

168
Figure 13. Path diagram of the Noncompliance factor from the nine-factor model with factor
loadings and residuals (i.e., random error and unique variation)
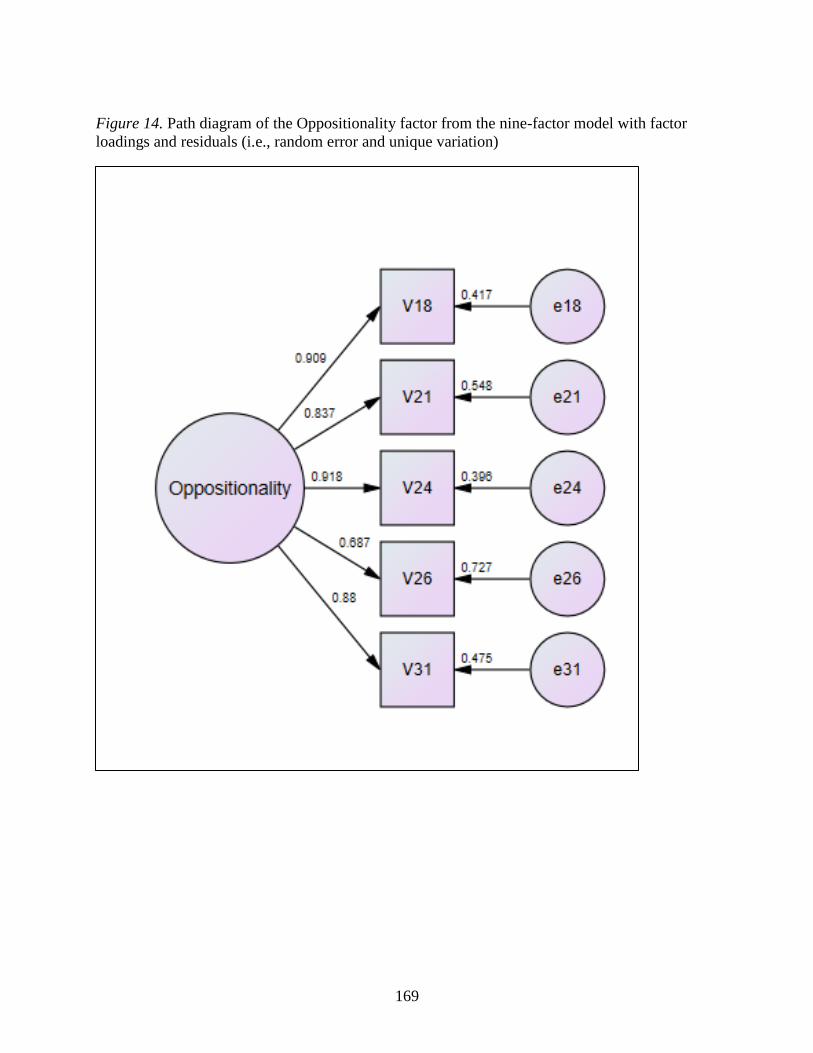
169
Figure 14. Path diagram of the Oppositionality factor from the nine-factor model with factor
loadings and residuals (i.e., random error and unique variation)

170
Table 31. CFA Inter-Factor Correlation Matrix Nine-Factor Solution
Factor
I II III IV V VI VII VIII IX
Fac
tor
I:
Hyperactivity 1.000
II:
Stereotypic Behavior 0.641 1.000
III:
Self-Injury/Aggressiveness 0.581 0.550 1.000
IV:
Social Withdrawal 0.430 0.552 0.360 1.000
V:
Inappropriate Speech 0.381 0.350 0.208 0.362 1.000
VI:
Lethargy 0.364 0.625 0.430 0.778 0.299 1.000
VII:
Irritability/Tantrums 0.749 0.541 0.752 0.533 0.392 0.535 1.000
VIII:
Noncompliance 0.628 0.686 0.513 0.728 0.282 0.848 0.626 1.000
IX:
Oppositionality 0.815 0.622 0.678 0.623 0.450 0.585 0.874 0.777 1.000
Non-identity values that are > 0.30 are presented in bold print.
Inter-factor correlations resulted in all values > .30 except in three cases: factor V
(Inappropriate Speech) with factor III (Self-Injury/Aggressiveness), factor V with factor VI
(Lethargy), and factor VIII (Noncompliance) with factor V. Multiple correlations were also in
the higher range (> .70) including factor VII (Irritability/Tantrums) with factor I (Hyperactivity),
factor IX (Oppositionality) with factor I, factor VII with factor III, factor VI with factor IV
(Social Withdrawal), factor VIII with factor IV, factor VIII with factor VI, factor IX with factor
VII, and factor IX with factor VIII. In addition, various correlations were in the moderate to
high range (i.e., > .50 < .70).
171
CHAPTER 5: DISCUSSION
Overview of Study One and Study Two
The purpose of this study was to examine the factor structure of the Aberrant Behavior
Checklist Community (ABC-C) using an autism spectrum disorder (ASD) sample rated by
special education staff members. The ABC-C potentially fills a major need for ASD researchers
as one of the few instruments capable of assessing treatment effects in individuals with ASD
(Lord et al., 2014). However, the ABC-C was originally designed for the ID population and had
not been first factor analyzed for the ASD population until 2007 (Brinkley et al., 2007). This
occurred years after it had already been used as a primary outcome measure in highly
consequential studies for individuals with ASD (e.g., McCracken et al., 2002; Shea et al., 2004)
and had become the most frequently used outcome instrument for measuring cognitive and
behavioral symptoms in individuals with ASD (Bolte & Diehl, 2013). Since Brinkley et al.
(2007) performed the first factor analyses on the ABC-C with an ASD population, Mirwis (2011)
followed with an exploratory factor analysis (EFA), and Kaat et al. (2014) performed both an
EFA and a confirmatory factor analysis (CFA) of the instrument with ASD samples. Results
from these three studies differed, raising questions regarding the most appropriate factor
structure of the ABC-C for an ASD population. However, a more thorough examination of the
factor analyses by Brinkley et al. (2007), Mirwis (2011), and Kaat et al. (2014) revealed certain
questionable methodological choices and skepticism of their drawn conclusions.
Brinkley et al. (2007) performed two factor analyses (exploratory and confirmatory) with
the ABC-C in an ASD sample with parents as raters. The exploratory analysis resulted in the
authors deciding that both a four-factor solution (Hyperactivity/Noncompliance, Lethargy/Social
Withdrawal, Stereotypy, and Irritability) and a five-factor solution
172
(Hyperactivity/Noncompliance, Lethargy/Social Withdrawal, Stereotypy, Irritability, and
Inappropriate Speech) were potentially viable, concluding that their factor models were similar
to the solutions found in previous factor analyses of the ABC-C with non-ASD samples (e.g., the
Aman et al. [1985a] five-factor model and the four-factor Marshburn and Aman [1992] model).
One of the more unique findings in Brinkley et al. (2007) was the emergence of the three self-
injurious behavior items loading separately on their own factor (named Irritability) in both the
four- and five-factor models. Brinkley et al. (2007) also performed a confirmatory analysis with
their derived five-factor solution though it did not result in an acceptable model fit. Despite the
conclusions that Brinkley et al. (2007) drew from their study, multiple methodological
weaknesses were apparent in their analyses.
The authors used a principal components analysis with an oblique rotation to derive their
factor solution, which was more appropriate for data reduction (i.e., reducing the number of
observed variables in a dataset) rather than identifying latent constructs reflected in the
covariation of the observed variables as in an EFA. The authors also only examined a four- and
five-factor solution, failing to explore other possible solutions. In addition, Brinkley et al. (2007)
only used the Guttman-Kaiser Criterion and the scree test as their factor retention tests rather
than including more robust techniques such as the MAP test (Velicer, 1976) or parallel analysis
(Horn, 1965). Finally, the CFA run by Brinkley et al. (2007) was performed on the same sample
already used for in their principal components analysis, meaning that their EFA and CFA were
not performed on independent samples. In sum, these methodological shortcomings call into
question the robustness of the Brinkley et al. (2007) results.
Mirwis (2011) carried out a psychometric study of the ABC-C and set out to improve
upon the Brinkley et al. (2007) analyses. Mirwis (2011) performed an EFA using the principal

173
axis factoring (PAF) method on the ABC-C with an ASD sample (as well as concurrent validity
analyses) and used special education staff members as raters. This study involved examination
of a wider range of factor solutions (between five and eight factors) compared to Brinkley et al.
(2007) and included a parallel analysis along with the Guttman-Kaiser Criterion and scree test to
determine how many factors to retain. Mirwis (2011) chose a seven-factor solution (Irritability,
Hyperactivity, Withdrawal, Lethargy, Stereotyped Behaviors, Inappropriate Speech, Self-
Injurious Behavior) which saw the Lethargy/Social Withdrawal factor in the Aman and Singh
(1994) five-factor ABC-C model split into two factors and, similarly as in Brinkley et al. (2007),
the emergence of a Self-Injurious Behavior factor. Despite performing a more rigorous analysis
than Brinkley et al. (2007), one major methodological weakness stood out in the Mirwis (2011)
study.
Mirwis (2011) did not use a polychoric correlation matrix (and instead used a Pearson
correlation-matrix) in his EFA, which would be more appropriate for use with the ordinal item
data from the ABC-C. This could have attenuated the strength of the correlations between
variables, which could have impacted the factors and the loadings. It must also be pointed out
that because Mirwis (2011) used special education staff as raters in his study, it is unknown what
effect this difference might have had on his results in comparison to caregiver raters.
Kaat et al. (2014) performed the most recent factor analyses of the ABC-C prior to this
study, including an EFA and a CFA in an ASD sample with parents as raters. Like Mirwis
(2011), Kaat et al. (2014) used PAF in their EFA along with an oblique rotation. However,
unlike both Mirwis (2011) and Brinkley et al. (2007), Kaat et al. (2014) used a polychoric
correlation matrix as input. Kaat et al. (2014) chose a five-factor solution after their EFA
(Irritability, Lethargy/Social Withdrawal, Stereotypic Behavior, Hyperactivity/Noncompliance,

174
and Inappropriate Speech), which was virtually the same as the existing ABC-C five-factor
model (Aman & Singh, 2017). The authors also performed a CFA with an independent sample.
They examined the original five-factor solution from the ABC test authors (Aman et al., 1985a)
as well as the four-factor solution with an ID sample from Brown et al. (2002), the four- and
five-factor solutions from Brinkley et al. (2007), and the six-factor solution found in a Fragile X
sample from Sansone et al. (2012). Results from the CFAs did not lead to any model clearly
distinguishing itself as fitting well or as the best fitting model. As a result, Kaat et al. (2014)
concluded that the original five-factor model from Aman et al. (1985a)—the same model, except
for a few item word changes and factor name changes as the ABC-C (Aman & Singh, 1994,
2017)—should be conservatively retained in the absence of evidence for a better model for use
with an ASD sample. However, a detailed examination of their study revealed some key
methodological weaknesses.
Kaat et al. (2014) only used the Guttman Kaiser Criterion, the scree test, and clinical
meaningfulness to determine their factor solution, leaving out some of the more powerful factor
retention tests like parallel analysis and the MAP test. This omission could have led Kaat et al.
(2014) to look at a more narrow range of potential factor solutions— a four-, five-, and six-factor
model—before they decided upon their chosen five-factor solution. Finally, Kaat et al. (2014)
decided on the five-factor solution for the ASD population by taking a “historical and pragmatic
perspective” (p. 1107) rather than potentially challenge or try and further improve upon the
original model. Despite the inclusion of the CFA, which did not provide greater clarity on the
most appropriate factor structure for the ABC-C with an ASD population, the Kaat et al. (2014)
study seemed to raise even more questions, further increasing the need for a more thorough
analysis of the ABC-C in ASD samples.

175
Thus, the current study attempted to rectify some of the various weaknesses in the
previous three factor analyses of the ABC-C with ASD samples. The intention was to better
explore possible factor structures for the ABC-C in an ASD sample and to potentially determine
the most appropriate factor structure(s) for the scale in the ASD population. To achieve these
ends, this research study was broken up into two different studies: study one, and study two.
Study one included performing an EFA on the ABC-C with an ASD sample with special
education staff as raters. It was carried out in order to contribute a rigorous study to the limited
number of existing studies in the literature. This involved performing a thorough exploratory
factor analytic process. This included using the most effective available methods to guide the
factor retention process, and relying upon the results and underlying theoretical understanding of
the ASD population rather than precedent to determine the most appropriate factor structure in
terms of interpretability, explanatory power, meaningful distinctions, and potential clinical
utility.
Study two involved a CFA on the ABC-C with an ASD sample as a way to determine
both the absolute and relative fit of the model generated in study one and compare it to the
existing ABC-C factor analytic models in the literature for the ASD population. It is noteworthy
that unlike prior CFAs for the ABC-C with an ASD sample, the CFA in study two included the
model derived in the dissertation by Mirwis (2011) and utilized fit indices that enabled a direct
comparison between non-nested models. In all, this study was intended to fill in some major
gaps in the existing factor analytic literature of the ABC-C for the ASD population and more
thoroughly explore the instrument’s internal structure validity when rated by special education
staff.
176
The discussion of the findings in study one and study two will be carried out separately.
Summary and interpretation sections will be provided. Limitations, implications, and future
research implications for each study will also be addressed.
Summary and Interpretation of Findings for Study One
Research question 1 and hypothesis 1. Research question 1 focused on the number of
potential interpretable ABC-C factors that would be considered for retention after the EFA was
performed. Four factor retention methods were used: the Guttman-Kaiser Criterion, the scree
test, parallel analysis, and Velicer’s MAP test. Results from the Guttman-Kaiser Criterion
suggested eight factors should be retained, while results from the scree test suggested three or
five factors should be retained. Plus or minus two factors above and below the parallel analysis
and MAP test were considered (as well as the results of the scree test and the Guttman-Kaiser
Criterion) resulting in a range of between three and 11 factors that were ultimately assessed for
retention. It was hypothesized that between four and seven factors would be available for
retention. Given the three- to 11-factor solution range, this hypothesis was not supported.
The hypothesis that a range between four and seven possible factor solutions would be
considered for retention was based solely on the existing literature of the ABC-C with an ASD
sample (Brinkley et al., 2007; Kaat et al., 2014; Mirwis, 2011). Factor solutions from the three
factor analyses of the ABC-C with an ASD sample have ranged between four and seven factors.
Results from research question 1 thus went beyond this range, going below and above what was
hypothesized. Having a greater number of possible factor solutions than had been considered in
the previous literature thus opened up the possibility that a unique factor solution model could be
generated from the study one EFA.
177
It must be acknowledged, as Osborne (2014) points out, no factor retention test is perfect.
This resulted in the decision to use multiple retention tests as criteria as well as to explore a
range of factors below and above the derived factor test solutions. This was done to ensure that
the final factor solution that would ultimately be decided on in study one would be chosen
through a process that was highly rigorous. Ultimately, the decision to explore a wide-range of
possible solutions was data driven.
The range of factor solutions considered in Mirwis (2011) most closely aligns with the
results found for research question 1 of the present study. Mirwis (2011) examined a range of
four different solutions, consisting of between five and eight factors, and used three of the same
factor retention decision tests for guidance that were used in this study: the Guttman Kaiser
Criterion, the scree test, and parallel analysis. The parallel analysis in Mirwis (2011) suggested
seven factors for retention, while in this study it designated six factors. Thus, the parallel
analysis in Mirwis (2011) and in this study both suggested factor solutions for an ASD sample
greater than the current author version of the ABC-C and led to a larger range of factor solutions
to consider. Parallel analysis (and the MAP test for that matter) is considered a more accurate
and powerful factor retention decision test (e.g., Hayton, Allen, & Scarpello, 2004). Both the
parallel analysis and MAP tests in the present study—as well as the parallel analysis results in
Mirwis (2011)—suggested the presence of more than five factors, providing reasonably
consistent evidence than a viable factor structure within the ASD population likely consists of
more than the five factors proposed by the authors of the ABC-C.
Unlike the EFA in this study, Kaat et al. (2014) only used the scree test, the Guttman
Kaiser Criterion, and clinical meaningfulness to guide their factor retention decisions, while
Brinkley et al (2007) only used the scree test and the Guttman Kaiser Criterion. As a result, Kaat
178
et al. (2014) only looked at possible solutions ranging between four and six factors while
Brinkley et al. (2007) looked only at four- and five-factor solutions. Kaat et al. (2014) reported
that the scree plot in their study indicated that five factors should be retained while the Guttman
Kaiser Criterion actually showed 11 eigenvalues > 1. Kaat et al. (2014) did not explain why they
specifically ignored the Guttman Kaiser Criterion, which could have led to a much broader range
of solutions to consider, like in the present study. Unfortunately, Brinkley et al. (2007) did not
report the results of their factor retention tests. Moreover, the decision by Kaat et al. (2014) and
Brinkley et al. (2007) to not use either parallel analysis or the MAP test (or both) quite possibly
limited the number of solutions that they considered and potentially, unknowingly, lead them to
look only at solutions with too few factors. Similarly, Mirwis (2011) did not make use of the
MAP test either, which may have resulted in the examination of a more limited range of options.
Overall, choosing to use four factor retention tests in this study led to more available
information and the examination of a broader range of possible solutions for interpretability than
any of the previous EFAs of the ABC-C with an ASD sample. However, had the number of
possible solutions for consideration been greater, or more limited, or even the same as Brinkley
et al. (2007), Kaat et al. (2014), or Mirwis (2011) was not the point. Rather, the fact that the
present study undertook a comprehensive, data-driven, exploratory process—one not limited or
biased by previous findings—means that there should be fewer questions regarding the rigor of
the analytic method with regard to the factor retention process used in this study and more focus
placed on its outcomes.
Research question 2 and hypotheses 2a, 2b, and 2c. Research question 2 built on of
the results from research question 1 and focused on which of the derived factor solutions for the
ABC-C with an ASD sample would be the most interpretable and thereby retained. Pattern

179
matrices generated following oblique rotation enabled factor models to be compared.
Consideration of solutions between three and eleven factors occurred resulting in two standout
options in terms of interpretability: the six-factor solution and the nine-factor solution. The six-
factor solution had been suggested by the parallel analysis and the nine-factor solution had been
suggested by the MAP test. Two researchers independently considered all factor solutions and
two additional researchers were included to consider the six- and nine-factor solutions.
Consensus between three of the four researchers was reached that the nine-factor solution was
the most interpretable. It was hypothesized that a) at least four-factors would likely be retained,
b) that an Inappropriate Speech factor would emerge, and c) a Self-Injurious Behavior factor
would also emerge. Hypotheses 2a and 2b were both supported. Hypothesis 2c was not
supported because a Self-Injurious Behavior factor did not cleanly emerge with only the three
self-injurious behavior items loading on the factor. Instead, two other items loaded as well,
which broadened the scope of the factor in terms of aggressiveness toward others and objects.
The decision to choose the nine-factor solution was both data- and theory-driven. It was
the solution suggested by the MAP test and it appeared to aptly structure the data in the most
refined and clinically meaningful way. Narrowed constructs in the nine-factor structure resulted
in fewer items loading on the factors, ranging from the four-item Inappropriate Speech factor to
the nine-item Irritability/Tantrums factor. Additionally, the nine-factor structure seemed to have
streamlined and separately distributed previously discovered constructs in the other EFAs of the
ABC-C.
Consideration of clinical meaningfulness was key in selecting the nine-factor solution
over the six-factor solution. Two fundamental questions were contemplated in the decision
making: a) whether the constructs that emerged in both factor solutions were clearly defined and
180
consistent with core and associated behaviors of individuals with ASD and b) whether factors
represented clinically distinct constructs that could be specifically targeted for intervention or
enhance understanding through important distinctions. Perhaps the most significant problem
with the six-factor solution was that it emerged with a Self-Injury/Tantrums/Irritability factor.
The three self-injurious behavior items all loaded > .91, clearly defining the factor; however, the
inclusion of the 10 other items making up the other constructs, tantrums and irritability, made the
factor problematic with regard to clinical clarity and utility. Simply put, an individual who
performs self-injurious behaviors may not have tantrum behavior nor might their self-injurious
behavior be specifically resulting from irritability. As Minshawi et al. (2014) argued, self-
injurious behavior can potentially occur for biomedical, genetic, or even other behavioral
reasons. An individual who is having a tantrum or showing irritable behaviors may not be
engaging in any self-injurious behavior. Further, a specific intervention targeting tantrum
behavior (e.g., Matson, 2009) might be different than one targeting self-injurious behavior (e.g.,
Matson & LoVullo, 2008). As such, a factor too conceptually dense was deemed problematic
and not clearly useful in a research or clinical context. In particular, with regard to individuals in
the ASD population, self-injurious behavior occurs about 30% more in individuals with ASD
than in individuals with other developmental disabilities (Soke et al., 2016). Thus, it is important
when working with individuals from the ASD population to be able to make a clear distinction
between self-.injurious behavior and other behaviors (e.g., irritability). In contrast, the nine-
factor solution resulted in more narrowed constructs and split the self-injurious and irritable
behaviors between two different factors (Self-Injury/Aggressiveness and Irritability/Tantrums),
allowing for a more conceptually distinct structure.

181
The other seven factors in the nine-factor solution all represent independent behavioral
constructs that are either core behaviors (Social Withdrawal, Stereotypic Behavior) or associated
features (Hyperactivity, Inappropriate Speech, Lethargy, Noncompliance, and Oppositionality)
of individuals with ASD. Despite the fact that a more expansive factor structure emerged in the
chosen model from study one, the solution was conceptually similar to, and broadly inclusive of
many of the constructs found within the other existing hypothesized EFA models. Only the
Oppositionality factor emerged as a unique construct.
The Inappropriate Speech and Stereotypic Behavior factors in the nine-factor model have
been found across all of the EFA models for the ABC-C with an ASD population (except for the
four-factor Brinkley et al. [2007] model which did not include Inappropriate Speech). Aside
from one extra item in the Stereotypy factor and Inappropriate Speech factor in the five-factor
model in Brinkley et al. (2007), both of these factors loaded with the same items as the nine-
factor solution. Similarly in Kaat et al. (2014), all but one of the items in their Stereotypic
Behavior factor was similar to the same factor in the nine-factor solution. In Mirwis (2011), the
Inappropriate Speech factor contained the same items as the nine-factor solution in this study.
All of the items found in the Stereotyped Behaviors factor in Mirwis (2011) were found in the
Stereotypic Behavior factor in the nine-factor solution. Thus, results from the current study and
in the existing studies seem to confirm that the Inappropriate Speech and Stereotyped behavior
factors are relatively robust in the ABC-C and have consistently appeared in virtually all models
of the ABC-C with an ASD population.
The Mirwis (2011) seven-factor model most closely aligns with the nine-factor solution
from this study. The main conceptual difference between Mirwis (2011) and the author version
of the ABC-C (Aman & Singh, 1994) was that the Mirwis (2011) model separated the

182
Withdrawal and Lethargy constructs into two different factors and it distinguished a three-item
Self-Injurious Behavior factor from the otherwise intact Irritability factor. (Of note, in 2017,
Aman and Singh [2017] removed the Lethargy name from the previously named Lethargy/
Social Withdrawal factor. The item loadings did not change and they did not explain the
reasoning behind the name change). The nine-factor model in this study largely follows and
expands upon the Mirwis (2011) model. As in Mirwis (2011), the nine-factor model maintained
independent factor constructs for hyperactivity, withdrawal (named Social Withdrawal in this
study) and lethargy (as well as the Stereotyped Behavior and Inappropriate Speech factors
discussed previously). Mirwis (2011) also maintained a separate Self-Injurious Behavior factor
in his study, and although the same three items that made up that factor had the highest loadings
in the Self-Injury/Aggressiveness factor in the nine-factor solution, two other items loaded with
them as well. All of the items in the Irritability/Tantrums factor in the nine-factor model are
found in the Irritability factor in Mirwis (2011) and all of the items in the Oppositionality factor
in the nine-factor solution are also found in the Irritability factor in Mirwis (2011). In essence,
the nine-factor model maintained six of the factors in Mirwis (2011), split the Irritability factor
into two different factors, and added a Noncompliance factor, which included two items from the
Mirwis (2011) Lethargy factor (43 and 37), one item from the Mirwis (2011) Withdrawal factor
(56) and four items from the Mirwis (2011) Hyperactivity factor (28, 40, 44, and 51). The nine-
factor model thus streamlined existing factor constructs in Mirwis (2011) and made some
narrower meaningful distinctions.
It is important to note that a seven-factor model similar to the Mirwis (2011) model was
considered for retention in study one as well. The structure was interpretable but a number of
problematic item cross-loadings were present in the solution. Ultimately, the evidence seemed to

183
show that additional interpretable and meaningful factors were present in the data and that the
seven-factor model was likely insufficient.
The nine-factor model generated in study one greatly expanded upon the four- and five-
factor structures in the Brinkley et al. (2007) study and the five-factor model from the Kaat et al.
(2014) study of the ABC-C for an ASD population. Unlike the rationale used in Kaat et al.
(2014), historical precedent of the previous EFAs for the ABC-C did not influence the final
factor solution decision in this study; rather, the choice was data-driven and based on clinical
meaningfulness with regard to the ASD population. Both a four- and five-factor solution, like in
Brinkley et al. (2007) and Kaat et al. (2014), were also considered for this study. However,
neither the four- nor the five-factor solution was suggested by the parallel analysis or the MAP
test, although the five-factor solution was suggested by the scree test. The four-factor solution
was rejected because some of its factors were considered too conceptually difficult to interpret.
The factors combined multiple constructs that made them difficult to clearly define, rendering
them clinically less meaningful. The five-factor solution maintained multiple crossloadings
across all factors and contained two factors (Social Withdrawal/Noncompliance and Self
Injury/Irritability) that appeared overly conceptually crowded. Rejecting the four- and five-
factor models in favor of the nine-factor model also included the decision to select a more
complex model compared to a more parsimonious solution. Underfactoring can lead to difficulty
with factor interpretation, while overfactoring can lead to factors with little conceptual
significance (Fabrigar et al., 1999). As Fabrigar et al. (1999) explain it is often safer to
overfactor, rather than underfactor—although it is best to do neither.
Discovering and then selecting the nine-factor model was not expected. It was not found
in the existing literature nor was it hypothesized in this study. Yet, it must be further highlighted
184
that implementing a rigorous factor-retention process, which included consideration of a larger
range of factor solutions, opened up the potential for this new solution. Although more complex
than the other models of the ABC-C for an ASD population, the nine-factor model maintains
factors that are more conceptually streamlined and clinically meaningful. This expanded model
perhaps highlights potential issues with some of the more conceptually bloated factors (e.g.,
Irritability, Social Withdrawal) from the five-factor models (i.e., Brinkley et al., 2007; Kaat et al.
2014), and revealed a previously unrecognized, somewhat distinct latent construct:
Oppositionality. Determination of whether this new model ultimately improves upon the
existing models in the literature is a more complicated question. Analyzing inter-factor
correlations (addressed in research question 3) helps to assess whether derived factor constructs
are more or less similar. Determining the model’s level of absolute and relative fit (addressed in
study two) was key to assessing whether or not the model is ultimately worthy of further analysis
or if it exists as a mere statistical outlier from a broad, exploratory process.
Research question 3 and hypothesis 3. Research question 3 focused on analyzing the
strength of the inter-factor correlations in the nine-factor structure. It was hypothesized that
there would be correlations > .30 among some of the factors. Results showed that eight of the
nine factors maintained substantive correlations with at least one other factor, ranging from .02
to .45. Only the Inappropriate Speech factor failed to generate a substantive correlation with
another factor. Thus, hypothesis 3 was fully supported. Internal consistency reliability estimates
were also calculated using both ordinal and Cronbach’s alpha. Ordinal alpha estimates ranged
from .889 to .951 and Cronbach’s alpha estimates ranged from .816 to .931.
Inter-factor correlations supported an oblique structure. Correlations in the nine-factor
solution ranged from .02 (Lethargy and Inappropriate Speech), where there is virtually no

185
relationship to .45 (Lethargy and Social Withdrawal), where there is a moderate relationship.
None of the correlations were high enough (i.e., > .80) suggesting the possibility of redundant
factors measuring the same constructs (Brown, 2006).
Relations between factors should be more or less correlated depending upon their
conceptual relations; therefore, factor correlations on the inter-factor correlation matrix offer the
opportunity to analyze whether chosen factor constructs make logical sense. Certain factor
correlations in particular are worth highlighting. The Inappropriate Speech factor had the lowest
correlations with all other factors (i.e., it did not correlate with any factor > .30). This seems to
make conceptual sense as the particular types of aberrant speech represented in the factor (e.g.,
repetitive speech, talking loudly), although consistent within the spectrum of possible behaviors
found in ASD, are not necessarily behaviors themselves that are core to the symptoms of ASD
(APA, 2013). Therefore these behaviors are not consistent across all individual presentations
and behaviors of individuals with ASD. On the other hand, the Hyperactivity factor had the most
substantive relationships in the matrix, including with Stereotypic Behavior (.43), Self-
Injury/Aggressiveness (.41), Irritability/Tantrums (.35), Noncompliance (.38), and
Oppositionality (.35). Rates of comorbidity of ADHD and ASD have been found to be between
20% and 70% (Matson et al., 2013), and a study by Matson, Wilkins, and Macken (2008) found
that nearly 94% of individuals with ASD exhibited challenging behaviors (e.g., disruptive
behaviors, stereotypies, aggression, and self-injurious behaviors) with 63% exhibiting some
externalizing challenging behaviors. Thus the strength of the relations between the
Hyperactivity factor and the other aforementioned factors seem to be relatively conceptually
appropriate for an ASD sample.

186
The two factors in this model which have not appeared as independent factors in any of
the other EFAs involving the ASD population, Noncompliance and Oppositionality, are also
worth further analyzing. The Noncompliance factor had substantive correlations with
Hyperactivity (.38) and Stereotypic Behavior (.38), while the Oppositionality factor had
substantive correlations with Hyperactivity (.35), Self-Injury/Aggressiveness (.34) and
Irritability/Tantrums (.30). The strength of these relations would seem to be consistent with the
aforementioned research by Matson et al. (2008) and Matson et al. (2013). The Noncompliance
factor also had substantive relations with the factors representing more internalizing behaviors
including Social Withdrawal (.43) and Lethargy (.31). This also seems to be conceptually viable
as Magnuson and Constantino (2011) argue that individuals with ASD are highly susceptible to
mood issues such as depression and anxiety given difficulties with social-communication and
can manifest in behaviors such as hyperactivity, self-injurious behavior, aggression, mood
lability, and catatonia. Additionally, O’Nions et al. (2018) explained, demand avoidant behavior
in ASD can often result in escape behaviors. Furthermore, the Noncompliance factor had the
weakest correlation with the Inappropriate Speech factor (.19).
The Oppositionality factor also had a weak correlation with Inappropriate Speech (.19).
Both of these weak correlations are consistent with the Inappropriate Speech factor across the
other seven factors in the model as well. The weakest correlation associated with the
Oppositionality factor was with the Stereotypic Behavior factor (.12). Cunningham and
Schreibman (2008) argue that stereotypic behavior requires a functional interpretation, and a
blanket assumption of its function should not be assumed. As such, the weak relation between
the Oppositionality factor and the Stereotypic Behavior factors in this study could thus possibly
be interpreted as these constructs being perceived as functionally independent of each other.

187
It is challenging to make many direct comparisons with the inter-factor correlations found
in both Kaat et al. (2014) and Mirwis (2011) because the factor structure of the nine-factor model
is more complex than both of the models in their studies. However, certain similar patterns can
be discerned. As expected, correlations were much higher in Kaat et al. (2014) in both their
calibration and validation samples (.36 to .76 in the calibration sample, and .36 to .76 in the
validation sample). This is potentially because factor constructs are much more conceptually
dense compared to the nine-factor structure in this study. Similar to the nine-factor model
however, the Inappropriate Speech factor in Kaat et al. (2014) has the lowest correlations with
the other four factors, ranging from .36 to .54 in the calibration sample and .36 to .54 in the
validation sample. The highest inter-factor correlation in both the calibration and validation
sample in Kaat et al. (2014) is .76, between the Irritability and the Hyperactivity/Noncompliance
factors. This high correlation is potentially a sign that these factors are conceptually overlapping
and might possibly benefit from being broken up into more factors, like in the nine-factor model.
The inter-factor correlations in Mirwis (2011) are more similar compared to the nine-
factor model, ranging from .05 to .58. Like in the nine-factor model and in Kaat et al. (2014),
the lowest correlations across the factors are associated with the Inappropriate Speech factor.
The highest correlation in the seven-factor Mirwis (2011) model was between the Lethargy and
Withdrawal factors (.58), which is also the highest correlation in the nine-factor solution (.45).
The second highest correlation in Mirwis (2011) between the Hyperactivity factor and the
Irritability factor (.55) is also the second highest correlation in the nine-factor model (.43) and, as
mentioned previously, also the highest correlation in the Kaat et al. (2014) model.
Overall, there are certainly some similarities and differences between the inter-factor
correlations in Mirwis (2011), Kaat et al. (2014), and the nine-factor model in this study.
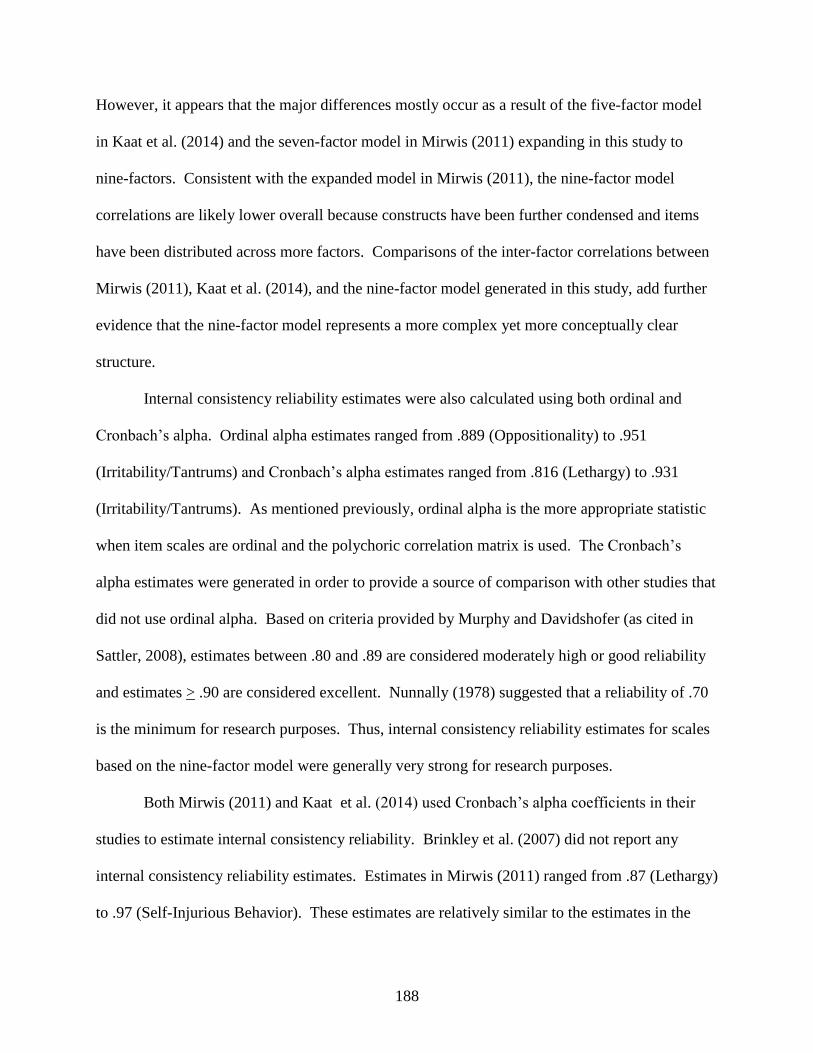
188
However, it appears that the major differences mostly occur as a result of the five-factor model
in Kaat et al. (2014) and the seven-factor model in Mirwis (2011) expanding in this study to
nine-factors. Consistent with the expanded model in Mirwis (2011), the nine-factor model
correlations are likely lower overall because constructs have been further condensed and items
have been distributed across more factors. Comparisons of the inter-factor correlations between
Mirwis (2011), Kaat et al. (2014), and the nine-factor model generated in this study, add further
evidence that the nine-factor model represents a more complex yet more conceptually clear
structure.
Internal consistency reliability estimates were also calculated using both ordinal and
Cronbach’s alpha. Ordinal alpha estimates ranged from .889 (Oppositionality) to .951
(Irritability/Tantrums) and Cronbach’s alpha estimates ranged from .816 (Lethargy) to .931
(Irritability/Tantrums). As mentioned previously, ordinal alpha is the more appropriate statistic
when item scales are ordinal and the polychoric correlation matrix is used. The Cronbach’s
alpha estimates were generated in order to provide a source of comparison with other studies that
did not use ordinal alpha. Based on criteria provided by Murphy and Davidshofer (as cited in
Sattler, 2008), estimates between .80 and .89 are considered moderately high or good reliability
and estimates > .90 are considered excellent. Nunnally (1978) suggested that a reliability of .70
is the minimum for research purposes. Thus, internal consistency reliability estimates for scales
based on the nine-factor model were generally very strong for research purposes.
Both Mirwis (2011) and Kaat et al. (2014) used Cronbach’s alpha coefficients in their
studies to estimate internal consistency reliability. Brinkley et al. (2007) did not report any
internal consistency reliability estimates. Estimates in Mirwis (2011) ranged from .87 (Lethargy)
to .97 (Self-Injurious Behavior). These estimates are relatively similar to the estimates in the

189
nine-factor model in this study although the Cronbach’s alpha estimates in Mirwis (2011) are
slightly higher. Estimates in Kaat et al. (2014) ranged from .77 (Inappropriate Speech, in both
the calibration and validation samples) to .94 (Hyperactivity/Noncompliance in the calibration
sample) and .93 (Hyperactivity/Noncompliance in the validation sample). Once again, these
Cronbach alpha estimates are relatively similar to the estimates in the nine-factor model.
Overall, internal consistency estimates in the nine-factor model generated in this study
were relatively similar compared to both Mirwis (2011) and Kaat et al. (2014). As such, it
appears the decision to embrace a model with a greater number of factors (averaging fewer items
per factor) did not substantively attenuate internal consistency reliability estimates. High
internal consistency reliability estimates for all factor-based subscales offer further evidence of
the psychometric viability of the nine-factor model.
Research question 4 and hypothesis 4. Research question 4 was intended to provide a
comparison between the Aman and Singh (2017) five-factor model and the five-factor EFA
solution generated (but not selected) in study one. It was hypothesized that the two models
would closely match. This was determined by qualitatively comparing factor names from both
solutions, contrasting the highest loading items in each factor, and calculating a percentage of
overlapping items between the two solutions. Similar factor names were found in Aman and
Singh (2017; Irritability, Social Withdrawal, Stereotypic Behavior,
Hyperactivity/Noncompliance, and Inappropriate Speech) and in the five-factor model in study
one (Self-Injury/Irritability, Social Withdrawal/Noncompliance, Stereotypic Behavior,
Inappropriate Speech, and Hyperactivity). The top five highest loading items were similar—
though often differing in exact rank across the two different five-factor solutions. A high
percentage of items from Aman and Singh (2017) were found in the similar factors in the five-

190
factor solution in study one. The major difference between the two different models was that the
noncompliance-related items in Aman and Singh (2017) appeared to break off from the
Hyperactivity factor and connect with the Social Withdrawal factor items in the five-factor
solution from study one (named Social Withdrawal/Noncompliance).
Comparing the results from these two factor solutions revealed many similarities between
them. In general, the five-factor structure in Aman and Singh (2017) was relatively intact in
comparison to the five-factor solution from study one. The Inappropriate Speech and the
Stereotypic Behavior factors in both studies contained the same items. This is yet another sign
of the robustness of these two factors in the ABC-C. The movement of the noncompliance-
related items from the Hyperactivity factor in Aman and Singh (2017) to the Social Withdrawal
factor in study one was an interesting change (i.e., Hyperactivity/Noncompliance in Aman and
Singh, 2017, and Social Withdrawal/Noncompliance in the five-factor solution from study one);
although both factors as constituted are conceptually crowded, each containing items that may
allow for further construct or subconstruct distinctions. The Irritability factor in Aman and
Singh (2017) was also very similar to the Self-Injury/Irritability factor in the five-factor solution
in this study (14 out of 15 items were similar). The major difference between them was that the
three self-injury items loaded the highest in the five-factor solution in study one, making it
difficult to avoid including self-injury as part of the factor name (considering its most dominant
loadings). The first self-injury item in the Irritability factor in Aman and Singh (2017) was the
fifth highest loading item in the factor. It thus makes sense that self-injury did not appear as
prominent in defining the factor as it does in this and other studies. That said, it is important to
point out that self-injury items make up the top two items in the Irritability factor in the five-
factor solution in Kaat et al. (2014) and three of its four top items. It is possible that the higher

191
correlations of the self-injurious behavior items in Kaat et al. (2014) are a result of using an ASD
sample in contrast to the ID sample used in the original ABC study (Aman & Singh, 1985a), as
persons with ASD have been shown to exhibit higher rates of self-injurious behavior than in
individuals with ID (Minshawi et al., 2014).
Overall, comparing the five-factor model in Aman and Singh (2017) and the five-factor
solution in study one indicated that the factors and the specific constructs are relatively stable
across the two studies. But, the findings of Mirwis (2011) and the present study raise questions
as to how consistent factor solutions consisting of more than five factors might be across the
samples from different studies. This is a difficult question to answer given that most studies did
not look beyond five or six factors. Though the five factors seem to consistently appear across
studies, what if more factors were consistently available to not just account for more common
variance but also to potentially make more nuanced clinical distinctions? It also raises questions
as to whether using an ASD sample could be a key reason for some of the changes in factor
loadings or whether the ASD population requires a different factor model to capture its item
variation. Thus, the ASD population might require a different factor solution than the one
currently used by Aman and Singh (2017) and perhaps a more complex factor model should be
examined in other populations as well.
Study One Implications
Theoretical. Perhaps the core theoretical question in study one concerns whether or not
the ABC-C requires a different factor structure for use with the ASD population. The three prior
factor analytic studies performed with ASD samples resulted in somewhat different outcomes.
Brinkley et al. (2007) concluded that the five-factor author version of the ABC-C was robust
within the ASD population. However, Brinkley et al. (2007) urged further assessment of the

192
Irritability scale particularly for the ASD population given the presence of the self-injurious
behavior items. Kaat et al. (2014) concluded that the five-factor author version of the ABC-C
was robust for the ASD population and Aman and Singh (2017) reiterated this assertion. On the
other hand, Mirwis (2011) questioned whether the ASD population does in fact yield a more
complex structure after he found seven meaningful factors in his EFA. Results from study one
seem to point to three different possibilities with regard to whether or not the factor structure of
the ABC-C may differ for individuals with ASD.
The first possibility is that the nine-factor solution chosen in study one provides evidence
that the ABC-C requires a different factor structure for individuals with ASD. No prior EFA
with the ABC-C with an ASD population had even considered a nine-factor solution. The
factors generated from the EFA are all made up of core and associated features of ASD. For
example, the Self-Injury/Aggressiveness factor, similar to the Self-Injury factor as found in
Mirwis (2011), primarily represents a more common behavior (self-injury) in individuals with
ASD than individuals with ID (Soke et al., 2016). Social Withdrawal, which became a
standalone factor in the nine-factor solution in study one (which split from the Lethargy
construct) is a common trait of individuals with ASD who struggle with social interactions
(APA, 2013). (To note, Aman and Singh (2017) dropped the Lethargy factor name from the
Lethargy/Social Withdrawal factor in the recent ABC-C2 manual without explanation. Perhaps
this highlights the perceived relative importance of the social withdrawal construct of the factor).
In sum, there may be certain traits inherent in individuals with ASD that are more pronounced
than in individuals with ID, resulting in a different pattern of variation and a need for an
ultimately more expansive factor structure than had been found previously in an ID population.

193
The second possibility is that the nine-factor structure chosen in study one does not
provide evidence that the ABC-C requires a different factor structure for individuals with ASD.
Aman and Singh (2017) argued that a different factor structure for the ASD population is
unnecessary, and that the five-factor structure should suffice as the generalized standard across
different populations. However, given that lack of prior exploration of more complex factor
structures for the ABC within the ID or other populations, it seems worth considering the
possibility that the five-factor model may reflect an under-factored model more generally across
populations. It could be that the current five-factor model author version of the ABC-C is simply
an under-factored model and that the nine-factor solution is an improvement upon the current
structure, which could be generalizable across populations. For instance, it has been argued in
this study that certain factors in the five-factor author version (e.g., Irritability, Social
Withdrawal) are conceptually crowded. This may be the case for the ASD population, but it
could also be true for the ID population as well. Another example can be seen with the one new
factor introduced in the nine-factor solution that had not appeared in any other factor solution of
the ABC-C: Oppositionality. Researchers have found that the DSM-5 (APA, 2013) model for
oppositional defiant behavior applies similarly for ASD and non-ASD populations alike (Mandy,
Roughan, & Skuse, 2014). It seems unlikely that this factor would be more distinct in ASD than
other clinical populations that vary on this dimension of behavior. Thus, the nine-factor solution
should be considered for evaluation as a factor structure for the ABC-C in the ID and ASD
populations, and potentially other populations as well.
The third possibility is that it is still unclear as to whether or not there should be a
different structure for the ABC-C for the ASD population. Certainly the nine-factor solution
seemed to highlight underlying weaknesses in the current five-factor author version of the ABC-
194
C for the ASD population. For instance, the inter-factor correlations of the nine-factor solution
did not reveal any unusually high correlations between factors in the EFA, providing evidence
for further latent construct distinctions not recognized in the five-factor solution. But, as
mentioned previously, perhaps the current five-factor solution is not the best fitting model of the
ABC-C for the ID population as well. It could also still be the case that the nine-factor solution
is not the most appropriate solution for the ASD population either, with a better model having
not yet been articulated in another study. Nonetheless, potentially calling into question the
structure of the five-factor model for the ID population makes it challenging to assess whether a
different structure of the ABC-C for the ASD population would be appropriate. As a result, it
may be difficult to provide a definitive answer to the core theoretical question in study one alone.
However, gaining clarity as to whether or not there should be a different structure for the
ABC-C for the ASD population can ultimately be addressed in future factor analyses. This effort
could be furthered by performing multiple EFAs to assess if different populations generate the
same or different model solutions. It could also be advanced by performing multiple CFAs and
directly assessing the fit of the nine- and five- (and whatever other) factor models with both an
ID and ASD population to determine whether outcomes are repeatedly similar among the
different populations or whether there is a distinct difference.
Research methodology. With regard to research methodology in study one, there are
two essential aspects that need to be highlighted. The first key methodological element involved
the decision to use four different factor retention tests. Between three and eleven factors were
ultimately considered in study one. This is a much larger range than had been looked at in the
three prior factor analyses for the ABC-C with an ASD sample. It is important to note that the
large range of factor solutions considered was data-driven and not based on any historical

195
precedent. As a result of this wide range, a new solution, the nine-factor model, was ultimately
selected. It was not expected and was not hypothesized prior to carrying out the EFA—
reflecting the truly exploratory nature of the analytic process.
It was argued in this study that the other factor analyses of the ABC-C for the ASD
population (and for non-ASD populations) often failed to perform more rigorous and thorough
EFAs, particularly focused on the failure to consider a larger range of factor solutions for
retention. As a result, these more limited factor solution choices potentially prevented the
researchers from exploring alternative, and perhaps more nuanced and appropriate solutions than
the ones they were choosing from. Factor analytic studies of the ABC-C with an ASD sample
prior to the present study had only considered a four-, five-, or six-factor models, except Mirwis
(2011) who considered five-, six-, seven-, and eight-factor models. Both Brinkley et al. (2007)
and Kaat et al. (2014) only used a scree test and the Guttman Kaiser Criterion to determine their
initial solutions to explore. Brinkley et al. (2007) only looked at a four- and five-factor model
and did not report results of their factor retention tests. Kaat et al. (2014) considered four-, five-,
and six-factor models in their EFA and reported a scree plot analysis showing a five-factor
solution and the Guttman Kaiser Criterion showing 11 factors with eigenvalues > 1. It is unclear
why Kaat et al. (2014) did not directly address the results of the Guttman Kaiser Criterion in
their study and only focused on the range of solutions surrounding the five-factor scree result.
The key point here is the fact that a shortcoming of both Kaat et al. (2014) and Brinkley et al.
(2007) in not relying on the more accurate factor retention tests likely biased the factor solutions
they were able or willing to consider. The parallel analysis used in Mirwis (2011) ultimately
resulted in the consideration and retention of a seven-factor solution. In study one, the inclusion
of the MAP test led to the consideration and retention of a nine-factor solution. Thus the core

196
methodological implication is that the failure to use the more advanced factor analytic retention
test methods (parallel analysis and the MAP test) may have negatively biased the previous factor
analyses for the ABC-C with an ASD population in terms of the range of solutions explored.
Moreover, it is also not out of the question to consider whether the current five-factor author
version of the ABC-C (Aman & Singh, 2017) contains fewer interpretable factors than may
actually be present in the data for the ID population because more modern and accurate factor
analytic retention tests were not used.
The second key methodological element employed in this study involved the use of
special education staff members as raters. Two of the previous factor analyses of the ABC-C
with an ASD population (Brinkley et al., 2007; Kaat et al., 2014) each used caregivers as raters
while only Mirwis (2011) used special education staff members. Mirwis (2011) generated a
unique seven-factor model in his study while a nine-factor solution was chosen in study one.
Thus, both of the EFA studies that used special education staff as raters retained factor solutions
involving more than five factors. This opens up the question of whether there is a quantifiable
difference in factor outcomes between the special education staff raters and caregivers as raters.
The Standards for Test Design and Development (SEPT; SEPT, 2014) highlight the idea
that validity needs to be established for a scale when it is used in a unique way. Researchers
have emphasized that when using a rating scale, different raters and distinctive environments can
potentially influence outcomes (Portney & Watkins, 2000; Tziner et al., 2005). Certainly special
education staff members have a different perspective than caregivers. They are interacting with
subjects in a separate environment than parents and they maintain a different role than parents as
well. Special education staff members are also typically interacting with multiple individuals in
their environments and thus may appraise the frequency, duration, intensity, and function or

197
intention of behaviors differently than parents. The fact that Mirwis (2011), and now this study,
generated more complex factor solutions using special education staff as raters certainly raises
questions as to their potential influence on the overall factor structure. Nonetheless, it is
inappropriate to make any strong conclusions about the specific influence of the special
education staff members as raters and how any environmental variables might have affected their
ratings on the ABC-C as this aspect was not specifically assessed in this study.
Practice. Results from study one potentially have major practical implications for the
use of the ABC-C with ASD populations. The viability of the five-factor author version of the
ABC-C (Aman & Singh, 2017) can appropriately be called into question given that two factor
analyses (Mirwis [2011] and this study) out of the four total of the ABC-C with an ASD
population—both of which relied upon more rigorous factor retention methods and processes—
have been shown to have a more expansive, interpretable, and nuanced factor structure. A strong
argument can be raised that the CFA analysis in study two, which tested the fit of the Mirwis
(2010) seven-factor model and the nine-factor model in this study, is the best way to determine
whether these viability questions have merit. Yet, as Church and Burke (1994) argue,
reproducing a model in EFA across different samples also offers solid evidence of the strength of
a model, given that it is generated without any limiting parameters. At this stage the most logical
answer is to continue to perform further rigorous EFAs of the ABC-C with ASD samples and see
if these more expansive factor models appear—giving a better sense of the impact of sampling
variation on the factor structure across samples. But, the question has to be raised where that
leaves a researcher who desires to use the scale now that the current author version of the model
has been legitimately questioned as a result of this study.

198
The results in study one also raise doubts as to the practical value of particular factors
that appear to be conceptually crowded in the five-factor model. For instance, the Irritability
factor in the Aman and Singh (2017) five-factor model maintains multiple items that support an
Irritability construct, but it also contains three self-injurious behavior items that may not be
directly related to Irritability—or may over-represent self-injury within the irritability context.
From a practical standpoint, a behavior intervention may need to target self-injury or irritability
or both, yet having a scale that combines the constructs and results in a singular subscale score
could make it challenging to appropriately assess intervention progress. Splitting the self-
injurious items off from the Irritability factor, as occurred in the nine-factor model and in the
Mirwis (2011) seven-factor model, seems to be more advantageous. Similar issues regarding
conceptual crowding also arise in the Aman and Singh (2017) five-factor model with regard to
the Hyperactivity/Noncompliance factor. Thus, the nine-factor model helped to highlight that
these two aforementioned factors in particular in the five-factor model might have diminished
value in both research and practice.
Overall, it is fair to ask whether a researcher should continue to use the five-factor author
version of the ABC-C with an ASD population now, before further studies are performed,
despite the fact that the factor structure and the practical utility of certain factors have been
legitimately questioned. It is likely best to leave that question to each individual researcher and
have her decide her own level of confidence in the instrument as currently constructed. It should
also be pointed out that there are apparent strengths contained in the five-factor model as well,
such as with the Inappropriate Speech and Stereotypic Behavior factors. These two constructs
have been consistently found across all four factor analyses of the ABC-C with ASD
populations. As long as ASD researchers are fully aware of the potential weaknesses of the
199
overall structure and individual factors in the author version of the five-factor model, they can
appropriately judge whether the ABC-C is still suitable for their needs prior to more research
being performed on the scale.
Study One Limitations
Despite the many strengths in study one, there are still some important limitations that
need to be acknowledged. Using an extant dataset limited certain methodological choices.
Having limited resources including budget, time, and people power, also constrained options.
The primary limitations in study one involve the sample and the raters, external validity and
generalizability, rotation, and extraction criteria.
Sample and raters. There are specific limitations regarding the sample that occurred as
a result of using an extant dataset. Certain variables that would have been useful to measure
were not accounted for in the dataset. These variables would have provided more clarity as to
the nature of the sample and could have influenced or helped contextualize outcomes to some
degree.
First, although there was a screening process at the special education agency to obtain an
ASD classification and participate in their center-based program, this process did not include the
agency performing their own ASD assessments in a majority of cases. As a result, classification
of individuals did not necessarily include assessment with a gold-standard instrument such as the
ADI-R or the ADOS-2. It would have made for a more rigorous classification process and
provided even more confidence in the diagnostic label. Additionally, it would have been helpful
to have performed cognitive testing specifically for this study, including using a more limited
number of instruments across cases to gain more confidence in the consistency and strength of
the DQ metric. Furthermore, although all individuals in the study were participants in special
200
education classrooms, meaning that they had substantial functional impairments, data on an
adaptive assessment measure would have provided more clarity as to the their level of
impairment. This is particularly important given that DQ scores in study one range from 12-112,
especially for individuals at the highest end of the DQ range. It is a valuable question to pose in
future studies to determine to what extent individuals with certain DQ levels or adaptive
behavior levels with ASD could influence model structure or subscale scores.
Another weakness in the dataset was the fact that no information was provided on
whether individuals had other comorbid conditions. Additionally, no information was provided
on which participants were taking particular medications. Each of these variables could also
have had an impact on outcomes as well and would have offered more clarity on the nature of the
sample.
The use of special education staff members as raters was also a potential weakness. A
legitimate argument could be made that different staff members (e.g., teachers, teaching
assistants, speech pathologists, behavior technicians, occupational therapists) each constitute a
different classification of rater. Ratings by staff position were not specified in the sample.
Although it is unlikely to be the case that raters that work together in the same particular
environment will have drastically different perspectives, it is still a valid criticism to point out
that raters in this group have different educational backgrounds and training, and that each bring
a particular lens to their observations. This could also have been useful information to determine
whether there was a distinct difference in ratings based upon staff title.
External validity and generalizability. The present study used special education staff
members as raters and generated a more expansive factor structure for the ABC-C when used
with an ASD sample. Despite the potential implications of these results, it is still premature to

201
assume that because Mirwis (2011) also found a more expansive factor structure as well when he
used special education staff members as raters, that this is enough evidence to definitively
generalize these results beyond these two studies. More EFAs performed in a special education
context with special education staff members as raters would be needed before being able to
confidently assert the robustness of these results with an ASD sample. It would even be more
presumptive to assume that the nine-factor model found in this study would generalize for the
ABC-C with an ASD sample to all types of raters or environments. Further, it is still premature
to assuredly question the ABC-C factor structure of the ABC-C for non-ASD populations as
well, particularly because other populations were not assessed in this study.
Rotation. A direct oblimin rotation was used in study one. The other factor analyses for
the ABC-C with an ASD sample used similar but slightly different techniques. For instance,
Mirwis (2011) used a promax rotation, Brinkley et al. (2007) used both a promax and varimax
rotation, and Kaat et al. (2014) used a Crawford-Ferguson quartimax rotation. It is beyond the
scope of this study to debate the intricacies of each rotation and how those differences may affect
outcomes. However, the fact that each study of the ABC-C with an ASD sample used a different
rotation makes it challenging to compare across studies. A limitation in this study could
certainly point to the fact that multiple rotation techniques (or extraction techniques for that
matter) were not tested to determine whether results would be consistent across methods. This is
not to say that all existing methods should have been chosen, but rather, multiple methods could
have been tested such that there would be more continuity between studies and more clarity as to
whether any particular rotation could substantively impact outcomes.
Extraction criteria. Study one relied upon four different extraction methods: the scree
test, the Guttman Kaiser Criterion, parallel analysis, and the MAP test. Only this study used the

202
MAP test out of the other factor analyses for the ABC-C with an ASD sample. Although using
the MAP test can certainly be considered a unique strength of this study, it must also be
recognized as a limitation with regard to comparing outcomes of this study to the other existing
studies.
The MAP test is considered amongst the most robust modern extraction techniques (e.g.,
Courtney, 2013; Osborne & Banjanovic, 2016) and in this study it generated a unique solution
(the nine-factor model). In contrast, the scree test and the Guttman Kaiser Criterion have their
limitations. Courtney (2013) suggested that the scree test is often subjective, such that it tends to
work well when factors are strong, but results in poor inter-rater reliability bias when factors are
less clear. Fabrigar et al. (1999) argued that the Guttman Kaiser Criterion is not very accurate
and has been shown to lead to both over- and under-factoring. Although the results of the MAP
test were not accepted blindly, as theory and clinical meaningfulness guided the final decision
making, a great deal of weight was provided to the MAP test (and parallel analysis) to help
justify decision making. Thus, the limitation in this study is not any direct problem with the use
of the MAP test, rather, because the MAP test is unique to this study its outcomes cannot be
directly compared to any of the other existing studies. Because these other studies did not use
the MAP test nor the parallel analysis (except for Mirwis [2011]), it makes it challenging to
determine whether the chosen factor structure in this study is truly unique and the result of
something inherently different in this sample or whether it is the result of the other studies’
failures to use this more advanced technique.
Study One Future Research Implications
Results from study one open up multiple avenues for future research of the ABC-C with
the ASD population. These future studies could improve upon some of the weaknesses in study

203
one and build upon the results generated herein. They could also assess the strength of outcomes
found in this and previous studies and move the literature forward to gain more clarity as to the
application of the ABC-C with an ASD population.
First, with regard to improving upon this study, future studies should collect certain key
information about the sample and the raters if possible. Because ASD is a spectrum disorder,
and there are varying presentations of ASD, it is important to be able to determine in future
studies which variables may have a certain degree of influence on the factor structure or even on
factor scores. This should include IQ and adaptive behavior information because both are key in
determining the level of functioning of individuals with ASD. It is likely not enough to cite IQ
as a proxy for needed level of support. Additionally, further information regarding co-morbid
disorders, medication usage, and functional language skills would help to identify if these
variables maintained any particular influence on outcomes. Only Kaat et al. (2014) assessed the
impact of multiple demographic variables (e.g., age, sex, IQ, adaptive behavior, and language),
and they did find moderate to small effects in subscale scores. Information should also be
gathered on raters, particularly if a study is done with special education staff to determine
whether raters in a certain role (e.g., as teachers or speech therapists) show rating differences that
may impact the factor structure.
Second, with regard to improving upon this study, different rotations and extractions
should be performed in any future study in order to determine whether there is a distinct
difference in outcomes when these varying methods are used. Because each of the different
studies with the ABC-C with an ASD sample were not uniform in their rotation (and extraction)
methods, it creates another variable that needs to be addressed in order to have greater
confidence in the ultimate solution. This is not to say that methods should be used if they are
204
inappropriate (e.g., if data is found to be non-normal it is not necessary to use a technique that is
appropriate only for normative data) but, for example, researchers could test both a promax and
direct oblimin rotation with their datasets to assess for any particular influence. In the same vein,
future studies should also use the same factor retention tests, particularly parallel analysis and the
MAP test, in order to ensure that the most powerful modern tests are used to help determine the
most interpretable solutions.
With regard to moving the literature forward in future studies, more EFAs should be
performed of the ABC-C with an ASD sample. First, this study, although not perfect, represents
a thorough and robust factor analysis that is key to determining the best fitting model in a future
CFA. One of the weaknesses of the existing literature for the ABC-C with an ASD sample is the
fact that there are so few factor models to assess and there are various questions regarding the
thoroughness of the exploratory methods that were used. More robust EFAs of the ABC-C with
the ASD population would solve this issue. In addition, as Church and Burke (1994) imply,
more robust EFAs would also help to establish whether a particular model or construct is
appearing on a consistent basis (e.g., a self-injurious behavior or oppositional behavior factor),
which would provide greater evidence for the strength of certain factors and models. Second,
more EFAs need to be performed to determine the influence of the different raters on the ABC-C
with an ASD sample. This study and Mirwis (2011) relied upon the same type of raters while
Brinkley et al. (2007) and Kaat et al. (2014) relied upon caregivers. Future studies, if possible,
might obtain multiple ratings from both caregivers and special education staff to determine if
there is a difference in outcomes.
Another way to move the existing literature forward would be perform further validation
assessments to test the strength of the different factors found in this study. For instance, a
205
concurrent validity assessment would help to assess how well factor constructs derived in this
study align with similar factor constructs from other scales. This would be particularly important
for the two newly independent factors generated in the nine-factor model: Noncompliance and
Oppositionality. Concurrent evidence, especially both convergent and divergent, would help
bolster the legitimacy of these two factors.
One of the outcomes of the nine-factor solution in this study involved a more expanded
factor model rather than maintaining more conceptually crowded factors as occurs in the five-
factor author version of the ABC-C (Aman & Singh, 2017). In particular, the Irritability factor
in Aman and Singh (2017), which was broken up into more than one factor in the nine-factor
model, deserves more intense scrutiny. The self-injurious behavior items were also broken off
from the Irritability factor and given their own factor in Mirwis (2011). This factor has been
used as a primary outcome measure in various consequential psychopharmacological-based
studies, such as the study by McCracken et al. (2002), which was one of the main studies that led
to FDA approval of Risperidone in children with ASD. Thus, it would be interesting to assess
the influence of the self-injurious behavior items in these Irritability factor scores. Additionally
as Bolte and Diehl (2013) found, the ABC-C was the most used measure for assessing
hyperactivity symptomology across ASD intervention studies where hyperactivity was measured
as an outcome. In the nine-factor model, both Hyperactivity and Noncompliance maintained
their own independent factors. In the Aman and Singh (2017) version of the ABC-C these
constructs are combined in a singular factor. As with the Irritability factor, it would be
interesting to determine the influence of Noncompliance items on the overall subscale scores in
each of these studies that used the Hyperactivity/Noncompliance factor as an outcome measure.

206
Finally, Mirwis (2011) suggested that inter-rater reliability, test-retest reliability, and
treatment sensitivity of the ABC-C should be performed to further assess its usability with the
ASD population. This study did not assess these key elements, as only factor structure and
internal consistency reliability estimates were examined. It would be useful for future studies to
determine whether the ABC-C for the ASD population demonstrates adequate inter-rater and
test-retest reliability as well. In addition it would be useful to determine whether reliability
statistics hold up in a variety of other clinical contexts, or if a particular hypothesized model
(e.g., the nine-factor model) is truly specific to only the ASD population.
Summary and Interpretation of Findings for Study Two
Research question 5 and hypotheses 5a and 5b. Research question 5 was focused on a)
evaluating the absolute and relative fit of the nine-factor ABC-C model derived from a sample of
individuals with ASD, rated by special education staff members, and then b) comparing the fit of
that model to that of the existing models of the ABC-C found in ASD samples (or proposed for
use with individuals with ASD). A confirmatory factor analysis (CFA) was performed using a
weighted least squares mean and variance adjusted (WLSMV) approach to generate five fit
indices (2, SRMR, RMSEA, CFI, TLI) for evaluation of the individual models. A maximum
likelihood estimator was also used to generate two other fit indices (AIC, BIC), which enabled a
direct comparison of several of the different ABC-C models for the ASD population. Results
from the CFA revealed the nine-factor ABC-C model from study one meeting or approximating
cut off-values on four different fit indices (SRMR, RMSEA, CFI, TLI). As a result, hypothesis
5a was supported as the nine-factor model was shown to adequately fit the ABC-C variance-
covariance matrix of the second sample. Results from the AIC and BIC fit tests revealed the
nine-factor model to be the best fitting model compared to the four- and five-factor models from

207
Brinkley et al. (2007), the five-factor model from Aman et al. (1985a), and the seven-factor
model from Mirwis (2011). In addition to the AIC and BIC indices, the nine-factor model
distinguished itself across four of the other fit indices (SRMR, RMSEA, CFI, TLI) compared to
the other five tested models—which included the Sansone et al. [2012] model for a Fragile X
population. (However, these other fit indices are not generally used for cross-model
comparisons.) Only the adjusted 2 statistic maintained relative parity (p < .001) across all six
tested models. Thus, hypothesis 5b was supported as results from the AIC and BIC fit indices
provided evidence that the nine-factor model demonstrated a better fit to the second ASD sample
ABC-C variance-covariance matrix than the previous ABC-C factor models for the ASD
population. In addition, results from the inter-factor correlation outputs revealed moderate to
high correlations among multiple factors.
It is important to note that although the nine-factor model consistently generated more
robust fit statistics than the other models that were tested, it does not mean that the nine-factor
model is objectively the best model. The six models tested were fit to one particular ASD
sample ABC-C variance-covariance matrix with ratings obtained by special education staff
members. Only the AIC and BIC fit indices used in study two enabled a more direct comparison
between models, based on the unique variance covariance matrix used only in study two.
Therefore, although the nine-factor model outperformed the other tested models across six of the
seven fit indices, it would be inappropriate to simply objectively generalize the results without
taking the characteristics of the unique validation sample into account.
It is precisely the nature of ASD that makes the validation sample used in this study truly
unique as well. Masi, DeMayo, Flozier, and Guastella (2017) highlighted the heterogeneity in
the spectrum of presentations found in ASD. They discussed the continuing disagreements

208
regarding the number of potential different diagnoses under the umbrella of ASD, the influence
of cognitive impairments on presentation, and the range of adaptive and cognitive skills found in
individuals with the disorder. In addition, Masi et al. (2017) underscored the fact that even
culture has biased the development of the diagnostic criteria of ASD, with Western cultural
participants having the largest influence. For instance, Masi et al. (2017) illustrated that in
certain Asian cultures, a lack of eye contact, a common feature in individuals with ASD, is often
not viewed as highly unusual in a culture that regards eye contact with older people or authority
figures as disrespectful. Thus, using a particular sample of individuals with ASD in a study and
attempting to generalize the sample to the larger population of individuals with ASD can be
problematic given the fact that samples can vary greatly in their presentations or expected
behaviors. Even the sample in study two highlights some of this spectrum with regard to
cognitive skills, with participant DQ scores ranging from 12 to123. Further, as Masi et al. (2017)
argue, without particular biological markers distinguishing between presentations of individuals
with ASD, the need to rely completely on behavior to assess and treat individuals with ASD is
highly challenging. Therefore, although the nine-factor model appeared to distinguish itself in
study two, it is certainly conceivable that outcomes could potentially vary greatly with a different
ASD sample.
However, results from study two seemed to generally reflect previous results from the
two CFAs (i.e., Brinkley et al., 2007; Kaat et al., 2014) of the ABC-C with ASD samples. Kaat
et al. (2014) examined the five-factor Aman et al. (1985a) model, the four- and five-factor
Brinkley et al. (2007) models, and the Sansone et al. (2012) model. Satorra-Bentler 2 values in
the Kaat et al. (2014) CFA were significant for all models, as were the 2 values for all models in
study two. RMSEA values were slightly higher in Kaat et al. (2014) ranging across the four

209
aforementioned models between .081 and .086, compared to .071 to .089 in study two. SRMR
values were similar across the four models tested in Kaat et al. (2014) ranging from .09 to .10,
compared to .093 to .116 in study two. Brinkley et al. (2007) only assessed their own five-factor
model generated from their study in their CFA and included two of the fit indices used in study
two: the Normed Fit Index (NFI, also known as the TLI), and the RMSEA. The RMSEA value
in Brinkley et al. (2007) was .091 compared to .078 in study two—a slightly better though still
elevated value. The NFI in Brinkley et al. (2007) was .89 compared to a TLI of .902 in study
two, both relatively similar obtained values. Overall, consistency of results replicated across
three total CFA studies of the ABC-C with an ASD sample provide further evidence of the
weakness of the existing ABC-C models in the ASD population.
There are two key differences between the previous CFAs with the ABC-C and the CFA
from study two. The first is that one model, the nine-factor model, distinguished itself across the
various fit indices. In Kaat et al. (2014) there was relative parity across the different models
tested. This included the validation sample, which was split up into subsamples to isolate certain
outcomes for age (> 6 years vs. < 6 years), IQ score (> 70 vs. < 70), and level of adaptive
behavior supports. In Kaat et al. (2014) only one model stood out as the poorest fitting model
(Brown et al., 2002), although it was not from an ASD sample. Had Kaat et al. (2014) relied
upon a greater number of fit index tests, as was done in study two, a certain model potentially
could have more clearly emerged as a better fitting model. In addition, the omission in Kaat et
al. (2014) of indices that would have enabled a direct comparison of models (e.g., AIC and BIC,
as were used in study two) prevented the authors from making more substantial evidence-based
decisions to justify their ultimate selection of the five-factor model over the other tested models.
Overall, perhaps the most obvious implication of the nine-factor model distinguishing itself in
210
study two is that it now has confirmatory evidence supporting it as a potentially viable model for
the ABC-C in the ASD population.
The other major difference between the CFA in Kaat et al. (2014) and the CFA in study
two was the inclusion of the Mirwis (2011) seven-factor model in study two, which was not
assessed in Kaat et al. (2014). The seven-factor model did not distinguish itself in study two
across the different fit indices compared to the other tested models, although it did produce the
second lowest AIC and BIC scores compared to the nine-factor model. That said, Mirwis (2011)
was one of the three studies of the ABC-C with an ASD sample, and it was important to assess
the viability of the seven-factor ABC-C model given that so few hypothesized ABC-C models
existed for the ASD population. It was also the only study of the three existing studies of the
ABC-C with an ASD sample prior to study two to use special education staff members as raters.
Including the model by Mirwis (2011) in the CFA in study two enabled two models (Mirwis
[2011], and the nine-factor model from study one) derived from special education staff member
ratings to be examined alongside four models (Sansone et al. [2012], the two models from
Brinkley et al. [2007], and Kaat et al. [2014]) generated with parents as raters. Although the
rater variable was not specifically examined in this study, distinctions between the differently
rated models should certainly open up questions regarding the potential impact of rater type on
outcomes. As such, because there was a noticeable difference between the nine-factor model and
the other assessed models, there are clearly questions worthy of future exploration regarding the
possible influence of rater type.
Study Two Implications
Theoretical. The core purpose of study two was to assess the viability of the nine-factor
model of the ABC-C for the ASD population, generated in study one, alongside the other
211
existing hypothesized models. Results from the CFA confirmed the nine-factor model to be a
reasonable fitting model, and one that fit the ASD validation sample ABC-C variance-covariance
matrix better than the previous ABC-C factor models for the ASD population. The most
important theoretical implication here is the possibility that the nine-factor model is a closer
approximation to a “true” ABC-C measurement model for the ASD population. (Though it is
theoretically possible for many models to fit the same data equally well, the models tested in the
present study are the only current conceptually defensible models. Still, in theory there is no
way to know a “true” latent model with certainty.) However, it is too early to generalize these
results at this stage as additional EFAs and CFAs are needed across multiple samples and under a
variety of conditions before having enough evidence to make such a claim.
All that said, results from the CFA in study two provide some additional information for
discussing the differentiation between the three possible theoretical implications raised at the end
of in study one: a) the ABC-C for the ASD population requires a different factor structure than
for the ID population, b) the ABC-C does not require a different model for the ASD population,
or c) is still unclear whether a different model is necessary for the ASD population. The CFA
analysis provided evidence that the nine-factor model distinguished itself compared to the other
existing models when fitted to a variance-covariance matrix consisting of data derived from
individuals with ASD. These results could be providing an indication that there is something
inherently different about the ASD population that necessitates a different theoretical model than
the typical ID population. However, the results also raise questions as to whether the nine-factor
model is viable across all different populations, and in particular that the nine-factor model, or
something like it, might be the most useful with an ID population as well. The final implication,
that the results of the CFA have not changed the situation and that it is still unclear whether a

212
different model is necessary for the ASD population, is perhaps the most vexing supposition at
this point.
As highlighted in Masi et al. (2017), caution must be maintained with regard to
generalizing results of studies with individuals with ASD as a result of the heterogeneity inherent
in this population. Further, the nine-factor model in study two expanded upon the structure of
the existing five-factor model of the ABC-C (Aman & Singh, 2017), but did not necessarily
result in a structure that clearly highlighted more features in an ASD population as opposed to an
ID population. Factors in the nine-factor model such as Self-Injury/Aggressiveness, not found in
the Aman and Singh (2017) five-factor model, represent some behaviors (e.g., self-injury) that
are more common in individuals with ASD than in individuals with ID (Soke et al., 2016). At
the same time, factors such as Oppositionality in the nine-factor model and not in the five-factor
author version of the ABC-C (Aman & Singh, 2017) appear to be behaviors that are consistent
across ASD and non-ASD populations alike (Mandy et al., 2014). It is thus fair to maintain
skepticism as to whether the results of study two are conveying something specific about an
ASD population as opposed to an ID population, or whether the nine-factor structure is unique to
this sample only, or if the original five-factor ABC-C model reflected a generalizable but
insufficiently factored model.
Thus, it is appropriate to ask the question as to how much weight should be placed on the
results from study two. The most measured answer is to consider these results tentative and
provide them the minimum amount of possible weight pending replication because study two is
the only existing study to test a nine-factor model and the only study that produced its particular
outcomes. The CFA performed in Kaat et al. (2014) did not result in any positively distinct
model difference between tested models, and Brinkley et al. (2007) only tested a single model.

213
Perhaps additional CFAs would enable one to provide increasing weight to the results of study
two—under the assumption that the results were repeatedly replicated. In addition, results from
study two did not show the nine-factor model or any other model to be an exceptionally fitting
model, which certainly points to potential challenges with the model solution, the individual
items, or the collection of items. As such, while the results in study two are distinct for the nine-
factor model, it is likely most judicious to maintain a neutral position at this point and concede
that it is unclear as to whether there is a different factor structure for the ABC-C for the ASD
population. That said, results of the CFA certainly warrant one to yet again further question the
viability of the author version (Aman & Singh, 2017) of the five-factor model for the ASD
population.
It is also important to highlight the fact that the various moderate to high inter-factor
correlations potentially represent the presence of higher order or overlapping factors. Inter-
factor correlation results from the CFA cannot be ignored given the high correlations between
some factors. There could be other explanations for these correlations (see Study Two
Limitations), but it is possible that there are higher order or overlapping factors present. In
particular, the highest correlations between factors are the most worthwhile targets to address,
such as between the Noncompliance factor and the Lethargy factor (r = .848), and the
Oppositionality factor and the Irritability/Tantrums factor (r = .874). There is also a possible
implication that the smaller factor models (e.g., the Aman et al. [1985a] five-factor model) with
certain factors with large numbers of indicators that appear to be conceptually crowded (e.g.,
Irritability) could in fact be functioning almost as a composite of lower-order latent factors rather
than as a single, indivisible factor or construct. Thus, the potential presence of higher-order
factors should be assessed in any future studies.

214
Research methodology. There were three main implications regarding the research
methodology for study two, two of which are extensions of implications from study one. One of
the core arguments presented in study one involved the need for an EFA to be performed on the
ABC-C in an ASD sample using a more thorough and rigorous factor exploration and retention
process. The thorough factor retention process used in study one led to the consideration of a
wider range of factor solutions than had been examined in previous studies and ultimately
resulted in the selection of a nine-factor solution. The main point of this argument was that the
failure to use the more advanced factor retention test methods in previous EFAs for the ABC-C
in ASD samples could have resulted in an inadvertently limited selection of factor solution
options, leading to potential suboptimal final factor solutions. The contention then was that the
nine-factor solution that resulted from the EFA process in study one would be shown to be a
better fitting model compared to the previous factor solutions for the ABC-C for an ASD sample.
Results from the CFA in study two revealed evidence that the nine-factor model was the better
fitting model on the sample ABC-C variance-covariance matrix when compared to the previous
ABC-C factor models in the ASD population (i.e., when directly compared using AIC and BIC
fit indices). It also resulted in outcomes either approximating or meeting fit index cut off values
for model acceptability across multiple indices, unlike the other models tested. The implication
then is that future EFAs for the ABC-C need to use similar rigorous processes in order to
generate the most robust hypothesized models. As a result of the failure to use these processes in
previous factor analyses of the ABC-C, highlighted by the results in study one and now study
two, multiple questions should be legitimately raised regarding the viability of the current factor
structure of the author version of the scale in the ASD population (Aman and Singh, 2017) and in
other populations as well.

215
The second major implication from study one that is also relevant to study two involves
the use of special education staff members as raters. Simply, the results from the CFA, using a
validation sample of special education staff members, did not dispel previous questions from
study one about the potential influence of rater type on outcomes. The nine-factor model,
derived from an EFA made up of ratings by special education staff members, maintained the
most acceptable fit statistics across the different models tested on the special education staff
member-rated validation sample. Thus, it is legitimate to question whether the results would
differ when assessed using ratings completed by parents.
The third implication of the CFA methodology in study two involved the appearance of
variables with slightly negative residual variances (item 34, cries over minor annoyances and
hurts, in the Brinkley et al [2007] four- and five-factor models and item 46, repeats a word or
phrase over and over, in all of the other models tested). The factor loadings for these items were
subsequently fixed to a value of 1 in order to properly run the estimation analysis. As noted
previously, fixing the factor loading of item 34 had a negative impact on the fit indices in the
four- and five-factor models in Brinkley et al. (2007), though it was not substantive enough that
it greatly altered the assessment of the models’ viability. Fixing the factor loading of item 46 did
not have any impact on the fit indices across the other models. Residual variances in item 34 and
item 46 revealed issues with multicollinearity, meaning that items that are highly correlated with
other items in the model can result in difficulties in estimating model fit. For instance item 46 is
similar to item 22, repetitive speech, in the Inappropriate Speech factor. Item 34, is similar to
item 41, cries and screams inappropriately. The implication for the multicollinearity in this
study is that these two particular items that resulted in negative residual variances likely should
be revised or even potentially removed from the model given the issues that they generated.

216
When models were rerun with these items removed, no substantive differences in model fit were
found.
Practice. Results from study two did not necessarily change any of the practice
implications articulated at the end of study one regarding whether or not a researcher should
continue to use the five-factor author version of the ABC-C (Aman & Singh, 2017) in an ASD
sample. However, results from study two add further weight to the argument that the five-factor
model is potentially not the most suitable for use with the ASD population. In addition, the
issues that arose with multicollinearity and the presence of various crossloadings further suggest
the need for scale revision and should give one pause as to whether the current version of the
scale is functioning optimally. In fairness however, no scale is ever perfect and all instruments
should be continually scrutinized and revised for maximum effectiveness, as is highlighted in the
Standards for Educational and Psychological Testing (SEPT; 2014).
It is important to point out that the ABC-C was not designed as an instrument for use in a
clinical context with regard to screening or decision-making. It was originally designed to assess
the effects of psychoactive drug intervention on aberrant behaviors in individuals with ID living
in residential environments (Aman & Singh, 1986). Strictly speaking, it has not been
standardized using a large representative normative sample. (In the ABC-C2 manual, Aman and
Singh [2017] conceded that the sample norms provided are not actually “normative” [p. 47].)
Clinical reference samples cited in the manual (e.g., children and adolescents with ID, children
and adolescents with ASD) are not necessarily representative of the larger clinical populations
involved. In addition Aman and Singh (2017) stated that they “cannot fully support . . . with
research data” the designated clinically significant cutoff scores for the ABC-C, which are at the
80th percentile across “most subscales” (p. 47, Aman & Singh, 2017).

217
All that said, the expanded nine-factor subscale structure (or similar future expanded
structure) could potentially enable more clinically meaningful distinctions to be made (compared
to the existing five-factor author version of the scale) if the scale was standardized for clinical
purposes. Having an instrument that could assess multiple associated and core behaviors within
ASD (e.g., social withdrawal, stereotypic behavior, noncompliance, oppositional behavior,
hyperactivity), ID, or other developmental disabilities, could potentially offer clinicians the
opportunity to assess outcomes within an applied intervention context. It would fill the current
gap in this area (i.e., the lack of currently established measures for intervention with an ASD-
population) as highlighted by Bolte and Diehl (2013). It would provide clinicians an appropriate
measure that could potentially be sensitive to short-term treatment effects rather than them
having to rely upon inappropriate diagnostic measures not designed for that purpose. However,
the current lack of clarity concerning the most appropriate factor structure—particularly with
regard to ID and ASD—and the lack of adequate norming (such as accounting for the general
population or more representative ASD or ID populations, multiple developmental disability
populations, etc.) suggest it is presently too underdeveloped to recommend for clinical use in
applied, non-research settings.
Study Two Limitations
It is important to acknowledge that study two contained some key limitations. These
limitations included aspects of the sample, the generalizability of the results, the analyses that
were performed, and the measurement methods that were chosen. Although it is unlikely that the
core conclusions of this study are critically threatened as a result of these limitations, they must
still be recognized as legitimate vulnerabilities in this study worthy of criticism.
218
Sample size and potential moderators. A sample size of 243 participants in the
validation sample in study two was likely adequate for the analyses that were performed.
However, a larger sample size would have been more ideal to further ensure stability and reduce
potential bias with regard to estimates and standard errors. As Harrington (2009) explained,
there are various expert opinions on sample size requirements for CFA, but in general, the more
participants in a sample the better. Further, in this study, the main limitation with regard to
having a moderate-sized sample was that potential moderating variables could not be explored.
This was not a primary goal of this study nor was it deemed fully necessary at this stage of the
factor analytic process. In fact, as mentioned in the limitations section in study one, not all
variables of potential interest (e.g., adaptive behavior scores) were available in the extant dataset.
However, given the results of study two, which confirmed the potential viability of the nine-
factor solution for the ABC-C in an ASD sample, it could have been useful to have had the
means to determine whether certain demographic variables (e.g., DQ score or age) had any
sizable impact on study outcomes. A larger sample size would have been necessary in order to
isolate and measure the potential impact of these variables, as was done with the large validation
sample in Kaat et al (2014) with 763 participants. This is not to say that particular suspicions
regarding any moderating variables had arisen in study two. However, Kaat et al. (2014) did
find small effects on the means for certain variables, but did not find evidence that any particular
variables greatly influenced model fit. Given that the make up of the validation sample in study
two was considerably different than the sample in Kaat et al. (2014), meaning, for example, that
mean age was higher (10.79 years vs. 6.7 years in Kaat et al. [2014]) and percentages of
individuals with IQ/DQ < 70 were also much higher (78.1% vs. 47.4% in Kaat et al. [2014]), it
would have been informative to have had the ability to assess the potential effects of these

219
demographics. This is particularly important with an ASD sample, given the heterogeneity of
this unique population (Masi et al., 2017).
Generalizability. With regard to generalizability for the results in study two, there are
two main limitations. First, given the nature of CFA, generalizing model results is somewhat
limited. Across the seven different fit tests used in study two, only two of them (the AIC and
BIC) enabled a direct comparison between models, though tests of significance for those
comparisons were not possible (i.e., no standard error of the difference available for AIC or
BIC). This means that although the nine-factor model was found to have the best AIC and BIC
outcomes, this is accomplished more descriptively and not through significance testing.
Additionally, the other five fit indices did not allow for direct comparisons. As such, all models
were assessed not in direct relation to each other but rather in relation to each model’s particular
fit with regard to the variance-covariance matrix of the validation sample. As mentioned prior,
this is especially true with regard to the heterogeneity inherent in the ASD population (Masi et
al., 2017). This means that it is not appropriate, in terms of these fit indices, to declare a model
as being a better fit than another model—but rather a better or worse fit to the variance-
covariance matrix of the validation sample. This is why more CFAs made up of different
samples (and perhaps different raters as well) could result in dissimilar outcomes.
The other major implication with regard to generalizability involves the actual fit
statistics of the nine-factor model. As stated previously, the nine-factor model either
approximated or met cut off values for all assessed fit indices except for the 2. This means that
the nine-factor model CFA results showed an adequately fitting model, but not one that
comfortably surpassed fit index cut off values. Results from study two must not be over-sold,
but rather, the nine-factor model’s viability should be based upon the strength of the outcome
220
data and the theory underlying the makeup of the scale. As mentioned prior, the theoretical
underpinnings of the nine-factor model are consistent with behaviors found in the ASD
population, but it is still unclear whether the model is especially unique to ASD or more
generalizable. This certainly limits the extent to which these results can and should be
generalized to ASD or other populations, and potentially points to a need for the instrument to
undergo an appropriate modification to improve its theoretical clarity and robustness. The nine-
factor model indeed distinguished itself with regard to the other models in this CFA, but that
does not mean that its viability is absolute. More EFAs and CFAs would need to be performed
in order to gain more confidence in the existing model’s overall acceptability.
Measurement and analyses. There are three significant limitations to highlight
regarding the measurement and analyses used in study two. First, in the CFA in study two,
factor models were specified to freely estimate factor loadings and inter-factor correlations. Any
crossloadings of items that appear in EFA (i.e., items that load on more than one factor) were not
modeled within the CFA. Each item was assumed to be primarily an indicator of or influenced
by one factor. Thus, any minimal or more substantial crossloadings were not accounted for in
the CFA. As a result, fit indices for all models were likely negatively affected, although not
likely to any substantial degree that would have changed the relative standing of model
acceptability. That said, fit index outcomes that were closely approaching cut off scores could
have potentially reached those thresholds if crossloadings were modeled.
Second, as mentioned previously, the need to alter the factor loading to one with a
residual variance of 0 for item 46 in the Aman et al. (1985a) model, the Mirwis (2011) model,
the nine-factor model from study one, and the Sansone et al. (2012) model as well as for item 34
in the four- and five-factor models from Brinkley et al. (2007) highlighted a weakness in the

221
underlying structure of the EFA model with regard to issues of multicollinearity. Compounded
by issues of crossloadings, it is likely that any particular future hypothesized model of the ABC-
C will be negatively affected with regard to overall model fit as well. The very existence of
some higher crossloading items and issues with multicollinearity likely reflect weaknesses in the
overall item set of the ABC-C. A more traditional scale development process would either result
in discarding these problematic items or revising them so that the issues would no longer appear.
However, neither instrument modifications nor model modifications occurred in this study. As
such, fit index outcomes were limited to the conditions of the existing unmodified instrument
and existing unmodified models. These limitations were of course self-imposed, as nothing
specifically prevented a more exploratory model modification process. In general, as these
model flaws make clear, revisions to the ABC-C for the ASD population (and potentially other
populations) are likely necessary if the longer-term goal is to improve scale utility and fit to an
underlying theoretically defensible model.
Third, as mentioned previously the resulting multiple elevated inter-factor correlations
that arose in the CFA of the nine-factor model could suggest the possible presence of higher-
order factors or potentially redundant factors. Though factor redundancy was generally ruled
out, one major limitation in this study is the fact that the presence of possible higher-order
factors was not further assessed. The inter-factor correlations found in the EFA of the nine-
factor model certainly did not approach the same high correlation levels. However, Li (2016)
reported that the use of the WLSMV estimator in a CFA can result in over-estimated inter-factor
correlation levels. The WLSMV estimator was specifically chosen for study two given the
nature of the ordinal, non-normal data, but it is possible that inflated, inter-factor correlations
were a negative tradeoff. Additionally, Schmitt and Sass (2011) pointed out that crossloadings
222
are often not modeled in CFA—and were not modeled in the CFA in study two. Schmitt and
Sass (2011) argued that because crossloadings are typically accounted for in EFA and different
EFA rotations can influence the absolute value of inter-factor correlations (and there is no
rotation in CFA) there is often a resulting discrepancy between the inter-factor correlations found
through EFA and CFA. Regardless, the presence of these high correlations must raise questions
about a possible higher-order structure that if modeled properly could potentially improve the fit
of the nine-factor model.
Study Two Future Research Implications
Results from study two open up various avenues that researchers could potentially pursue
in future studies of the ABC-C involving the ASD population. These studies could involve
moving the existing literature forward by building on the current findings in order to determine
whether the nine-factor model or another model is the most theoretically, practically, and
quantifiably satisfactory model. Other studies could involve taking a few steps backwards, and
adopting a more exploratory focus for the purposes of scale revision. Overall, there are five key
future research directions that could be pursued.
First, additional CFAs of the ABC-C with ASD and non-ASD samples are warranted.
The results in study two confirmed the potential viability of the nine-factor model for individuals
with ASD. However, this is the first study to not only introduce a nine-factor model but also test
it for quality of model fit. More studies need to be performed with various ASD validation
samples, including those where data were derived from different types of raters (e.g., examining
factorial invariance across rater types). One of the more complicated aspects of individuals with
ASD is the fact that the disorder is characterized by heterogeneous presentations. This means
that samples of individuals with ASD could vary greatly as ASD characteristics and behaviors
223
can range across a broad spectrum of frequency, intensity, expression, and type. Thus, the need
for more CFAs with multiple samples is necessary in order to ensure that this heterogeneity in
presentation is adequately represented by different validation samples. Additionally, it would be
appropriate to perform more CFAs with non-ASD samples (e.g., the ID population) in order to
assess whether the model is robust across non-ASD populations (e.g., examining factorial
invariance across sample types) and different rater types as well.
Second, it is important to further address the issue of the elevated inter-factor correlations
that resulted from the CFA of the nine-factor model. Analyses need to be performed to
determine whether theoretically defensible higher order factors may be present in the nine-factor
model and whether the factors as constituted reflect any redundant constructs. Performing
concurrent validity analyses with external scales that reflect theoretically similar and dissimilar
factor constructs (i.e., evidence of both convergent and divergent validity) would also be useful
to determine whether factors as constituted are sufficiently unique and robust.
Third, future CFA studies should assess the influence of potential sample characteristics
on scale factor structure (e.g., age, DQ, adaptive behavior, rater type, functional language skills,
etc.). Similar to the analyses performed in Kaat et al. (2014), evaluating these sample
characteristics would be useful in any future CFAs to determine the potential influence of these
variables in relation to the nine-factor model or other factor models of the ABC-C with an ASD
(or even a non-ASD sample). It can be argued that this type of analysis is particularly important
for the ASD population given the aforementioned range of characteristics (i.e., heterogeneity) of
individuals with ASD. To appropriately examine such demographic aspects, sufficiently large
samples would be required to allow for the generation of adequately large subsamples to
examine the consistency in factor structure across the range of such characteristics.

224
Fourth, given that the ABC-C was originally proposed for assessing those with ID, but
now being used extensively with those with ASD (with or without co-morbid ID), a particularly
informative study would examine similarities and potential differences in factor structures across
an ID without ASD sample, an ASD with co-morbid ID sample, and an ASD sample of
individuals requiring less intensive levels of support. If possible, such a large study could take
rater type into account as well (e.g., parent/caregiver vs. special education staff). Such a study
could involve assessing for factorial invariance across the different sample and rater types. Such
a large study could be more feasibly conducted, if necessary, as a series of studies involving the
comparison of various sample types within rater type, and the comparison of various rater types
within sample type.
Fifth, there is a clear need for scale revision of the ABC-C. Despite finding a substantive
difference in fit favoring the nine-factor model over others, the CFA in study two revealed
problems in the item set of the ABC-C indicative of the need for instrument revision. In
particular, issues regarding high crossloadings, multicollinearity, and redundancy provided
evidence of significant issues with multiple items in the ABC-C. Scale revision could include
both eliminating and adding items to factors/subscales for purposes of improving construct
validity, distinctness, robustness, reliability, and refining existing language to clarify item
meaning or intent. Study two did not include any model modification goals, as these
undertakings are exploratory rather than confirmatory in nature.
It can be argued that performing multiple EFAs and CFAs of the ABC-C in the hopes of
finding the most acceptable version of the model may ultimately be an undertaking with limited
potential for greater improvement unless the core foundation of the scale, its items, are optimized
such that they are designed to be as effective as possible. This would include isolating

225
theoretical constructs that can be used in a research or clinical setting that would enable a
researcher the ability to more effectively target particular behaviors. These constructs should be
theoretically clear and either intentionally limited to a particular population (e.g., ID or ASD) or
intentionally designed with generalizability across populations in mind. It can be legitimately
argued, at this time, that scale revision should be the highest priority with regard to future
psychometric work on the ABC-C.

226
APPENDICES

227
APPENDIX A: EFA Model 1
Figure 15. Brinkley et al. (2007) four-factor model

228
APPENDIX B: EFA Model 2
Figure 16. Brinkley et al. (2007) five-factor model
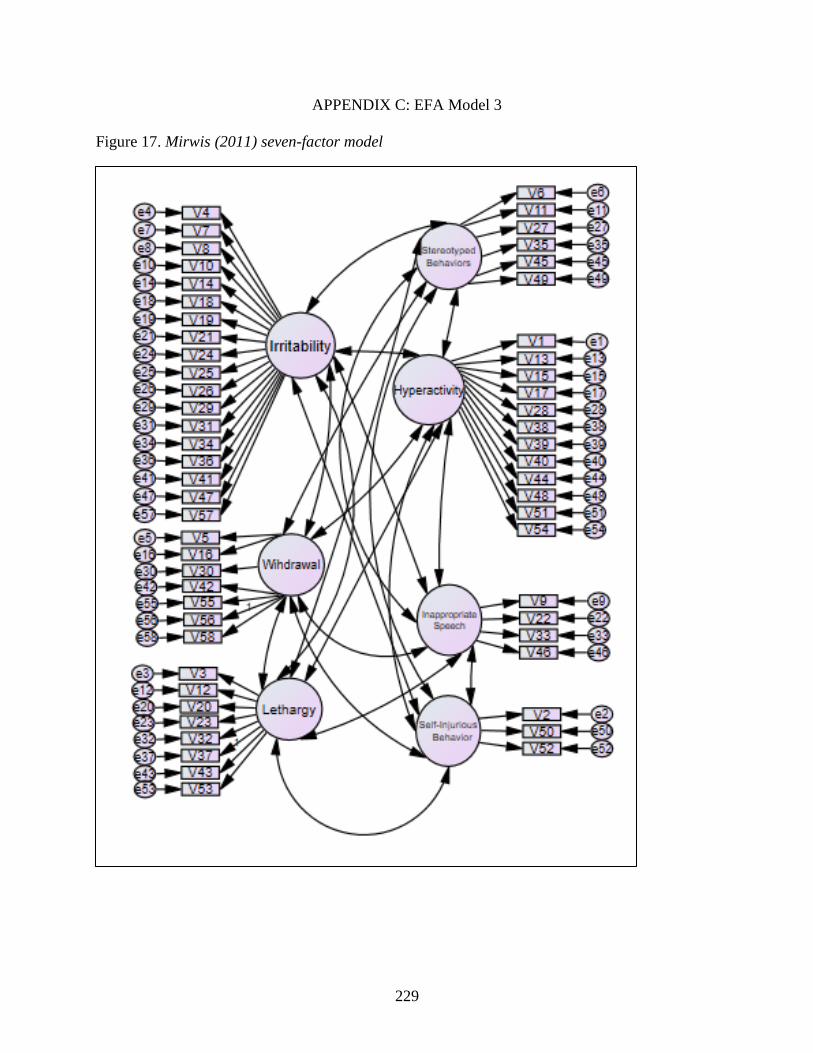
229
APPENDIX C: EFA Model 3
Figure 17. Mirwis (2011) seven-factor model
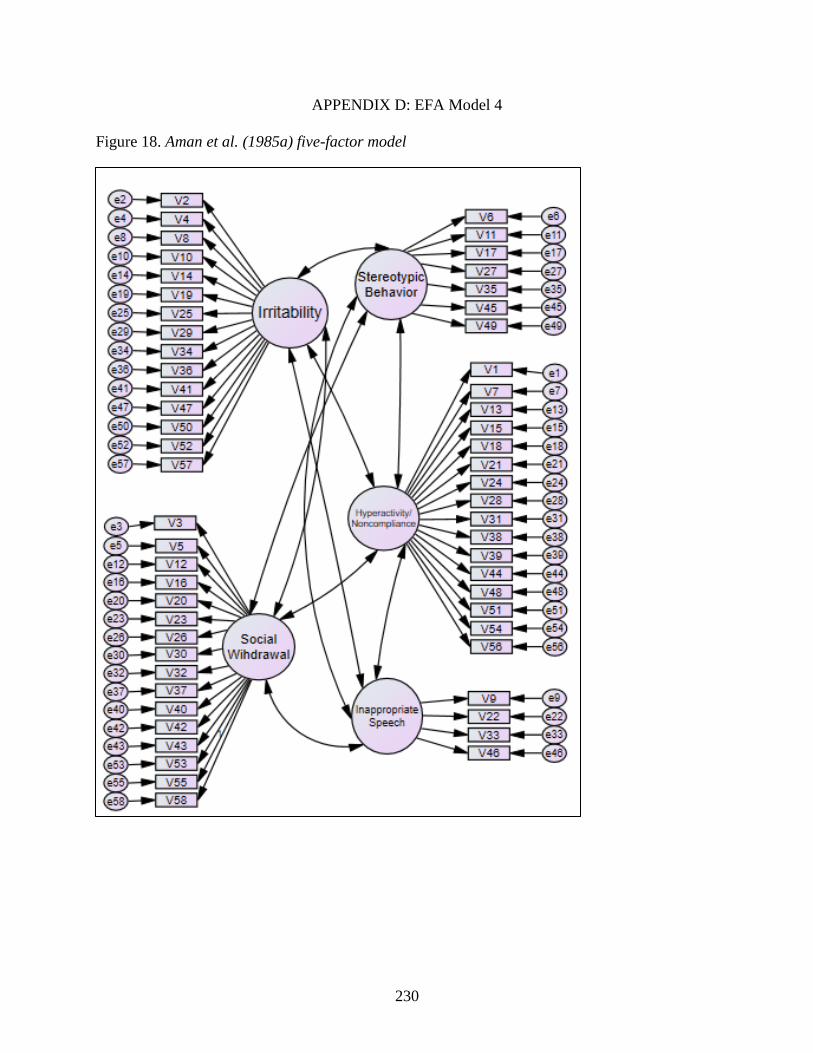
230
APPENDIX D: EFA Model 4
Figure 18. Aman et al. (1985a) five-factor model
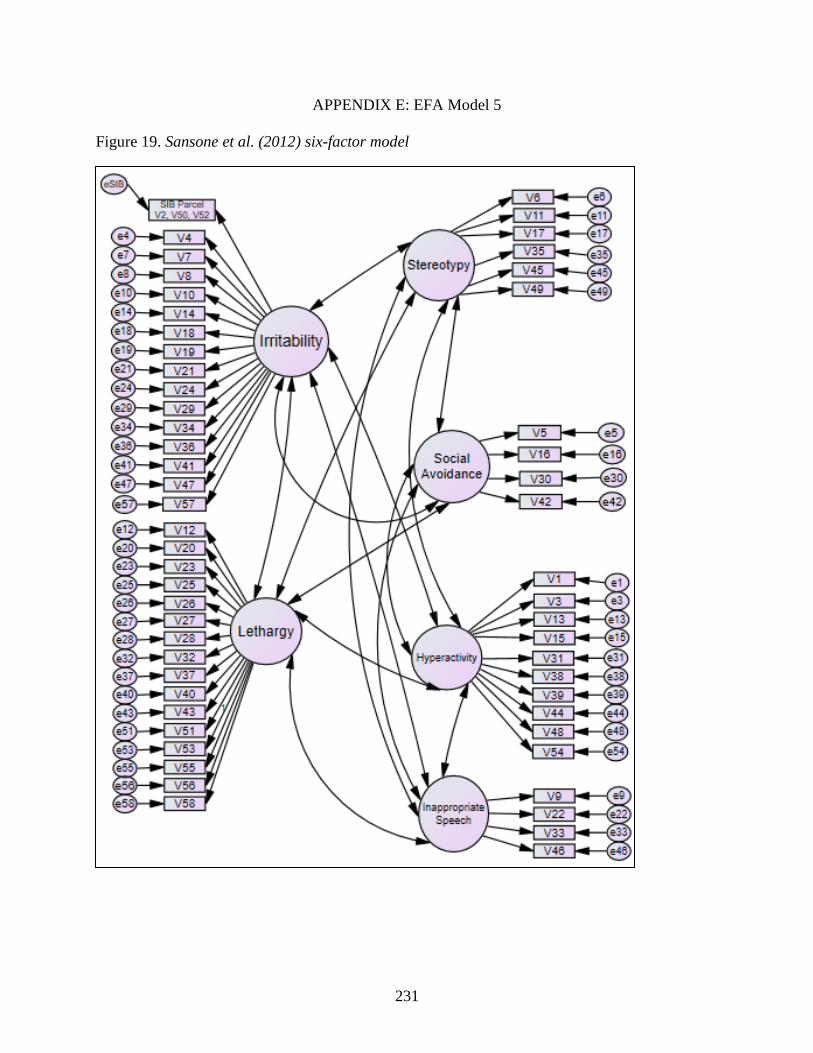
231
APPENDIX E: EFA Model 5
Figure 19. Sansone et al. (2012) six-factor model

232
APPENDIX F: EFA Model 6
Figure 20. Study one nine-factor model

233
APPENDIX G: Inter-Item Polychoric Correlation Matrix
Table 32. Study One Inter-Item Polychoric Correlation Matrix (N = 300)
Item 1 2 3 4 5 6 7 8 9 10
1 (.869)
2 0.339 (.942)
3 -0.014 0.256 (.758)
4 0.408 0.653 0.131 (.722)
5 0.276 0.235 0.433 0.270 (.895)
6 0.373 0.464 0.258 0.346 0.524 (.856)
7 0.671 0.544 0.135 0.619 0.318 0.597 (.791)
8 0.478 0.479 0.238 0.532 0.364 0.437 0.732 (.910)
9 0.238 -0.025 -0.028 0.142 0.161 0.237 0.329 0.367 (.723)
10 0.409 0.686 0.170 0.710 0.317 0.392 0.604 0.702 0.158 (.900)
11 0.398 0.470 0.219 0.363 0.521 0.855 0.565 0.446 0.174 0.460
12 0.227 0.291 0.510 0.210 0.594 0.564 0.376 0.365 0.157 0.285
13 0.617 0.493 0.141 0.584 0.439 0.493 0.682 0.639 0.294 0.598
14 0.354 0.419 0.306 0.480 0.324 0.297 0.456 0.549 0.184 0.679
15 0.747 0.426 0.122 0.438 0.331 0.508 0.703 0.541 0.276 0.494
16 0.266 0.284 0.457 0.251 0.849 0.548 0.386 0.409 0.172 0.368
17 0.495 0.461 0.295 0.380 0.618 0.687 0.611 0.506 0.227 0.467
18 0.553 0.581 0.189 0.722 0.405 0.389 0.651 0.659 0.152 0.785
19 0.508 0.511 0.201 0.503 0.376 0.425 0.725 0.910 0.358 0.719
20 0.293 0.292 0.545 0.265 0.494 0.434 0.429 0.395 0.141 0.357
21 0.576 0.455 0.114 0.614 0.345 0.431 0.791 0.687 0.384 0.626
22 0.190 0.185 0.033 0.246 0.270 0.392 0.446 0.365 0.708 0.319
23 0.023 0.043 0.579 -0.024 0.455 0.220 0.112 0.086 0.039 -0.033
24 0.379 0.479 0.347 0.608 0.537 0.340 0.501 0.545 0.175 0.655
25 0.152 0.294 0.489 0.266 0.460 0.249 0.324 0.333 0.105 0.421
26 0.184 0.171 0.381 0.238 0.488 0.224 0.341 0.266 0.053 0.231
27 0.292 0.332 0.385 0.302 0.423 0.665 0.491 0.304 0.184 0.299
28 0.436 0.311 0.334 0.303 0.632 0.556 0.494 0.450 0.273 0.410
29 0.515 0.479 0.201 0.595 0.415 0.411 0.609 0.600 0.156 0.735
30 0.229 0.227 0.447 0.220 0.895 0.522 0.308 0.325 0.077 0.327
31 0.571 0.493 0.155 0.665 0.406 0.440 0.721 0.740 0.296 0.671
32 0.155 0.118 0.497 0.071 0.394 0.256 0.258 0.208 0.021 0.194
33 0.199 0.206 0.014 0.284 0.336 0.405 0.415 0.415 0.723 0.288
34 0.308 0.381 0.383 0.368 0.430 0.409 0.470 0.549 0.296 0.582
35 0.359 0.392 0.259 0.316 0.482 0.856 0.529 0.355 0.150 0.356
36 0.478 0.619 0.288 0.578 0.399 0.516 0.584 0.578 0.115 0.752
37 0.230 0.334 0.489 0.321 0.537 0.392 0.333 0.368 -0.017 0.350
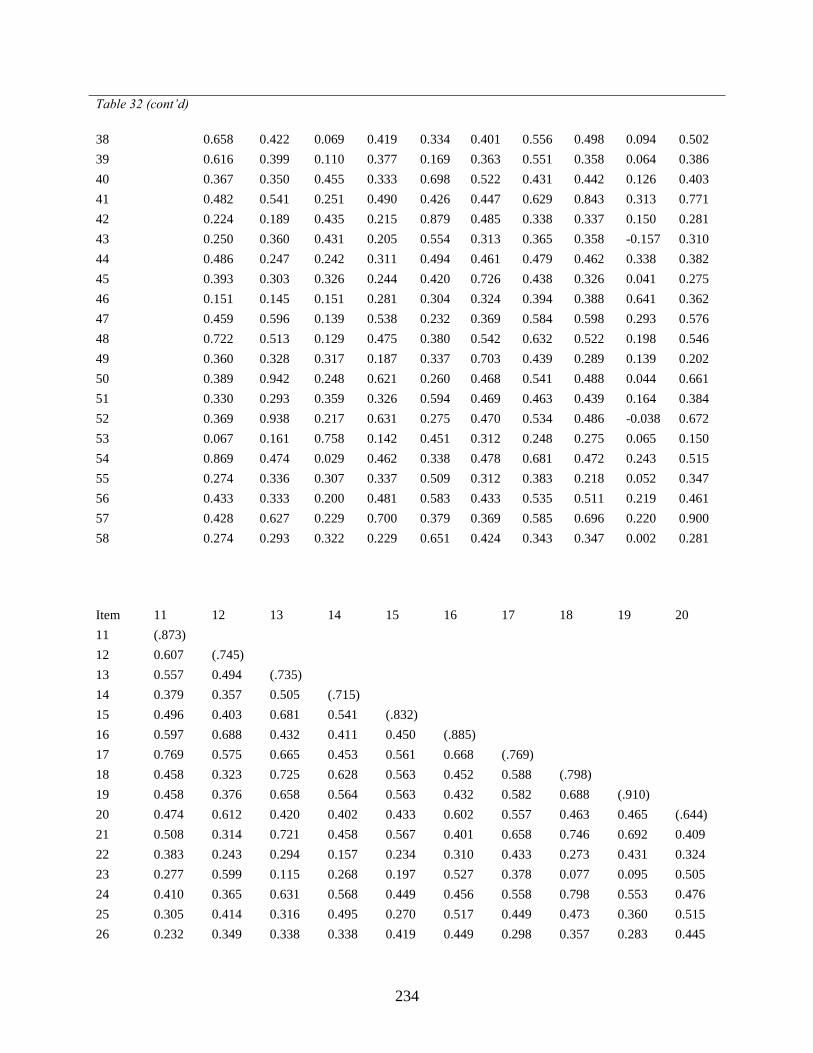
234
Table 32 (cont’d)
38 0.658 0.422 0.069 0.419 0.334 0.401 0.556 0.498 0.094 0.502
39 0.616 0.399 0.110 0.377 0.169 0.363 0.551 0.358 0.064 0.386
40 0.367 0.350 0.455 0.333 0.698 0.522 0.431 0.442 0.126 0.403
41 0.482 0.541 0.251 0.490 0.426 0.447 0.629 0.843 0.313 0.771
42 0.224 0.189 0.435 0.215 0.879 0.485 0.338 0.337 0.150 0.281
43 0.250 0.360 0.431 0.205 0.554 0.313 0.365 0.358 -0.157 0.310
44 0.486 0.247 0.242 0.311 0.494 0.461 0.479 0.462 0.338 0.382
45 0.393 0.303 0.326 0.244 0.420 0.726 0.438 0.326 0.041 0.275
46 0.151 0.145 0.151 0.281 0.304 0.324 0.394 0.388 0.641 0.362
47 0.459 0.596 0.139 0.538 0.232 0.369 0.584 0.598 0.293 0.576
48 0.722 0.513 0.129 0.475 0.380 0.542 0.632 0.522 0.198 0.546
49 0.360 0.328 0.317 0.187 0.337 0.703 0.439 0.289 0.139 0.202
50 0.389 0.942 0.248 0.621 0.260 0.468 0.541 0.488 0.044 0.661
51 0.330 0.293 0.359 0.326 0.594 0.469 0.463 0.439 0.164 0.384
52 0.369 0.938 0.217 0.631 0.275 0.470 0.534 0.486 -0.038 0.672
53 0.067 0.161 0.758 0.142 0.451 0.312 0.248 0.275 0.065 0.150
54 0.869 0.474 0.029 0.462 0.338 0.478 0.681 0.472 0.243 0.515
55 0.274 0.336 0.307 0.337 0.509 0.312 0.383 0.218 0.052 0.347
56 0.433 0.333 0.200 0.481 0.583 0.433 0.535 0.511 0.219 0.461
57 0.428 0.627 0.229 0.700 0.379 0.369 0.585 0.696 0.220 0.900
58 0.274 0.293 0.322 0.229 0.651 0.424 0.343 0.347 0.002 0.281
Item 11 12 13 14 15 16 17 18 19 20
11 (.873)
12 0.607 (.745)
13 0.557 0.494 (.735)
14 0.379 0.357 0.505 (.715)
15 0.496 0.403 0.681 0.541 (.832)
16 0.597 0.688 0.432 0.411 0.450 (.885)
17 0.769 0.575 0.665 0.453 0.561 0.668 (.769)
18 0.458 0.323 0.725 0.628 0.563 0.452 0.588 (.798)
19 0.458 0.376 0.658 0.564 0.563 0.432 0.582 0.688 (.910)
20 0.474 0.612 0.420 0.402 0.433 0.602 0.557 0.463 0.465 (.644)
21 0.508 0.314 0.721 0.458 0.567 0.401 0.658 0.746 0.692 0.409
22 0.383 0.243 0.294 0.157 0.234 0.310 0.433 0.273 0.431 0.324
23 0.277 0.599 0.115 0.268 0.197 0.527 0.378 0.077 0.095 0.505
24 0.410 0.365 0.631 0.568 0.449 0.456 0.558 0.798 0.553 0.476
25 0.305 0.414 0.316 0.495 0.270 0.517 0.449 0.473 0.360 0.515
26 0.232 0.349 0.338 0.338 0.419 0.449 0.298 0.357 0.283 0.445

235
Table 32 (cont’d)
27 0.642 0.480 0.357 0.342 0.393 0.429 0.558 0.375 0.287 0.447
28 0.598 0.654 0.621 0.434 0.544 0.656 0.673 0.530 0.485 0.557
29 0.490 0.378 0.696 0.542 0.522 0.434 0.525 0.703 0.601 0.444
30 0.588 0.607 0.399 0.395 0.361 0.885 0.653 0.405 0.325 0.555
31 0.504 0.334 0.735 0.555 0.582 0.451 0.643 0.769 0.746 0.423
32 0.346 0.421 0.208 0.305 0.178 0.456 0.376 0.320 0.212 0.531
33 0.359 0.271 0.302 0.134 0.298 0.374 0.436 0.302 0.474 0.256
34 0.426 0.410 0.482 0.715 0.431 0.419 0.467 0.483 0.567 0.400
35 0.873 0.612 0.472 0.320 0.476 0.574 0.719 0.362 0.371 0.409
36 0.565 0.517 0.691 0.601 0.535 0.442 0.617 0.675 0.610 0.483
37 0.486 0.652 0.407 0.422 0.389 0.598 0.524 0.426 0.392 0.585
38 0.464 0.328 0.626 0.516 0.766 0.370 0.502 0.647 0.501 0.330
39 0.409 0.274 0.513 0.372 0.785 0.287 0.421 0.483 0.404 0.337
40 0.568 0.659 0.564 0.427 0.519 0.729 0.702 0.512 0.472 0.638
41 0.491 0.390 0.648 0.697 0.551 0.443 0.594 0.686 0.884 0.451
42 0.550 0.599 0.396 0.269 0.331 0.859 0.570 0.346 0.332 0.579
43 0.439 0.590 0.411 0.342 0.390 0.567 0.523 0.360 0.398 0.578
44 0.497 0.578 0.631 0.507 0.599 0.555 0.602 0.479 0.508 0.455
45 0.760 0.506 0.480 0.276 0.515 0.528 0.664 0.307 0.348 0.394
46 0.340 0.265 0.297 0.239 0.230 0.379 0.447 0.314 0.474 0.303
47 0.418 0.284 0.552 0.391 0.492 0.344 0.522 0.596 0.568 0.353
48 0.594 0.386 0.700 0.479 0.779 0.458 0.616 0.617 0.549 0.377
49 0.636 0.479 0.390 0.298 0.510 0.463 0.534 0.282 0.307 0.393
50 0.488 0.331 0.493 0.434 0.448 0.341 0.476 0.556 0.535 0.333
51 0.572 0.682 0.544 0.395 0.477 0.660 0.596 0.483 0.462 0.626
52 0.452 0.311 0.500 0.369 0.401 0.321 0.471 0.557 0.530 0.301
53 0.331 0.745 0.300 0.361 0.271 0.550 0.347 0.223 0.283 0.644
54 0.485 0.262 0.674 0.443 0.832 0.395 0.600 0.590 0.519 0.369
55 0.384 0.396 0.488 0.316 0.456 0.531 0.464 0.443 0.298 0.537
56 0.453 0.469 0.645 0.535 0.459 0.562 0.592 0.636 0.520 0.448
57 0.447 0.304 0.627 0.676 0.481 0.401 0.478 0.758 0.687 0.398
58 0.528 0.621 0.392 0.320 0.420 0.734 0.543 0.395 0.392 0.640
Item 21 22 23 24 25 26 27 28 29 30
21 (.871)
22 0.479 (.847)
23 0.107 0.192 (.720)
24 0.663 0.255 0.322 (.798)
25 0.363 0.081 0.529 0.574 (.637)
26 0.380 0.137 0.450 0.538 0.444 (.750)

236
Table 32 (cont’d)
27 0.447 0.272 0.358 0.381 0.397 0.258 (.731)
28 0.546 0.352 0.467 0.601 0.495 0.407 0.502 (.824)
29 0.663 0.241 0.056 0.647 0.466 0.274 0.353 0.601 (.820)
30 0.366 0.236 0.558 0.502 0.559 0.506 0.463 0.657 0.476 (.918)
31 0.871 0.368 0.124 0.690 0.407 0.370 0.392 0.568 0.671 0.403
32 0.287 0.082 0.659 0.420 0.637 0.333 0.386 0.426 0.242 0.482
33 0.448 0.734 0.027 0.267 0.146 0.166 0.210 0.314 0.166 0.241
34 0.513 0.379 0.280 0.549 0.390 0.270 0.327 0.531 0.563 0.435
35 0.435 0.339 0.324 0.365 0.329 0.228 0.731 0.551 0.407 0.561
36 0.625 0.184 0.198 0.649 0.501 0.259 0.398 0.550 0.678 0.409
37 0.359 0.076 0.594 0.605 0.588 0.476 0.514 0.678 0.410 0.584
38 0.565 0.125 0.132 0.560 0.287 0.333 0.325 0.550 0.564 0.391
39 0.507 0.092 0.149 0.411 0.159 0.272 0.361 0.450 0.407 0.266
40 0.489 0.245 0.597 0.596 0.551 0.483 0.387 0.755 0.522 0.750
41 0.638 0.378 0.127 0.606 0.390 0.228 0.346 0.542 0.656 0.391
42 0.381 0.243 0.546 0.517 0.554 0.589 0.432 0.637 0.454 0.918
43 0.341 0.024 0.541 0.456 0.416 0.419 0.410 0.577 0.350 0.585
44 0.477 0.345 0.433 0.495 0.347 0.279 0.401 0.719 0.513 0.527
45 0.342 0.190 0.344 0.288 0.192 0.233 0.567 0.476 0.362 0.498
46 0.444 0.847 0.184 0.332 0.126 0.132 0.203 0.396 0.276 0.227
47 0.592 0.321 0.070 0.469 0.354 0.200 0.305 0.424 0.556 0.281
48 0.574 0.226 0.100 0.474 0.254 0.258 0.448 0.574 0.547 0.406
49 0.346 0.122 0.272 0.301 0.240 0.235 0.669 0.429 0.252 0.349
50 0.487 0.193 0.053 0.462 0.296 0.155 0.395 0.349 0.503 0.258
51 0.501 0.242 0.477 0.542 0.451 0.430 0.436 0.824 0.496 0.600
52 0.472 0.156 0.042 0.462 0.299 0.139 0.354 0.350 0.508 0.277
53 0.169 0.037 0.720 0.380 0.524 0.433 0.407 0.536 0.269 0.468
54 0.629 0.283 0.054 0.437 0.173 0.201 0.337 0.484 0.552 0.342
55 0.425 0.218 0.340 0.469 0.430 0.750 0.379 0.486 0.411 0.548
56 0.634 0.295 0.271 0.683 0.419 0.450 0.317 0.743 0.581 0.570
57 0.655 0.292 0.010 0.698 0.411 0.270 0.314 0.504 0.820 0.423
58 0.379 0.187 0.508 0.483 0.388 0.419 0.328 0.653 0.400 0.712
Item 31 32 33 34 35 36 37 38 39 40
31 (.871)
32 0.230 (.659)
33 0.384 0.039 (.734)
34 0.549 0.247 0.350 (.727)
35 0.457 0.276 0.377 0.398 (.873)
36 0.648 0.348 0.213 0.600 0.518 (.752)

237
Table 32 (cont’d)
37 0.444 0.541 0.069 0.303 0.479 0.469 (.751)
38 0.609 0.164 0.144 0.408 0.412 0.535 0.444 (.798)
39 0.539 0.135 0.096 0.331 0.385 0.450 0.417 0.798 (.798)
40 0.529 0.535 0.268 0.430 0.560 0.570 0.721 0.514 0.458 (.772)
41 0.711 0.200 0.403 0.727 0.430 0.695 0.413 0.576 0.455 0.538
42 0.415 0.507 0.276 0.351 0.508 0.394 0.608 0.313 0.240 0.727
43 0.471 0.450 -0.024 0.335 0.448 0.439 0.684 0.397 0.451 0.742
44 0.538 0.326 0.313 0.507 0.470 0.509 0.575 0.528 0.454 0.626
45 0.396 0.203 0.237 0.314 0.825 0.423 0.392 0.438 0.436 0.566
46 0.362 0.100 0.712 0.406 0.324 0.262 0.145 0.159 0.120 0.301
47 0.599 0.155 0.365 0.424 0.369 0.552 0.307 0.424 0.437 0.361
48 0.578 0.186 0.234 0.402 0.543 0.575 0.437 0.744 0.685 0.477
49 0.411 0.240 0.245 0.287 0.694 0.436 0.427 0.391 0.420 0.376
50 0.493 0.126 0.253 0.389 0.440 0.634 0.359 0.428 0.413 0.352
51 0.546 0.414 0.198 0.401 0.491 0.495 0.751 0.465 0.431 0.772
52 0.489 0.127 0.181 0.336 0.437 0.646 0.362 0.401 0.363 0.373
53 0.186 0.633 -0.005 0.355 0.331 0.397 0.671 0.098 0.179 0.564
54 0.612 0.154 0.286 0.410 0.439 0.542 0.273 0.721 0.730 0.456
55 0.334 0.391 0.168 0.157 0.332 0.478 0.466 0.366 0.349 0.549
56 0.658 0.320 0.267 0.508 0.406 0.529 0.568 0.568 0.360 0.679
57 0.674 0.213 0.294 0.596 0.363 0.728 0.388 0.552 0.422 0.520
58 0.412 0.491 0.210 0.304 0.468 0.433 0.641 0.412 0.370 0.714
Item 41 42 43 44 45 46 47 48 49 50
41 (.884)
42 0.360 (.981)
43 0.455 0.613 (.742)
44 0.561 0.508 0.493 (.719)
45 0.409 0.477 0.442 0.508 (.825)
46 0.465 0.239 0.050 0.429 0.234 (.847)
47 0.604 0.265 0.335 0.357 0.304 0.326 (.665)
48 0.627 0.348 0.406 0.534 0.550 0.209 0.619 (.812)
49 0.335 0.406 0.376 0.504 0.695 0.174 0.249 0.496 (.703)
50 0.587 0.241 0.332 0.307 0.355 0.193 0.665 0.570 0.379 (.958)
51 0.484 0.666 0.703 0.646 0.438 0.307 0.370 0.493 0.428 0.356
52 0.565 0.241 0.356 0.280 0.308 0.143 0.626 0.552 0.321 0.958
53 0.258 0.507 0.568 0.454 0.303 0.175 0.221 0.193 0.342 0.191
54 0.550 0.305 0.317 0.505 0.446 0.206 0.501 0.812 0.414 0.528
55 0.289 0.609 0.430 0.296 0.281 0.235 0.365 0.422 0.254 0.380
56 0.566 0.567 0.435 0.593 0.309 0.354 0.374 0.488 0.351 0.369

238
Table 32 (cont’d)
57 0.789 0.395 0.371 0.421 0.330 0.365 0.643 0.594 0.249 0.651
58 0.397 0.736 0.685 0.525 0.398 0.164 0.345 0.431 0.374 0.365
Item 51 52 53 54 55 56 57 58
51 (.824)
52 0.362 (.958)
53 0.594 0.177 (.758)
54 0.401 0.490 0.047 (.869)
55 0.481 0.374 0.419 0.378 (.750)
56 0.734 0.395 0.317 0.463 0.490 (.743)
57 0.466 0.645 0.190 0.518 0.414 0.589 (.900)
58 0.715 0.386 0.538 0.380 0.531 0.545 0.388 (.736)
Note: Prior communalities before rotation are found on the diagonal in parentheses.
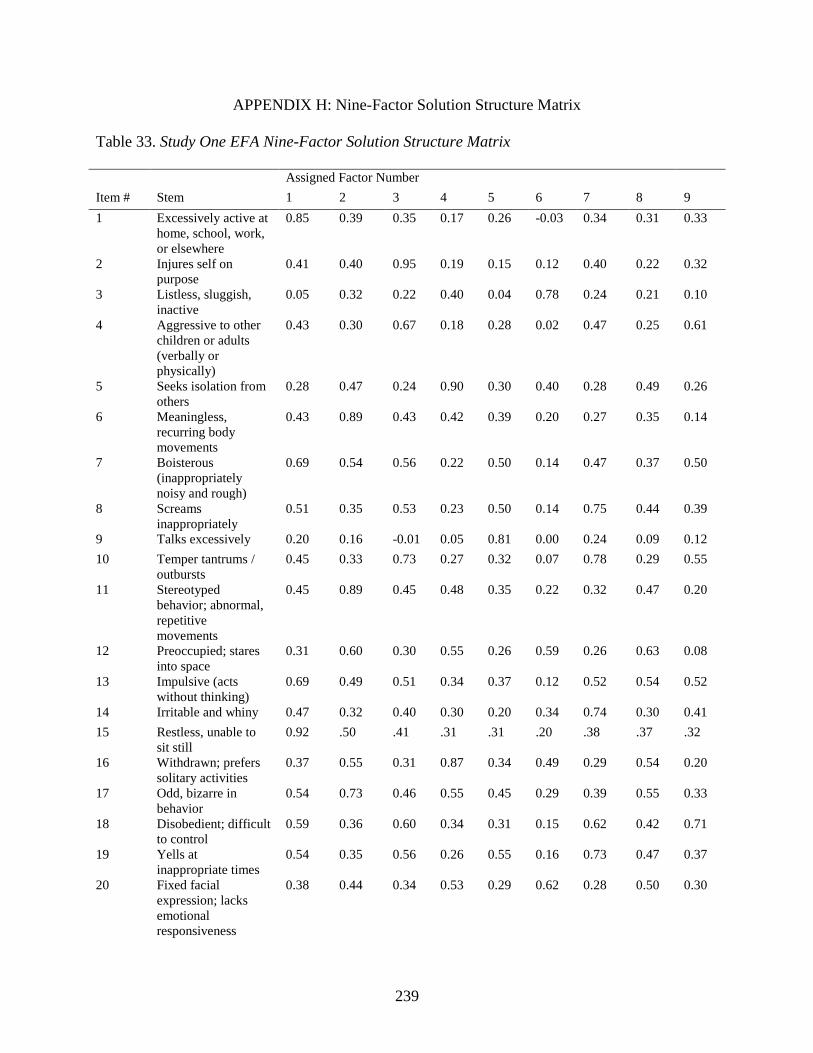
239
APPENDIX H: Nine-Factor Solution Structure Matrix
Table 33. Study One EFA Nine-Factor Solution Structure Matrix
Assigned Factor Number Item # Stem 1 2 3 4 5 6 7 8 9
1 Excessively active at
home, school, work,
or elsewhere
0.85 0.39 0.35 0.17 0.26 -0.03 0.34 0.31 0.33
2 Injures self on
purpose
0.41 0.40 0.95 0.19 0.15 0.12 0.40 0.22 0.32
3 Listless, sluggish,
inactive
0.05 0.32 0.22 0.40 0.04 0.78 0.24 0.21 0.10
4 Aggressive to other
children or adults
(verbally or
physically)
0.43 0.30 0.67 0.18 0.28 0.02 0.47 0.25 0.61
5 Seeks isolation from
others
0.28 0.47 0.24 0.90 0.30 0.40 0.28 0.49 0.26
6 Meaningless,
recurring body
movements
0.43 0.89 0.43 0.42 0.39 0.20 0.27 0.35 0.14
7 Boisterous
(inappropriately
noisy and rough)
0.69 0.54 0.56 0.22 0.50 0.14 0.47 0.37 0.50
8 Screams
inappropriately
0.51 0.35 0.53 0.23 0.50 0.14 0.75 0.44 0.39
9 Talks excessively 0.20 0.16 -0.01 0.05 0.81 0.00 0.24 0.09 0.12
10 Temper tantrums /
outbursts
0.45 0.33 0.73 0.27 0.32 0.07 0.78 0.29 0.55
11 Stereotyped
behavior; abnormal,
repetitive
movements
0.45 0.89 0.45 0.48 0.35 0.22 0.32 0.47 0.20
12 Preoccupied; stares
into space
0.31 0.60 0.30 0.55 0.26 0.59 0.26 0.63 0.08
13 Impulsive (acts
without thinking)
0.69 0.49 0.51 0.34 0.37 0.12 0.52 0.54 0.52
14 Irritable and whiny 0.47 0.32 0.40 0.30 0.20 0.34 0.74 0.30 0.41
15 Restless, unable to
sit still
0.92 .50 .41 .31 .31 .20 .38 .37 .32
16 Withdrawn; prefers
solitary activities
0.37 0.55 0.31 0.87 0.34 0.49 0.29 0.54 0.20
17 Odd, bizarre in
behavior
0.54 0.73 0.46 0.55 0.45 0.29 0.39 0.55 0.33
18 Disobedient; difficult
to control
0.59 0.36 0.60 0.34 0.31 0.15 0.62 0.42 0.71
19 Yells at
inappropriate times
0.54 0.35 0.56 0.26 0.55 0.16 0.73 0.47 0.37
20 Fixed facial
expression; lacks
emotional
responsiveness
0.38 0.44 0.34 0.53 0.29 0.62 0.28 0.50 0.30

240
Table 33 (cont’d)
21 Disturbs others 0.61 0.44 0.49 0.28 0.54 0.10 0.49 0.45 0.70
22 Repetitive speech 0.18 0.29 0.19 0.21 0.90 0.04 0.21 0.18 0.18
23 Does nothing but sit
and watch others
0.12 0.33 -0.01 0.51 0.10 0.81 0.03 0.42 0.07
24 Uncooperative 0.45 0.34 0.47 0.48 0.28 0.36 0.54 0.48 0.72
25 Depressed mood 0.20 0.30 0.29 0.50 0.12 0.62 0.38 0.33 0.48
26 Resists any form of
physical contact
0.35 0.19 0.17 0.58 0.15 0.53 0.07 0.22 0.54
27 Moves or rolls head
back and forth
repetitively
0.35 0.77 0.32 0.32 0.23 0.42 0.20 0.28 0.28
28 Does not pay
attention to
instructions
0.52 0.55 0.31 0.60 0.37 0.41 0.37 0.77 0.36
29 Demands must be
met immediately
0.52 0.39 0.53 0.39 0.25 0.12 0.66 0.46 0.58
30 Isolates
himself/herself from
other children or
adults
0.32 0.52 0.24 0.94 0.21 0.47 0.28 0.49 0.27
31 Disrupts group
activities
0.62 0.45 0.51 0.31 0.43 0.10 0.61 0.53 0.64
32 Sits or stands in one
position for a long
time
0.16 0.31 0.11 0.44 0.07 0.70 0.16 0.35 0.32
33 Talks to self loudly 0.21 0.32 0.23 0.25 0.84 -0.02 0.23 0.13 0.14
34 Cries over minor
annoyances and
hurts
0.37 0.38 0.35 0.33 0.40 0.30 0.75 0.33 0.26
35 Repetitive hand,
body, or head
movements
0.41 0.93 0.39 0.45 0.32 0.25 0.25 0.41 0.14
36 Mood changes
quickly
0.52 0.51 0.65 0.35 0.23 0.28 0.63 0.45 0.47
37 Unresponsive to
structured activities
(does not react)
0.36 0.47 0.34 0.54 0.06 0.64 0.25 0.70 0.34
38 Does not stay in seat
(e.g., during lesson
or training periods,
meals, etc.)
0.83 0.41 0.39 0.31 0.14 0.07 0.44 0.45 0.40
39 Will not sit still for
any length of time
0.84 0.40 0.38 0.18 0.10 0.14 0.26 0.39 0.27
40 Is difficult to reach,
contact, or get
through to
0.48 0.52 0.35 0.72 0.25 0.52 0.33 0.73 0.33
41 Cries and screams
inappropriately
0.55 0.40 0.59 0.32 0.46 0.17 0.84 0.48 0.32
42 Prefers to be alone 0.29 0.48 0.22 0.93 0.25 0.50 0.18 0.52 0.32
43 Does not try to
communicate by
words or gestures
0.40 0.41 0.35 0.55 -0.02 0.54 0.24 0.69 0.19
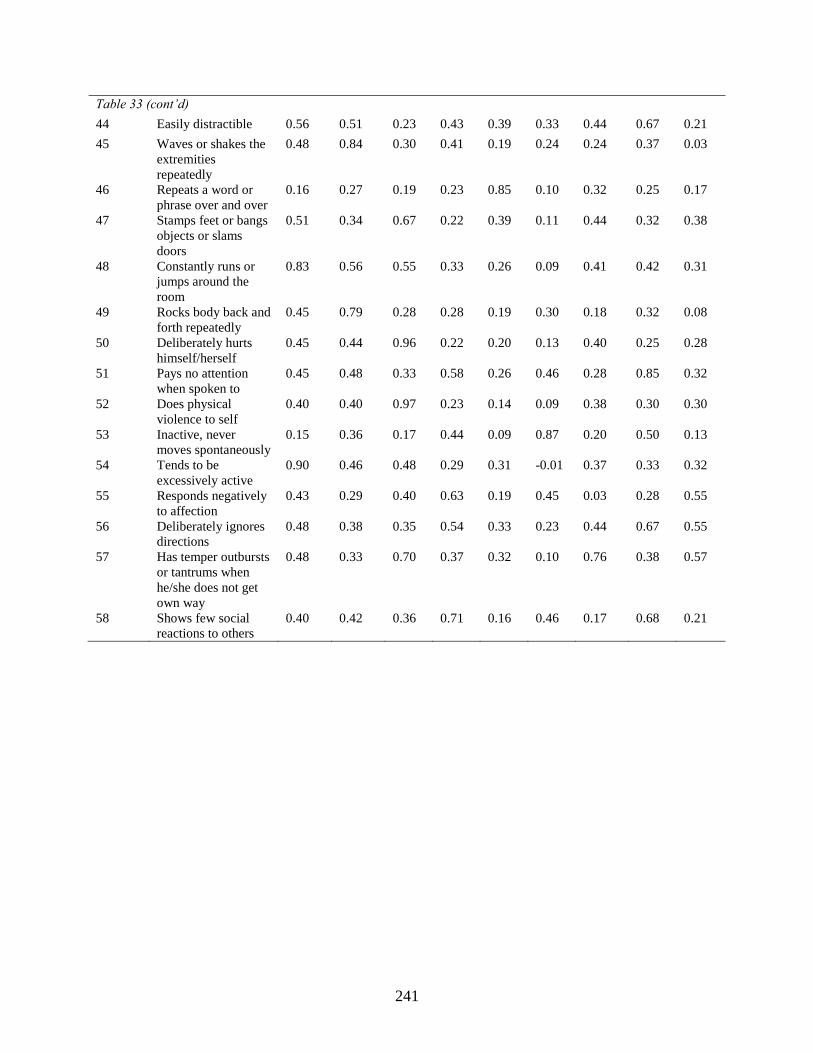
241
Table 33 (cont’d)
44 Easily distractible 0.56 0.51 0.23 0.43 0.39 0.33 0.44 0.67 0.21
45 Waves or shakes the
extremities
repeatedly
0.48 0.84 0.30 0.41 0.19 0.24 0.24 0.37 0.03
46 Repeats a word or
phrase over and over
0.16 0.27 0.19 0.23 0.85 0.10 0.32 0.25 0.17
47 Stamps feet or bangs
objects or slams
doors
0.51 0.34 0.67 0.22 0.39 0.11 0.44 0.32 0.38
48 Constantly runs or
jumps around the
room
0.83 0.56 0.55 0.33 0.26 0.09 0.41 0.42 0.31
49 Rocks body back and
forth repeatedly
0.45 0.79 0.28 0.28 0.19 0.30 0.18 0.32 0.08
50 Deliberately hurts
himself/herself
0.45 0.44 0.96 0.22 0.20 0.13 0.40 0.25 0.28
51 Pays no attention
when spoken to
0.45 0.48 0.33 0.58 0.26 0.46 0.28 0.85 0.32
52 Does physical
violence to self
0.40 0.40 0.97 0.23 0.14 0.09 0.38 0.30 0.30
53 Inactive, never
moves spontaneously
0.15 0.36 0.17 0.44 0.09 0.87 0.20 0.50 0.13
54 Tends to be
excessively active
0.90 0.46 0.48 0.29 0.31 -0.01 0.37 0.33 0.32
55 Responds negatively
to affection
0.43 0.29 0.40 0.63 0.19 0.45 0.03 0.28 0.55
56 Deliberately ignores
directions
0.48 0.38 0.35 0.54 0.33 0.23 0.44 0.67 0.55
57 Has temper outbursts
or tantrums when
he/she does not get
own way
0.48 0.33 0.70 0.37 0.32 0.10 0.76 0.38 0.57
58 Shows few social
reactions to others
0.40 0.42 0.36 0.71 0.16 0.46 0.17 0.68 0.21

242
APPENDIX I: Brinkley et al. (2007) Four-Factor Model Study Two CFA Statistics
Table 34. Brinkley et al. (2007) Four-Factor Model Parameter Estimates, Standard Errors, Two-
Tailed p-Value, R2, Residual Variance
Factor Item # Parameter
Estimate
Standard Error
(S.E.)
Parameter
Estimate/
Standard
Error (S.E.)
Two-Tailed
p-Value
R2 Residual
Variance
Hyperactivity
34 1.000 0.000 a a 1.000 0.000
1 0.805 0.026 31.206 < .001 0.648 0.352
4 0.706 0.036 19.476 < .001 0.499 0.501
7 0.833 0.022 38.127 < .001 0.693 0.307
8 0.828 0.024 33.899 < .001 0.685 0.315
9 0.348 0.063 5.481 < .001 0.121 0.879
10 0.872 0.019 47.03 < .001 0.761 0.239
13 0.765 0.030 25.519 < .001 0.585 0.415
14 0.769 0.030 25.679 < .001 0.591 0.409
15 0.836 0.022 37.162 < .001 0.699 0.301
18 0.867 0.020 42.933 < .001 0.751 0.249
19 0.844 0.022 38.558 < .001 0.713 0.287
21 0.796 0.028 28.812 < .001 0.634 0.366
24 0.869 0.018 48.658 < .001 0.755 0.245
28 0.807 0.028 29.038 < .001 0.652 0.348
29 0.814 0.026 30.995 < .001 0.663 0.337
31 0.838 0.021 39.655 < .001 0.702 0.298
33 0.450 0.058 7.700 < .001 0.202 0.798
36 0.848 0.023 37.006 < .001 0.720 0.280
38 0.817 0.026 31.581 < .001 0.668 0.332
39 0.813 0.029 28.215 < .001 0.661 0.339
41 0.826 0.026 31.737 < .001 0.683 0.317
44 0.647 0.040 15.989 < .001 0.419 0.581
47 0.780 0.031 24.876 < .001 0.609 0.391
48 0.799 0.030 26.908 < .001 0.638 0.362
51 0.807 0.026 31.159 < .001 0.651 0.349
54 0.857 0.022 38.358 < .001 0.734 0.266
56 0.784 0.028 27.709 < .001 0.615 0.385
57 0.839 0.022 38.097 < .001 0.704 0.296
Lethargy
3 0.482 0.068 7.086 < .001 0.232 0.768
5 0.875 0.020 43.348 < .001 0.766 0.234
16 0.877 0.021 41.351 < .001 0.769 0.231
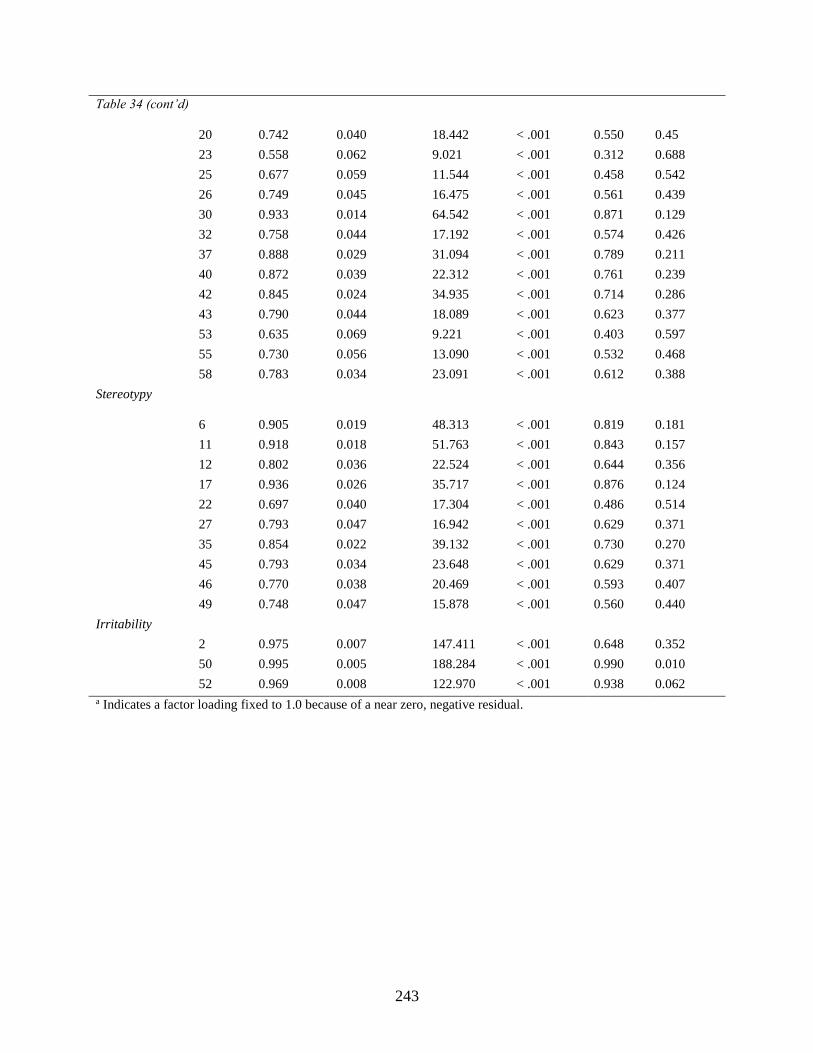
243
Table 34 (cont’d)
20 0.742 0.040 18.442 < .001 0.550 0.45
23 0.558 0.062 9.021 < .001 0.312 0.688
25 0.677 0.059 11.544 < .001 0.458 0.542
26 0.749 0.045 16.475 < .001 0.561 0.439
30 0.933 0.014 64.542 < .001 0.871 0.129
32 0.758 0.044 17.192 < .001 0.574 0.426
37 0.888 0.029 31.094 < .001 0.789 0.211
40 0.872 0.039 22.312 < .001 0.761 0.239
42 0.845 0.024 34.935 < .001 0.714 0.286
43 0.790 0.044 18.089 < .001 0.623 0.377
53 0.635 0.069 9.221 < .001 0.403 0.597
55 0.730 0.056 13.090 < .001 0.532 0.468
58 0.783 0.034 23.091 < .001 0.612 0.388
Stereotypy
6 0.905 0.019 48.313 < .001 0.819 0.181
11 0.918 0.018 51.763 < .001 0.843 0.157
12 0.802 0.036 22.524 < .001 0.644 0.356
17 0.936 0.026 35.717 < .001 0.876 0.124
22 0.697 0.040 17.304 < .001 0.486 0.514
27 0.793 0.047 16.942 < .001 0.629 0.371
35 0.854 0.022 39.132 < .001 0.730 0.270
45 0.793 0.034 23.648 < .001 0.629 0.371
46 0.770 0.038 20.469 < .001 0.593 0.407
49 0.748 0.047 15.878 < .001 0.560 0.440
Irritability
2 0.975 0.007 147.411 < .001 0.648 0.352
50 0.995 0.005 188.284 < .001 0.990 0.010
52 0.969 0.008 122.970 < .001 0.938 0.062
a Indicates a factor loading fixed to 1.0 because of a near zero, negative residual.
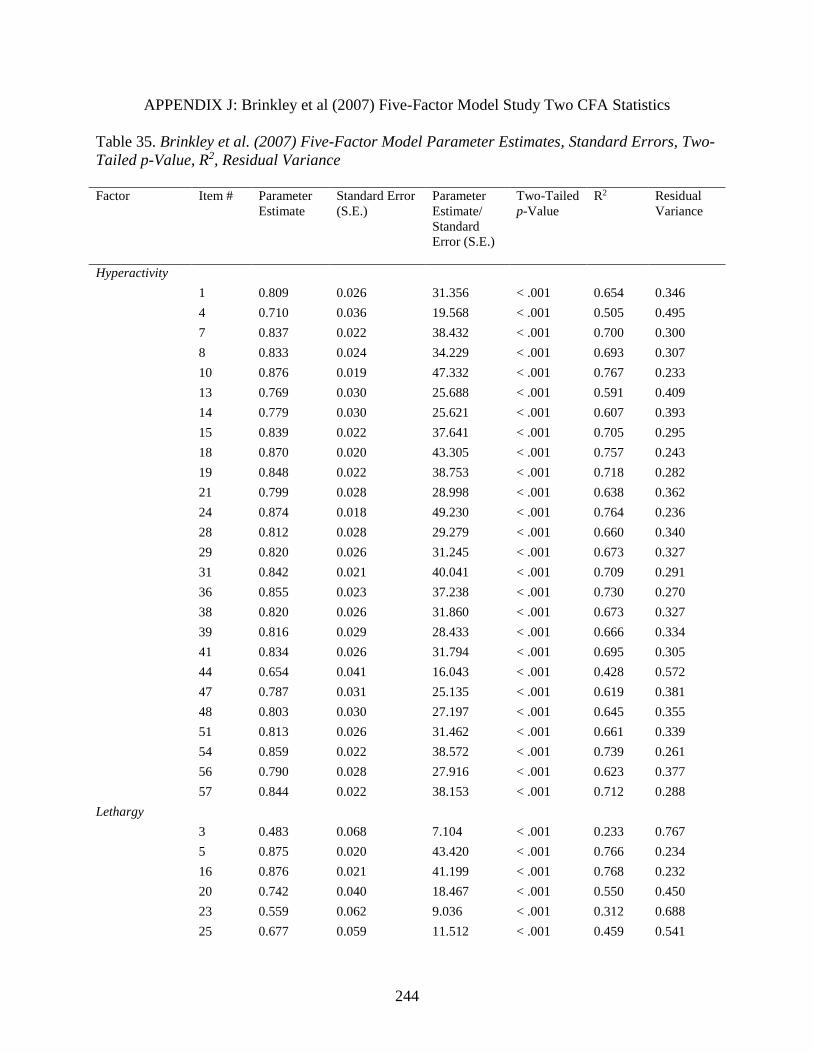
244
APPENDIX J: Brinkley et al (2007) Five-Factor Model Study Two CFA Statistics
Table 35. Brinkley et al. (2007) Five-Factor Model Parameter Estimates, Standard Errors, Two-
Tailed p-Value, R2, Residual Variance
Factor Item # Parameter
Estimate
Standard Error
(S.E.)
Parameter
Estimate/
Standard
Error (S.E.)
Two-Tailed
p-Value
R2 Residual
Variance
Hyperactivity
1 0.809 0.026 31.356 < .001 0.654 0.346
4 0.710 0.036 19.568 < .001 0.505 0.495
7 0.837 0.022 38.432 < .001 0.700 0.300
8 0.833 0.024 34.229 < .001 0.693 0.307
10 0.876 0.019 47.332 < .001 0.767 0.233
13 0.769 0.030 25.688 < .001 0.591 0.409
14 0.779 0.030 25.621 < .001 0.607 0.393
15 0.839 0.022 37.641 < .001 0.705 0.295
18 0.870 0.020 43.305 < .001 0.757 0.243
19 0.848 0.022 38.753 < .001 0.718 0.282
21 0.799 0.028 28.998 < .001 0.638 0.362
24 0.874 0.018 49.230 < .001 0.764 0.236
28 0.812 0.028 29.279 < .001 0.660 0.340
29 0.820 0.026 31.245 < .001 0.673 0.327
31 0.842 0.021 40.041 < .001 0.709 0.291
36 0.855 0.023 37.238 < .001 0.730 0.270
38 0.820 0.026 31.860 < .001 0.673 0.327
39 0.816 0.029 28.433 < .001 0.666 0.334
41 0.834 0.026 31.794 < .001 0.695 0.305
44 0.654 0.041 16.043 < .001 0.428 0.572
47 0.787 0.031 25.135 < .001 0.619 0.381
48 0.803 0.030 27.197 < .001 0.645 0.355
51 0.813 0.026 31.462 < .001 0.661 0.339
54 0.859 0.022 38.572 < .001 0.739 0.261
56 0.790 0.028 27.916 < .001 0.623 0.377
57 0.844 0.022 38.153 < .001 0.712 0.288
Lethargy
3 0.483 0.068 7.104 < .001 0.233 0.767
5 0.875 0.020 43.420 < .001 0.766 0.234
16 0.876 0.021 41.199 < .001 0.768 0.232
20 0.742 0.040 18.467 < .001 0.550 0.450
23 0.559 0.062 9.036 < .001 0.312 0.688
25 0.677 0.059 11.512 < .001 0.459 0.541
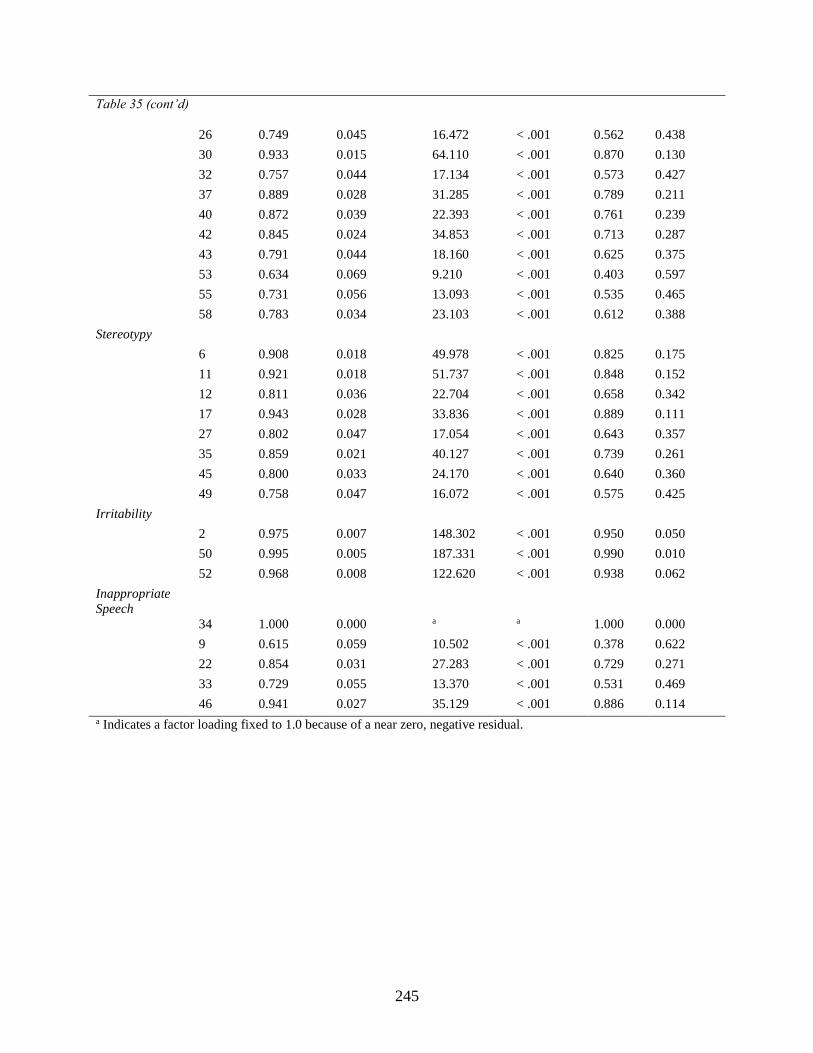
245
Table 35 (cont’d)
26 0.749 0.045 16.472 < .001 0.562 0.438
30 0.933 0.015 64.110 < .001 0.870 0.130
32 0.757 0.044 17.134 < .001 0.573 0.427
37 0.889 0.028 31.285 < .001 0.789 0.211
40 0.872 0.039 22.393 < .001 0.761 0.239
42 0.845 0.024 34.853 < .001 0.713 0.287
43 0.791 0.044 18.160 < .001 0.625 0.375
53 0.634 0.069 9.210 < .001 0.403 0.597
55 0.731 0.056 13.093 < .001 0.535 0.465
58 0.783 0.034 23.103 < .001 0.612 0.388
Stereotypy
6 0.908 0.018 49.978 < .001 0.825 0.175
11 0.921 0.018 51.737 < .001 0.848 0.152
12 0.811 0.036 22.704 < .001 0.658 0.342
17 0.943 0.028 33.836 < .001 0.889 0.111
27 0.802 0.047 17.054 < .001 0.643 0.357
35 0.859 0.021 40.127 < .001 0.739 0.261
45 0.800 0.033 24.170 < .001 0.640 0.360
49 0.758 0.047 16.072 < .001 0.575 0.425
Irritability
2 0.975 0.007 148.302 < .001 0.950 0.050
50 0.995 0.005 187.331 < .001 0.990 0.010
52 0.968 0.008 122.620 < .001 0.938 0.062
Inappropriate
Speech
34 1.000 0.000 a a 1.000 0.000
9 0.615 0.059 10.502 < .001 0.378 0.622
22 0.854 0.031 27.283 < .001 0.729 0.271
33 0.729 0.055 13.370 < .001 0.531 0.469
46 0.941 0.027 35.129 < .001 0.886 0.114
a Indicates a factor loading fixed to 1.0 because of a near zero, negative residual.

246
APPENDIX K: Aman et al. (1985a) Five-Factor Model Study Two CFA Statistics
Table 36. Aman et al. (1985a) Five-Factor Model Parameter Estimates, Standard Errors, Two-
Tailed p-Value, R2, Residual Variance
Factor Item # Parameter
Estimate
Standard Error
(S.E.)
Parameter
Estimate/
Standard
Error (S.E.)
Two-Tailed
p-Value
R2 Residual
Variance
Irritability
2 0.936 0.009 100.271 < .001 0.876 0.124
4 0.741 0.035 20.907 < .001 0.549 0.451
8 0.866 0.024 36.830 < .001 0.751 0.249
10 0.916 0.016 56.129 < .001 0.838 0.162
14 0.820 0.029 28.439 < .001 0.672 0.328
19 0.887 0.022 41.134 < .001 0.786 0.214
25 0.629 0.062 10.102 < .001 0.395 0.605
29 0.863 0.025 34.553 < .001 0.745 0.255
34 0.719 0.038 18.792 < .001 0.518 0.482
36 0.899 0.022 40.147 < .001 0.809 0.191
41 0.867 0.025 34.778 < .001 0.752 0.248
47 0.826 0.031 26.686 < .001 0.682 0.318
50 0.986 0.006 165.461 < .001 0.972 0.028
52 0.941 0.010 97.571 < .001 0.885 0.115
57 0.882 0.020 43.125 < .001 0.778 0.222
Lethargy, Social
Withdrawal
3 0.479 0.068 7.052 < .001 0.229 0.771
5 0.874 0.020 43.115 < .001 0.763 0.237
12 0.805 0.034 23.544 < .001 0.649 0.351
16 0.872 0.021 40.992 < .001 0.761 0.239
20 0.738 0.041 18.196 < .001 0.544 0.456
23 0.556 0.062 8.999 < .001 0.309 0.691
26 0.745 0.046 16.180 < .001 0.555 0.445
30 0.931 0.015 63.342 < .001 0.867 0.133
32 0.751 0.044 16.966 < .001 0.564 0.436
37 0.879 0.028 31.096 < .001 0.773 0.227
40 0.865 0.037 23.252 < .001 0.748 0.252
42 0.842 0.024 34.597 < .001 0.709 0.291
43 0.787 0.044 18.063 < .001 0.619 0.381
53 0.631 0.069 9.144 < .001 0.398 0.602
55 0.727 0.057 12.852 < .001 0.529 0.471

247
Table 36 (cont’d)
58 0.778 0.034 22.793 < .001 0.605 0.395
Stereotypic
Behavior
6 0.915 0.018 51.283 < .001 0.838 0.162
11 0.929 0.018 52.512 < .001 0.864 0.136
17 0.963 0.030 32.536 < .001 0.928 0.072
27 0.813 0.047 17.391 < .001 0.661 0.339
35 0.869 0.021 41.248 < .001 0.755 0.245
45 0.811 0.033 24.731 < .001 0.657 0.343
49 0.770 0.047 16.536 < .001 0.593 0.407
Hyperactivity/
Noncompliance
1 0.822 0.025 32.467 < .001 0.676 0.234
7 0.863 0.021 40.138 < .001 0.744 0.256
13 0.791 0.029 26.890 < .001 0.626 0.374
15 0.851 0.022 39.588 < .001 0.725 0.275
18 0.898 0.020 44.558 < .001 0.806 0.194
21 0.822 0.028 29.833 < .001 0.675 0.325
24 0.905 0.017 51.911 < .001 0.819 0.181
28 0.827 0.027 30.449 < .001 0.685 0.315
31 0.862 0.020 42.368 < .001 0.744 0.256
38 0.837 0.025 33.574 < .001 0.701 0.299
39 0.833 0.028 29.665 < .001 0.693 0.307
44 0.671 0.041 16.336 < .001 0.451 0.549
48 0.824 0.029 28.860 < .001 0.679 0.321
51 0.830 0.026 32.329 < .001 0.690 0.310
54 0.870 0.022 40.153 < .001 0.756 0.244
56 0.809 0.028 28.827 < .001 0.654 0.346
Inappropriate
Speech
46 1.000 0.000 a a 1.000 0.000
9 0.701 0.056 12.447 < .001 0.491 0.509
22 0.896 0.027 33.741 < .001 0.803 0.197
33 0.830 0.053 15.556 < .001 0.689 0.311
a Indicates a factor loading fixed to 1.0 because of a near zero, negative residual.

248
APPENDIX L: Sansone et al. (2012) Six-Factor Model Study Two CFA Statistics
Table 37. Sansone et al. (2012) Six-Factor Model Parameter Estimates, Standard Errors, Two-
Tailed p-Value, R2, Residual Variance
Factor
Item #
Parameter
Estimate
Standard Error
(S.E.)
Parameter
Estimate/
Standard
Error (S.E.)
Two-Tailed
p-Value
R2
Residual
Variance
Irritability
4 0.726 0.036 19.986 < .001 0.528 0.472
7 0.869 0.021 40.788 < .001 0.756 0.244
8 0.853 0.023 36.606 < .001 0.728 0.272
10 0.892 0.018 50.865 < .001 0.796 0.204
14 0.802 0.029 27.576 < .001 0.643 0.357
18 0.897 0.019 46.070 < .001 0.805 0.195
19 0.869 0.021 41.535 < .001 0.755 0.245
21 0.832 0.027 30.307 < .001 0.692 0.308
24 0.907 0.017 53.036 < .001 0.822 0.178
29 0.845 0.025 33.428 < .001 0.714 0.286
34 0.708 0.038 18.539 < .001 0.501 0.499
36 0.879 0.022 39.303 < .001 0.773 0.227
41 0.855 0.025 34.346 < .001 0.731 0.269
47 0.808 0.031 25.788 < .001 0.652 0.348
57 0.864 0.021 41.127 < .001 0.746 0.254
59 0.675 0.048 14.056 < .001 0.456 0.544
Hyperactivity
1 0.855 0.023 36.766 < .001 0.731 0.269
3 0.390 0.076 5.1270 < .001 0.152 0.848
13 0.842 0.029 28.856 < .001 0.709 0.291
15 0.884 0.019 46.543 < .001 0.782 0.218
31 0.936 0.021 43.580 < .001 0.876 0.124
32 -0.202 0.086 -2.364 < .001 0.598 0.402
38 0.880 0.022 39.584 < .001 0.775 0.225
39 0.864 0.026 33.476 < .001 0.746 0.254
44 0.723 0.044 16.564 < .001 0.522 0.478
48 0.866 0.025 34.636 < .001 0.751 0.249
54 0.898 0.019 46.826 < .001 0.806 0.194
Socially
Unresponsive/
Lethargic
12 0.758 0.033 23.193 < .001 0.575 0.425
20 0.709 0.042 17.005 < .001 0.503 0.497

249
Table 37 (cont’d)
23 0.523 0.061 8.546 < .001 0.274 0.726
25 0.646 0.059 10.921 < .001 0.418 0.582
26 0.721 0.047 15.178 < .001 0.519 0.481
27 0.754 0.049 15.334 < .001 0.568 0.432
28 0.866 0.025 34.050 < .001 0.749 0.251
32 0.891 0.069 12.830 < .001 0.598 0.402
37 0.837 0.029 29.157 < .001 0.701 0.299
40 0.803 0.033 24.293 < .001 0.645 0.355
43 0.747 0.042 17.770 < .001 0.558 0.442
51 0.867 0.020 43.038 < .001 0.752 0.248
53 0.596 0.068 8.706 < .001 0.355 0.645
55 0.706 0.057 12.467 < .001 0.499 0.501
56 0.874 0.029 30.352 < .001 0.765 0.235
58 0.753 0.035 21.409 < .001 0.568 0.432
Social Avoidance
5 0.919 0.017 53.443 < .001 0.844 0.156
16 0.938 0.018 51.814 < .001 0.880 0.120
30 0.973 0.013 75.062 < .001 0.946 0.054
42 0.891 0.021 41.841 < .001 0.793 0.207
Stereotypy
6 0.915 0.018 51.545 < .001 0.837 0.163
11 0.928 0.017 53.635 < .001 0.862 0.138
17 0.964 0.030 32.509 < .001 0.929 0.071
35 0.869 0.021 41.072 < .001 0.756 0.244
45 0.814 0.032 25.156 < .001 0.663 0.337
49 0.775 0.049 15.771 < .001 0.600 0.400
Inappropriate
Speech
46 1.000 0.000 a a 1.000 0.000
9 0.706 0.056 12.697 < .001 0.498 0.502
22 0.896 0.026 33.961 < .001 0.803 0.197
33 0.830 0.052 15.841 < .001 0.690 0.310
a Indicates a factor loading fixed to 1.0 because of a near zero, negative residual.
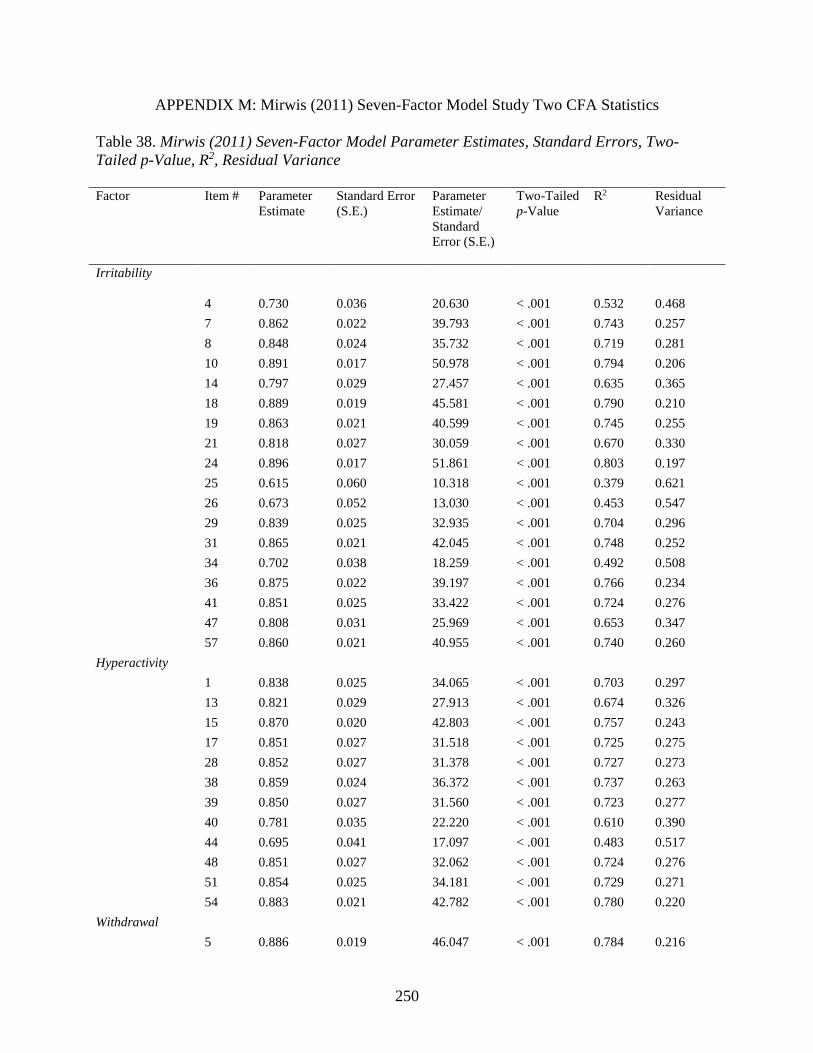
250
APPENDIX M: Mirwis (2011) Seven-Factor Model Study Two CFA Statistics
Table 38. Mirwis (2011) Seven-Factor Model Parameter Estimates, Standard Errors, Two-
Tailed p-Value, R2, Residual Variance
Factor Item # Parameter
Estimate
Standard Error
(S.E.)
Parameter
Estimate/
Standard
Error (S.E.)
Two-Tailed
p-Value
R2 Residual
Variance
Irritability
4 0.730 0.036 20.630 < .001 0.532 0.468
7 0.862 0.022 39.793 < .001 0.743 0.257
8 0.848 0.024 35.732 < .001 0.719 0.281
10 0.891 0.017 50.978 < .001 0.794 0.206
14 0.797 0.029 27.457 < .001 0.635 0.365
18 0.889 0.019 45.581 < .001 0.790 0.210
19 0.863 0.021 40.599 < .001 0.745 0.255
21 0.818 0.027 30.059 < .001 0.670 0.330
24 0.896 0.017 51.861 < .001 0.803 0.197
25 0.615 0.060 10.318 < .001 0.379 0.621
26 0.673 0.052 13.030 < .001 0.453 0.547
29 0.839 0.025 32.935 < .001 0.704 0.296
31 0.865 0.021 42.045 < .001 0.748 0.252
34 0.702 0.038 18.259 < .001 0.492 0.508
36 0.875 0.022 39.197 < .001 0.766 0.234
41 0.851 0.025 33.422 < .001 0.724 0.276
47 0.808 0.031 25.969 < .001 0.653 0.347
57 0.860 0.021 40.955 < .001 0.740 0.260
Hyperactivity
1 0.838 0.025 34.065 < .001 0.703 0.297
13 0.821 0.029 27.913 < .001 0.674 0.326
15 0.870 0.020 42.803 < .001 0.757 0.243
17 0.851 0.027 31.518 < .001 0.725 0.275
28 0.852 0.027 31.378 < .001 0.727 0.273
38 0.859 0.024 36.372 < .001 0.737 0.263
39 0.850 0.027 31.560 < .001 0.723 0.277
40 0.781 0.035 22.220 < .001 0.610 0.390
44 0.695 0.041 17.097 < .001 0.483 0.517
48 0.851 0.027 32.062 < .001 0.724 0.276
51 0.854 0.025 34.181 < .001 0.729 0.271
54 0.883 0.021 42.782 < .001 0.780 0.220
Withdrawal
5 0.886 0.019 46.047 < .001 0.784 0.216

251
Table 38 (cont’d)
16 0.889 0.020 44.091 < .001 0.790 0.210
30 0.944 0.014 67.104 < .001 0.891 0.109
42 0.852 0.023 36.482 < .001 0.726 0.274
55 0.749 0.059 12.714 < .001 0.561 0.439
56 0.981 0.041 23.841 < .001 0.963 0.037
58 0.803 0.036 22.088 < .001 0.645 0.355
Lethargy
3 0.500 0.069 7.195 < .001 0.250 0.750
12 0.844 0.036 23.655 < .001 0.712 0.288
20 0.780 0.042 18.420 < .001 0.609 0.391
23 0.580 0.063 9.212 < .001 0.336 0.664
32 0.784 0.044 17.791 < .001 0.615 0.385
37 0.928 0.029 32.210 < .001 0.861 0.139
43 0.828 0.044 18.642 < .001 0.686 0.314
53 0.662 0.070 9.475 < .001 0.439 0.561
Stereotyped
Behaviors
6 0.934 0.018 52.979 < .001 0.873 0.127
11 0.950 0.018 53.930 < .001 0.902 0.098
27 0.849 0.047 18.259 < .001 0.721 0.279
35 0.892 0.020 43.750 < .001 0.796 0.204
45 0.838 0.032 26.393 < .001 0.702 0.298
49 0.802 0.046 17.506 < .001 0.643 0.357
Inappropriate
Speech
46 1.000 0.000 a a 1.000 0.000
9 0.708 0.055 12.765 < .001 0.501 0.499
22 0.896 0.026 33.859 < .001 0.802 0.198
33 0.831 0.052 15.871 < .001 0.691 0.309
Self-Injurious
Behavior
2 0.975 0.007 147.880 < .001 0.951 0.049
50 0.995 0.005 189.340 < .001 0.989 0.011
52 0.969 0.008 122.751 < .001 0.938 0.062
a Indicates a factor loading fixed to 1.0 because of a near zero, negative residual.

252
REFERENCES
253
REFERENCES
Abbeduto, L, McDuffie, A., & Thurman, A. J. (2014). The Fragile X syndrome—autism
comorbidity: What do we really know? Frontiers in Genetics, 5, 355.
doi:10.3389/fgene.2014.00355
Achenbach, T. M., & Rescorla, L. A. (2000). Manual for the ASEBA preschool forms and
profiles. Burlington, VT: University of Vermont, Research Center for Children, Youth, &
Families.
Achenbach, T. M., & Rescorla, L. A. (2001). Manual for the ASEBA school-age forms and
profiles. Burlington, VT: University of Vermont, Research Center for Children, Youth, &
Families.
Allen, R. A., Robins, D. L., & Decker, S. L. (2008). Autism spectrum disorders: Neurobiology
and current assessment practices. Psychology in the Schools, 45(10), 905-917.
doi:10.1002/pits.20341
Allison, P. D. (2002). Quantitative applications in the social sciences: Missing data. Thousand
Oaks, CA: Sage Publications Ltd. doi:10.4135/9781412985079
Aman, M. G., Burrow, W. H., & Wolford, P. L. (1995). The Aberrant Behavior Checklist-
Community: Factor validity and effect of subject variables for adults in group homes.
American Journal of Mental Retardation, 100(3), 283-292.
Aman, M. G., Richmond, G., Stewart, A. W., Bell, J. C., Kissel, R. C. (1987). The Aberrant
Behavior Checklist: Factor structure and the effect of subject variables in American and
New Zealand facilities. American Journal of Mental Deficiency, 91(6), 570-578.
Aman, M. G., & Singh, N. N. (1986). Aberrant Behavior Checklist: Manual. East Aurora, NY:
Slosson Educational Publications, Inc.
Aman, M. G., & Singh, N. N. (1994). Aberrant Behavior Checklist—Community:
Supplementary manual. East Aurora, NY: Slosson Educational Publications, Inc.
Aman, M. G., & Singh, N. N. (2017). Aberrant Behavior Checklist Manual (2nd ed.). East
Aurora, NY: Slosson Educational Productions, Inc.
Aman, M. G., Singh, N. N., Stewart, A. W., & Field, C. J. (1985b). Psychometric characteristics
of the Aberrant Behavior Checklist. American Journal of Mental Deficiency, 89(5), 492-
502.
Aman, M. G., Singh, N. N., Stewart, A. W., & Field, C. J. (1985a). The Aberrant Behavior

254
Checklist: A behavior rating scale for the assessment of treatment effects. American
Journal of Mental Deficiency, 89(5), 485-491.
American Psychiatric Association (1994). Diagnostic and statistical manual of mental disorders
(4rd ed.). Washington, DC: Author.
American Psychiatric Association (2000). Diagnostic and statistical manual of mental disorders
(4rd ed., text rev.). Washington, DC: Author.
American Psychiatric Association (2013). Diagnostic and statistical manual of mental disorders
(5th ed.). Washington, DC: Author.
Amir, R. E., Van den Veyver, I. B., Wan, M., Tran, C. Q., Francke, U., & Zoghbi, H. Y. (1999).
Rett syndrome is caused by mutations in X-linked MECP2, encoding methyl-CpG-
binding protein 2. Nature Genetics, 23(2), 185-188. doi:10.1038/13810
Araten-Bergman, T. (2015). The subjective well-being of individuals diagnosed with comorbid
intellectual disability and attention deficit hyperactivity disorders. Quality of Life
Research, 24(8), 1875-1886. doi:10.1007/s11136-015-1036-1
Baio, J., Wiggins, L., Christensen, D. L., Maenner, M. J., Daniels, J., Warren, Z., . . . Dowling,
N. F. (2018). Prevalence of autism spectrum disorders among children aged 8 years—
Autism and developmental disabilities monitoring network, 11 sites, United States, 2014.
Morbidity and Mortality Weekly Report Surveillance Summaries, 67(6), 1-23.
doi:10.15585/mmwr.ss6706a1
Bartlett, M. S. (1950). Tests of significance in factor analysis. British Journal of Mathematical
and Statistical Psychology, 3(2), 77-85. doi:10.1111/j.2044-8317.1950.tb00285.x
Basto, M., & Pereira, J. M. (2012). An SPSS R-menu for ordinal factor analysis. Journal of
Statistical Software, 46(4), 1-29. doi:10.18637/jss.v046.i04
Bayley, N. (1969). Bayley Scales of Infant Development. San Antonio, TX: The Psychological
Corporation.
Bayley, N. (1993). Bayley Scales of Infant Development—Second Edition. San Antonio, TX: The
Psychological Corporation.
Bayley, N. (2006). Bayley Scales of Infant and Toddler Development-Third Edition. San
Antonio, TX: Harcourt Assessment
Beavers, A. S., Lounsbury, J. W., Richards, J. K., Huck, S. W., Skolits, G. J., & Esquivel, S. L.
(2013). Practical considerations for using exploratory factor analysis in educational
research. Practical Assessment, Research & Evaluation, 18(6), Retrieved from
http://pareonline.net/getvn.asp?v=18&n=6
255
Ben-Sasson, A., Cermak, S. A., Orsmond, G. I., Tager-Flusberg, H., Kadlec, M. B., & Carter, A.
S. (2008). Sensory clusters of toddlers with autism spectrum disorders: Differences in
affective symptoms. Journal of Child Psychology and Psychiatry, 49(8), 817-825.
doi:10.1111/j.1469-7610.2008.01899.x
Bihm, E. M., & Poindexter, A. R. (1991). Cross-validation of the factor structure of the Aberrant
Behavior Checklist for persons with mental retardation. American Journal of Mental
Retardation, 96(2), 209-211.
Bodfish, J. W., Symons, F. J., Parker, D. E., & Lewis, M. H. (2000). Varieties of repetitive
behavior in autism: Comparisons to mental retardation. Journal of Autism and
Developmental Disorders, 30(3), 237-243. doi:10.1023/A:1005596502855
Bolte, E. E., & Diehl, J. J. (2013). Measurement tools and target symptoms/skills used to assess
treatment response for individuals with autism spectrum disorder. Journal of Autism and
Developmental Disorders, 43(11), 2491-2501. doi:10.1007/s10803-013-1798-7
Bracken, B. A., & McCallum, R. S. (1998). The Universal Nonverbal Intelligence Test. Chicago,
IL: Riverside.
Brinkley, J., Nations, L., Abramson, R. K., Hall, A., Wright, H. H., Gabriels, R., . . . Cuccaro, M.
L. (2007). Factor analysis of the Aberrant Behavior Checklist in individuals with autism
spectrum disorders. Journal of Autism and Developmental Disorders, 37(10), 1949-
1959. doi:10.1007/s10803-006-0327-3
Brown, T. A. (2006). Confirmatory factor analysis for applied research. New York, NY:
Guilford Press.
Brown, E. C., Aman, M. G., & Havercamp, S. M. (2002). Factor analysis and norms for parent
ratings on the Aberrant Behavior Checklist-Community for young people in special
education. Research in Developmental Disabilities, 23(1), 45-60. doi:10.1016/S0891-
4222(01)00091-9
Browne, M. W., & Cudeck, R. (1993). Alternative ways of assessing model fit. In K. A. Bollen
& J. S. Long (Eds.), Testing structural equation models (pp. 136-162). Newbury Park,
CA: Sage Publications, Inc.
Byrne, M. B. (2012). Structural equation modeling with Mplus: Basic concepts, applications,
and programming. New York, NY: Taylor & Francis Group.
Cattell, R. B. (1966). The scree test for the number of factors. Multivariate Behavioral Research,
1(2), 245-276. doi:10.1207/s15327906mbr0102_10
Chebli, S. S., Martin, V., & Lanovaz, M. J. (2016). Prevalence of stereotypy in individuals with
developmental disabilities: A systematic review. Review of Journal of Autism and
Developmental Disorders, 3(2), 107-118. doi:10.1007/s40489-016-0069-x

256
Church, A. T., & Burke, P. J. (1994). Exploratory and confirmatory tests of the big five and
Tellegen’s three-and four-dimensional models. Journal of Personality and Social
Psychology, 66(1), 93-114. doi:10.1037/0022-3514.66.1.93
Cohen, I. L., & Sudhalter, V. S. (2005). Pervasive Developmental Disorder Behavior Inventory.
Lutz, FL: Psychological Assessment Resources.
Constantino, J. N., & Gruber, C. P. (2012). Social Responsiveness Scale (2nd ed.). Los Angeles,
CA: Western Psychological Services.
Courtney, M. G. R. (2013). Determining the number of factors to retain in EFA: Using the SPSS
R-menu v2.0 to make more judicious estimations. Practical Assessment, Research &
Evaluation, 18(8), 1-14. Retrieved from http://pareonline.net/getvn.asp?v=18&n=8
Cronbach, L. J. (1951). Coefficient alpha and the internal structure of tests. 16(3), 297-334.
doi:10.1007/BF02310555
Cunningham A. B., & Schreibman, L. (2008). Stereotypy in autism: The importance of function.
Research in Autism Spectrum Disorders, 2(3), 469-479. doi:10.1016/j.rasd.2007.09.006
Curran, P. J., West, S. G., & Finch, J. F. (1996). The robustness of test statistics to nonormality
and specification error in confirmatory factor analysis. Psychological Methods, 1(1), 16-
29. doi:10.1037/1082-989X.1.1.16
Davis, N. O., & Carter, A. S. (2014). Social development in autism. In F. R. Volkmar, S. J.
Rogers, R. Paul, & K. A. Pelphrey (Eds.), Handbook of autism and pervasive
developmental disorders: Diagnosis, development, and brain mechanisms (4th ed., Vol 1.,
pp. 212-229). Hoboken, NJ: Wiley & Sons, Inc.
Davis, N. O., & Kollins, S. H. (2012). Treatment for co-occurring attention deficit/hyperactivity
disorder and autism spectrum disorder. Neurotherapeutics, 9(3), 518-530.
doi:10.1007/s13311-012-0126-9
Diedenhofen, B., & Musch, J. (2015). Cocor: A comprehensive solution for the statistical
comparison of correlations. PLoS ONE, 10(4), 1-12. doi:10.1371/journal.pone.0121945
DiStefano, C., & Morgan G. B. (2014). A comparison of diagonal weighted least squares robust
estimation techniques for ordinal data. Structural Equation Modeling: A
Multidisciplinary Journal, 21(3), 425-438. doi:10.1080/10705511.2014.915373
Dua, E. H. (2014). Exploratory factor analysis of the Gilliam Autism Rating Scale—Second
Edition with a sample of students with autism spectrum disorders (Doctoral dissertation).
Available from ProQuest Dissertations and Theses Global database. (UMI No. 3629713)
Dunn, O. J., & Clark, V. A. (1969). Correlations measures on the same individuals. Journal of
the American Statistical Association, 64, 366-377. doi:10.1080/01621459.1969.10500981
257
Esbensen, A. J., Seltzer, M. M., Lam, K. S., & Bodfish, J. W. (2009). Age-related differences in
restricted repetitive behaviors in autism spectrum disorders. Journal of Autism and
Developmental Disorders, 39(1), 57-66. doi:10.1007/s10803-008-0599-x
Elliott, C. D. (1990). Differential Ability Scales. San Antonio, TX: The Psychological
Corporation.
Elliott, C. D. (2007). Differential Ability Scales, Second Edition. San Antonio, TX: Harcourt
Assessment.
Fabrigar, L. R., & Wegener, D. T. (2012). Exploratory factor analysis. New York, NY:
Oxford University Press.
Fabrigar, L. R., Wegener, D. T., MacCallum, R. C., & Strahan, E. J. (1999). Evaluating the use
of exploratory factor analysis in psychological research. Psychological Methods, 4(3),
272-299. doi:10.1037/1082-989X.4.3.272
Falkmer, T., Anderson, K., Falkmer, M., & Horlin, C. (2013). Diagnostic procedures in autism
spectrum disorders: A systematic literature review. European Child & Adolescent
Psychiatry, 22(6), 329-340. doi:10.1007/s00787-013-0375-0
Faul, F., Erdfelder, E., Buchner, A., & Lang, A-G. (2009). Statistical power analyses using
G*Power 3.1: Tests for correlation and regression analyses. Behavior Research Methods,
41, 1149-1160. doi:10.3758/BRM.41.4.1149
Fisher, R. A. (1925). Statistical methods for research workers. Edinburgh, Scotland: Oliver &
Boyd. Retrieved from http://psychclassics.yorku.ca/Fisher/Methods/
Floyd, F. J., & Widaman, K. F. (1995). Factor analysis in the development and refinement of
clinical assessment instruments. Psychological Assessment, 7(3), 286-299.
doi:10.1037/1040-3590.7.3.286
Freund, L. S., & Reiss, A. L. (1991). Rating problem behaviors in outpatients with mental
retardation: Use of the Aberrant Behavior Checklist. Research in Developmental
Disabilities, 12(4), 435-51. doi:10.1016/0891-4222(91)900037-S
Frazier, T. W., Youngstrom, E. A., Speer, L., Embacher, R., Law, P., Constantino, J. . . . Eng, C.
(2012). Validation of proposed DSM-5 criteria for autism spectrum disorder. Journal of
the American Academy of Child & Adolescent Psychiatry, 51(1), 28-40.e3.
doi:10.1016/j.jaac.2011.09.021
Gadermann, A. M., Guhn, M., & Zumbo, B. D. (2012). Estimating ordinal reliability for Likert-
type and ordinal item response data: A conceptual, empirical, and practical guide.
Practical Assessment, Research & Evaluation, 17(3), Retrieved from
http://pareonline.net/getvn.asp?v=17&n=3

258
Gerbing, D. W., & Hamilton, J. G. (1996). Viability of exploratory factor analysis as a precursor
to confirmatory factor analysis. Structural Equation Modeling, 3(1), 62-72.
doi:10.1080/10705519609540030
Gilliam, J. E. (1995). Gilliam Autism Rating Scale—Summary response form. Austin, TX: Pro-
Ed.
Gilliam, J. E. (2006). Gilliam Autism Rating Scale—Second edition: Examiner’s manual.
Austin, TX: Pro-Ed
Glorfield, L. W. (1995). An improvement on Horn’s parallel analysis methodology for selecting
the correct number of factors to retain. Educational and Psychological Measurement,
55(3), 377-393. doi:10.1177/0013164495055003002
Goldman, S., Wang, C., Salgado, M. W., Greene, P. E., Kim, M., & Rapin, I. (2009). Motor
stereotypies in children with autism and other developmental disorders. Developmental
Medicine & Child Neurology, 51(1), 30-38. doi:10.1111/j.1469-8749.2008.03178.x
Gorsuch, R. L. (1997). Exploratory factor analysis: It’s role in item analysis. Journal of
Personality Assessment, 68(3), 532-560. doi:10.1207/s15327752jpa6803_5
Guttman, L. (1954). Some necessary conditions for common factor analysis. Psychometrika, 19,
149-161.
Hammill, D. D., Pearson, N. A., & Wiederholt, J. L. (1996). Comprehensive Test of Nonverbal
Intelligence. Austin, TX: Pro-Ed.
Hampton, J., & Strand, P. S. (2015). A review of level 2 parent-report instruments used to screen
children aged 1.5-5 for autism: A meta-analytic update. Journal of Autism and
Developmental Disorders, 45(8), 2519-2530. doi:10.1007/s10803-015-2419-4
Happé, F. (2011). Criteria, categories, and continua: Autism and related disorders in DSM-5.
Journal of the American Academy of Child & Adolescent Psychiatry, 50(6), 540-542.
doi:10.1016/j.jaac.2011.03.015
Harrington, D. (2009). Confirmatory factor analysis. New York, NY: Oxford University Press.
Harwell, M., & LeBeau, B. (2010). Student eligibility for a free lunch as an SES measure in
education research. Educational Researcher, 39(2), 120-131.
doi:10.3102/0013189X10362578
Hassiotis, A., Robotham, D., Canagasabey, A., Romeo, R., Langridge, D., Blizard, R., . . . King,
M. (2009). Randomized, single-blind, controlled trial of a specialist behavior therapy
team for challenging behavior in adults with intellectual disabilities. The American
Journal of Psychiatry, 166(11), 1278-1285. doi:10.1176/appi.ajp.2009.08111747

259
Hayton, J. C., Allen, D. G., & Scarpello, V. (2004). Factor retention decisions in exploratory
factor analysis: A tutorial on parallel analysis. Methodological Resources, 7(2), 191-205.
doi:10.1177/1094428104263675
Holgado-Tello, P., Chacón-Moscoso, S., Barbero-García, I. & Vila-Abad, E. (2010). Polychoric
versus Pearson correlations in exploratory and confirmatory factor analysis of ordinal
variables. Quality & Quantity, 44(1), 153-166. doi:10.1007/s11135-008-9190-y
Horn, J. L (1965). A rationale and test for the numbers of factors in factor analysis.
Psychometrika, 30(2), 179-185. doi:10.1007/BF02289447
Hu, L-t, & Bentler, P. M. (1999). Cutoff criteria for fit indexes in covariance structure analysis:
Conventional criteria versus new alternatives. Structural Equation Modeling: A
Multidisciplinary Journal, 6(1), 1-55. doi:10.1080/10705519909540118
Huerta, M., Bishop, S. L., Duncan, A., Hus, V., & Lord, C. (2012). Application of DSM-5
criteria for autism spectrum disorder to three samples of children with DSM-IV diagnoses
of pervasive developmental disorders. American Journal of Psychiatry, 169(10), 1056-
1064. doi:10.1176/appi.ajp.2012.12020276
Huerta, M., & Lord, C. (2012). Diagnostic evaluation of autism spectrum disorders. Pediatric
Clinics of North America, 59(1), 103-111. doi:10.1016/j.pcl.2011.10.018
Iacobucci, D. (2010). Structural equations modeling: Fit indices, sample size, and advanced
topics. Journal of Consumer Psychology, 20(1), 90-98. doi:10.1016/j.jcps.2009.09.003
IBM Corp. (2017). IBM SPSS Statistics for Macintosh, Version 25. Armonk, NY: IBM Corp.
Individuals with Disabilities Education Act, 20 U.S.C. § 1400 (2004)
Jackson, D. L., Gillaspy, J. A., & Purc-Stephenson, R. (2009). Reporting practices in
confirmatory factor analysis: An overview and some recommendations. Psychological
Methods, 14(1), 6-23. doi:10.1037/a0014694
Jennrich, R. I., & Sampson, P. F. (1966). Rotation for simple loadings. Psychotemtrika, 31(3),
313-323. doi:10.1007/BF02289465
Kaat, A. J., Lecavalier, L., & Aman, M. G. (2014). Validity of the Aberrant Behavior Checklist
in children with autism spectrum disorder. Journal of Autism and Developmental
Disorders, 44(5), 1103-1116. doi:10.1007/s10803-013-1970-0
Kaiser, H. F. (1958). The varimax criterion for analytic rotation in factor analysis.
Psychometrika, 23(3), 187-200. doi:10.1007/BF02289233
Kaiser, H. F. (1960). The application of electronic computers to factor analysis. Educational and
Psychological Measurement, 20(1), 141-151. doi:10.1177/001316446002000116

260
Kaiser, H. F. (1970). A second generation little jiffy. Psychometrika, 35(4), 401-415.
doi:10.1007/BF02291817
Kaiser, H. F., & Rice, J. (1974) Little jiffy, mark iv. Educational and Psychological
Measurement, 34(1), 111-117. doi:10.1177/001316447403400115
Kanner, L. (1943). Autistic disturbances of affective contact. Nervous Child, 2, 217-250.
Kaufman, A. S., & Kaufman, N. L. (1983). Kaufman Assessment Battery for Children. Circle
Pines, MN: American Guidance Service.
Kaufman, A. S., & Kaufman, N. L. (1990). Kaufman Brief Intelligence Test. Circle Pines, MN:
American Guidance Service, Inc.
Kazdin, A. E. (2017). Research design in clinical psychology (5th ed.). [Kindle Edition]
Retrieved from Amazon.com
Lai, M. C., Lombardo, M. V., Chakrabarti, B., & Baron-Cohen, S. (2013). Subgrouping the
autism “spectrum”: reflections on DSM-5. PLoS Biology, 11(4), e1001544.
doi:10.1371/journal.pbio.1001544
Lam, K. D. (2005). Alternative method for scoring Repetitive Behavior Scale—Revised version.
Retrieved from
https://www.google.com/url?sa=t&rct=j&q=&esrc=s&source=web&cd=1&ved=0ahUKE
wj2iPmOsrPYAhVM6oMKHYojCjYQFgguMAA&url=https%3A%2F%2Fpsychmed.os
u.edu%2Fwp-content%2Fuploads%2F2017%2F04%2FRBS-R-Lam-Scoring-
Supplement2-1.doc&usg=AOvVaw3nL2_Z55uORbPHphN3mjY7
Lam, K. D. (2004). The Repetitive Behavior Scale-Revised: Independent validation and the
effects of subject variables (Doctoral dissertation). Available from ProQuest Dissertations
and Theses Global database. (UMI No. 3148184)
Lam, K. S., & Aman, M. G. (2007). The Repetitive Behavior Scale-Revised: Independent
validation in individuals with autism spectrum disorders. Journal of Autism and
Developmental Disorders, 37(5), 855-866. doi:10.1007/s10803-006-0213-z
Lavelle, T. A., Weinstein, M. C., Newhouse, J. P., Munir, K., Kuhlthau, K. A., & Prosser, L. A.
(2014). Economic burden of childhood autism spectrum disorders. Pediatrics, 133(3),
e520-e529. doi:10.1542/peds.2013-0763
Lecavalier, L. (2005). An evaluation of the Gilliam Autism Rating Scale. Journal of Autism and
Developmental Disorders, 35(6), 795-805. doi:10.1007/s10803-005-0025-6
Lecavalier, L. (2013). Thoughts on the DSM-5. Autism, 17(5), 507-509.
doi:10.1177/1362361313500865
261
LeCouteur, A., Lord, C., & Rutter, M. (2003). The Autism Diagnostic Interview: Revised (ADI-
R). Los Angeles, CA: Western Psychological Services.
Leigh, J. P., & Du, J. (2015). Brief report: Forecasting the economic burden of autism in 2015
and 2025 in the United States. Journal of Autism and Developmental Disorders, 45(12),
4135-4139. doi:10.1007/s10803-015-2521-7
Lehotkay, R., Devi, T. S., Raju, M. V. R., Bada, P. K., Nuti., S., Kempf, N., & Carminati, G. G.
(2015). Factor validity and reliability of the Aberrant Behavior Checklist-Community
(ABC-C) in an Indian population with intellectual disability. Journal of Intellectual
Disability Research, 59(3), 208-214. doi:10.1111/jir.12128
Li, C. H. (2016). Confirmatory factor analysis with ordinal data: Comparing robust maximum
likelihood and diagonally weighted least squares. Behavior Research Methods, 48(3),
936-949. doi:10.3758/s13428-015-0619-7
Loebel, A., Brams, M., Goldman, R. S., Silva, R., Hernandez, D., Deng, L., . . . Findling, R. L.
(2016). Lurasidone for the treatment of irritability associated with autistic disorder.
Journal of Autism and Developmental Disorders, 46(4), 1153-1163. doi:10.1007/s10803-
015-2628-x
Long, J. S. (1983). Confirmatory factor analysis: A preface to Liseral. Newbury Park, CA: Sage
Publications, Inc.
Lord, C., Corsello, C., & Grzadzinski, R. (2014). Diagnostic instruments in autistic spectrum
disorders. In F. R. Volkmar, S. J. Rogers, R. Paul, & K. A. Pelphrey (Eds.), Handbook of
autism and pervasive developmental disorders: Assessment, interventions, and policy (4th
ed., Vol 2, pp. 609-660). Hoboken, NJ: Wiley & Sons, Inc.
Lord, C., & Jones, R. M. (2012). Annual research review: Re-thinking the classification of
autism spectrum disorders. Journal of Child Psychology and Psychiatry, 53(5), 490-509.
doi:10.1111/j.1469-7610.2012.02547.x
Lord, C., Petkova, E., Hus, V., Gan, W., Lu, F., Martin, D. M. . . . Risi, S. (2012). A multisite
study of the clinical diagnosis of different Autism spectrum disorders. Archives of
General Psychiatry, 69(3), 306-313. doi:10.1001/archgenpsychiatry.2011.148
Lord, C., Rutter, M., DiLavore, P. C., & Risi, S. (2000). Autism diagnostic observation schedule
(ADOS). Los Angeles: Western Psychological Services.
Lord, C., Rutter, M., DiLavore, P. C., Risi, S., Gotham, K., & Bishop, S. (2012). Autism
diagnostic observation schedule, second edition (ADOS-2). Los Angeles: Western
Psychological Services.
Lord, C., Wagner, A., Rogers, S., Szatmari, P., Aman, M., Charman, T., . . . Yoder, P. (2005).

262
Challenges in evaluating psychosocial interventions for autistic spectrum disorders.
Journal of Autism and Developmental Disorders, 35(6), 695-708. doi:10.1007/s10803-
005-0017-6
MacCallum, R. C., Browne, M. W., & Sugawara, H. M. (1996). Power analysis and
determination of sample size for covariance structure modeling. Psychological Methods,
1(2), 130-149. doi:10.1037/1082-989X.1.2.130
MacCallum, R. C., Widaman, K., Zhang, S., & Hong, S. (1999). Sample size in factor analysis.
Psychological Methods, 4(1), 84-99. doi:10.1037/1082-989X.4.1.84
MacDonald, R., Green, G., Mansfield, R., Geckeler, A., Gardenier, N., Anderson, J., . . .
Sanchez, J. (2007). Stereotypy in young children with autism and typically developing
children. Research in Developmental Disabilities, 28(3), 266-277.
doi:10.1016/j.ridd.2006.01.004
Magnuson, K. M., & Constantino, J. N. (2011). Journal of Developmental and Behavioral
Pediatrics, 32(4), 332-340. doi:10.1097/DBP.0b013e318213f56c
Mahatmya, D., Zobel, A., & Valdovinos, M. G. (2008). Treatment approaches for self-injurious
behavior in individuals with autism: Behavioral and pharmacological methods. Journal of
Early and Intensive Behavior Intervention, 5(1), 106-118. doi:10.1037/h0100413
Mandy, W., Roughan, L. & Skuse, D. (2014). Three dimensions of oppositionality in autism
spectrum disorder. Journal of Abnormal Child Psychology, 42(2), 291-300.
doi:10.1007/s10802-013-9778-0
Mannion, A., & Leader, G. (2014). Attention-deficit/hyperactivity disorder (AD/HD) in autism
spectrum disorder. Research in Autism Spectrum Disorders, 8(4), 432-439.
doi:10.1016/j.rasd.2013.12.021
Marcus, R. N., Owen, R., Kamen, L., Manos, G., McQuade, R. D., Carson, W. H., & Aman, M.
G. (2009). A placebo-controlled, fixed-dose study of aripiprazole in children and
adolescents with irritability associated with autistic disorder. Journal of the American
Academy of Child and Adolescent Psychiatry, 48(11), 1110-1119.
doi:10.1097/CHI.0b013e3181b76658
Marshburn, E. C., & Aman, M .G. (1992). Factor validity and norms for the Aberrant Behavior
Checklist in a community sample of children with mental retardation. Journal of Autism
and Developmental Disorders, 22(3), 357-373. doi:10.1007/BF01048240
Masi, A., DeMayo, M. M., Glozier, N., & Guastella A. J. (2017). An overview of autism
spectrum disorder, heterogeneity and treatment options. Neuroscience Bulletin, 33(2),
183-193. doi:10.1007/s12264-017-0100-y
Matson, J. L. (2009). Aggression and tantrums in children with autism: A review of behavioral

263
treatments and maintaining variables. Journal of Mental Health Research in Intellectual
Disabilities, 2(3), 169-187. doi:10.1080/19315860902725875
Matson, J. L., Beighley, J., & Turygin, N. (2012). Autism diagnosis and screening: Factors to
consider in differential diagnosis. Research in Autism Spectrum Disorders, 6(1), 19-24.
doi:10.1016/j.rasd.2011.08.003
Matson, J. L., & LoVullo, S. V. (2008). A review of behavioral treatments for self-injurious
behaviors of persons with autism spectrum disorders. Behavior Modification, 32(1), 61-
76. doi:10.1177/0145445507304581
Matson, J. L., Rieske, R. D., & Williams, L. W. (2013). The relationship between autism
spectrum disorders and attention-deficit/hyperactivity disorder: An overview. Research in
Developmental Disabilities, 34(9), 2475-2484. doi:10.1016/j.ridd.2013.05.021
Matson, J. L., Wilkins, J., & Macken, J. (2008). The relationship of challenging behaviors to
severity and symptoms of autism spectrum disorders. Journal of Mental Health Research
in Intellectual Disabilities, 2(1), 29-44. doi:10.1080/19315860802611415
Mayes, S. D., & Calhoun, S. L. (2011). Impact of IQ, age, SES, gender, and race on autistic
symptoms. Research in Autism Spectrum Disorders, 5(2), 749-757.
doi:10.1016/j.rasd.2010.09.002
Mazefsky, C. A., McPartland, J. C., Gastgeb, H. Z., & Minshew, N. J. (2013). Brief report:
Comparability of DSM-IV and DSM-5 ASD research samples. Journal of Autism
Developmental Disorders, 43(5), 1236-1242. doi:10.1007/s10803-012-1665-y
McCarthy, D. (1972). Manual for the McCarthy Scales of Children’s Abilities. New York, NY:
The Psychological Corporation.
McConachie, H., Parr, J. R., Glod, M., Hanratty, J., Livingstone, N., Oono, I. P., . . . Williams,
K. (2015). Systematic review of tools to measure outcomes for young children with
autism spectrum disorder. Health Technology Assessment, 19(41), 1-538.
doi:10.3310/hta19410
McCracken, J. T., McGough, J., Shah, B., Cronin, P., Hong, D., Aman, M. G., . . . McMahon, D.
(2002). Risperidone in children with autism and serious behavioral problems. The New
England Journal of Medicine, 347(5), 314-321. doi:10.1056/NEJMoa013171
McPartland, J. C., Reichow, B., & Volkmar, F. R. (2012). Sensitivity and specificity of proposed
DSM-5 diagnostic criteria for autism spectrum disorder. Journal of the American
Academy of Child and Adolescent Psychiatry, 51(4), 368-383.
doi:10.1016/j.jaac.2012.01.007
Merrell, K. W. (2001). Assessment of children’s social skills: Recent developments, best
practices, and new directions. Exceptionality, 9(1-2), 3-18.

264
doi:10.1080/09362835.2001.9666988
Mikita, N., Hollocks, M. J., Papadopoulos, A. S., Aslani, A., Harrison, S., Leibenluft, E., . . .
Stringaris, A. (2015). Irritability in boys with autism spectrum disorders: An investigation
of physiological reactivity. Journal of Child Psychology and Psychiatry, 56(10), 1118-
1126. doi:10.1111/jcpp.12382
Miller, M. L., Fee, V. E., & Netterville, A. K. (2004). Psychometric properties of ADHD rating
scales among children with mental retardation I: Reliability. Research in Developmental
Disabilities, 25(5), 459-476. doi:10.1016/j.ridd.2003.11.003
Minshawi, N. F., Hurwitz, S., Fodstad, J. C., Biebl, S., Morriss, D. H., & McDougle, C. J.
(2014). The association between self-injurious behaviors and autism spectrum disorders.
Psychology Research and Behavior Management, 7, 125-136.
doi:10.2147/PRBM.S44635
Mire, S. S., Nowell, K. P., Kubiszyn, T., & Goin-Kochel, R. P. (2014). Psychotropic medication
use among children with autism spectrum disorders within the Simons Simplex
Collection: Are core features of autism spectrum disorder related? Autism, 18(8), 933-
942. doi:10.1177/1362361313498518
Mirenda, P., Smith, I. M., Vaillancourt, T., Georgiades, S., Duku, E., Szatmari, P., . . .
Zwaigenbaum, L. (2010). Validating the Repetitive Behavior Scale-Revised in young
children with autism spectrum disorder. Journal of Autism and Developmental Disorders,
40(12), 1521-1530. doi:10.1007/s10803-010-1012-0
Mirwis, J. E. (2011). Exploratory factor analysis of the Aberrant Behavior Checklist—
Community (ABC-C) with a sample of individuals with autism spectrum disorders
(Doctoral dissertation). Available from ProQuest Dissertations and Theses Global
database. (UMI No. 3460858)
Muthén, B. O. (1993). Goodness of Fit with Categorical and Other Non-Normal Variables. In K.
A. Bollen, & J. S. Long (Eds.), Testing Structural Equation Models (pp. 205-243).
Newbury Park, CA: Sage Publications.
Muthén, B. O., du Toit, S. H. C., & Spisic, D. (1997). Robust inference using weighted least
squares and quadratic estimating equations in latent variable modeling with categorical
and continuous outcomes. Retrieved from
https://www.statmodel.com/download/Article_075.pdf
Muthén, L. K., & Muthén, B. O. (2002). How to use a monte carlo study to decide on sample
size and determine power. Structural Equation Modeling: A Multidisciplinary Journal,
9(4), 599-620. doi:10.1207/S15328007SEM0904_8
Muthén, L. K., & Muthén, B. O. (1998-2017). Mplus user’s guide (8th ed.). Los Angeles, CA:
Muthén & Muthén
265
Naglieri, J. A., Das, J. P., & Goldstein, S. (2014). Cognitive Assessment System-Second Edition
(2nd ed.). Austin, TX: Pro-Ed.
Nehring, A. D., Nehring, E. F., Bruni, J. R., & Randolph, P. L. (1992). Learning
Accomplishment Profile—Diagnostic Standardized Assessment. Lewisville, NC: Kaplan
Press.
Nelson, A. T. (2015). Exploratory factor analysis of the social responsiveness scale—second
edition in a sample of individuals with autism spectrum disorders (Doctoral dissertation).
Available from ProQuest Dissertations and Theses Global database. (UMI No. 3714653)
Neuhaus, J. O., Wrigley, C. (1954). The quartimax method: An analytic approach to orthogonal
simple structure. The British Journal of Statistical Psychology, 7(2), 81-91.
doi:10.1111/j.2044-8317.1954.tb00147.x
Newton, J. T., & Sturmey, P. (1988). The Aberrant Behavior Checklist: A British replication and
extension of its psychometric properties. Journal of Mental Deficiency Research, 32(2),
87-92. doi:10.1111/j.1365-2788.1988.tb01394.x
Nicholson, L.M., Slater, S. J., Chriqui, J. F., Chaloupka, F. (2014). Validating adolescent
socioeconomic status: Comparing school free and reduced price lunch with community
measures. Spatial Demography, 2(1), 55-65. doi:10.1007/BF03354904
Norris, M., & Lecavalier, L. (2010b). Evaluating the use of exploratory factor analysis in
developmental disability psychological research. Journal of Autism and Developmental
Disorders, 40(1), 8-20. doi:10.1007/s10803-009-0816-2.
Norris, M., & Lecavalier, L. (2010a). Screening accuracy of level 2 autism spectrum disorder
rating scales. Autism, 14(4), 263-284. doi:10.1177/1362361309348071
Norris, M., Lecavalier, L., & Edwards, M. C. (2012). The structure of autism symptoms as
measured by the Autism diagnostic observation schedule. Journal of Autism and
Developmental Disorders, 42(6), 1075-1086. doi:10.1007/s10803-011-1348-0
Nunnally, J. (1978). Psychometric theory (2nd ed.). New York: McGraw-Hill.
Oliver, C., & Richards, C. (2015). Practitioner review: Self-injurious behaviour in children with
developmental delay. Journal of Child Psychology and Psychiatry, 56(10), 1042-1054.
doi:10.1111/jcpp.12425
O’Nions, E., Vidling, E., Floyd, C., Quinlan, E., Pidgeon, C., Gould, J., & Happé, F. (2018).
Dimensions of difficulty with children reported to have an autism spectrum diagnosis and
features of extreme/’pathological’ demand avoidance. Child and Adolescent Mental
Health, 23(3), 220-227. doi:10.1111/camh.12242

266
Ono, Y. (1996). Factor validity and reliability for the Aberrant Behavior Checklist-Community
in a Japanese population with mental retardation. Research in Developmental
Disabilities, 17(4), 303-309. doi:10.1016/0891-4222(96)00015-7
O’Rourke, N. & Hatcher, L. (2013). A step-by-step approach to using SAS for factor analysis
and structural equation modeling (2nd ed.). Cary, NC: SAS Institute Inc.
Osborne, J. W. (2014). Best practices in exploratory factor analysis. Retrieved from
https://www.researchgate.net/publication/265248967_Best_Practices_in_Exploratory_Fa
ctor_Analysis
Osborne, J. W. (2015). What is rotating in exploratory factor analysis? Practical Assessment,
Research & Evaluation, 20(2), 1-7. Retrieved from
http://pareonline.net/getvn.asp?v=20&n=2
Osborne, J. W., & Banjanovic, E. S. (2016). Exploratory factor analysis with SAS. Cary, NC:
SAS Institute Inc.
Osborne, J. W., & Costello, A. B. (2005). Best practices in exploratory factor analysis: Four
recommendations for getting the most from your analysis. Practical Assessment,
Research & Evaluation, 10(7), 1-9. Retrieved from
http://pareonline.net/getvn.asp?v=10&n=7
Ozonoff, S., Goodlin-Jones, B. L., & Solomon, M. (2005). Evidence-based assessment of autism
spectrum disorders in children and adolescents. Journal of Clinical Child and Adolescent
Psychology, 34(3), 523-540. doi:10.1207/s15374424jccp3403_8
Pearson, K. (1900). Mathematical contributions to the theory of evolution. VII. On the
correlation of characters not quantitatively measurable. Philosophical Transactions of the
Royal Society of London. Series A., Containing Papers of a Mathematical or Physical
Character, 195, 1-47+405. doi:10.1098/rsta.1900.0022
Pedhazur, E. J., & Schemlkin, L. P. (1991). Measurement, design, and analysis: An integrated
approach. Hillsdale, NJ: Lawrence Erlbaum Associates, Inc.
Péter, Z., Oliphant, M. E., & Fernandez, T. V. (2017). Motor stereotypies: A pathophysiological
review. Frontiers in Neuroscience, 11(171), 1-6. doi:10.3389/fnins.2017.00171
Pett, M. A., Lackey, N. R., & Sullivan, J. J. (2003). Making sense of factor analysis: The use of
factor analysis for instrument development in health care research. Thousand Oaks, CA:
Sage Publications, Inc.
Portney, L. G., & Watkins, M. P. (2000). Foundations of clinical research: Applications to
practice (2nd ed.) Upper Saddle River, NJ: Prentice Hall Health.
R Core Team (2013). R: A language and environment for statistical computing. R Foundation for

267
Statistical Computing, Vienna, Austria. Retrieved from http://www.R-project.org/
Reynolds, C. R., & Kamphaus, R. W. (1992) Behavior Assessment System for Children. Circle
Pines, MN: American Guidance Service.
Reynolds, C. R., & Kamphaus, R. W. (2015). BASC-3: Behavior Assessment System for
Children (3rd ed.). Bloomington, MN: NCS Pearson, Inc.
Ripamonti, L. (2016). Disability, diversity, and autism: Philosophical perspectives on health. The
New Bioethics, 22(1), 56-70. doi:10.1080/20502877.2016.1151256
Roid, G. H. (2003). Stanford-Binet Intelligence Scales, Fifth Edition (SB:5). Itasca, IL: Riverside
Publishing.
Rojahn, J., & Helsel, W. J. (1991). The Aberrant Behavior Checklist in children and adolescents
with dual diagnosis. Journal of Autism and Developmental Disorders, 21(1), 17-28.
doi:10.1007/BF02206994
Rojahn, J., Schroeder, S. R., Mayo-Ortega, L., Oyama-Ganiko, R., LeBlanc, J., Marquis, J., &
Berke, E. (2013). Validity and reliability of the Behavior Problems Inventory, the
Aberrant Behavior Checklist, and the Repetitive Behavior Scale—Revised among infants
and toddlers at risk for intellectual or developmental disabilities: A multi-method
assessment approach. Research in Developmental Disabilities, 34(5), 1804-1814.
doi:10.1016/j.ridd.2013.02.024
Sansone, S. M., Widaman, K. F., Hall, S. S., Reiss, A. L., Lightbody, A., Kaufmann, W. E., . . .
Hessl, D. (2012). Psychometric study of the Aberrant Behavior Checklist in fragile x
syndrome and implications for targeted treatment. Journal of Autism and Developmental
Disorders, 42(7), 1377-1392. doi:10.1007/s10803-011-1370-2
SAS Institute, Inc. (2013). SAS version 9.4. Cary, NC: SAS Institute Inc.
Satorra, A., & Bentler, P. M. (2001). Scaled difference chi-square test statistic for moment
structure analysis. Psychometrika, 66(4), 507-514. doi:10.1007/BF02296192
Satorra, A., & Bentler, P. M. (2010). Ensuring positiveness of the scaled difference chi-square
test statistic. Psychometrika, 75(2), 243-248. doi:10.1007/s11336-009-9135-y
Sattler, J. M. (2008) Assessment of children: Cognitive foundations (5th ed.). La Mesa, CA:
Jerome M. Sattler, Publisher, Inc.
Schopler, E. S., Reichler, R. J., & Renner, B. R. (1986). The Childhood Autism Rating Scale
(CARS) for diagnostic screening and classification of autism. Irvington, NY: Irvington.
Schmidt, J. D., Huete, J. M., Fodstad, J. C., Chin, M. D., & Kurtz, P. F. (2013). An evaluation of
268
the Aberrant Behavior Checklist for children under age 5. Research in Developmental
Disabilities, 34(4), 1190-1197. doi:10.1016/j.ridd.2013.01.002
Schmitt, T. A., & Sass, D. A. (2011). Rotation criteria and hypothesis testing for exploratory
factor analysis: Implications for factor pattern loadings and interfactor correlations.
Educational and Psychological Measurement, 71(1), 95-113.
doi:10.1177/0013164410387348
Schroeder, S. R., Rojahn, J., & Reese, R. M. (1997). Brief report: Reliability and validity of
instruments for assessing psychotropic medication effects on self-injurious behavior in
mental retardation. Journal of Autism and Developmental Disorders, 27(1), 89-102.
doi:10.1023/A:10258253
Snyder, T. & Musu-Gillette, L. (2015, April 16). Free or reduced price lunch: A proxy for
poverty [Web log comment]. Retrieved from https://nces.ed.gov/blogs/nces/post/free-or-
reduced-price-lunch-a-proxy-for-poverty
Sparrow, S. S., Cicchetti, D. V., & Balla, D. A. (2005) Vineland adaptive behavior scales:
Second edition (VABS-II), survey, interview form/caregiver rating form. Livonia, MN:
Pearson Assessments.
Sprenger, L., Bühler, E., Poustka, L., Bach, C., Heinzel-Gutenbrunner, M. Kamp-Becker, I., &
Bachmann, C. (2013). Impact of ADHD symptoms on autism spectrum disorder
symptom severity. Research in Developmental Disabilities, 34(10), 3545-3552.
doi:10.1016/j.ridd.2013.07.028
Simonoff, E., Jones, C. R. G., Pickles, A., Happé, F., Baird, G., Charman, T. (2012). Severe
mood problems in adolescents with autism spectrum disorder. The Journal of Child
Psychology and Psychiatry, 53(11), 1157-1166. doi:10.1111/j.1469-7610.2012.02600.x
Soke, G. N., Rosenberg, S. A., Hamman, R. F., Fingerlin, T., Robinson, C., Carpenter, L., . . .
DiGuiseppi, C. (2016). Brief report: Prevalence of self-injurious behaviors among
children with autism spectrum disorder-a population-based study. Journal of Autism and
Developmental Disorders, 46(11), 3607-3614. doi:10.1007/s10803-016-2879-1
Sörbom, D. (1989). Model modification. Psychometrika, 54(3), 371-384. doi:
10.1007/BF02294623
Stachnik, J., & Gabay, M. (2010). Emerging role of aripiprazole for treatment of irritability
associated with autistic disorder in children and adolescents. Adolescent Health, Medicine
and Therapeutics, 1, 104-114. doi:10.2147/AHMT.S9819
Steiger, J. H. (2016). Notes on the Steiger-Lind (1980) handout. Structural Equation Modeling:
A Multidisciplinary Journal, 23(6), 777-781. doi:10.1080/10705511.2016.1217487
Stringaris, A. (2011). Irritability in children and adolescents: a challenge for DSM-5. European

269
Child and Adolescent Psychiatry, 20(2), 61-66. doi:10.1007/s00787-010-0150-4
Thorndike, R. L., Hagen, E. P., & Sattler, J. M. (1986). The Stanford-Binet Intelligence Scale:
Fourth Edition, Guide for administering and scoring (2nd printing). Chicago, IL:
Riverside Publishing.
Trammell, B., Wilczynski, S. M., Dale, B., & McIntosh, D. E. (2013). Assessment and
differential diagnosis of comorbid conditions in adolescents and adults with autism
spectrum disorders. Psychology in the Schools, 50(9), 936-946. doi:10.1002/pits.21720
Turner-Brown, L. M., Lam, K. S. L., Holtzclaw, T. N., Dichter, G. S., & Bodfish, J. W. (2011).
Phenomenology and measurement of circumscribed interests in autism spectrum
disorders. Autism, 15(4), 437-456. doi:10.1177/1362361310386507
Urbina, S. (2014). Essentials of psychological testing (2nd ed.). Hoboken, NJ: John Wiley &
Sons, Inc.
Velicer, W. F. (1976). Determining the number of components from the matrix of partial
correlations. Psychometrika, 41(3), 321-327. doi:10.1007/BF02293557
Velicer, W. F., Eaton, C. A., & Fava, J. L. (2000). Construct explication through factor or
component analysis: A review and evaluation of alternative procedures for determining
the number of factors or components. In R. D. Goffin & E, Helmes (Eds.). Problems and
solutions in human assessment: Honoring Douglas Jackson at seventy (pp. 41-71).
Boston, MA: Kluwer Academic Publishers.
Volker, M. A. (2012). Introduction to the special issue: High-functioning autism spectrum
disorders in the schools. Psychology in the Schools, 49(10), 911-916.
doi:10.1002/pits.21653
Volker, M. A., Dua, E. H., Lopata, C., Thomeer, M . L., Toomey, J. A., Smerbeck, A. M., . . .
Lee, G. K. (2016). Factor structure, internal consistency, and screening sensitivity of the
GARS-2 in a developmental disabilities sample. Autism Research and Treatment, 2016,
1-12. doi:10.1155/2016/8243079
Volker, M. A., Thomeer, M. L., & Lopata, C. (2010). Pervasive developmental disorders. In A.
S. Davis (Ed.), Handbook of pediatric neuropsychology (pp. 501-535). New York, NY:
Spring Publishing Company, LLC
Volkmar, F. R., Reichow, B., Westphal, A., & Mandell, D. S. (2014). Autism and the autism
spectrum: Diagnostic concepts. In F. R. Volkmar, S. J. Rogers, R. Paul, & K. A. Pelphrey
(Eds.). Handbook of autism and pervasive developmental disorders: Diagnosis,
development, and brain mechanisms (4th ed., Vol 1, pp. 3-28). Hoboken, NJ: Wiley &
Sons, Inc.
Wechsler, D. (1974). Wechsler Intelligence Scale for Children-Revised. New York, NY: The
270
Psychological Corporation.
Wechsler, D. (1989). The Wechsler Preschool and Primary Scale of Intelligence-Revised. San
Antonio, TX: The Psychological Corporation.
Wechsler, D. (1991). The Wechsler Intelligence Scale for Children-Third Edition. San Antonio,
TX: The Psychological Corporation.
Wechsler, D. (1997), Wechsler Adult Intelligence Scale-Third Edition (WAIS-III). San Antonio,
TX: The Psychological Corporation.
Wechsler, D. (1999). Wechsler Abbreviated Scale of Intelligence (WASI). San Antonio, TX:
Psychological Corporation.
Wechsler, D. (2002). The Wechsler Preschool and Primary Scale of Intelligence-Third Edition.
San Antonio, TX: The Psychological Corporation.
Wechsler, D. (2011). Wechsler Abbreviated Scale of Intelligence-Second Edition (WASI-II). San
Antonio, TX: NCS Pearson.
Wechsler, D. (2012). Wechsler Preschool and Primary Scale of Intelligence-Fourth Edition. San
Antonio, TX: The Psychological Corporation.
Wheeler, A., Raspa, M., Bann, C., Bishop, E., Hessl, D. Sacco, P., & Bailey, D. B., Jr. (2014).
Anxiety, attention problems, hyperactivity, and the Aberrant Behavior Checklist in
fragile x syndrome. American Journal of Medical Genetics, 164A(1), 141-155.
doi:10.1002/ajmg.a.36232
White, S. W., Keonig, K., & Scahill, L. (2007). Social skills development in children with autism
spectrum disorders: A review of the intervention research. Journal of Autism and
Developmental Disorders, 37(10), 1858-1868. doi:10.1007/s10803-006-0320-x
Witwer, A. N., & Lecavalier, L. (2008). Examining the validity of autism spectrum disorder
subtypes. Journal of Autism and Developmental Disorders, 38(9), 1611-1624.
doi:10.1007/s10803-008-0541-2
Wothke, W. (1993). Nonpositive definite matrices in structural modeling. In K. A. Bollen & J. S.
Long (Eds.), Testing structural equation models (pp. 256-293). Newbury Park, CA: Sage
Publications, Inc.
Zeilinger, E. L., Weber, G., & Haverman, M. J. (2011). Psychometric properties and norms of
the German ABC-Community and PAS-ADD Checklist. Research in Developmental
Disabilities, 32(6), 2431-2440. doi:10.1016/j.ridd.2011.07.017
Zumbo, B. D., Gadermann, A. M., & Zeisser, C. (2007). Ordinal versions of coefficients alpha

271
and theta for Likert rating scales. Journal of Modern Applied Statistical Methods, 6(1),
21-29. doi:10.22237/jmasm/1177992180
Related Documents