SOFTWARE Open Access Exploratory analysis of genomic segmentations with Segtools Orion J Buske 1 , Michael M Hoffman 1 , Nadia Ponts 2 , Karine G Le Roch 2 and William Stafford Noble 1,3* Abstract Background: As genome-wide experiments and annotations become more prevalent, researchers increasingly require tools to help interpret data at this scale. Many functional genomics experiments involve partitioning the genome into labeled segments, such that segments sharing the same label exhibit one or more biochemical or functional traits. For example, a collection of ChlP-seq experiments yields a compendium of peaks, each labeled with one or more associated DNA-binding proteins. Similarly, manually or automatically generated annotations of functional genomic elements, including cis-regulatory modules and protein-coding or RNA genes, can also be summarized as genomic segmentations. Results: We present a software toolkit called Segtools that simplifies and automates the exploration of genomic segmentations. The software operates as a series of interacting tools, each of which provides one mode of summarization. These various tools can be pipelined and summarized in a single HTML page. We describe the Segtools toolkit and demonstrate its use in interpreting a collection of human histone modification data sets and Plasmodium falciparum local chromatin structure data sets. Conclusions: Segtools provides a convenient, powerful means of interpreting a genomic segmentation. Background Genomic research often requires classifying regions of the genome according to their biochemical or functional properties and then investigating how these classes relate to one another and to complementary genomic data sets. One might create these classifications automa- tically, by using machine learning methods that partition the genome into labeled segments [1-4], or manually on the basis of one or more experimental data sets. In either case, one then faces the challenge of explor- ing the biological meanings of the segment labels. The UCSC Genome Browser [5] allows researchers to explore some such relationships manually, but such ana- lyses do not efficiently scale to aggregation over a com- plete genome. The Galaxy platform [6] and BEDTools [7] provide useful large-scale automated analyses, but these methods do not generate the aggregate compari- sons and visualizations critical to understanding these genomic segmentations. EpiGRAPH [8] is a more sophisticated software toolkit that, in conjunction with Galaxy, offers some visualization capabilities in addition to a variety of machine learning analysis methods. To address this type of analytical challenge, we have developed Segtools , a software toolkit that facilitates the exploratory analysis of genomic segmentations. Segtools is designed to provide segmentation-centric summary statistics and visualizations, in a manner that is scalable and easy to use. In this context, a segmenta- tion is defined as a set of non-overlapping regions of a genome, where each segment is assigned one of a small set of labels. Manually or automatically gener- ated classifications, such as the examples above, are easily represented as segmentations, with a segment for each genomic locus. Labels may correspond to dif- ferent types of functional elements — intron, exon, promoter — or to different subtypes of a single ele- ment — genes with high, medium or low expression. A user can then employ Segtools to explore how the labels relate to transcription factor binding sites, peaks of histone modification, or any other annotation. Note that some Segtools commands can operate on sets of regions that contain overlapping segments, such as * Correspondence: [email protected] 1 Department of Genome Sciences, University of Washington, PO Box 355065, Seattle, WA 98195-5065, USA Full list of author information is available at the end of the article Buske et al. BMC Bioinformatics 2011, 12:415 http://www.biomedcentral.com/1471-2105/12/415 © 2011 Buske et al; licensee BioMed Central Ltd. This is an Open Access article distributed under the terms of the Creative Commons Attribution License (http://creativecommons.org/licenses/by/2.0), which permits unrestricted use, distribution, and reproduction in any medium, provided the original work is properly cited.

Welcome message from author
This document is posted to help you gain knowledge. Please leave a comment to let me know what you think about it! Share it to your friends and learn new things together.
Transcript

SOFTWARE Open Access
Exploratory analysis of genomic segmentationswith SegtoolsOrion J Buske1, Michael M Hoffman1, Nadia Ponts2, Karine G Le Roch2 and William Stafford Noble1,3*
Abstract
Background: As genome-wide experiments and annotations become more prevalent, researchers increasinglyrequire tools to help interpret data at this scale. Many functional genomics experiments involve partitioning thegenome into labeled segments, such that segments sharing the same label exhibit one or more biochemical orfunctional traits. For example, a collection of ChlP-seq experiments yields a compendium of peaks, each labeledwith one or more associated DNA-binding proteins. Similarly, manually or automatically generated annotations offunctional genomic elements, including cis-regulatory modules and protein-coding or RNA genes, can also besummarized as genomic segmentations.
Results: We present a software toolkit called Segtools that simplifies and automates the exploration of genomicsegmentations. The software operates as a series of interacting tools, each of which provides one mode ofsummarization. These various tools can be pipelined and summarized in a single HTML page. We describe theSegtools toolkit and demonstrate its use in interpreting a collection of human histone modification data sets andPlasmodium falciparum local chromatin structure data sets.
Conclusions: Segtools provides a convenient, powerful means of interpreting a genomic segmentation.
BackgroundGenomic research often requires classifying regions ofthe genome according to their biochemical or functionalproperties and then investigating how these classesrelate to one another and to complementary genomicdata sets. One might create these classifications automa-tically, by using machine learning methods that partitionthe genome into labeled segments [1-4], or manually onthe basis of one or more experimental data sets.In either case, one then faces the challenge of explor-
ing the biological meanings of the segment labels. TheUCSC Genome Browser [5] allows researchers toexplore some such relationships manually, but such ana-lyses do not efficiently scale to aggregation over a com-plete genome. The Galaxy platform [6] and BEDTools[7] provide useful large-scale automated analyses, butthese methods do not generate the aggregate compari-sons and visualizations critical to understanding thesegenomic segmentations. EpiGRAPH [8] is a more
sophisticated software toolkit that, in conjunction withGalaxy, offers some visualization capabilities in additionto a variety of machine learning analysis methods.To address this type of analytical challenge, we have
developed Segtools, a software toolkit that facilitatesthe exploratory analysis of genomic segmentations.Segtools is designed to provide segmentation-centricsummary statistics and visualizations, in a manner thatis scalable and easy to use. In this context, a segmenta-tion is defined as a set of non-overlapping regions of agenome, where each segment is assigned one of asmall set of labels. Manually or automatically gener-ated classifications, such as the examples above, areeasily represented as segmentations, with a segmentfor each genomic locus. Labels may correspond to dif-ferent types of functional elements — intron, exon,promoter — or to different subtypes of a single ele-ment — genes with high, medium or low expression. Auser can then employ Segtools to explore how thelabels relate to transcription factor binding sites, peaksof histone modification, or any other annotation. Notethat some Segtools commands can operate on sets ofregions that contain overlapping segments, such as
* Correspondence: [email protected] of Genome Sciences, University of Washington, PO Box 355065,Seattle, WA 98195-5065, USAFull list of author information is available at the end of the article
Buske et al. BMC Bioinformatics 2011, 12:415http://www.biomedcentral.com/1471-2105/12/415
© 2011 Buske et al; licensee BioMed Central Ltd. This is an Open Access article distributed under the terms of the Creative CommonsAttribution License (http://creativecommons.org/licenses/by/2.0), which permits unrestricted use, distribution, and reproduction inany medium, provided the original work is properly cited.
overlapping transcripts. Throughout this manuscriptand the Segtools documentation, we refer to this morerelaxed form of segmentation as an annotation. Seg-tools generates results in tab-delimited text and imageformats, and can summarize them in a single HTMLreport. Furthermore, Segtools analyses are easy to per-form, script, and incorporate into existing analysispipelines, making them useful for both manual andautomated exploration.
ImplementationSegtools is implemented as a collection of Python mod-ules that process input files and output results in tab-delimited data files. These output files are then pro-cessed by visualization code written in R to generateplots.
UsageSegtools provides a set of tools for analyzing segmenta-tions, a subset of which are summarized in Table 1.These tools can be run via a command-line or Pythoninterface to create or compare segmentations and tovisualize the properties of a segmentation and its rela-tionships with provided annotations. A typical workflowinvolves 1) running the length-distribution,nucleotide-frequency, and transition com-mands on a segmentation to get a high-level view of itsstructure and the relationships among labels, 2) runningsignal-distribution against a set of signal trackssuch as ChlP-seq signal intensities, and aggregationand overlap against a collection of annotations setsuch as genes, TSSs, enhancer sites, insulator sites, repe-titive regions, CpG islands, or any other (potentially sub-categorized) region sets, and then 3) generating anHTML report to collate these results. Because each
Segtools command performs an independent analysisagainst a single annotation file, such a workflow is trivialto parallelize.As input, segmentations are accepted in Browser
Extensible Data (BED) or General Feature Format (GFF)formats, with the “name” column used as the segmentlabel. Point and region annotations are accepted in BEDor GFF formats with the “name” column as an optionalgrouping variable, gene annotations in Gene TransferFormat (GTF), and signal annotations in Genomedataformat [9]. As output, each command produces a tab-delimited text file containing the primary results, andmost commands also produce a visualization of theresults. A summary of the data outputted by each com-mand is shown in Table 1, and the specific visualizationsare as follows:
• The aggregation command produces a plot inwhich the x-axis is either a specific type of pointannotation (such as a TSS) or a region (such asan exon), and the vertical axis is the relativeenrichment of a given label at each position (seeFigure 1A).• The length-distribution command pro-duces two visualizations: (1) a stacked collection ofviolin plots, each showing the distribution of seg-ment lengths for one label, and (2) a bar plot show-ing the fraction of the segmentation (both in termsof bases and segments) that is occupied by eachlabel (see Figure 2).• The nucleotide-frequency command pro-duces a heat map in which rows are segment labels,columns are dinucleotides, and values are frequen-cies of the given dinucleotide in the given label (seeFigure 1B).
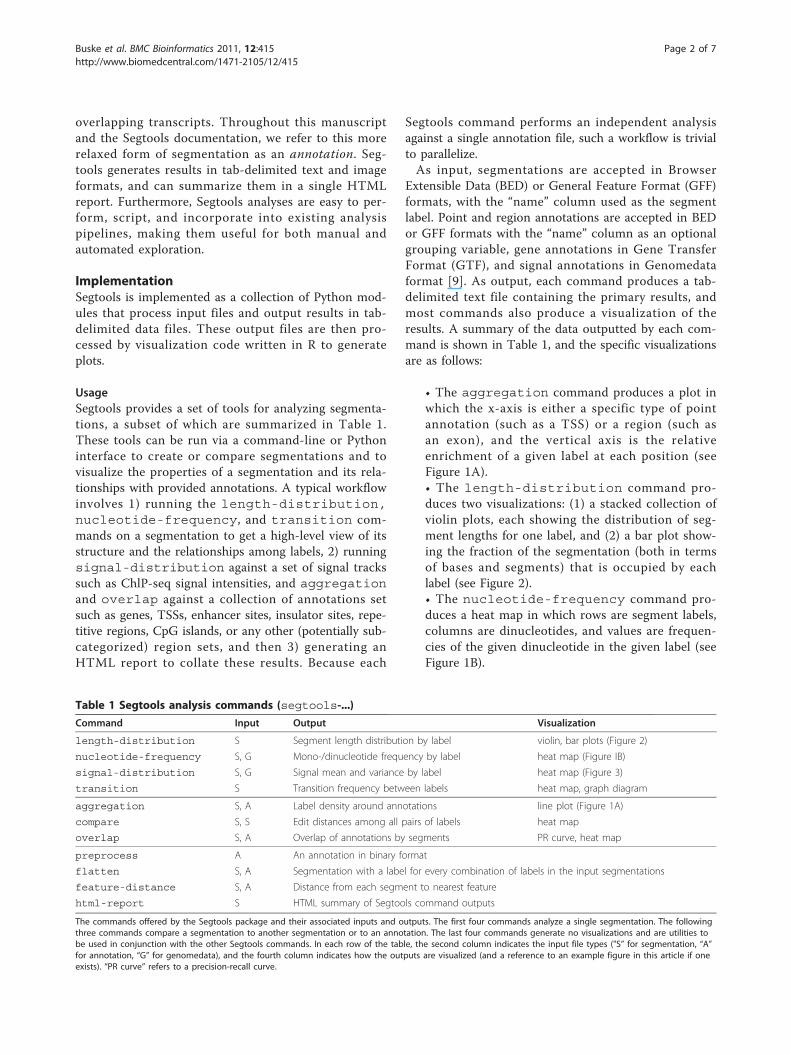
Table 1 Segtools analysis commands (segtools-...)
Command Input Output Visualization
length-distribution S Segment length distribution by label violin, bar plots (Figure 2)
nucleotide-frequency S, G Mono-/dinucleotide frequency by label heat map (Figure IB)
signal-distribution S, G Signal mean and variance by label heat map (Figure 3)
transition S Transition frequency between labels heat map, graph diagram
aggregation S, A Label density around annotations line plot (Figure 1A)
compare S, S Edit distances among all pairs of labels heat map
overlap S, A Overlap of annotations by segments PR curve, heat map
preprocess A An annotation in binary format
flatten S, A Segmentation with a label for every combination of labels in the input segmentations
feature-distance S, A Distance from each segment to nearest feature
html-report S HTML summary of Segtools command outputs
The commands offered by the Segtools package and their associated inputs and outputs. The first four commands analyze a single segmentation. The followingthree commands compare a segmentation to another segmentation or to an annotation. The last four commands generate no visualizations and are utilities tobe used in conjunction with the other Segtools commands. In each row of the table, the second column indicates the input file types ("S” for segmentation, “A”for annotation, “G” for genomedata), and the fourth column indicates how the outputs are visualized (and a reference to an example figure in this article if oneexists). “PR curve” refers to a precision-recall curve.
Buske et al. BMC Bioinformatics 2011, 12:415http://www.biomedcentral.com/1471-2105/12/415
Page 2 of 7

Figure 1 Histone modifications. Segtools plots for a segmentation of histone modification peaks produced with flatten (4: H3K4me3; 27:H3K27me3; 36: H3K36me3; 4/27: H3K4me3+H3K27me3; 4/36: H3K4me3+H3K36me3; 27/36: H3K27me3+H3K36me3; all: H3K4me3+H3K27me3+H3K36me3). A) The relative enrichment of these labels around active GENCODE release 3c protein-coding genes. “Manual” and “Auto” geneannotations from the UCSC Table Browser were merged and only protein-coding transcripts active in K562 (RPKM values in top 25%) wereretained. Genes are split into idealized components: flanking regions; initial, internal, and terminal exons and introns, with the mean length ofeach component in parentheses. Enrichment is calculated as log2 (fobs + 1)/(frand + 1), where fobs is the frequency at which the given label isobserved at the given offset, and frand is the frequency expected at random, given the relative abundance of each segment label. B) Meandinucleotide frequencies across segments of each label.
Fraction of segmentation
Seg
men
t lab
el
RST
0
ST
S
RT
T
RS
R
0.1 0.2 0.3 0.4
Bases
Fraction of segmentation
Seg
men
t lab
el
RST
0
ST
S
T
RT
RS
R
0.1 0.2 0.3 0.4
Bases
(A) Cell cycle D (B) Cell cycle I
Figure 2 Coverage of TSSs by gene expression label. The figure plots, for two cell cycle experiments, the proportion of bases and segmentsthat are covered by-each of the eight labels. The labels correspond to genes that are not expressed ("0”), expressed at a specific stage of theerythrocytic cycle ("R” for “ring”, “T” for “trophozoite” and “S” for “schizont”), or expressed at multiple stages ("RS”, “RT”, “ST” and “RST”). Becauseeach segment is of a fixed length (200 bp), the proportion of bases and segments covered is the same for each label.
Buske et al. BMC Bioinformatics 2011, 12:415http://www.biomedcentral.com/1471-2105/12/415
Page 3 of 7
• The overlap command produces a series of pre-cision-recall plots, one per annotation label. In eachplot, every point corresponds to a segmentationlabel, the x-axis is the percentage of annotationlabels that overlap the segmentation label, and the y-axis is the percentage of segmentation labels thatoverlap the annotation label. The command alsoproduces a heat map in which rows are segmentlabels, columns are annotation groups, and valuesrepresent the fraction of overlap between segmentsof the given label and annotations of the givengroup. This overlap fraction is either in terms of seg-ments or bases overlapped.• The signal-distribution command producesa heat map in which rows are data tracks, columns aresegment labels, and values represent the mean datavalue associated with the given label (see Figure 3).• The transition command produces a heat mapin which rows and columns are segment labels, andvalues represent the frequency with which the rowlabel occurs immediately following the column label.The command also produces a graph visualization ofthe same data, in which nodes are labels, and edgesrepresent transition frequencies. The command pro-vides options to include only edges corresponding tohigh-frequency transitions.
Online documentation linked from the project webpage contains complete usage information for eachcommand.
ResultsCase study 1: histone modifications in the humangenomeCertain post-translational covalent modifications of his-tones are associated with gene expression [10-13], withspecific combinations known to act cooperatively[14,15]. To demonstrate Segtools’s functionality, we gen-erated a segmentation from the ChlP-seq “peaks” (geno-mic loci exhibiting significantly elevated read count) forcore histone H3 methylated at three different lysine resi-dues (H3K4me3, H3K27me3, H3K36me3). The BroadInstitute produced these data from the chronic myelo-genous leukemia cell line K562 as part of the ENCODEProject [16], and we downloaded them from the UCSCTable Browser [17] on assembly NCBI36.We compared the segmentation against GENCODE
[18] version 3c gene annotations and transcription startsites (TSSs). We classified a gene as active when thenumber of ENCODE Project RNA-seq [19] reads perkilobase per million mapped reads (RPKM) in the geneexceeded the 75th percentile and as inactive when thegene had 0 RPKM. We classified TSS as active when it
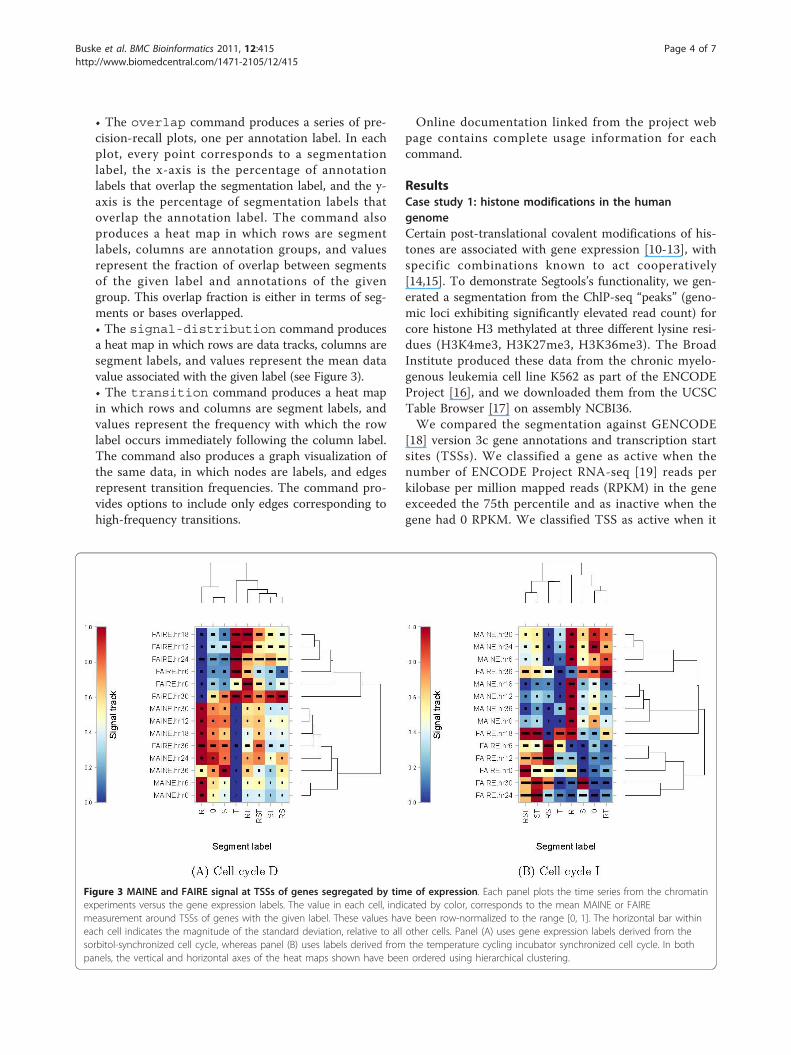
Figure 3 MAINE and FAIRE signal at TSSs of genes segregated by time of expression. Each panel plots the time series from the chromatinexperiments versus the gene expression labels. The value in each cell, indicated by color, corresponds to the mean MAINE or FAIREmeasurement around TSSs of genes with the given label. These values have been row-normalized to the range [0, 1]. The horizontal bar withineach cell indicates the magnitude of the standard deviation, relative to all other cells. Panel (A) uses gene expression labels derived from thesorbitol-synchronized cell cycle, whereas panel (B) uses labels derived from the temperature cycling incubator synchronized cell cycle. In bothpanels, the vertical and horizontal axes of the heat maps shown have been ordered using hierarchical clustering.
Buske et al. BMC Bioinformatics 2011, 12:415http://www.biomedcentral.com/1471-2105/12/415
Page 4 of 7
had at least 2 K562 cytosolic poly(A)+ CAGE tagsmapped from the ENCODE Project CAGE data [20],and as inactive when the TSS had 0 CAGE tags. First,we used flatten to create a segmentation in which thelabel for each segment corresponds to the combinationof histone modifications with a peak at that segment.For example, the “4/27” label corresponds to regionsspanned by both H3K4me3 and H3K27me3 ChlP-seqpeaks. We then used aggregation in “gene mode” tovisualize the enrichment of each label around the 11,693protein-coding GENCODE genes active in the K562 cellline. Consistent with previous studies, Figure 1a showsthe enrichment of H3K4me3 (4) around active transcrip-tion start sites in the first row, depletion of H3K27me3(27) around active genes in the second row, and enrich-ment of H3K36me3 (36) in the bodies of actively-tran-scribed genes in the third row.Then we created Figure 1b, with nucleotide-fre-
quency. It shows the increased frequency of CpG in alllabels that include promoter-associated H3K4me3 (4)peaks.Finally, we used overlap to explore each label’s pre-
dictive power for protein-coding TSS activity. With pre-cision (also known as the positive predictive value) of70.2% and and recall (or sensitivity) of 54.2%, segmentshigh in both H3K4me3 and H3K36me3 were most pre-dictive of overlapped TSSs being active. Surprisingly,segments high in all three histone modifications werethe next most predictive of TSS activity, with precisionof 68.7% and recall of 20.1%, suggesting that the pre-sence of the other two histone modifications compen-sates for the inhibitory effect of H3K27me3. Segmentswith H3K27me3 alone were the most predictive of inac-tive TSSs, with precision of 95.2% and recall of 30.7%,though segments also high in H3K36me3 spanned anadditional 5.2% of the inactive TSSs with a precision of83.6%. In general, Segtools analyses are quick and paral-lelize easily. For this case study, the flatten analysis,which operated on three segmentations consisting ofaround 61,000 segments spanning ~50% of the humangenome, required only 15 s on a single 2.33 GHz IntelXeon CPU. The nucleotide-transition com-mand processed the 1.6 billion bases spanned by thesegmentation in 4 min, the overlap command summar-ized the intersection between these segments and 73,000transcription start sites in 17 s, and the aggregationaggregated the segmentation over 9,000 gene models in2 min.
Case study 2: gene expression and local chromatinstructure in the Plasmodium falciparum genomeWe used Segtools to investigate the relationshipbetween gene expression and local chromatin structurein Plasmodium falciparum, the parasite responsible for
the most lethal form of malaria. Le Roch et al. [21] per-formed microarray expression assays in two time seriesacross the Plasmodium erythrocytic cell cycle, corre-sponding to cell cycle synchronization performed with a5% D-sorbitol treatment (cell cycle D) and a tempera-ture cycling incubator (cell cycle I). Recently, these datawere complemented with cell cycle time series datafrom two assays that measure local chromatin structure[22]: formaldehyde-assisted isolation of regulatory ele-ments (FAIRE) [23] and MNase-assisted isolation ofnucleosomal elements (MAINE) [24,25]. We used Seg-tools to investigate the extent to which the local chro-matin profile varies as a function of gene expression.Our analysis consisted of three steps. First, we identi-
fied genes that were significantly expressed in each ofthe three primary stages of the erythrocytic cycle: ring,trophozoite and schizont. To do so, we applied the sta-tistical criterion from [21], and we required that thegene be expressed either in the “early” or “late” geneexpression experiment for the given stage. This proce-dure was carried out separately for the two cell cycledata sets (D and I). Second, we used a previouslycurated set of transcription start sites (TSSs) [26] toidentify genes with a single, known TSS, and then welabeled these TSSs with one of eight labels (R, S, T, RS,RT, ST, RST, 0) indicating the stages during which thegene is expressed. This labeling was accomplished bycreating a BED file for each stage and then using flat-ten to merge the separate files into a single segmenta-tion. The flattening was carried out separately for eachcell cycle data set, resulting in two distinct labelings.Third, we applied several Segtools commands to each ofthe two segmentations, using a Genomedata archive thatcontained the FAIRE and MAINE data.Figure 2 shows the results of applying length-dis-
tribution. Because we selected a 200 bp windowaround each TSS, the percent coverage by “Segments”or “Bases” is identical so we specified -no-segmentsto only plot the base coverage. The figure shows that alarge proportion (47%-48%) of genes with known TSSsare expressed in all three stages of the erythrocyticcycle, and only a small proportion (10%-13%) areexpressed, or at least accessible to transcription factors,exclusively in a single stage. This observation is consis-tent across the two cell cycles. Altogether, the data indi-cates that only a small proportion of the genes can beexpressed in a stage specific manner.Figure 3 shows the distribution of MAINE and FAIRE
values over the course of the erythrocytic cell cycle as afunction of different gene expression classes, producedusing signal-distribution. Each cell correspondsto one expression label and one time point. The color ofeach cell indicates the strength of the MAINE or FAIREsignal in TSSs with the corresponding label. Each row of
Buske et al. BMC Bioinformatics 2011, 12:415http://www.biomedcentral.com/1471-2105/12/415
Page 5 of 7
the plot is linearly scaled so that the minimum andmaximum values are 0 and 1, respectively. Horizontallines within the plot indicate the magnitude of the stan-dard deviation in a given cell, relative to all other cells.Rows and columns have been ordered using the hier-archical clusterings shown on the top and right of eachheat map. These two plots exhibit several intriguingfeatures.First, we note that the hierarchical clusterings shown
along the right edge of both panels indicate that theFAIRE measurements at the end of the erythrocyticcycle (hr36) most closely resembles MAINE measure-ments (at hours 12, 18 and 30 in cell cycle D and hours6, 24 and 30 in cell cycle I). This observation — that theFAIRE measurement of open chromatin at hr36 resem-bles measurements of closed chromatin — is consistentwith the model proposed by Ponts et al., in which theparasite strongly compacts its chromatin in preparationfor egress from the red blood cell at the end of the ery-throcytic cycle. Second, we note that the genesexpressed exclusively at the beginning of the cell cycle(R - ring stage) show an extremely strong and comple-mentary pattern to genes expressed during the middleof the cell cycle (T - trophozoite stage). This pattern isparticularly strong in cell cycle D (panel A), but alsoappears in cell cycle I (panel B). Apparently, ring-speci-fic genes exhibit closed chromatin around their TSSs,whereas trophozoite-specific genes exhibit open chroma-tin around their TSSs. This pattern is consistent acrossnearly the entire cell cycle, with the possible exceptionof hr36, suggesting that local chromatin structure maycontribute to stage-specific gene expression, but thatlocal chromatin dynamics may not be the only mechan-ism regulating gene expression.Overall, the figure shows relatively little correlation
between the time at which a gene is expressed andchanges in local chromatin structure. Canonically, timepoints 0, 6 and 12 of the MAINE/FAIRE data corre-spond to the ring stage, time points 18 and 24 corre-spond to the trophozoite, and time points 30 and 36correspond to schizont. The absence of a strong correla-tion between time of expression and the degree of localchromatin compaction suggests that, though Ponts et al.have clearly demonstrated that local chromatin structurechanges over the course of the erythrocytic cycle, thecurrent analysis does not support a model in which thedegree of chromatin compaction around the TSSdirectly correlates with the expression of the gene.Apparently, a more complex model that integrates addi-tional types of data, such as transcription factor bindingand histone modification profiles, is required to fullyunderstand Plasmodium’s unusual gene expressionmachinery.
Discussion and ConclusionsSegtools enables the rapid exploration of a bird’s-eyeview of complex multi-label data, allowing researchersto easily generate and confirm hypotheses.One challenge in creating any software toolkit is to
define the scope of the project, treading a line betweensolving many problems and solving a few problems well.Segtools is specifically targeted toward the analysis ofsegmentations, which we believe will become an increas-ingly prevalent and useful way to make sense of collec-tions of parallel genomic data sets. Segtools emphasizesthe efficient calculation of summary statistics and publi-cation quality visualizations thereof. Indeed, all of thefigures in this article were generated directly by Segtoolswith no subsequent processing. Statistical hypothesistesting — that is, testing for the enrichment of a specificannotation label within a specific segment label — hasnot been implemented, primarily because many suchtests have been proposed [27-30]. Full implementationsof such tests are available in R, and Segtools can intero-perate seamlessly with these existing functions. Similarly,we have not attempted to build into Segtools sophisti-cated functionality for pre-filtering segmentations andannotations. Segtools currently includes limited pre-pro-cessing functionality, in the form of the flatten andfeature-distance commands; however, for sophis-ticated logical filtering operations, a toolkit such asGalaxy [31] or BEDtools [7] should be used prior toSegtools analysis.Given the growing availability of large-scale heteroge-
neous functional genomics data sets, methods that allowus to quickly and easily summarize and make sense ofthese data are in growing demand. The two case studiesincluded in this paper demonstrate how one can useSegtools to pick out interesting results from complexdata. Individually examining many potential hypothesesone-by-one would prove laborious and difficult, but Seg-tools makes it trivial to perform a broad battery ofexploratory data analyses and find the important fea-tures of segmentation results.
Availability and requirementsProject name: SegtoolsProject home page: http://noble.gs.washington.edu/
proj/segtoolsOperating systems: Linux, Mac OS XProgramming language: Python 2.5.1-2.7, R ≥ 2.10Other requirements: Segtools requires NumPy ≥ 1.3,
two R packages (latticeExtra, reshape), one Python pack-age (RPy2 ≥ 2.1.3), and the Genomedata Python packagefor the two commands that process Genomedata files.Segtools can then be easily installed by typing easy_-setup segtools at the shell prompt. Segtools can
Buske et al. BMC Bioinformatics 2011, 12:415http://www.biomedcentral.com/1471-2105/12/415
Page 6 of 7
also be acquired using our installation script thatattempts to install Segtools and all missing dependen-cies, or it can be downloaded as a virtual machine com-plete with all dependencies. See the project home pagefor additional installation instructions.License: GNU GPLAny restrictions to use by non-academics: none
AcknowledgementsWe wish to thank Mirela Andronescu, Nathan Boley, and the ENCODEProject Consortium for assistance and data. This work was funded by theNational Institutes of Health [HG004695].
Author details1Department of Genome Sciences, University of Washington, PO Box 355065,Seattle, WA 98195-5065, USA. 2The Institute for Integrative Genome Biology,University of California, Riverside, 900 University Avenue, Riverside, CA 92521,USA. 3Department of Computer Science and Engineering, University ofWashington, PO Box 352350, Seattle, WA 98195-2350, USA.
Authors’ contributionsMMH and WSN conceived of and supervised the project. OJB and MMHdeveloped the software. OJB and WSN carried out the experiments. OJB,MMH, NP, KGLR and WSN wrote the manuscript. All authors read andapproved the final manuscript.
Received: 11 February 2011 Accepted: 26 October 2011Published: 26 October 2011
References1. Day N, Hemmaplardh A, Thurman RE, Stamatoyannopoulos JA, Noble WS:
Unsupervised segmentation of continuous genomic data. Bioinformatics2007, 23(11):1424-1426.
2. Jaschek R, Tanay A: Spatial Clustering of Multivariate Genomic andEpigenomic Information. RECOMB Proceedings 2009, 5541:170-183.
3. Ernst J, Kellis M: Discovery and characterization of chromatin states forsystematic annotation of the human genome. Nature Biotechnology 2010,28(8):817-825.
4. Kharchenko PV, Alekseyenko AA, Schwartz YB, Minoda A, Riddle NC, Ernst J,Sabo PJ, Larschan E, Gorchakov AA, Gu T, Linder-Basso D, Plachetka A,Shanower G, Tolstorukov MY, Luquette LJ, Xi R, Jung YL, Park RW,Bishop EP, Canfield TP, Sandstrom R, Thurman RE, MacAlpine DM,Stamatoyannopoulos JA, Kellis M, Elgin SCR, Kuroda MI, Pirrotta V,Karpen GH, Park PJ: Comprehensive analysis of the chromatin landscapein Drosophila melanogaster. Nature 2010, 471:480-485.
5. Kent WJ, Sugnet CW, Furey TS, Roskin KM, Pringle TH, Zahler AM,Haussler D: The Human Genome Browser at UCSC. Genome Research 2002,12:996-1006.
6. Giardine B, Riemer C, Hardison RC, Burhans R, Elnitski L, Shah P, Zhang Y,Blankenberg D, Albert I, Taylor J, Miller W, Kent WJ, Nekrutenko A: Galaxy: aplatform for interactive large-scale genome analysis. Genome Research2005, 15(10):1451-1455.
7. Quinlan AR, Hall IM: BEDTools: a flexible suite of utilities for comparinggenomic features. Bioinformatics 2010, 26(6):841-842.
8. Bock C, Kuster GV, Halachev K, Taylor J, Nekrutenko A, Lengauer T: Web-based analysis of (Epi-) genome data using EpiGRAPH and Galaxy.Methods in Molecular Biology 2010, 628:275-296.
9. Hoffman MM, Buske OJ, Noble WS: The Genomedata format for storinglarge-scale functional genomics data. Bioinformatics 2010,26(11):1458-1459, [PMC2872006].
10. Kouzarides T: Chromatin modifications and their function. Cell 2007,128(4):693-705.
11. Barski A, Cuddapah S, Cui K, Roh TY, Schones DE, Wang Z, Wei G,Chepelev I, Zhao K: High-resolution profiling of histone methylations inthe human genome. Cell 2007, 129:823-837.
12. Kolasinska-Zwierz P, Down T, Latorre I, Liu T, Liu XS, Ahringer J: Differentialchromatin marking of introns and expressed exons by H3K36me3.Nature Genetics 2009, 41(3):376-381.
13. Schwartz S, Meshorer E, Ast G: Chromatin organization marks exon-intronstructure. Nature Structural Molecular Biology 2009, 16(9):990-995.
14. Koch C, Andrews R, Flicek P, Dillon S, Karaöz U, Clelland G, Wilcox S,Beare D, Fowler J, Couttet P, James K, Lefebvre G, Bruce A, Dovey O, Ellis P,Dhami P, Langford C, Weng Z, Birney E, Carter N, Vetrie D, Dunham I: Thelandscape of histone modifications across 1% of the human genome infive human cell lines. Genome Research 2007, 17:691-707.
15. Wang Z, Zang C, Rosenfeld JA, Schones DE, Barski A, Cuddapah S, Cui K, Roh T,Peng W, Zhang MQ, Zhao K: Combinatorial patterns of histone acetylationsand methylations in the human genome. Nature Genetics 2008, 40(7):897-903.
16. ENCODE Consortium: The ENCODE (ENCyclopedia Of DNA Elements)Project. Science 2004, 306(5696):636-640.
17. Karolchik D, Hinrichs AS, Furey TS, Roskin KM, Sugnet CW, Haussler D,Kent WJ: The UCSC table browser retrieval tool. Nucleic Acids Research2004, , 32 Database: D493-D496.
18. Harrow J, Denoeud F, Frankish A, Reymond A, Chen CK, Chrast J, Lagarde J,Gilbert JGR, Storey R, Swarbreck D, Rossier C, Ucla C, Hubbard T,Antonarakis SE, Guigó R: GENCODE: Producing a reference annotation forENCODE. Genome Biology 2006, 7(Suppl 1):S4.
19. ENCODE Consortium: A user’s guide to the encyclopedia of DNAelements (ENCODE). PLoS Biology 2011, 9(4):e1001046.
20. Takahashi H, Kato S, Murata M, Carninci P: CAGE (Cap Analysis of GeneExpression): A Protocol for the Detection of Promoter andTranscriptional Networks. Methods in Molecular Biology 2012, 784:181-200.
21. Roch KGL, Zhou Y, Blair PL, Grainger M, Moch JK, Haynes JD, de la Vega P,Holder AA, Batalov S, Carucci DJ, Winzeler EA: Discovery of gene functionby expression profiling of the malaria parasite life cycle. Science 2003,301(5639):1503-1508.
22. Ponts N, Harris EY, Prudhomme J, Wick I, Eckhardt-Ludka C, Hicks GR,Hardiman G, Lonardi S, Le Roch KG: Nucleosome landscape and control oftranscription in the human malaria parasite. Genome Research 2010,20(2):228-238.
23. Giresi PG, Lieb JD: Isolation of active regulatory elements from eukaryoticchromatin using FAIRE (Formaldehyde Assisted Isolation of RegulatoryElements). Methods 2009, 48(3):233-239.
24. Gupta S, Dennis J, Thurman RE, Kingston R, Stamatoyannpoulos JA,Noble WS: Predicting human nucleosome occupancy from primarysequence. PLoS Computational Biology 2008, 4(8):e10000134, [PMC2515632].
25. Kaplan N, Moore IK, Fondufe-Mittendorf Y, Gossett AJ, Tillo D, LeProust YFEM,Hughes TR, Lieb JD, Widom J, Segal E: The DNA-encoded nucleosomeorganization of a eukaryotic genome. Nature 2009, 458(7236):362-366.
26. Ponts N, Harris EY, Lonardi S, Le Roch KG: Nucleosome occupancy attranscription start sites in the human malaria parasite: A hard-wiredevolution of virulence? Infection Genetics and Evolution 2011, 11(4):716-724.
27. Blakesley RW, Hansen NF, Mullikin JC, Thomas PJ, McDowell JC, Maskeri B,Young AC, Benjamin B, Brooks SY, Coleman BI, Gupta Y, Ho S, Karlins EM,Maduro QL, Stantripop S, Tsurgeon C, Vogt JL, Walker MA, Masiello CA,Guan X, Bouffard GG, Green ED: An intermediate grade of finishedgenomic sequence suitable for comparative analyses. Genome Research2004, 14(11):2235-2244.
28. Redon R, Ishikawa S, Fitch KR, Feuk L, Perry GH, Andrews TD, Fiegler H,Shapero MH, Carson AR, Chen W, Cho EK, Dallaire S, Freeman JL,Gonzalez JR, Gratacos M, Huan J, Kalaitzopoulos D, Komura D, MacDonal JR,Marshall CR, Mei R, Montgomery L, nad K Okamura KN, Shen F,Somerville MJ, Tchinda J, Valsesia A, Woodwark C, Yang F, Zhang J, Zerjal T,Zhang J, Armengol L, COnrad DF, Estivill X, Tyler-Smith C, Carter NP,Aburatain H, Lee C, Jones KW, Scherer SW, Hurles ME: Global variation incopy number in the human genome. Nature 2006, 444:444-454.
29. Bickel PJ, Boley N, Brown JB, Huang H, Zhang NR: Subsampling methodsfor genomic inference. Annals of Applied Statistics 2010, 4(4):1660-1697.
30. McLean CY, Bristoer D, Hiller M, Clarker SL, Schaar BT, Lowe CB,Wenger AM, Bejerano G: GREAT improves functional interpretation of cis-regulatory regions. Nature Biotechnology 2010, 28(5):495-501.
31. Goecks J, Nekrutenko A, Taylor J: Galaxy: a comprehensive approach forsupporting accessible, reproducible, and transparent computationalresearch in the life sciences. Genome Biology 2010, 11(8):R86.
doi:10.1186/1471-2105-12-415Cite this article as: Buske et al.: Exploratory analysis of genomicsegmentations with Segtools. BMC Bioinformatics 2011 12:415.
Buske et al. BMC Bioinformatics 2011, 12:415http://www.biomedcentral.com/1471-2105/12/415
Page 7 of 7
Related Documents