1 INTRODUCTION 1.1 Type area Accurate forecasts of flood water levels are essential for flood management. While a lot of improvements have been made in the field of hydraulic modeling, the roughness values of the main channel and flood- plains are still largely uncertain (Warmink et al., 2007, 2013). This research focusses on the rough- ness of the main channel under field conditions, which is mainly determined by the bed forms that develop on the river bed. Rivers dunes are the dominant bed forms in many rivers. The height is in the order of 10 - 30% of the water depth and their length in the order of 10 times their heights. Under flood conditions the bed is high- ly dynamic; dunes grow and decay as a result of the changing flow conditions. River bed forms act as roughness to the flow, thereby significantly influenc- ing the water levels. Accurate and fast computer models are required to predict daily water level fore- casts for operational flood management and fore- casting. In current river models, the hydraulic roughness if often used as a calibration coefficient (e.g. Bates et al. 2004; Van den Brink et al. 2006). However, hydraulic roughness is then a constant or a directly related to flow conditions. Recent advances in research about river bed forms, however, provides knowledge about the evolution of bed forms. This knowledge is currently not included in the prediction of water levels in operational flood modelling. The objective of this paper is to investigate the potential of fast bed form evolution models to reduce the need for calibration of flood models. We implemented the time-lag model of Coleman et al. (2005) combined with the Van Rijn (1984) roughness model to dy- namically predict roughness for the Dutch river Rhine branches. 2 DATA & STUDY AREA 2.1 Study area Flooding is a serious threat in the Netherlands. Strong dikes have been constructed to protect the Explicit computation of bed form roughness for operational flood modelling, a case study for the river Rhine J.J. Warmink Department of Water Engineering and Management, University of Twente, Enschede, Netherlands R.M.J. Schielen Centre for Water Management, Rijkswaterstaat, Netherlands ABSTRACT: The hydraulic roughness of the main channel of most lowland rivers is dominated by bed forms. River bed forms act as roughness to the flow, thereby significantly influencing the water levels, which are essential for flood forecasting. We implemented a time-lag model to predict dynamic bed form evolution during a flood wave. The results showed that the explicit computation of bed form and associated roughness predictions perform equally well as a calibrated model for the Dutch river Rhine branches in the Netherlands. We were able to explain a large part of the roughness of the main channel that is normally calibrated. Using a physically-based roughness prediction improves the accuracy of the modelled water levels for operational flood forecasting. Figure 1. River Rhine in the Netherlands bifurcates into Waal, Nederrijn and IJssel. The circles show the bifurcation points Pannerdensche Kop (PK) and IJssel Kop (IJK).

Welcome message from author
This document is posted to help you gain knowledge. Please leave a comment to let me know what you think about it! Share it to your friends and learn new things together.
Transcript
1 INTRODUCTION
1.1 Type area Accurate forecasts of flood water levels are essential for flood management. While a lot of improvements have been made in the field of hydraulic modeling, the roughness values of the main channel and flood-plains are still largely uncertain (Warmink et al., 2007, 2013). This research focusses on the rough-ness of the main channel under field conditions, which is mainly determined by the bed forms that develop on the river bed.
Rivers dunes are the dominant bed forms in many rivers. The height is in the order of 10 - 30% of the water depth and their length in the order of 10 times their heights. Under flood conditions the bed is high-ly dynamic; dunes grow and decay as a result of the changing flow conditions. River bed forms act as roughness to the flow, thereby significantly influenc-ing the water levels. Accurate and fast computer models are required to predict daily water level fore-casts for operational flood management and fore-casting. In current river models, the hydraulic roughness if often used as a calibration coefficient (e.g. Bates et al. 2004; Van den Brink et al. 2006). However, hydraulic roughness is then a constant or a directly related to flow conditions. Recent advances in research about river bed forms, however, provides knowledge about the evolution of bed forms. This knowledge is currently not included in the prediction of water levels in operational flood modelling. The objective of this paper is to investigate the potential of fast bed form evolution models to reduce the need
for calibration of flood models. We implemented the time-lag model of Coleman et al. (2005) combined with the Van Rijn (1984) roughness model to dy-namically predict roughness for the Dutch river Rhine branches.
2 DATA & STUDY AREA
2.1 Study area Flooding is a serious threat in the Netherlands. Strong dikes have been constructed to protect the
Explicit computation of bed form roughness for operational flood modelling, a case study for the river Rhine
J.J. Warmink Department of Water Engineering and Management, University of Twente, Enschede, Netherlands
R.M.J. Schielen Centre for Water Management, Rijkswaterstaat, Netherlands
ABSTRACT: The hydraulic roughness of the main channel of most lowland rivers is dominated by bed forms. River bed forms act as roughness to the flow, thereby significantly influencing the water levels, which are essential for flood forecasting. We implemented a time-lag model to predict dynamic bed form evolution during a flood wave. The results showed that the explicit computation of bed form and associated roughness predictions perform equally well as a calibrated model for the Dutch river Rhine branches in the Netherlands. We were able to explain a large part of the roughness of the main channel that is normally calibrated. Using a physically-based roughness prediction improves the accuracy of the modelled water levels for operational flood forecasting.
Figure 1. River Rhine in the Netherlands bifurcates into Waal, Nederrijn and IJssel. The circles show the bifurcation points Pannerdensche Kop (PK) and IJssel Kop (IJK).
land from flooding. After the 1993 and 1995 near flood events, the Dutch government laid down that every 5 years the safety of the primary dikes has to be evaluated against a design discharge (Van Stok-kom et al., 2005). This design discharge of 16000 m3/s is based on the statistical analysis of historical discharge series.
After the river Rhine enters the Netherlands (at Lobith) it bifurcates at “Pannerdensche Kop (PK)” into the rivers Waal and the Pannerdensch Canal. Further downstream the Pannerdensch Canal bifur-cates in the river Nederrijn/Lek and the river IJssel (Figure 1).
2.2 Data We modelled the discharge wave of Octo-ber/November 1998, because extensive dune dimen-sion data were available by Frings and Kleinhans (2008). They measured the dune dimensions at three locations at PK: just upstream in the Rhine and just downstream in the Waal and Pannerdensch Canal. Multibeam echo sounding observations of the river bed were made about twice a day for ten days and about every three days for the next twelve days. The bathymetry data were processed to yield the dune dimensions and migration rates using the procedure described in Ten Brinke et al. (1999). Dunes were classified into primary and secondary bed forms, which appear after the peak of the flood wave. In this study only the primary dunes are included in the data. Also the size of the bed material was recorded and sediment transport was computed using both dune data and a Helley-Smith bed load sampler. Simultaneously, velocity measurements were taken using an ADCP, for six days of the 1998 flood wave. Furthermore, water level and discharge data were available at several measurement stations through Rijkswaterstaat. Local water surface slopes were computed from detailed laser altimetry data just up-stream of PK. The roughness of the main channel was computed using Chézy’s law: 𝐶 = 𝑢
√ℎ𝑆 [1]
Where u is flow velocity [m/s], h is water depth [m] and S is water surface slope [-]. Table 1. Data from Frings and Kleinhans (2008) for the three branches at PK. For the flow data only the values during the peak on Nov 4 are shown, for the dune data (H,L) only the maxima are shown.
Branch Qpeak
[m3/s] Hpeak [m]
Upeak [m/s]
Smean [m/m]
Hmax [m]
Lmax [m]
D50 [mm]
P0 9413 12.7 2.15 2.8e-4 1.2 33.1 3.1 P1 6172 10.5 1.84 0.8e-4 0.48 12.5 1.1 P2 3302 11.2 2.13 0.8e-4 0.49 16.6 7.2 * Maximum dune length (H,L) occurred not at the same time as maximum discharge.
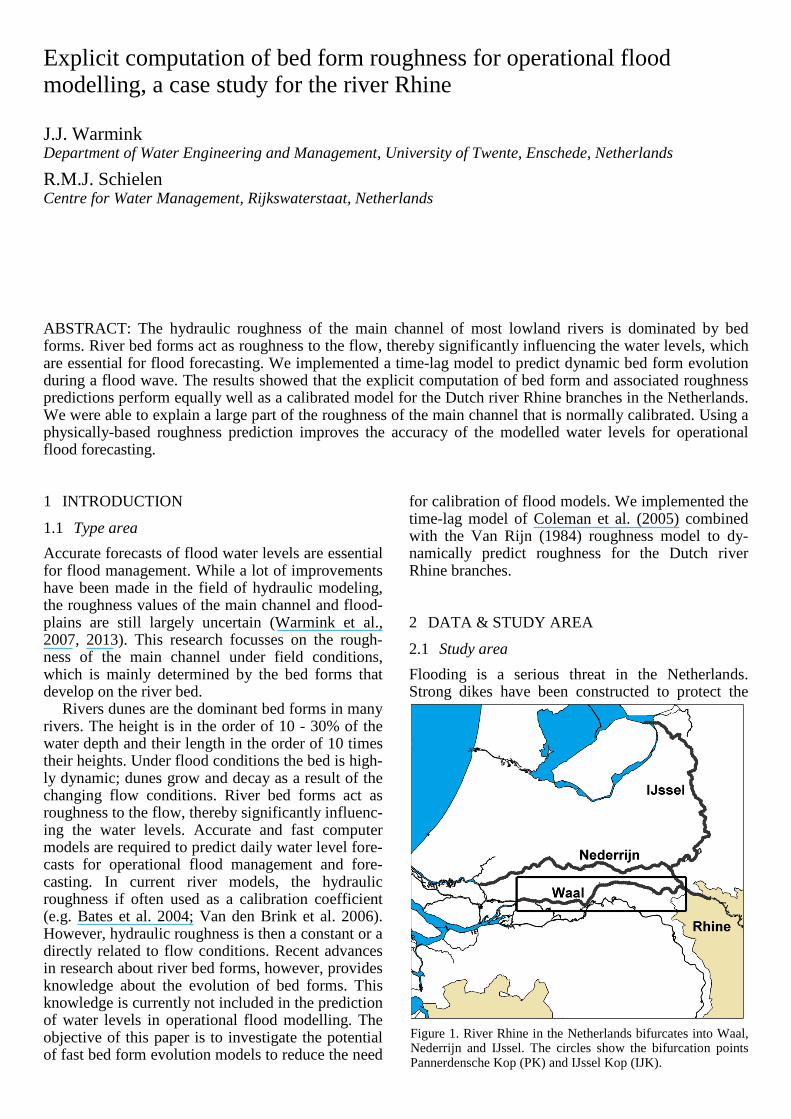
2.3 Sobek model description As a test case, we followed the SOBEK model ap-proach presented by Paarlberg and Schielen (2012), but for another period and extended location. Sobek is a 1D hydraulic model that is used in the Nether-lands to make water level predictions for the main rivers. SOBEK solves the 1D cross-sectional integrat-ed shallow water equations. Cross sections are de-fined approximately every 500 m, so large scale var-iations in river geometry are accounted for (Paarlberg and Schielen, 2012). We used the SOBEK model for the three main distributaries in of the river Rhine in the Netherlands with an upstream boundary at Ruhrort, Germany (Figures 1 and 2).
The roughness of the main channel in the SOBEK model was calibrated on measured water levels for a flood wave in 1995 (peak discharge of about 12000 m3/s at Lobith) for 9 sections between the water lev-el stations of roughly between 15 and 85 km length (Figure 2). The calibrated roughness coefficient is specified as a function of the river discharge, thus for each discharge the roughness coefficient is al-ways equal. This means that, although dunes are ”included” in the measured water levels, hysteresis effects due to dune evolution are not incorporated in the calibrated roughness coefficients. Each section (between circles in Figure 2) was calibrated sepa-rately.
The observed discharge was set as upstream boundary condition and corresponding water levels were set at the three downstream boundary condi-tions: Werkendam, Krimpen a/d Lek and Katerveer. The downstream boundary conditions are located more than 50km downstream of the bifurcation points and did not influence the water levels at the PK.
Figure 2. Sobek model schematization of the Rhine distributar-ies in the Netherlands. Names refer to water level stations. The roughness was computed for the three branches: P0, P1 and P2.
3 METHOD
3.1 Coleman et al. (2005) method To predict the dune dimensions, we use the analyti-cal time-lag approach presented by Coleman et al. (2005). This dune evolution model predicts the (non-equilibrium) dune dimensions based on only data of the water levels. However, because water level de-pends on the roughness and therefore on the bed forms, we compute this in an iterative manner by coupling the dune evolution model with the Sobek model following the approach of Paarlberg and Schielen (2012) and Warmink and Schielen (2014).
Coleman et al. (2005) adopted the commons scal-ing relationship for sand-wave development from an initially flat bed from Nikora & Hicks (1997) valid for 0.01< t / te< 1: PPe
= � tte�γ [2]
where P is the average value of dune length or height, Pe is the equilibrium value, t is time, te is the time to achive Pe, and γ is a growth rate parameter. Coleman et al. (2005) derived a relation for γ, based on flume experiment with a discharge step. They showed that growth rate was different for dune height and dune length and only depended on char-acteristic sediment size, D: γH = 0.22D∗
0.22 ≈ 0.37 [3] 𝛾L = 0.14𝐷∗0.33 ≈ 0.32 [4] where γH and γL are the growth rate parameters for height and length respectively (-), D is a non-dimensional sediment size based on median grain size D50 (m). Furthermore, the Coleman approach requires an estimate of the time-to-equilibrium, te, and the equilibrium dune dimensions, Heq and Leq.
Coleman et al. (2005) used their data to derive an empirical equation to predict the time-to-equilibrium for dunes, based on shear velocity, 𝑢∗, water depth, h, the Shields number, θ, and critical Shields num-ber, θcr:
te �u∗D50
� = 2.05 ∗ 10−2 ��D50h�−3.5
� �� θθcr�−1.12
� [5] A rough calibration showed that te for both dune height and length needed to be adapted by a factor 0.001 to yield realistic results.
Many empirical equations are available to predict the equilibrium dune dimensions, such as Yalin (1964), Van Rijn (1984), Julien and Klaassen (1995). These equations are usually a relation be-tween dune dimensions and water depth and depend-ing on the author several other parameters. Naqshband et al. (2014) showed that based on e.g. the Froude number the dune dimensions may signif-icantly differ. This implies that the most appropriate equilibrium predictor needs to be selected. In this study we adopted the dune dimensions predictor of Allen (1968), which performed best for field data:
𝐻 = 0.068 ℎ1.19 [6] 𝐿 = 1.16ℎ1.55 [7] where H is dune height (m), L is dune length (m) and h is water depth (m).
Finally, the dune roughness coefficient of the main channel was computed using Van Rijn (1993) for the relation between computed dune dimensions and bed roughness where α = 0.7: 𝑘𝑠,𝑔𝑟𝑎𝑖𝑛 = 𝐷90 [8] 𝑘𝑠,𝑑𝑢𝑛𝑒 = 1.1𝛼𝐻 �1 − exp �−25𝐻
𝐿�� [9]
This roughness height is translated into a Chézy, C coefficient using the White-Colebrook equation for comparison with the roughness from the flow meas-urements. C = 18 log �12h
ks� [10]
where h is the water depth and ks the sum of ks,grain and ks,dune.
3.2 SobekDune method In our modelling approach, we imposed the dis-charge in Sobek to compute the water depths, given an initial roughness. For this water depth, the dune dimensions and associated roughness were comput-ed for the three branches connecting to the PK bifur-cation point. If at time, t, the water depths or rough-ness changed more than 5% compared to the start of
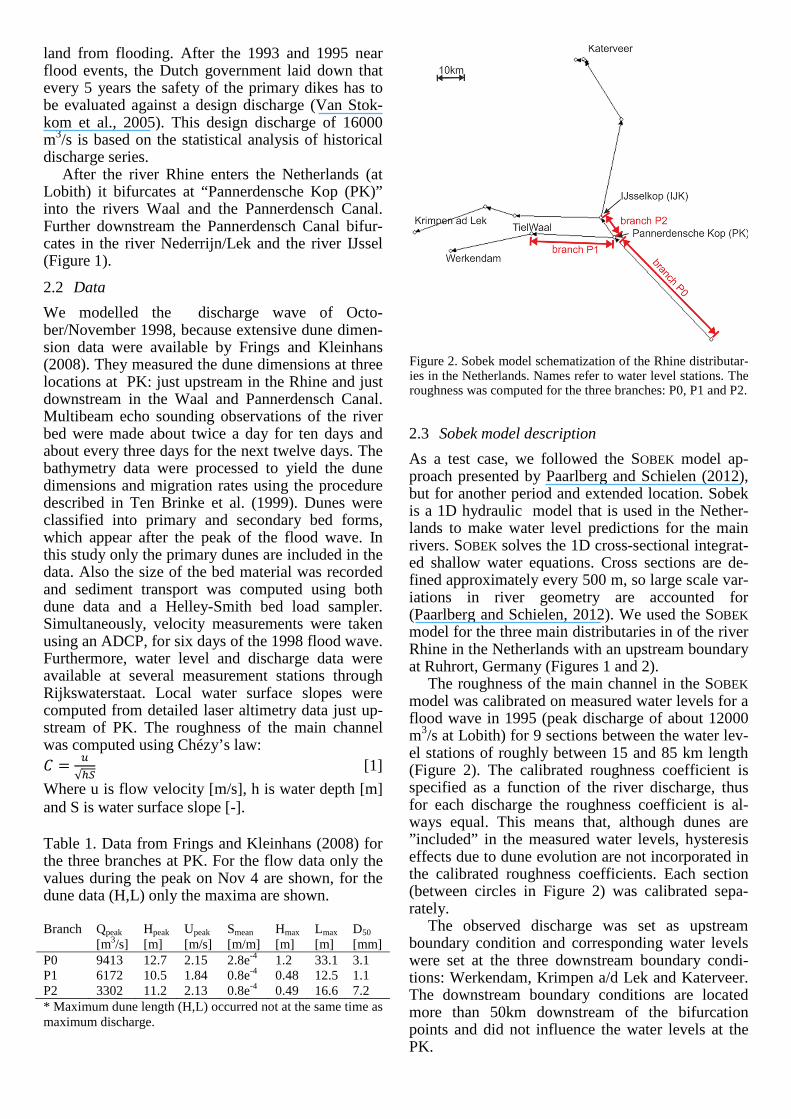
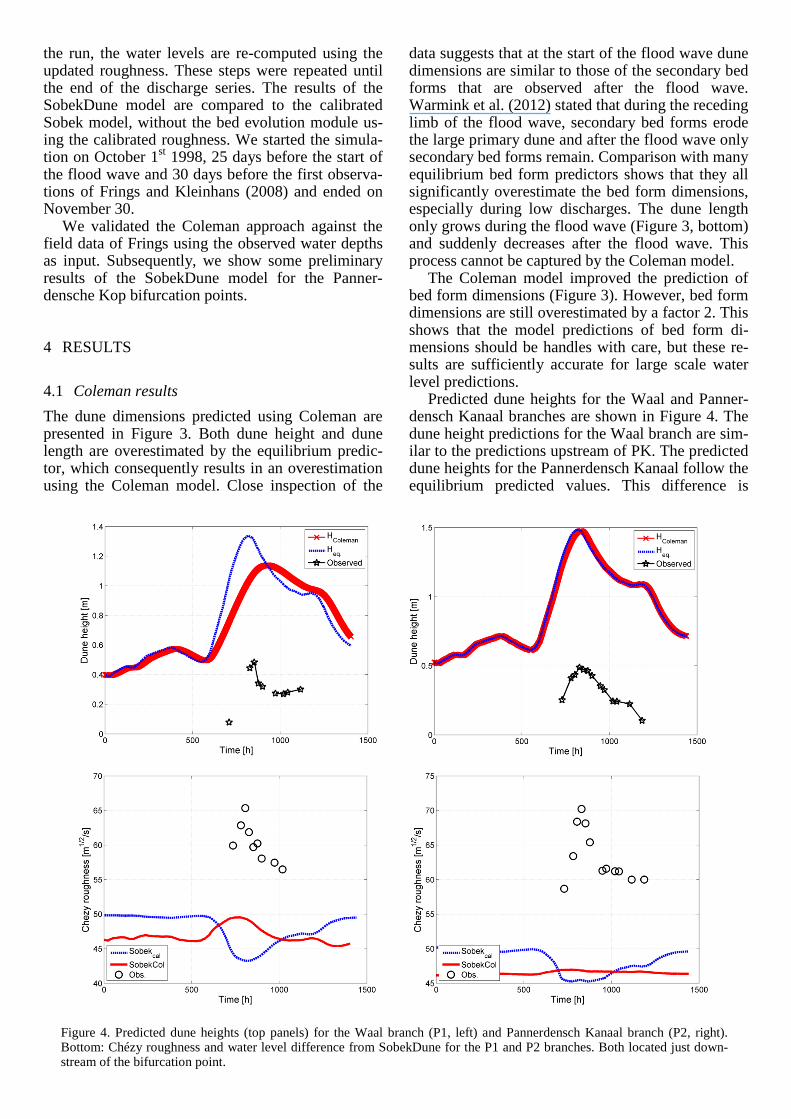
Figure 3. Dune dimensions predicted by Coleman using ob-served water levels just upstream of PK (Upper Rhine branch).
the run, the water levels are re-computed using the updated roughness. These steps were repeated until the end of the discharge series. The results of the SobekDune model are compared to the calibrated Sobek model, without the bed evolution module us-ing the calibrated roughness. We started the simula-tion on October 1st 1998, 25 days before the start of the flood wave and 30 days before the first observa-tions of Frings and Kleinhans (2008) and ended on November 30.
We validated the Coleman approach against the field data of Frings using the observed water depths as input. Subsequently, we show some preliminary results of the SobekDune model for the Panner-densche Kop bifurcation points.
4 RESULTS
4.1 Coleman results The dune dimensions predicted using Coleman are presented in Figure 3. Both dune height and dune length are overestimated by the equilibrium predic-tor, which consequently results in an overestimation using the Coleman model. Close inspection of the
data suggests that at the start of the flood wave dune dimensions are similar to those of the secondary bed forms that are observed after the flood wave. Warmink et al. (2012) stated that during the receding limb of the flood wave, secondary bed forms erode the large primary dune and after the flood wave only secondary bed forms remain. Comparison with many equilibrium bed form predictors shows that they all significantly overestimate the bed form dimensions, especially during low discharges. The dune length only grows during the flood wave (Figure 3, bottom) and suddenly decreases after the flood wave. This process cannot be captured by the Coleman model.
The Coleman model improved the prediction of bed form dimensions (Figure 3). However, bed form dimensions are still overestimated by a factor 2. This shows that the model predictions of bed form di-mensions should be handles with care, but these re-sults are sufficiently accurate for large scale water level predictions.
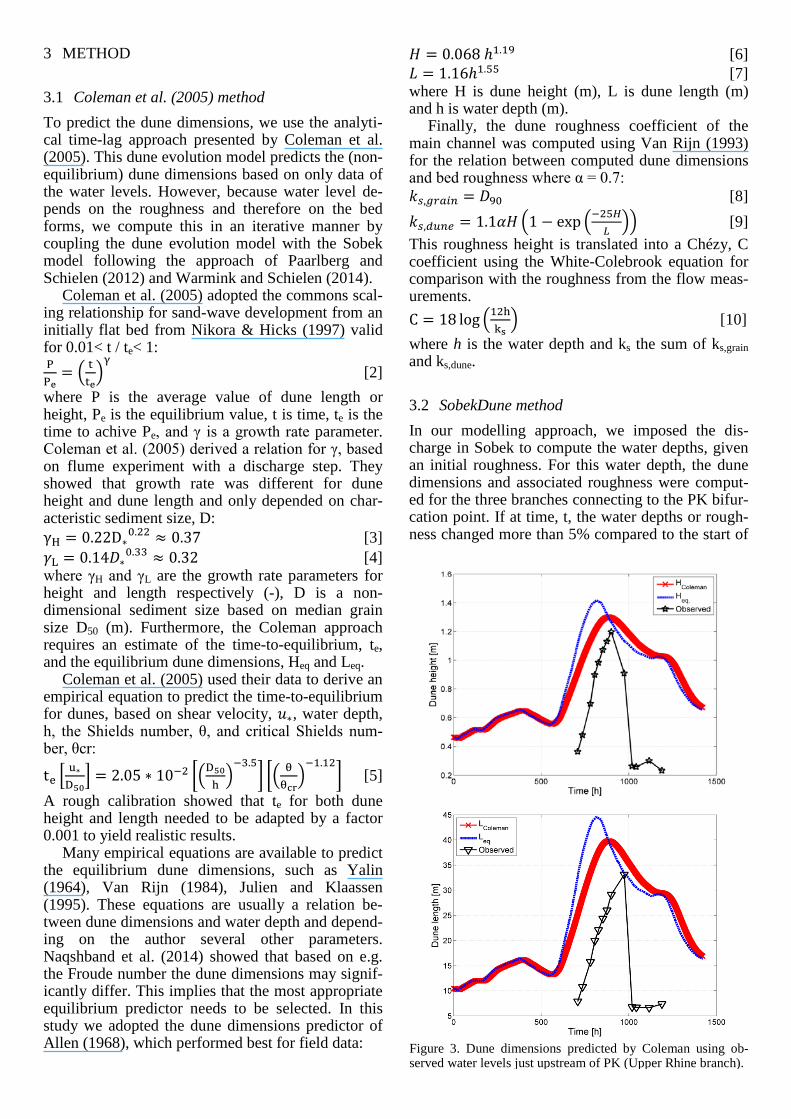
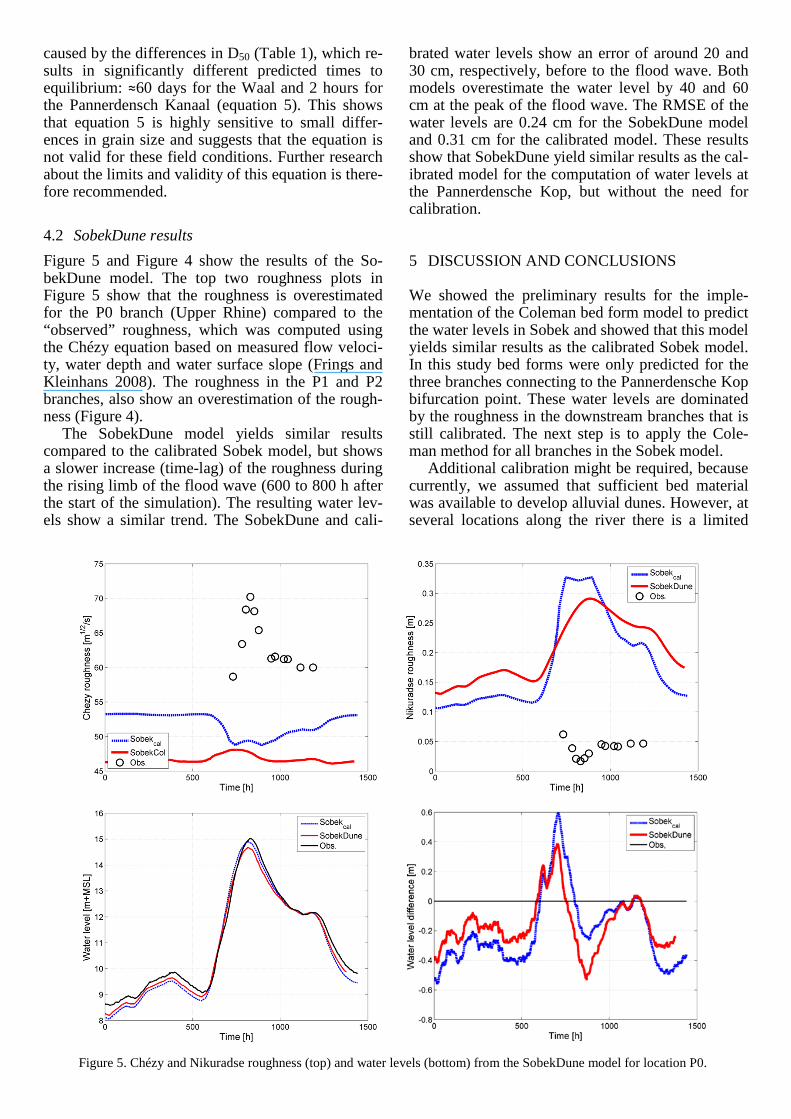
Predicted dune heights for the Waal and Panner-densch Kanaal branches are shown in Figure 4. The dune height predictions for the Waal branch are sim-ilar to the predictions upstream of PK. The predicted dune heights for the Pannerdensch Kanaal follow the equilibrium predicted values. This difference is
Figure 4. Predicted dune heights (top panels) for the Waal branch (P1, left) and Pannerdensch Kanaal branch (P2, right). Bottom: Chézy roughness and water level difference from SobekDune for the P1 and P2 branches. Both located just down-stream of the bifurcation point.
caused by the differences in D50 (Table 1), which re-sults in significantly different predicted times to equilibrium: ≈60 days for the Waal and 2 hours for the Pannerdensch Kanaal (equation 5). This shows that equation 5 is highly sensitive to small differ-ences in grain size and suggests that the equation is not valid for these field conditions. Further research about the limits and validity of this equation is there-fore recommended.
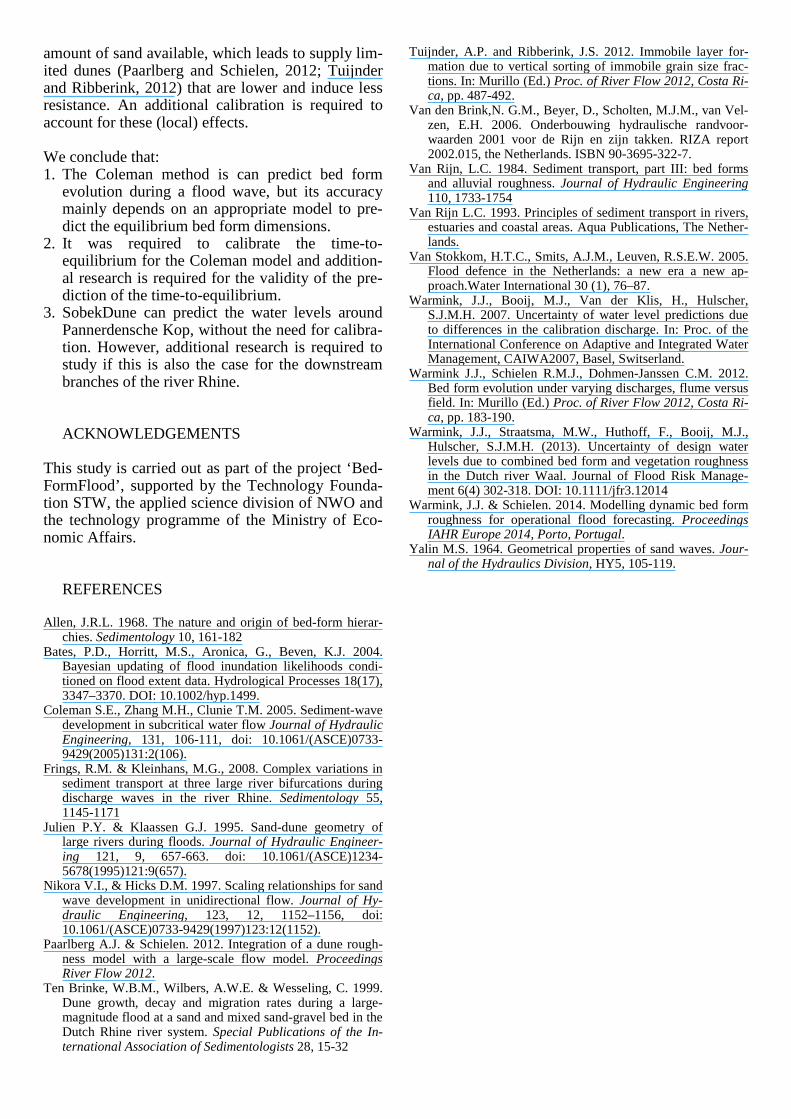
4.2 SobekDune results Figure 5 and Figure 4 show the results of the So-bekDune model. The top two roughness plots in Figure 5 show that the roughness is overestimated for the P0 branch (Upper Rhine) compared to the “observed” roughness, which was computed using the Chézy equation based on measured flow veloci-ty, water depth and water surface slope (Frings and Kleinhans 2008). The roughness in the P1 and P2 branches, also show an overestimation of the rough-ness (Figure 4).
The SobekDune model yields similar results compared to the calibrated Sobek model, but shows a slower increase (time-lag) of the roughness during the rising limb of the flood wave (600 to 800 h after the start of the simulation). The resulting water lev-els show a similar trend. The SobekDune and cali-
brated water levels show an error of around 20 and 30 cm, respectively, before to the flood wave. Both models overestimate the water level by 40 and 60 cm at the peak of the flood wave. The RMSE of the water levels are 0.24 cm for the SobekDune model and 0.31 cm for the calibrated model. These results show that SobekDune yield similar results as the cal-ibrated model for the computation of water levels at the Pannerdensche Kop, but without the need for calibration.
5 DISCUSSION AND CONCLUSIONS
We showed the preliminary results for the imple-mentation of the Coleman bed form model to predict the water levels in Sobek and showed that this model yields similar results as the calibrated Sobek model. In this study bed forms were only predicted for the three branches connecting to the Pannerdensche Kop bifurcation point. These water levels are dominated by the roughness in the downstream branches that is still calibrated. The next step is to apply the Cole-man method for all branches in the Sobek model.
Additional calibration might be required, because currently, we assumed that sufficient bed material was available to develop alluvial dunes. However, at several locations along the river there is a limited
Figure 5. Chézy and Nikuradse roughness (top) and water levels (bottom) from the SobekDune model for location P0.
amount of sand available, which leads to supply lim-ited dunes (Paarlberg and Schielen, 2012; Tuijnder and Ribberink, 2012) that are lower and induce less resistance. An additional calibration is required to account for these (local) effects.
We conclude that: 1. The Coleman method is can predict bed form
evolution during a flood wave, but its accuracy mainly depends on an appropriate model to pre-dict the equilibrium bed form dimensions.
2. It was required to calibrate the time-to-equilibrium for the Coleman model and addition-al research is required for the validity of the pre-diction of the time-to-equilibrium.
3. SobekDune can predict the water levels around Pannerdensche Kop, without the need for calibra-tion. However, additional research is required to study if this is also the case for the downstream branches of the river Rhine.
ACKNOWLEDGEMENTS
This study is carried out as part of the project ‘Bed-FormFlood’, supported by the Technology Founda-tion STW, the applied science division of NWO and the technology programme of the Ministry of Eco-nomic Affairs.
REFERENCES
Allen, J.R.L. 1968. The nature and origin of bed-form hierar-chies. Sedimentology 10, 161-182
Bates, P.D., Horritt, M.S., Aronica, G., Beven, K.J. 2004. Bayesian updating of flood inundation likelihoods condi-tioned on flood extent data. Hydrological Processes 18(17), 3347–3370. DOI: 10.1002/hyp.1499.
Coleman S.E., Zhang M.H., Clunie T.M. 2005. Sediment-wave development in subcritical water flow Journal of Hydraulic Engineering, 131, 106-111, doi: 10.1061/(ASCE)0733-9429(2005)131:2(106).
Frings, R.M. & Kleinhans, M.G., 2008. Complex variations in sediment transport at three large river bifurcations during discharge waves in the river Rhine. Sedimentology 55, 1145-1171
Julien P.Y. & Klaassen G.J. 1995. Sand-dune geometry of large rivers during floods. Journal of Hydraulic Engineer-ing 121, 9, 657-663. doi: 10.1061/(ASCE)1234-5678(1995)121:9(657).
Nikora V.I., & Hicks D.M. 1997. Scaling relationships for sand wave development in unidirectional flow. Journal of Hy-draulic Engineering, 123, 12, 1152–1156, doi: 10.1061/(ASCE)0733-9429(1997)123:12(1152).
Paarlberg A.J. & Schielen. 2012. Integration of a dune rough-ness model with a large-scale flow model. Proceedings River Flow 2012.
Ten Brinke, W.B.M., Wilbers, A.W.E. & Wesseling, C. 1999. Dune growth, decay and migration rates during a large-magnitude flood at a sand and mixed sand-gravel bed in the Dutch Rhine river system. Special Publications of the In-ternational Association of Sedimentologists 28, 15-32
Tuijnder, A.P. and Ribberink, J.S. 2012. Immobile layer for-mation due to vertical sorting of immobile grain size frac-tions. In: Murillo (Ed.) Proc. of River Flow 2012, Costa Ri-ca, pp. 487-492.
Van den Brink,N. G.M., Beyer, D., Scholten, M.J.M., van Vel-zen, E.H. 2006. Onderbouwing hydraulische randvoor-waarden 2001 voor de Rijn en zijn takken. RIZA report 2002.015, the Netherlands. ISBN 90-3695-322-7.
Van Rijn, L.C. 1984. Sediment transport, part III: bed forms and alluvial roughness. Journal of Hydraulic Engineering 110, 1733-1754
Van Rijn L.C. 1993. Principles of sediment transport in rivers, estuaries and coastal areas. Aqua Publications, The Nether-lands.
Van Stokkom, H.T.C., Smits, A.J.M., Leuven, R.S.E.W. 2005. Flood defence in the Netherlands: a new era a new ap-proach.Water International 30 (1), 76–87.
Warmink, J.J., Booij, M.J., Van der Klis, H., Hulscher, S.J.M.H. 2007. Uncertainty of water level predictions due to differences in the calibration discharge. In: Proc. of the International Conference on Adaptive and Integrated Water Management, CAIWA2007, Basel, Switserland.
Warmink J.J., Schielen R.M.J., Dohmen-Janssen C.M. 2012. Bed form evolution under varying discharges, flume versus field. In: Murillo (Ed.) Proc. of River Flow 2012, Costa Ri-ca, pp. 183-190.
Warmink, J.J., Straatsma, M.W., Huthoff, F., Booij, M.J., Hulscher, S.J.M.H. (2013). Uncertainty of design water levels due to combined bed form and vegetation roughness in the Dutch river Waal. Journal of Flood Risk Manage-ment 6(4) 302-318. DOI: 10.1111/jfr3.12014
Warmink, J.J. & Schielen. 2014. Modelling dynamic bed form roughness for operational flood forecasting. Proceedings IAHR Europe 2014, Porto, Portugal.
Yalin M.S. 1964. Geometrical properties of sand waves. Jour-nal of the Hydraulics Division, HY5, 105-119.
Related Documents