This article was published in an Elsevier journal. The attached copy is furnished to the author for non-commercial research and education use, including for instruction at the author’s institution, sharing with colleagues and providing to institution administration. Other uses, including reproduction and distribution, or selling or licensing copies, or posting to personal, institutional or third party websites are prohibited. In most cases authors are permitted to post their version of the article (e.g. in Word or Tex form) to their personal website or institutional repository. Authors requiring further information regarding Elsevier’s archiving and manuscript policies are encouraged to visit: http://www.elsevier.com/copyright

Welcome message from author
This document is posted to help you gain knowledge. Please leave a comment to let me know what you think about it! Share it to your friends and learn new things together.
Transcript
This article was published in an Elsevier journal. The attached copyis furnished to the author for non-commercial research and
education use, including for instruction at the author’s institution,sharing with colleagues and providing to institution administration.
Other uses, including reproduction and distribution, or selling orlicensing copies, or posting to personal, institutional or third party
websites are prohibited.
In most cases authors are permitted to post their version of thearticle (e.g. in Word or Tex form) to their personal website orinstitutional repository. Authors requiring further information
regarding Elsevier’s archiving and manuscript policies areencouraged to visit:
http://www.elsevier.com/copyright
Author's personal copy
Explaining variation in Brazil nut fruit production
Karen A. Kainer a,b,*, Lucia H.O. Wadt c, Christina L. Staudhammer a
a School of Forest Resources and Conservation, University of Florida, Gainesville, FL 32611, USAb Center for Latin American Studies, Tropical Conservation and Development Program, University of Florida, Gainesville, FL 32611, USA
c Centro de Pesquisa Agroflorestal do Acre (Embrapa Acre), BR-364, Km 14, Rio Branco, Acre 69901-108, Brazil
Received 8 November 2006; received in revised form 17 May 2007; accepted 20 May 2007
Abstract
Brazil nut is widely recognized as the cornerstone of the Amazonian extractive economy. Tight linkages between Brazil nut production,
regional income, and intact mature forests have thrust this species into focus as a key component of Amazonian conservation and income
generation strategies. Nonetheless, a comprehensive synthesis of factors explaining Brazil nut fruit production variation is lacking. We aimed to
address this knowledge gap, asking: (1) What are the rates and annual variation of Bertholletia excelsa fruit production at individual and population
levels? (2) What factors explain B. excelsa production variation, focusing on spatial and temporal variables, diameter at breast height (dbh), crown
attributes, liana loads, and soil attributes? and (3) Does liana cutting affect fruit production?
Our model explained 73% of the variability in fruit production by 140 trees over 5 years. Dbh alone explained >50%, and trees in the middle
diameter range (100 cm � dbh < 150 cm) produced best. Top-producing trees were loosely grouped spatially. Cation exchange capacity and P also
explained production variation. The liana load variable was only weakly significant for explaining production variation, and there were no direct
significant effects of liana cutting. Cutting, however, did improve crown forms—another highly significant model variable. This, coupled with a
weakly significant interaction of liana cutting by year, suggests that liana cutting could improve production over time.
In any given year, approximately 25% of the trees produced 72% of the total population production. Annual variation of fruit production at the
individual level was relatively high, and at the population level was extremely low, with annual production departing from average only in a year of
delayed and reduced rainfall. These results coupled with low synchronicity of fruiting, confirm long-term observations of harvesters that Brazil nut
populations exhibit relatively constant fruit production.
Results suggest that fruit productivity at the individual tree level could be increased, possibly through experimental liana cutting and/or P
amendments. At the population level, Brazil nut collectors could potentially increase efficiency by concentrating collection efforts on consistently
high producers and possible production ‘‘hotspots’’.
# 2007 Published by Elsevier B.V.
Keywords: Amazon; Bertholletia excelsa; Nut production; Liana; Non-timber forest product; NTFP; Nutrients; Seed production; Tropical forest
1. Introduction
Brazil nut (Bertholletia excelsa Humb. and Bonpl.) is widely
recognized as the cornerstone species of the Amazonian
extractive economy, and is the only internationally traded nut
collected almost entirely from natural populations in mature
forests (Clay, 1997). Historically, collection and processing
have been centered in eastern Amazonia where it has been
commercially exploited since the mid-1600s (de Souza, 1963).
Over the last three decades, however, large-scale collection has
shifted westward to the tri-border region of Brazil, Bolivia, and
Peru (Peres et al., 2003) where commercial harvest and
marketing represent a major income source for rural and peri-
urban collectors and processors (Stoian, 2005). Because of this
central importance of Brazil nut to the regional economy,
household income shortfalls across this entire supply chain
were attributed most frequently to insufficient Brazil nut
production in any given locality or year (Stoian, 2005). This
socioeconomic link between Brazil nut production and income
can also have clear consequences for conservation as
documented in Peru, where Brazil nut income alone was
insufficient to thwart deforestation by small producers who
concurrently participated in more environmentally destructive
income-generating activities like cattle ranching and intensive
www.elsevier.com/locate/foreco
Forest Ecology and Management 250 (2007) 244–255
* Corresponding author. Tel.: +1 352 846 0833; fax: +1 352 846 1277.
E-mail address: [email protected] (K.A. Kainer).
0378-1127/$ – see front matter # 2007 Published by Elsevier B.V.
doi:10.1016/j.foreco.2007.05.024
Author's personal copy
agriculture (Escobal and Aldana, 2003). Indeed, these tight
linkages between Brazil nut production, regional income, and
intact mature forests have thrust this species into focus as a key
component of Amazonian conservation and income generation
strategies (Clay, 1997; Ortiz, 2002). Nonetheless, a compre-
hensive synthesis of factors explaining Brazil nut fruit
production variation is lacking. Indeed, there is a paucity of
quantitative information on fruit production and sources of
production variation of most tropical non-timber forest product
(NTFP) fruits, nuts, and seeds of commercial interest. This is
surprising given that NTFPs are considered an important
component of developing country economies and tropical
forest conservation strategies (Freese, 1997; Alexiades and
Shanley, 2004). The main aim of our study is to address this
knowledge gap in production variation using Brazil nut as a
model species, while providing scientific insights to the larger
ecological question of fruit production variation.
1.1. Fruit production variation
Variation in fruit and seed production in forest trees has been
attributed to exogenous and endogenous factors. Climate is a
major contributor to crop size variation, leading to a resource
matching hypothesis that annual seed production patterns
‘‘match’’ annual rainfall distribution and/or some key seasonal
temperature variable. Koenig and Knops (2000) reviewed 443
data sets of multiple northern hemisphere species within three
families, and found that annual rainfall and temperature
variation were important, and identified latitudinal patterns
linked to climate. Kelly and Sork (2002) came to similar
conclusions in their global analysis of 570 data sets. Seedfall
variation of 108 tropical species – a forest type poorly
represented in all previous analyses – corroborated these
latitudinal patterns; while production variation was substantial
for these tropical species, it was significantly smaller than for
higher latitudes (Wright et al., 2005).
Nonetheless, most polycarpic woody plants adhere to
alternating supra-annual schedules of low and high production
years (Herrera et al., 1998; Koenig and Knops, 2000; Kelly and
Sork, 2002). This provides strong evidence that rainfall and
temperature, which are more normally distributed and much less
variable than production (Koenig and Knops, 2000), are not the
only determinants of fruit production variation. Disease,
herbivory, or adverse weather such as high winds or storms,
particularly during key phenological events such as pollination or
fruit development, can reduce flowering or seed set (Stephenson,
1981). Liana presence has been shown to reduce fruit production
of trees (Stevens, 1987; Kainer et al., 2006), and proximate
disturbances such as fire also have been implicated (Layne and
Abrahamson, 2004). Controlled experiments in monoculture
orchards (Ponder and Jones, 2001), agroforestry systems (Jones
et al., 1995), and natural forests (Vaughton, 1991) clearly
demonstrate the importance of nutrient and light availability as
explanatory variables of production variation.
Endogenous factors such as life cycle rhythms play a central
role in fruiting. Reproduction is a function of accumulated
resources, and is positively correlated to total tree height
(Layne and Abrahamson, 2004) and diameter (Ares and Brauer,
2004). Successful reproduction in 1 year, however, is often
followed (or ‘‘switched’’) at the expense of vegetative growth
(Harper and White, 1974; Kelly and Sork, 2002).
Fruiting variation has strong implications for fauna
dependent on fruit and seed resources for their caloric and
nutritional values. In general, woody plants produce more
expensive fruits than herbaceous plants (Sutherland, 1986), and
the expected return for this costly expenditure is dispersal.
Scatterhoarding (burial of one or a few seeds at many widely
scattered sites), a dispersal method typically restricted to trees
producing large nutritious nuts (Jansen, 2003), has several
advantages for the plant: facilitation of transportation away
from the source plant, nut burial for seed protection and
improved germination, and caching in microenvironments
more favorable for seedling establishment (Vander Wall, 2001).
In return, these cached food supplies are available to
scatterhoarders for periods of scarcity, such as tropical dry
seasons or temperate zone winters (Jansen, 2003). Cached seeds
not reclaimed by scatterhoarders (e.g., forgotten or due to
predator mortality) are well positioned for germination.
1.2. Management significance of production variation
For tree fruits with high economic value, maximum levels of
fruiting and minimal annual variation can be central to
commercial success. In these cases, plant breeding and
selection programs, resource amendments (nutrients, water),
and other controls to direct resource partitioning to fruits and
minimize production variation are commonly practiced within
domesticated populations (Acquaah, 2002). Very little research,
however, has focused on understanding or manipulating fruit
production of natural populations of species with commercial
and/or subsistence import, such as Brazil nut and other NTFPs
(Ticktin, 2004). For example, most Brazil nut collectors in our
study region cut lianas, stating that this practice increases nut
yield (personal observations, KK and LW), but to our
knowledge, effects of liana cutting have not been quantified.
Understanding demographic parameters, including fruit pro-
duction, also is essential for fostering population persistence,
and such ecological knowledge coupled with management
interventions could enhance fruit production levels for meeting
both economic and demographic goals. Such interventions
advocated include: reducing localized resource competition,
including measures such as liana cutting, tree girdling, and/or
felling; enrichment planting; tending or favoring new recruits;
alternating geographic areas of harvest; setting harvest quotas;
and recruitment monitoring (Peters, 1996; Peres et al., 2003;
Ticktin, 2004).
Using Brazil nut (Bertholletia excelsa Humb. and Bonpl.) as
a model species, we aim to contribute to scientific under-
standing of fruit production variation and provide ecological
information that could contribute to improved management of
natural populations of commercially important NTFPs.
Production variation of tropical species in general is poorly
documented (Herrera et al., 1998; Kelly and Sork, 2002;
although see Wright et al., 2005), and very few studies have
K.A. Kainer et al. / Forest Ecology and Management 250 (2007) 244–255 245

Author's personal copy
explored manipulation of natural populations for enhancing
production. We focused on three research questions: (1) What
are the rates and annual variation of B. excelsa fruit production
at individual and population levels? (2) What factors explain B.
excelsa production variation, focusing on spatial and temporal
variables, diameter at breast height (dbh), crown attributes,
liana loads, and soil attributes? and (3) Does liana cutting affect
fruit production?
2. Study species
At maturity, B. excelsa is a very large, emergent tree. Adults
can be long-lived, with three individuals >45 cm dbh radio-
carbon-dated as older than 650 years (Vieira et al., 2005).
Individual trees may or may not be totally deciduous, with floral
buds emerging on axillary spikes at the apex of recent leaf flushes
produced toward the end of the dry season (Mori and Prance,
1990; Maues, 2002). Individuals rely on out-crossing for seed
development (O’Malley et al., 1988), and are pollinated
principally by large bodied bees, especially Euglossinae, capable
of lifting the hood of the zygomorphic flower (Prance, 1976;
Nelson et al., 1985). The hard, large round fruit (10–16 cm)
reaches maturity 14 months after successful pollination, falling
during the rainy season (January and February in our study
region). The 8–26 large (�3.5–5 cm � 2 cm) seeds (or nuts)
remain inside this woody fruit until extraction by humans or other
seed predators/dispersers; agoutis (Dasyprocta spp.) are the
almost exclusive scatterhoarding dispersers. The nut reward is a
nutritious food source packed with 14–17% protein and 65–70%
oil (Prance and Mori, 1979).
3. Study site
Research was conducted in Extractive Reserve (RESEX)
Chico Mendes, a conservation unit 10–118 south of the equator
in the eastern region of the state of Acre, Brazil. The area has
gently undulating topography; a pronounced dry season,
typically from June to August (IMAC, 1991); and the dominant
vegetation is humid, moist tropical forests (Holdridge, 1978).
Average temperature is approximately 25 8C (ZEE, 2000), and
brief intrusions of frigid southern air are common during the dry
season, dropping temperatures to 12 8C. Soils are classified
under the Brazilian system as Argissolos (ZEE, 2000) or red-
yellow podzolics. In our study region, those soils under the
Solimoes geological formation are influenced by volcanic
material, likely ashes, deposited during soil genesis by Andean
winds (Gama et al., 1992). Thus, while aluminium and its
associated acidity dominate other weathered Amazonian
podzolic soils, Solimoes podzolics tend to be relatively new
soils with higher silt content, nutrient stocks, and cation
exchange capacity (Gama et al., 1992).
Research efforts were concentrated in a 420-ha extractivist
landholding (colocacao) in the southeastern portion of the
reserve (Colocacao Rio de Janeiro in Seringal Filipinas) (see
Wadt et al., 2005 for study site map). The resident family
collects Brazil nuts annually, but like others in the region (Ortiz,
2002), would not likely harvest from trees that typically
produce less than 20 fruits. A 2001–2002 inventory of 568 B.
excelsa trees �10 cm dbh in this landholding revealed a
population density of 1.35 trees ha�1 and average diameters of
86.1 � 45.0 cm dbh (Wadt et al., 2005).
4. Methods
Study trees were selected by initially placing all 404
reproductively mature B. excelsa adults (�50 cm dbh) from the
previous inventory into 10 diameter classes, and then randomly
selecting 140 trees to include representatives within each
diameter class and four liana load categories: (1) no lianas in
crown, (2) lianas present, but �25% crown covered, (3) 25–
75% crown covered, and (4) >75% crown covered. Selected
trees were then revisited in the field to exclude individuals with
overlapping crowns or fruit fall areas. Finally, the geospatial
location of the 140 selected trees was determined through GPS
and plotted, confirming fairly representative spatial distribution
of the sample across the study landscape.
4.1. Fruit counts
Production was measured in the last 15 days of February,
after fruit fall, for 5 consecutive years (2002–2006). Fruit
production was quantified as the number of fruits harvested
from the ground by the research team. These count values do
not reflect 100% total counts of fruit production per tree. A
small count error is attributed to the very few fruits remaining in
the crowns at the time of fruit collection. Scatterhoarding
Dasyprocta spp. and other minor seed predators, however, are a
larger source of error since they open and/or remove fallen
fruits prior to the late-February counts. We used two methods to
estimate this count discrepancy.
In September 2004, a period after premature fruit abortion
had occurred and deciduous B. excelsa individuals were
leafless, we surveyed our 140-tree study population. We
counted absolute numbers of fruits on trees in which crowns
were entirely visible (a minority of all trees) and fruits were not
too numerous to impede accurate counts (�100 fruits, N = 19).
When comparing these absolute crown counts with subsequent
on-the-ground harvest from the same trees, we found a strong
correlation (r = 0.89) between crown and ground counts. On
average, we collected only 62% of those fruits counted in the
crown, suggesting a 38% predator removal rate. Since canopy
counts were conducted after the exocarp had hardened, we
assumed little to no macaw predation of immature canopy fruits
as reported by Trevedi et al. (2004). A second method involved
enumerating depressions with traces of the non-woody exocarp
and/or mesocarp on the ground below each tree canopy. These
depressions are created when the heavy fruits fall from the
approximately 50 m tree canopy, and become visible when the
predator removes the fruit from this microsite. Each depression
count was sometimes augmented when additional predator-
opened fruits clearly not associated with the depressions were
encountered. Based on this method applied to the entire study
population during ground counts, predators removed 7.9 and
6.1% of the total 2005 and 2006 production, respectively. Using
K.A. Kainer et al. / Forest Ecology and Management 250 (2007) 244–255246
Author's personal copy
similar methods, Zuidema and Boot (2002) estimated that 7%
of all production was not harvested by collectors in Bolivia.
Though far from error-free, we believe that crown counts
more accurately reflect count discrepancies because of the
possibly large error associated with depression counts given
that predators could easily remove a substantial number of
fruits that left no ground trace. Repeated fruit counts that
consider daily or weekly fruit removal by predators are
warranted for highly accurate estimates of absolute fruit
production—a procedure that was not possible in our study.
Nonetheless, for consistency, all subsequent discussion of fruit
production rates reflect fruits counted on the ground without
adjustments for these potential sources of error.
4.2. Tree and soil attributes
Crown attributes (crown form, cross-sectional area, and
canopy position) were assessed for each of the 140 trees. Crown
form categorizations was adapted from Synnott (1979), and
included: (1) complete or irregular circle (perfect or good); (2)
half-crown (tolerable); (3) less than half-crown (poor); and (4)
one or a few branches (very poor). Each crown was originally
evaluated in July 2001, and again in July 2005. Tree crown
cross-sectional area was determined in July 2002 by measuring
maximum crown diameter and a second diameter at right angles
to the maximum axis, followed by application of an ellipsoid
formula. Crown position was scored as: (1) dominant (full
overhead and side light); (2) co-dominant (full overhead light);
(3) intermediate (some overhead or side light); or (4)
suppressed (no direct light).
In October 2002, leaves were collected from a random sample
of 24 study crowns, controlling to include trees at different fruit
production levels, dispersed locations on the 420-ha landscape
and liana cutting treatment (described below). Leaves were dried
at 105 8C for 72 h, ground with a Wiley mill, and passed through
a 1 mm sieve. For P, K, Ca, and Mg, samples were digested in a
2:1 nitroperchloric acid, with concentrations determined using
the metavanadate colorimetry method and absorption spectro-
photometry (P) or atomic absorption spectrophotometry (K, Ca,
and Mg). Nitrogen was analyzed by the Kjeldahl method as
modified by Mills and Jones (1996).
To determine soil properties, a composite of six soil cores
were excavated beneath the crown of each of the 140 trees in
July 2002. Samples were extracted below the litter layer at two
depths: 0–10 and 10–20 cm. Two replicates of each composite
were dried for 4 days at 65 8C, and passed through a 2 mm
stainless steel sieve. Soil pH was measured at a 1:2.5 soil to
water ratio. Extractable P and K were processed using a dilute
double acid extraction (Mehlich-1), with concentrations
determined colorimetrically using the molybdate blue method
for P, and flame emission spectrophotometry for K. Exchange-
able Ca and Mg were measured after extracting cations with a
1N KCl solution, with concentrations determined through
atomic absorption spectrophotometry. To determine total
potential acidity, H+ + Al3+ was extracted with a buffered
solution of calcium acetate at pH 7, and then titrated with 0.1N
NaOH. Cation exchange capacity (CEC) was calculated as the
sum of this potential acidity plus base cations. Oxidizable
organic carbon was determined on soils passed through a 1 mm
screen, ground in a porcelain mortar, and then digested in a
potassium dichromate acid medium with external heat. Organic
matter was estimated by multiplying this value by 1.75. All
soils analyses were conducted at the Soils Laboratory of
Embrapa Acre, Brazil (EMBRAPA, 1997).
4.3. Liana cutting
Lianas were cut from 80 of the 140 trees in July 2002. Each
liana was cut near the ground and at approximately 2 m from
ground level. Since B. excelsa fruits take 14 months to mature,
impacts would only be detectable with 2004 production data.
Thus, fruit and nut production in 2002 and 2003 were clearly not
associated with any liana cutting impacts, while data for 2004,
2005, and 2006 could potentially be affected by liana cutting.
4.4. Data analysis
We modelled fruit production as a function of the liana cutting
treatment, with tree and soil attributes acting as covariates, using
SAS software for all data analysis (Version 9.1). Since the
number of possible predictor variables was large, a principal
components analysis (PCA) was first performed with all
quantitative explanatory variables to illuminate relationships
and show redundancies (PROC PCA) (Appendix A). Two-way
correlations between all variables, including the dependent
variable, were calculated using PROC CORR to verify PCA
results and reveal further relationships between annual fruit
production and possible predictor variables.
A mixed model was constructed first with all quantitative tree
variables (dbh and crown size), class variables (crown position,
crown form class, liana load, and liana cutting treatment), and the
group of soil variables determined from the PCA to have high
explanatory power. Because fruit production data were collected
annually for each of 5 years on 140 trees located in a contiguous
forest area, data were both spatially and temporally correlated. A
mixed effects approach, accounting for the repeated measures
structure of the data ensured correct formation of the error
covariance matrix and proper tests of significance. Year of
measurement was treated as a repeated measurement, but not as a
linear one, as it was known that fruit production by year did not
follow a linear trend. Location (UTM easting and northing) was
included so that spatial location of trees could be incorporated
into the error covariance matrix. Variograms were constructed to
reveal patterns of spatial dependency in the data (PROC
VARIOGRAM), and several candidate models of spatial
covariance (e.g., exponential, power, and Gaussian) were
incorporated and tested in the mixed model (Schabenberger
and Pierce, 2001). Because a previous study showed a quadratic
relationship between dbh and fruit production (Wadt et al., 2005),
dbh2 was included in the model. Using PROC MIXED, model
parameters were found via maximum likelihood, and several
error covariance structures were tested.
Model results were compared using Akaike’s Information
Criteria (AIC, Akaike, 1973), and by visual examination to test
K.A. Kainer et al. / Forest Ecology and Management 250 (2007) 244–255 247
Author's personal copy
normality and homoscedastic model residuals. Second- and
third-order interactions, and later covariates, were included in
the first iterations of the model, and those that did not improve
(lower) AIC were dropped sequentially as recommended by
Burnham and Anderson (2002). We also explored model
building by conventional methods of sequentially dropping
non-significant interactions and covariates based on P-values.
In this case, we used a significance level of a = 0.10 rather than
the usual arbitrary 0.05 level (Johnson, 1999; Burnham and
Anderson, 2002) to allow all possible significant effects to
remain for the purpose of building the best explanatory model
(Bancroft, 1968, p. 8). Since we found almost identical results
using this second method, we only report results using the AIC
method. Because a primary purpose of data analysis was to
develop an explanatory model of fruit production with and
without liana cutting treatments, the indicator variable for liana
cutting was considered fundamental. As such, it was retained in
the model without regard to its significance level (Neter et al.,
1996, p. 354).
Using methods detailed in Kelly and Sork (2002), fruit
production variability at the individual level (xCVi) was
determined by calculating the mean of the coefficient of
variation of fruits per tree of each tree over 5 years, and then
calculating the mean of these individual tree coefficients of
variation. Fruit productionvariation at the population level (CVp)
was measured by the coefficient of variation of the mean number
of fruits per tree of each tree over 5 years. Following Snook et al.
(2005), synchronicity of fruiting by the study population (xPCC)
was determined by calculating the Pearson correlation coeffi-
cient of all possible pairs of trees in the sample, and then
calculating the mean of those correlation coefficients.
Finally, we also assessed relevant relationships not
specifically tested in the mixed model. We computed Pearson’s
correlation coefficients for relevant variable pairs, and to
specifically test liana cutting effects on crown form, we
modelled the change in crown form class controlling for initial
crown form class.
5. Results
5.1. Fruit production rates
Without adjusting for the liana cutting treatment, mean
number of B. excelsa fruits produced per tree per year was 66.2
(S.D. = 98.5, N = 681). Of the 140 B. excelsa trees studied,
approximately 40% produced, on average, fewer than
20 fruits year�1. Correspondingly, in any given year, approxi-
mately 25% of the trees (those that produced > 200 fruits
year�1) produced, on average, 72% of the total annual
production.
5.2. Fruit production variation explained
The final mixed model explained 73% of the variability in
number of fruits produced. The analysis incorporated
significant spatial correlation into the error covariance structure
with a power model and included significant random effects for
dbh. Significant fixed effects were detected for year, dbh2,
crown form, liana load, and two soil attributes (Table 1).
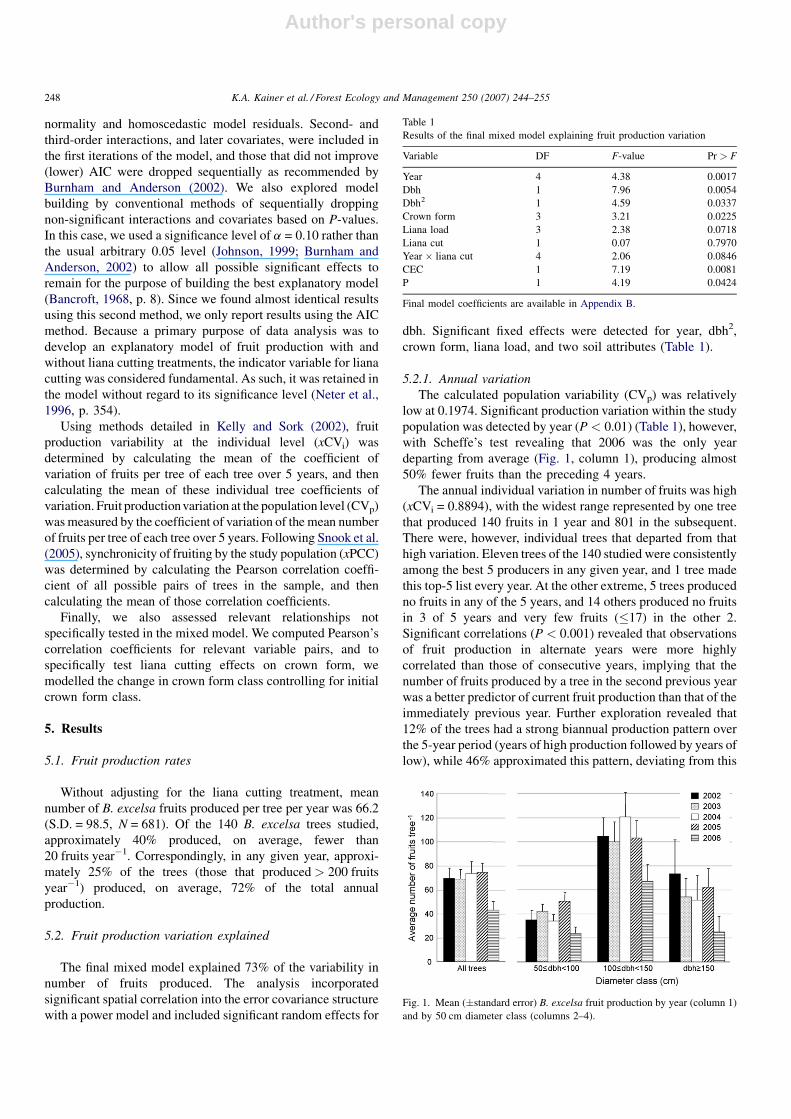
5.2.1. Annual variation
The calculated population variability (CVp) was relatively
low at 0.1974. Significant production variation within the study
population was detected by year (P < 0.01) (Table 1), however,
with Scheffe’s test revealing that 2006 was the only year
departing from average (Fig. 1, column 1), producing almost
50% fewer fruits than the preceding 4 years.
The annual individual variation in number of fruits was high
(xCVi = 0.8894), with the widest range represented by one tree
that produced 140 fruits in 1 year and 801 in the subsequent.
There were, however, individual trees that departed from that
high variation. Eleven trees of the 140 studied were consistently
among the best 5 producers in any given year, and 1 tree made
this top-5 list every year. At the other extreme, 5 trees produced
no fruits in any of the 5 years, and 14 others produced no fruits
in 3 of 5 years and very few fruits (�17) in the other 2.
Significant correlations (P < 0.001) revealed that observations
of fruit production in alternate years were more highly
correlated than those of consecutive years, implying that the
number of fruits produced by a tree in the second previous year
was a better predictor of current fruit production than that of the
immediately previous year. Further exploration revealed that
12% of the trees had a strong biannual production pattern over
the 5-year period (years of high production followed by years of
low), while 46% approximated this pattern, deviating from this
Table 1
Results of the final mixed model explaining fruit production variation
Variable DF F-value Pr > F
Year 4 4.38 0.0017
Dbh 1 7.96 0.0054
Dbh2 1 4.59 0.0337
Crown form 3 3.21 0.0225
Liana load 3 2.38 0.0718
Liana cut 1 0.07 0.7970
Year � liana cut 4 2.06 0.0846
CEC 1 7.19 0.0081
P 1 4.19 0.0424
Final model coefficients are available in Appendix B.
Fig. 1. Mean (�standard error) B. excelsa fruit production by year (column 1)
and by 50 cm diameter class (columns 2–4).
K.A. Kainer et al. / Forest Ecology and Management 250 (2007) 244–255248
Author's personal copy
sequence in 1 year only. Overall synchronicity of fruiting
(considering all possible pairs of all individuals and all years)
by the study population was very low (xPCC = 0.0565).
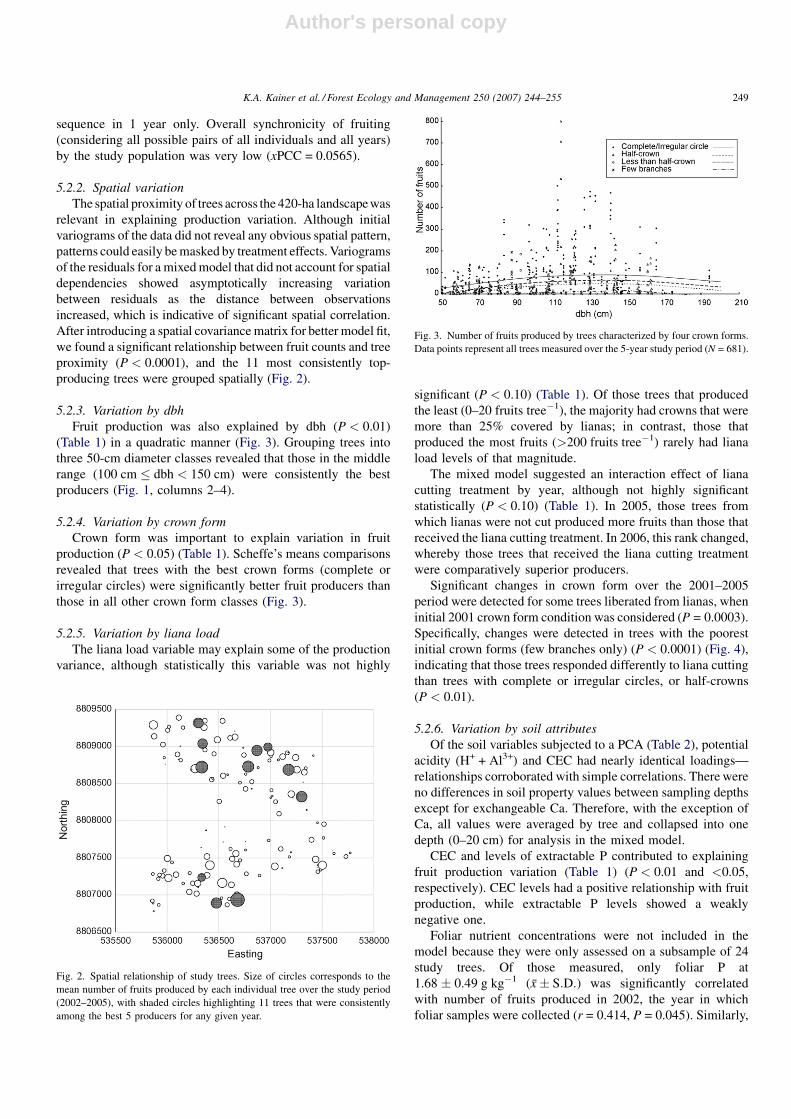
5.2.2. Spatial variation
The spatial proximity of trees across the 420-ha landscape was
relevant in explaining production variation. Although initial
variograms of the data did not reveal any obvious spatial pattern,
patterns could easily be masked by treatment effects. Variograms
of the residuals for a mixed model that did not account for spatial
dependencies showed asymptotically increasing variation
between residuals as the distance between observations
increased, which is indicative of significant spatial correlation.
After introducing a spatial covariance matrix for better model fit,
we found a significant relationship between fruit counts and tree
proximity (P < 0.0001), and the 11 most consistently top-
producing trees were grouped spatially (Fig. 2).
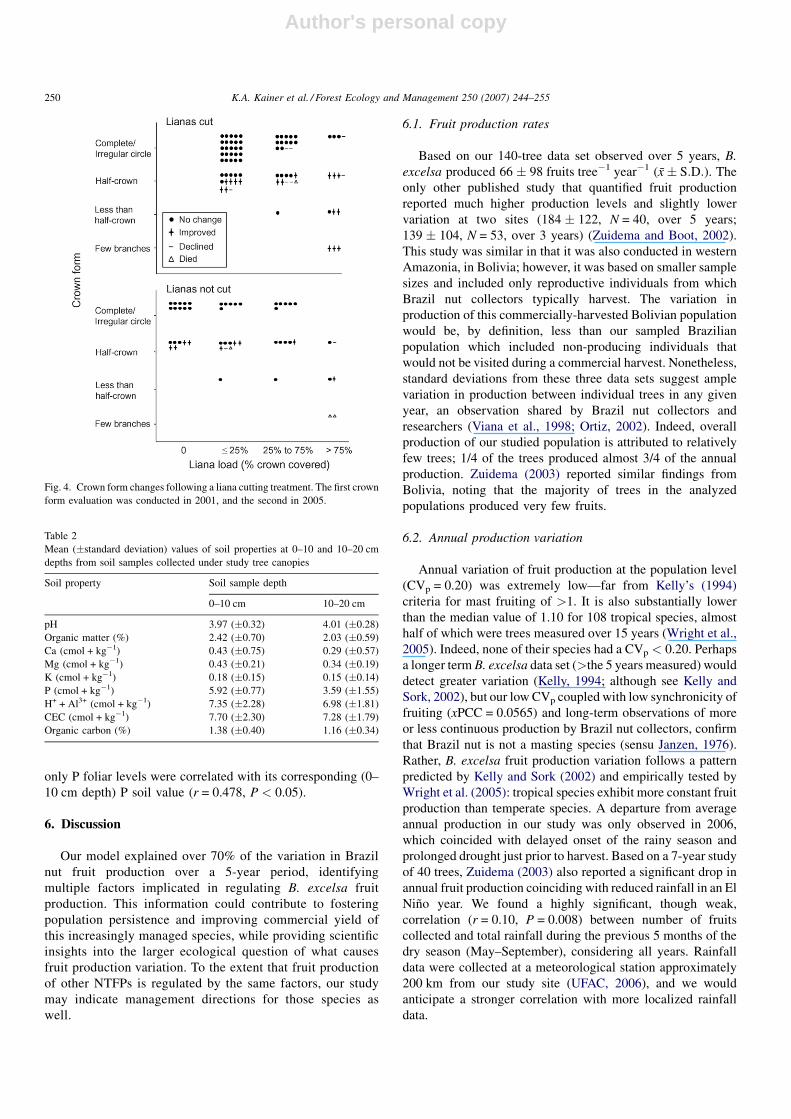
5.2.3. Variation by dbh
Fruit production was also explained by dbh (P < 0.01)
(Table 1) in a quadratic manner (Fig. 3). Grouping trees into
three 50-cm diameter classes revealed that those in the middle
range (100 cm � dbh < 150 cm) were consistently the best
producers (Fig. 1, columns 2–4).
5.2.4. Variation by crown form
Crown form was important to explain variation in fruit
production (P < 0.05) (Table 1). Scheffe’s means comparisons
revealed that trees with the best crown forms (complete or
irregular circles) were significantly better fruit producers than
those in all other crown form classes (Fig. 3).
5.2.5. Variation by liana load
The liana load variable may explain some of the production
variance, although statistically this variable was not highly
significant (P < 0.10) (Table 1). Of those trees that produced
the least (0–20 fruits tree�1), the majority had crowns that were
more than 25% covered by lianas; in contrast, those that
produced the most fruits (>200 fruits tree�1) rarely had liana
load levels of that magnitude.
The mixed model suggested an interaction effect of liana
cutting treatment by year, although not highly significant
statistically (P < 0.10) (Table 1). In 2005, those trees from
which lianas were not cut produced more fruits than those that
received the liana cutting treatment. In 2006, this rank changed,
whereby those trees that received the liana cutting treatment
were comparatively superior producers.
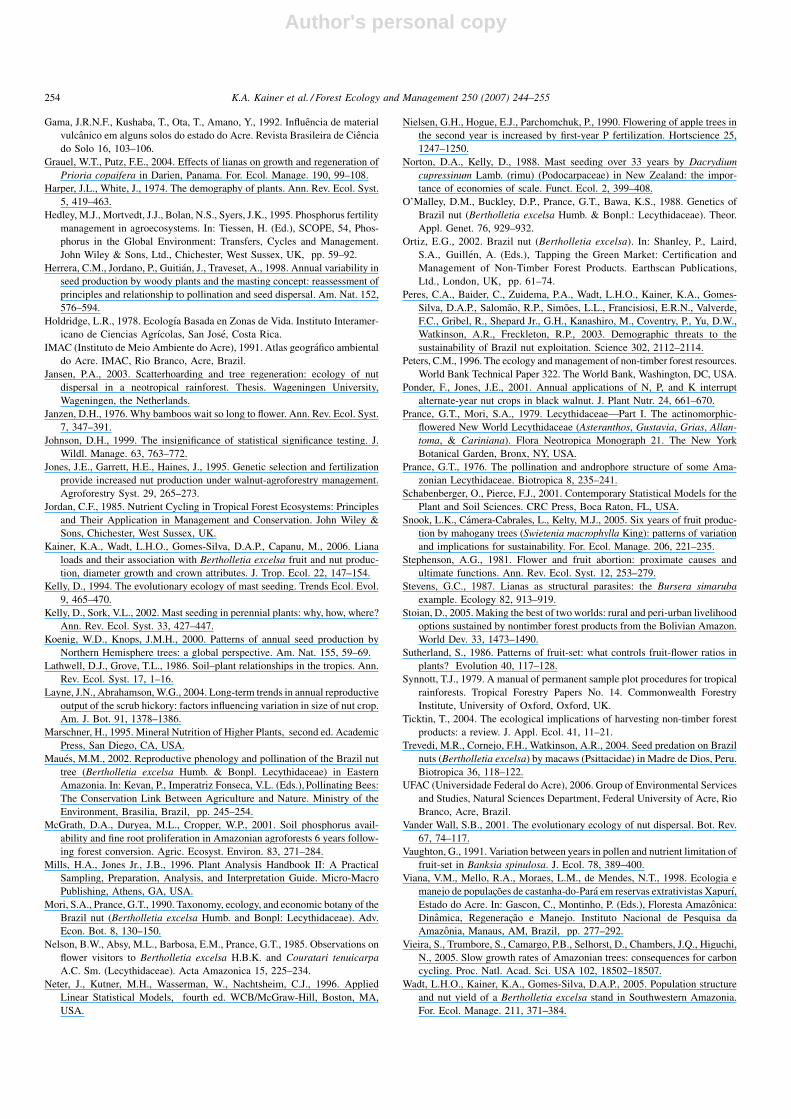
Significant changes in crown form over the 2001–2005
period were detected for some trees liberated from lianas, when
initial 2001 crown form condition was considered (P = 0.0003).
Specifically, changes were detected in trees with the poorest
initial crown forms (few branches only) (P < 0.0001) (Fig. 4),
indicating that those trees responded differently to liana cutting
than trees with complete or irregular circles, or half-crowns
(P < 0.01).
5.2.6. Variation by soil attributes
Of the soil variables subjected to a PCA (Table 2), potential
acidity (H+ + Al3+) and CEC had nearly identical loadings—
relationships corroborated with simple correlations. There were
no differences in soil property values between sampling depths
except for exchangeable Ca. Therefore, with the exception of
Ca, all values were averaged by tree and collapsed into one
depth (0–20 cm) for analysis in the mixed model.
CEC and levels of extractable P contributed to explaining
fruit production variation (Table 1) (P < 0.01 and <0.05,
respectively). CEC levels had a positive relationship with fruit
production, while extractable P levels showed a weakly
negative one.
Foliar nutrient concentrations were not included in the
model because they were only assessed on a subsample of 24
study trees. Of those measured, only foliar P at
1.68 � 0.49 g kg�1 (x� S:D:) was significantly correlated
with number of fruits produced in 2002, the year in which
foliar samples were collected (r = 0.414, P = 0.045). Similarly,
Fig. 2. Spatial relationship of study trees. Size of circles corresponds to the
mean number of fruits produced by each individual tree over the study period
(2002–2005), with shaded circles highlighting 11 trees that were consistently
among the best 5 producers for any given year.
Fig. 3. Number of fruits produced by trees characterized by four crown forms.
Data points represent all trees measured over the 5-year study period (N = 681).
K.A. Kainer et al. / Forest Ecology and Management 250 (2007) 244–255 249
Author's personal copy
only P foliar levels were correlated with its corresponding (0–
10 cm depth) P soil value (r = 0.478, P < 0.05).
6. Discussion
Our model explained over 70% of the variation in Brazil
nut fruit production over a 5-year period, identifying
multiple factors implicated in regulating B. excelsa fruit
production. This information could contribute to fostering
population persistence and improving commercial yield of
this increasingly managed species, while providing scientific
insights into the larger ecological question of what causes
fruit production variation. To the extent that fruit production
of other NTFPs is regulated by the same factors, our study
may indicate management directions for those species as
well.
6.1. Fruit production rates
Based on our 140-tree data set observed over 5 years, B.
excelsa produced 66 � 98 fruits tree�1 year�1 (x� S:D:). The
only other published study that quantified fruit production
reported much higher production levels and slightly lower
variation at two sites (184 � 122, N = 40, over 5 years;
139 � 104, N = 53, over 3 years) (Zuidema and Boot, 2002).
This study was similar in that it was also conducted in western
Amazonia, in Bolivia; however, it was based on smaller sample
sizes and included only reproductive individuals from which
Brazil nut collectors typically harvest. The variation in
production of this commercially-harvested Bolivian population
would be, by definition, less than our sampled Brazilian
population which included non-producing individuals that
would not be visited during a commercial harvest. Nonetheless,
standard deviations from these three data sets suggest ample
variation in production between individual trees in any given
year, an observation shared by Brazil nut collectors and
researchers (Viana et al., 1998; Ortiz, 2002). Indeed, overall
production of our studied population is attributed to relatively
few trees; 1/4 of the trees produced almost 3/4 of the annual
production. Zuidema (2003) reported similar findings from
Bolivia, noting that the majority of trees in the analyzed
populations produced very few fruits.
6.2. Annual production variation
Annual variation of fruit production at the population level
(CVp = 0.20) was extremely low—far from Kelly’s (1994)
criteria for mast fruiting of >1. It is also substantially lower
than the median value of 1.10 for 108 tropical species, almost
half of which were trees measured over 15 years (Wright et al.,
2005). Indeed, none of their species had a CVp < 0.20. Perhaps
a longer term B. excelsa data set (>the 5 years measured) would
detect greater variation (Kelly, 1994; although see Kelly and
Sork, 2002), but our low CVp coupled with low synchronicity of
fruiting (xPCC = 0.0565) and long-term observations of more
or less continuous production by Brazil nut collectors, confirm
that Brazil nut is not a masting species (sensu Janzen, 1976).
Rather, B. excelsa fruit production variation follows a pattern
predicted by Kelly and Sork (2002) and empirically tested by
Wright et al. (2005): tropical species exhibit more constant fruit
production than temperate species. A departure from average
annual production in our study was only observed in 2006,
which coincided with delayed onset of the rainy season and
prolonged drought just prior to harvest. Based on a 7-year study
of 40 trees, Zuidema (2003) also reported a significant drop in
annual fruit production coinciding with reduced rainfall in an El
Nino year. We found a highly significant, though weak,
correlation (r = 0.10, P = 0.008) between number of fruits
collected and total rainfall during the previous 5 months of the
dry season (May–September), considering all years. Rainfall
data were collected at a meteorological station approximately
200 km from our study site (UFAC, 2006), and we would
anticipate a stronger correlation with more localized rainfall
data.
Fig. 4. Crown form changes following a liana cutting treatment. The first crown
form evaluation was conducted in 2001, and the second in 2005.
Table 2
Mean (�standard deviation) values of soil properties at 0–10 and 10–20 cm
depths from soil samples collected under study tree canopies
Soil property Soil sample depth
0–10 cm 10–20 cm
pH 3.97 (�0.32) 4.01 (�0.28)
Organic matter (%) 2.42 (�0.70) 2.03 (�0.59)
Ca (cmol + kg�1) 0.43 (�0.75) 0.29 (�0.57)
Mg (cmol + kg�1) 0.43 (�0.21) 0.34 (�0.19)
K (cmol + kg�1) 0.18 (�0.15) 0.15 (�0.14)
P (cmol + kg�1) 5.92 (�0.77) 3.59 (�1.55)
H+ + Al3+ (cmol + kg�1) 7.35 (�2.28) 6.98 (�1.81)
CEC (cmol + kg�1) 7.70 (�2.30) 7.28 (�1.79)
Organic carbon (%) 1.38 (�0.40) 1.16 (�0.34)
K.A. Kainer et al. / Forest Ecology and Management 250 (2007) 244–255250

Author's personal copy
No single pattern of annual fruit production was detected at
the individual level. Previously, Zuidema (2003) had reported
that Brazil nut individuals with high production in 1 year were
often preceded and followed by years with substantially lower
production. A little over 10% of our study trees exhibited such a
strong biannual pattern, but another 46% (almost half)
approximated it, deviating from this sequence in 1 year.
Resource switching, whereby plants move resources into and
away from reproduction in successive years (Norton and Kelly,
1988), is suggested by these results, but we present no data as to
where resources might be allocated (e.g., growth) in ‘‘off-
production’’ years. We also observed that 11 trees of the 140
studied were consistently among the best 5 producers in any
given year, and 1 tree made this top-5 list every year. Similarly,
Ortiz (2002) reported that Brazil nut collectors in Peru have
observed that highly productive B. excelsa trees typically
produce better in relation to their local conspecifics,
independent of year. These results of consistently good or
poor reproductive performances of individual plants apparently
unrelated to site conditions or tree size (within reproductive
limits) suggest genotypic influences over production (Vander
Wall, 2001).
6.3. Explaining production variation
In addition to rainfall embedded in year, what factors
contributed to the significant temporal and spatial variation in
B. excelsa nut production encountered in our study? The great
variation in annual production within B. excelsa individuals
(CVi = 0.95) indicates that other explanatory variables at the
scale of the individual were important. Dbh was the most
critical variable, explaining >50% of fruit production variation
(partial R2 = 0.565). Trees in the middle diameter range of our
study population (100 cm � dbh < 150 cm) were better pro-
ducers than both smaller and larger trees (Fig. 1, columns 2–4).
Most trees produce their best seed crop in middle age, which
may last from decades to centuries, followed by decline and
senescence (Harper and White, 1974). While B. excelsa
diameter is not perfectly correlated with age (Vieira et al.,
2005), it seems reasonable to use dbh as a proxy for observing
tree development over time. The quadratic nature of the
relationship observed in our study (Fig. 3) contrasts to that of
Zuidema and Boot (2002), who reported a positive linear
relationship between dbh and production, although based on a
smaller and constrained sample. For Swietenia macrophylla,
Snook et al. (2005) also found that fruit production increased
with diameter, although they reported a pattern whereby
production continued to increase with increasing dbh,
apparently throughout tree life.
Crown attributes (area, position, and form) also played a role
in fruit production variation. Crown area was strongly
correlated with dbh (r = 0.53, P < 0.0001), and preliminary
model tests demonstrated that it was a slightly better predictor
of fruit production than diameter (similar to Zuidema, 2003),
although both variables explained fruit production well. We
retained dbh in the mixed model, however, because predictive
differences between dbh and crown area were very small, and to
facilitate data interpretation because dbh is a common field
measurement. Crown position or ability to access light
resources is clearly an important determinant of fruit
production, but since almost all B. excelsa study trees had a
co-dominant or dominant canopy position, this variable fell out
of the model. While Zuidema (2003) states that trees below
canopy level do not seem to produce fruits, we observed six
trees (4%) that were in an intermediate canopy position and
produced fruits. Finally, crown form was an important
explanatory variable in our study (Table 1), such that better
fruit producers consistently had the best crown forms.
A previous analysis of the first 2 years of our data set (prior
to liana cutting), specifically testing liana load and fruit
production, clearly demonstrated an association between liana
presence and reduced Brazil nut fruit counts (Kainer et al.,
2006). Similarly, Stevens (1987) had demonstrated negative
impacts of lianas on Bursera simaruba fecundity. Thus, we
expected positive fruit production effects from liana cutting.
Nonetheless, single variable effects from our current mixed
model did not support this expectation (Table 1). We did find
some evidence that effects of liana cutting on production were
changing, based on the weakly significant interaction effect of
liana cutting by year (P < 0.10). We also observed that liana
cutting improved crown form and/or circumvented mortality of
trees with very poor crown forms (Fig. 4). These observations
confirm that branch regrowth following liana liberation had
begun in some of our study trees, and that crown forms (a highly
significant explanatory variable of B. excelsa fruit production)
of Brazil nut trees liberated of lianas could improve over time.
Both long-term liana consequences, such as branch modifica-
tion (Stevens, 1987), and short-term, such as light interception
(Grauel and Putz, 2004), have been speculated upon for
suppressing host tree fruit production. We conclude that liana
impacts (and liana cutting effects) are complex and may be
attributable to a series of events at multiple levels over time.
Soils and nutrient availability have been cited as important
factors in B. excelsa fruit production (Viana et al., 1998;
Zuidema, 2003); however, these potential effects had not been
tested previously. In analyzing soil chemical characteristics,
only two variables were implicated in fruit production
(Table 1). Not surprisingly, CEC was positively associated
with increased production, and CEC in our study site was
higher compared to other Amazonian podzolics (Lathwell and
Grove, 1986). Base cation levels (Ca, Mg, and K) were
relatively high, and similar to another primary forest in the
region (McGrath et al., 2001), though not significant in our
model. Extractable P was implicated, but this statistical
significance may not be meaningful since it was slightly
negatively correlated with production, and coefficients of
variation for production in years prior to and after soil sampling
were very small (<0.1). Foliar P, however, a better indicator of
plant nutrient status than soil stocks, was fairly strongly
positively correlated with number of fruits produced. These
results are too limited to reveal how P is cycling through the
soil–plant system, but suggest that the relationship between P
and B. excelsa fruit production merits further study. P is often
cited as limiting tropical forest productivity (Jordan, 1985;
K.A. Kainer et al. / Forest Ecology and Management 250 (2007) 244–255 251

Author's personal copy
Cuevas and Medina, 1988; McGrath et al., 2001), and is a key
component of reproductive tissues (Marschner, 1995) such as
fruits and nuts. Experimental studies of multiple apple varieties,
revealed that addition of P in 1 year of production significantly
increased flowering and fruit set in the subsequent year (Nielsen
et al., 1990).
We did not directly evaluate predator and pollinator
availability or genotypic variation—factors potentially impor-
tant in B. excelsa fruit production. Discrepancies between
number of fruits collected off the ground and absolute fruit
numbers from crown and soil depression counts reveal strong
interactions with the agouti predator/disperser. These interac-
tions must affect fruit production as measured in our study, and
possibly fruit production variation. Ortiz (2002) speculated that
the principal determinant of low B. excelsa productivity is
pollination deficiency, perhaps due to smoke from increasing
forest fires or lower bee visitation in trees within forest
fragments or isolated in converted pastures. While we did not
study pollinator activity, our study site was located within a
largely unfragmented conservation unit exposed to minimal
smoke. Five trees in our sample exhibited individual
characteristics of good producers (good dbh and crown form,
no to few lianas), but produced no or few fruits (�6) throughout
the 5-year period, implicating at least some genetic influences
(Vander Wall, 2001).
Finally, our data suggest a spatial pattern of production
variation across the 420-ha landscape, with highly productive
trees found in loose groups (Fig. 2). Ortiz (2002) reported the
existence of Brazil nut ‘‘hot spots’’ of greater tree densities, and
bigger and better producers. Reasons for these patterns remain
speculative, but soils and genetic factors influenced by
disperser activity are plausible explanations.
6.4. Management implications
The more or less continuous reproduction pattern of B.
excelsa at the population level documented in our study has
certainly contributed to the high commercial success of Brazil
nut over the decades, and consequently, its importance for
Amazonian conservation. Results from our study suggest
several avenues that could further minimize production
variation and maximize levels of fruiting. Brazil nut collectors
and processors across the Amazon basin depend on B. excelsa
fruit production as part of their cash income and food security,
and interventions suggested from our study are intended to
advance those economic goals, while respecting dynamics of
the broader ecological community and ecosystem.
First, our findings imply that productivity at the individual
tree level could be increased. Our data show that liberating trees
of lianas improves crown forms, and in time, may increase fruit
production. Study results suggest a positive relationship
between foliar P and fruit production. Experimenting with P
amendments may prove fruitful, perhaps testing effectiveness
and practicality of utilizing on-site manure sources. Grazing
animals partition all P into dung (Hedley et al., 1995), and cattle
are increasingly common in extractivist livelihood systems in
many parts of Amazonia.
Second, Brazil nut collectors could potentially augment the
pool of trees from which they collect and perhaps increase
collection efficiency. In our study region, Brazil nut harvest is
based on a trail system originally blazed for collecting rubber.
While Brazil nut collectors are very familiar with the large
reproductive B. excelsa trees on and near these trails, there is
limited preoccupation with systematically seeking and tending
younger trees entering reproductive maturity, which could
increase the harvest pool. Additionally, over time, this
traditional trail system could preferentially concentrate harvest-
ing from the largest trees (>150 cm dbh), whereas we found
that those of intermediate diameters (100–150 cm dbh) are the
most productive. Our study also shows that some trees (11 of
140) were consistently super-producers, while a full 40%
produced fewer than 20 fruits year�1 on average, a quantity that
would not likely be collected given current harvest practices. To
achieve maximum efficiency, harvesters could concentrate
collection efforts on these consistently high producers that also
seem to be spatially aggregated. These production ‘‘hot spots’’
might also be targeted for incorporating new trees into the
harvest regime. Poor producers could be targeted for individual
tree interventions highlighted above.
Differences in ground fruit counts, reported throughout our
study as fruit production, versus our measured crown counts or
fruit depressions, clearly indicate that many fruits are ‘‘lost’’ to
predators, rather than human-harvested. While more intensive
extraction would certainly increase commercial yield, caution
should be exercised to not exceed a theoretically unsustainable
harvest threshold as documented in populations very inten-
sively harvested over decades (Peres et al., 2003). Overharvest
could also adversely affect the broader forest community (such
as agouti dynamics) and ecosystem functions (such as nutrient
cycling) (Ticktin, 2004).
Finally, although we did not find any one pattern of annual
fruit production at the individual tree level, harvesters could
begin tracking production levels of individual trees over time,
revealing patterns that might increase collection efficiency and
predictability of crop yield. Indeed, many Brazil nut harvesters
who have been collecting from the same trees for years, have
developed a mental map of high production trees, and often can
fairly accurately predict average individual tree production
(Wadt et al., 2005). Tapping into this local knowledge and
integrating it with science could enhance our understanding of
B. excelsa autecology and augment Brazil nut productivity. It
may also further our understanding of the complex interactions
between Dasyprocta spp., Homo sapiens, and B. excelsa, which
are poorly documented in the literature. Understanding of
production and production variation coupled with interventions
to achieve management goals can hopefully further advance
Amazonian forest conservation efforts in which Brazil nut is a
keystone element.
Acknowledgements
This research was supported by grants from FINEP/MCT/
CNPq in Brazil, The William and Flora Hewlett Foundation in
the U.S., and the International Science Foundation, Sweden,
K.A. Kainer et al. / Forest Ecology and Management 250 (2007) 244–255252

Author's personal copy
through a grant to Dr. Wadt. CNPT/IBAMA in Brazil gave
permission to conduct the research in RESEX Chico Mendes.
We also thank Paulo Rodrigues de Carvalho for his superior
field assistance, Pieter Zuidema and Wendell Cropper for
helpful comments on earlier manuscript drafts, and Paulo Wadt
and Deborah McGrath for nutrient insights. Finally, we are
most grateful to Valderi and Maria Alzenira who graciously
shared their forest home.
References
Acquaah, G., 2002. Horticulture: Principals and Practices, third ed. Prentice
Hall, Upper Saddle River, NJ, USA.
Akaike, H., 1973. Information theory as an extension of the maximum like-
lihood principle. In: Pretrov, B.N., Csaki, F.F. (Eds.), Proceedings of the
Second International Symposium on Information Theory. Akademiai
Kiado, Budapest, Hungary, pp. 267–281.
Alexiades, M.N., Shanley, P. (Eds.), 2004. Productos Forestales, Medios de
Subsistencia y Conservacion: Estudios de Caso Sobre Sistemas de Manejo
de Productos Forestales No Maderables. Volumen 3—America Latina.
Center for International Forestry Research (CIFOR), Bogor, Indonesia.
Ares, A., Brauer, D., 2004. Growth and nut production of black walnut in
relation to site, tree type and stand conditions in south-central United States.
Agroforestry Syst. 63, 83–90.
Bancroft, T.A., 1968. Topics in Intermediate Statistical Methods. Iowa State
University Press, Ames, IA, USA.
Burnham, K.P., Anderson, D.R., 2002. Model Selection and Multi-Model
Inference: A Practical Information-Theoretic Approach, second ed.
Springer-Verlag, New York, NY, USA.
Clay, J.W., 1997. Brazil nuts: the use of a keystone species for conservation and
development. In: Freese, C.H. (Ed.), Harvesting Wild Species: Implications
for Biodiversity Conservation. The Johns Hopkins University Press, Balti-
more, MD, USA, pp. 246–282.
Cuevas, E., Medina, E., 1988. Nutrient dynamics within Amazonian forests. II.
Fine root growth, nutrient availability and leaf litter decomposition. Oeco-
logia 76, 222–235.
de Souza, A.H., 1963. Castanha do Para: estudo botanico, quımico e tecnolo-
gico. Estudos Tecnicos, 23. Ministerio da Agricultura-Servico de Infor-
macao Agrıcola, Rio de Janeiro, RJ, Brazil.
EMBRAPA (Empressa Brasileira de Pesquisa Agropecuaria), 1997. Manual de
Metodos de Analise de Solos. Segunda edicao. Centro Nacional de Pesquisa
de Solos, Rio de Janeiro, RJ, Brazil.
Escobal, J., Aldana, U., 2003. Are nontimber forest products the antidote to
rainforest degradation? Brazil nut extraction in Madre de Dios, Peru. World
Dev. 31, 1873–1887.
Freese, C.T. (Ed.), 1997. Harvesting Wild Species: Implications for Biodi-
versity Conservation. The Johns Hopkins University Press, Baltimore, MD,
USA.Ap
pen
dix
A.
Pri
nci
pa
lco
mp
on
ent
loa
din
gs
an
dp
erce
nt
va
ria
tio
nex
pla
ined
by
qu
an
tita
tiv
etr
ee,
loca
tio
n,
an
dso
ilv
ari
ab
les
Pri
nci
pal
com
ponen
t
NE
Yea
rD
BH
Cro
wn
size
C (0–10
cm)
C (10–20
cm)
K (0–10
cm)
K (10–20
cm)
P (0–10
cm)
P (10–20
cm)
Mg
(0–10
cm)
Mg
(10–20
cm)
Ca
(0–10
cm)
Ca
(10–20
cm)
pH
(0–10
cm)
pH
(10–20
cm)
CE
C
(0–10
cm)
CE
C
(10–20
cm)
H+
+A
l3+
(0–10
cm)
H+
+A
l3+
(10–20
cm)
Var
iati
on
expla
ined
(%)
1�
0.0
50.1
40.0
00.1
10.1
20.2
40.2
6�
0.0
3�
0.0
7�
0.0
9�
0.0
4�
0.2
5�
0.2
3�
0.1
3�
0.0
9�
0.3
1�
0.2
80.3
50.3
50.3
60.3
628
2�
0.1
5�
0.2
70.0
00.2
10.1
4�
0.0
40.0
50.3
70.3
00.1
90.3
60.3
50.4
00.0
40.1
60.0
5�
0.0
10.2
20.2
00.1
70.1
510
30.0
00.2
40.0
00.2
00.2
00.3
80.2
8�
0.0
6�
0.1
70.1
4�
0.0
3�
0.0
3�
0.0
70.5
00.3
70.2
90.3
20.0
7�
0.0
80.0
8�
0.0
59
40.3
00.2
80.0
0�
0.5
3�
0.4
60.2
20.0
30.3
0�
0.0
60.1
5�
0.1
30.2
80.1
10.0
0�
0.0
10.0
40.0
60.1
50.1
00.1
10.1
18
50.5
50.0
60.0
00.0
80.3
40.1
60.0
10.0
20.0
90.5
50.2
2�
0.0
8�
0.0
8�
0.1
3�
0.3
50.0
4�
0.1
2�
0.0
9�
0.0
6�
0.0
9�
0.0
76
6�
0.0
90.4
00.0
0�
0.0
50.0
50.1
50.0
8�
0.2
60.6
0�
0.2
90.1
10.1
10.1
90.1
6�
0.3
8�
0.1
20.1
9�
0.0
2�
0.0
10.0
2�
0.1
05
70.0
00.0
01.0
00.0
00.0
00.0
00.0
00.0
00.0
00.0
00.0
00.0
00.0
00.0
00.0
00.0
00.0
00.0
00.0
00.0
00.0
05
80.4
8�
0.2
80.0
00.1
30.2
60.1
3�
0.1
20.0
80.2
0�
0.3
7�
0.5
60.0
40.1
4�
0.0
50.0
50.1
50.1
00.0
40.1
10.0
30.0
84
90.3
4�
0.1
80.0
0�
0.1
5�
0.2
20.0
4�
0.2
8�
0.3
40.2
9�
0.0
70.3
5�
0.2
3�
0.1
20.1
60.4
3�
0.0
2�
0.1
50.1
6�
0.0
30.2
1�
0.0
84
10
0.2
5�
0.0
70.0
00.0
6�
0.0
3�
0.0
10.2
9�
0.4
9�
0.4
5�
0.2
10.2
50.2
90.3
8�
0.2
3�
0.0
40.0
30.0
40.0
1�
0.0
20.0
80.0
53
11
�0.1
60.0
40.0
0�
0.0
9�
0.0
5�
0.0
70.3
3�
0.3
60.3
50.4
1�
0.3
7�
0.0
30.1
4�
0.3
50.3
30.1
3�
0.1
2�
0.0
90.0
6�
0.0
40.0
13
12
0.1
10.3
00.0
00.1
9�
0.0
50.1
00.2
10.3
90.0
9�
0.3
20.2
0�
0.1
3�
0.0
2�
0.5
00.3
10.0
3�
0.0
5�
0.0
1�
0.2
5�
0.0
6�
0.2
63
13
0.1
50.3
60.0
0�
0.2
80.4
7�
0.3
60.0
10.0
5�
0.0
7�
0.1
0�
0.0
10.1
10.1
40.2
40.3
2�
0.2
7�
0.3
2�
0.1
30.0
7�
0.1
40.0
82
14
0.0
7�
0.3
40.0
0�
0.3
50.0
2�
0.0
30.5
30.1
20.1
3�
0.1
80.2
5�
0.2
0�
0.2
00.0
9�
0.0
30.1
40.1
5�
0.2
50.2
2�
0.2
70.1
92
15
0.2
10.0
30.0
00.4
9�
0.4
8�
0.1
10.2
60.0
40.0
9�
0.0
1�
0.1
10.0
80.0
20.3
7�
0.0
6�
0.0
7�
0.4
1�
0.1
70.0
4�
0.1
80.0
32
16
0.2
40.1
40.0
00.2
2�
0.1
1�
0.5
10.0
5�
0.0
10.0
60.1
30.0
00.0
2�
0.2
2�
0.0
90.0
9�
0.2
80.6
20.0
70.1
30.0
80.1
22
17
�0.0
50.2
00.0
00.1
8�
0.0
60.3
1�
0.4
0�
0.1
1�
0.0
1�
0.0
30.1
70.1
2�
0.0
7�
0.1
80.1
90.0
60.0
7�
0.3
50.3
8�
0.3
40.3
82
18
0.0
20.3
00.0
00.0
3�
0.0
3�
0.3
9�
0.1
00.0
0�
0.0
1�
0.0
80.0
8�
0.2
80.1
0�
0.0
1�
0.1
70.7
2�
0.1
00.1
20.1
60.1
20.1
61
19
�0.0
20.0
00.0
0�
0.0
10.1
1�
0.0
90.0
5�
0.0
90.1
1�
0.1
00.0
20.6
4�
0.6
4�
0.0
7�
0.0
10.2
6�
0.1
70.0
8�
0.0
40.0
9�
0.0
61
20
0.0
00.0
00.0
00.0
00.0
00.0
00.0
00.0
00.1
10.0
00.0
00.0
00.0
00.0
00.0
00.0
00.0
00.0
0�
0.7
00.0
00.7
10
21
0.0
00.0
00.0
00.0
00.0
00.0
00.0
00.0
90.0
00.0
00.0
00.0
00.0
00.0
00.0
00.0
00.0
0�
0.7
10.0
00.7
00.0
00
Appendix B. Final coefficients of the mixed model
explaining fruit production
Variable Base
coefficient
Additional coefficient for
Year Severity
2002 2003 2004 2005 2006 1 2 3 4
Intercept �198.15
Year 20.09 17.55 27.44 17.49 0.00
Dbh 3.0061
Dbh2 �0.0111
Crown form 52.62 31.24 17.98 0.00
Vine load 4.28 5.35 �26.67 0.00
Vine cutting �16.59 23.42 25.97 12.23 36.16 0.00
No vine cutting 0.00 0.00 0.00 0.00 0.00 0.00
P �6.478
CEC 7.617
K.A. Kainer et al. / Forest Ecology and Management 250 (2007) 244–255 253
Author's personal copy
Gama, J.R.N.F., Kushaba, T., Ota, T., Amano, Y., 1992. Influencia de material
vulcanico em alguns solos do estado do Acre. Revista Brasileira de Ciencia
do Solo 16, 103–106.
Grauel, W.T., Putz, F.E., 2004. Effects of lianas on growth and regeneration of
Prioria copaifera in Darien, Panama. For. Ecol. Manage. 190, 99–108.
Harper, J.L., White, J., 1974. The demography of plants. Ann. Rev. Ecol. Syst.
5, 419–463.
Hedley, M.J., Mortvedt, J.J., Bolan, N.S., Syers, J.K., 1995. Phosphorus fertility
management in agroecosystems. In: Tiessen, H. (Ed.), SCOPE, 54, Phos-
phorus in the Global Environment: Transfers, Cycles and Management.
John Wiley & Sons, Ltd., Chichester, West Sussex, UK, pp. 59–92.
Herrera, C.M., Jordano, P., Guitian, J., Traveset, A., 1998. Annual variability in
seed production by woody plants and the masting concept: reassessment of
principles and relationship to pollination and seed dispersal. Am. Nat. 152,
576–594.
Holdridge, L.R., 1978. Ecologıa Basada en Zonas de Vida. Instituto Interamer-
icano de Ciencias Agrıcolas, San Jose, Costa Rica.
IMAC (Instituto de Meio Ambiente do Acre), 1991. Atlas geografico ambiental
do Acre. IMAC, Rio Branco, Acre, Brazil.
Jansen, P.A., 2003. Scatterhoarding and tree regeneration: ecology of nut
dispersal in a neotropical rainforest. Thesis. Wageningen University,
Wageningen, the Netherlands.
Janzen, D.H., 1976. Why bamboos wait so long to flower. Ann. Rev. Ecol. Syst.
7, 347–391.
Johnson, D.H., 1999. The insignificance of statistical significance testing. J.
Wildl. Manage. 63, 763–772.
Jones, J.E., Garrett, H.E., Haines, J., 1995. Genetic selection and fertilization
provide increased nut production under walnut-agroforestry management.
Agroforestry Syst. 29, 265–273.
Jordan, C.F., 1985. Nutrient Cycling in Tropical Forest Ecosystems: Principles
and Their Application in Management and Conservation. John Wiley &
Sons, Chichester, West Sussex, UK.
Kainer, K.A., Wadt, L.H.O., Gomes-Silva, D.A.P., Capanu, M., 2006. Liana
loads and their association with Bertholletia excelsa fruit and nut produc-
tion, diameter growth and crown attributes. J. Trop. Ecol. 22, 147–154.
Kelly, D., 1994. The evolutionary ecology of mast seeding. Trends Ecol. Evol.
9, 465–470.
Kelly, D., Sork, V.L., 2002. Mast seeding in perennial plants: why, how, where?
Ann. Rev. Ecol. Syst. 33, 427–447.
Koenig, W.D., Knops, J.M.H., 2000. Patterns of annual seed production by
Northern Hemisphere trees: a global perspective. Am. Nat. 155, 59–69.
Lathwell, D.J., Grove, T.L., 1986. Soil–plant relationships in the tropics. Ann.
Rev. Ecol. Syst. 17, 1–16.
Layne, J.N., Abrahamson, W.G., 2004. Long-term trends in annual reproductive
output of the scrub hickory: factors influencing variation in size of nut crop.
Am. J. Bot. 91, 1378–1386.
Marschner, H., 1995. Mineral Nutrition of Higher Plants, second ed. Academic
Press, San Diego, CA, USA.
Maues, M.M., 2002. Reproductive phenology and pollination of the Brazil nut
tree (Bertholletia excelsa Humb. & Bonpl. Lecythidaceae) in Eastern
Amazonia. In: Kevan, P., Imperatriz Fonseca, V.L. (Eds.), Pollinating Bees:
The Conservation Link Between Agriculture and Nature. Ministry of the
Environment, Brasilia, Brazil, pp. 245–254.
McGrath, D.A., Duryea, M.L., Cropper, W.P., 2001. Soil phosphorus avail-
ability and fine root proliferation in Amazonian agroforests 6 years follow-
ing forest conversion. Agric. Ecosyst. Environ. 83, 271–284.
Mills, H.A., Jones Jr., J.B., 1996. Plant Analysis Handbook II: A Practical
Sampling, Preparation, Analysis, and Interpretation Guide. Micro-Macro
Publishing, Athens, GA, USA.
Mori, S.A., Prance, G.T., 1990. Taxonomy, ecology, and economic botany of the
Brazil nut (Bertholletia excelsa Humb. and Bonpl: Lecythidaceae). Adv.
Econ. Bot. 8, 130–150.
Nelson, B.W., Absy, M.L., Barbosa, E.M., Prance, G.T., 1985. Observations on
flower visitors to Bertholletia excelsa H.B.K. and Couratari tenuicarpa
A.C. Sm. (Lecythidaceae). Acta Amazonica 15, 225–234.
Neter, J., Kutner, M.H., Wasserman, W., Nachtsheim, C.J., 1996. Applied
Linear Statistical Models, fourth ed. WCB/McGraw-Hill, Boston, MA,
USA.
Nielsen, G.H., Hogue, E.J., Parchomchuk, P., 1990. Flowering of apple trees in
the second year is increased by first-year P fertilization. Hortscience 25,
1247–1250.
Norton, D.A., Kelly, D., 1988. Mast seeding over 33 years by Dacrydium
cupressinum Lamb. (rimu) (Podocarpaceae) in New Zealand: the impor-
tance of economies of scale. Funct. Ecol. 2, 399–408.
O’Malley, D.M., Buckley, D.P., Prance, G.T., Bawa, K.S., 1988. Genetics of
Brazil nut (Bertholletia excelsa Humb. & Bonpl.: Lecythidaceae). Theor.
Appl. Genet. 76, 929–932.
Ortiz, E.G., 2002. Brazil nut (Bertholletia excelsa). In: Shanley, P., Laird,
S.A., Guillen, A. (Eds.), Tapping the Green Market: Certification and
Management of Non-Timber Forest Products. Earthscan Publications,
Ltd., London, UK, pp. 61–74.
Peres, C.A., Baider, C., Zuidema, P.A., Wadt, L.H.O., Kainer, K.A., Gomes-
Silva, D.A.P., Salomao, R.P., Simoes, L.L., Francisiosi, E.R.N., Valverde,
F.C., Gribel, R., Shepard Jr., G.H., Kanashiro, M., Coventry, P., Yu, D.W.,
Watkinson, A.R., Freckleton, R.P., 2003. Demographic threats to the
sustainability of Brazil nut exploitation. Science 302, 2112–2114.
Peters, C.M., 1996. The ecology and management of non-timber forest resources.
World Bank Technical Paper 322. The World Bank, Washington, DC, USA.
Ponder, F., Jones, J.E., 2001. Annual applications of N, P, and K interrupt
alternate-year nut crops in black walnut. J. Plant Nutr. 24, 661–670.
Prance, G.T., Mori, S.A., 1979. Lecythidaceae—Part I. The actinomorphic-
flowered New World Lecythidaceae (Asteranthos, Gustavia, Grias, Allan-
toma, & Cariniana). Flora Neotropica Monograph 21. The New York
Botanical Garden, Bronx, NY, USA.
Prance, G.T., 1976. The pollination and androphore structure of some Ama-
zonian Lecythidaceae. Biotropica 8, 235–241.
Schabenberger, O., Pierce, F.J., 2001. Contemporary Statistical Models for the
Plant and Soil Sciences. CRC Press, Boca Raton, FL, USA.
Snook, L.K., Camera-Cabrales, L., Kelty, M.J., 2005. Six years of fruit produc-
tion by mahogany trees (Swietenia macrophylla King): patterns of variation
and implications for sustainability. For. Ecol. Manage. 206, 221–235.
Stephenson, A.G., 1981. Flower and fruit abortion: proximate causes and
ultimate functions. Ann. Rev. Ecol. Syst. 12, 253–279.
Stevens, G.C., 1987. Lianas as structural parasites: the Bursera simaruba
example. Ecology 82, 913–919.
Stoian, D., 2005. Making the best of two worlds: rural and peri-urban livelihood
options sustained by nontimber forest products from the Bolivian Amazon.
World Dev. 33, 1473–1490.
Sutherland, S., 1986. Patterns of fruit-set: what controls fruit-flower ratios in
plants? Evolution 40, 117–128.
Synnott, T.J., 1979. A manual of permanent sample plot procedures for tropical
rainforests. Tropical Forestry Papers No. 14. Commonwealth Forestry
Institute, University of Oxford, Oxford, UK.
Ticktin, T., 2004. The ecological implications of harvesting non-timber forest
products: a review. J. Appl. Ecol. 41, 11–21.
Trevedi, M.R., Cornejo, F.H., Watkinson, A.R., 2004. Seed predation on Brazil
nuts (Bertholletia excelsa) by macaws (Psittacidae) in Madre de Dios, Peru.
Biotropica 36, 118–122.
UFAC (Universidade Federal do Acre), 2006. Group of Environmental Services
and Studies, Natural Sciences Department, Federal University of Acre, Rio
Branco, Acre, Brazil.
Vander Wall, S.B., 2001. The evolutionary ecology of nut dispersal. Bot. Rev.
67, 74–117.
Vaughton, G., 1991. Variation between years in pollen and nutrient limitation of
fruit-set in Banksia spinulosa. J. Ecol. 78, 389–400.
Viana, V.M., Mello, R.A., Moraes, L.M., de Mendes, N.T., 1998. Ecologia e
manejo de populacoes de castanha-do-Para em reservas extrativistas Xapurı,
Estado do Acre. In: Gascon, C., Montinho, P. (Eds.), Floresta Amazonica:
Dinamica, Regeneracao e Manejo. Instituto Nacional de Pesquisa da
Amazonia, Manaus, AM, Brazil, pp. 277–292.
Vieira, S., Trumbore, S., Camargo, P.B., Selhorst, D., Chambers, J.Q., Higuchi,
N., 2005. Slow growth rates of Amazonian trees: consequences for carbon
cycling. Proc. Natl. Acad. Sci. USA 102, 18502–18507.
Wadt, L.H.O., Kainer, K.A., Gomes-Silva, D.A.P., 2005. Population structure
and nut yield of a Bertholletia excelsa stand in Southwestern Amazonia.
For. Ecol. Manage. 211, 371–384.
K.A. Kainer et al. / Forest Ecology and Management 250 (2007) 244–255254

Author's personal copy
Wright, S.J., Muller-Landau, H.C., Calderon, O., Hernandez, A., 2005. Annual
and spatial variation in seedfall and seedling recruitment in a neotropical
forest. Ecology 86, 848–860.
ZEE (Zoneamento Ecologico-Economico do Acre), 2000. Recursos naturais e
meio ambiente, vol. I. Secretaria de Estado de Ciencia, Tecnologia e Meio
Ambiente, Rio Branco, Acre, Brazil.
Zuidema, P.A., Boot, R.G.A., 2002. Demography of the Brazil nut tree
(Bertholletia excelsa) in the Bolivian Amazon: impact of seed extraction
on recruitment and population dynamics. J. Trop. Ecol. 18, 1–31.
Zuidema, P.A., 2003. Ecology and management of the Brazil nut tree (Berthol-
letia excelsa), PROMAB (Programa Manejo de Bosques de la Amazonia
Boliviana) Scientific Series 6. PROMAB, Riberalta, Bolivia.
K.A. Kainer et al. / Forest Ecology and Management 250 (2007) 244–255 255
Related Documents