Explaining the Use of On-line Administrative Services: Economic Approach and Empirical Evidences. Maya Bacache ∗ , David Bounie † , and Abel François ‡ October 30, 2008 Abstract Despite the rapid growth in e-government research over the past few years, there is little consensus among researchers about the fac- tors that affect the demand side of on-line government services, and a theory of the use of government Internet services is still lacking. This paper attempts to fill this gap by proposing a standard economic approach based on individual rational choice behavior and by exploit- ing a unique data set collected in 2005 on a random sample of 5,603 French respondents. Estimating a Heckman’s model of selection to control for selection bias, the results confirm that i. selection biases are particularly pregnant, ii. a standard economic approach based on a cost analysis is particularly well adapted to explain the use of on-line administrative services. In particular, we find that the relative access cost to on-line administrative services (measured by the occupational status), the cost to find administrative information (captured by In- ternet and computer skills) and the cost of processing administrative information (identified by the professional status and the level of edu- cation) as well as the availability of Internet services play a major role in the trade-off between on-line and off-line administrative channels. Key Words: e-administration, Internet uses, selection bias. * Economics and Social Sciences Department, Telecom ParisTech. † Economics and Social Sciences Department, Telecom ParisTech. ‡ LaRGE, Strasbourg University and Economics and Social Sciences Department, Tele- com ParisTech. Corresponding author: [email protected].

Welcome message from author
This document is posted to help you gain knowledge. Please leave a comment to let me know what you think about it! Share it to your friends and learn new things together.
Transcript
Explaining the Use of On-line Administrative
Services: Economic Approach and Empirical
Evidences.
Maya Bacache∗, David Bounie†, and Abel François‡
October 30, 2008
Abstract
Despite the rapid growth in e-government research over the pastfew years, there is little consensus among researchers about the fac-tors that affect the demand side of on-line government services, anda theory of the use of government Internet services is still lacking.This paper attempts to fill this gap by proposing a standard economicapproach based on individual rational choice behavior and by exploit-ing a unique data set collected in 2005 on a random sample of 5,603French respondents. Estimating a Heckman’s model of selection tocontrol for selection bias, the results confirm that i. selection biasesare particularly pregnant, ii. a standard economic approach based ona cost analysis is particularly well adapted to explain the use of on-lineadministrative services. In particular, we find that the relative accesscost to on-line administrative services (measured by the occupationalstatus), the cost to find administrative information (captured by In-ternet and computer skills) and the cost of processing administrativeinformation (identified by the professional status and the level of edu-cation) as well as the availability of Internet services play a major rolein the trade-off between on-line and off-line administrative channels.
Key Words: e-administration, Internet uses, selection bias.
∗Economics and Social Sciences Department, Telecom ParisTech.†Economics and Social Sciences Department, Telecom ParisTech.‡LaRGE, Strasbourg University and Economics and Social Sciences Department, Tele-
com ParisTech. Corresponding author: [email protected].
1 Introduction
In recent years, e-government1 has become one of the most important
aspects of public sector reform in developed countries. However, despite the
rapid development of on-line administrative services, there is little consensus
among researchers about the factors that affect the demand side of on-line
government services2. Three main reasons can be advanced to explain this
situation.
First, much of the existing work has explored e-administration from a
supply-side perspective by proposing inventories, classifications and a guide
of the best practices of e-government offerings (Gupta and Jana, 2003; Navarro
et al., 2007).
Second, even when the studies focus on citizen interactions with e-government
(demand-side perspective), they are often based on qualitative methods and
case studies rather on quantitative methods. Reviewing for instance eighty-
four papers in e-government-specific research outlets, Heeks and Bailur (2007)
note that only ten papers used quantitative methods. Despite the quality of
such methods, case studies are mainly dedicated to the analysis of a spe-
cific (or a limited group) administrative service which therefore prevents all
comparisons between e-administrative services or between on-line and off-line
administrative services.
Third, even when quantitative analysis (based exclusively on survey data)
are conducted, they are either realized on limited samples of national popu-
lations or they use basic statistical analysis that preclude all generalization
of the results. Schellong and Mans (2004) for instance surveyed 400 German
patients in several doctor´s practices (off-line) and 50 students or recent uni-
versity graduates through the Internet. Pieterson and van Dijk (2007) use
1e-government and e-administration are considered as synonym in this paper.2We are especially interested here in citizen interactions with e-government rather than
in business interactions. The reader interested in the adoption of e-government in businesswill consult Navarro et al. (2007).
3
survey data collected in the Netherlands from five groups (collective inter-
views) and 18 people (single interviews). Likewise, Akman et al. (2005)
use a sample of 83 citizens and representatives of IT divisions of govern-
ment and business sectors who were the attendees of an annual meeting of
e-government. Finally, Horst et al. (2006) use a sample of 238 persons in-
terviewed in trains, in local government offices and at post offices in several
cities in the Netherlands in 2003. Overall, these studies are extremely inter-
esting and put forward the role of several important determinants of the use
of on-line administrative services such as sociodemographic characteristics
(age, income, profession, etc.), channel characteristics (speed, ease of use,
personalization), situational constraint (availability of the channel, need for
closure, etc.), the perceived usefulness of electronic services, etc. Unfortu-
nately, the interpretation of these results have to be viewed with caution since
on the one hand, they are not valid for the entire population (Reddick, 1995)
and, on the other, they can be biased due to the simplicity of the statisti-
cal analysis (partial correlation coefficients, Ordinary Least Square method,
etc.) (Heeks and Bailur, 2007).
To the best of our knowledge, the only deepened quantitative study based
on a large sample is to the initiative of van Dijk et al. (2007). The authors
exploit a survey with a random sample of 1,225 respondents who completed
the questionnaire by e-mail, by telephone and by personal interview in 2006.
The survey intends to understand the actual use and intended use of the
main government Internet services of Dutch national and local governments.
The authors find that the sociodemographic and psychological factors usually
investigated in new technology acceptance and usage research do not prove
to be strong. Instead, it is demonstrated that the availability of Internet ser-
vices, the knowledge of this availability, the preference to use digital channels,
and the ability and experience to do this are the primary conditions.
However, if this research is very interesting, it has two major defaults.
First, the structural equation modeling techniques used are simply a refined
4
version of partial correlation coefficients for each pair of explanatory variables
and this technique does not allow to simultaneously control for potential
correlation between more than two explanatory variables. Second and most
of all, they do not take potential selection bias into account. In other words,
the distribution of respondents over categories of the explanatory variables
they are interested in has probably taken place in a selective way and that
non-randomness can disturb the estimation of other relationships which are
of substantial interest.
In the sequel, we explicitly account for these statistical biases by using
an Heckman’s model of selection and by exploiting a unique data set col-
lected in 2005 on a random sample of 5,603 French respondents. By using
this technique, we answer in part the Heeks and Bailur’s critics related to
the lack of rigor about research methods. Estimation results confirm that
i. selection biases are particularly pregnant for our concern, ii. a standard
economic approach based on a cost analysis is particularly well adapted to
explain the use of on-line administrative services. In particular, we find that
the relative access cost to on-line administrative services, the costs of col-
lecting and processing administrative information as well as the availability
of Internet services play a major role in the trade-off between on-line and
off-line administrative channels.
The remainder of the paper is structured as follows. In a second part,
we give an overview of the French on-line administrative services in 2005.
In a third part, we present a simple model to explain the use of on-line
administrative services and describe the survey and the data set we use to test
the model. In part four, we introduce the estimation method and comment
on the estimation results. In a last part, we conclude.
5
2 E-administration in France: what the supply
side looks like in 2005?
The first governmental French website was the one of the French Em-
bassy in Washington, which opened in the early nineties. Later, in 1996, the
Government of the Prime Minister Alain Juppé opened the first ministry-
level websites, but they were mainly political communication tools. In 1997,
the first on-line administrative services appear with the French prime min-
ister Lionel Jospin’s plan entitled "Internet, un défi pour la France". The
first administrative website opens in 1998: "Admifrance", which provided
information and allowed to download some forms, used content previously
available through the France Telecom operated "Minitel" network and ter-
minal (Trumbull, 2004). The 23rd of October 2000, the French government
opened a major website "Service-Public.fr", a portal hosting all public ser-
vices on the web. In 2003, more than 1,200 forms were available and can be
downloaded and 15% of all procedures could be entirely realized on the web.
In a nutshell, most of what is possible in 2008 was already available in 2005,
the date of the data set we use in this paper.
In France in 2005, nearly all public administrations are present on the
web and provide three main types of services such as delivering information,
downloading forms or delivering public services in extenso. First, nearly
everything related to taxes is available for agents and businesses: information,
downloading of forms, paying income taxes, etc. Second, many websites
provide information about the job market and a specific website (ANPE and
ASSEDIC) allows to get information, to download forms and to manage job
search. Those receiving unemployment benefits can access their personal files,
follow their transfers and modify their situation. Third, those receiving social
transfers such as family transfers, retirement transfers or housing allowances
can download forms and get information about their transfers. At large, all
citizens can also make many "one-way" interactions, that is to say can ask
6
for various documents such as birth acts which they will then subsequently
receive by post mail.
Because various services are referred as "public" in France, the term of
public services is used in a broad sense. Public services in France are orga-
nized in three different structures: what is referred to central public services,
provided by civil servants and organized at a national level; the local public
services provided by agents employed by local communities (municipalities
or regional structures); the health sector. In addition, one can add the social
security system, often perceived as public services in France; but it is not
a governmental organization. Eventually, former public firms can be added
to this wide scope of public services. One must notice that in households
survey, "e-Government" refers widely to e-administration and to many pub-
lic services provided by local organizations or even by private enterprises.
For instance, social services, transportation, electricity or post mail could be
perceived as governmental services. Hence it is difficult to establish a precise
link between what is actually offered on public websites and what French
users consider as e-administration.
3 The use of e-administration in France
The main objective of this section is to explain the use of on-line admin-
istrative services in France. In a first section, we present a simple model
based on individual rational choice behavior in which the individual choice is
mainly driven by costs of administrative processes. This model leads to for-
mulate some testable propositions. In as second part, we present the survey
and the data set we use to test our model.
3.1 An economic approach
Let us assume an agent who has the choice between an Internet and a
face-to-face relation to engage into an administrative process. Each alterna-
7
tive is attended by costs and benefits. We assume that the benefits of the
administrative process are similar whatever the type of relation3. By con-
trast, the costs of using each alternative differ and the one with the lowest
cost will be selected by the agent. In other words, if the cost related to the
on-line process is lower than the cost of the face-to-face one, then the agent
will choose the on-line process.
The costs of an administrative process vary across agents and are specific
to each alternative. Four main costs can be listed.
The first cost is an access cost. On-line administrative services are always
available (24 hours a day, 7 days a week). At the opposite, the opening hours
of the administration (bureau) are limited and scheduled during the working
times of the agents (which limit its access). The second one is a trip cost.
By nature, on-line administrative services have no physical location and do
not require a trip for the agents. Therefore, the time spent in an on-line
administrative process is less important, especially if the process requires
many trips. But this benefit could be undermined by the costs related to
searching and collecting relevant on-line information. Indeed, finding relevant
information can be time-consuming for agents facing the huge quantity of
on-line available information. This third cost, a cost to collect information,
is in part related to individual skills to use the Internet. An agent who
easily knows how to find information on the Internet has a weakest cost
than an other agent without any technical competences. Finally, the last
cost, called hereafter processing cost, has to be distinguished from the cost of
collecting information on the Internet. The technical administrative language
is complex and can represent a real effort to process the information for agents
even if the information is easy to find. This cost does not depend on the type
of interaction used with the administration (on-line versus face-to-face) but
strictly depends on the ability of the agent to understand the administrative
information and the administrative process.
3The benefits of an on-line or face-to-face relations are assumed equivalent.
8
Hence, we can formalize the choice of an agent willing to use a specific
administrative process as follows. Each cost for an agent i depends on the
time spent in an administrative process, Ci = f(time). However costs are
different according to the channel used, i.e. on-line (ol) or face-to-face (f2f):
f oli 6= f f2f
i . Let set a relative cost ci =f f2f
i
foli
S 1. If ci > 1, then the e-
administration process is less costly than the face-to-face one, and the agent
chooses to use the first channel. By contrast, if ci < 1, the e-administration
process is more costly than the face-to-face one, and the agent chooses to use
the second channel. Finally, if ci = 1, there is no difference between both
channels.
Now, let formalize the four costs described previously: the access cost
(cai ), the trip cost (ct
i), the cost of collecting information (cci) and the cost
of processing information (cpi ). Using the expression of the individual choice
above, we expect that cai , c
ti > 1, cc
i
?
≷ 1 and cpi = 1. In the next part, we test
empirically these relations.
3.2 Survey and descriptive statistics
To test the above propositions, we use a unique and original data set on
the use of e-administration in France.
The survey has been carried out by the National Institute for Statistics
and Economic Studies in November 2005. 5,603 individuals aged older than
15 years have been randomly interviewed. The survey intended to describe
the diffusion and the use of Information Technologies in France (the Inter-
net, mobile phone, personal computer, etc.) as well as the individual and
professional practicals affected by these technologies (electronic commerce,
e-administration, e-banking, etc.). Additionally, a part of the survey was
designed to better understand the individual competences and the modes of
learning of these technologies.
Globally, the respondents who declared to use the Internet during the last
9
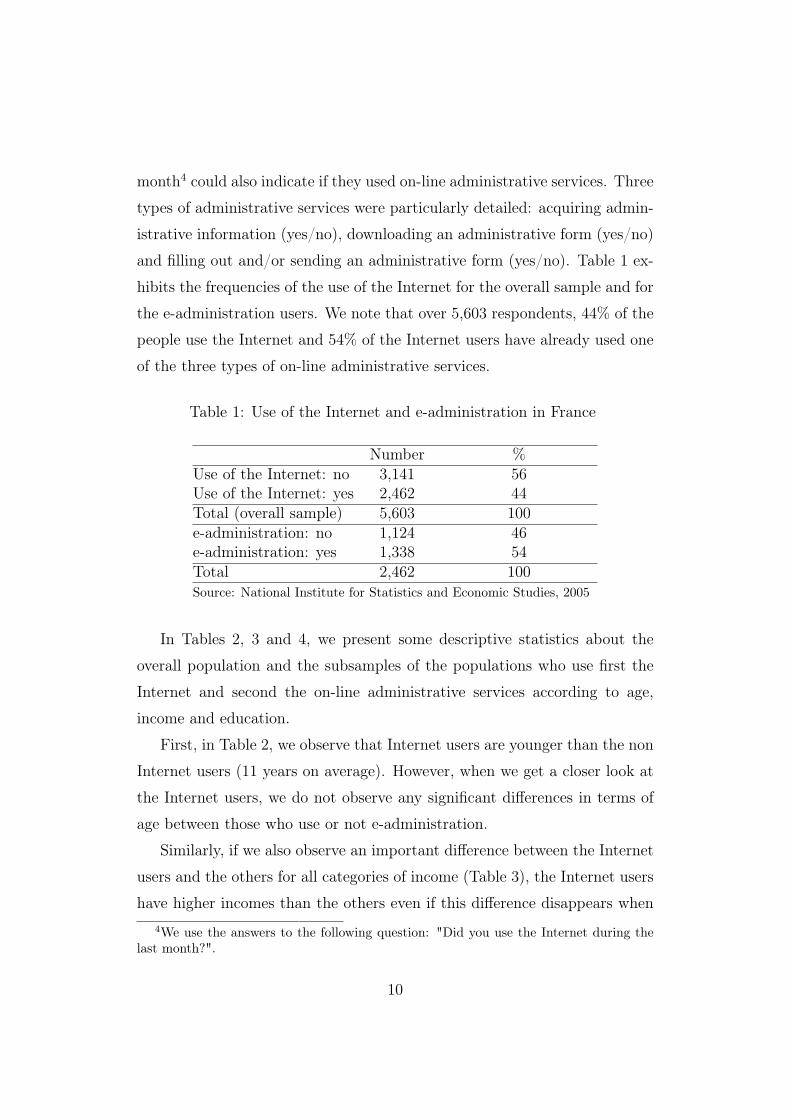
month4 could also indicate if they used on-line administrative services. Three
types of administrative services were particularly detailed: acquiring admin-
istrative information (yes/no), downloading an administrative form (yes/no)
and filling out and/or sending an administrative form (yes/no). Table 1 ex-
hibits the frequencies of the use of the Internet for the overall sample and for
the e-administration users. We note that over 5,603 respondents, 44% of the
people use the Internet and 54% of the Internet users have already used one
of the three types of on-line administrative services.
Table 1: Use of the Internet and e-administration in France
Number %Use of the Internet: no 3,141 56Use of the Internet: yes 2,462 44Total (overall sample) 5,603 100e-administration: no 1,124 46e-administration: yes 1,338 54Total 2,462 100Source: National Institute for Statistics and Economic Studies, 2005
In Tables 2, 3 and 4, we present some descriptive statistics about the
overall population and the subsamples of the populations who use first the
Internet and second the on-line administrative services according to age,
income and education.
First, in Table 2, we observe that Internet users are younger than the non
Internet users (11 years on average). However, when we get a closer look at
the Internet users, we do not observe any significant differences in terms of
age between those who use or not e-administration.
Similarly, if we also observe an important difference between the Internet
users and the others for all categories of income (Table 3), the Internet users
have higher incomes than the others even if this difference disappears when
4We use the answers to the following question: "Did you use the Internet during thelast month?".
10
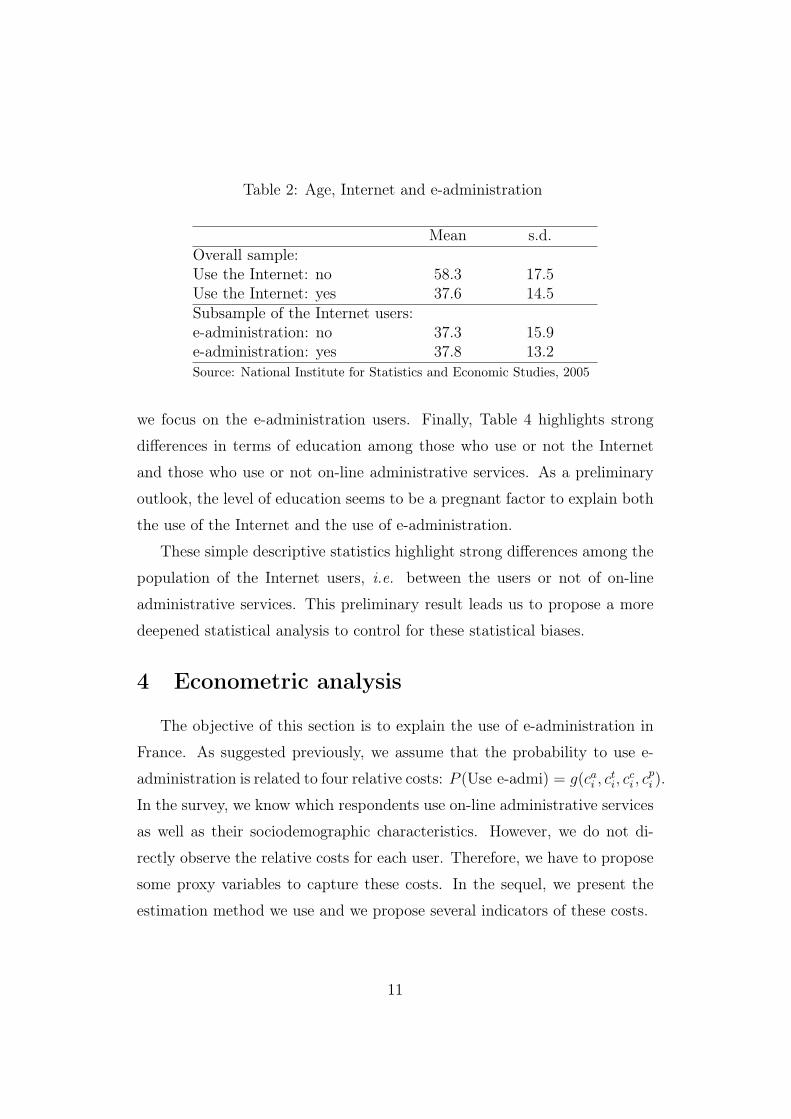
Table 2: Age, Internet and e-administration
Mean s.d.Overall sample:Use the Internet: no 58.3 17.5Use the Internet: yes 37.6 14.5Subsample of the Internet users:e-administration: no 37.3 15.9e-administration: yes 37.8 13.2Source: National Institute for Statistics and Economic Studies, 2005
we focus on the e-administration users. Finally, Table 4 highlights strong
differences in terms of education among those who use or not the Internet
and those who use or not on-line administrative services. As a preliminary
outlook, the level of education seems to be a pregnant factor to explain both
the use of the Internet and the use of e-administration.
These simple descriptive statistics highlight strong differences among the
population of the Internet users, i.e. between the users or not of on-line
administrative services. This preliminary result leads us to propose a more
deepened statistical analysis to control for these statistical biases.
4 Econometric analysis
The objective of this section is to explain the use of e-administration in
France. As suggested previously, we assume that the probability to use e-
administration is related to four relative costs: P (Use e-admi) = g(cai , c
ti, c
ci , c
pi ).
In the survey, we know which respondents use on-line administrative services
as well as their sociodemographic characteristics. However, we do not di-
rectly observe the relative costs for each user. Therefore, we have to propose
some proxy variables to capture these costs. In the sequel, we present the
estimation method we use and we propose several indicators of these costs.
11
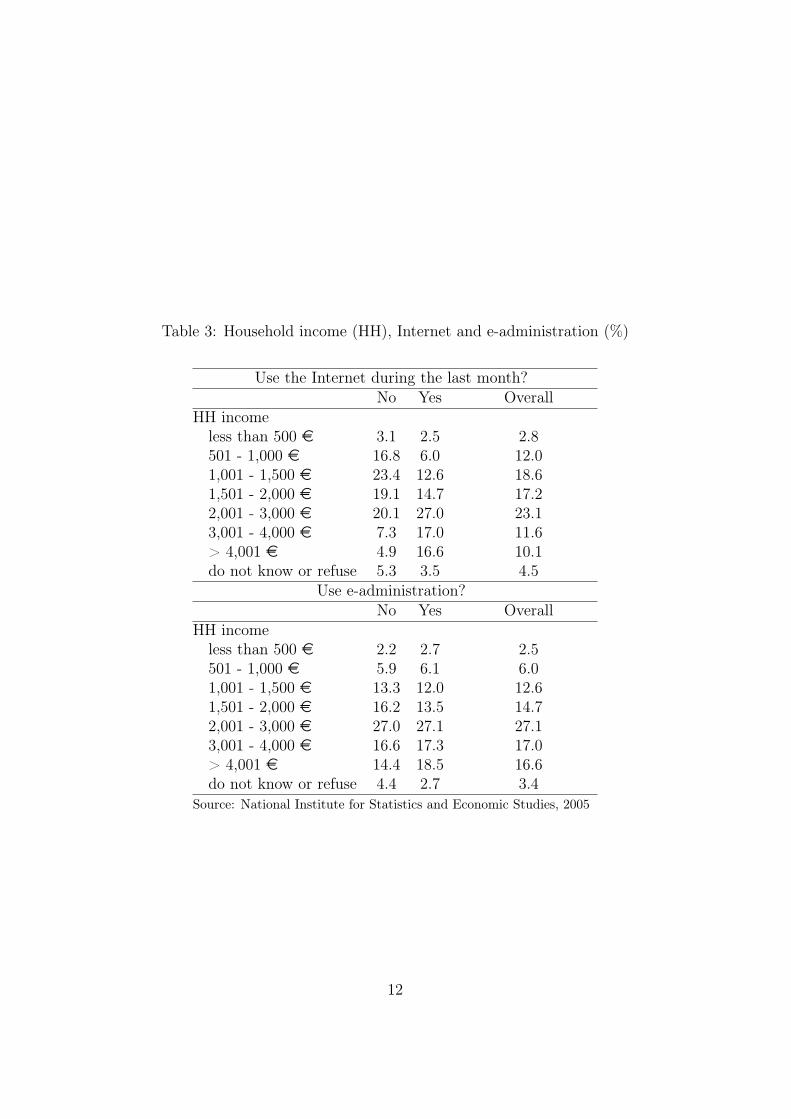
Table 3: Household income (HH), Internet and e-administration (%)
Use the Internet during the last month?No Yes Overall
HH incomeless than 500 e 3.1 2.5 2.8501 - 1,000 e 16.8 6.0 12.01,001 - 1,500 e 23.4 12.6 18.61,501 - 2,000 e 19.1 14.7 17.22,001 - 3,000 e 20.1 27.0 23.13,001 - 4,000 e 7.3 17.0 11.6> 4,001 e 4.9 16.6 10.1do not know or refuse 5.3 3.5 4.5
Use e-administration?No Yes Overall
HH incomeless than 500 e 2.2 2.7 2.5501 - 1,000 e 5.9 6.1 6.01,001 - 1,500 e 13.3 12.0 12.61,501 - 2,000 e 16.2 13.5 14.72,001 - 3,000 e 27.0 27.1 27.13,001 - 4,000 e 16.6 17.3 17.0> 4,001 e 14.4 18.5 16.6do not know or refuse 4.4 2.7 3.4
Source: National Institute for Statistics and Economic Studies, 2005
12
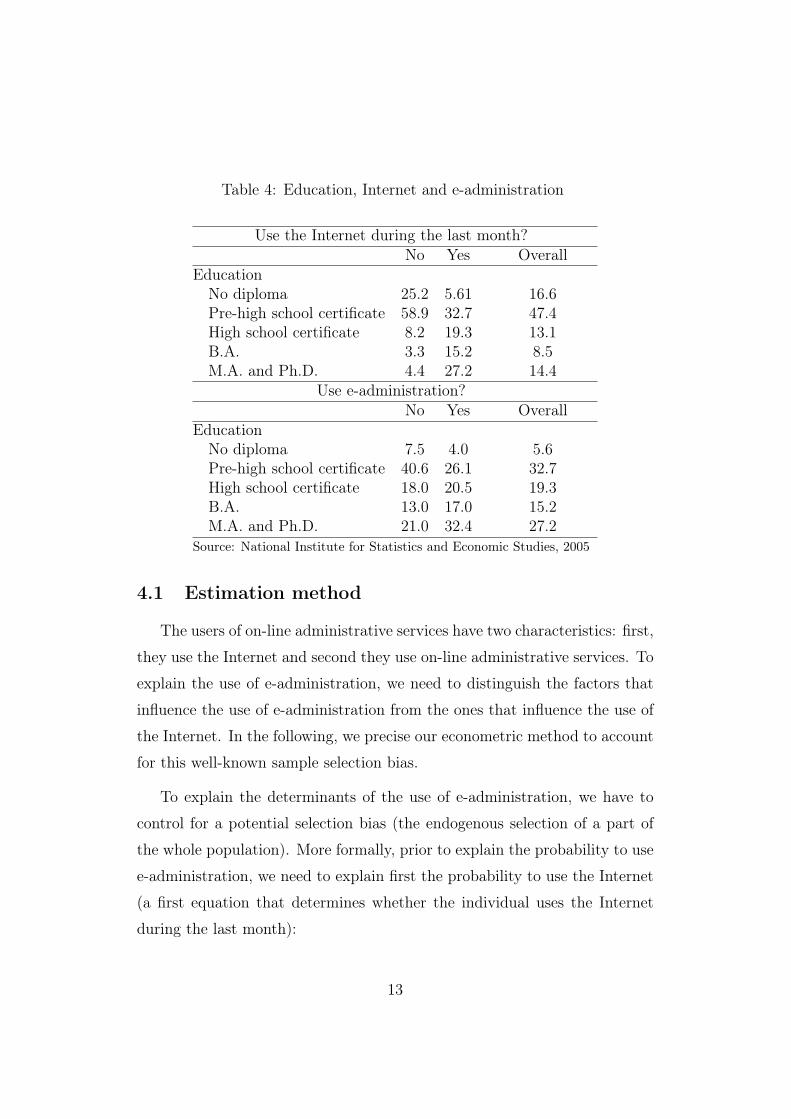
Table 4: Education, Internet and e-administration
Use the Internet during the last month?No Yes Overall
EducationNo diploma 25.2 5.61 16.6Pre-high school certificate 58.9 32.7 47.4High school certificate 8.2 19.3 13.1B.A. 3.3 15.2 8.5M.A. and Ph.D. 4.4 27.2 14.4
Use e-administration?No Yes Overall
EducationNo diploma 7.5 4.0 5.6Pre-high school certificate 40.6 26.1 32.7High school certificate 18.0 20.5 19.3B.A. 13.0 17.0 15.2M.A. and Ph.D. 21.0 32.4 27.2
Source: National Institute for Statistics and Economic Studies, 2005
4.1 Estimation method
The users of on-line administrative services have two characteristics: first,
they use the Internet and second they use on-line administrative services. To
explain the use of e-administration, we need to distinguish the factors that
influence the use of e-administration from the ones that influence the use of
the Internet. In the following, we precise our econometric method to account
for this well-known sample selection bias.
To explain the determinants of the use of e-administration, we have to
control for a potential selection bias (the endogenous selection of a part of
the whole population). More formally, prior to explain the probability to use
e-administration, we need to explain first the probability to use the Internet
(a first equation that determines whether the individual uses the Internet
during the last month):
13
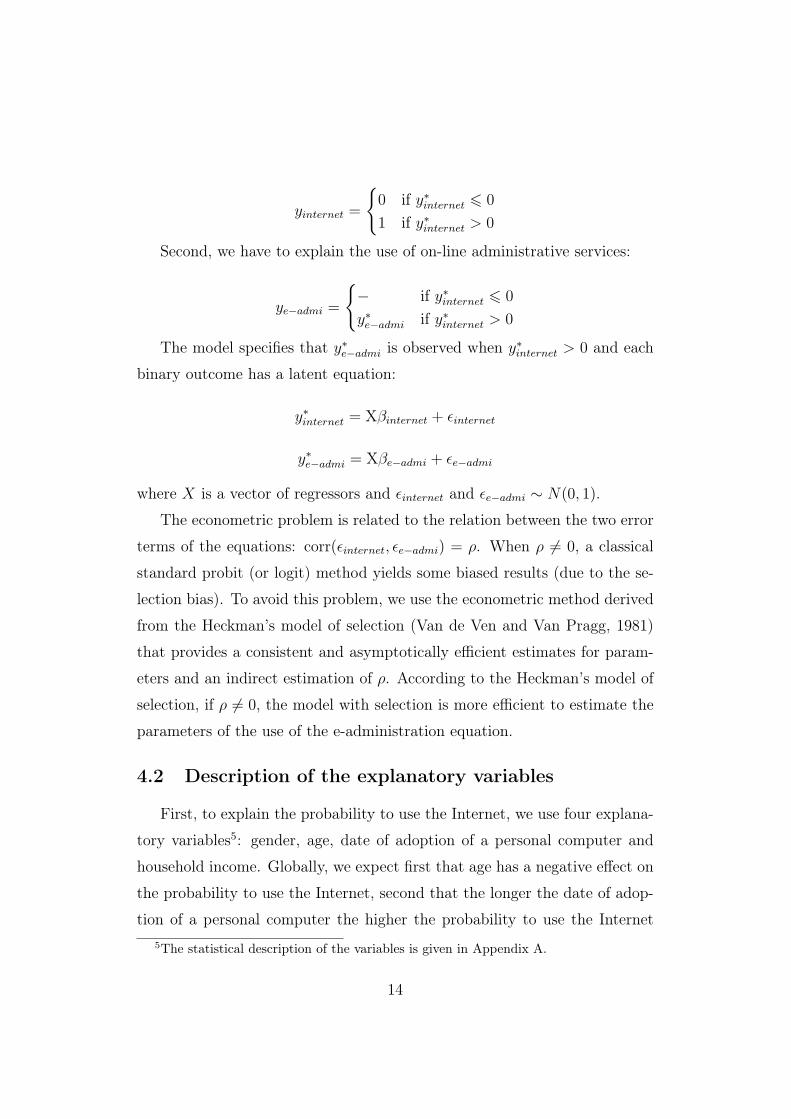
yinternet =
{
0 if y∗
internet 6 0
1 if y∗
internet > 0
Second, we have to explain the use of on-line administrative services:
ye−admi =
{
− if y∗
internet 6 0
y∗
e−admi if y∗
internet > 0
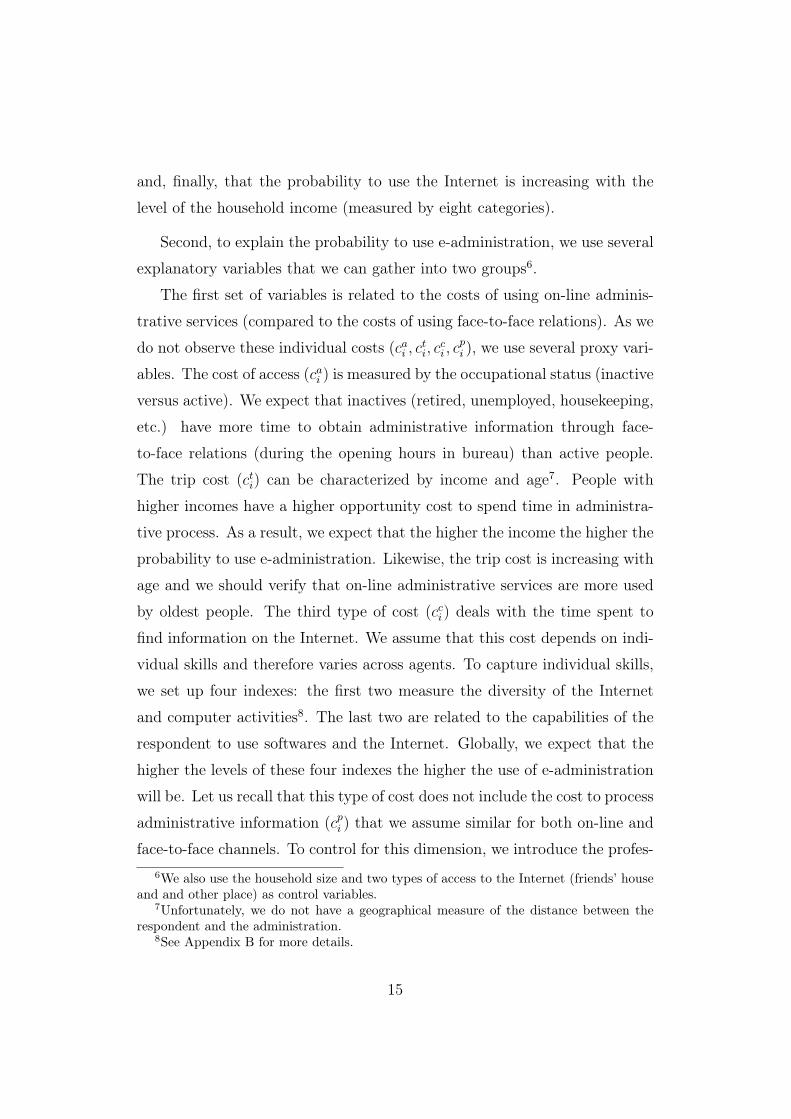
The model specifies that y∗
e−admi is observed when y∗
internet > 0 and each
binary outcome has a latent equation:
y∗
internet = Xβinternet + ǫinternet
y∗
e−admi = Xβe−admi + ǫe−admi
where X is a vector of regressors and ǫinternet and ǫe−admi ∼ N(0, 1).
The econometric problem is related to the relation between the two error
terms of the equations: corr(ǫinternet, ǫe−admi) = ρ. When ρ 6= 0, a classical
standard probit (or logit) method yields some biased results (due to the se-
lection bias). To avoid this problem, we use the econometric method derived
from the Heckman’s model of selection (Van de Ven and Van Pragg, 1981)
that provides a consistent and asymptotically efficient estimates for param-
eters and an indirect estimation of ρ. According to the Heckman’s model of
selection, if ρ 6= 0, the model with selection is more efficient to estimate the
parameters of the use of the e-administration equation.
4.2 Description of the explanatory variables
First, to explain the probability to use the Internet, we use four explana-
tory variables5: gender, age, date of adoption of a personal computer and
household income. Globally, we expect first that age has a negative effect on
the probability to use the Internet, second that the longer the date of adop-
tion of a personal computer the higher the probability to use the Internet
5The statistical description of the variables is given in Appendix A.
14
and, finally, that the probability to use the Internet is increasing with the
level of the household income (measured by eight categories).
Second, to explain the probability to use e-administration, we use several
explanatory variables that we can gather into two groups6.
The first set of variables is related to the costs of using on-line adminis-
trative services (compared to the costs of using face-to-face relations). As we
do not observe these individual costs (cai , c
ti, c
ci , c
pi ), we use several proxy vari-
ables. The cost of access (cai ) is measured by the occupational status (inactive
versus active). We expect that inactives (retired, unemployed, housekeeping,
etc.) have more time to obtain administrative information through face-
to-face relations (during the opening hours in bureau) than active people.
The trip cost (cti) can be characterized by income and age7. People with
higher incomes have a higher opportunity cost to spend time in administra-
tive process. As a result, we expect that the higher the income the higher the
probability to use e-administration. Likewise, the trip cost is increasing with
age and we should verify that on-line administrative services are more used
by oldest people. The third type of cost (cci) deals with the time spent to
find information on the Internet. We assume that this cost depends on indi-
vidual skills and therefore varies across agents. To capture individual skills,
we set up four indexes: the first two measure the diversity of the Internet
and computer activities8. The last two are related to the capabilities of the
respondent to use softwares and the Internet. Globally, we expect that the
higher the levels of these four indexes the higher the use of e-administration
will be. Let us recall that this type of cost does not include the cost to process
administrative information (cpi ) that we assume similar for both on-line and
face-to-face channels. To control for this dimension, we introduce the profes-
6We also use the household size and two types of access to the Internet (friends’ houseand and other place) as control variables.
7Unfortunately, we do not have a geographical measure of the distance between therespondent and the administration.
8See Appendix B for more details.
15
sional status of the individual (among the actives, we distinguish two types
of civil servants (national and local civil servants) and three types of em-
ployee status (employee of individual9, employee of a firm and self-employed
(entrepreneur)) and the level of education as explanatory variables. The rea-
son is that civil servants can take advantage of their position to understand
the specificities of the administration processes. Likewise, higher educated
people are likely to get a lower cost than the others to process administrative
information.
The second set of variables accounts for financial relations between admin-
istration and users. Some people benefit from social and public allowances
and are more inclined to use e-administration, most of all if these institu-
tions offer some on-line services10. Therefore, we introduce in the estimation
the four main types of public allowances in France related to unemploy-
ment, family, housing and insertion11. More precisely, we use four dummy
variables that indicate if the household receives an unemployment, housing,
insertion and/or a family allowance. Finally, among the professional status,
that of "employee of individual" benefits from special on-line administrative
services12.
4.3 Estimation results
Table 5 summarizes the estimation results.
First, we note that the correction of the selection bias is relevant since
the estimated coefficient of correlation (ρ) between the error terms of the two
equations is statistically significant. The Wald test of independence between
9A private individual or a household in France can employ an other person (nurse,housekeeper, gardener, etc.).
10Some of the institutions in charge of these allowances organize exclusively on theInternet the interactions with the beneficiaries. For instance, the institution in charge ofthe unemployment allowances exclusively manages on the Internet the declaration of theactivities.
11An allowance called Insertion Minimum Income is given to the poorest people.12To foster this kind of employment, all administrative processes are available on-line.
16
the two equations confirms this result. Additionally, we also run an Hausman
specification test13 that concludes to the highest relevance of the probit with
the selection bias method (compared to a standard probit estimation).
Second, the results are stable and robust whatever the distribution of
the variables between both equations. Although the relevance of the probit
method with selection bias is deeply related to the correlation between the
explanatory variables on the one hand and between the explanatory variables
and the ρ term on the other hand (Puhani, 2001), our results are fairly stable
even if we introduce the education and/or the income variables into the first
and/or the second equation.
Third, estimation results show that our model has globally a strong ex-
planatory power. First of all, the relative cost of access to administration
seems to influence the choice of the administrative process (on-line versus
face-to-face). Indeed, all the coefficients related to the occupational status
are positive and statistically significant except for the self-employed category
which is not different from the base category (inactive) which means that
the inactive people use less e-administration than the actives. On the con-
trary, the trip cost, captured by age and the household income has globally
a tiny influence. Indeed, only age impacts the conditional probability to use
e-administration. Since estimation results show that the older the people the
higher the probability to use on-line administrative services, we can conclude
that the trip costs for those people are important. Also interesting is the
importance of the cost of collecting information. The coefficients associated
to the four indexes of computer and Internet skills and to the diversity of
the computer and Internet activities have a strong impact. We note that
13The method based upon a control of selection bias is assumed to be the most relevantand efficient. The test can be presented as follows. The coefficients estimated from theprobit with selection bias are more consistent and efficient than those obtained with astandard probit. The null hypothesis is that the difference between the two sets of coeffi-cients is not systematic. The calculated value, χ
2(28) = 1, induces a probability equals to 1.
We can conclude that the probit with selection bias gives a more efficient and consistentestimation of the coefficients.
17
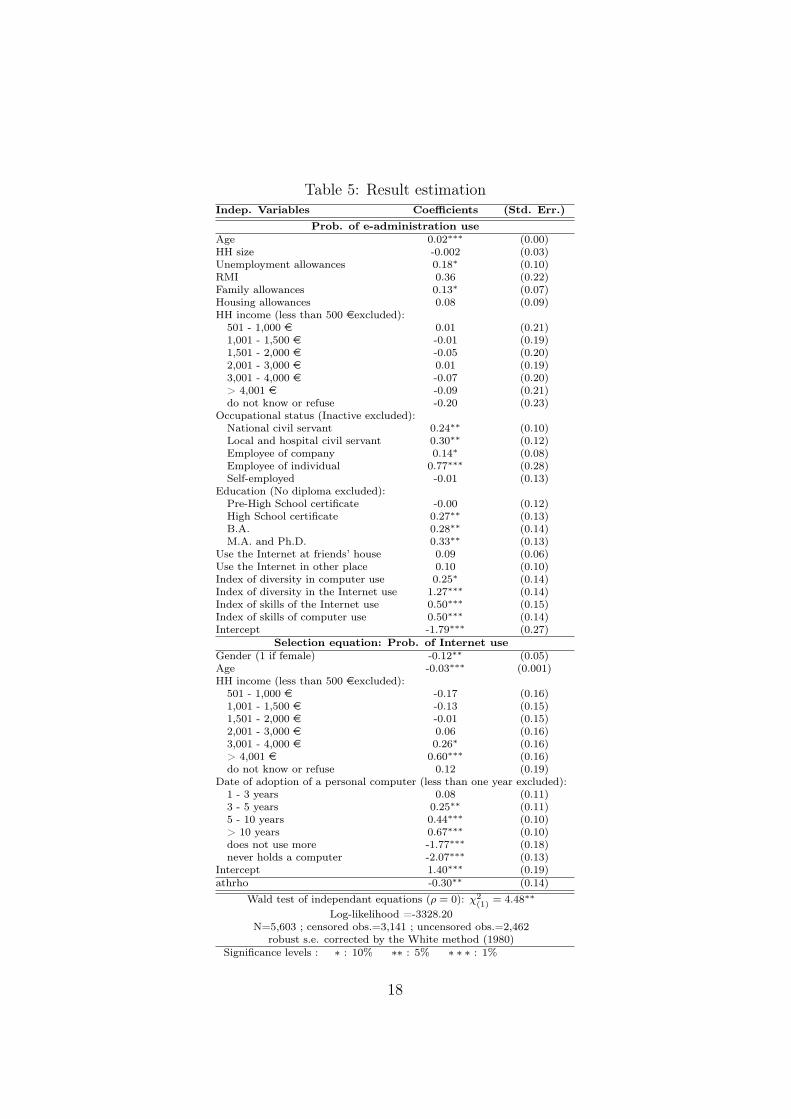
Table 5: Result estimationIndep. Variables Coefficients (Std. Err.)
Prob. of e-administration useAge 0.02∗∗∗ (0.00)HH size -0.002 (0.03)Unemployment allowances 0.18∗ (0.10)RMI 0.36 (0.22)Family allowances 0.13∗ (0.07)Housing allowances 0.08 (0.09)HH income (less than 500 eexcluded):
501 - 1,000 e 0.01 (0.21)1,001 - 1,500 e -0.01 (0.19)1,501 - 2,000 e -0.05 (0.20)2,001 - 3,000 e 0.01 (0.19)3,001 - 4,000 e -0.07 (0.20)> 4,001 e -0.09 (0.21)do not know or refuse -0.20 (0.23)
Occupational status (Inactive excluded):National civil servant 0.24∗∗ (0.10)Local and hospital civil servant 0.30∗∗ (0.12)Employee of company 0.14∗ (0.08)Employee of individual 0.77∗∗∗ (0.28)Self-employed -0.01 (0.13)
Education (No diploma excluded):Pre-High School certificate -0.00 (0.12)High School certificate 0.27∗∗ (0.13)B.A. 0.28∗∗ (0.14)M.A. and Ph.D. 0.33∗∗ (0.13)
Use the Internet at friends’ house 0.09 (0.06)Use the Internet in other place 0.10 (0.10)Index of diversity in computer use 0.25∗ (0.14)Index of diversity in the Internet use 1.27∗∗∗ (0.14)Index of skills of the Internet use 0.50∗∗∗ (0.15)Index of skills of computer use 0.50∗∗∗ (0.14)Intercept -1.79∗∗∗ (0.27)
Selection equation: Prob. of Internet useGender (1 if female) -0.12∗∗ (0.05)Age -0.03∗∗∗ (0.001)HH income (less than 500 eexcluded):
501 - 1,000 e -0.17 (0.16)1,001 - 1,500 e -0.13 (0.15)1,501 - 2,000 e -0.01 (0.15)2,001 - 3,000 e 0.06 (0.16)3,001 - 4,000 e 0.26∗ (0.16)> 4,001 e 0.60∗∗∗ (0.16)do not know or refuse 0.12 (0.19)
Date of adoption of a personal computer (less than one year excluded):1 - 3 years 0.08 (0.11)3 - 5 years 0.25∗∗ (0.11)5 - 10 years 0.44∗∗∗ (0.10)> 10 years 0.67∗∗∗ (0.10)does not use more -1.77∗∗∗ (0.18)never holds a computer -2.07∗∗∗ (0.13)
Intercept 1.40∗∗∗ (0.19)athrho -0.30∗∗ (0.14)
Wald test of independant equations (ρ = 0): χ2(1)
= 4.48∗∗
Log-likelihood =-3328.20N=5,603 ; censored obs.=3,141 ; uncensored obs.=2,462
robust s.e. corrected by the White method (1980)Significance levels : ∗ : 10% ∗∗ : 5% ∗ ∗ ∗ : 1%
18
the higher the skill and the diversity indexes, the higher is the probability
to use e-administration. Finally, we observe that the agents for whom the
processing cost of the administrative information is the lowest, i.e. civil ser-
vants and high-educated agents, are more likely to use e-administration. On
the one hand, the higher the level of education the higher the probability
to use on-line administrative services and, on the other, local and national
civil servants have a lower cost to process administrative information since
the probability to use e-administration is higher for this population.
Four, estimation results confirm that the people who have some financial
relations with the administration (family, unemployment) or a close rela-
tionship through on-line channels ("employee of individual") have a higher
probability to use e-administration. This result highlights the efforts of the
French administration to promote on-line interactions with those popula-
tions.
To conclude, let us recall that these results related to the use of e-
administration are robust since we control in a first step the use of the
Internet. Indeed, the determinants of using on-line administrative services
are conditional to the probability to use the Internet. In Table 5, we observe
that the explanatory variables (gender, age and date of adoption of a personal
computer) are good predictors of the probability to use the Internet.
5 Conclusion
Why do citizens decide to use on-line administrative services rather than
traditional bureaus? In order to explain this trade-off, we adopt a standard
economic approach based on individual rational choice which is mainly driven
by the relative costs of on-line administrative processes. Four main costs are
defined: access, trip, information and processing costs. Our model is tested
on a large and original dataset composed of 5,603 individuals in France in
2005. We control for the selection bias by estimating a Heckman’s model
19
which relies on the distinction between the Internet use and the e-government
use. We show that the access cost, the information cost and the processing
cost have a strong impact on the use of government websites. Moreover,
our estimation results confirm that the citizens who receive social transfers
(family and unemployment allowances) tend to use relatively more on-line
services. This result is probably driven by a supply side effect and highlights
the efforts of the French administration to foster interactions through the web
(Beauvallet et al., 2006). Our results therefore contrast with Thomas and
Streib (2003) who concluded that the digital divide is even more pronounced
among government Web site visitors than among Internet users in general.
Globally, if our contribution is a first attempt to better understand the
choice between on-line and off-line administrative channels, it remains per-
fectible on two main points. First, our dependent variable does not allow
to go deeper into the analysis of several and distinct administrative on-line
services such as information based services and transaction based services
(tax payments, etc.). Now, the choice of the channels is likely to be different
according to the nature of the administrative service. Second, our measure
of the trip cost could be significantly improve by distinguishing the type of
administration (local, national, etc.) and by introducing a more precise geo-
graphic measure of the distance between the living area of the agent and the
administration. We leave aside these issues for future researches.
20
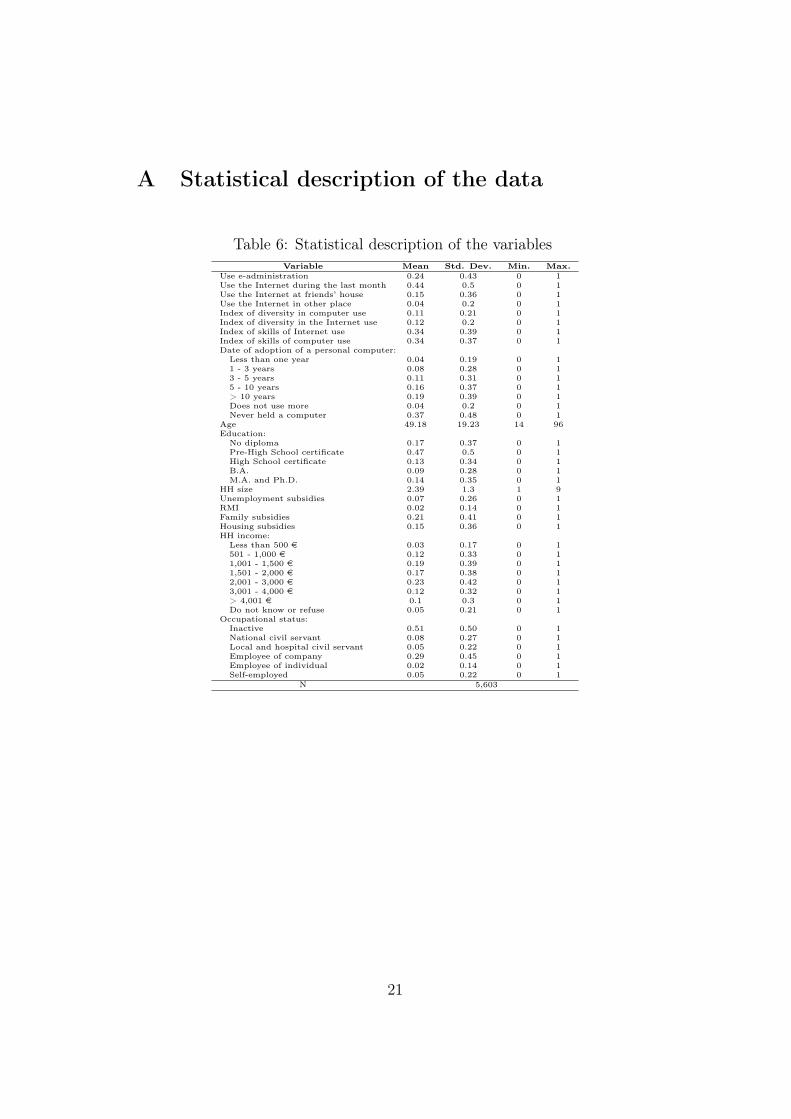
A Statistical description of the data
Table 6: Statistical description of the variablesVariable Mean Std. Dev. Min. Max.
Use e-administration 0.24 0.43 0 1
Use the Internet during the last month 0.44 0.5 0 1
Use the Internet at friends’ house 0.15 0.36 0 1
Use the Internet in other place 0.04 0.2 0 1
Index of diversity in computer use 0.11 0.21 0 1
Index of diversity in the Internet use 0.12 0.2 0 1
Index of skills of Internet use 0.34 0.39 0 1
Index of skills of computer use 0.34 0.37 0 1
Date of adoption of a personal computer:
Less than one year 0.04 0.19 0 1
1 - 3 years 0.08 0.28 0 1
3 - 5 years 0.11 0.31 0 1
5 - 10 years 0.16 0.37 0 1
> 10 years 0.19 0.39 0 1
Does not use more 0.04 0.2 0 1
Never held a computer 0.37 0.48 0 1
Age 49.18 19.23 14 96
Education:
No diploma 0.17 0.37 0 1
Pre-High School certificate 0.47 0.5 0 1
High School certificate 0.13 0.34 0 1
B.A. 0.09 0.28 0 1
M.A. and Ph.D. 0.14 0.35 0 1
HH size 2.39 1.3 1 9
Unemployment subsidies 0.07 0.26 0 1
RMI 0.02 0.14 0 1
Family subsidies 0.21 0.41 0 1
Housing subsidies 0.15 0.36 0 1
HH income:
Less than 500 e 0.03 0.17 0 1
501 - 1,000 e 0.12 0.33 0 1
1,001 - 1,500 e 0.19 0.39 0 1
1,501 - 2,000 e 0.17 0.38 0 1
2,001 - 3,000 e 0.23 0.42 0 1
3,001 - 4,000 e 0.12 0.32 0 1
> 4,001 e 0.1 0.3 0 1
Do not know or refuse 0.05 0.21 0 1
Occupational status:
Inactive 0.51 0.50 0 1
National civil servant 0.08 0.27 0 1
Local and hospital civil servant 0.05 0.22 0 1
Employee of company 0.29 0.45 0 1
Employee of individual 0.02 0.14 0 1
Self-employed 0.05 0.22 0 1
N 5,603
21
B Skill indexes about the Internet and com-
puter
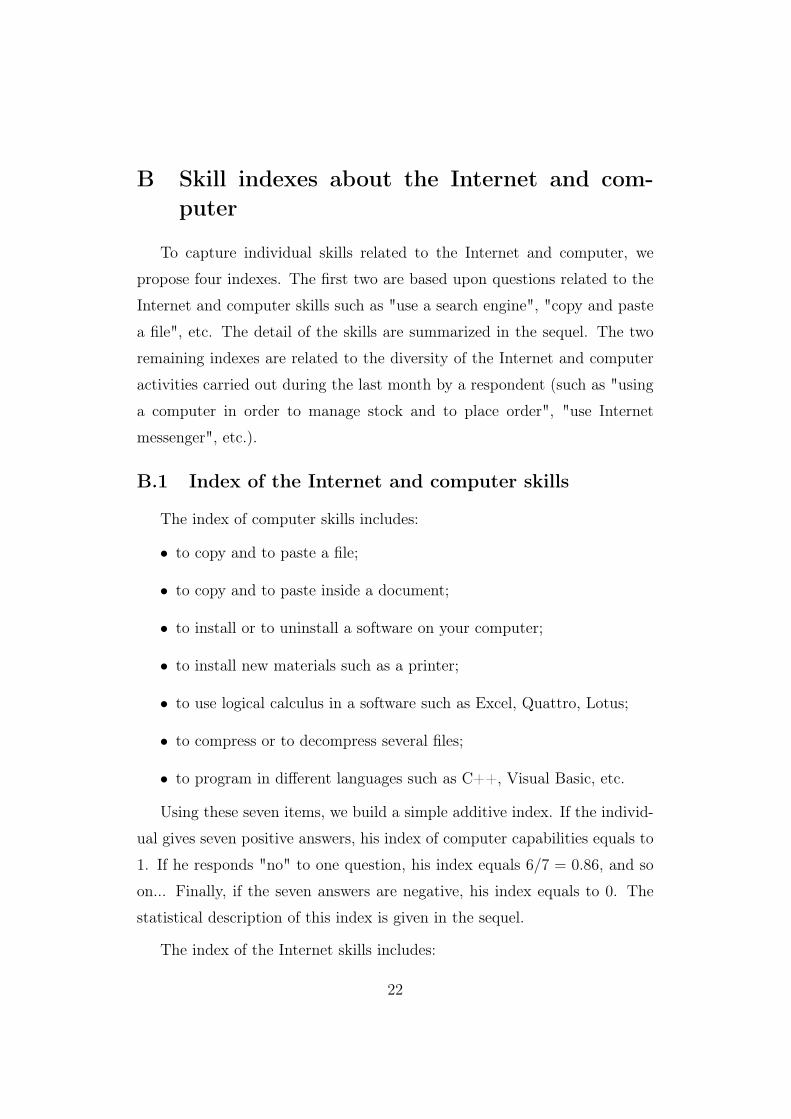
To capture individual skills related to the Internet and computer, we
propose four indexes. The first two are based upon questions related to the
Internet and computer skills such as "use a search engine", "copy and paste
a file", etc. The detail of the skills are summarized in the sequel. The two
remaining indexes are related to the diversity of the Internet and computer
activities carried out during the last month by a respondent (such as "using
a computer in order to manage stock and to place order", "use Internet
messenger", etc.).
B.1 Index of the Internet and computer skills
The index of computer skills includes:
• to copy and to paste a file;
• to copy and to paste inside a document;
• to install or to uninstall a software on your computer;
• to install new materials such as a printer;
• to use logical calculus in a software such as Excel, Quattro, Lotus;
• to compress or to decompress several files;
• to program in different languages such as C++, Visual Basic, etc.
Using these seven items, we build a simple additive index. If the individ-
ual gives seven positive answers, his index of computer capabilities equals to
1. If he responds "no" to one question, his index equals 6/7 = 0.86, and so
on... Finally, if the seven answers are negative, his index equals to 0. The
statistical description of this index is given in the sequel.
The index of the Internet skills includes:
22
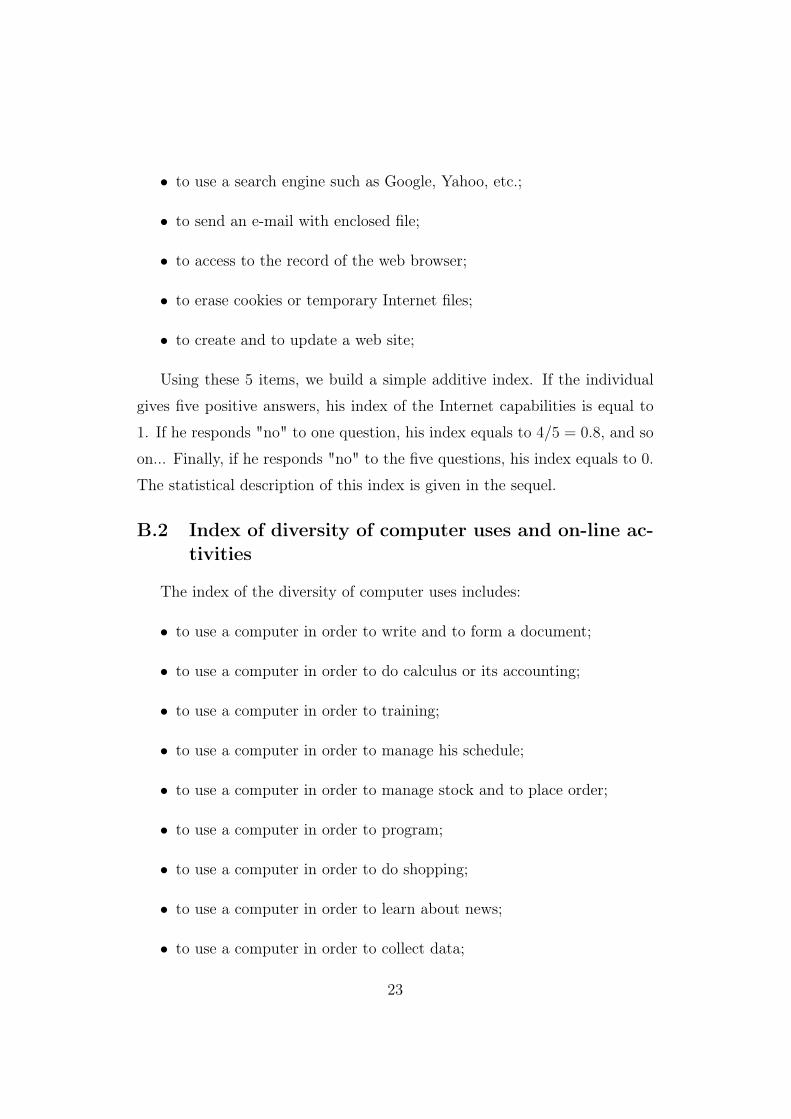
• to use a search engine such as Google, Yahoo, etc.;
• to send an e-mail with enclosed file;
• to access to the record of the web browser;
• to erase cookies or temporary Internet files;
• to create and to update a web site;
Using these 5 items, we build a simple additive index. If the individual
gives five positive answers, his index of the Internet capabilities is equal to
1. If he responds "no" to one question, his index equals to 4/5 = 0.8, and so
on... Finally, if he responds "no" to the five questions, his index equals to 0.
The statistical description of this index is given in the sequel.
B.2 Index of diversity of computer uses and on-line ac-
tivities
The index of the diversity of computer uses includes:
• to use a computer in order to write and to form a document;
• to use a computer in order to do calculus or its accounting;
• to use a computer in order to training;
• to use a computer in order to manage his schedule;
• to use a computer in order to manage stock and to place order;
• to use a computer in order to program;
• to use a computer in order to do shopping;
• to use a computer in order to learn about news;
• to use a computer in order to collect data;
23
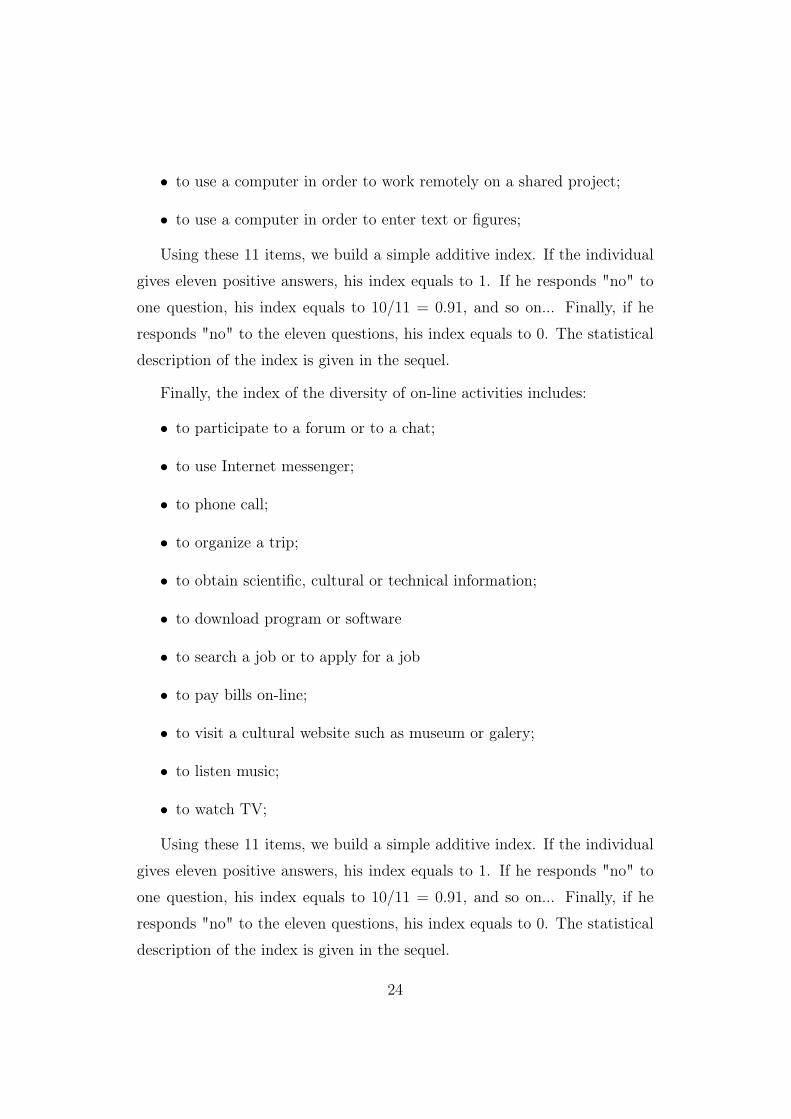
• to use a computer in order to work remotely on a shared project;
• to use a computer in order to enter text or figures;
Using these 11 items, we build a simple additive index. If the individual
gives eleven positive answers, his index equals to 1. If he responds "no" to
one question, his index equals to 10/11 = 0.91, and so on... Finally, if he
responds "no" to the eleven questions, his index equals to 0. The statistical
description of the index is given in the sequel.
Finally, the index of the diversity of on-line activities includes:
• to participate to a forum or to a chat;
• to use Internet messenger;
• to phone call;
• to organize a trip;
• to obtain scientific, cultural or technical information;
• to download program or software
• to search a job or to apply for a job
• to pay bills on-line;
• to visit a cultural website such as museum or galery;
• to listen music;
• to watch TV;
Using these 11 items, we build a simple additive index. If the individual
gives eleven positive answers, his index equals to 1. If he responds "no" to
one question, his index equals to 10/11 = 0.91, and so on... Finally, if he
responds "no" to the eleven questions, his index equals to 0. The statistical
description of the index is given in the sequel.
24
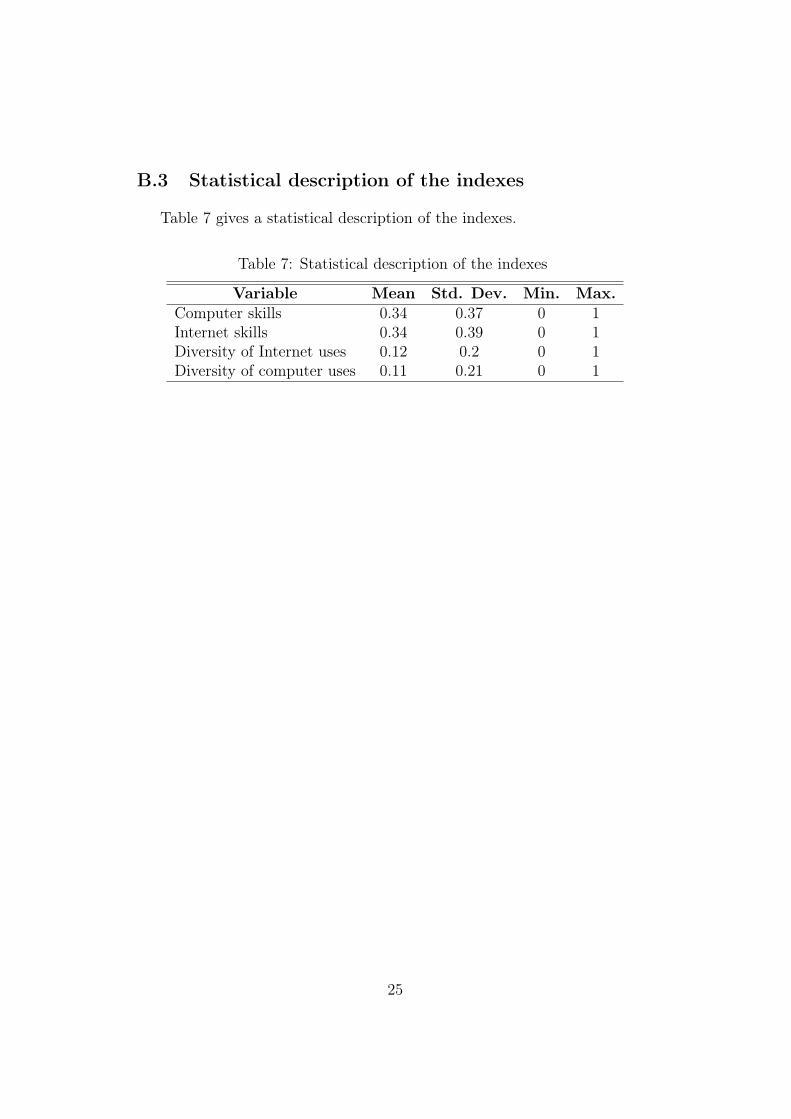
B.3 Statistical description of the indexes
Table 7 gives a statistical description of the indexes.
Table 7: Statistical description of the indexes
Variable Mean Std. Dev. Min. Max.
Computer skills 0.34 0.37 0 1Internet skills 0.34 0.39 0 1Diversity of Internet uses 0.12 0.2 0 1Diversity of computer uses 0.11 0.21 0 1
25
References
Akman I., Yazicib, A., Mishraa, A. and Arifogluc A., 2005, "E-Government:
A global view and an empirical evaluation of some attributes of citizens",
Government Information Quarterly, 22, 239-257.
Beauvallet, G., Le Garff M.C., Negri, A.L, and F. Cara, 2006, "L’usage
d’Internet par les demandeurs d’emploi", Revue de l’IRES, 52-3.
Gupta M.P., Jana D., 2003, "E-government evaluation: A framework and
case study", Government Information Quarterly, 20, 365-387.
Heeks R., Bailur S., 2007, "Analyzing e-government research: Perspec-
tives, philosophies, theories, methods, and practice", Government Informa-
tion Quarterly, 24, 243-265.
Horst M., Kuttschreuter M., Gutteling J.M., 2007, "Perceived usefulness,
personal experiences, risk perception and trust as determinants of adoption
of e-government services in The Netherlands, Computers in Human Behavior,
23, 1838-1852.
Navarro, J. and Dewhurstb F., Penalve A.J., 2007, "Factors affecting the
use of e-government in the telecommunications industry of Spain", Techno-
vation, 27, 595-604.
Pieterson W. and van Dijk J., 2007, "Channel Choice Determinants; An
exploration of the factors that determine the choice of a service channel in
citizen initiated contacts", The Proceedings of the 8th Annual International
Digital Government Research Conference, 173-182.
Puhani P., 2000, "The Heckman Correction for Sample Selection and its
Critique", Journal of Economic Surveys, 141: 53-68.
Reddick, Ch., 2005, "Citizen interaction with e-government: From the
streets to servers? Government Information Quarterly, 22, 38-57.
Schellong, A. and Mans, D., 2004, "Citizens preferences toward one-stop
government", The 2004 annual national conference on Digital Government
research, ACM International Conference Proceeding Series, Seattle, WA,
26
2004.
Thomas, J.C. and Streib, G., 2003, "The New Face of Government:
Citizen-Initiated Contacts in the Era of E-Government", Journal of Public
Administration Research and Theory, 13(1), 83-102.
Trumbull G., 2004, Silicon and the State French Innovation Policy in the
Internet Age, Brookings Institution Press.
Van de Ven W. and Van Pragg B., 1981,"The demand for deductibles in
private health insurance: A probit model with sample selection", Journal of
Econometrics, 17: 229-252.
Van Dijk J.A.G.M., Peters O., Ebbers W., 2007, "Explaining the accep-
tance and use of government Internet services: A multivariate analysis of
2006 survey data in the Netherlands", forthcoming.
White H., 1980, "A Heteroscedasticity-consistent Covariance Matrix Esti-
mator and a Direct Test for Heteroscedasticity", Econometrica, 48: 817-838.
27
Related Documents