POLICY RESEARCH WORKING PAPER 2816 Explaining the Migration of Stocks from Exchanges in Emerging Economies to International Centers Stijn Claessens Daniela Klingebiel Sergio L. Schmukler The World Bank r Development Research Group Macroeconomics and Growth March 2002 Public Disclosure Authorized Public Disclosure Authorized Public Disclosure Authorized Public Disclosure Authorized

Welcome message from author
This document is posted to help you gain knowledge. Please leave a comment to let me know what you think about it! Share it to your friends and learn new things together.
Transcript

POLICY RESEARCH WORKING PAPER 2816
Explaining the Migration of Stocksfrom Exchanges in Emerging Economies
to International Centers
Stijn Claessens
Daniela Klingebiel
Sergio L. Schmukler
The World Bank rDevelopment Research GroupMacroeconomics and GrowthMarch 2002
Pub
lic D
iscl
osur
e A
utho
rized
Pub
lic D
iscl
osur
e A
utho
rized
Pub
lic D
iscl
osur
e A
utho
rized
Pub
lic D
iscl
osur
e A
utho
rized

POLICY RESEARCH WORKING PAPER 2816
Abstract
Claessens, Klingebiel, and Schmukler study the show that these factors also drive the degree with whichdeterminants of the growing migration of stock market capital raising, listing, and trading have been migrating toactivity to international financial centers. They use a international financial centers. As fundamentals improvesample of 77 countries and document that higher and technology advances, this migration will likelyeconomic growth and more macroeconomic stability increase and domestic stock market activity may becomehelp stock market development. Countries with higher too little to support local markets. For many emergingincome per capita, sounder macroeconomic policies, economies, the best policy is to establish soundmore efficient legal systems, better shareholder fundamentals but not necessarily the trading, or evenprotection, and more open financial markets tend to listing of securities locally.have larger and more liquid stock markets. The authors
This paper-a product of Macroeconomics and Growth, Development Research Group-is part of a larger effort in thegroup to understand financial globalization and capital market development. Copies of the paper are available free fromthe World Bank, 1818 H Street NW, Washington, DC 20433. Please contact Emily Khine, room MC3 -347, telephone 202-473-7471, fax 202-522-3518, email address [email protected]. Policy Research Working Papers are also posted onthe Web at http://econ.worldbank.org. The authors may be contacted at [email protected], [email protected], [email protected]. March 2002. (38 pages)
The Policy Research Working Paper Series disseminates the findings of work in progress to encourage the exchange of ideas aboutdevelopment issues. An objective of the series is to get the findings out quickly, even if the presentationzs are less than fully polished. Thepapers carry the names of the authors and should be cited accordingly. The findings, interpretations, and conclusions expressed in thispaper are entirely those of the authors. They do not necessarily represent the view of the World Bank, its Executive Directors, or thecountries they represent.
Produced by the Research Advisory Staff

Explaining the Migration of Stocks from Exchangesin Emerging Economies to International Centers
by
Stijn Claessens, Daniela Klingebiel, and Sergio L. Schmukler
JEL classification codes: G15, G18, G20
Keywords: stock exchange development; intemationalization of financial markets;trading migration; emerging economies; cross-listing; ADRs; GDRs
University of Amsterdam and CEPR, World Bank, and World Bank respectively. We would like to thankKen Kavajecz, Andrew Karolyi, Benn Steil, and Ruben Lee for useful comments, and Ying Lin, FranciscoVazquez, and especially Tatiana Didier for their research assistance. For help with the data, we are gratefulto Pamela Dottin, Monica Erpen, Dori Flanagan, Gregorio Impavido, Himmat Kalsi, Eung Kim, AngelaMarshall, Alberto Musalem, Richard Webster-Smith, and Cheryl Workman. For financial support, we aregrateful to the World Bank Latin American Regional Studies Program and Research Support Budget. Thefindings, interpretations, and conclusions expressed in this paper are entirely those of the authors and donot necessarily represent the views of the World Bank. Email addresses: stijn(aJ,fee.uva.nl,dklingebiel(d.worldbank.org, and sschmukler(d)worldbank.org.

1. Introduction and motivation
Financial markets, and especially stock markets, have grown considerably indeveloped and developing countries over the last two decades. Better fundamentals(higher economic growth, more macro stability), structural reforms (notably privatizationof state-owned enterprises), and specific policy changes (notably domestic financialreform and capital account liberalization) have aided in their growth. Globalization hasalso advanced in the last two decades with increased cross-border capital flows, tighterlinks among financial markets, and greater commercial presence of foreign financial firmsaround the world.
An element of the globalization trend has been the migration of stock exchangeactivities abroad, particularly in the case of emerging markets. Many firms from emergingeconomies now cross-list on international exchanges. Depositary Receipts (DRs), forexample, are increasingly popular instruments.' In 1999, U.S. $533 billion in DRs wererecorded on the New York Stock Exchange (NYSE) alone. And some $29 billion in newequity was raised through DRs in 2000 through 115 depositary receipt offerings in theUnited States and European markets, a 32 percent increase over 1999. Trading has alsobeen migrated abroad and local stock exchanges have seen liquidity diminish. Trading inAmerican Depositary Receipts (ADRs) amounted in 2000 to $1,185 billion or some 17percent of trading in corresponding local exchanges.
Advances in technology have further accelerated the globalization trend. Inparticular, remote access to trading systems is ubiquitous, implying that the servicesoffered by stock exchanges can now easily be accessed from anywhere, including firmshaving their stocks traded on international exchanges while still being easily accessible tolocal investors. Given the network properties of stock exchanges, high liquidity furtherincreases the value of additional transactions at exchanges such as New York or London,leading to more concentration of order flow and further increasing liquidity at theseexchanges. Migration of trading abroad is putting pressure on many local exchanges,especially in Latin America, but also elsewhere, such as in Central Europe as volumesdecline and income from trading activities is reduced.
' There are different alternatives to cross-list domestic stocks in international financial markets. Atraditional way is to cross-list the share at another exchange. European companies use this methodof intemationalization most often. A very popular way to internationalize among emergingmarkets' firms during the 1990s is through depositary receipts, called American DepositaryReceipts (ADRs) or Global Depositary Receipts (GDRs). These are foreign currency-denominatedderivative instruments, issued by international banks like Bank of New York or Citibank,representing home securities held with a local custodian. DR programs grow or shrink dependingon demand, since the issuance of DRs and the conversion back to the underlying shares onlyinvolve a small transaction cost. DRs trade in intemational markets. For example, U.S. dollar-denominated ADRs from Mexican companies trade at the New York Stock Exchange. A morerecently introduced mechanism is the global registered share (GRS), used by large multinationalfirms; see Karolyi (2001) for an analysis of a recent case. Karolyi (1998) and Pulatkonak andSofianos (1999) provide more details and a complete review of the options to list internationally.
2
Going forward, these global trends are likely to accelerate as access to informationimproves, standards--concerning corporate governance, listing and accounting-arefurther harmonized, technology further advances and intermarket linkages increase. Thesetrends are raising questions on the emphasis countries need to place on developing theirown stock exchange as means to assure efficient resource mobilization and allocation fortheir corporate sectors. To shed light on the costs and benefits of these trends, it isnecessary to address a number of related questions. How have stock markets developedaround the world and what factors drive their general development? Are the trends ofinternationalization common across all regions and countries? Which factors affectinternationalization in particular? Is the increased migration a function of improvedfundamentals or a reflection of corporations fleeing domestic financial systems that areinstitutionally weak and have a limited investor base? Does the degree of migrationdepend on the size of the local market?
The answers to these questions require an analysis of the determinants of stockmarket development across the globe, the causes of internationalization, and the effects onlocal exchanges. This paper investigates some of these questions by describing andanalyzing the patterns and determinants in market capitalization and trading domesticallyfor 77 countries between 1975 and 2000. Using individual firm data starting from 1983on, we aggregate for each country and year individual capitalization, trading, and capitalraising figures of all international companies to get different measures of the degree ofinternationalization. We then analyze the three components of the internationalizationprocess-listing, trading, and capital raising-for a large cross-section of countries, reporton the factors driving these components, and compare these factors to those driving stockmarkets development in general.
We find that there are a (small) number of fundamental factors that affect in asimilar way both the development of the local market as well as the degree to whichcountries participate in international markets. As countries improve their fundamentals,stock exchange activity increases, but so does the share of activity taking place abroad.This suggests that the two are complementing processes: as better fundamentals allowlocal markets to develop, so will there also be an increased tendency for firms to accessglobal exchanges. But there will be limits of increased local development beingassociated with an increased share of offshore activity. Migration of a major share ofmarket capitalization and value traded may have adverse consequences for remainingcompanies' liquidity (Levine and Schmukler 2001). Large scale migration may also makeit more difficult to sustain a fully fledged local stock exchange, in a narrow sense-to payfor the fixed overhead of maintaining trading, clearing, and settlement systems, amongother things-and in a broader sense-to generate enough order flow for local brokers andenough business for local investment banks, accounting firms, and other supportingservices.
Policy implications of these findings are that countries will need to continue toimprove fundamental factors such as shareholder protection and the quality of local legalsystems-to make it more attractive for any investor to buy shares and thus to make iteasier for firms to list in public markets, have their shares properly valued and, trade
3

liquidly. Our results also imply that countries do not face a choice between local andinternational exchanges: improving fundamentals will lead to more activity, but most ofthis activity will go abroad as better fundamentals also accelerate the degree of migration.
The implications are that countries will be best off facilitating as much as possiblethe access of their firms to international exchanges-by removing regulatory barriers andharmonizing standards-to allow them to reap the gains from more liquid exchangesoverseas. Moreover, tighter links or even mergers with global exchanges may benecessary as not doing so will lead to a sure decline of the local market. This does notnecessarily mean that there is not a role whatsoever for local exchanges; there may still bea role for a locally provided mechanism that allows firms to come to the market for thefirst time.
The paper is structured as follows. Section 2 reviews the related literature. Section3 provides a description of the data and illustrates some of the main trends in stock marketdevelopment and the degree of internationalization over time and across our sample ofcountries. Section 4 reports provides the results of the regressions that try to explain thecapitalization, listing, capital raising, and trading trends, both domestic and abroad.Section 5 concludes.
2. Review of related literature
We study several aspects of stock market development: market capitalization,listing, degree of new capital raising, and trading value. We study most of these aspectsboth from the domestic and international side. Some of these aspects of stock marketdevelopment have been studied in several research strands. We discuss these strands herebriefly.
The determinants of financial sector development have become a much-researchedarea lately.2 King and Levine (1993) La Porta, Lopez-de-Silanes, Shleifer, and Vishny(1998), Rajan and Zingales (1998), Beck, Demirguc-Kunt, Levine, and Maksimovic(2001), Henry (2000a an 2000b), Bekaert, Harvey, and Llundblad (2001), Demirguc-Kuntand Levine (2001), and a number of others have analyzed the legal foundations offinancial markets. They have also studied the relation of financial market developmentwith macroeconomic variables, financial reform, and other country factors, and therelations among the development of the various parts of a financial system. The generalfinding is that financial markets tend to develop as income per capita grows and financialreform progresses. Stock market development specifically has been shown to depend on agood legal system, particularly minority rights that are being enforced. Stock marketdevelopment also appears to complement the development of other parts of the financialsystem and be complementary to other forms of finance in affecting growth, both at theaggregate level as well at the individual firm level.
2 See Levine (1997) for an earlier review.
4
The determinants of stock market capitalization have been analyzed for specificgroups of countries in some papers. Catalan, Impavido, and Musalem (2000) examine thedeterminants of stock market development for OECD and some emerging markets,studying 27 countries in total. They find that, apart from macro stability and legal rights,the size of the institutional investor bases positively affects stock market development,and report evidence of a causal times series relation between institutional investors andstock market development. Claessens, Djankov, and Klingebiel (2001) investigate thedevelopment of stock markets in a panel oiF transition economies and highlight the role ofprivatization for stock market development in this sample of countries. Perotti and vanOijen (2000) also study privatization and find an indirect positive relation of a program ofprivatization-through political risk reduction-on stock market development in a sampleof 31 emerging economies.
Papers have focused less on the factors determining trading behavior, although theliquidity of the stock market has been found to be a useful predictor of future economicgrowth (Levine and Zervos 1998). In part this reduced attention on trading may bebecause there are large differences across otherwise similarly developed countries in thedegree to which stocks are traded. Some emerging markets, South Korea and Taiwan, forexample, have much higher trading volumes than many developed countries, while tradingin other emerging markets is much lower than that in most developed countries. These,presumably institutional-driven differences have made it more difficult to come up withexplanatory factors for trading intensity. One of the few cross-country studies on tradingis Domowitz, Glen, and Madhavan (2001 a). They document the relations betweenturnover, equity trading costs, and volatility, and investigate the determinants of domestictrading. They show, among other things, that turnover is inversely related to trading costs,providing a possible explanation for the increase in turnover in recent years as direct costs(commissions, fees) have declined. Jain (2001) analyzes the effects of differentinstitutional designs for stock exchanges and trading systems such as tick size, tradingmechanism, and order flow rules-on bid-ask spreads, volatility, and trading turnover.
The determinants of (new) domestic offerings at the firm level have been muchstudied. Pagano, Panetta, and Zingales (1998), for example, provide a recent review andanalysis of why companies go public. Subrahmanyam and Titman (1999) extend thisliterature to a cross-country context by developing a model of the relation between thegoing public decision and local financial rnarket development. Empirically, Domowitz,Glen, and Madhavan (200 lb) study the determinants of aggregate new offerings (domesticand abroad), covering both debt and equity on a cross-country basis. They find thatcomplex and significant intertemporal correlations exist among various financing choices.The level of overall primary market activity across countries is related to the accountingframework, the level of investor protection, and the extent of access to the local market forforeign investors. They also find that plivatization influences foreign offerings anddomestic bond market development.
The means and motivations for listing abroad have been studied for different groupsof firms and countries. Ljungqvist, Jenkinson, and Wilhelm (2000) investigate the costsand benefits of global integration of primary markets associated with the spread of U.S.
5
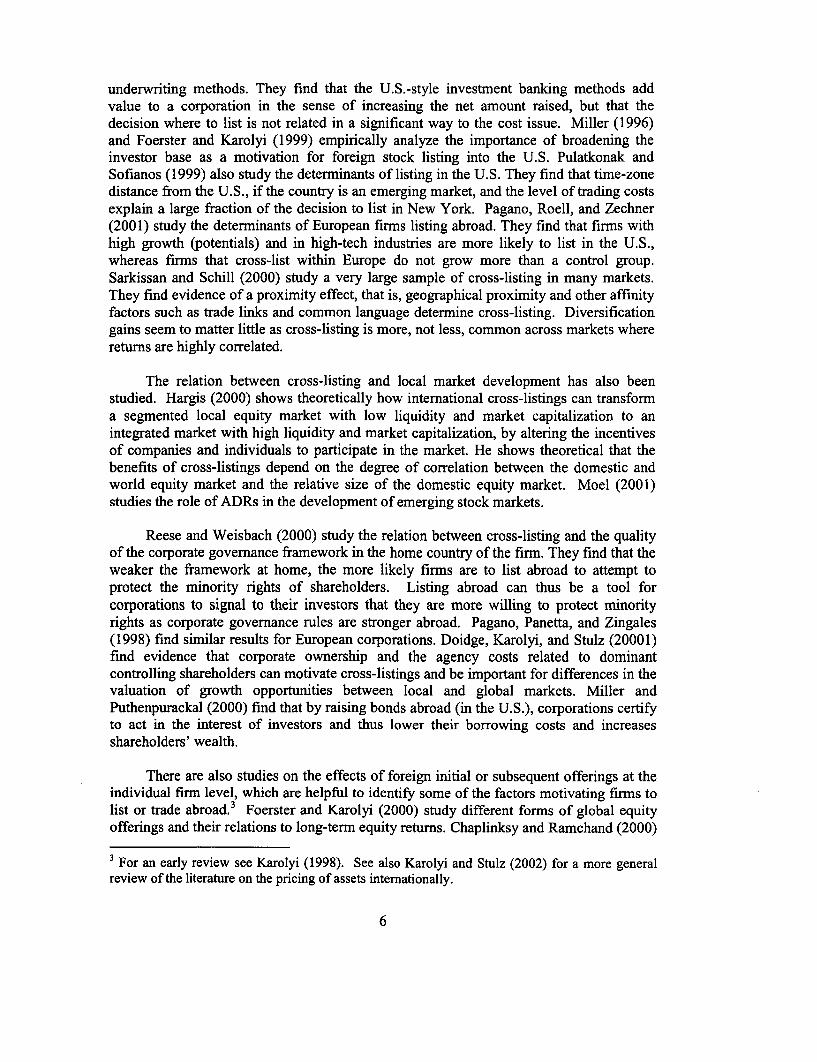
underwriting methods. They find that the U.S.-style investment banking methods addvalue to a corporation in the sense of increasing the net amount raised, but that thedecision where to list is not related in a significant way to the cost issue. Miller (1996)and Foerster and Karolyi (1999) empirically analyze the importance of broadening theinvestor base as a motivation for foreign stock listing into the U.S. Pulatkonak andSofianos (1999) also study the determinants of listing in the U.S. They find that time-zonedistance from the U.S., if the country is an emerging market, and the level of trading costsexplain a large fraction of the decision to list in New York. Pagano, Roell, and Zechner(2001) study the determinants of European firms listing abroad. They find that firms withhigh growth (potentials) and in high-tech industries are more likely to list in the U.S.,whereas firms that cross-list within Europe do not grow more than a control group.Sarkissan and Schill (2000) study a very large sample of cross-listing in many markets.They find evidence of a proximity effect, that is, geographical proximity and other affinityfactors such as trade links and common language determine cross-listing. Diversificationgains seem to matter little as cross-listing is more, not less, common across markets wherereturns are highly correlated.
The relation between cross-listing and local market development has also beenstudied. Hargis (2000) shows theoretically how international cross-listings can transforma segmented local equity market with low liquidity and market capitalization to anintegrated market with high liquidity and market capitalization, by altering the incentivesof companies and individuals to participate in the market. He shows theoretical that thebenefits of cross-listings depend on the degree of correlation between the domestic andworld equity market and the relative size of the domestic equity market. Moel (2001)studies the role of ADRs in the development of emerging stock markets.
Reese and Weisbach (2000) study the relation between cross-listing and the qualityof the corporate governance framework in the home country of the firm. They find that theweaker the framework at home, the more likely firms are to list abroad to attempt toprotect the minority rights of shareholders. Listing abroad can thus be a tool forcorporations to signal to their investors that they are more willing to protect minorityrights as corporate governance rules are stronger abroad. Pagano, Panetta, and Zingales(1998) find similar results for European corporations. Doidge, Karolyi, and Stulz (20001)find evidence that corporate ownership and the agency costs related to dominantcontrolling shareholders can motivate cross-listings and be important for differences in thevaluation of growth opportunities between local and global markets. Miller andPuthenpurackal (2000) find that by raising bonds abroad (in the U.S.), corporations certifyto act in the interest of investors and thus lower their borrowing costs and increasesshareholders' wealth.
There are also studies on the effects of foreign initial or subsequent offerings at theindividual firm level, which are helpful to identify some of the factors motivating firms tolist or trade abroad.3 Foerster and Karolyi (2000) study different forms of global equityofferings and their relations to long-term equity returns. Chaplinksy and Ramchand (2000)
3 For an early review see Karolyi (1998). See also Karolyi and Stulz (2002) for a more generalreview of the literature on the pricing of assets internationally.
6

show that global offers are effective in expanding demand and reducing the price pressureeffects associated with share issuance. Lins, Strickland, and Zenner (2001) show thatfirms from emerging markets that use DRs or list on the U.S. equity markets see theirfinancing constraints relaxed, in the sense that their sensitivity of new investment tointernal cash flow is reduced. Schmukler and Vesperoni (2001a and 2001b) also find thatdomestic firms that participate in international markets obtain better financingopportunities and extend their debt maturity.
Reese and Weisbach (2000) also study the effects of cross-listing on subsequentequity offerings and find that offerings increase following cross-listing, especially fromlower shareholder protection countries. Baker, Nofsinger, and Weaver (1999) show thatinternational cross-listings raise firm visibility, increasing analyst coverage and mediaattention. This is turn may lead to lower cost of capital, although they do not study this.Doidge (2001) shows that following listing in the U.S., foreign firms' ownership becomesless concentrated with reduced family and management control and more publicownership. Changes in ownership concentration may have implications for the degree oftrading as the free float is increased with foreign listing.
There are also some firm- and country-specific studies on the effects of tradingmigrating abroad. Karolyi (2001) studies the effects of different institutionalarrangements on trading for the case of DaimlerChrysler, a single global registered share,in Frankfurt and New 'York. He finds that the structure of the global share facility cannotbe credited with improvements in liquidity nor can it be blamed for the flow-back toFrankfurt, suggesting that the gains from cross-listing in terms of trading and pricediscovery are not obvious.
Lastly, our work relates to the analysis of the determinants, structure, and evolutionof trading systems, and possible impacts of changes in trading systems on marketcapitalization, turnover, and migration. Clayton, Jorgensen, and Kavajecz (1999) find,studying 248 financial exchanges, that the main determinants for exchange formation arethe degree of freedorn in the country, the size of its economy, the availability oftechnology and the quality of its legal system. Schmiedel (2001) analyzes the technicalefficiency of financial exchanges in Europe. He finds statistically significantinefficiencies, on the order of 20-25 percent, which can be explained, among others, bysize. Not meeting a minimum size for efficient provision of trading services, combinedwith increased cross-border flow of informiation and capital, may thus be a motivatingfactor for the migration abroad and the trend towards consolidation of trading systems.Domowitz and Steil (1999) highlight the impact of a reduction in trading costs, asexperienced in many markets, on turnover directly, and the much more important indirecteffects of a reduction in trading costs on the cost of equity. Steil (2001) analyzes theeffects of technological advances on securities trading industries globally, with particularemphasis on the implications for developing countries. These last studies also discuss theglobal trends towards consolidation in trading systems and associated clearing andsettlement systems, in part as responses of increased competition among exchanges.
7
As evident from this review, there is a wide range of research studies on thedevelopment of local capital markets and the internationalization of equity markets.However, as far as we know, there is no study that analyzes which factors explain theinternationalization of stock exchange activity relative to the development of localexchange activity and the implications of this migration abroad for local exchanges.Furthermore, while it is generally believed that trading is more liquid in internationalexchanges than in most local exchanges, no cross-country studies exist on the degree anddeterminants of liquidity of local shares in international markets. We believe that theseissues are addressed for the first time in this paper.
3. Data
This section describes the data used in the paper. First, we discuss the data sources.Second, we present summary statistics of the variables under study.
3.1 Data sources
As noted above, we are interested in several aspects of the development of stockexchanges: market capitalization, listing, trading volume, and degree of new capitalraising. For all, we are interested in both the domestic and foreign dimension. Gettingdata and documenting these various trends is not easy, however, especially as we want tobe as comprehensive as possible and cover as many countries and as long a times series aspossible. While there are several data sources on market capitalization and tradingvolumes that cover a large number of countries, there is no comprehensive database on thedegree of new capital raising domestically. There is even less comprehensive dataavailable on the degree to which securities are being listed and traded abroad and thedegree of capital raising in foreign markets. We therefore need to combine a number ofsources. The list of countries covered and the groupings by income level are provided inAppendix Table I, while the data sources are detailed in Appendix Table II.
On domestic activity, the dollar amounts of market capitalization and value tradedon the major domestic stock exchanges come from the International FinanceCorporation's (IFC's) Emerging Markets Factbook, now named the Standard & Poor'sEmerging Markets Database. These data have typically been used to measure theimportance of stock markets in financial systems around the world, the contribution ofstock markets to firm financing, and the relation between stock markets development andeconomic growth. The data cover only the major stock exchange in the country. The dataalso only cover listing and trading on formal, organized public exchanges and ignores anyover-the-counter trading and other markets' trading. As such, it underestimates thecountry's total market activity. The value of new equity issued on the respective localstock exchange is the total value of public offerings and rights issued during the period,excluding stock dividends or bonus shares that do not raise cash. Its source is also theStandard & Poor's Emerging Markets Database. The dataset on domestic activity coversthe period January 1975 - November 2000 for 82 countries, but the maximum number ofcountries that we analyze is 77 due to data availability on other variables.
8
On foreign activity, we have data from Bank of New York, which covers the threemajor stock exchanges in the U.S.: NYS]E, NASDAQ, and AMEX. The base list ofcompanies with DR programs comes from two Bank of New York sources: the CompleteDR Directory and a database with the value traded at the ticker level. These two datasetscontain the list of current DR programs and the effective date of each program. As ofMarch 2001, there we:re a total of 2,206 listed programs. The DR Directory includes allcurrently active programs, dating back to January 1956, with most of them being initiatedafter 1980. The resulting database accounts for 1,951 active DR programs from 1,524firms in 80 countries. However, these two databases do not include DR programs thatwere terminated before March 2001. To account for these programs, we use an additionaldatabase, also provided by Bank of New York, that lists all terminated DR programs (650programs in total as of January 31, 2001). T he set of terminated DR programs relevant forour study amounts to 214 firms that are added to the list of firms with DR programs.
In terms of trading abroad, we focus on trading in DRs. One dataset on DR valuetraded comes also from Bank of New York and covers the period 1989 - November2000.4 Companies that are not shown to be trading according to Bank of New York areassigned a zero. We also have data on value traded by foreign firms on the London StockExchange (LSE) for 45 countries for the period January 1998 - November 2000. Thevalues reported by LSE were converted to current U.S. dollars using the average monthlyexchange rates as reported in the International Financial Statistics from the InternationalMonetary Fund (IMF). However, given that the time span of the LSE data is much morelimited, we focus our analysis on the Bank of New York data on DR trading in NewYork.5
On capital raised abroad, we use a combination of two different datasets. Onecomes from the Bank of New York, which covers capital raised though depositary receiptsfor the period May 1980-November 2000. It contains 1,178 operations from 864 firms in54 countries. The other dataset covers all operations of capital raised in internationalmarkets by firms and is compiled by Euromoney. This database provides a morecomprehensive account of capital raised, because it includes DR programs and cross-border listings. It reports 8,795 operations from 5,665 firms in 86 countries, covering theperiod January 1983 - April 2001. By combining these two datasets, we create a series oncapital raised in foreign markets.6 Capital raised abroad, as we define it, thus refers to thesum of the amount of new equity financing which is obtained by using a non-domesticinstrument, such as a foreign listing or an ADR, and any new equity issue abroad.
The data from Bank of New York and Euromoney allow us to construct a list of the"international" companies for each country. These are companies that cross-list, directlyor via DRs, or raise capital in international stock markets. We use this variable to study
4 Using these data, we extrapolate the amount traded in December 2000 to obtain an estimate forthe value traded abroad during 2000.S Since we have only data for trading in ADRs, we cannot study whether differences in forms ofinternationalization (e.g., cross-listing, ADRs/GD)R, versus global shares) matter for the liquidity.6 The use of both data sets help us, to some extent, cross check the data, obtain missinginformation, and correct reporting errors.
9
the degree of listing on international exchanges. In fact, this variable is more general,because it also captures capital raising without listing. We do not, however, consider thedegree to which foreign investors hold shares traded in local markets as an indication ofinternationalization of the firm. It would be almost impossible to construct such a seriesbecause most countries do not distinguish between local and foreign investors in thedomestic market. Similarly, we do not consider to what degree domestic residents holddomestic shares in the international markets.
3.2 Descriptive statistics
Based on the data compiled, we focus on eight variables of interest, three for thedevelopment of local stock exchanges and five for the internationalization of stockexchanges. The former are market capitalization over gross domestic product (GDP),value traded domestically over GDP, and value traded over market capitalization (alsoknown as turnover ratio). The latter are market capitalization of internationalfirms overtotal market capitalization (here equal to the domestic market capitalization),' valuetraded abroad over GDP, value traded abroad over value traded domestically, capitalraised abroad over GDP, and capital raised abroad over capital raised domestically. Inall cases we work with annual data. Stock data are all end-of-year data. We exclude theU.S. and U.K. markets, as they are the international financial centers on which basis wedefine a firm's internationalization.
The variable market capitalization of international firms over total marketcapitalization captures the degree of listing on intemational stock exchanges. Thenumerator of this variable is the sum of market capitalization of firms defined asinternational, according to the criteria described above. The variable value traded abroadover value traded domestically shows the relative importance of international activity.Both an increase in international trading and a decrease in local trading will produce a risein this variable. To isolate these effects, we also look at another variable, value tradedabroad over GDP. The same applies to capital raised.
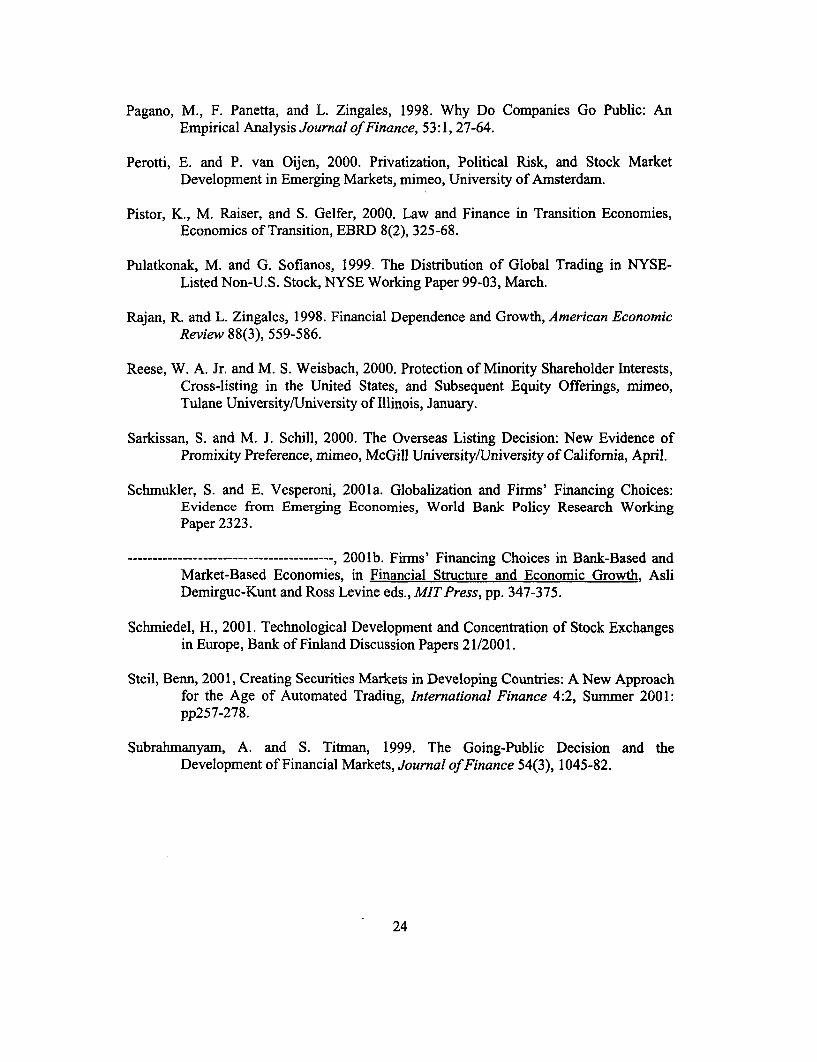
Tables 1, 2, and 3 provide descriptive statistics on the eight variables for the years1990 and 2000. We also use three figures to describe the aggregate trends in the data overtime and by country groupings. Figure 1 plots market capitalization as a ratio to GDP anddomestic value traded as a ratio to GDP and as a ratio to market capitalization. Figures 2and 3 plot the variables related to the internationalization of stock exchanges. Thosefigures differentiate trends by groups of countries according to income level.
As is well known, Figure 1 shows that there has been a gradual increase in marketcapitalization for all three groupings, with an acceleration in the 1990s for the high-income countries. Table 1 shows that, for all countries combined, the ratio of market
7 As total market capitalization we use the market capitalization in the domestic market. Thisincludes shares that are traded domestically and shares that are traded internationally through DRs.It does not capture the market capitalization of companies cross-listed in international stockexchanges (what is difficult to obtain), so our measure is an underestimate of the true total marketcapitalization.
10
capitalization to GDP increased from a mean (median) of 31 (18) percent in 1990 to some62 (34) percent in 2000. This increase in market capitalization reflects both generallyhigher prices for existing stocks as well as increased number of listings. For high-incomecountries, for example, the average number of companies listed on a domestic exchange ina country increased from 703 in 1990 to 900 in 1999. Taking a longer perspective, therelative increase in niarket capitalization has been the most pronounced in high-incomecountries, with a six-fold increase in the average ratio of market capitalization to GDPbetween 1975 and 2000, from 22 percent to close to 117 percent (see Figure 1). In low-income countries, there has been a quadrupling in market capitalization, from 5 percent to20 percent of GDP. In middle-income countries, however, market capitalization did notincrease much, only from 37 percent to 45 percent of GDP. These countries seem to havelost out in the 1990s, increasing their market capitalization by only 8 percentage points,when stock markets in high-income countries grew by some 75 percentage points (Table1). Middle-income and low-income countries end up with market capitalization in 2000much below that of high-income countries, on average 70 and 100 percentage pointsrespectively less.
Yet these averages hide some differences within the groups. On the basis of themedian, for example, middle-income countries saw a doubling in market sizes over the1990s, while the mean market size only increased by a quarter, as some markets increasedvery little, if at all. There are also large differences among regions in the size of marketsand their growth.8 Among emerging markets, East Asian countries have still the largestmarkets relative to GDP, although growing at a slower pace relative to transitioneconomies and Latin American countries. Transition economies have seen fast growth inmarket capitalization, but from very low or non-existing bases, and are currently the groupwith the lowest average market capitalization. Following a period of rapid increase in thelate 1980s, Latin American markets continued growing, but their markets are still only onethird (relative to GDP) of those in East Asia. More generally, there are large differencesaround the world. The country with the highest aggregate stock market capitalizationrelative to their GDP in our sample in 2000 is Hong Kong, with a stock marketcapitalization of 383 percent; the country with the lowest market capitalization isBangladesh with 2.5 percent.
Value traded as a ratio to GDP has grown strongly in the high-income group with analmost 20-fold increase over the 1975-2000 period. Growth has been much lesspronounced in the middle- and low-income group with only a ten-fold increase. Thegrowth patterns in value traded mimic those in market capitalization as they mainlycapture the overall growth of markets (see Figure 1). As before, low-income countriesand middle-income countries have much lower ratios of value traded to GDP than high-income countries do. There are again large variations between countries, however. Somemiddle-income countries had very high value traded for some years. For Taiwan in 1988,for example, the ratio of value traded to GDP was 224 percent. In 2000, value traded inEast Asian countries was 87 percent of GDP, while in Eastern Europe and Latin Americait was only about 4 percent. The relative slow growth of value traded during the 1 990s in
8 To save space, we do not report tables or figures with the numbers for different regions orcountries. We just highlight some of the interesting results in the text.
11

Latin America might be explained by limited price increases, de-listings, and migration oftrading abroad.
The pattern is different, however, when comparing value traded relative to marketcapitalization. Here the distinction between the three groups is less strong. Nevertheless,high-income countries have generally more liquid markets than middle-income countriesdo and middle-income countries in turn tend to have more liquid exchanges than low-income countries do. The mean value traded ratio in 2000 was 86 percent for high-incomecountries, 47 percent for middle-income countries, and 29 percent for low-incomecountries (Table 1). For all three groupings, value traded as a fraction of marketcapitalization has risen, especially in the second half of the 1990s, the fastest for themiddle- and high-income countries. Differences between countries remain large,however, with many middle-income countries having higher value traded ratios than high-income countries on average do.
Figures 2 and 3 plot a number of internationalization indicators, with somedescriptive statistics of the data provided in Tables 2 and 3. Figure 2 and Table 2 displaythree indicators of the relative importance of internationalization: market capitalization ofinternational firms relative to market capitalization of all firms, value traded abroadrelative to GDP, and value traded abroad relative to value traded domestically. Figure 3and Table 3 provide two other indicators of the degree of internationalization: capitalraised abroad over GDP and capital raised abroad over capital raised domestically. Again,the indicators are split by the three groups of countries.
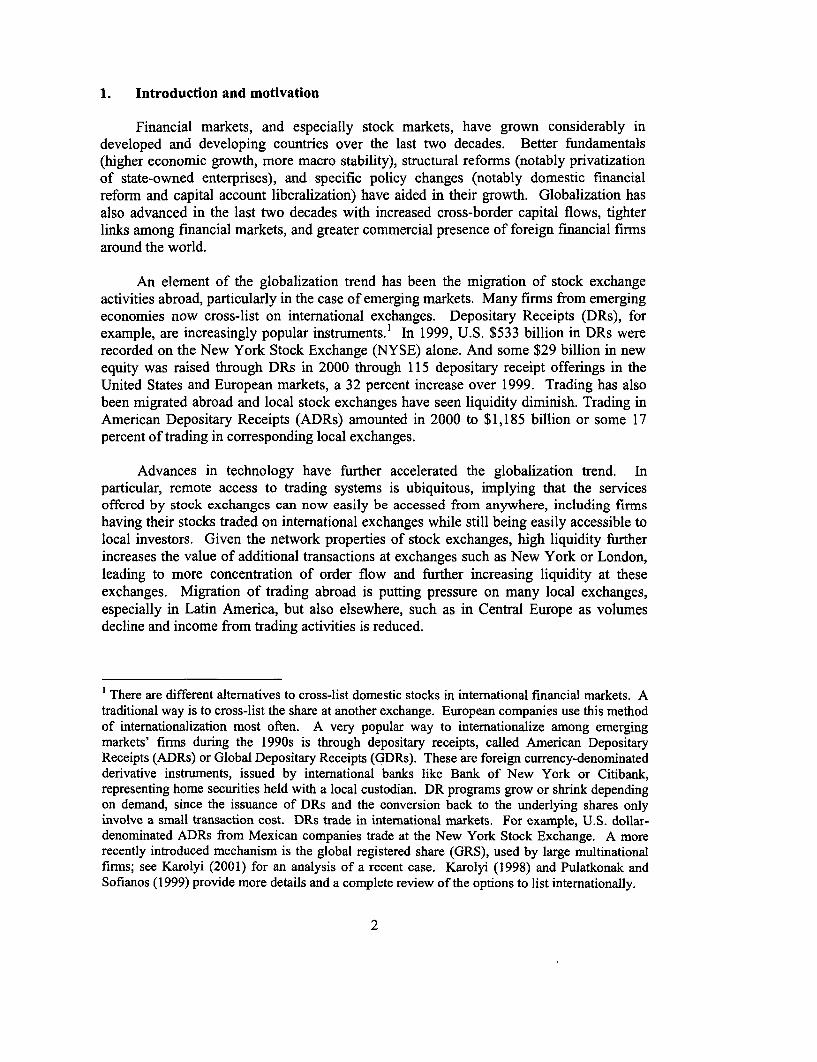
The plot of the ratio of market capitalization listed abroad to total marketcapitalization shows clearly how strong the internationalization trend has been over thepast few years, especially for middle-income countries. For these economies, the ratio ofmarket capitalization listed abroad to total market capitalization jumped from only a fewpercentage points in 1989 to about half, with a peak of over 62 percent in 1999. In low-and high-income countries, the ratio of foreign to total market capitalization rose by aquarter. In 2000, market capitalization of international firms over total marketcapitalization stood at an average (median) 31 (37) percent for high-income countries, 55(62) percent for middle-income countries, and 27 (14) percent for low-income countries.With 95.7 percent in 2000, Israel had the highest ratio of foreign to total marketcapitalization. Here too, one can observe considerable regional differences. In 2000, theEastern Europe region had the highest ratio of market capitalization listed abroad with 49percent, followed by East Asia with 37 percent, and the Latin America region with 33percent. Firms listed abroad accounted just for 19 percent of total market capitalization inAfrica.
Of course, the (increasing) market capitalization listed abroad is accounted for by arelatively small number of companies as typically larger companies list abroad, but thegrowth in numbers has been large. For middle-income countries, the average number ofcompanies listed abroad increased from 3 in 1990 to 25 in 2000. Low-income countrieshad on average 18 companies listed abroad in 2000. With more companies listing abroad,high-income countries experienced the highest increase on average in terms of numbers.
12
While on average only 35 companies were trading abroad in 1990, this number increasedto 177 in 2000 for the high-income countries.
Similar trends can be observed for the ratio of trading abroad to domestic trading; apronounced increase for middle-income countries during the 1 990s and a slow increase forlow-income countries in the last few years. The trading ratio for middle-income countriesrose from a few percentage points to some 40 percent in 2000. At the same time, theaverage ratio of trading abroad to home rose from 0 to 7 percent for low-income countries.The high-income country group appears to have had less of a change in trading migratingabroad in the last few years, with the ratio fluctuating between 15 percent and 20 percent.
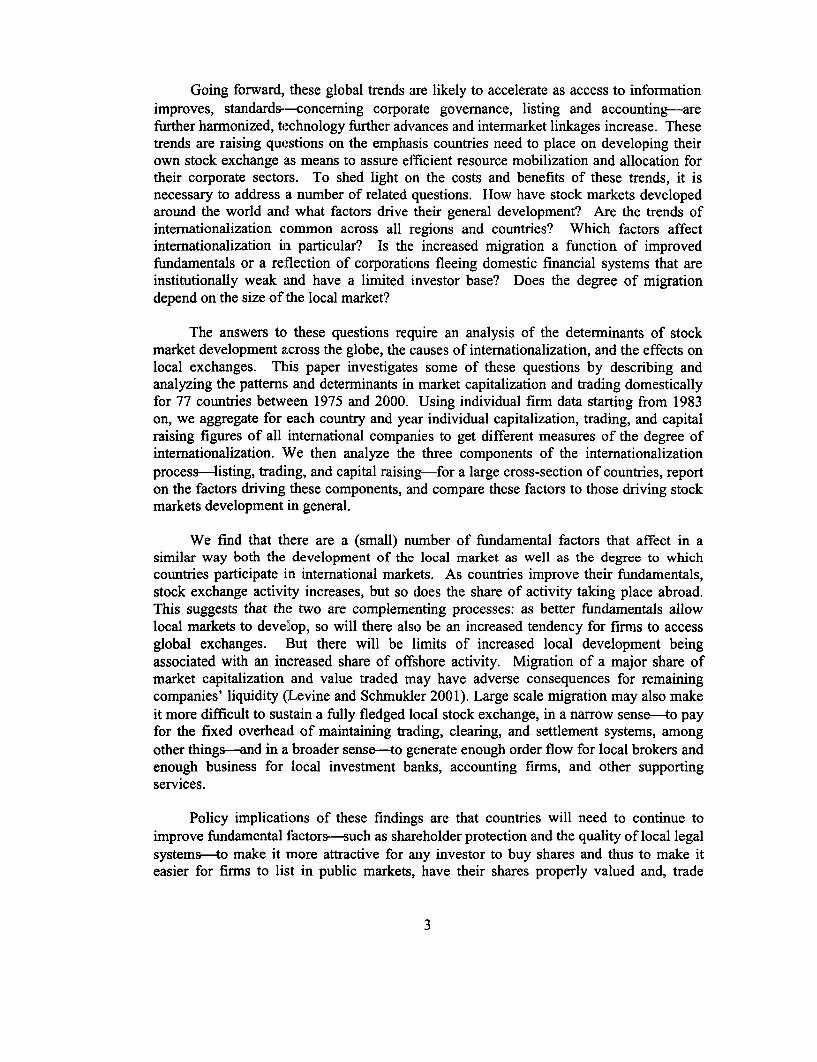
In terms of capital raised abroad, the trends towards internationalization in the lastfew years are striking as well. For various years between 1989 and 2000, the amount ofcapital raised abroad exceeded the amount raised domestically for middle-incomecountries, with a peak in the ratio of 3.7 in 2000. For low-income countries, the ratio hasbeen more volatile, but capital raised abroad amounted on average to some 26 percent ofcapital raised domestically in 2000. Not surprisingly, since some of the high-incomecountries are financial centers in their own right, capital raised abroad exceeded theamount of domestic capital raised in high-income countries only in the years 1990, 1991,and 1997.
As a ratio to GDP, the figures for value traded abroad and capital raised abroad forthe three groups of countries are similar to those relative to domestic activity. Sinceinternationalization is now adjusted by the size of the economy, rather than by the size ofthe local stock market, the relative importance appears different, however. In middle-income countries, trading abroad represented only two percent of GDP as trading itselfwas only a small ratio to GDP, but amounted to 40 percent of domestic trading in 2000.This is similar so for the trends in capital raised abroad, which increased from virtually nilin 1990 to 0.27 percent of GDP for middle-income countries and to 0.18 percent of GDPfor low-income countries in 2000. High-income countries experienced the highest growthin capital raised abroad, from less than a quarter of a percentage point in 1990 to almost 2percentage points in 2000.
9 This reflects the two offsetting effects. While, on one hand, trading abroad has increased as ashare of GDP, at the same time, trading domestically has increased even more, thus leading to arelative lower share. Of course, the sample of high-income countries includes in part the countrieswhere the listing itself is actually taking place (the U.S. and the U.K., although these countrieswere not used in the subsequent section to explain the determinants of internationalization). Thetrend in developed countries is also affected by the data availability: while we have good data forthe trading in ADRs and GDRs, the main vehicle used for intemationalization by low-income andmiddle-income countries, we do not cover the trading in cross-listed stocks, a vehicle moretypically used by high-income countries. As a result, we probably underestimate theinternationalization trend for high-income countries.
13
4. Explaining the trends in stock market development and migration
We try to explain stock market development and the trends towardsinternationalization, including differences among countries, by investigating the role ofcountry and international factors. We use several groups of explanatory variables. Weuse the overall level of development of the country, as captured by GDP per capita andsize of its economy. For macroeconomic performance, we use the inflation rate. For thequality of the institutional framework, we use the law and order index, as reported by theCountry Risk Guide, and the strength of shareholders rights, as reported by La Porta,Lopez-de-Silanez, Shleifer, and Vishny (1998) and Pistor, Raiser, and Gelfer (2000). Forease of foreign ownership in the stock market, we use the measure of capital accountliberalization reported by the IMF'0 and the index of financial liberalization constructedby Kaminsky and Schmukler (2001)." Finally, we use a variable related to the tradingsystem in the country, namely trading commissions and trading fees. The explanatorydata are described in more detail in Appendix Table II.
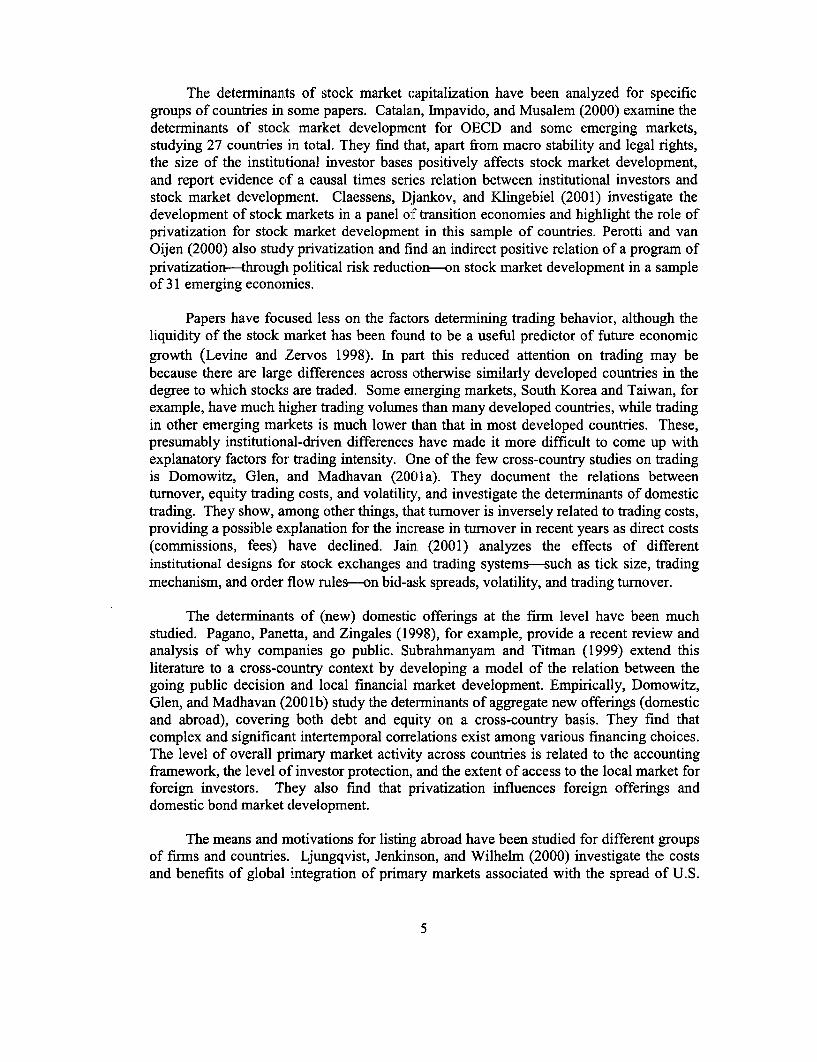
Before presenting the formal regression results, we explore some key relations usingscatter plots of the market development and internationalization variables against the mostimportant explanatory variables we use. Figures 4 and 5 show that there is in general apositive relation between the level of development (GDP per capita) and stock marketactivity. As expected, higher inflation rates depress stock market activity, although theeffect seems to be non-linear. The institutional variable-shareholder protection weightedby the degree of enforcement in the country-relates positively to the level of stockmarket development, as already documented by others. Trading cost (fees andcommissions) has an unclear raw relation with stock market development.
The positive relation between stock market development and GDP per capita alsoextends to the degree of internationalization scaled by the size of the local market,although the relation is less strong. It is clearer when scaling by GDP (not depicted):more developed countries have more trading and capital raised abroad relative to GDP.The raw relation between inflation rates and the degree of internationalization is unclear.The degree of shareholder protection also appears to have a positive relation with thedegree of internationalization, although the relation is not as strong as for stock marketdevelopment. Finally, trading costs (fees and commissions) have a positive relation withthe degree of internationalization, i.e., higher trading costs seem to drive securities market
'O This measure has some drawbacks as the IMF revised the reporting format for capital accountrestrictions in 1996 when the IMF started to provide more details on aspects of capital accountliberalization. Before 1996, the IMF measure of capital account liberalization is a simply dummyvariable. As a consequence, we needed to splice the two series together to create a series of capitalaccount freedom going back. We do this by using the year-by-year dummy measures up to 1995and then create a single liberalization dummy after 1996 if at least half of the detailed aspectscovered by the IMF signaled liberalization.'" The Kaminsky and Schmukler (2001) variable covers different aspects of the financialliberalization process, including liberalization of stock markets, the domestic financial system, andthe capital account, for 28 countries since 1973.
14
activities offshore, ailthough the sample cf countries for which we have trading costs issmaller.
In addition to the variables already mentioned, we also used in some regressionvariables that provide other macros-economic and institutional aspects related to stockmarket development. These other variables included interest rates differentials, degree ofcorruption, capital flows in the form of bonds, equities, and foreign direct investment.Most of these variables were close proxies to the variables we did use (such as inflation inthe case of interest rate differentials, and the institutional variables) and we obtainedsimilar results. Other variables, such as portfolio flows, were generally positively relatedwith both stock market development and degree of internationalization, but might beendogenous. On the basis of scatter plots, we also eliminated some outliers in bothdependent and independent variables.'2 To save space, we do not report these alternativespecifications, also as they confirmed the main results reported below.
For our empirical approach, we use fixed and random effects models. Hausman(1978) specification tests indicate that in some cases we cannot reject the hypothesis thatthe coefficients from the fixed effects and random effects models are different. In othercases, this hypothesis is rejected. Nevertheless, the sign and significance of thecoefficients does not vary across model specifications, and in economic terms similarconclusions can be obtained from both estimators. To avoid reporting results fromdifferent estimators, and given the already large number of variables and specifications,we report only results from the random effects models. We also estimated cross-sectionregressions using data for one year and means over time. Since the results are similar tothose obtained with random effects models, we also omit reporting the cross-sectionestimations for the same reasons mentioned above.
Regarding the estimation technique, we use generalized least squares estimates forthe variables related to domestic market development (market capitalization and valuetraded over GDP) with robust standard errors for heteroskedasticity. For the variablescapturing the internationalization of stock markets we estimate random effects tobitmodels, calculated with a semi-parametric estimator. The difference in techniques ismotivated by the different nature of data on domestic and international activity. We havedata on market capitalization and value traded for most countries, otherwise we havemissing observations; thus linear estimations can yield consistent and efficient results.For the variables related to the internationalization of stock markets, we have eitherpositive values or observations with zeros. These zeros are informative because theymean the data are censored at that point. Tobit models account for this feature of the dataand yield consistent estimates. Random effects models, ordinary or tobit, account fordifferent variances across countries.
Though we have estimated different models, there are some aspects that we have notaddressed. There may, for example, exist interrelations between some of the dependentvariables (e.g., between trading and capital raising abroad) and time lags (e.g.,
12 Specifically, we dropped some observations for Argentina, Azerbaijan, Brazil, Croatia, Ghana,Hungary, Peru, Portugal, Ukraine, and Venezuela.
15
privatization may stimulate new offerings domestically or enhance credibility leading toincreased stock market development and repeated offerings), relationships we did notattempt to capture. We neither tried to adjust for the possible endogeneity of somevariables, such as between the level of economic development and the size of the stockmarket, or between the level of trading costs and value traded. We feel comfortable doingso, in part because the results were generally robust to the estimation techniques employedand to the use of alternative specifications, with some of them containing variables lesslikely to be endogenous. Moreover, we believe that the endogeneity problem is less likelyto arise in the cross-section regressions, for which where the results were generally similarto the ones reported here. However, it would be worth testing for potential endogeneityproblems if good instruments were found.
Regression results are presented in Tables 4, 5, and 6. The Tables provide theresults for the basic regression with GDP per capita, inflation, and law and order as theonly three explanatory variables. The Tables also report regression results with someother variables added. Specifically, we added shareholder rights, capital accountliberalization dummy, financial liberalization dummy, and trading costs. It should benoted that there is significant correlation between the various institutional variables. Wediscuss the results in turn.
For market capitalization. The regression results for the ratio of marketcapitalization to GDP (Table 4) indicate that general stock market development in oursample of countries and time period is affected by the variables already identified in theliterature. In particular, GDP per capita (+) and enforcement of laws (+, although notstatistically significant) drive stock market capitalization, while inflation (-) impedes stockmarket development. In addition, the simple index of shareholder rights and the degree ofcapital account liberalization and financial liberalization also positively affect stockmarket development. Interestingly, both the law and order and the shareholder rightsindex are statistically significant, suggesting it is the combination of strong enforcementand good shareholder rights which helps stock market development. Perhaps surprisingly,trading costs domestically are not statistically significant related with stock marketdevelopment.
For trading domestically. The regression results for the ratio of domestic valuetraded to market capitalization (Table 4) indicate that value traded is affected by the samevariables that drive stock market development in general. In particular, GDP per capitapositively affects trading. Inflation is not statistically significantly related to tradingactivity in the basic regression, but is in one of the other regression results. Enforcementof laws is also positively and statistically significant related to value traded. The indexesof shareholder rights and capital account and financial liberalization are not statisticallysignificant related to value traded. Surprisingly also, trading costs do not seem to affectdomestic trading in a statistically significant way.
Results improve somewhat when considering the ratio of trading domestically toGDP (Table 4). Here, inflation is generally negatively, and statistically significant, relatedto trading activity. Also, shareholders rights affects positively trading. But the law and
16
order variable takes on a negative sign, which is sometimes also statistically significant.The liberalization dummies and trading costs variables are again not statisticallysignificant. The fits for tk,e regressions of the trading variables are in general much lowerthan those for the stock market development regressions are, maybe as other institutionaldifferences explain most of a country's stock trading intensity.
For the ratio of market capitalization listed abroad. The regression results for theratio of market capitalization listed abroad to domestic market capitalization (Table 5)indicate that the degree oif internationalization is influenced by some of the same factorsthat appear to determine general stock market development. In particular, in the basicregression, GDP per capita (+), inflation (-), and enforcement of laws (+, although notstatistically significant) also drive the share of market capitalization listed abroad. Inaddition, the degree of capital account and linancial liberalization are positively, andstatistically significant, related to the share of market cap listed abroad. Higher tradingcosts (-) surprisingly does not seem to accelerate internationalization, but rather retard it.
For shares traded abroad. The ratio of value traded abroad to the value tradeddomestically appears also to increase with the level of economic development (Table 5).Inflation appears to be less of a factor in influencing migration of trading: although stillnegative, it is not statistically significant in the basic regression. The degree to whichlaws are being enforced appears to be less of a determining factor for this variable. Noneof the other institutional variables except for the degree of financial liberalization areactually significant.
The results are sormewhat better when considering the value of trading abroadrelative to the GDP, a variable that does not combine the aspects of the degree trading ingeneral in the country with the value of migration of trading. Here, inflation decreasesand shareholder rights increases the relative value of shares traded abroad. Also, greaterfinancial liberalization higher trading costs lead to more trading abroad. The capitalaccount liberalization is not statistically significant. It maybe that by taking tradingabroad as a ratio to GDP that this measure is less sensitive to the large institutionaldifferences across countries affecting the degree of domestic trading.
For capital raised abroad. Finally, we find that the degree of capital raised abroadis also a function of the same factors as the other internationalization variables (Table 6):the more developed the economy, the greater the share of capital raised abroad. The other,macro (inflation) and institutional (law and order) variables do not seem to affect the ratioof capital raised abroad relative to the share of capital raised domestically. This is alsotrue for the other institutional variables, except for the financial liberalization variable thatis statistically significant positive. When taking the ratio of capital raised abroad to GDP,and not to domestic capital raised, we find some more statistically significant results. Notonly is GDP per capita still statistically significant, but also inflation and law and orderbecome statistically significant in the expected way. Furthermore, the degree of financialas well as capital account liberalization are positively associated with foreign capitalraised. These better results may be explained in part by the fact that the ratio of capital
17

raised abroad to GDP is less volatile from year to year than the ratio of capital raisedabroad to capital raised domestically.
In general, it seems that the degree of internationalization is affected by the samevariables that drive the development of stock markets: higher income levels, moremacroeconomic stability, stronger legal systems, and greater financial and capital accountliberalization. Since the internationalization regressions typically have the ratio ofinternational to domestic activity as the dependent variable, the results imply that, ascountries develop their fundamentals, they will experience an increase in internationalactivity relative to domestic activity, even as domestic activity increases.
5. Conclusions
Powerful trends of internationalization and migration of order flow are puttingpressures on stock exchanges around the world. For some exchanges, already more thanhalf of trading and listing has migrated offshore. Our analysis suggests that the process ofdeveloping a local stock exchange also increases domestic firms' access to internationalexchanges. In particular, we show that, while better fundamentals lead to an increase indomestic activity, more and more of this activity will occur abroad as better fundamentalsspur the degree of migration in capital raising, listing, and trading to exchanges abroad.
Other analyses we reviewed have shown that this migration has been beneficial inmany ways. Corporations have been able to attract more easily funds at lower costs andbetter terms, and have tapped into wider investor bases. And investors have been able toacquire and sell shares at more liquid exchanges. At the same time, the migration of amajor share of market capitalization and value traded abroad has had adverseconsequences for the liquidity of the remaining companies' securities.
Migration also makes it more difficult for countries to sustain a fully-fledged localstock exchange. As trading volumes further decrease, financing the fixed overhead ofmaintaining market oversight, clearing, and settlement systems, among others, andgenerating enough order flow for local brokers and enough business for local investmentbanks, accounting firms, and other supporting services will become even harder,especially for smaller emerging markets. The trend towards increased migration will thusmake it more difficult for small exchanges to survive (see also Lee and Steil 2002). This isalready reflected in the drive for mergers among many developed countries, particularly inEurope. This consolidation of trading systems, spurred in part by technological advances,is not new. It occurred in the U.S. over the last 100 years: there were close to 200 stockexchanFes in the U.S. at the start of the 20th century, but there are only about half a dozentoday. ' Surprisingly, stock exchanges in emerging economies have not yet participated inthis trend, although they are possibly more at risk given their smaller size and worse legaland financial infrastructure. Clearly, however, pressures to do so will increase and, astechnology advances, the ability to interlink trading systems to varying degrees remotelywill increase.
13 We like to thank Ken Kavajecz for bringing this fact to our attention.
18

The future of stock exchanges in many, especially emerging economies, isconsequently not obvious. But, this does not mean that firms and investors will not haveaccess to financial services. To the contrary, costs, terms, and liquidity can improve withincreased migration to exchanges with better rules and greater transparency. Given theincreased remote access to trading systems, domestic investors neither need to give up ontheir ability to trade stocks, even when they are listed abroad. The policy implication isthat countries might be better off not focussing on developing full-fledged local stockexchanges, but rather concentrate on creating the conditions, such as improvingshareholder rights and the quality of local legal systems, that allow corporations to issueand trade shares abroad efficiently. This facilitation will also need to involve theharmonization of corporate governance, accounting, listing and other rules with those ininternational financial centers, and in many environments the strengthening of securitiesmarkets' enforcement.
In addition, countries, especially those with small markets, should encourage thattheir local trading systems are linked tightly or merged with global markets. Furthermore,as Steil (2001) highlights, countries' governments should encourage foreign tradingsystems and clearing and settlement operators to provide services locally, whether incollaboration with local institutions or on their own, and if necessary, remove anyimpediments against foreign participation. Finally, to avoid domestic institutionalinvestors being held captive to an increasingly illiquid and untransparent local market,portfolio restrictions that require investment in local instrumnents only should be avoided.
These conclusions should remain tentative, however, in part because we did notexplore all possible determinants of the intemationalization process. Furthermore,although we used data for individual firms, we only studied the process ofinternationalization at the aggregate level of a country. We did not investigate what typesof firms were more likely to be internationalized; it might well be, for example, that theinternationalization process to date has mainly involved larger corporations which alreadyoperate internationally going abroad. Casual evidence suggests this to be the case,although there has also been a flurry of new, innovative firms from emerging markets thathave been able to secure financing abroad.'4
Our analysis does, however, suggest that stock exchanges in emerging markets donot seem to have comparative advantage in offering capital raising, listing and tradingservices. Nevertheless, many medium-sized firms with local informational needs may notbe able to go directly overseas. This may imply a need for some mechanism in eachcountry to bring firms for the first time to a public market. This may not need to require astock exchange, however, but rather an active market-in the form of venture capitalfirms, commercial banks, non-bank financial institutions, and institutional investors withlinks to intemational financial centers-for the financing of new and expanding firms.While we shed light on the internationalization side, more research is needed on what
14 The most important firm-specific characteristic determining internationalization in terms ofcapital raising may have been whether or not it involved a privatization. Many of theprivatizations in the 1 990s of telecommunications and other state-owned enterprises were too largeto be floated purely domestically and most involved large international tranches.
1is

constitutes not only the minimum legal, but also institutional setup for such an active first-stage financing industry, and whether or not that includes some form of a local market forpublic shares.
20
BEaker, H. K., '. R. Nofsinger, and D. G. Weaver, 1999. International Cross-Listing andVisibility, NYFSE Worlckng Paper 99-01, January.
Be3kaert, G., C. Harvey, and C. Lundblad, 2001. Does Financial Liberalization SpurGrowth?, Columbia Business School, Duke University and Indiana University,Aprii 20.
Beck, 'T., A. Demirguc-Kunt, R. Levine, and V. Maksimovic, 2001. Financial Structureand Economic Development: Firm, Industry, and Country Evidence, in FinancialStructure and Economic Growth, Asl:; Demirguc-Kunt and Ross Levine eds., MITPress.
Beck, T., R. Levine, and N. Loayza, 2000. Finance and the Sources of Growth, Journal ofFinancial Economics 58(1-2), 261-3C0.
Catalan, M., G. Impavido, and A. R. Musalem, 2000. Contractual Savings of StockMarket Development: Which Leads? Policy Research Working Paper 2421,World Bank, August.
Chaplinkcsy, S. and L. Ramchand, 2000. The Impact of Global Equity Offerings, Journalof Finance 55(6), 2767-89.
Claessens, S., S. Djankov, and D. Klingebiel, 2001. Stock Markets in TransitionEconornies, Financial Sector Discussion Paper No. 5, World Bank, September.
Claessens, S., D. Klingebiel, and S. Schmukler 2001. FDI and Stock MarketDevelopment: Complements or Substitutes? mimeo, World Bank.
Claessens, S., D. Klingebiel, and S. Schmukler 2002. The Future of Stock Markets inEmerging Economies: Evolution and Prospects, Working Paper, World Bank.
Clayton, M. ., B. N. .Jorgensen, and K. A. Kavajecz, 1999. On the Formation andStructure of Intemational Exchanges, mimeo, The Stern School of Business, NewYork University, September.
Demirguc-Kunt, A. and R. Levine (Eds), 2001. Financial Structure and EconomicDeveiopment, MIT Press, Cambridge, Massachusetts.
Doidge, C., 2001. Do Changes in Law Matter for Corporate Ownership and Control?Evidence for E-merging Markets Firms that Lists in the U.S., mimeo, Ohio StateUniversity.
Doidge, C., G. A. Karolyi, and R. Stulz, 2001. Why are foreign firms listed in the U.S.worth more? mimeo, Ohio State University.
21
Domowitz, I. and B. Steil, 1999. Automation, Trading Costs, and the Structure of theTrading Service Industry, Second Annual Brookings- Wharton Conference onFinancial Services.
Domowitz, I. J. Glenn and A. Madhavan, 2001 a. Liquidity, Volatility and Equity TradingCosts Across Countries and Over Time, International Finance 4:2, Summer2001: pp. 221-255.
-------------- , 2001b. International Evidence on Aggregate Corporate FinancingDecisions, in Financial Structure and Economic Growth, Asli Demirguc-Kuntand Ross Levine eds., MIT Press.
Foerster S. and G. A. Karolyi, 1999. The effects of market segmentation and investorrecognition on assets prices: evidence from foreign stock listing in the US,Journal of Finance 54, 981-1014
----------------- , 2000, The Long Run Performance of Global Equity Offerings, Journal ofFinancial and Quantitative Analysis 35, 499-528.
Jain, P., 2001. Institutional Design, and Liquidity at Stock Exchanges around the World,mimeo, Indiana University, October.
Hargis, K., 2000. International Cross-Listing and Stock Market Development in EmergingEconomies, International Review of Economics and Finance 9(2), 101-122.
Henry, P. B., 2000a. Stock Market Liberalization, Economic Reform, and EmergingMarket Equity Prices, Journal of Finance 55(2), 529-64, April.
----------------- , 2000b. Do Stock Market Liberalization Cause Investment Booms? Journalof Financial Economics 58(1), 301-34, October.
Kaminsky, G., R. Lyons, and S. Schmukler, 2001. Mutual Fund Investment in EmergingMarkets - An Overview, World Bank Economic Review 15(2), 315-40.
Kaminsky, G. and S. Schmukler, 2001. On Booms and Crashes: Financial Liberalizationand Stock Market Cycles, mimeo, World Bank.
Karolyi, G. A., 1998. Why Do Companies Lists Shares Abroad? A Survey of the Evidenceand Its Managerial Implications, Financial Markets, Institutions and Instruments,Volume 7, Number 1, Blackwell Publishers, Boston.
--------------------, 2001, DaimlerChrysler AG, The First Truly Global Share, mimeo, OhioState University, December.
22

Karolyi, G. A. and R. M. Stulz, 2002. Are Financial Assets Priced Locally or Globally?prepared for the HIandbook of the Economics of Finance, George Constaninides,Milton Harris, ancl Rene M. Stulz, (Eds), North-Holland.
King, R. G. and R. Levine, 1993. Finance and Growth: Schumpeter Might Be Right,Quarterly Journal of Economics 108(3),, 717-37.
La Porta, R., F. Lopez-de-Silanes, A. Shleifer, and R. W. Vishny, 1998. Law and Finance,Journal of Political Economy 106(6), 1113-55.
Lee, and B. Steil, 2002. Changes in the Ownership and Governance of SecuritiesExchanges: Causes and Consequences, mimeo, Council on Foreign Relations.
Levine, R., 1997. Financial Development and Growth, Journal of Economic Literature 35,688-726, June.
Levine, R. and S. Schmukler, 2001. The Effects of Cross-Listing on Local EquityMarkets, mimeo, World Bank.
Levine, R. and S. Zervos, :1998. Stock Markets, Banks, and Economic Growth, AmericanEconomic Review 88(3), 537-58.
Lins, K., D. Strickland, and M. Zenner, 2001. Do Non-U.S. Firmns Issue Equity on U.S.Stock Exchanges to Relax Capital Conistraints, mimeo, David Eccles School ofBusiness, University of Utah.
Ljundqvist, A., T. Jenkinson, and W. Wilhelm, 2000. Global Integration in Primary EquityMarkets: The Role of U.S. Banks and U.S. Underwriters, mimeo, New YorkUniversity, September.
Miller, D. 1996, Why do foreign firms list in the United States? An empirical analysis ofthe depositary receipt market, Journal cf Financial Economics 51, 103-123.
----------- and J. Puthenpurackal, 2000. The Costs, Wealth Effects and Deterninants ofInternational Capital Raising: Evidence from Public Yankee Bonds, mimeo,Indiana University and Texas A&M University.
Moel, Alberto, 2001, The Role of American Depositary Receipts in the Development ofEmerging Markets." Economia, Fall 2001, Brookings Institution.
Pagano, M., A. Roell, and J. Zechner, 1999. The Geography of Equity Listing: Why DoEuropean Companies List Abroad? CSE,F working paper 28, October.
Pagano, M., 0. Randl, A. Roell, and J. Zechner, 2001. What Makes Stock ExchangesSucceed?: Evidence from Cross-Listinlg Decisions, European Economic Review45: 770-82.
23
Pagano, M., F. Panetta, and L. Zingales, 1998. Why Do Companies Go Public: AnEmpirical Analysis Journal ofFinance, 53:1, 27-64.
Perotti, E. and P. van Oijen, 2000. Privatization, Political Risk, and Stock MarketDevelopment in Emerging Markets, mimeo, University of Amsterdam.
Pistor, K., M. Raiser, and S. Gelfer, 2000. Law and Finance in Transition Economies,Economics of Transition, EBRD 8(2), 325-68.
Pulatkonak, M. and G. Sofianos, 1999. The Distribution of Global Trading in NYSE-Listed Non-U.S. Stock, NYSE Working Paper 99-03, March.
Rajan, R. and L. Zingales, 1998. Financial Dependence and Growth, American EconomicReview 88(3), 559-586.
Reese, W. A. Jr. and M. S. Weisbach, 2000. Protection of Minority Shareholder Interests,Cross-listing in the United States, and Subsequent Equity Offerings, mimeo,Tulane University/University of Illinois, January.
Sarkissan, S. and M. J. Schill, 2000. The Overseas Listing Decision: New Evidence ofPromixity Preference, mimeo, McGill University/University of California, April.
Schmukler, S. and E. Vesperoni, 2001a. Globalization and Firms' Financing Choices:Evidence from Emerging Economies, World Bank Policy Research WorkingPaper 2323.
----------------------------------------- , 2001b. Firms' Financing Choices in Bank-Based andMarket-Based Economies, in Financial Structure and Economic Growth, AsliDemirguc-Kunt and Ross Levine eds., MITPress, pp. 347-375.
Schmiedel, H., 2001. Technological Development and Concentration of Stock Exchangesin Europe, Bank of Finland Discussion Papers 21/2001.
Steil, Benn, 2001, Creating Securities Markets in Developing Countries: A New Approachfor the Age of Automated Trading, International Finance 4:2, Summer 2001:pp257-278.
Subrahmanyam, A. and S. Titman, 1999. The Going-Public Decision and theDevelopment of Financial Markets, Journal of Finance 54(3), 1045-82.
24
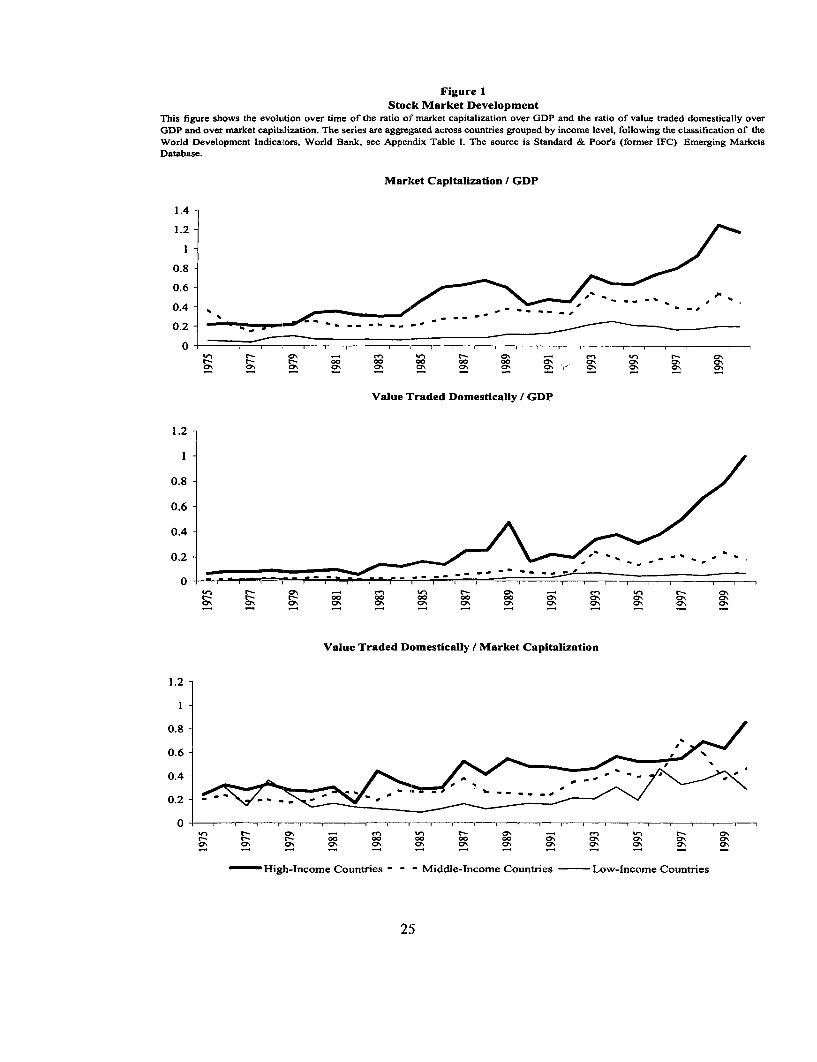
Figure 1Stock Market Development
This figure shows the evolution over time of the ratio o:F market capitalization over GDP and the ratio of value traded domestically overGDP and over market capitadization. The series are aggregated across countries grouped by income level, following the classification of theWorld Development Indicators, World Bank, see Apperidix Table 1. The source is Standard & Poor's (former IFC) Emerging MarketsDatabase.
Market Capitalization / GDP
1.4
1.2
0.8
0.6
0.4
_~-t ~ t- 0 00 00 00 00 C0 . 0 a, ON ON
Value Traded Domestically / GDP
1.2
0.8
0.6
0.4
0.2
0 2O ~ r _0 ___ - - '% -- .% _ _ ~ _, , 0,
t- r - t- 0 C 0 00 00 00 a, 0% 0%0% 0% 0o 0% 0% o% 0o 0i cr 0 0% % 0
Value Traded Domestically / Market Capitalization
1.2
0.8
0.6
0.4-
02
f r I t 00 00 00 00 00 0% 0 a, a, 0O 0% 0% 0, El , % 0% 0 0, 0 0% 0, 0
- High-Income Countries - - - Middle-Income Countries- Low-Income Countries
25
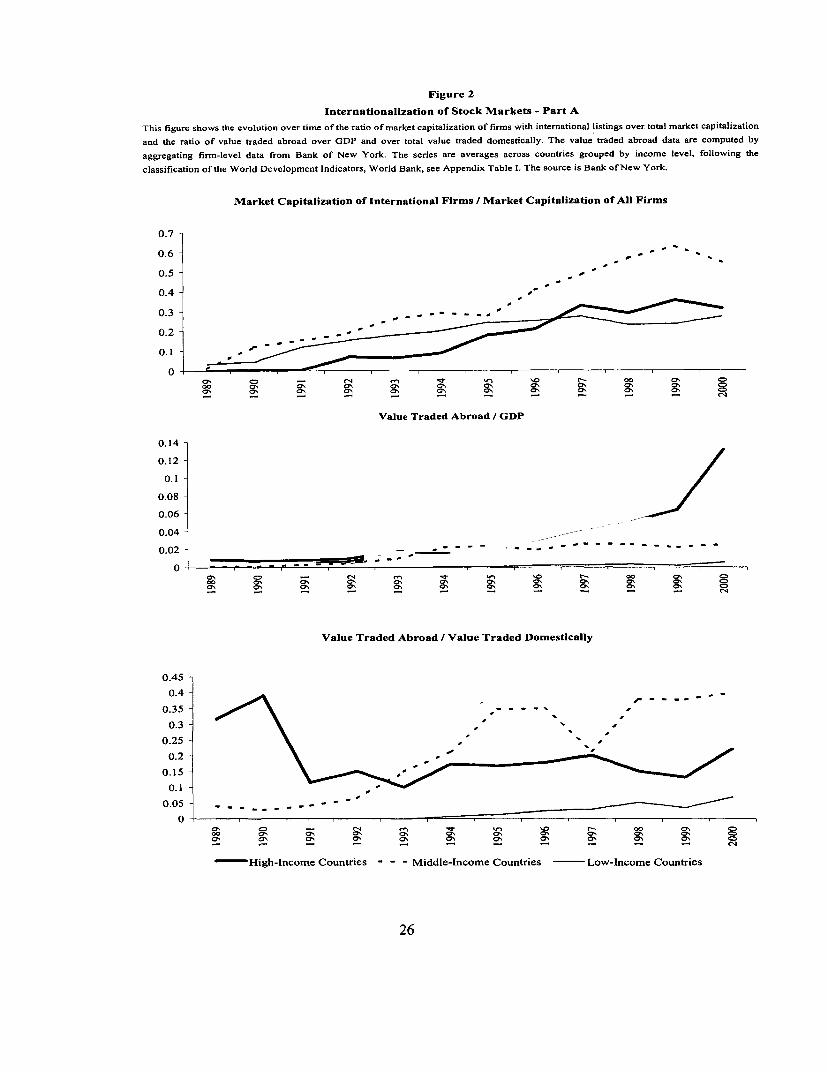
Figure 2
Internationalization of Stock Markets - Part A
This figure shows the evolution over time of the ratio of market capitalization of firms with international listings over total market capitalization
and the ratio of value traded abroad over GDP and over total value traded domestically. The value traded abroad data are computed by
aggregating firm-level data from Bank of New York. The series are averages across countries grouped by income level, following the
classification of the World Development Indicators, World Bank, see Appendix Table 1. The source is Bank of New York.
Market Capitalization of International Firms / Market Capitalization of All Firms
0.7
0.6 , ' ' ' ' ' -
0.5
0.4
0.3 ,,_
0.2
0C'. - '~~cq.: I 0 !r- 00 CD. 00 '2-. 0 '. ' ' ' '
Value Traded Abroad / GDP
0.14
0.12
0.1
0.08
0.06
0.04
0.02 - - - - - - -- - - - _,
0 0. C' - r-. 1 .' ' t-. 00 CY, C)
o.a~ a'. ,' 0' 0. 0. ' ' 0. 0. C
Value Traded Abroad / Value Traded Domestically
0.45
0.4
0.35
0.3
0.25
0.2
0.15
0.1
0.05 -_ _ _ _ _ _ _ - - ' -
00' C - eN 0 t- 00 0'. o o ' ' ''o' o. 0'. 0'. 0'. 0'. 0'
High-Income Countries - - - Middle-Income Countries Low-Income Countries
26

Figure 3
Internationalization of Stock Markets - Part BThis figure shows the evolution over time of the ratio of capitil raised in international markets over GDP and over capital raised domestically. Thiscapital raised in international markets is computed by aggregating firm-level data from Bank of New York and Euromoney. The series are averagesacross countries grouped by income level, following the classification of the World Development Indicators, World Bank, see Appendix Table 1. Thesources are Euromoney and Bank of New York.
Capital Raised Abroad / GDP
0.025 -
0.02 -
0.015 -
0.01-
0.005
0O , . . 00 .00 a ~0~ ~ O (7 \ a, ON 0% 0% %0% 0% 0 ON ON 07% O\ 0% O\ 0% % -8 - - es -f -m - -oo ci
Capital Raised Abroad / Capital Raised Domestically
4-
3.5 - ,
3 -
2.5 -
2-
1.5-
1-
0.5
0% 0 - ~~~Ci %Q t- 00 a\
- High-Income Countries ---- Middle-Income Countries Low-Income Countries
27

Figure 4
Scatter Plots - Stock Market DevelopmentThis figure shows the graphs of market capitalization over GDP (in the vertical axis) against log of GDP per capita, inflation (percentage per year),
enforcement of shareholders rights, and trading costs - fees and commissions (in basis points), respectively. The data are averages by country overtime,
with the available data in the period 1975 - 2000. The sources are Standard & Poor's (former IFC) Emerging Markets Database for data on market
capitalization in domestic markets; World Development Indicators, World Bank, for GDP, GDP per capita, and inflation; La Porta et al. (1998), Pistor
et al. (2000), and Country Risk Guide for enforcement of shareholders rights; Elkins/McSherry Co., Inc. for trading costs.
Market Capitalization / GDP
2.50 -2.50
2.00 2.00 -
1.50 - 1.50 -
1.00 - 1.00-
0.50 - - * 0.50
0.00 *- s * - *, *.. 0.00 * -* *4 5 6 7 8 9 10 11 0 50 100 150 200 250
Log of GDP per capita Inflation
2.50 - 2.50
2.00 2.00
1.50 * * 1.50
1.00 * 1.00
# ~~* *- 0.50 * $ 0.50
0.00 * .o - *,-;0 5 10 15 20 25 30 35 0 20 40 60 80 100 120
Enforcement of Shareholders Rlghts Trading Costs - Fees and Commissions
28

Figure 5
Scatter Plots - Internationalization of Stock MarketsThis figure shows the graphs of market capitalization of international firms over total market capitalization (in the vertical axis) against log of GDP percapita, inflation (percentage per year), enforcement of shareholders rights, and trading costs - fees and commissions (in basis points), respectively.These variables are averages by country overtime, with the available data in the period 1975 - 2000. The sources are Standard & Poor's (former IFC)Emerging Markets Database for data on market capitalization in domestic markets; World Development Indicators, World Bank, for GDP, GDP percapita, and inflation; La Porta et al. (1998), Pistor et al. (2000), and Country Risk Guide for enforcement of shareholders rights; Elkins/McSherry Co.,Inc. for trading costs.
Market Capitalization of International Firms / Total Market Capitalization
0.80 q +0.80 0.70 0.70
0.60 0.60-
0.50 * 0.50-
0.40 0.40 -
0.30 - 0.30 -
0.20 0.20 - *0.10 0 orn *0.00* 000
4 5 6 7 8 9 10 11 0 50 100 150 200 250
Log of GDP per capita Inflation
0.90 0.90
0.80 * 0.80]
0.70 * 0.70
0.60 0.60 -* * * *
0.50 * 0.50-
0.40 * 0.40-
0.30 * * . 0.30 **0.20 - 0.20
0.10 * * * 0.10
0.00- s ** * * , ¢ 0.00- 0 5 10 15 20 25 30 35 0 20 40 60 80 100 120
Enforcement of Shareholders Rights Trading Costs -Fees and Commissions
29
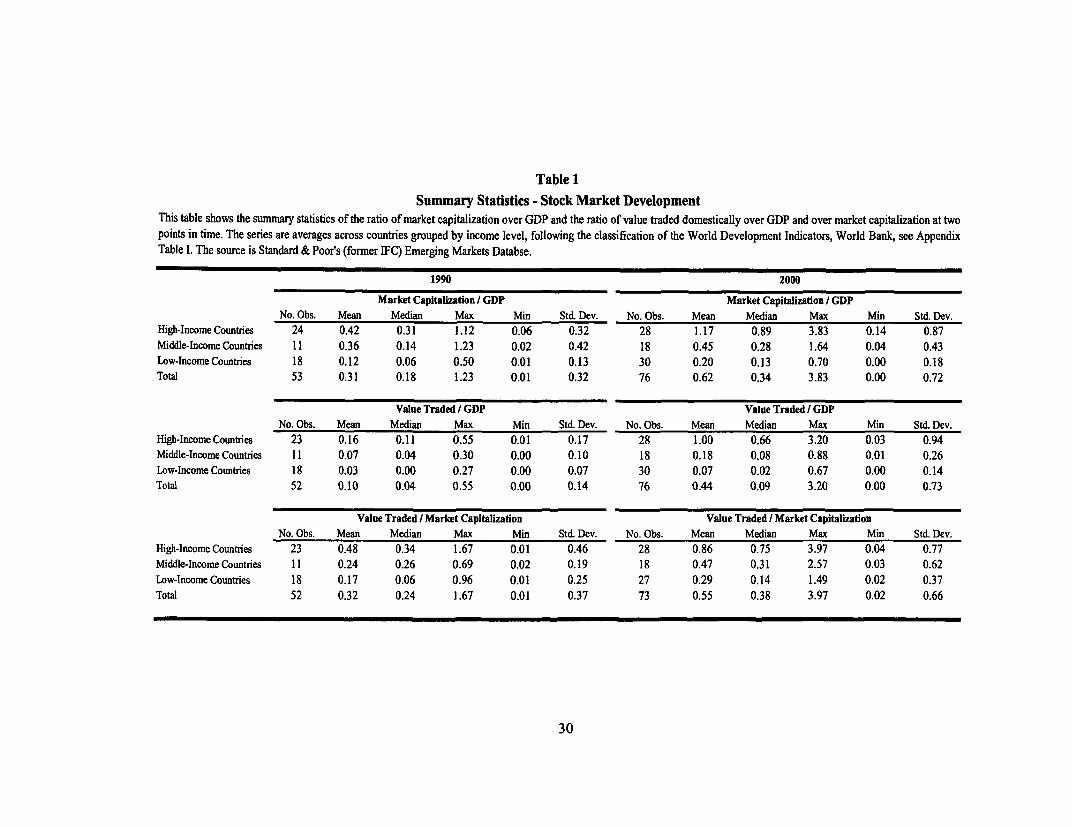
Table 1
Summary Statistics - Stock Market DevelopmentThis table shows the summary statistics of the ratio of market capitalization over GDP and the ratio of value traded domestically over GDP and over market capitalization at two
points in time. The series are averages across countries grouped by income level, following the classification of the World Development Indicators, World Bank, see Appendix
Table 1. The source is Standard & Poor's (former IFC) Emerging Markets Databse.
1990 2000
Market Capitalization / GDP Market Capitalization i GDPNo. Obs. Mean Median Max Min Std. Dev. No. Obs. Mean Median Max Min Std. Dev.
High-IncomeCountries 24 0.42 0.31 1.12 0.06 0.32 28 1.17 0.89 3.83 0.14 0.87
Middle-Income Countries 11 0.36 0.14 1.23 0.02 0.42 18 0.45 0.28 1.64 0.04 0.43
Low-Income Countries 18 0.12 0.06 0.50 0.01 0.13 30 0.20 0.13 0.70 0.00 0.18
Total 53 0.31 0.18 1.23 0.01 0.32 76 0.62 0.34 3.83 0.00 0.72
Value Traded / GDP Value Traded / GDPNo. Obs. Mean Median Max Min Std. Dev. No. Obs. Mean Median Max Min Std. Dev.
High-IncomeCountries 23 0.16 0.11 0.55 0.01 0.17 28 1.00 0.66 3.20 0.03 0.94
Middle-IncomeCountries 11 0.07 0.04 0.30 0.00 0.10 18 0.18 0.08 0.88 0.01 0.26
Low-Income Countries 18 0.03 0.00 0.27 0.00 0.07 30 0.07 0.02 0.67 0.00 0.14
Total 52 0.10 0.04 0.55 0.00 0.14 76 0.44 0.09 3.20 0.00 0.73
Value Traded / Market Capitalization Value Traded / Market CapitalizationNo. Obs. Mean Median Max Min Std. Dev. No. Obs. Mean Median Max Min Std. Dev.
High-Income Countries 23 0.48 0.34 1.67 0.01 0.46 28 0.86 0.75 3.97 0.04 0.77
Middle-IncomeCountries 11 0.24 0.26 0.69 0.02 0.19 18 0.47 0.31 2.57 0.03 0.62
Low-Income Countries 18 0.17 0.06 0.96 0.01 0.25 27 0.29 0.14 1.49 0.02 0.37
Total 52 0.32 0.24 1.67 0.01 0.37 73 0.55 0.38 3.97 0.02 0.66
30
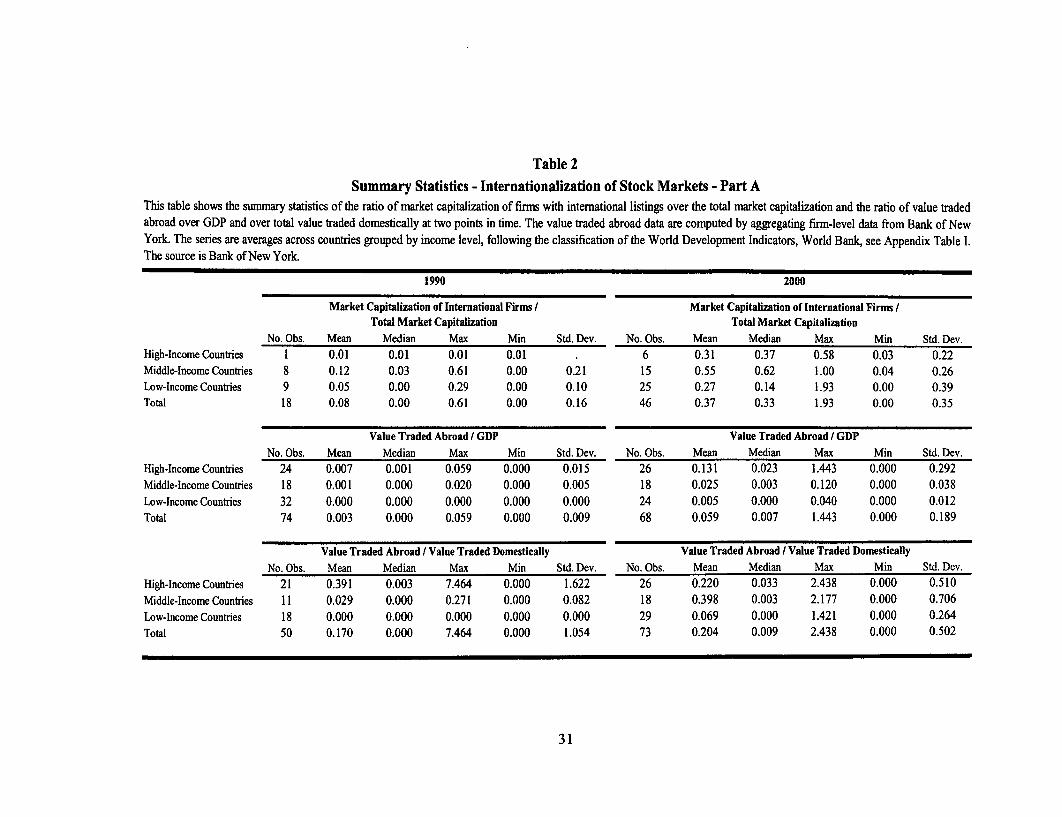
Table 2Summary Statistics - Internationalization of Stock Markets - Part A
This table shows the summary statistics of the ratio of market capitalization of firms with international listings over the total market capitalization and the ratio of value tradedabroad over GDP and over total value traded domestically at two points in time. The value traded abroad data are computed by aggregating firm-level data from Bank of NewYork. The series are averages across countries grouped by income level, following the classification of the World Development Indicators, World Bank, see Appendix Table 1.The source is Bank of New York.
!990 2000
Market Capitalzation of International Firms / Market Capitalzation of International Firms /Total Market Capitalization Total Market CapitaDzation
No. Obs. Mean Median Max Min Std. Dev. No. Obs. Mean Median Max Min Std. Dev.High-Income Countries I 0.01 0.01 0.01 0.01 . 6 0.31 0.37 0.58 0.03 0.22Middle-Income Countries 8 0.12 0.03 0.61 0.00 0.21 15 0.55 0.62 1.00 0.04 0.26Low-Income Countries 9 0.05 0.00 0.29 0.00 0.10 25 0.27 0.14 1.93 0.00 0.39Total 18 0.08 0.00 0.61 0.00 0.16 46 0.37 0.33 1.93 0.00 0.35
Value Traded Abroad / GDP Value Traded Abroad / GDPNo. Obs. Mean Median Max Min Std. Dev. No. Obs. Mean Median Max Min Std. Dev.
High-Income Countries 24 0.007 0.001 0.059 0.000 0.015 26 0.131 0.023 1.443 0.000 0.292Middle-Income Countries 18 0.001 0.000 0.020 0.000 0.005 18 0.025 0.003 0.120 0.000 0.038Low-Income Countries 32 0.000 0.000 0.000 0.000 0.000 24 0.005 0.000 0.040 0.000 0.012Total 74 0.003 0.000 0.059 0.000 0.009 68 0.059 0.007 1.443 0.000 0.189
Value Traded Abroad / Value Traded Domestically Value Traded Abroad I Value Traded DomesticallyNo. Obs. Mean Median Max Min Std. Dev. No. Obs. Mean Median Max Min Std. Dcv.
High-IncomeCountries 21 0.391 0.003 7.464 0.000 1.622 26 0.220 0.033 2.438 0.000 0.510Middle-Income Countries 1 1 0.029 0.000 0.271 0.000 0.082 18 0.398 0.003 2.177 0.000 0.706Low-Income Countries 18 0.000 0.000 0.000 0.000 0.000 29 0.069 0.000 1.421 0.000 0.264Total 50 0.170 0.000 7.464 0.000 1.054 73 0.204 0.009 2.438 0.000 0.502
31
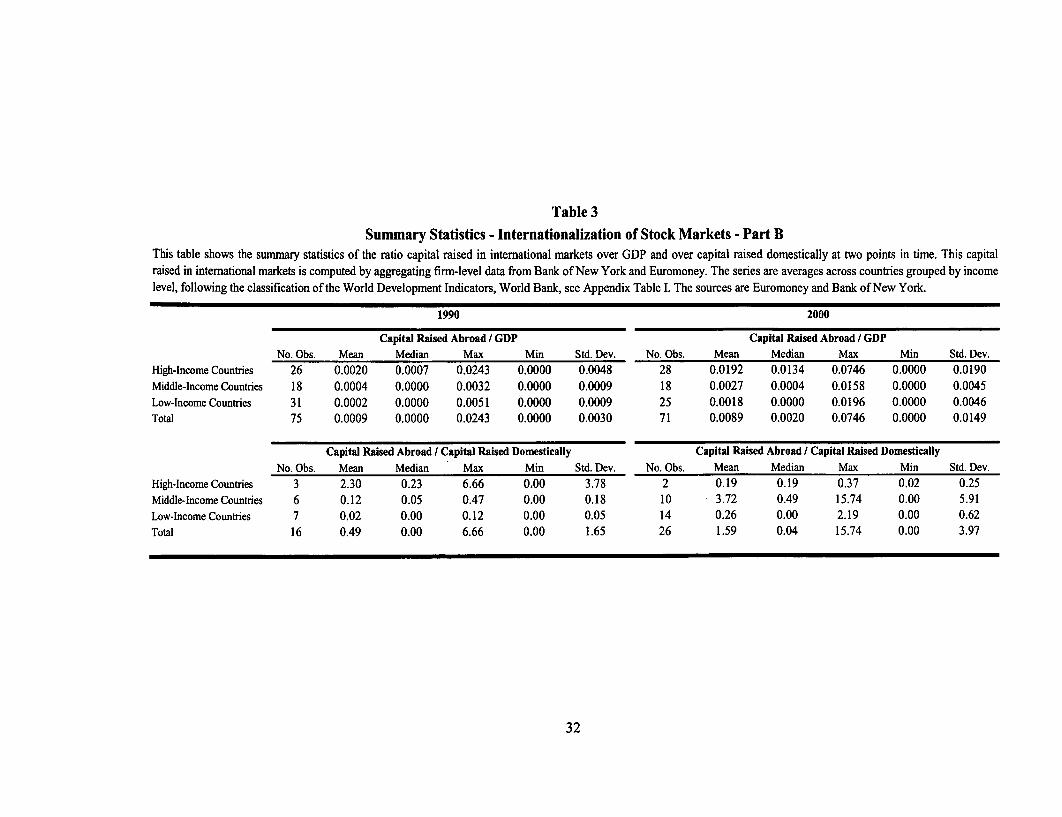
Table 3
Summary Statistics - Internationalization of Stock Markets - Part BThis table shows the summary statistics of the ratio capital raised in international markets over GDP and over capital raised domestically at two points in time. This capitalraised in international markets is computed by aggregating firm-level data from Bank of New York and Euromoney. The series are averages across countries grouped by incomelevel, following the classification of the World Development Indicators, World Bank, see Appendix Table I. The sources are Euromoney and Bank of New York.
1990 2000
Capital Raised Abroad / GDP Capital Raised Abroad / GDPNo. Obs. Mean Median Max Min Std. Dev. No. Obs. Mean Median Max Min Std. Dev.
High-Income Countries 26 0.0020 0.0007 0.0243 0.0000 0.0048 28 0.0192 0.0134 0.0746 0.0000 0.0190Middle-Income Countries 18 0.0004 0.0000 0.0032 0.0000 0.0009 18 0.0027 0.0004 0.0158 0.0000 0.0045Low-Income Countries 31 0.0002 0.0000 0.0051 0.0000 0.0009 25 0.0018 0.0000 0.0196 0.0000 0.0046Total 75 0.0009 0.0000 0.0243 0.0000 0.0030 71 0.0089 0.0020 0.0746 0.0000 0.0149
Capital Raised Abroad / Capital Raised Domestically Capital Raised Abroad I Capital Raised DomesticallyNo. Obs. Mean Median Max Min Std. Dev. No. Obs. Mean Median Max Min Std. Dev.
High-Income Countries 3 2.30 0.23 6.66 0.00 3.78 2 0.19 0.19 0.37 0.02 0.25Middle-Income Countries 6 0.12 0.05 0.47 0.00 0.18 10 3.72 0.49 15.74 0.00 5.91Low-Income Countries 7 0.02 0.00 0.12 0.00 0.05 14 0.26 0.00 2.19 0.00 0.62Total 16 0.49 0.00 6.66 0.00 1.65 26 1.59 0.04 15.74 0.00 3.97
32
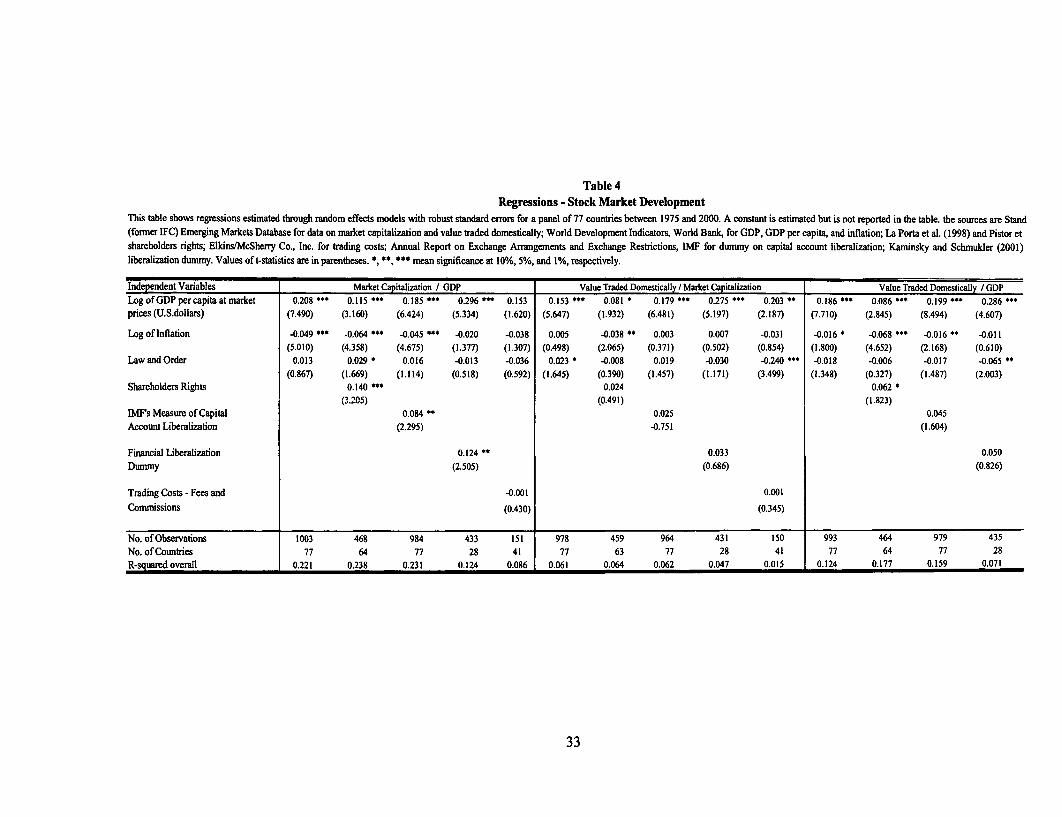
Table 4Regressions - Stock Market Development
This table shows regressions estimated through random effects models with robust standard errors for a panel of 77 countries between 1975 and 2000. A constant is estimated but is not reported in the table. the sources are Stand(former IFC) Emerging Markets Database for data on market capitalization and value traded domestically; World Development Indicators, World Bank, for GDP, GDP per capita, and inflation; La Porta ct al. (1998) and Pistor etshareholders rights; Elkins/McSherry Co., Inc. for trading costs; Annual Report on Exchange Arrangements and Exchange Restrictions, IMF for dummy on capital account liberalization; Kaminsky and Schmukler (2001)liberalization dummy. Values of t-statistics are in parentheses. *, **, *** mean significance at 10%, 5%, and 1%, respectively.
Independent Variables Market Capitalization / GDP Value Traded Domestically / Market Capitalization Value Trded Domestically / GDPLog of GDP per capita at market 0.208 " 0.115 "' 0.185 "' 0.296 "' 0.153 0.153 "' 0.081 ' 0.179 " 0.275 " 0.203 " 0.186 "' 0.086 ' 0.199 "* 0.286 "prices (U.S.dollars) (7.490) (3.160) (6.424) (5.334) (1.620) (5.647) (1.932) (6.481) (5.197) (2.187) (7.710) (2.845) (8.494) (4.607)
Log of Inflation -0.049 "' -0.064 " -0.045 " -0.020 -0.038 0.005 -0.038 " 0.003 0.007 -0.031 -0.016 -0.068 " -0.016 ** -0.011(5.010) (4.358) (4.675) (1.377) (1.307) (0.498) (2.065) (0.371) (0.502) (0.854) (1.800) (4.652) (2.168) (0.610)
Law and Order 0.013 0.029 * 0.016 -0.013 -0.036 0.023 ' -0.008 0.019 -0.030 -0.240 " -0.018 -0.006 -0.017 -0.065 "(0.867) (1.669) (1.114) (0.518) (0.592) (1.645) (0.390) (1.457) (1.171) (3.499) (1.348) (0.327) (1.487) (2.003)
Shareholders Rights 0.140 "' 0.024 0.062 '(3.205) (0.491) (1.823)
IMF's Measure of Capital 0.084 " 0.025 0.045Account Liberalization (2.295) -0.751 (1.604)
Financial Liberalization 0.124 " 0.033 0.050Dummy (2.505) (0.686) (0.826)
Trading Costs - Fees and -0.001 0.001Commissions (0.430) (0.345)
No. of Observations 1003 468 984 433 151 978 459 964 431 150 993 464 979 435No. of Countries 77 64 77 28 41 77 63 77 28 41 77 64 77 28R-squared overall 0.221 0.238 0.231 0.124 0.086 0.061 0.064 0.062 0.047 0.015 0.124 0.177 0.159 0.071
33
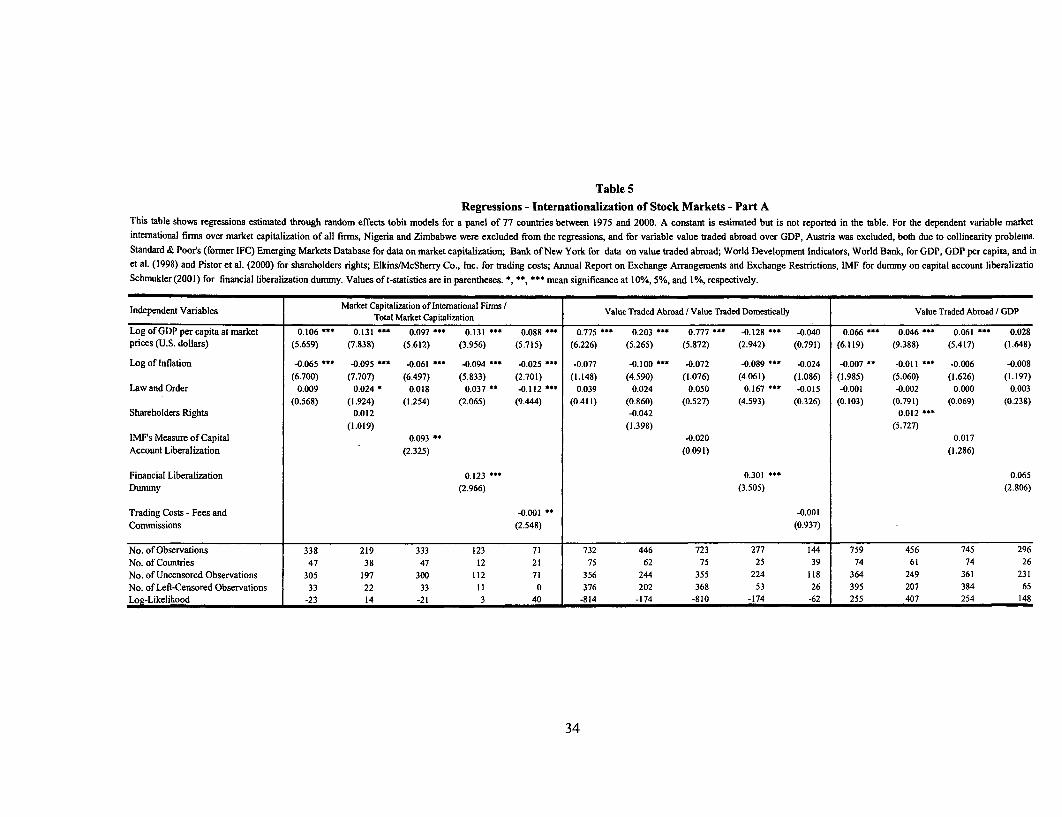
Table 5
Regressions - Internationalization of Stock Markets - Part AThis table shows regressions estimated through random effects tobit models for a panel of 77 countries between 1975 and 2000. A constant is estimated but is not reported in the table. For the dependent variable marketintemational finns over market capitalization of all firms, Nigeria and Zimbabwe were excluded from the regressions, and for variable value traded abroad over GDP, Austria was excluded, both due to collinearity problems.
Standard & Poor's (former IFC) Emerging Markets Database for data on market capitalization; Bank of New York for data on value traded abroad; World Development Indicators, World Bank, for GDP, GDP per capita, and in
et a]. (1998) and Pistor et al. (2000) for shareholders rights; Elkins/McSherry Co., Inc. for trading costs; Annual Report on Exchange Arrangements and Exchange Restrictions, IMF for dummy on capital account liberalizatio
Schmukler (2001) for financial liberalization dunimy. Values oft-statistics are in parentheses. *, *, "' mean significance at 10%, 5%, and 1%, respectively.
Independent Variables Market Capitalization of Intemational Fimis / Value Traded Abroad / Value Traded Domestically Value Traded Abroad / GDPTotal Market Capitalization .
Log of GDP per capita at market 0.106 ' 0.131 *' 0.097 * 0.131 ** 0.088 " 0.775 ' 0.203 ** 0.777 ' -0.128 ** -0.040 0.066 *** 0.046 ' 0.061 0.028prices (U.S. dollars) (5.659) (7.838) (5.612) (3.956) (5.715) (6.226) (5.265) (5.872) (2.942) (0.791) (6.119) (9.388) (5.417) (1.648)
Log of Inflation -0.065 "' -0.095 * -0.061 -* 0.094 ' -0.025 * -0.077 -0.100 * -0.072 -0.089 * -0.024 -0.007 ** -0.011 ** -0.006 -0.008(6.700) (7.707) (6.497) (5.833) (2.701) (1.148) (4.590) (1.076) (4.061) (1.086) (1.985) (5.060) (1.626) (1.197)
Law and Order 0.009 0.024 * 0.018 0.037 -0.112 * 0.039 0.024 0.050 0.167 * -0.015 -0.001 -0.002 0.000 0.003(0.568) (1.924) (1.254) (2.065) (9.444) (0.411) (0.860) (0.527) (4.593) (0.326) (0.103) (0.791) (0.069) (0.238)
Shareholders Rights 0.012 -0.042 0.012 *(1.019) (1.398) (5.727)
IMF's Measure of Capital 0.093 * -0.020 0.017Account Liberalization (2.325) (0.091) (1.286)
Financial Liberalization 0.123 *$* 0.301 * 0.065Dummy (2.966) (3.505) (2.806)
Trading Costs - Fees and -0.001 ** -0.001Commissions (2.548) (0.937)
No. of Observations 338 219 333 123 71 732 446 723 277 144 759 456 745 296No. of Countries 47 38 47 12 21 75 62 75 25 39 74 61 74 26No. of Uncensored Observations 305 197 300 112 71 356 244 355 224 118 364 249 361 231No. of Left-Censored Observations 33 22 33 11 0 376 202 368 53 26 395 207 384 65Log-Likelihood -23 14 -21 3 40 -814 -174 -810 -174 -62 255 407 254 148
34
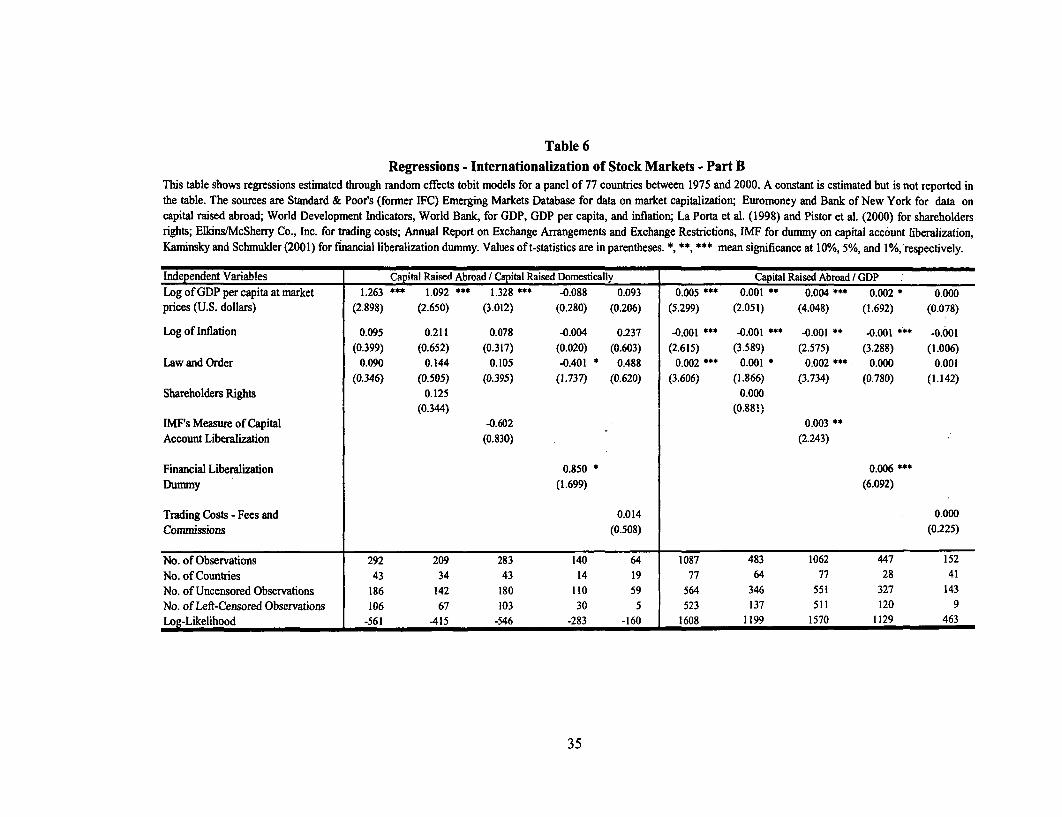
Table 6Regressions - Internationalization of Stock Markets - Part B
This table shows regressions estimated through random effects tobit models for a panel of 77 countries between 1975 and 2000. A constant is estimated but is not reported inthe table. The sources are Standard & Poor's (former IFC) Emerging Markets Database for data on market capitalization; Euromoney and Bank of New York for data oncapital raised abroad; World Development Indicators, World Bank, for GDP, GDP per capita, and inflation; La Porta et al. (1998) and Pistor et al. (2000) for shareholdersrights; Elkins/McSherry Co., Inc. for trading costs; Annual Report on Exchange Arrangements and Exchange Restrictions, IMF for dummy on capital account liberalization,Kaminsky and Schmukler (2001) for financial liberalization dummy. Values of t-statistics are in parentheses. ', , *' mean significance at 10%, 5%, and 1%, respectively.
Independent Variables Capital Raised Abroad / Capital Raised Domestically Capital Raised Abroad / GDPLog of GDP per capita at market 1.263 ** 1.092 * 1.328 *4* -0.088 0.093 0.005 ** 0.001 ** 0.004 *** 0.002 * 0.000prices (U.S. dollars) (2.898) (2.650) (3.012) (0.280) (0.206) (5.299) (2.051) (4.048) (1.692) (0.078)
Log of Inflation 0.095 0.211 0.078 -0.004 0.237 -0.001 *** -0.001 *** -0.001 * -0.001 *** -0.001(0.399) (0.652) (0.317) (0.020) (0.603) (2.615) (3.589) (2.575) (3.288) (1.006)
Law and Order 0.090 0.144 0.105 -0.401 * 0.488 0.002 * 0.001 * 0.002 * 0.000 0.001(0.346) (0.505) (0.395) (1.737) (0.620) (3.606) (1.866) (3.734) (0.780) (1.142)
Shareholders Rights 0.125 0.000(0.344) (0.881)
IMFs Measure of Capital -0.602 0.003Account Liberalization (0.830) (2.243)
Financial Liberalization 0.850 * 0.006 ***
Dumny (1.699) (6.092)
Trading Costs - Fees and 0.014 0.000Commissions (0.508) (0.225)
No. of Observations 292 209 283 140 64 1087 483 1062 447 152No. of Countries 43 34 43 14 19 77 64 77 28 41No. of Uncensored Observations 186 142 180 110 59 564 346 551 327 143No. of Left-Censored Observations 106 67 103 30 5 523 137 511 120 9Log-Likelihood -561 -415 -546 -283 -160 1608 1199 1570 1129 463
35

Appendix Table IList of Countries by Income Level
This table shows the list of countries grouped by income level following the classification of the WorldDevelopment Indicators, World Bank. The source is World Bank.
Low-Income Countries Middle-Income Countries High-Income Countries
Armenia Argentina AustraliaAzerbaijan Botswana AustriaBangladesh Brazil BelgiumBulgaria Chile BritainChina Croatia CanadaColombia Czech Republic DenmarkCote D'Ivoire Estonia FinlandEcuador Hungary FranceEgypt Korea GermanyGhana Malaysia GreeceIndia Mauritius Hong KongIndonesia Mexico IrelandIran Islamic Republic Poland IsraelJamaica Saudi Arabia ItalyJordan Slovak Republic JapanKazakhstan South Africa LuxembourgKenya Trinidad and Tobago MaltaKyrgyz Republic Turkey NetherlandsLatvia Venezuela. New ZealandLithuania NorwayMacedonia PortugalMoldova SingaporeMorocco SloveniaNigeria SpainPakistan SwedenPeru SwitzerlandPhilippines TaiwanRomania United StatesRussiaSri LankaThailandTunisiaUkraineUzbekistanZimbabwe
36

Appendix Table II
Series Description and Data SourcesThis table shows the description of the data used and their sources.
Series Names Description Source
Capital raised abroad (current Capital raised in international markets through depository receipts or equity issues. The sample is Euromoney and Bank of New YorkU.S. dollars) based on two sources: Euromoney and Bank of New York. The first covers all operations of
capital raised in international markets. The second covers capital raised through depositoryreceipts. The series are based on Euromoney's information, augmented by depository receiptsoperations reported in Bank of New York and not included in Euromoney. The series covercapital raising operations since 1980.
Capital raised domestically Total value of public offerings and rights issues during the period, excluding stock dividends or Standard & Pooes (former IFC) Emerging Markets Database(current U.S. dollars) bonus shares that do not raise cash.
Domestic market Market capitalization in domestic stock markets. Standard & Poor's (fofrmcr IFC) Emerging Markets Databasecapitalization (current U.S.dollars)
Domestic market Market capitalization of international companies at the end of the year. Series are computed in a Worldscope, Emerging Markets Database, and Bloombergcapitalization of international firm-level basis, by adding, for each country-year, the market capitalization of all companiescompanies (current U.S. with international activity. Companies with intemational activity are those identified as having atdollars)
least one active depository receipt program at any time in the year, or having raised capital in
intemational markets in the current or previous years, or trading in London Stock Exchange.
Domestic value traded Value traded in domestic stock market Standard & Poor's (former IFC) Emerging Markets Database(current U.S. dollars)
Value traded in depository Value traded in depository receipts covering the period 1989-2000. Series are computed in a Bank of New Yorkreceipts (current U.S. dollars) firm-level basis by adding all tickers belonging to the samne company on a yearly basis.
GDP at market prices (current Gross domestic product (GDP) at purchaser prices. GDP data is converted from domestic World Bank: World Development IndicatorsU.S. dollars) currencies using yearly official exchange rates. For a few countries where the official exchange
rate does not reflect the rate effectively applied to actual foreign exchange transactions, analternative conversion factor is used.
GDP per capita at market Gross domestic product divided by midyear population. World Bank: World Development Indicatorsprices (current U.S. dollars)
Inflation, consumer prices Inflation as measured by the consumer price index. World Bank: World Development Indicators(percent per year)
37
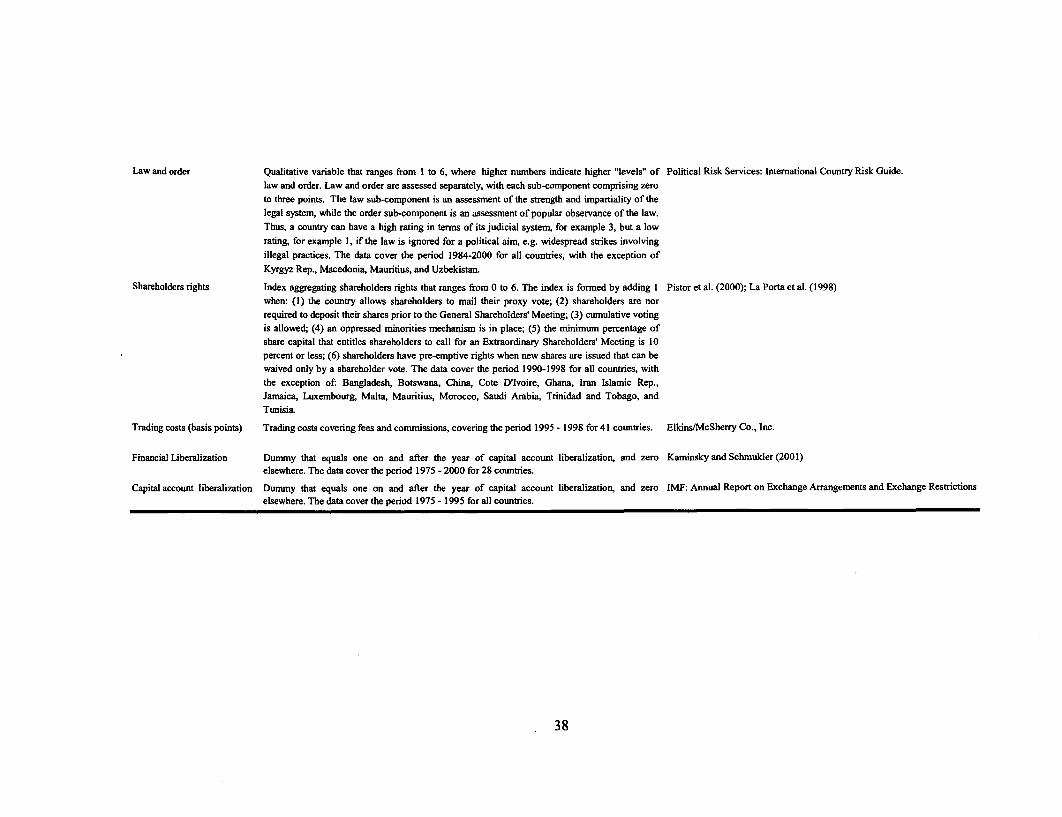
Law and order Qualitative variable that ranges from I to 6, where higher numbers indicate higher "levels" of Political Risk Services: Intemational Country Risk Guide.law and order. Law and order are assessed separately, with each sub-component comprising zeroto three points. The law sub-component is an assessment of the strength and impartiality of thelegal system, while the order sub-component is an assessment of popular observance of the law.Thus, a country can have a high rating in terms of its judicial systern, for example 3, but a lowrating, for example 1, if the law is ignored for a political aim, e.g. widespread strikes involvingillegal practices. The data cover the period 1984-2000 for all countries, with the exception ofKyrgyz Rep., Macedonia, Mauritius, and Uzbekistan.
Shareholders rights Index aggregating shareholders rights that ranges from 0 to 6. The index is formed by adding I Pistor et al. (2000); La Porta et al. (1998)when: (I) the country allows shareholders to mail their proxy vote; (2) shareholders are norrequired to deposit their shares prior to the General Shareholders' Meeting; (3) cumulative votingis allowed; (4) an oppressed minorities mechanism is in place; (5) the minimum percentage ofshare capital that entitles shareholders to call for an Extraordinary Shareholders' Meeting is 10percent or less; (6) shareholders have pre-emptive rights when new shares are issued that can bewaived only by a shareholder vote. The data cover the period 1990-1998 for all countries, withthe exception of: Bangladesh, Botswana, China, Cote D'Ivoire, Ghana, Iran Islamic Rep.,Jamaica, Luxembourg, Malta, Mauritius, Morocco, Saudi Arabia, Trinidad and Tobago, andTunisia.
Trading costs (basis points) Trading costs covering fees and commissions, covering the period 1995 - 1998 for 41 countries. Elkins/McSherry Co., Inc.
Financial Liberalization Dummy that equals one on and after the year of capital account liberalization, and zero Kaminsky and Schmukler (2001)elsewhere. The data cover the period 1975 - 2000 for 28 countries.
Capital account liberalization Dummy that equals one on and after the year of capital account liberalization, and zero IMF: Annual Report on Exchange Arrangements and Exchange Restrictionselsewhere. The data cover the period 1975 - 1995 for all countries.
38


Policy Research Working Paper Series
ContactTitle Author Date for paper
WPS2791 The Static and Dynamic Incidence of Dominique van de Walle February 2002 H. SladovichVietnam's Public Safety Net 37698
WPS2792 Determinants of Life Insurance Thorsten Beck February 2002 A. YaptencoConsumption across Countries Ian Webb 31823
WPS2793 Agricultural Markets and Risks: Panos Varangis February 2002 P. KokilaManagement of the Latter, Not the Donald Larson 33716Former Jock R. Anderson
WPS2794 Land Policies and Evolving Farm Zvi Lerman February 2002 M. FernandezStructures in Transition Countries Csaba Csaki 33766
Gershon Feder
WPS2795 Inequalities in Health in Developing Adam Wagstaff February 2002 H. SladovichCountries: Swimming against the Tide? 37698
WPS2796 Do Rural Infrastructure Investments Jocelyn A. Songco February 2002 H. SutrisnaBenefit the Poor? Evaluating Linkages: 88032A Global View, A Focus on Vietnam
WPS2797 Regional Integration and Development Maurice Schiff February 2002 P. Flewittin Small States 32724
WPS2798 Fever and Its Treatment among the Deon Filmer March 2002 H. SladovichMore or Less Poor in Sub-Saharan 37698Africa
WPS2799 The Impact of the Indonesian Lisa A. Cameron March 2002 P. SaderFinancial Crisis on Children: Data from 33902100 Villages Survey
WPS2800 Did Social Safety Net Scholarships Lisa A. Cameron March 2002 P. SaderReduce Drop-Out Rates during the 33902Indonesian Economic Crisis?
WPS2801 Policies to Promote Saving for Dimitri Vittas March 2002 P. InfanteRetirement: A Synthetic Overview 37642
WPS2802 Telecommunication Reforms, Access Antonio Estache March 2002 G. Chenet-SmithRegulation, and Internet Adoption Marco Manacorda 36370in Latin America Tommaso M. Valletti
WPS2803 Determinants of Agricultural Growth Yair Mundlak March 2002 P. Kokilain Indonesia, the Philippines, and Donald F. Larson 33716Thailand Rita Butzer
WPS2804 Liberalizing Trade in Agriculture: John S. Wilson March 2002 P. FlewittDeveloping Countries in Asia and the 32724Post-Doha Agenda
WPS2805 To Spray or Not to Spray? Pesticides, John S. Wilson March 2002 P. FlewittBanana Exports, and Food Safety Tsunehiro Otsuki 32724

Policy Research Working Paper Series
ContactTitle Author Date for paper
WPS2806 Dirty Exports and Environmental John S. Wilson March 2002 P. FlewittRegulation: Do Standards Matter to Tsunehiro Otsuki 32724Trade?
WPS 2807 The Role of Natural Resources in Benoit Bosquet March 2002 D. DuffFundamental Tax Reform in the 39506Russian Federation
WPS2808 A Capital Accord for Emerging Andrew Powell March 2002 E. MekhovaEconomies 85984
WPS2809 On the Measurement and Impact of Robert [). Ebel March 2002 M. MorrisFiscal Decentralization Serdar Yilmaz 37285
WPS2810 Growth, Distribution, and Poverty Luc Christiaensen March 2002 N. Nouvialein Africa: Messages from the 1990s Lionel Demery 34514
Stefano Paternostro
WPS2811 The Epidemiological Impact of an John Stover March 2002 H. SladovichHIV/AIDS Vaccine in Developing Geoff P. Garnett 37698Countries Steve Seitz
Steven Forsythe
WPS2812 Can Financial Markets be Tapped to Jerry Skees March 2002 P. KokilaHelp Poor People Cope with Weather Panos Varangis 33716Risks? Donald Larson
Paul Siegel
WPS2813 The Collective Model of the Household Kaushik Basu March 2002 N. Jamesonand an Unexpected Implication for Ranjan Ray 30677Child Labor: Hypothesis and anEmpirical Test
WPS2814 Estimating the Endogenously Gayatri Koolwal March 2002 N. JamesonDetermined Intrahousehold Balance Ranjan Ray 30677of Power and Its Impact on ExpenditurePattern: Evidence from Nepal
WPS2815 Pricing Currency Risk: Facts and Sergio L. Schmukler March 2002 E. KhinePuzzles from Currency Boards Luis Serven 37471
Related Documents