Munich Personal RePEc Archive Explaining the Awareness and Attitude of the Delhi Households in context of Electricity Consumption Tewathia, Nidhi Gargi College, Delhi University, India 6 June 2015 Online at https://mpra.ub.uni-muenchen.de/64854/ MPRA Paper No. 64854, posted 07 Jun 2015 13:33 UTC

Welcome message from author
This document is posted to help you gain knowledge. Please leave a comment to let me know what you think about it! Share it to your friends and learn new things together.
Transcript
Munich Personal RePEc Archive
Explaining the Awareness and Attitude
of the Delhi Households in context of
Electricity Consumption
Tewathia, Nidhi
Gargi College, Delhi University, India
6 June 2015
Online at https://mpra.ub.uni-muenchen.de/64854/
MPRA Paper No. 64854, posted 07 Jun 2015 13:33 UTC

Explaining the Awareness and Attitude of the Delhi Households in context of Electricity
Consumption
Nidhi Tewathia Assistant Professor, Department of Economics,
University of Delhi, Gargi College, Siri Fort Road, New Delhi 110041. Email id: [email protected]
ABSTRACT: Electricity has attained a very important place in every household on this planet. It is
a major contributor towards improvement of the standard of living of any individual, family and
society at large. The consumer habits constitute an important factor in deciding the electricity
consumption. Also, it will help in policy making for the conservation of electricity. The household
awareness is also identified by probing in the consumer behaviour. The respondents are the Delji
housheolds. Through stratified random sampling, 395 households were selected for collection of
data. Likert scale is used to find out the trend in consumer behaviour, awareness and habits of the
households. It is found that households need to take conservation steps in order to make judicious
use of the electricity. Households are found to have the environmental awareness with respect to
electricity consumption and generation but availability of various electrical appliances makes it
difficult for the household to stop the electricity wastage.
Keywords: Delhi; Electricity; Attitude; Awareness; Household
1. Introduction
The task of understanding energy-consuming behaviours has presented substantial
complexities. The complexities as per Ritchie et al. (1981), involve determining both the factors
that influence electricity-consuming behaviours and the nature of each influence. The potential
factors which influence electricity consuming behaviours include climatic conditions,
house/product/vehicle characteristics, household demographics, and attitudinal variables.
The investigations on consumers’ willingness to change habits and undertake energy savings
are relevant for the present study. In the literature, attitudes have been found to correlate with
electricity conservation behaviour. Psychology-based studies show mixed results. “Mass
information has limited success. Targeted information campaigns can be more effective” (OECD
2002). Gatersleben et al. (2002), through the results of two large-scale surveys of Dutch households,

showed that, among other things, households with high pro-environmental attitudes were often not
aware of the environmental impacts of their energy consumption, both directly and indirectly.
Gardner & Ashworth (2007) 1 came out with substantial results from their study in the
context of consumer behaviour and attitude. People who already use less electricity, women, and
people with more pro-environmental beliefs, attitudes and past behaviour have stronger intentions
to reduce their energy consumption. People with higher levels of knowledge tended to polarise,
reporting either very high or very low intentions to reduce consumption. These results are in line
with previous findings and with psychological theory. The findings for acceptance of both demand
management and distributed generation were fairly similar, even though individual survey
respondents only assessed one technology. Younger, more educated, working people, with
moderate size households including children and higher income levels, were more likely to accept
these technologies. People scoring higher on pro-environmental beliefs and behaviours, those with
positive attitudes and subjective norms towards energy reduction, and those with higher levels of
knowledge about energy/environment issues were also more likely to accept both technologies. In
direct demand management applications, air conditioners and pool pumps are the two high- load
appliances most likely to be controlled.
Collins (2010) says that the behavioural patterns for using appliances progress from
knowledge based to skill-based more rapidly when operation is less complex. Once a person is
operating an appliance using skill-based behaviour, the behaviour is harder to change. Another
thing pointed by him is that the people use instruction manuals less when the appliance is less
complex.
“Encouraging the electricity efficiency through an alteration of ‘lifestyles’ could be difficult
as this would involve changing how people live (which is a difficult and questionable task for a
government or any group to undertake), but a lso because changing lifestyles means changing
socialised ideas of taste and norms, which does not happen quickly” (McMichael, 2007).
1 The survey was developed with reference to psychological theory.

Collins (2010) also suggests that a household may have at least three motivations for
changing their energy use habits:
a. Financial: saving money on their monthly utility bill.
b. Environmental: reducing their carbon footprint.
c. Competitive: outperforming neighbours in saving energy.
Initially he looked at three mechanisms in particular: offering people cash rebates for reducing use,
providing them with more frequent feedback, and giving them tips on how to conserve energy. Not
surprisingly, the cash payments tended to work best, while the conservation tips showed the
smallest impact.
As per Jensen et al. (2011), “Small investments typically involve purchasing and installing
the gadget and a change of habits requiring time and effort, whereas the financial cost of the
investment itself is often small”. It is this kind of change in habits that the electricity saving
programmes are designed to induce. But the results from the literature are much more inconclusive.
According to Jensen et al. (2011), some studies find that willingness to change habits depends on
income, age, education, and household size, but most studies have not found these effects. The only
consistent result seems to be that the ownership status of the dwellings has no effect.
In fact, it has been observed by Collins, (2010) that households could also increase their use
of electricity if they see that their neighbours are using substantially more than they are”. This
phenomenon has been termed as the “Demonstration effect” in the fundamentals of economics. The
consumers feel peer pressure to remain in sync with the neighbourhood and hence have to maintain
a status level similar to the neighbours.
Reiss & White (2002) recognised that each household faces private costs of reducing
consumption in response to the public appeals. Through individual efforts, there remains a virtually
zero possibility of bringing about any tangible benefit with respect to the electricity crisis. But what
works for individuals is that there exists a considerable incentive to free-ride on whatever efforts are
made by others. The nature of individuals’ free-rider problem here and the lack of private incentives

for electricity conservation leave largely “moral suasion”- type arguments to explain their behaviour:
consumers individually wanting to “do their part” to mitigate the electricity crisis, and so forth.
Delhi is one of the biggest and most populous metropolitans in the world. The growth in the
population, density and the number of households in Delhi over the past three decades is clearly
visible from table 1.
Table 1 Population of Delhi (1981-2011)
S.No Item 1981 1991 2001 2011
1 Total population 6220406 9420644 13850507 16753235
2 Density of Population 4194 6352 9340 11297
3 Number of households 1211784 1860748 2554149 3340538
Source: Directorate of Census operations, Delhi
Along with population and income of Delhi, the domestic electricity consumption and the
number of domestic consumers has also increase steadily over the period of 2009-2013 (refer table
2).
Table 2 Domestic Consumption of Electricity in Delhi
S.No Period Domestic consumers
Domestic Electricity Consumption (in million units)
1 2009-10 3000383 8753
2 2010-11 3258647 9723
3 2011-12 3464611 10396
4 2012-13 3616611 10796
Source: Delhi Electricity Regulatory Commission (DERC)
Over the period of 2000-11, the share of domestic electricity consumption out of the total
electricity consumption of Delhi has gone up from 23% to 25.2%2. Over the period of 2006 to 2012,
the annual per capita electricity consumption has increased from 671.9 kWh to 879.22 kWh3. This
indicates towards an achievement of Delhi’s power sector both in terms of quantum of power
supply as well as the efficiency in generation and transmission of power.
Attitude of the consumers and their approach towards the consumption of power mould the
consumption pattern of electricity. Awareness towards the scarcity of electricity is one of the factors
which determine the attitude of a household for conservation of electricity. Attitude of a consumer
2 Ministry of Power/ Central Electricity Authority 3 August Report 2013, CEA
towards the consumption of a good or service is greatly affected by the family culture, habits,
lifestyle and awareness.
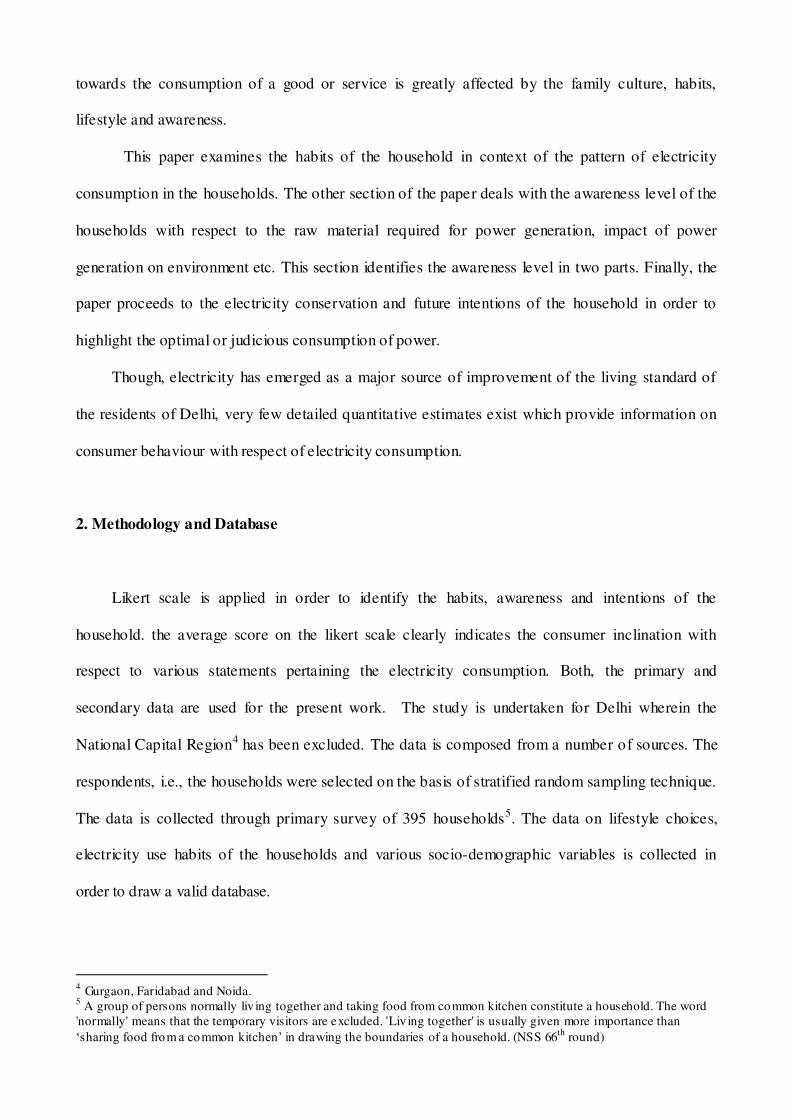
This paper examines the habits of the household in context of the pattern of electricity
consumption in the households. The other section of the paper deals with the awareness level of the
households with respect to the raw material required for power generation, impact of power
generation on environment etc. This section identifies the awareness level in two parts. Finally, the
paper proceeds to the electricity conservation and future intentions of the household in order to
highlight the optimal or judicious consumption of power.
Though, electricity has emerged as a major source of improvement of the living standard of
the residents of Delhi, very few detailed quantitative estimates exist which provide information on
consumer behaviour with respect of electricity consumption.
2. Methodology and Database
Likert scale is applied in order to identify the habits, awareness and intentions of the
household. the average score on the likert scale clearly indicates the consumer inclination with
respect to various statements pertaining the electricity consumption. Both, the primary and
secondary data are used for the present work. The study is undertaken for Delhi wherein the
National Capital Region4 has been excluded. The data is composed from a number of sources. The
respondents, i.e., the households were selected on the basis of stratified random sampling technique.
The data is collected through primary survey of 395 households5. The data on lifestyle choices,
electricity use habits of the households and various socio-demographic variables is collected in
order to draw a valid database.
4 Gurgaon, Faridabad and Noida.
5 A group of persons normally liv ing together and taking food from common kitchen constitute a household. The word
'normally' means that the temporary visitors are excluded. 'Liv ing together' is usually given more importance than
‘sharing food from a common kitchen’ in drawing the boundaries of a household. (NSS 66th
round)
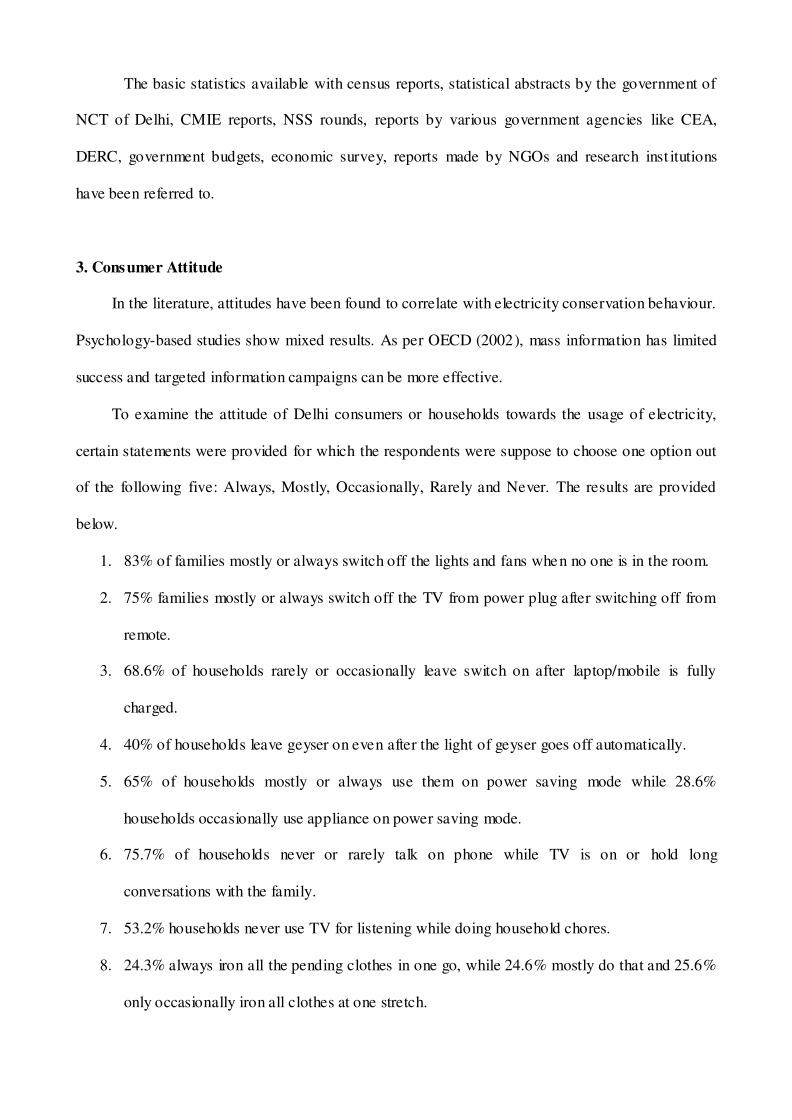
The basic statistics available with census reports, statistical abstracts by the government of
NCT of Delhi, CMIE reports, NSS rounds, reports by various government agencies like CEA,
DERC, government budgets, economic survey, reports made by NGOs and research inst itutions
have been referred to.
3. Consumer Attitude
In the literature, attitudes have been found to correlate with electricity conservation behaviour.
Psychology-based studies show mixed results. As per OECD (2002), mass information has limited
success and targeted information campaigns can be more effective.
To examine the attitude of Delhi consumers or households towards the usage of electricity,
certain statements were provided for which the respondents were suppose to choose one option out
of the following five: Always, Mostly, Occasionally, Rarely and Never. The results are provided
below.
1. 83% of families mostly or always switch off the lights and fans when no one is in the room.
2. 75% families mostly or always switch off the TV from power plug after switching off from
remote.
3. 68.6% of households rarely or occasionally leave switch on after laptop/mobile is fully
charged.
4. 40% of households leave geyser on even after the light of geyser goes off automatically.
5. 65% of households mostly or always use them on power saving mode while 28.6%
households occasionally use appliance on power saving mode.
6. 75.7% of households never or rarely talk on phone while TV is on or hold long
conversations with the family.
7. 53.2% households never use TV for listening while doing household chores.
8. 24.3% always iron all the pending clothes in one go, while 24.6% mostly do that and 25.6%
only occasionally iron all clothes at one stretch.

9. 49.1% of the households rarely keep warm food in the fridge but a good proportion of the
households i.e. 39.2% never store hot or warm food in the refrigerator.
10. 69% of households mostly or always see BEE label on the appliance before buying it.
11. 21% households occasionally use manuals for appliances while 71.7% mostly or always use
manuals.
After going through the above mentioned results, it seems that the habits of a typical
household are not too bad in terms of carelessness towards power consumption. However, there are
certain areas where corrective measures for the attitude towards electricity are required. Households
still have individuals who 1) leave the switch of the TV, laptop charger and geyser “on” when these
appliances are not in active use 2) do not refer to the manuals of the appliances before using them 3)
switch on the TV and talk over phone or keep doing household chores 4) leave the fans and lights
on in the room when there is no one in that room. It is important to probe the awareness level of the
households for it will give a better clarity as to why the power consuming attitude still requires
improvement.
4. Awareness of the Households
Awareness in general means knowing or being informed. For judicious use of electricity, it is
important that the consumers are well aware of the use and misuse of the electricity. The consumers
of electricity were asked if they are the informed and aware citizen of the state. The majority of the
households i.e. 72.2% agree (refer figure 1) that they are aware and informed and 24.3% strongly
agree that they are well informed and aware citizens of the state.
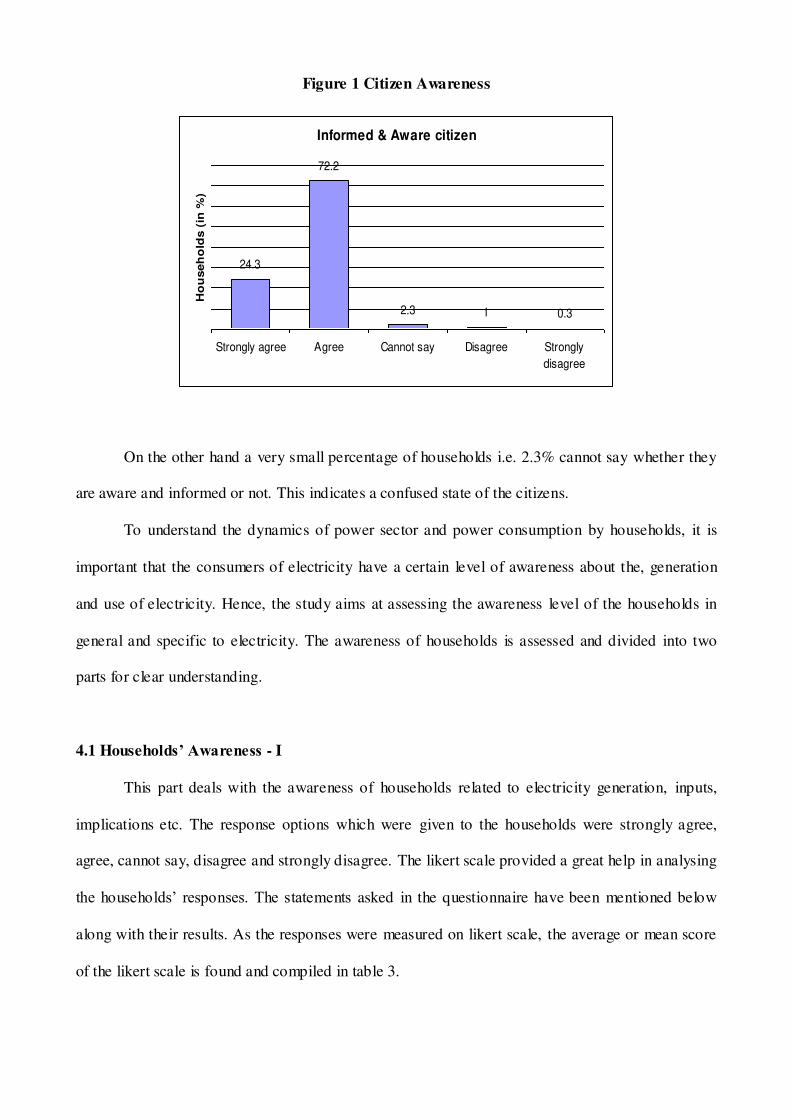
Figure 1 Citizen Awareness
Informed & Aware citizen
24.3
72.2
2.3 1 0.3
Strongly agree Agree Cannot say Disagree Strongly
disagree
Ho
useh
old
s (
in %
)
On the other hand a very small percentage of households i.e. 2.3% cannot say whether they
are aware and informed or not. This indicates a confused state of the citizens.
To understand the dynamics of power sector and power consumption by households, it is
important that the consumers of electricity have a certain level of awareness about the, generation
and use of electricity. Hence, the study aims at assessing the awareness level of the households in
general and specific to electricity. The awareness of households is assessed and divided into two
parts for clear understanding.
4.1 Households’ Awareness - I
This part deals with the awareness of households related to electricity generation, inputs,
implications etc. The response options which were given to the households were strongly agree,
agree, cannot say, disagree and strongly disagree. The likert scale provided a great help in analysing
the households’ responses. The statements asked in the questionnaire have been mentioned below
along with their results. As the responses were measured on likert scale, the average or mean score
of the likert scale is found and compiled in table 3.

A) I am aware of the adverse effects of electricity generation: The majority of the households
(69.9%) agree that they are aware of the fact that the electricity generation has adverse effects. The
households which strongly agree to this statement are 22.5% of the total sample. These results
indicate that a general household knows that the electricity generation leads to some adverse effects.
B) Electricity is not scarce and should not be conserved: Majority of the households (51.4%)
have disagreed to this statement and the second majority i.e. 42.8% strongly disagrees that the
electricity is not scarce and should not be conserved. This indicates that the general citizen of the
state has a fair understanding of the scarcity of electricity. The households also believe that
electricity should be conserved.
C) The raw material required for electricity generation is readily available: The raw material
which is largely required for generating electricity comprises of coal (thermal plants) and water
(Hydro plants). Only 38.5% of the households disagree and 20.3% of the households strongly
disagree that the raw material required for electricity is readily available. But, proportion as high as
36.7% “cannot say” whether the raw material is readily available or not. The figures indicate that
the households are not well aware about the availability of the raw material for electricity
generation. This is mainly due to the fact that households do not find it important to know the
dynamics of the supply side of electricity and are just bothered with the availability of the electricity
at their homes.
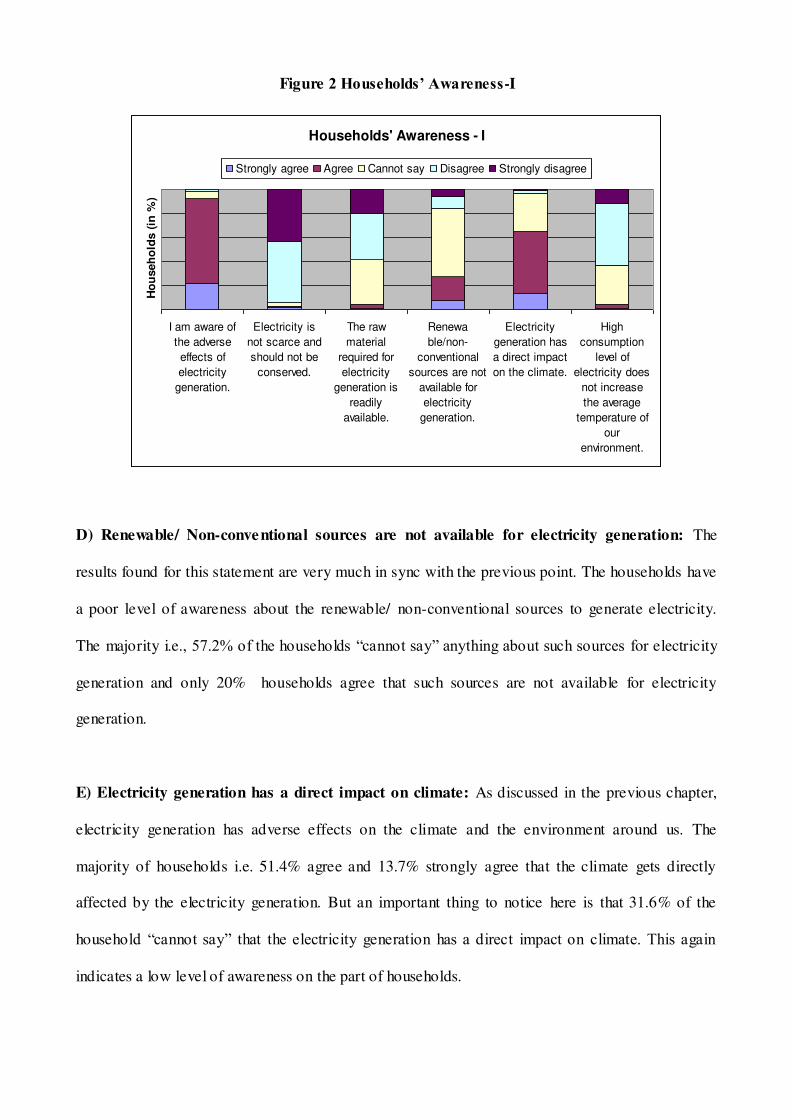
Figure 2 Households’ Awareness-I
Households' Awareness - I
I am aware of
the adverse
effects of
electricity
generation.
Electricity is
not scarce and
should not be
conserved.
The raw
material
required for
electricity
generation is
readily
available.
Renewa
ble/non-
conventional
sources are not
available for
electricity
generation.
Electricity
generation has
a direct impact
on the climate.
High
consumption
level of
electricity does
not increase
the average
temperature of
our
environment.
Ho
useh
old
s (
in %
)
Strongly agree Agree Cannot say Disagree Strongly disagree
D) Renewable/ Non-conventional sources are not available for electricity generation: The
results found for this statement are very much in sync with the previous point. The households have
a poor level of awareness about the renewable/ non-conventional sources to generate electricity.
The majority i.e., 57.2% of the households “cannot say” anything about such sources for electricity
generation and only 20% households agree that such sources are not available for electricity
generation.
E) Electricity generation has a direct impact on climate: As discussed in the previous chapter,
electricity generation has adverse effects on the climate and the environment around us. The
majority of households i.e. 51.4% agree and 13.7% strongly agree that the climate gets directly
affected by the electricity generation. But an important thing to notice here is that 31.6% of the
household “cannot say” that the electricity generation has a direct impact on climate. This again
indicates a low level of awareness on the part of households.

Table 3 Mean score of Household Awareness-I
S.No Statement SA
(%)
A
(%)
CS
(%)
D
(%)
SD
(%)
Mean
score of
likert
scale
1 I am aware of the adverse effects of
electricity generation.
22.5 69.9 6.3 1.3 0 1.14
2 Electricity is not scarce and should not be conserved.
1.5 1.8 2.5 51.4 42.8 -1.32
3 The raw material required for electricity
generation is readily available.
0.8 3.8 36.7 38.5 20.3 -0.74
4 Renewable/non-conventional sources are not available for electricity generation.
7.1 20 57.2 9.9 5.8 0.13
5 Electricity generation has a direct impact
on the climate.
13.7 51.4 31.6 2.3 1 0.74
6 High consumption level of electricity does not increase the average
temperature of our environment.
0.8 3.8 32.7 51.1 11.6 -0.69
Note: Scores and full forms; SA=Strongly Agree (2), A=Agree (1), CS=Cannot Say (0), D=Disagree (-1) and SD=Strongly Disagree (-2)
F) High consumption level of Electricity does not increase the average temperature of our
environment: A majority of households i.e. 51.1% disagree that higher electricity consumption
does not increase the average temperature of our environment but on the other hand 32.7% of the
households “cannot say” this. Such households either are not able to connect the adverse effects of
electricity generation with the effect in average temperature around us or they do not have
awareness that the electricity generation can lead to some adverse effects, at first place.
4.2 Households’ Awareness -II
The second category of households’ awareness deals with awareness related with the house
and electricity consumption. The statements like a) presence of sunlight in the house saves
electricity, b) walls of the house should not be painted with light colours, c) home with BEE
labelled appliances does not consume less electricity and d) reducing the electricity wastage will
help protect the environment; have been tested with the households in this section. The likert scale
was applied for recording the responses of the households. The visual representation is shown in
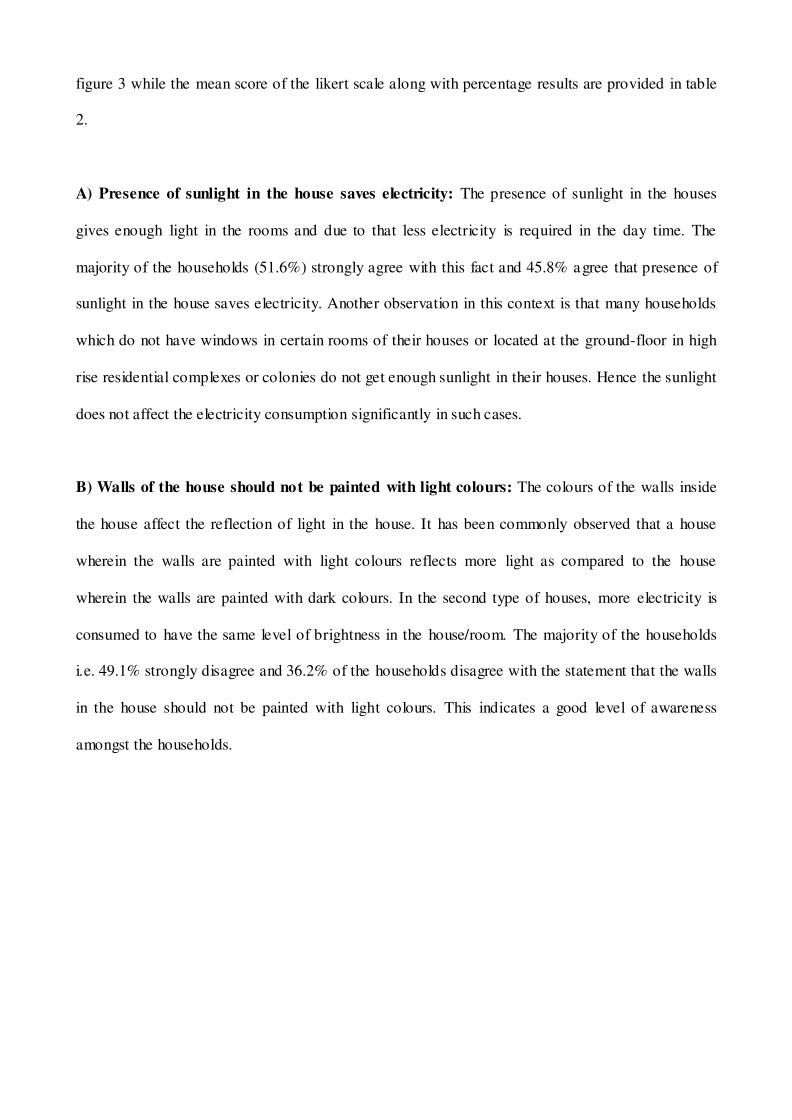
figure 3 while the mean score of the likert scale along with percentage results are provided in table
2.
A) Presence of sunlight in the house saves electricity: The presence of sunlight in the houses
gives enough light in the rooms and due to that less electricity is required in the day time. The
majority of the households (51.6%) strongly agree with this fact and 45.8% agree that presence of
sunlight in the house saves electricity. Another observation in this context is that many households
which do not have windows in certain rooms of their houses or located at the ground-floor in high
rise residential complexes or colonies do not get enough sunlight in their houses. Hence the sunlight
does not affect the electricity consumption significantly in such cases.
B) Walls of the house should not be painted with light colours: The colours of the walls inside
the house affect the reflection of light in the house. It has been commonly observed that a house
wherein the walls are painted with light colours reflects more light as compared to the house
wherein the walls are painted with dark colours. In the second type of houses, more electricity is
consumed to have the same level of brightness in the house/room. The majority of the households
i.e. 49.1% strongly disagree and 36.2% of the households disagree with the statement that the walls
in the house should not be painted with light colours. This indicates a good level of awareness
amongst the households.
Figure 3 Households’ Awareness-II
Households' Awareness - II
0
20
40
60
80
100
120
Strongly agree Agree Cannot say Disagree Strongly disagree
Ho
useh
old
s (
in %
)
Reducing the electricity wastage will help protect the environment.
Presence of sunlight in the house saves electricity.
Home with BEE labelled appliances does not consume less electricity.
Walls of the house should not be painted with light colours.
C) Home with BEE labelled appliances does not consume less electricity: BEE labelled
appliances are energy efficient appliances. Such appliances consume less electricity to do the same
task e.g. BEE labelled TV will consume less electricity when used as compared to a non-BEE
labelled TV. The majority of the households i.e. 44.6% disagree and 32.7% strongly disagree that
the houses which have BEE labelled appliances do not consume less electricity. These results also
indicate a good level of awareness amongst the households with respect to the BEE labelled
electrical appliances.
D) Reducing the electricity wastage will help protect the environment: The majority of the
households feel that reducing the electricity wastage will help protect the environment. These
households are well aware that consumption of electricity has repercussions on environment and
hence the electricity consumption shall be reduced through judicious use of electricity. A proportion
as high as 52.9% strongly agree and 41.3% of households agree that reducing the electricity
wastage will help protect the environment.

Table 4 Mean score of Household Awareness-II
S.No Statement SA
(%)
A (%) CS
(%)
D
(%)
SD
(%)
Mean
score of
likert
scale
1 Reducing the electricity wastage
will help protect the environment.
52.9 41.3 5.1 0.3 0.3 1.47
2 Presence of sunlight in the house saves electricity.
51.6 45.8 2 0.5 0 1.49
3 Walls of the house should not be painted with light colours.
2.8 4.8 7.1 36.2 49.1 -1.24
4 Home with BEE labelled appliances does not consume less electricity.
0.5 2.8 19.5 44.6 32.7 -1.06
Note: Scores and full forms; SA=Strongly Agree (2), A=Agree (1), CS=Cannot Say (0), D=Disagree (-1) and SD=Strongly Disagree (-2)
5. Electricity Conservation
Over the past few years, electricity being scarce and power failures still prevalent, some
households are observing steps to reduce the electricity consumption or to reduce the wasteful usage
of electricity. When consumers make decisions to conserve energy – such as; by using less hot
water or turning lights off around the house – it is likely they lose some utility by having to expend
the extra effort in the conservation. With perfect information relating consumption to cost, they will
only conserve when the utility of lowering their bill (and reducing their GHG footprint) outweighs
the disutility of using less energy. The present study investigates the steps of conserving electricity
by the households in this section.
Majority of the households agree (33.9%) and strongly agree (46.6%) that they have
complete control over reducing the household electricity (refer figure 4) and a majority disagrees
(51.6%) and strongly disagrees (21.5%) that they are not aware of different ways to reduce the
wastage of electricity.
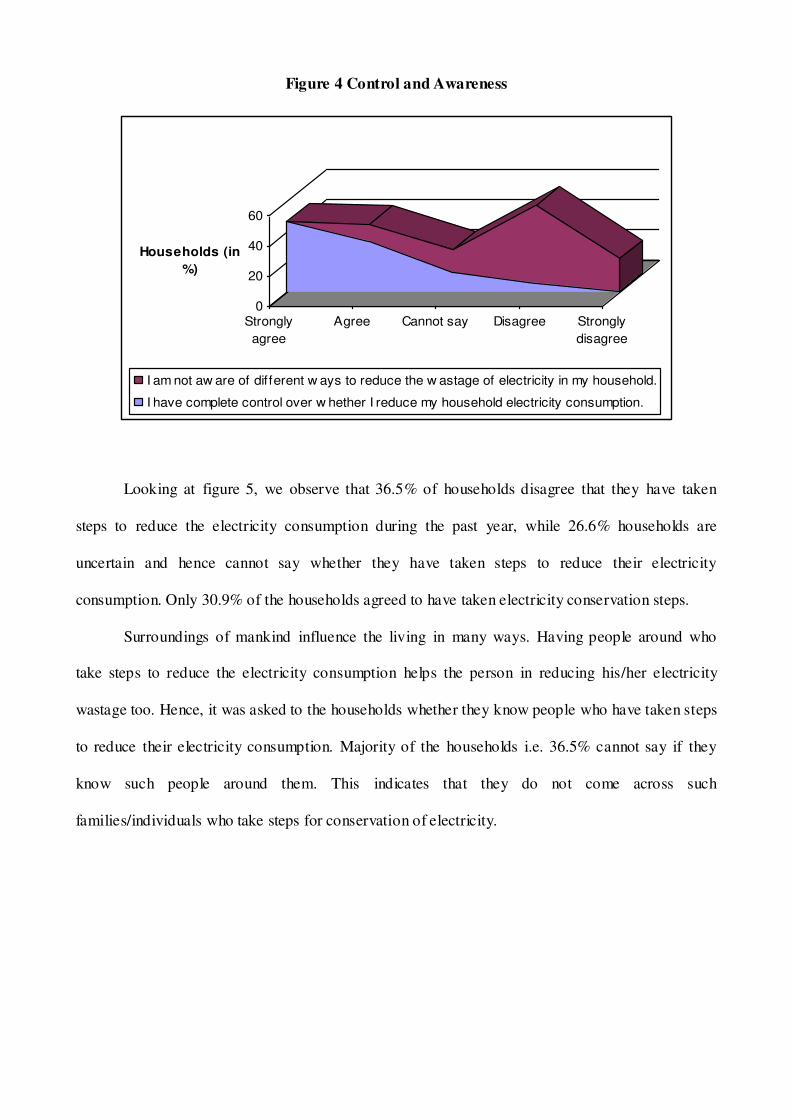
Figure 4 Control and Awareness
0
20
40
60
Households (in
%)
Strongly
agree
Agree Cannot say Disagree Strongly
disagree
I am not aw are of different w ays to reduce the w astage of electricity in my household.
I have complete control over w hether I reduce my household electricity consumption.
Looking at figure 5, we observe that 36.5% of households disagree that they have taken
steps to reduce the electricity consumption during the past year, while 26.6% households are
uncertain and hence cannot say whether they have taken steps to reduce their electricity
consumption. Only 30.9% of the households agreed to have taken electricity conservation steps.
Surroundings of mankind influence the living in many ways. Having people around who
take steps to reduce the electricity consumption helps the person in reducing his/her electricity
wastage too. Hence, it was asked to the households whether they know people who have taken steps
to reduce their electricity consumption. Majority of the households i.e. 36.5% cannot say if they
know such people around them. This indicates that they do not come across such
families/individuals who take steps for conservation of electricity.
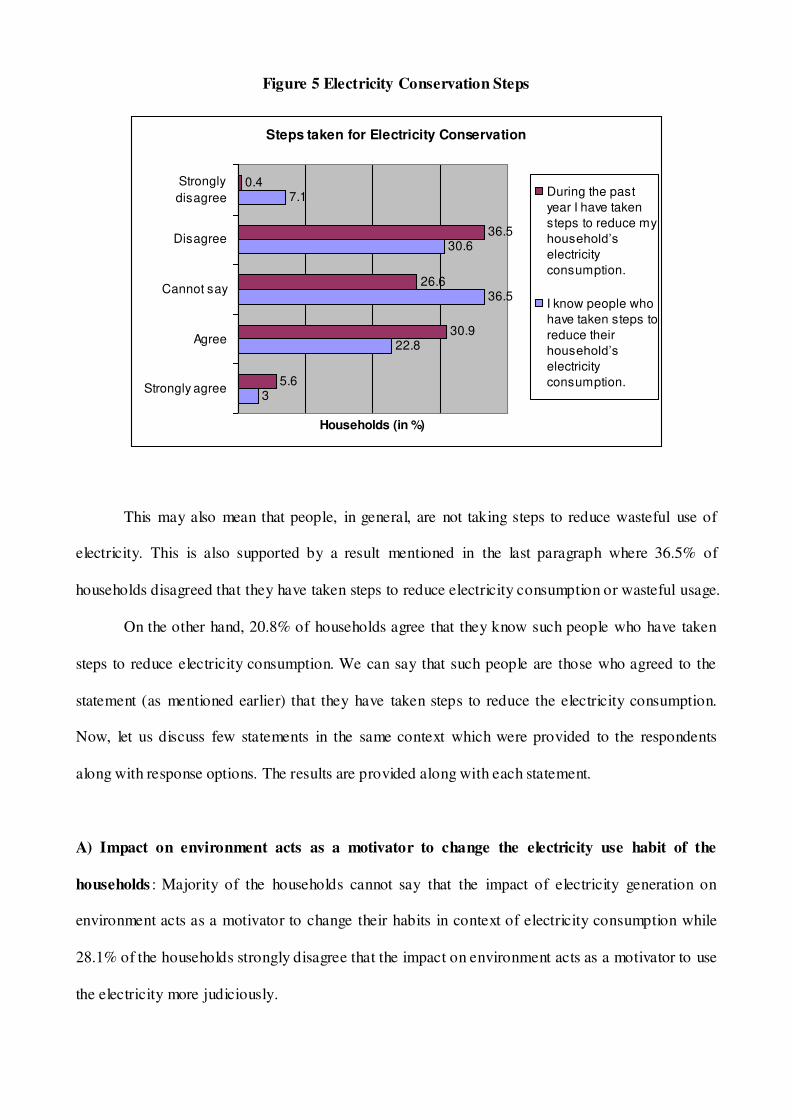
Figure 5 Electricity Conservation Steps
Steps taken for Electricity Conservation
3
22.8
36.5
30.6
7.1
5.6
30.9
26.6
36.5
0.4
Strongly agree
Agree
Cannot say
Disagree
Strongly
disagree
Households (in %)
During the past
year I have taken
steps to reduce my
household’selectricity
consumption.
I know people who
have taken steps to
reduce their
household’selectricity
consumption.
This may also mean that people, in general, are not taking steps to reduce wasteful use of
electricity. This is also supported by a result mentioned in the last paragraph where 36.5% of
households disagreed that they have taken steps to reduce electricity consumption or wasteful usage.
On the other hand, 20.8% of households agree that they know such people who have taken
steps to reduce electricity consumption. We can say that such people are those who agreed to the
statement (as mentioned earlier) that they have taken steps to reduce the electricity consumption.
Now, let us discuss few statements in the same context which were provided to the respondents
along with response options. The results are provided along with each statement.
A) Impact on environment acts as a motivator to change the electricity use habit of the
households : Majority of the households cannot say that the impact of electricity generation on
environment acts as a motivator to change their habits in context of electricity consumption while
28.1% of the households strongly disagree that the impact on environment acts as a motivator to use
the electricity more judiciously.
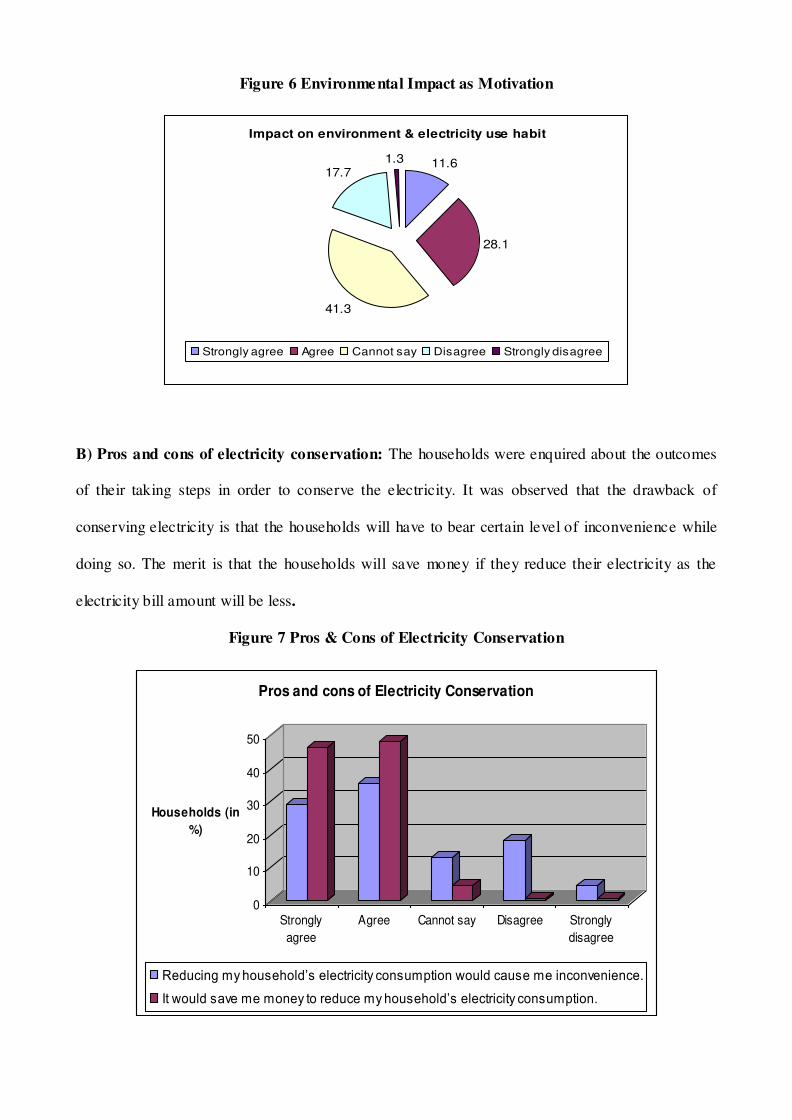
Figure 6 Environmental Impact as Motivation
Impact on environment & electricity use habit
11.6
28.1
41.3
17.71.3
Strongly agree Agree Cannot say Disagree Strongly disagree
B) Pros and cons of electricity conservation: The households were enquired about the outcomes
of their taking steps in order to conserve the electricity. It was observed that the drawback of
conserving electricity is that the households will have to bear certain level of inconvenience while
doing so. The merit is that the households will save money if they reduce their electricity as the
electricity bill amount will be less.
Figure 7 Pros & Cons of Electricity Conservation
0
10
20
30
40
50
Households (in
%)
Strongly
agree
Agree Cannot say Disagree Strongly
disagree
Pros and cons of Electricity Conservation
Reducing my household’s electricity consumption would cause me inconvenience.
It would save me money to reduce my household’s electricity consumption.

The majority of households agree (48.1%) and strongly agree (46.1%) that they will save
some money if they choose to reduce the electricity consumption for their household. But, the
majority also agrees (35.4%) and strongly agrees (29.1%) with the statement that they will be
caused inconvenience if they reduce the electricity consumption. But, an important thing to notice
here is that 18.2% of households disagree that reducing their electricity consumption will cause
them inconvenience.
5.1 Issues in Collective action
Public appeals for energy conservation by government officials have a long history in times
of energy crises. Reiss and White (2008) found that the households’ electricity consumption fell
quite substantially when prices were not changing. It was attributed to the influence of public
appeals on the citizens. But, in economic terms, voluntary conservation is a collective-action
problem which is subject to extreme free-rider issues. Substantial benefits accrue only if the
aggregate consumer participation is high, and no one can be excluded from the benefits of collective
success.
The major hindrance is that the chance of any single household’s effort being pivotal in
averting a power blackout is very small. The main idea is that each household faces private costs of
reducing electricity consumption in response to the public appeals which means there is a virtually
zero possibility of bringing about any substantial benefit with respect to the power crisis through
individual household effort. In other words, there lies a considerable incentive to free-ride on
whatever efforts are made by other individuals or households.
In these respects, voluntarily conserving electricity in response to public appeals is like
contributing anonymously to a public good. The reason behind this anonymity is that there is no
real way to know whether a particular household is conserving electricity or not, even among our
immediate neighbours. The nature of individuals’ free-rider problem here and the lack of private

incentives for electricity conservation largely lead to the “moral suasion”- type arguments in order
to explain the noted behaviour. The households are individually wanting to “do their part” to
mitigate the electricity crisis but are not incentivised in a visible manner.
5.2 Households’ Intentions
A few questions in the questionnaire aimed at knowing the intentions of the households in
context of electricity conservation.
A) Willingness to pay extra for an energy efficient home: The households were asked if they
would be willing to pay some extra amount on the price of a house which is energy efficient. It was
observed that 46% of the households were willing to pay 5% more on the price of the energy
efficient house while 39% households are willing to pay even 10% over and above the cost of such
house (see figure 8). Only 3% of the sample households indicated that they are not willing to pay
higher price for an energy efficient home.
Figure 8 Willingness to pay for Energy Efficient Home
Willingness to pay Extra for Energy Efficient Home
39%
46%
12%3%
Willing to pay 10% more Willing to pay 5% more
Willing to pay 2% more Not willing to pay extra
B) Intentions of reducing electricity consumption: The households were asked about the
intentions of reducing their electricity consumption in the coming year. It was observed that 56.2%
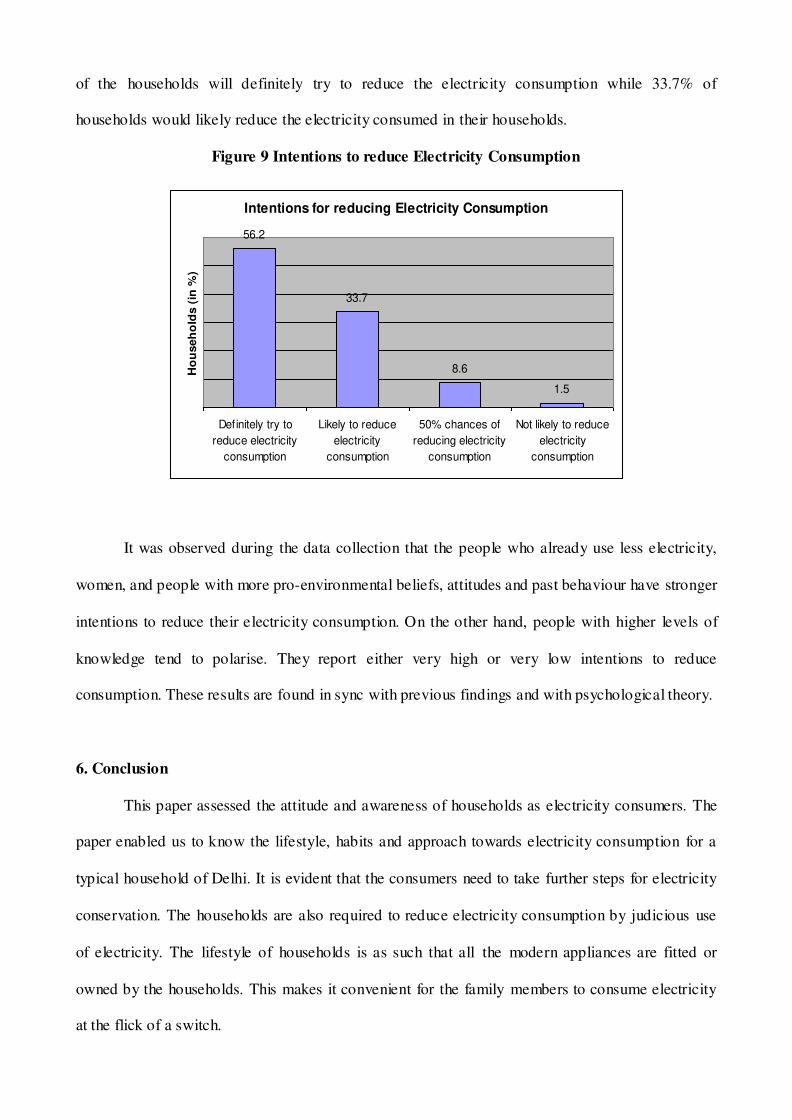
of the households will definitely try to reduce the electricity consumption while 33.7% of
households would likely reduce the electricity consumed in their households.
Figure 9 Intentions to reduce Electricity Consumption
Intentions for reducing Electricity Consumption
56.2
33.7
8.6
1.5
Definitely try to
reduce electricity
consumption
Likely to reduce
electricity
consumption
50% chances of
reducing electricity
consumption
Not likely to reduce
electricity
consumption
Ho
useh
old
s (
in %
)
It was observed during the data collection that the people who already use less electricity,
women, and people with more pro-environmental beliefs, attitudes and past behaviour have stronger
intentions to reduce their electricity consumption. On the other hand, people with higher levels of
knowledge tend to polarise. They report either very high or very low intentions to reduce
consumption. These results are found in sync with previous findings and with psychological theory.
6. Conclusion
This paper assessed the attitude and awareness of households as electricity consumers. The
paper enabled us to know the lifestyle, habits and approach towards electricity consumption for a
typical household of Delhi. It is evident that the consumers need to take further steps for electricity
conservation. The households are also required to reduce electricity consumption by judicious use
of electricity. The lifestyle of households is as such that all the modern appliances are fitted or
owned by the households. This makes it convenient for the family members to consume electricity
at the flick of a switch.
References:
CEA, August 2013 Report.
Collins, M.T., (2010), Managing Residential Energy Demand through Provision of Better Feedback . Delhi Statistical Handbook, 2013.
DERC Reports from www.derc.gov.in
Directorate of Census Operations, Delhi (2011)
Gardner, J., and Ashworth, P., (2007), Public Attitudes toward Electricity Alternatives: Results from
a Survey of Australian Householders, pp 2008-944.
Gatersleben, B., Steg, L., and Vlek, C., (2002), Measurement and Determinants of Environmentally
Significant Consumer Behaviour, Environment and Behaviour, Vol. 34, No. 3, pp
335-362.
Jensen, C. L., Hansen, L.G., Fjordbak, T., Gudbjerg, E., (2011), The Effect of providing Free Auto-
Poweroff Plugs to Households on Electricity Consumption- A Field Experiment, FOI working paper.
Level and Pattern of Household Consumer Expenditure in Delhi, Based on N.S.S. 66th Round, July
2009-June 2010. McMichael, M., (2007), A social capital approach to household energy consumption, ECEEE.
OECD, (2002), Environmental and Health Impacts of Electricity Generation - A Comparison of the
Environmental Impacts of Hydropower with Those of Other Generation
Technologies, The International Energy Agency.
Reiss, P.C., and White, M.W., (2002), Household Electricity Demand- Revisited, Review of Economic Studies, Vol. 72, pp 853–883.
Ritchie, J.R.B., Mcdougall, H.G., and Claxton, J.D., (1981), Complexities of Household Energy
Consumption and Conservation, The Journal of Consumer Research, pp 233-242.
World Bank, (2008), Residential Consumption of Electricity in India, Documentation of data and
methodology, Background Paper, India: Strategies for Low Carbon Growth.
Related Documents