Explaining Student Performance Evidence from the international PISA, TIMSS and PIRLS surveys Final Report November 2005

Welcome message from author
This document is posted to help you gain knowledge. Please leave a comment to let me know what you think about it! Share it to your friends and learn new things together.
Transcript

Explaining Student Performance Evidence from the international PISA, TIMSS and PIRLS surveys Final Report November 2005

Explaining Student Performance Evidence from the international PISA, TIMSS and PIRLS surveys Jens Henrik Haahr with Thomas Kibak Nielsen, Martin Eggert Hansen and Søren Teglgaard Jakobsen www.danishtechnology.dk [email protected] This study was carried out on behalf of the European Commission’s Directorate-General for Education and Culture. Views expressed represent exclusively the positions of the authors and do not necessarily correspond to those of the European Commission.

1
Contents Index .......................................................................................................................... 2
1. Executive Summary................................................................................................. 4 1.1. Education Systems and Basic Skills................................................................. 4 1.2. Student Background Characteristics and Basic Skills.................................... 10 1.3. School Characteristics and Basic Skills ......................................................... 13 1.4. Individual Student Characteristics and Basic Skills....................................... 17 1.5. New Analysis and Data Collection Activities................................................ 19
2. Introduction............................................................................................................ 22 2.1. Objectives....................................................................................................... 22 2.2. Scope of the Study.......................................................................................... 24 2.3. Approach and Methodology........................................................................... 32
3. A Framework for Analysing Basic Skills Education Outcomes........................ 37
4. Overall Performances: Status and Developments .............................................. 39 4.1. Average Performance and its Development................................................... 39 4.2. Variations within Countries ........................................................................... 51 4.3. Economic Resources and PISA Achievement Scores.................................... 63 4.4. Policy Implications......................................................................................... 66
5. Student Background and Basic Skills .................................................................. 72 5.1. Foreign Background and Basic Skills ............................................................ 72 5.2. Socio-Economic Background and Basic Skills .............................................. 82 5.3. Gender and Basic Skills ................................................................................. 96 5.4. The Overall Significance of Student Background.......................................... 98 5.5. Policy Implications....................................................................................... 101
6. Student Attitudes and Behaviour and Basic Skills ........................................... 107 6.1. Motivational Factors .................................................................................... 109 6.2. Self-Related Beliefs...................................................................................... 116 6.3. Learning Strategies....................................................................................... 121 6.4. Learning Situations ...................................................................................... 126 6.5. Emotional Factors ........................................................................................ 129 6.6. Overview and Discussion............................................................................. 132 6.7. How Learner Characteristics Vary Across Schools ..................................... 135 6.8. Policy Implications....................................................................................... 136
7. The Educational Environment and Basic Skills ............................................... 140 7.1. The Organization of Education .................................................................... 140 7.2. The Learning Environment .......................................................................... 154 7.3. Policy Implications....................................................................................... 171
Literature..................................................................................................................... 180
Annex 1: New Analysis and Data Collection Activities ........................................... 186
Annex 2: What Lies Behind the Case of Finland, the Top Performing Country? 194
Annex 3: Development and Policy Reform: Latvia and Poland............................. 203
Annex 4: Relevant Data Tables ................................................................................. 206

2
Index A
Admittance policies .....................................157 Age cohorts....................................................25 Analytical framework ....................................37 Anxiety ...................... 17,108,129-132,135-137 Attitudes toward school ........................109,115
B
Bilingual tuition .................................11,80,105
C
Centrally set exams............. 14-15,156-157,176 Comparability of test results ..........................28 Competitive learning......................108,126,132 Control strategies .........................................121 Co-operative learning ....................108,126,132
D
Density of non-native students................. 81-82 Development over time in mean scores ... 47-48 Dutch education system.................................58
E
Early home reading activities................... 93-94 Early school start .........................................154 East Asian educational systems .....121,133,138 Education research..................................21,188 Educational resources in home ......................92 Educational spending.....................................66 Elaboration strategies...................................121 Emotional factors 17,108,111,129-132,135-137 Enjoyment....................................................111 EU education objectives ..................... 22-24,35
F
Finnish education system........................71,194 Foreign background ............................ 72-76,78 Foreign language skills ........................ 190-191
G
Gender ......................................................96,98 Gender and basic skills ........... 36,72,96-98,183 Geographical coverage ..................................26
H
Home work ..................................................165 Home-school involvement ....................... 94-95
I
ICT skills ................................... 16,23,190-192 Instruction time................... 8,164-166,177-178
Instructional material, computers......... 169-171 Interpreting differences in PISA scores .........47
L
Learning strategies...........108,121-122,132,135 Lisbon strategy...........22-24,32,35,101,191,193 Low achieving students ...................... 59,60-62
M
Memorization strategies...............................121 Motivation.......... 4,7,17-18,36,38,107-109,110-
113,116,130-133,135-139,197
N
Nordic education systems ..............................57 Number of instructional weeks .............165,212
O
Organization of reading instruction .............167 Out-of-school learning activities.......... 163-164
P
Parents’ occupational status..................... 83-84 Policy reform .................9,12,50,68,70,103,203 Pre-schooling ......... 8,37,140,151-153,171,174-
175,184 Private vs. public schools.... 7,143,146,172-173 Problem solving ....24-25,183-184,190,206-207
R
Reforms in Finland ......................................196 Reforms in Latvia ..................................9,50,68 Reforms in Poland .................................9,50,68
S
Sampling designs ...........................................28 School autonomy 7,13-15,37,140-143,157,171-
172,176,200-201 School autonomy and external exit exams...157 School climate .........4,15-16,154,159-163,176-
177,210 School infrastructure...............................16,169 School management...................... 140-142,157 Self-confidence ........... 17,30,108,116-120,132-
133,135,137,198 Sense of belonging at school..........108,110,132 Share of immigrants.......................................43 Single parents...................................... 12,87-88 Small n problem.................................19,33,186 Student assessments......... 14,140-141,154,175-
176,193

3
T
Teacher education................20-21,188,194,201 Teacher shortage.....................154,168,169,171 Test populations.............................................29 Time devoted to learning .............................163 Tracking vs. comprehensive school systems . 5-
6,15,53,55,58-59,140,146-150,158,161,171-174,177
V
Variations within countries ............................51
W
Wealth................................................. 63-65,68
______________________________________________
Executive Summary 4
1. Executive Summary Analysing data from three international surveys of students’ skills, PISA, TIMSS and PIRLS, the objectives of the current study are twofold: • To formulate recommendations on improved provision of basic skills educa-
tion in the EU, on the basis of an increased understanding of the outcomes of the PISA, TIMSS, and PIRLS surveys.
• To formulate recommendations for improved or new data collection activi-ties to cover data needs in the area of basic skills.
Our analysis has focused on conditions for the provision of basic skills at differ-ent levels: A systemic level, covering factors concerning the systemic character-istics of educational systems and the consequences for students’ basic skills; A structural level, covering socio-economic background characteristics of students, the significance of these factors for students’ basic skills, and the capacities of education systems to adjust for differences in students’ socio-economic back-ground; A school level, covering aspects of school management and school cli-mate and the significance of these factors for students’ basic skills; and an indi-vidual level, concerning the significance of student attitudes, motivation and learning behaviour, and their consequences for students’ achievements. This executive summary presents key findings and recommendations resulting from the study at these four different levels. It addresses the Member States of the European Union and the European Commission, the EFTA-EEA and the Acceding and Candidate Countries. The assessment of results and the recommendations that are put forward rest on a normative foundation, which can be derived from the EU’s Lisbon Strategy: • Education systems should enable as many students as possible to perform as
strongly as possible in mathematics, reading, and science. • The average performance of the weakest groups of students should be im-
proved. The final section of the summary presents key findings and recommendations in relation to the question of improved or new data collection activities in the area of basic skills.
1.1. Education Systems and Basic Skills
Differences Within Countries More Important Than Between Countries (p. 39, 66) International surveys such as PISA have attracted considerable attention from the media and policy makers. In particular, focus has been on the relative rank-ings of countries on the basis of students' average achievement scores. Our analysis of the characteristics of average achievement scores has highlighted that

______________________________________________
Executive Summary 5
variance is much higher within countries than between countries. Only about one tenth of total variation in student performance lies between countries and can, therefore, be captured through a comparison of country averages. The remaining approximately nine tenths of variation in student performance occurs within countries, that is, between education systems and programmes, between schools, and between students within schools. This result is confirmed in both PISA 2000 and 2003 and TIMSS 1995, 1999, and 2003 (OECD 2004c: 60, 280-282). Recommendation: • Policy makers should focus their attention on how basic skills performance
varies between different groups of pupils and different schools within each country. The comparison between countries should not impede this.
Equality Is not Opposed to Quality (pp. 58, 69-70, 102-103) The analysis shows that a high degree of equality in achievement scores within countries (i.e. a low variance around the mean) can be achieved without com-promising the overall level of achievement scores in reading, mathematics, and science. A number of the countries with a relatively low variation in student achievement scores are also countries where the average student achievement is high. Focus-ing on groups with lower skills levels and on reducing skills disparities within the student population would thus seem to be an efficient strategy for pursuing average levels of basic skills that are in the high end of the international spec-trum. • Where relevant, policy makers should focus efforts for higher average levels
of basic skills towards groups with lower skills levels and towards reducing skills disparities within the overall student population.
Dividing Students into Tracks Increases Disparity, not Average Performance (pp. 53-54, 58, 173-174) Data from PISA suggests that there is no clear statistical relation between the degree of institutional differentiation of school systems (the use of tracking and streams in the school system) and average student performance. There is, how-ever, a clear statistical correlation between the degree of institutional differentia-tion on the one hand, and variance in student performance on the other hand. The political implication is that increased institutional differentiation (for in-stance the introduction of tracking systems at an earlier age or more frequent use of grade repetition for weak students) cannot plausibly be expected to result in improved average academic performances of students, everything else being equal. The most likely result is greater diversity in student performance, as weak students become weaker and strong students stronger.

______________________________________________
Executive Summary 6
Institutional Differentiation Means that Socio-Economic Background Matters More (pp. 146-150, 173-174) Moreover, the number of distinct school types and educational programmes is positively correlated with the significance of socio-economic background for student performance. In other words, the data from PISA suggests that the more and the earlier students are divided into separate groups according to their aca-demic performance, the more the students’ socio-economic background matters for their academic performance. Educational systems’ ability to adjust for the socio-economic background of students and provide all students with equal opportunities of learning thus dimin-ishes as the importance of tracking systems and institutional differentiation in education systems increases. Recommendation: • Tracking systems and other forms of differentiation of students into separate
streams are used widely in the Netherlands, Austria, Germany, Belgium, Luxembourg, Hungary, and the Czech Republic and Slovakia. Policy makers in these countries should consider whether there are unrealized potentials in developing education systems towards more comprehensive systems with a lower degree of institutional differentiation among students.
Differentiated Systems: Potentials in Better Teacher Support for Weak Students (pp. 150-151, 174) The majority of the countries with a particularly high degree of institutional dif-ferentiation in their educational systems are also countries in which students in PISA 2003 report a comparatively low level of individual support from their teachers. Thus, in Austria, Germany, the Netherlands, the Czech Republic, Slovakia, and Luxembourg - countries where school systems are among the most differentiated – relatively few students say that their mathematics teacher shows interest in every student’s learning in most lessons or every lesson. Similarly, relatively few students say that their teachers provide an opportunity for students to ex-press their opinions in most or every lesson, and that their teachers help them with their learning in most lessons or all lessons. Recommendation: • Policy makers in Austria, Germany, the Netherlands, the Czech Republic,
Slovakia, and Luxembourg, should consider whether sufficient teacher sup-port is provided to the pupils most in need of this support.
It is a likely possibility that there are unrealized potentials for increasing equality of opportunity and the efficiency of school systems in these countries, focusing on measures that seek to adjust for the disadvantages of students with an unfa-vourable socio-economic background.

______________________________________________
Executive Summary 7
Competitiveness in Educational Systems is Connected with Personal Costs (pp. 116-121, 129-130, 132-134, 138) The analysis suggests that a high degree of competitiveness in national education systems (in the form of the widespread use of tests for advancing to the next level of schooling and of entry exams) may facilitate high levels of basic skills among students. However, in highly competitive education systems (Hong Kong China, Japan, Korea), students generally display above-average levels of anxi-ety, lower levels of intrinsic motivation (interest in and enjoyment of a subject area), as well as a low sense of belonging to schools and negative attitudes to-wards schools’ ability to prepare students for adult life. This suggests that while a high degree of competitiveness may yield results in terms of student achievements, there are also costs associated with this strategy in terms of motivation and anxiety. These costs may have unforeseen negative effects in the long run, for instance in relation to life-long learning. Recommendation: • Policy makers should take into account that increased competition among
students in educational systems is associated with individual costs.
Increased Reliance on Private Schools Should be Approached Cautiously (pp. 143-146, 172) Primary and secondary school education is mainly a public enterprise. Among 20 OECD countries with comparable data, the private share of funds invested in primary and secondary education is greater than 10 per cent in only 6 countries, and in no country does it exceed 20 per cent (OECD 2004d). Moreover, private schools differ considerably, from very elitist private schools in terms of the socio-economic profile or other characteristics of their intake, to schools which are founded on specific pedagogical or religious beliefs. In public debates of education, the possibility that private schools should be given a more prominent role is frequently heard. Data from PISA 2003 suggests that students from private schools tend to perform better in the PISA tests than students from public schools. The explanation is, however, found in the socio-economic profile of the intake of private and public schools. Once this factor is taken into consideration, differences between the performance of students from private schools and those from public schools largely disappear. On the other hand, evidence from PISA 2000 suggests that students from pri-vately managed but not necessarily privately funded schools perform better than students from public schools (Fuchs and Wössmann 2004a). This conclusion remains valid even when taking account of differences in the student composi-tion of public and private schools. It thus seems conducive to student performance if schools are privately operated but at the same time mainly publicly financed, a finding that is consistent with the observation that in several respects school autonomy is positively related to student performance.

______________________________________________
Executive Summary 8
Recommendations: • Policy makers should approach increased privatization of school systems
cautiously, as the evidence on its effects on student performance is inconclu-sive.
• There is some evidence from PISA that a combination of private operation and public funding of schools is conducive to student performance. Policy makers should take this into account when considering increased privatiza-tion.
Pre-SchoolingProbably Beneficial for Later Academic Achievement (pp. 151-153, 174-175) Firm conclusions regarding the significance of pre-schooling for academic per-formance require longitudinal studies. However, evidence from both PISA and PIRLS based on student self-reports as to the duration of each student’s pre-schooling (if any) suggests that pre-schooling is positively related to later aca-demic achievement among 4th graders (PIRLS) and 15-year-olds (PISA). Data from TIMSS (2003) confirms this observation. There is also longitudinal re-search which supports the finding (Sammons et al. 2002). At the same time, the socio-economic background of children influences the ability of children to take advantage of pre-schooling. After adjusting for the socio-economic background of children, the net effect of pre-schooling tends to be smaller, such that the performance difference between students who have attended preschool and those who have not is reduced to about half after the ad-justment. Recommendations: • Policy makers should consider the increased use of pre-schooling. Attention
should be paid to forms of pre-schooling that may strengthen the academic performance of students in the long run without affecting negatively the overall personal development of small children.
• Policy makers should consider whether there are relevant approaches to pre-schooling which could help children from less advantaged socio-economic backgrounds to a good start in the education system.
Increased Instruction and Homework Time is not a Simple Solution (pp. 163-167, 177-178) Data from PISA, TIMSS, and PIRLS, points to a weak statistical relation be-tween student time devoted to learning and average achievement scores. This is not surprising, in so far as the relation is complicated by a number of factors: Teachers may assign more homework to those students most in need of it, for instance, and slower learners may need more time to complete the same amount of homework. The weak statistical relation between student time devoted to learning and per-formance reminds policy makers that there is no clear-cut and simple relation between instruction time and academic results. More instruction hours do not

______________________________________________
Executive Summary 9
necessarily lead to better academic performance among students. The contents of teaching and learning may be more important than the amount of time allocated to teaching and learning. Recommendations: • Policy makers should consider whether sufficient resources are devoted to
the actual contents of learning and to ensuring positive teaching and learn-ing experiences, rather than focus on the quantitative amount of teaching and learning time.
• Policy makers in EU countries where the time devoted to learning among 15-year-olds is higher than in other countries should consider whether the PISA data on instructional time for 15-year-olds is representative for other age groups; if yes: whether resources could be freed in the education system by reducing the number of instruction hours; and whether the resources that are freed in this manner could be applied to improving the contents of teach-ing and learning.
Data from PISA 2003 suggests that the time devoted to learning among 15-year-olds is significantly higher in Greece, Italy, Latvia, Ireland, and Spain, than in the other EU countries.
Scope for Improvement within Given Economic Resources (pp. 63-66, 67-68) The relation between the wealth of countries and educational spending per stu-dent on the one hand and PISA achievement scores on the other hand have been shown to be far from deterministic. Relatively low wealth cannot, in other words, be used as a general excuse for low average achievement scores at the level of countries. This observation leaves policy makers considerable scope for the improvement of educational systems within the given framework of re-sources available.
Policy Reform Can Be Effective (pp. 50, 68-69, 202-205) The cases of Latvia and Poland suggest that educational systems can be re-formed with significant effects on average PISA achievement scores. Both insti-tutional reforms and reforms aimed to change the form and content of teaching and learning appear important. However, the cases of Latvia and Poland are particular, in the sense that both countries have been developing their education systems from a quite specific starting point, namely a system in which education was embedded within a planned economy and the teaching of an official ideology. Hence, the experi-ences from Latvia and Poland may not be relevant in other countries to a very great extent.

______________________________________________
Executive Summary 10
1.2. Student Background Characteristics and Basic Skills
Education Systems Can Compensate for Different Socio-Economic Backgrounds (pp. 98-103) While the results from PISA 2003 confirm that socio-economic background mat-ters significantly for students’ academic performances, they also point to the possibility that the degree to which it matters can be affected by educational policies and by approaches focusing on providing all children, irrespective of background, with high quality education. This is reflected in the fact that the degree to which socio-economic background matters differs significantly across countries. Socio-economic background matters more for PISA achievement scores (mathematics) in Belgium, Hungary, Slovakia, the Czech Republic, and Germany, than in other EU countries. Moreover, the data from PISA does not support a thesis that average student performance decreases as the importance of socio-economic background of stu-dents decreases. For some of the best performing countries in terms of average achievement scores (Finland, Hong Kong China, Japan, and Korea), the socio-economic background of students thus matters the least. Equality in education outcomes irrespective of socio-economic background is therefore not in conflict with a high quality of outcomes. It is a viable policy option to focus on equity in performance outcomes and the same time strive for high average performance outcomes. Recommendation: • Policy makers and authorities in Belgium, Hungary, Slovakia, the Czech
Republic, and Germany, should consider adjusting educational structures, systems, and approaches, with a view to increasing the ability of education systems to compensate for students’ socio-economic background.
Foreign Background Matters More in Some Countries than Others (pp. 72-81, 103) In many countries, the academic performance of students with a foreign back-ground is significantly weaker than that of native students. Moreover, the analy-sis reveals that foreign background matters more for performance in some coun-tries than in others, even when accounting for the socio-economic and language differences in the composition of the group of foreign students. It thus appears that some countries are better than others in providing students with adequate levels of skills, regardless of the students’ background in terms of nationality, ethnicity, and language. Students with a foreign background appear to perform relatively poorly in Belgium, Sweden, and the Netherlands, even when adjusting for socio-economic background and language background. Recommendations: • Policy makers should seek to learn from each other with respect to success-
ful ways for promoting the provision of basic skills to students with a foreign background.

______________________________________________
Executive Summary 11
• More research should be initiated enabling an in-depth understanding of significant inter-country differences in the provision of basic skills to stu-dents with a foreign background.
• Policy makers in Belgium, Sweden, and the Netherlands, should consider whether enough is done in educational systems and at school levels to adjust for the apparent disadvantages of foreign background.
More Focus on Bilingual Tuition for Students with a Foreign Background (p. 105) In a number of countries, there are relatively large differences in student per-formance between native students and students with a foreign background, and at the same time a large share of students with a foreign background speaks a different language than the test language at home. Currently, these countries are Belgium, Germany, Austria, the Netherlands, Denmark, and France. At the same time, there is solid evidence from research that bilingual tuition and mother-tongue instruction affects the academic performances of students posi-tively, where such instruction is relevant. However, in the EU only a small mi-nority of Member States presently offer this possibility. Recommendations: • From the perspective of improving the basic skills performance of students,
policy makers should consider strengthening the possibilities of bilingual tui-tion for students who are not proficient in the dominant or official lan-guage(s) of the country concerned.
• Policy makers and authorities in Belgium, Germany, Austria, the Nether-lands, Denmark, and France, should pay particular attention to improved possibilities for bilingual tuition.
Diffusion of Non-Native Students an Important Policy Option (pp. 81-82, 104-105) There are significant differences in the average achievement scores of non-native students who attend schools with a high density of non-native students and non-native students who attend schools with a low density of non-native students. These differences are relatively large in a number of countries where a large share of non-native students attend schools with a high density of non-native students. Taking into account the socio-economic background of non-native students does not change this conclusion. The implication is that a higher degree of diffusion of non-native students among schools is likely to be significantly beneficial. Recommendation: • Policy makers should consider whether enough is done to ensure diffusion of
non-native students among schools. This recommendation is particularly relevant where a large share of non-native students attends schools with a large share of non-native students. On the basis of available PISA data this is the case in Germany, Sweden, the Netherlands,
______________________________________________
Executive Summary 12
Austria, and Denmark, but it is probably the case in several other EU countries as well. Various strategies for improved diffusion could be considered, including hous-ing and settlement policies and free school choice allowing non-native students to opt for schools with a low density of non-native students. The experiences of “bussing” in the United States in the 1970s suggest that this particular strategy is probably not feasible.
More Support to Single-Parent Families is Likely to Have Positive Effects (pp. 87-90, 103-103) Not all socio-economic background factors are relevant from a policy perspec-tive, as they can be affected only in the very long run. However, for one of the factors that have been considered in the analysis, namely family structure, policy reforms seem both relevant and likely to have some effect in the short to me-dium term. PISA 2000 and 2003 thus suggest that the academic performance of children from families with a single parent is weaker than that of children from other family structures. This may in part be explained by the fact that adults from single-parent families have fewer resources available for assisting children with their school work and other activities related to school and education. Recommendation: • Policy makers should consider whether sufficient support is provided to
children from single-parent families within existing school and education systems.
In the EU, this question is particularly relevant for Belgium, Ireland, the Nether-lands, Denmark, Sweden, and Norway. Relevant support to children from single-parent families may consist of for in-stance increased assistance with homework and other school related activities. Support may also, however, focus on assisting single parents in other ways, thereby freeing parent resources to assist their children.
Potential Benefits in Focusing on the Math and Science Performance of Girls (pp. 96-98, 105-106) In several of the countries studied, girls perform more weakly in mathematics and science than boys. In the EU, this is the case for Denmark, Italy (only mathematics), Luxembourg, Slovakia, and Greece, and to a lesser extent Ireland and the Czech Republic. Taking into account the tendency to female under-representation in tertiary education in mathematics and science, there are poten-tial benefits to be realized in focusing on these weaknesses. Recommendation: • In Denmark, Italy, Luxembourg, Slovakia, and Greece, and to a lesser extent
in Ireland and the Czech Republic, policy makers and authorities should consider increasing the focus on the performance of girls in the school sys-tem as regards mathematics and science.

______________________________________________
Executive Summary 13
Various options are possible, for instance reviews of teaching material and in-struction methods with a view to increasing subject attractiveness and learning efficiency in mathematics for girls.
Benefits in Focusing on the Reading Performance of Boys (pp. 96-98, 105-106) The relative underperformance of boys in reading should also be a matter of concern. Good reading skills must be seen as a prerequisite for the acquisition of a large number of other skills and competences. However, according to data from PISA 2003, boys perform significantly more poorly than girls in reading in all the countries studied, with the score point difference ranging between 21 and 58 score points. Recommendation: • In all the EU’s member states, policy makers and authorities should consider
to increase the focus on the reading performance of boys in the school sys-tem.
Teaching material and instruction methods could be reviewed with the objective of increasing the attractiveness of reading to boys.
1.3. School Characteristics and Basic Skills
School Autonomy Positively Correlated to Student Performance (pp. 140-143, 157, 172) The analysis has identified a positive correlation between higher degrees of school autonomy in certain respects and average student performance in mathe-matics. Across schools in the different countries participating in the PISA sur-veys, there is a clear positive correlation between the degree to which schools themselves decide on budget allocations within schools and the average student performance. The percentage of schools which have responsibility for appointing teachers, the percentage of schools which have responsibility as regards student disciplinary policies, and school autonomy in the fields of dismissing teachers, determining course contents, and deciding which courses are offered, are also positively cor-related to student performance. While the interpretation of statistical correlations as causal relations should be avoided, the findings from PISA are compatible with a hypothesis that “freedom under responsibility” for schools is a fruitful development path with respect to the further improvement of primary and secondary education in Europe. For in-stance, it is possible for schools with a high degree of autonomy to innovate and push themselves harder to succeed with students who have learning difficulties.

______________________________________________
Executive Summary 14
Some EU Member States Confer Relatively Little Autonomy on Schools (pp. 143, 172) Data from PISA 2003 in this connection suggests that within the EU, the school systems of Austria, Germany, Italy, Portugal, and Spain, provide schools with less autonomy than the school systems of other member states. Notably, this is the case with respect to the appointment and dismissal of teachers, but for some of the five countries mentioned also with respect to determining course contents and deciding which courses are offered. Recommendations: • Policy makers and authorities should consider whether their educational
systems confer sufficient autonomy upon schools as regards budget alloca-tion decisions, the appointment and dismissal of teachers, disciplinary poli-cies and practices, and in other relevant respects.
• Policy makers and authorities in Austria, Germany, Italy, Portugal, and Spain, should consider whether the provision of primary and secondary edu-cation could be improved through increased autonomy for schools, as data from PISA suggests that school autonomy is presently relatively limited in these countries.
Certain Types of Student Assessments May Facilitate Student Performance (pp. 154-157, 175-176) A range of assessment methods can be used in order to assess students’ aca-demic progress. As a consequence, assessments differ widely in nature and qual-ity, and assessment policies and practices are often applied in different ways across school and programme types. For these reasons, it is difficult to relate the use of a specific kind of student assessment to student performances as measured in for instance PISA. Data from PISA 2003 suggests that for a number of different assessment me-thods (standardized tests, student portfolios, and judgemental ratings by teach-ers), the explanatory power in relation to student performance is low, and there are no clear directions in statistical relations. Nevertheless, in PISA 2003 there is a tendency for schools in which teacher-developed tests are applied more fre-quently to perform better, at least in some countries. Multivariate analyses of data from PISA 2000 and TIMSS 1995 also provide some evidence that there is a positive impact of centrally set examinations on student performance in mathematics and science (Bishop 1997; Wössmann 2003, Fuchs and Wössmann 2004a), and the analyses of PISA 2000 (Fuchs and Wössmann 2004a) in particular suggest that external exit exams may increase the performance of autonomous schools, serving as a tool for school account-ability. Recommendations: • Policy makers and authorities should distinguish between testing for ac-
countability purposes and testing as a part of the learning process.
______________________________________________
Executive Summary 15
• Given the intensity of the policy debate around testing, policy makers should introduce reforms of testing practices only after careful scrutiny of available knowledge on the potentials and risks of intensified testing.
• Analyses of data from PISA 2000 and TIMSS 1995 provide some evidence that there is likely to be a positive effect of centrally set examinations on stu-dent performance. Moreover, data from PISA 2003 suggests that testing used as a tool in the learning process, i.e. teacher-developed tests, is positively re-lated to student performance. Policy makers should take these findings into account when considering reforms of testing practices.
Positive Student-Related School Climate May be Precondition for Good Out-comes (pp. 158-163, 176-177) In PISA 2003, school principals were asked to assess to what extent student ab-senteeism, disruption of classes by students, students skipping classes, students lacking respect for teachers, students’ use of alcohol or illegal drugs, and stu-dents intimidating or bullying other students, hindered learning. Among the seven countries where school principals’ assessments of school cli-mate is the most positive, four are among the top six performers as regards the average performance of students across the disciplines (Korea, HK China, Japan, and Belgium). On the other hand, school climate as assessed by school princi-pals can explain only a modest share of total variance in student performance: On average across OECD-countries, less than 4 per cent of total variance is thus explained. Recommendation: • A positive school climate may be necessary, but is not a sufficient condition
for strong academic performance among students. If this hypothesis holds true, policy makers should consider whether specific initiatives can be initi-ated to strengthen the overall climate of each country’s schools.
It should be borne in mind in this connection, that there are probably benefits in respecting overall school autonomy. One option that may be relevant in several countries could be to focus on schools with a particularly poor school climate and consider possibilities for the restructuring of schools and/or the relocation of parts of the student body to other schools.
Belgium, Germany, the Netherlands: Focus on Climate in Disadvantaged Schools (pp. 161, 177) Countries differ as regards the significance of school climate for academic per-formance. It is notable that among the four countries where school climate fac-tors matter the most, three (Belgium, Germany, and the Netherlands) are among the countries where the institutional differentiation of the school system is most far-reaching. This may suggest that in these countries, problems concerning school climate are concentrated in relatively few schools with a high concentration of students who

______________________________________________
Executive Summary 16
have been separated from other groups of students on the grounds of weak aca-demic performance or other disadvantages. Recommendations: • To the extent that problems concerning school climate are concentrated in
relatively few schools, policy makers in Belgium, the Netherlands, and Ger-many, should consider whether there are advantages in focusing efforts for improving school climate on particularly disadvantaged schools.
• Other options that could be considered are the restructuring of schools or a redistribution of students between schools, so as to achieve a higher degree of diffusion of students with particular problems that contribute negatively to school climate.
Netherlands, Greece, Portugal: Negative Assessment of Teachers by Principals (pp. 163, 177) Teacher-related school climate factors (comprising factors such as teachers’ ex-pectations of students, student-teacher relations, absenteeism among teachers, and teachers’ attitudes towards change) are only weakly related to average stu-dent performance. Nevertheless, the education authorities of the Netherlands, Greece, and Portugal, could consider the reasons explaining the relatively nega-tive assessment of teachers by school principals in these countries. Recommendation: • Policy makers and authorities in the Netherlands, Greece, and Portugal,
may consider whether efforts targeted towards increasing teacher commit-ment, performance, and willingness to consider change, could be beneficial for the overall efficiency and performance of the education systems.
School Infrastructure and Educational Resources Not Very Important (pp. 169-171, 178-179) Data from PISA, TIMSS, and PIRLS, suggests that, contrary to expectations, shortages of educational resources (instructional materials, computers etc.) do not affect students’ average performances in mathematics, science, and reading, to a very great extent. The availability of computers may affect other skills posi-tively, for instance ICT skills, but it does not appear to strengthen student per-formances in the skill domains studied here. Given that the group of students from schools with relatively many resources do not on average perform better than those from schools with fewer resources, the question emerges whether available resources are used effectively in resource-rich schools. The availability of technology in classrooms has increased signifi-cantly in recent years, especially students’ access to computers for instruction purposes and for accessing the Internet. But effective use of these new facilities in basic skills learning also depends on the implementation of new learning forms and on the teaching staff developing pedagogical competences accord-ingly.

______________________________________________
Executive Summary 17
Another aspect of educational resources is the growing use of computers for in-structional purposes, which may demand more self-management and learning-to-learn competences from students. The use of instructional software in for in-stance reading may require more self-conduct and learning-to-learn competences from each individual student. The question emerges whether schools and teach-ers are adequately equipped to deal with the challenges posed by such new re-quirements to students. Recommendations: • Policy makers and other relevant actors should consider analysing in more
detail the approaches adopted in schools that manage to achieve good re-sults in spite of scarce resources.
• Policy makers and authorities should consider whether schools and teachers are adequately equipped to cope with the challenges of teaching and learn-ing posed by the growing use of ICT for instructional purposes.
1.4. Individual Student Characteristics and Basic Skills
Potentials in Focusing on Student Motivation – Especially in Reading (pp. 111-114, 130-132, 136-137) Motivation matters for learning outcomes: There is a positive relationship be-tween interest in and enjoyment of a subject (mathematics or reading) and the PISA achievement scores of students, even if the relationship is stronger in read-ing than in mathematics. However, interest in and enjoyment of a subject is nei-ther a sufficient nor a necessary precondition for high average achievement scores among students. Recommendation: • Policy makers should consider initiatives for increasing the awareness
among students of the individual rewards of reading. Thus, improving reading skills among students may follow not only from im-proved teaching and learning of reading, but to a great extent also from improv-ing students’ motivation to read. Initiatives which open the eyes of more stu-dents to the thrills of reading are likely to have positive effects on reading per-formances.
Self-Confidence and Anxiety Matter More (pp. 116-121, 137) Data from PISA suggests that students are more likely to achieve high achieve-ment scores if they believe in their own capacities and do not feel anxious about the learning process. This picture is valid across the countries analysed. Thus, there is a clear statistical relation between self-confidence – defined in this con-nection as a positive self-concept and high self-efficacy – and average achie-vement scores in reading and mathematics. Moreover, anxiety is clearly nega-tively related to performance in mathematics.
______________________________________________
Executive Summary 18
A number of background factors can be expected to affect students’ self-confi-dence and levels of anxiety in relation to academic performance. Nevertheless, it could be considered whether there are possibilities for addressing these factors in educational policy and practice. Recommendation: • Policy makers should consider whether enough is done in each country’s
education system to stimulate students’ self-confidence and – as regards the learning of mathematics - reduce anxiety.
Different Learning Strategies Not Related to Performance (pp. 126-129, 138-138) The PISA-surveys highlight that different learning strategies (control, memoriza-tion, elaboration) are not related to the achievement scores of students in mathe-matics and reading. Similarly, the relation between different learning situations (cooperative learning, competitive learning) and performance in mathematics and reading is very weak. The data from PISA 2000 and 2003 thus contradicts a hypothesis that there are specific and clearly identifiable advantages related to specific learning strategies and learning situations. This opens of the field of basic education for experi-ments with different learning situations and learning strategies. Recommendation: • Policy makers should consider whether enough is done to experiment with
new forms of learning strategies and learning situations, and whether enough is done to ensure that experiences from such activities are gathered and analysed on a systematic basis.
Focusing on the Heterogeneity of Students’ Motivation and Attitudes (pp. 135-136, 139-139) The analysis suggests that differences between schools in students’ self reported characteristics (motivation, emotions, and behaviour) are far less pronounced than the differences within schools. This means that in most countries, compara-tively few schools stand out as being particularly likely to have students who report being well-motivated and confident and using effective learning strate-gies. In other words: heterogeneity is higher within schools than between schools in relation to motivation, emotions, and behaviour. Recommendation: • Policy makers should consider whether enough is done in their respective
countries’ approaches to education to address the individual differences of students’ motivation and attitudes.
Initiatives for increasing the attention being paid to student heterogeneity and individual needs in terms of attitudes and learning behaviour may pertain to both the education of teachers and the organization of education.

______________________________________________
Executive Summary 19
1.5. New Analysis and Data Collection Activities Experiences from implementing the present study should be utilized in the Euro-pean Commission’s and the Member States’ further work for improving basic skills education in Europe.
Findings and Recommendations Rather General - Much of the analysis in the present report has focused on the country level and on trying to identify patterns and relations with policy implications and policy relevance at this level. The policy implications of the findings are frequently at a rather general level. There are several reasons for this. At the country level, one factor is the “small-n”- problem: Given the low number of units of investigation and the large number of potentially relevant independent variables, it is not possible to isolate the effects of each indendent variable on the dependent variable. From a statis-tical point of view, it is therefore not possible to answer the question why some countries perform better than others in terms of achievement scores. The small-n problem has been evident in connection with the focus in the pre-sent study on the Finnish education system and its performance. Various expla-nations for the Finnish success are floating the public debate, some more con-vincing than others. A German researcher has even pointed to the long Finnish winter nights as a plausible explanation for high average reading scores. Another example: Danish nutritional researchers have recently claimed that free school meals in Finland and Sweden explain the difference in PISA achievement scores between these two countries and Denmark and Norway, where no free meals are provided. More convincing accounts of the Finnish success story have been presented by members of the Finnish PISA research team. However, even these explanations rest on assessments and judgements, and they have to do so since the independ-ent effect of various factors cannot be identified.
- And This Must Necessarily be So More generally, there are inherent limits to the degree of detail in the back-ground variables which can be included in large-scale quantitative surveys. As the OECD itself notes frequently in its analysis of PISA-data, quantitative sur-veys can only go some of the way in providing valid description of school prac-tices, of the relations between teachers and students, and more generally in pro-viding rich and valid pictures of “good schools” as well as “bad schools”. A relatively high level of aggregation has also been made necessary in the study, considering that it covers 27 countries, 3 skills domains, and 3 major interna-tional skills surveys, each of them having been carried out several times. Finally, many statistical relations between the study’s key variables have been revealed to be weak or contingent. Frequently, such findings do not allow the formulation of very strong policy implications and policy recommendations, even if they can

______________________________________________
Executive Summary 20
sometimes be used to refute simplistic understandings of causal relations and relevant policy options.
The Strength of PISA, TIMSS, and PIRLS: To Generate Questions and Stir Debate This does not mean that the findings generated by the data from PISA, TIMSS, and PIRLS are uninteresting or irrelevant. As the present report hopefully dem-onstrates, it is indeed possible to arrive at both interesting and controversial con-clusions on the basis of data from the three international surveys. However, on the basis of our experiences, it seems clear that the strength of PISA, TIMSS, and PIRLS is more in their ability to highlight differences in edu-cational outcomes across countries and to generate debate and raise (often un-comfortable) questions against this background, than in their being tools for generating explanations of educational outcomes and pointing to very specific solutions in terms of good practices.
Limited Use of PISA, TIMSS, and PIRLS, for Research in Teaching and Learning This observation is underpinned by the fact that the educational research estab-lishment has only to a limited extent made use of PISA, TIMSS, and PIRLS, for research purposes. This is the case at least for pedagogical education research (cf. Olsen 2004), whereas the situation appears different in the field of educa-tional economics research, where data from PISA, TIMSS, and PIRLS, has been used more extensively.
Implications: Quantitative Data to be Supplemented by Qualitative Information These observations have implications for the kinds of information and data which can best inform future policy making on the provision of basic skills in the European Union. In our assessment, the development of education policy via mutual learning in the EU cannot rest alone on quantitative data of the sort gen-erated by PISA, TIMSS, and PIRLS. There are benefits in supplementing quanti-tative information of this kind with more qualitative types of information. There are several possibilities that are relevant for supplementing data from PISA, TIMSS, and PIRLS with other kinds of knowledge: Existing educational research on for instance pedagogical approaches and learning practices could be utilized systematically to generate policy recommendations. It is a challenge to transpose basic research in this respect into policy-relevant implications and rec-ommendations, and evidently there are many conflicting views on best teaching and learning practices. However, the potential advantages are large and the at-tempt should be made. Similarly, existing research on factors such as school management practices and teacher education practices could be analysed on an international basis and util-ized wherever relevant. New systematic, research-based activities could be initiated for generating rele-vant conclusions on good practices as regards factors such as teacher training, school management, and teaching and learning practices. It seems likely to us

______________________________________________
Executive Summary 21
that international comparisons could very well form an important element in such research. On the other hand, research designs would probably only rely on quantitative data collection tools to a limited extent, as such tools cannot be ex-pected to capture all relevant aspects of the objects of study. Recommendations: • In stimulating mutual learning about educational systems and educational
policy, the European Commission should make increased use of qualitative educational research on for instance school management practices, teacher training approaches, and pedagogical approaches and learning practices, to generate policy recommendations.
• In this connection, the European Commission should consider establishing a virtual centre of good education practice. Such a centre could hold and make available across Europe data from innovators and independent assessors in different forms (reports, PowerPoint-presentations, videos, etc.), concerning good and innovative education practice.
• The European Commission should also consider launching targeted re-search-based activities for generating relevant conclusions on good prac-tices as regards for instance teacher training, school management, and teaching and learning.
• The European Commission should discuss with the member states the option of introducing qualitative in-depth reviews of national education systems in the framework of the EU, along the lines of the qualitative OECD country reviews in education (e.g. OECD 2002; OECD 2005b).
Additional and more detailed observations and recommendations concerning the need for new analysis and data collection activities are found in Annex 1. The recommendations in the Annex are primarily directed towards the European Commission.

______________________________________________
Introduction 22
2. Introduction This report contains the results of an analysis carried out by the Danish Techno-logical Institute of three comprehensive international skills surveys among school-aged children: PISA, TIMSS, and PIRLS, all focusing on basic skills – reading, mathematics, and science.
2.1. Objectives The analysis has been commissioned by the European Commission, DG Educa-tion and Culture, with the following two overall objectives: 1. To formulate recommendations on improved provision of basic skills educa-
tion in the EU, on the basis of an increased understanding of the outcomes of the PISA, TIMSS, and PIRLS surveys. Recommendations on the provision of basic skills education should be formulated on the basis of an analysis of the outcomes of the surveys and of the causes explaining these outcomes.
2. To formulate recommendations for improved or new data collection activi-
ties to cover data needs in the area of basic skills. These recommendations will be based on the experiences generated by the data analysis carried out in connection with point 1.
Contributing to “Education and Training 2010” The first objective should be seen in connection with the strategic objective, formulated in relation to the European Union’s Lisbon Strategy, of increasing the quality and effectiveness of education and training systems in Europe up to 2010, with the overall objective of making education and training systems in Europe a world class reference. Thus, in 2001 the Council adopted a set of three overall and thirteen associated concrete objectives to support the Lisbon goal. A number of these objectives are relevant in the present context: Increasing nu-meracy and literacy (one of the benchmarks in the Lisbon Strategy itself relating to basic skills is to reduce the percentage of low-achieving 15-year olds in reading literacy), maintaining the ability to learn, improving foreign language learning, and ‘making the best use of resources’. In 2002, a work programme was developed for realising these objectives. Subse-quently, a number of different working groups comprised of stakeholders and experts, have been working on one or more objectives of the work programme, for example by supporting the implementation of the objectives for education and training systems at national level through exchanges of good practices, study visits, and peer reviews. One of the working groups, the Standing Group on Indicators and Benchmarks, has had the task of developing indicators to monitor progress on the work pro-gramme’s specific objectives. In July 2003, the Standing Group presented a list

______________________________________________
Introduction 23
of indicators to support the implementation of the work programme, and sug-gested the development of several new indicators, including indicators for lan-guage competences, learning-to-learn skills, and ICT skills, and indicators on social cohesion and active citizenship (Standing Group on Indicators 2003). Another group has focused on basic skills / key competences. In November 2003, the key competences working group presented a report which contained proposals for definitions of essential competences in eight domains (European Commission 2003). Other working groups have focused on issues such as education and training of teachers and trainers; on language learning; on maths, science and technology; on making the best possible use of resources; and on reforming guidance and counselling. The current study may potentially support the work of all these groups – now frequently termed “clusters” - by highlighting the achievement of different groups of pupils as regards certain basic skills and by attempting to explain or interpret these achievements, for instance in light of the resources available to different education systems, in light of aspects of the organization of educational systems and school systems, or in light of other contextual factors.
Contributing to the Quality and Relevance of Statistical Data The second objective concerns the issue of how to obtain information on basic skills (key competences) and how to improve the quality and relevance of information. As mentioned, the strategy ‘Education and Training 2010’ relies on so-called “open coordination”, i.e. voluntary but structured cooperation on the basis of the exchange of experience, peer review, and related activities. Bench-marking and other forms of systematic comparison, as well as statistical indica-tors making it possible to assess progress towards defined objectives, are impor-tant in this respect. The current project is relevant in this connection in so far as it can contribute to an assessment of the quality and relevance of the available data on school-aged pupils’ basic skills as measured in the PISA, TIMSS, and PIRLS-surveys. It can also contribute to an assessment of the relevance and quality of the different methodological frameworks of the three surveys, on the basis of the experience from analysing the data generated by them. The primary objective in this respect is to assess the relevance of the surveys and their data in relation to the specific policy objectives of the Lisbon Strategy and “Education and Training 2010”, and where relevant to provide proposals for changes in existing data collection ac-tivities or new data collection activities to cover data needs in the area of basic skills. It is thus important that the study is carried out with quite clear policy develop-ment purposes. This means that a key challenge has been to design analyses of the available data which can inform policy development, and similarly to assess the relevance and quality of data against this background.
______________________________________________
Introduction 24
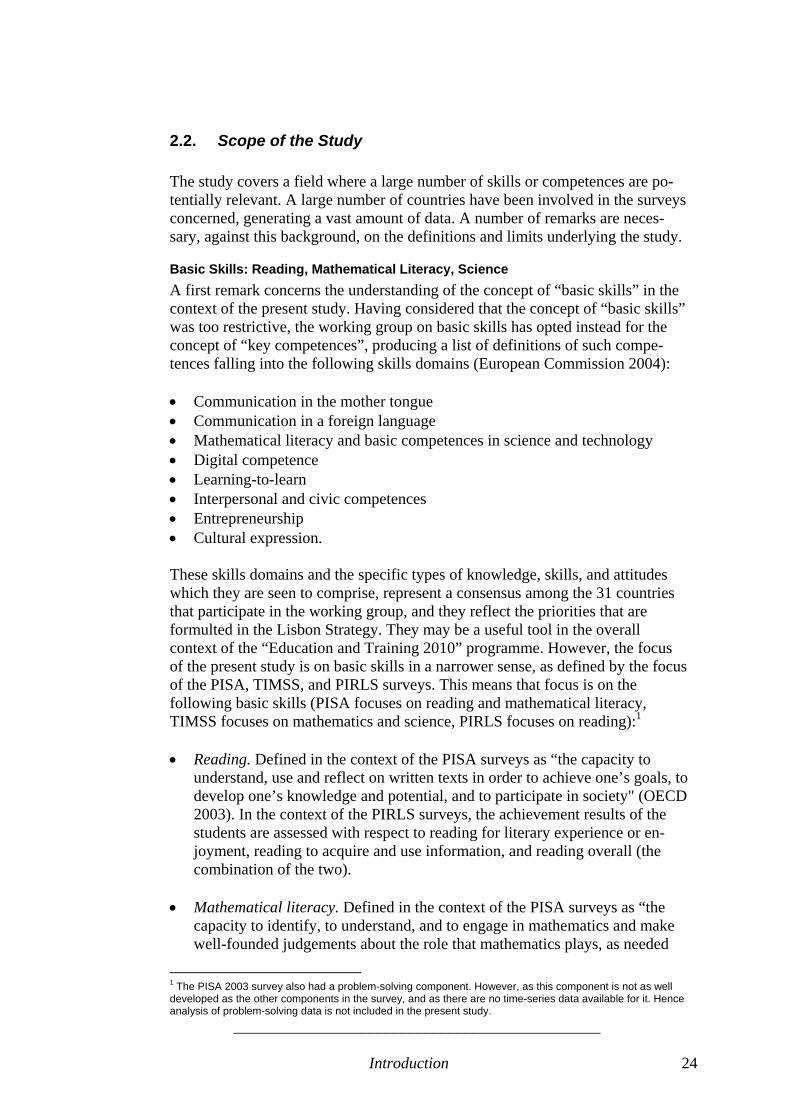
2.2. Scope of the Study The study covers a field where a large number of skills or competences are po-tentially relevant. A large number of countries have been involved in the surveys concerned, generating a vast amount of data. A number of remarks are neces-sary, against this background, on the definitions and limits underlying the study.
Basic Skills: Reading, Mathematical Literacy, Science A first remark concerns the understanding of the concept of “basic skills” in the context of the present study. Having considered that the concept of “basic skills” was too restrictive, the working group on basic skills has opted instead for the concept of “key competences”, producing a list of definitions of such compe-tences falling into the following skills domains (European Commission 2004): • Communication in the mother tongue • Communication in a foreign language • Mathematical literacy and basic competences in science and technology • Digital competence • Learning-to-learn • Interpersonal and civic competences • Entrepreneurship • Cultural expression. These skills domains and the specific types of knowledge, skills, and attitudes which they are seen to comprise, represent a consensus among the 31 countries that participate in the working group, and they reflect the priorities that are formulted in the Lisbon Strategy. They may be a useful tool in the overall context of the “Education and Training 2010” programme. However, the focus of the present study is on basic skills in a narrower sense, as defined by the focus of the PISA, TIMSS, and PIRLS surveys. This means that focus is on the following basic skills (PISA focuses on reading and mathematical literacy, TIMSS focuses on mathematics and science, PIRLS focuses on reading):1 • Reading. Defined in the context of the PISA surveys as “the capacity to
understand, use and reflect on written texts in order to achieve one’s goals, to develop one’s knowledge and potential, and to participate in society" (OECD 2003). In the context of the PIRLS surveys, the achievement results of the students are assessed with respect to reading for literary experience or en-joyment, reading to acquire and use information, and reading overall (the combination of the two).
• Mathematical literacy. Defined in the context of the PISA surveys as “the
capacity to identify, to understand, and to engage in mathematics and make well-founded judgements about the role that mathematics plays, as needed
1 The PISA 2003 survey also had a problem-solving component. However, as this component is not as well developed as the other components in the survey, and as there are no time-series data available for it. Hence analysis of problem-solving data is not included in the present study.
______________________________________________
Introduction 25
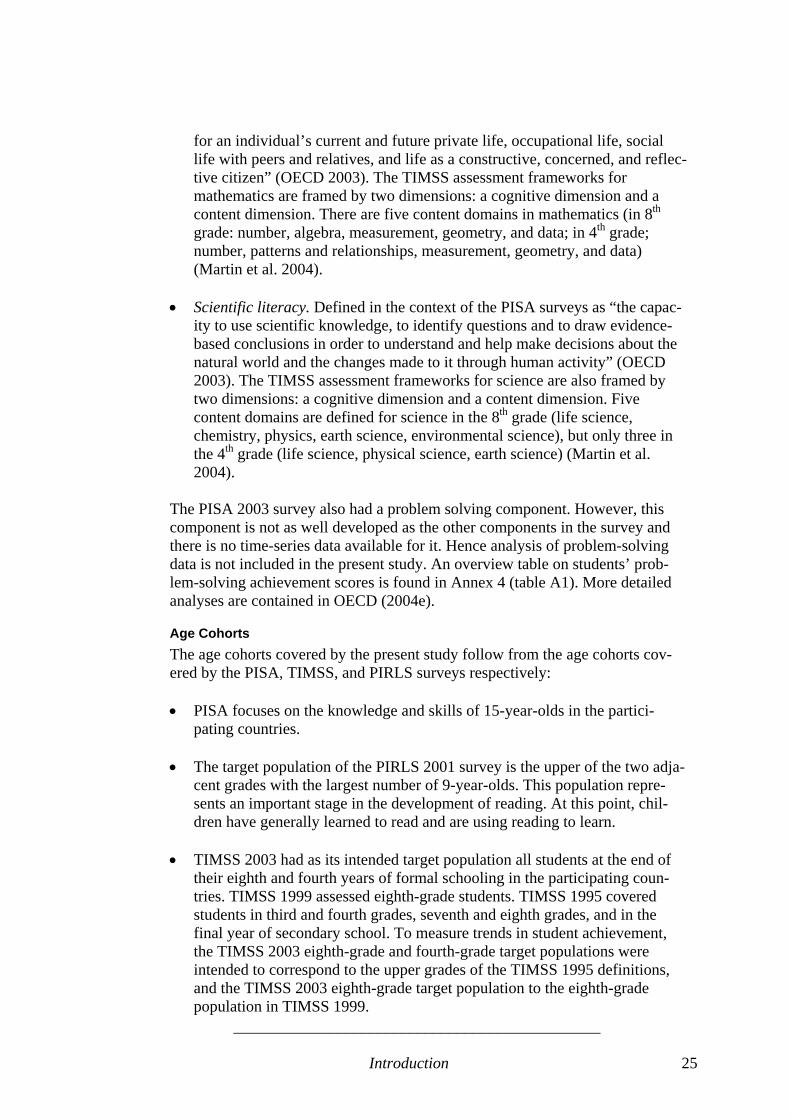
for an individual’s current and future private life, occupational life, social life with peers and relatives, and life as a constructive, concerned, and reflec-tive citizen” (OECD 2003). The TIMSS assessment frameworks for mathematics are framed by two dimensions: a cognitive dimension and a content dimension. There are five content domains in mathematics (in 8th grade: number, algebra, measurement, geometry, and data; in 4th grade; number, patterns and relationships, measurement, geometry, and data) (Martin et al. 2004).
• Scientific literacy. Defined in the context of the PISA surveys as “the capac-
ity to use scientific knowledge, to identify questions and to draw evidence-based conclusions in order to understand and help make decisions about the natural world and the changes made to it through human activity” (OECD 2003). The TIMSS assessment frameworks for science are also framed by two dimensions: a cognitive dimension and a content dimension. Five content domains are defined for science in the 8th grade (life science, chemistry, physics, earth science, environmental science), but only three in the 4th grade (life science, physical science, earth science) (Martin et al. 2004).
The PISA 2003 survey also had a problem solving component. However, this component is not as well developed as the other components in the survey and there is no time-series data available for it. Hence analysis of problem-solving data is not included in the present study. An overview table on students’ prob-lem-solving achievement scores is found in Annex 4 (table A1). More detailed analyses are contained in OECD (2004e).
Age Cohorts The age cohorts covered by the present study follow from the age cohorts cov-ered by the PISA, TIMSS, and PIRLS surveys respectively: • PISA focuses on the knowledge and skills of 15-year-olds in the partici-
pating countries. • The target population of the PIRLS 2001 survey is the upper of the two adja-
cent grades with the largest number of 9-year-olds. This population repre-sents an important stage in the development of reading. At this point, chil-dren have generally learned to read and are using reading to learn.
• TIMSS 2003 had as its intended target population all students at the end of
their eighth and fourth years of formal schooling in the participating coun-tries. TIMSS 1999 assessed eighth-grade students. TIMSS 1995 covered students in third and fourth grades, seventh and eighth grades, and in the final year of secondary school. To measure trends in student achievement, the TIMSS 2003 eighth-grade and fourth-grade target populations were intended to correspond to the upper grades of the TIMSS 1995 definitions, and the TIMSS 2003 eighth-grade target population to the eighth-grade population in TIMSS 1999.
______________________________________________
Introduction 26
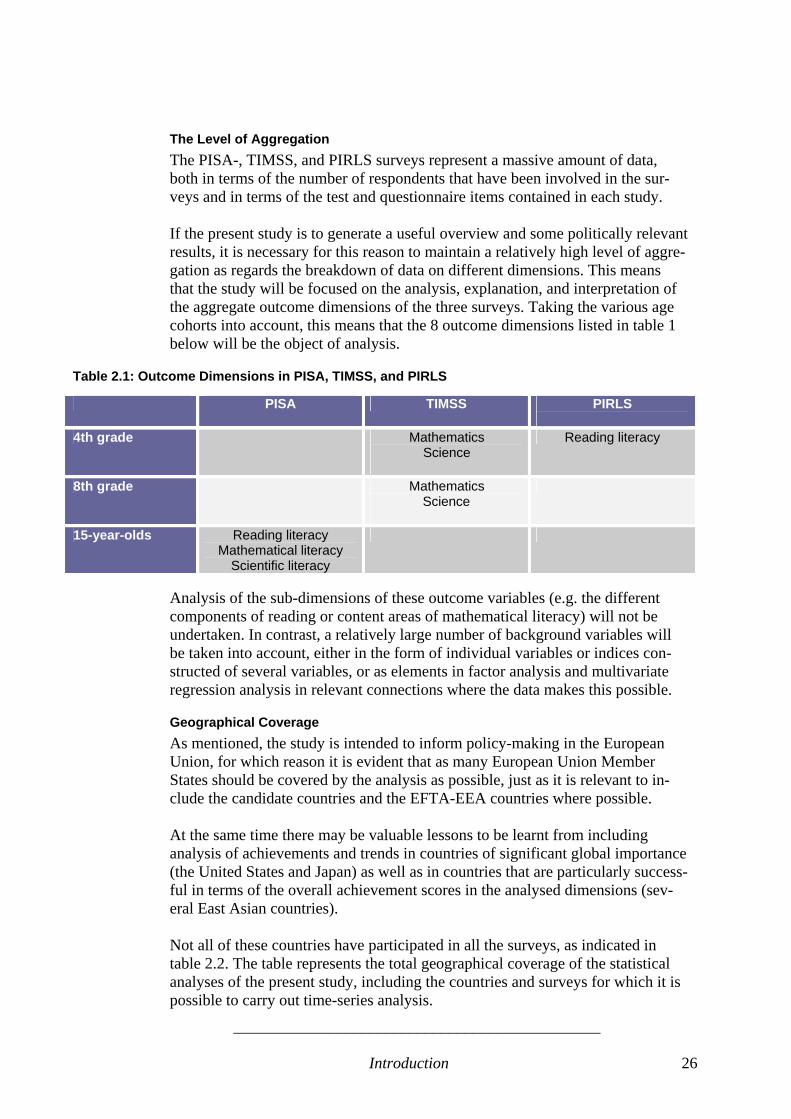
The Level of Aggregation The PISA-, TIMSS, and PIRLS surveys represent a massive amount of data, both in terms of the number of respondents that have been involved in the sur-veys and in terms of the test and questionnaire items contained in each study. If the present study is to generate a useful overview and some politically relevant results, it is necessary for this reason to maintain a relatively high level of aggre-gation as regards the breakdown of data on different dimensions. This means that the study will be focused on the analysis, explanation, and interpretation of the aggregate outcome dimensions of the three surveys. Taking the various age cohorts into account, this means that the 8 outcome dimensions listed in table 1 below will be the object of analysis.
Table 2.1: Outcome Dimensions in PISA, TIMSS, and PIRLS
Analysis of the sub-dimensions of these outcome variables (e.g. the different components of reading or content areas of mathematical literacy) will not be undertaken. In contrast, a relatively large number of background variables will be taken into account, either in the form of individual variables or indices con-structed of several variables, or as elements in factor analysis and multivariate regression analysis in relevant connections where the data makes this possible.
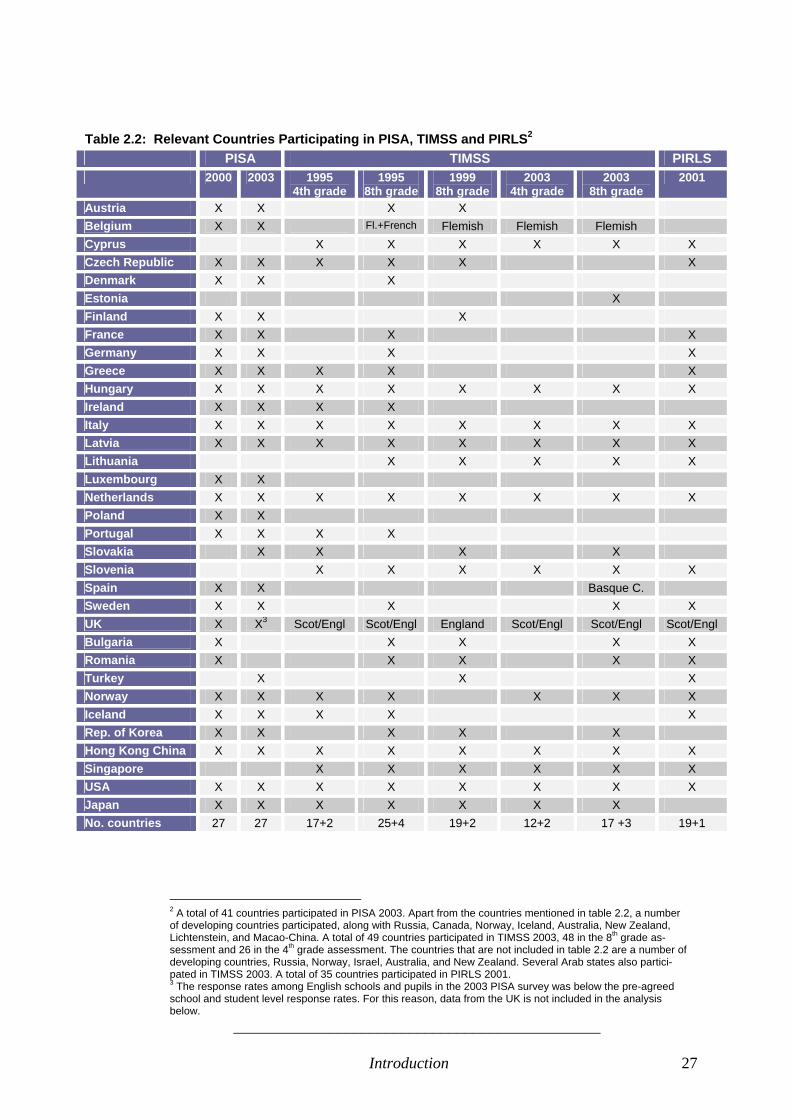
Geographical Coverage As mentioned, the study is intended to inform policy-making in the European Union, for which reason it is evident that as many European Union Member States should be covered by the analysis as possible, just as it is relevant to in-clude the candidate countries and the EFTA-EEA countries where possible. At the same time there may be valuable lessons to be learnt from including analysis of achievements and trends in countries of significant global importance (the United States and Japan) as well as in countries that are particularly success-ful in terms of the overall achievement scores in the analysed dimensions (sev-eral East Asian countries). Not all of these countries have participated in all the surveys, as indicated in table 2.2. The table represents the total geographical coverage of the statistical analyses of the present study, including the countries and surveys for which it is possible to carry out time-series analysis.
PISA TIMSS PIRLS
4th grade Mathematics Science
Reading literacy
8th grade Mathematics Science
15-year-olds Reading literacy Mathematical literacy
Scientific literacy
______________________________________________
Introduction 27
Table 2.2: Relevant Countries Participating in PISA, TIMSS and PIRLS2 PISA TIMSS PIRLS
2000 2003 1995 4th grade
1995 8th grade
1999 8th grade
2003 4th grade
2003 8th grade
2001
Austria X X X X Belgium X X Fl.+French Flemish Flemish Flemish Cyprus X X X X X X Czech Republic X X X X X X Denmark X X X Estonia X Finland X X X France X X X X Germany X X X X Greece X X X X X Hungary X X X X X X X X Ireland X X X X Italy X X X X X X X X Latvia X X X X X X X X Lithuania X X X X X Luxembourg X X Netherlands X X X X X X X X Poland X X Portugal X X X X Slovakia X X X X Slovenia X X X X X X Spain X X Basque C. Sweden X X X X X UK X X3 Scot/Engl Scot/Engl England Scot/Engl Scot/Engl Scot/Engl Bulgaria X X X X X Romania X X X X X Turkey X X X Norway X X X X X X X Iceland X X X X X Rep. of Korea X X X X X Hong Kong China X X X X X X X X Singapore X X X X X X USA X X X X X X X X Japan X X X X X X X No. countries 27 27 17+2 25+4 19+2 12+2 17 +3 19+1
2 A total of 41 countries participated in PISA 2003. Apart from the countries mentioned in table 2.2, a number of developing countries participated, along with Russia, Canada, Norway, Iceland, Australia, New Zealand, Lichtenstein, and Macao-China. A total of 49 countries participated in TIMSS 2003, 48 in the 8th grade as-sessment and 26 in the 4th grade assessment. The countries that are not included in table 2.2 are a number of developing countries, Russia, Norway, Israel, Australia, and New Zealand. Several Arab states also partici-pated in TIMSS 2003. A total of 35 countries participated in PIRLS 2001. 3 The response rates among English schools and pupils in the 2003 PISA survey was below the pre-agreed school and student level response rates. For this reason, data from the UK is not included in the analysis below.
______________________________________________
Introduction 28
The Comparability of Test Results This study will not go into any detail as regards the methodology of the three surveys. It proceeds from the assumption that the achievement scores generated by the tests of the three surveys are valid expressions of the skills of the test populations in the domains of reading, mathematics, and science. The study fo-cuses instead on the analysis, interpretation, and – as far as possible – explana-tion of the achievement scores, at country level, school level, and individual level. The validity of achievement scores can, of course, be discussed, and it is well known that this issue is hotly debated in the countries participating in for instance the PISA surveys. The issue is not, however, a concern in the current report. Nevertheless, since there are both important differences and similarities as re-gards the methodologies of the three surveys, this needs to be taken into account in the interpretation and comparison of results. Similarities between PISA, TIMSS, and PIRLS All three surveys are sample-based and make use of tests as the most important method for assessing competences, as opposed to, for instance, self-assessments or self-reports (cf. DTI et al. 2004: 32). Furthermore, tests have been developed in an international cooperative effort, aiming at international comparability of achievement scores. In all three surveys, tests of specific types of competences are supplemented by self-reported background information by the students tested. Furthermore, back-ground information provided by students concerns both individual attitudes and behaviour and factual information on home background. Sampling Differences Sampling strategies differ; TIMSS and PIRLS focus on classrooms, whereas PISA focuses on the student (random samples of the whole student population, based on cluster sampling). • In PISA, most countries employed a two-stage stratified sampling technique.
In the first stage, a (usually stratified) random sample of schools was drawn among schools in which 15-year-old students were enrolled, yielding a minimum sample of 150 schools per country. The second stage randomly sampled 35 of the 15-year-old students in each of these schools, with each 15-year-old student in a school having equal probability of selection. Within each country, this sampling procedure typically led to a sample of between 4,500 and 10,000 tested students.
• In TIMSS and PIRLS, a two-stage stratified sampling technique was also applied. However, in the second stage, the sampling unit was classrooms rather than individual students: In the first stage, at least 150 schools were sampled among all schools of the target population. The second stage con-sisted of a sample of one or more classrooms from the target grade in sam-pled schools. As a rule, one classroom per school was sampled, although some participants opted to sample two classrooms. All classrooms were se-
______________________________________________
Introduction 29
lected with equal probabilities for all countries. In each country, TIMMS required a minimum of 4,000 tested students for each target population.
Population Differences All the three surveys are based on samples. However, there are differences in the overall population from which the samples are drawn. PISA is an age-based study, whereas TIMSS and PIRLS are grade-based, meaning that the average age of the sampled students may differ between countries, reflecting differences in the age of school start across countries. • In PISA, the target population is all 15-year-old students. Operationally, this
includes all students who were from 15 years and 3 months to 16 years and 2 months at the beginning of the testing period and who were enrolled in school, regardless of grade level or full-time or part-time status.
• In TIMSS, the target population is all students from the upper of the two adjacent grades that contain the largest number of 9-year-olds and all stu-dents from the upper of the two adjacent grades that contain the largest num-ber of 13-year olds. In most countries, this population is all fourth-grade and eight-grade students.
• In PIRLS, the target population is the upper of the two adjacent grades with the largest number of 9-year-olds. In most countries, this population is all fourth-grade students.
Test Frameworks and Test Items There are a number of differences between the test frameworks and test items of the three surveys, even in similar fields such as mathematics. All assessments are developed on the basis of a framework specifying the content and skill to be measured. However, whereas PISA focuses on tests aimed at measuring ‘know-ledge and skills that are essential for full participation in society’, TIMSS focuses on tests aimed at measuring the extent to which the intended and implemented curriculum is reflected in individual students’ competences. In PISA, the framework which is used to specify a range of content expectations as regards mathematics, for instance, is organized around overarching ideas (e.g. space and shape) and with emphasis on the contexts in which mathematics is applied (e.g. in school, in society). In contrast, in TIMSS the overall framework for mathematics assessment consists of five main content areas related to the major mathematical curricular areas of number, measurement, geometry, data, and algebra, as well as four cognitive domains (knowing facts and procedures, using concepts, solving routine problems, and reasoning). The same differences apply in the field of science. The test framework for scien-ce in TIMSS is organized around five disciplinarily defined content domains; life science, physical sciences (chemistry and physics), earth science, and envi-ronmental science), as well well as around three cognitive domains (factual knowledge, conceptual understanding, and reasoning and analysis). In PISA, the framework is defined in terms of themes (e.g. form and function, biodiversity),
______________________________________________
Introduction 30
and the framework also specifies, along with a process dimension, a context dimension (e.g. science in life and health, science in technology). The differences in the overall perspective of the test frameworks is to a great extent reflected in the individual test items. Test items in PISA thus reflect the overarching ideas or themes which structure the test items, rather than the disci-plinary approach of TIMSS and PIRLS. Moreover, test items in PISA tend to be more real-life oriented than test items in TIMSS. Comparing PISA and TIMSS in mathematics, there are also differences in the relative importance of test domains in terms of the number of test items (Scott 2004). PISA has a greater focus on data (40 per cent of all items) and less focus on algebra (11 per cent than the eight-grade assessment in TIMSS (11 per cent and 23 per cent respectively). The PIRLS assessment framework focuses on three aspects of reading literacy: processes of comprehension, purposes for reading and reading behaviours and attitudes. In contrast, PISA’s reading assessment design rests on the definition of reading literacy as “the ability to understand, use and reflect on written texts in order to achieve one’s goals, to develop one’s knowledge and potential, and to participate effectively in society”, and it measures this along several dimensions: The form of reading material or text, the type of reading task, and the use for which the text was constructed. The differences in terms of framework and test items reflect the different age groups that are targeted in the two surveys, as well as the more direct “real life” orientation of PISA’s test framework. Background Variables There are also differences in the specific coverage of background variables. For instance, TIMSS asks about the students’ academic self-concept, which PISA does not. A number of background questionnaire items specifically address is-sues that are relevant only to the competences tested, e.g. reading or mathemat-ics.
Implications: Differences Must be Taken Into Account Evidently, the differences that are described above imply that the results of the different surveys are not directly comparable, and that independent analyses will have to be carried out for each survey. This does not mean, however, that com-parisons cannot be made. For surveys that seek to test similar, if not identical, competences, comparisons can clearly be made. But methodological differences need to be taken into account in the interpretation of results. Broadly speaking, the different conceptual frameworks of PISA on the one hand and TIMSS and PIRLS on the other hand suggest that the results of the different surveys can potentially inform policy making in different ways.

______________________________________________
Introduction 31
• The design of PISA, with its focus on ‘knowledge and skills that are essen-tial for full participation in society”, entails that results from PISA potenti-ally allow societies to consider and answer the following question: To what extent does our educational system equip 15-year-olds to live up to the requirements of society with respect to mathematics, reading, and science?
• The design of TIMSS and PIRLS, with their focus on curriculum require-ments, entails that results from these surveys potentially allow societies to consider and answer the following question: How does our educational system perform in the various curricular domains in mathematics, science, and reading?
The difference in the potential utility of the two types of surveys should not be exaggerated, however. It could be expected that the curricular objectives in mathematics, science, and reading, are not very significantly different from the real-life requirements to students as regards mathematics, science, and reading.4 More specifically, the main advantage of the PISA-approach is that it makes possible international comparisons regardless of differences in curricular objectives between school systems. If all participating countries can agree that the overall objective of school systems in mathematics, science, and reading, is to equip students to participate fully in society, and if the test framework pro-vides valid information on this, it becomes irrelevant whether countries differ with respect to the specific curricular objectives and requirements in e.g. the 4th or the 8th grade. On the other hand, the age-based sampling design of PISA does not take into account that the starting age of schooling may differ between school systems. 15-year-olds in different countries may therefore have attended school for a different number of years. Neither does the sampling strategy of PISA facilitate the use of teacher-related variables, since the random sample of 15-year-olds in the sampled schools will have been subject to instruction from a number of different teachers. The main advantage of the TIMSS-approach is that it potentially allows policy makers to interpret test results in relation to curricular objectives. The level of algebra proficiency in the 8th grade that is demonstrated in TIMSS in a given school system can in principle be compared to the objectives in the intended curriculum, and action can be taken on this basis. It can also be argued that the class-based sampling design of TIMSS and PIRLS involves particular advan-tages, making it possible to link curriculum with instructional practices and both of these with student outcomes. Classrooms can be connected to particular
4 Indeed, if there are big differences, it could imply that there are major problems with the focus of the curricu-lum in question: In this situation, the curriculum would not be oriented towards equipping students with the knowledge and skills that are essential for participation in society. Other explanations for large differences in test scores of TIMSS and PISA are also possible, however, such as sampling design and validity problems in one or both of the tests (PISA may not measure real life requirements, or TIMSS may not measure curriculum achievement).

______________________________________________
Introduction 32
teachers, to particular instructional processes, and to a particular curriculum (cf. Robitaille 2001) As for the international comparison of TIMSS test results, the curriculum-based approach is open to criticism: Different school systems may have different curri-cular objectives at the different grade levels. A relatively low average achieve-ment score in a particular curriculum domain may therefore reflect that this domain is accorded a relatively low priority in the curriculum of the school system concerned. The advantages of the classroom-based sampling design can also be discussed, as it is difficult to capture the relevant aspects of instructional practices and other teacher-related characteristics in quantitative surveys. For both TIMSS (the 8th grade surveys) and PISA (focusing on 15-year-olds) it could be considered a problem that early school leavers are not covered by the surveys. On the other hand, the surveys can be said to measure the performance of school systems for students who are enrolled in the school systems. The rate of early school leavers can be considered a separate, and significant, performance criterion for school systems.
2.3. Approach and Methodology The overall objective of the present analysis of the PISA, TIMSS, and PIRLS surveys, is to generate as much information and knowledge as possible that is relevant for policy-making purposes. Against this background, the approach to the analysis rests on a number of assumptions and focus areas.
The Normative Element: Evaluation Criteria The Lisbon Strategy – as we understand it - provides us with the normative yardstick against which analytical results can be assessed and recommendations can be formulated. Thus, the normative foundations of the study and its conclu-sions are: • that education systems should enable as many students as possible to per-
form as strongly as possible in mathematics, reading, and science. • that the average performance of the weakest groups of students should be
increased. We believe that both statements are in line with the Lisbon Strategy and its focus on “world class education” in the European Union, as well as with its emphasis on social cohesion and the related operational objectives of reducing the share of low-achieving 15-year-olds in reading literacy in the EU.
The Statistical Analysis and Its Limits It is important that we keep in mind that there are different limits and possibi-lities depending on the level of analysis. By definition, PISA, TIMSS, and PIRLS are international efforts, and much attention has been paid to the level of

______________________________________________
Introduction 33
countries and to comparisons between countries. Data is also, however, at an individual level and at school level. At the country level there are important limits as to the types of valid and useful statistical analysis that can be carried out and the research questions which can be answered via statistical analysis. At the level of individual students, there is a higher degree of freedom and therefore much greater possibilities for carrying out multivariate analysis. At the school level, there is also a higher degree of freedom in principle, since the number of sampled schools is large. However, possibilities for analyses at school level are affected by the applied sampling strategy in PISA, TIMSS, and PIRLS. Country Level At the country level, there are only a very limited number of units of investi-gation. From tabel 2.2 it appears that the number of units of investigation varies between 12 and 27, depending on the survey and data collection round. A very significant number of independent variables are covered by the back-ground variables of each study. An even larger number of variables is potentially relevant. Some of these background variables have been added to the data set in the course of the implementation of the current project. Given the low number of units of investigation and the large number of indepen-dent variables, it is not possible to isolate the effects of each indendent variable on the dependent variable. From a statistical point of view, it is therefore not possible to answer the question why some countries perform better than others in terms of achievement scores. There are too few cases and too many variables which differ between countries. Statistical co-variations can be found, but several independent variables will co-vary with achievement scores. Conse-quently, it will not be possible to isolate the effects of individual independent variables. It is very problematic, therefore, to speak of causal correlations between variables at the level of countries. The number of independent variables could in principle be reduced via factor analysis, identifying a limited number of underlying dimensions in the back-ground variables. This will enable multivariate analysis with only a limited number of cases. This approach has been tested in the current project. However, because of the dramatic reduction required in the number of independent variables due to the low number of units of investigation, the ensuing analysis becomes very abstract, involving highly aggregate dimensions. The results of such an analysis have not been deemed useful for policy purposes. There are still many possibilities for carrying out statistical analysis at a country level, and these will be utilized in the current study. However, such analyses will only involve a limited number of independent variables at a time. They will be able to highlight statistical correlations/co-variations between these independent variables and the achievement scores of the respective surveys. These correla-
______________________________________________
Introduction 34
tions can serve to raise questions and formulate hypotheses, but they cannot claim to be causal explanations of achievement scores. Instead, the relevance of hypotheses and correlations between variables can be investigated in more interpretative ways, by drawing on various sources of background information at the level of individual countries. This is the approach which will be adopted in the present report. Interesting findings from the statistical analysis will be interpreted in light of relevant background factors, be they in qualitative of quantitative form. Individual Level At the individual level, the possiblities for statistical analysis are much more comprehensive, as the number of units of investigation amounts to many thousands in each of the involved surveys. It is possible to explain a significant proportion of the variance of individual achievement scores across countries, by making use of multivariate regression analysis that draws upon the background variables of the various studies. Similarly, it is possible to explain a significant proportion of the variance of individual achievement scores within specific countries, for instance in well-performing countries. However, this cannot explain why one country’s average score is higher that that of another country. At the individual level, the present study will include some multivariate analyses of individual achivement scores for the entire population of respondents. This will enable an identification of the background factors which are most signifi-cant for individual achievement scores across countries. Some, but evidently not all, of these background factors will be relevant for public policy decisions. School Level As with the individual level, it is possible in principle to explain a significant proportion of the variance of achievement scores between schools by making use of multivariate regression analysis and drawing upon the background variables of the various studies pertaining to the school level. As mentioned, the degree to which this is possible, however, depends on the sampling strategy of the survey concerned. Thus, for PISA, TIMSS, and PIRLS, it is true that “although the student’s samples were drawn from within a sample of schools, the school sample was designed to optimize the resulting sample of students, rather than to give an optimal samples of schools. For this reason, it is always preferable to analyze the school-level variables as attributes of students, rather than as elements in their own rights” (Gonzales and Kennedy, 2003).
Interpretative Elements Against the background of the limits and possibilities described above, the study will include significant interpretative elements, allowing an understanding or interpretation of a given statistical co-variation. For example:
______________________________________________
Introduction 35
• For high-performing countries in various respects, a number of structural or
other characteristics of selected educational systems of these countries are highlighted in both qualitative and quantitative form and discussed in the perspective of these characteristics.
• For countries’ whose average achievement scores have developed signifi-cantly from one point of time to another, relevant reforms of educational sys-tems and approaches are highlighted and discussed.
Analytical Focus Areas In light of the Lisbon Strategy and the priorities of the “Education and Training 2010” programme, a number of analytical fields merit particular attention in the framework of the present report. The following list summarizes the key research questions of the study: • Overall average achievement scores and the development in the scores. The
variance of the achievement scores of the various outcome dimensions. De-velopments in variance over time. Structural characteristics of high perform-ing countries and low performing countries.
• The share of low-achieving pupils across countries. Achievement scores of immigrants. Achievement scores of less privileged social groups.
• School-related factors and their relation to average achievement scores on the different outcome dimensions.
• Factors related to the individual which affect the level of achievement scores for individual students as regards each of the outcome dimensions; the rela-tive importance of these factors across countries
• The relationship between immigration status and achievement scores at the level of individuals; the character of the relation when controlling for coun-try (is the relationship stronger in some countries than in others, i.e. are some countries better than others at providing immigrants with the same level of basic skills as the total student population?)
• The relationship between socio-economic status and achievement scores at the level of individuals; the character of the relationship when controlling for country (is the relationship stronger in some countries than in others, i.e. are some countries better than others at providing children from less privileged backgrounds with the same level of basic skills as the total student popula-tion?)
The Backbone: PISA A key challenge in the current study in light of the massive amounts of available data has been to seek clarity and provide overviews without losing important relevant information. Clarity and simplicity have been sought in several ways.. One important element has been to take a point of departure in the PISA-surveys. The PISA studies have been considered the backbone of the report, and data from TIMSS and PIRLS are used either to underpin or question data from PISA. Operationally, this means that most of the tables and figures in the main text body of the report rely on PISA data, whereas several tables reporting the TIMSS and PIRLS studies are found in Annex 4.

______________________________________________
Introduction 36
Guide to the Following Chapters The following sections contain the results of the analysis, organized in accor-dance with the overall analytical framework which is developed and presented in Chapter 3. Chapter 4 contains an overview and descriptive analysis of achievement scores across countries in reading, mathematics, and science, including an analysis of developments over time and an analysis of variance in achievement scores. The chapter also presents an analysis of the relation between achievement scores across countries and the resource inputs provided to primary and lower secon-dary education in each country. Chapter 5 focuses on the relation between achievement scores in mathematics, reading, and science, and specific student characteristics: gender, ethnicity, and socioeconomic background. This analysis is at the level of individual students, but results are broken down by countries, allowing comparisons of the strength and direction of relations between factors across countries, and an assessment of the significance of educational systems in this connection. The significance of gender, ethnicity, and socioeconomic background on the one hand, and achievement scores on the other hand, will be analysed for reading, mathemat-ics, and science. The most in-depth analyses, however, concern students’ profi-ciency in mathematics. Chapter 6 deals with students’ individual resources and motivation and the sig-nificance of these factors for achievement scores. Again, the analysis is at the level of individual students, but results are broken down by countries, allowing cross-country comparison and an analysis of the significance of country back-ground. Chapter 7 concerns the broader educational environment and the provision of basic skills. We analyse the relationship between the performance of students and a number of background variables at both the level of the educational sys-tems of the involved countries and the level of schools.
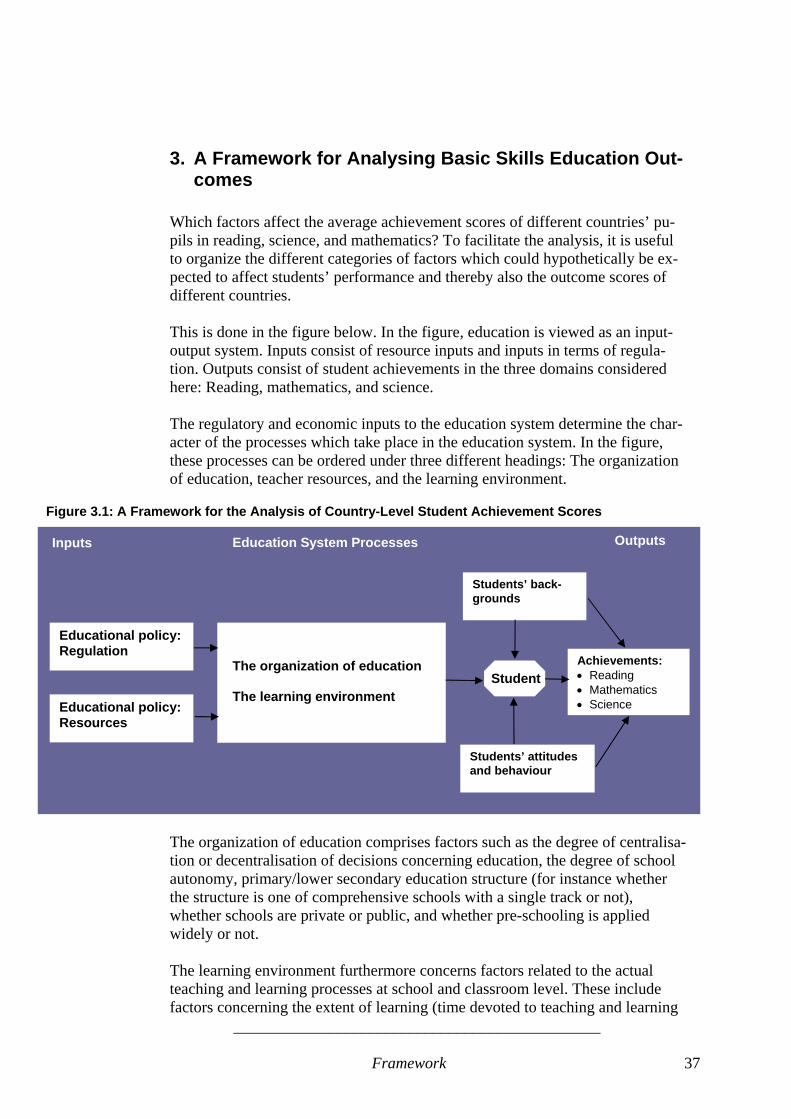
______________________________________________
Framework 37
3. A Framework for Analysing Basic Skills Education Out-comes
Which factors affect the average achievement scores of different countries’ pu-pils in reading, science, and mathematics? To facilitate the analysis, it is useful to organize the different categories of factors which could hypothetically be ex-pected to affect students’ performance and thereby also the outcome scores of different countries. This is done in the figure below. In the figure, education is viewed as an input-output system. Inputs consist of resource inputs and inputs in terms of regula-tion. Outputs consist of student achievements in the three domains considered here: Reading, mathematics, and science. The regulatory and economic inputs to the education system determine the char-acter of the processes which take place in the education system. In the figure, these processes can be ordered under three different headings: The organization of education, teacher resources, and the learning environment.
Figure 3.1: A Framework for the Analysis of Country-Level Student Achievement Scores
The organization of education comprises factors such as the degree of centralisa-tion or decentralisation of decisions concerning education, the degree of school autonomy, primary/lower secondary education structure (for instance whether the structure is one of comprehensive schools with a single track or not), whether schools are private or public, and whether pre-schooling is applied widely or not. The learning environment furthermore concerns factors related to the actual teaching and learning processes at school and classroom level. These include factors concerning the extent of learning (time devoted to teaching and learning
Educational policy: Regulation
Educational policy: Resources
The organization of education The learning environment
Education System Processes
Achievements:• Reading • Mathematics • Science
Students’ attitudes and behaviour
Students’ back-grounds
Student
Inputs Outputs

______________________________________________
Framework 38
inside and outside of school) and factors related to the learning climate (the ex-tent of disciplinary problems and the like), but also factors concerning the condi-tions of learning such as the physical infrastructure of schools, and the availabil-ity of relevant educational resources (instruction materials, computers etc.), as well as the availability of qualified teachers. The ways in which processes of the education system can result in student profi-ciency must be expected to be conditioned by a number of factors. The figure highlights students’ backgrounds (home background including the socio-econo-mic status of the parents, gender, and whether the student is a native speaker of the test language or an immigrant or not) and students’ individual resources and motivation (covering self-confidence, ambitions, and expectations, among other things) as two categories of potentially important factors. The analytical framework does not purport to include all factors and variables which may potentially be relevant for explaining the achievement scores at a country level. Instead it lists a number of factors whose importance it is relevant to investigate in the context of the overall purposes of the present study and within the limits defined by the available data. In the following sections, we focus on a number of the different categories of factors which are outlined in the figure, and the relations between these factors and the performance of students in reading, mathematics, and science.
______________________________________________
Overall Performance 39
4. Overall Performances: Status and Developments In the section below, an overview analysis is provided over the achievement scores of the countries participating in the PISA, TIMSS, and PIRLS surveys. First we will look at differences between countries on the basis of the average achievement scores in reading, mathematics, and science literacy at the level of countries. Next we will focus on variance within countries. The penultimate sec-tion focuses on the relation between economic resources devoted to education and PISA achievement scores. The final section draws out a number of policy implications from the analysis. Throughout the chapter, special attention will be paid to the PISA-surveys, but the results of TIMSS and PIRLS will be included on a continual basis. Comparisons between the average achievement scores of countries in the PISA surveys and similar studies yielding data which is internationally comparable certainly receive considerable attention in the media and among policy makers. This is understandable, since the level of skills and competences is seen as a key to the international competitiveness of today’s and tomorrow's economies. At the same time, the nation state remains the key framework for the formulation and implementation of education policy. • However, it should be emphasized that the importance of country differences
in achievement scores for basic skills may very well be considerably overes-timated in the general public debate. It is an important point in this connec-tion that only about one tenth of total variation in student performance lies between countries and can, therefore, be captured through a comparison of country averages. The remaining about nine tenths of variation in student performance occurs within countries, that is, between education systems and programmes, between schools, and between students within schools. This re-sult is confirmed in both PISA 2000 and 2003 and TIMSS 1995, 1999 and 2003 (OECD 2004c: 60, 280-282).
4.1. Average Performance and its Development Average Performance Scores in PISA 2003 Nevertheless, the point of departure for much of the public debate on the PISA survey remains international comparison and not least the overall ranking of the countries on the basis of mean achievement scores in reading, mathematical, and scientific literacy. The table below displays this ranking. The ranking should be interpreted quite cautiously, both as regards the ranking in the various domains – reading, science, and mathematics – and as regards the aggregate ranking. The calculation of average achievement scores at the level of countries is made from estimates of national performance based on samples of students, rather than from the values that could be calculated had the total stu-dent population in each country answered every test question.
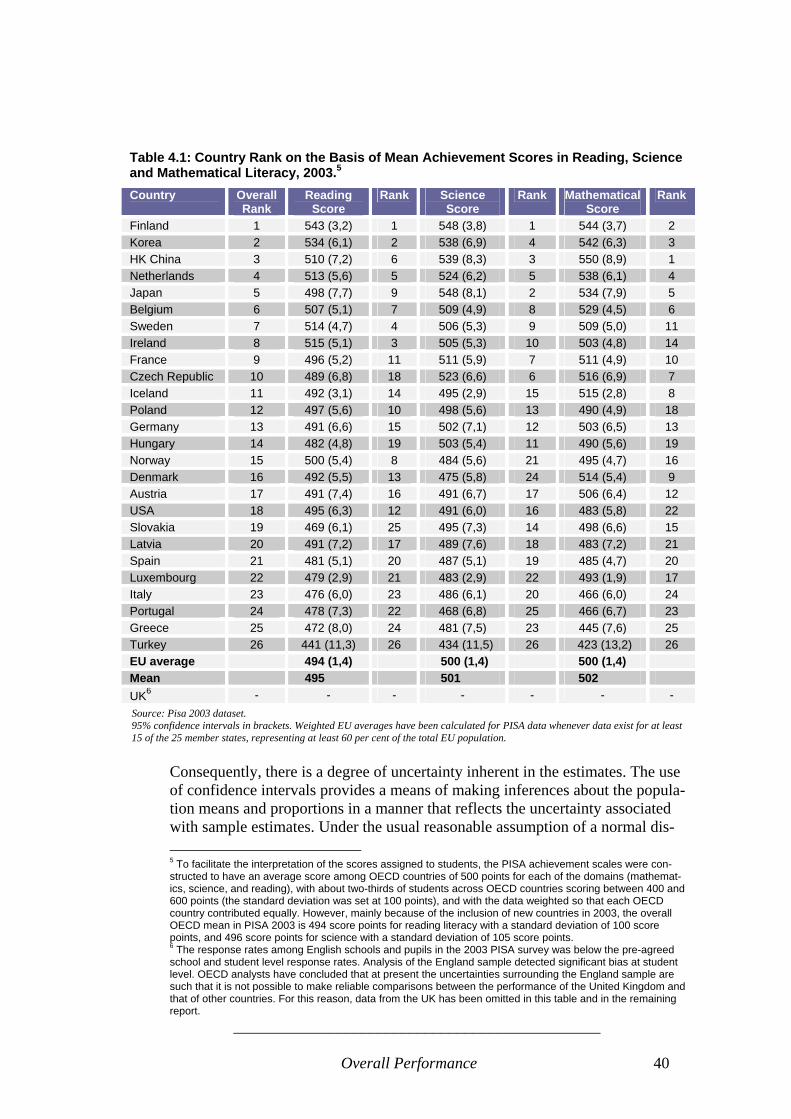
______________________________________________
Overall Performance 40
Table 4.1: Country Rank on the Basis of Mean Achievement Scores in Reading, Science and Mathematical Literacy, 2003.5 Country Overall
Rank Reading
Score Rank Science
Score Rank Mathematical
Score Rank
Finland 1 543 (3,2) 1 548 (3,8) 1 544 (3,7) 2 Korea 2 534 (6,1) 2 538 (6,9) 4 542 (6,3) 3 HK China 3 510 (7,2) 6 539 (8,3) 3 550 (8,9) 1 Netherlands 4 513 (5,6) 5 524 (6,2) 5 538 (6,1) 4 Japan 5 498 (7,7) 9 548 (8,1) 2 534 (7,9) 5 Belgium 6 507 (5,1) 7 509 (4,9) 8 529 (4,5) 6 Sweden 7 514 (4,7) 4 506 (5,3) 9 509 (5,0) 11 Ireland 8 515 (5,1) 3 505 (5,3) 10 503 (4,8) 14 France 9 496 (5,2) 11 511 (5,9) 7 511 (4,9) 10 Czech Republic 10 489 (6,8) 18 523 (6,6) 6 516 (6,9) 7 Iceland 11 492 (3,1) 14 495 (2,9) 15 515 (2,8) 8 Poland 12 497 (5,6) 10 498 (5,6) 13 490 (4,9) 18 Germany 13 491 (6,6) 15 502 (7,1) 12 503 (6,5) 13 Hungary 14 482 (4,8) 19 503 (5,4) 11 490 (5,6) 19 Norway 15 500 (5,4) 8 484 (5,6) 21 495 (4,7) 16 Denmark 16 492 (5,5) 13 475 (5,8) 24 514 (5,4) 9 Austria 17 491 (7,4) 16 491 (6,7) 17 506 (6,4) 12 USA 18 495 (6,3) 12 491 (6,0) 16 483 (5,8) 22 Slovakia 19 469 (6,1) 25 495 (7,3) 14 498 (6,6) 15 Latvia 20 491 (7,2) 17 489 (7,6) 18 483 (7,2) 21 Spain 21 481 (5,1) 20 487 (5,1) 19 485 (4,7) 20 Luxembourg 22 479 (2,9) 21 483 (2,9) 22 493 (1,9) 17 Italy 23 476 (6,0) 23 486 (6,1) 20 466 (6,0) 24 Portugal 24 478 (7,3) 22 468 (6,8) 25 466 (6,7) 23 Greece 25 472 (8,0) 24 481 (7,5) 23 445 (7,6) 25 Turkey 26 441 (11,3) 26 434 (11,5) 26 423 (13,2) 26 EU average 494 (1,4) 500 (1,4) 500 (1,4) Mean 495 501 502 UK6 - - - - - - - Source: Pisa 2003 dataset. 95% confidence intervals in brackets. Weighted EU averages have been calculated for PISA data whenever data exist for at least 15 of the 25 member states, representing at least 60 per cent of the total EU population.
Consequently, there is a degree of uncertainty inherent in the estimates. The use of confidence intervals provides a means of making inferences about the popula-tion means and proportions in a manner that reflects the uncertainty associated with sample estimates. Under the usual reasonable assumption of a normal dis- 5 To facilitate the interpretation of the scores assigned to students, the PISA achievement scales were con-structed to have an average score among OECD countries of 500 points for each of the domains (mathemat-ics, science, and reading), with about two-thirds of students across OECD countries scoring between 400 and 600 points (the standard deviation was set at 100 points), and with the data weighted so that each OECD country contributed equally. However, mainly because of the inclusion of new countries in 2003, the overall OECD mean in PISA 2003 is 494 score points for reading literacy with a standard deviation of 100 score points, and 496 score points for science with a standard deviation of 105 score points. 6 The response rates among English schools and pupils in the 2003 PISA survey was below the pre-agreed school and student level response rates. Analysis of the England sample detected significant bias at student level. OECD analysts have concluded that at present the uncertainties surrounding the England sample are such that it is not possible to make reliable comparisons between the performance of the United Kingdom and that of other countries. For this reason, data from the UK has been omitted in this table and in the remaining report.

______________________________________________
Overall Performance 41
tribution, there is a 95 per cent chance that the true value lies within the confi-dence interval. In table 4.1, confidence intervals are displayed in brackets. The confidence in-tervals imply that it is not possible to determine the exact rank order position of countries in the international comparisons. Rather, it is possible to say with 95 per cent confidence that a country lies within a range of positions. For instance, it is possible to say with 95 per cent confidence that Finland and Korea, lie between the first and second position of all countries listed in the table as regards reading, and that Finland, Japan, Korea, and HK China, lie between the top four positions as regards the average science score. The average score of Denmark in mathematics, to take another example, can be said with 95 per cent confidence to lie in the interval from 509 score points to 520 score points. This means that with 95 per cent confidence, the relative position of the Danish mathematics average is between position 8 and position 13 in the mathematics ranking.
Box 4.1 The PISA Levels in Reading: What can Students at Each Proficiency Level do and what Scores are Associated with the Levels? Students proficient at Level 5 (over 625 points) are capable of completing sophisticated reading tasks, such as: managing information that is difficult to find in unfamiliar texts; showing detailed understanding of such texts and inferring which information in the text is relevant to the task; and being able to evaluate criti-cally and build hypotheses, draw on specialized knowledge, and accommodate concepts that may be con-trary to expectations. Students proficient at Level 4 (553 to 625) are capable of difficult reading tasks, such as locating embed-ded information, construing meaning from nuances of language, and critically evaluating a text. Students proficient at Level 3 (481 to 552 points) are capable of moderately complex reading tasks, such as locating multiple pieces of information, drawing links between different parts of the text, and relating the text to familiar everyday knowledge. Students proficient at Level 2 (408 to 480 points) are capable of basic reading tasks, such as locating straightforward information, making low-level inferences of various types, deciding what a well-defined part of the text means, and using some outside knowledge to understand it. Students proficient at Level 1 (335 to 407 points) are capable of competing only the least complex read-ing tasks developed for PISA, such as locating a single piece of information, identifying the main theme of a text or making a simple connection with everyday knowledge. Students performing below Level 1 (below 335 points) are not able to routinely show the most basic type of knowledge and skills that PISA seeks to measure. These students may have serious difficulties in using reading literacy as an effective tool to advance and extend their knowledge and skills in other areas. Source: OECD
These reservations having been made, a number of points can be formulated on the basis of the table. Thus, with only a few exceptions, the ten best performing countries in one test domain are also among the ten best performing countries in the other test domains. The correlation between student performance on the dif-ferent scales is also found at the level of individual students, cf. Table A2 in An-
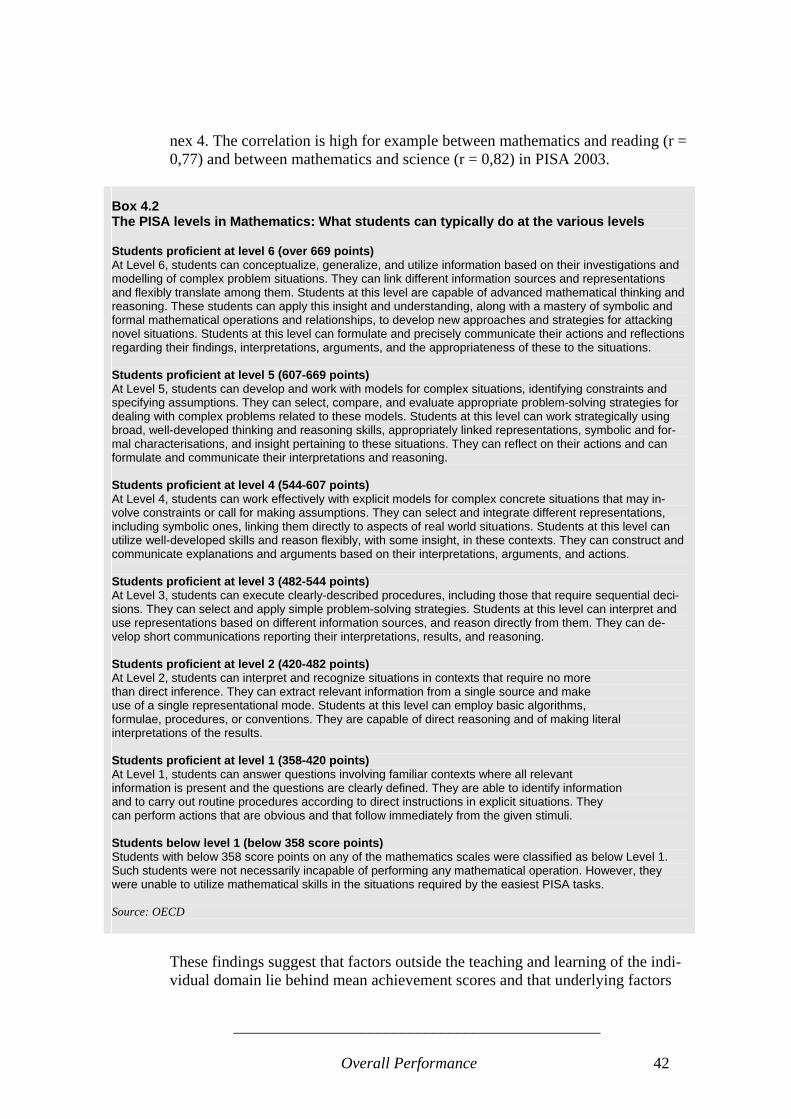
______________________________________________
Overall Performance 42
nex 4. The correlation is high for example between mathematics and reading (r = 0,77) and between mathematics and science (r = 0,82) in PISA 2003.
Box 4.2 The PISA levels in Mathematics: What students can typically do at the various levels Students proficient at level 6 (over 669 points) At Level 6, students can conceptualize, generalize, and utilize information based on their investigations and modelling of complex problem situations. They can link different information sources and representations and flexibly translate among them. Students at this level are capable of advanced mathematical thinking and reasoning. These students can apply this insight and understanding, along with a mastery of symbolic and formal mathematical operations and relationships, to develop new approaches and strategies for attacking novel situations. Students at this level can formulate and precisely communicate their actions and reflections regarding their findings, interpretations, arguments, and the appropriateness of these to the situations. Students proficient at level 5 (607-669 points) At Level 5, students can develop and work with models for complex situations, identifying constraints and specifying assumptions. They can select, compare, and evaluate appropriate problem-solving strategies for dealing with complex problems related to these models. Students at this level can work strategically using broad, well-developed thinking and reasoning skills, appropriately linked representations, symbolic and for-mal characterisations, and insight pertaining to these situations. They can reflect on their actions and can formulate and communicate their interpretations and reasoning. Students proficient at level 4 (544-607 points) At Level 4, students can work effectively with explicit models for complex concrete situations that may in-volve constraints or call for making assumptions. They can select and integrate different representations, including symbolic ones, linking them directly to aspects of real world situations. Students at this level can utilize well-developed skills and reason flexibly, with some insight, in these contexts. They can construct and communicate explanations and arguments based on their interpretations, arguments, and actions. Students proficient at level 3 (482-544 points) At Level 3, students can execute clearly-described procedures, including those that require sequential deci-sions. They can select and apply simple problem-solving strategies. Students at this level can interpret and use representations based on different information sources, and reason directly from them. They can de-velop short communications reporting their interpretations, results, and reasoning. Students proficient at level 2 (420-482 points) At Level 2, students can interpret and recognize situations in contexts that require no more than direct inference. They can extract relevant information from a single source and make use of a single representational mode. Students at this level can employ basic algorithms, formulae, procedures, or conventions. They are capable of direct reasoning and of making literal interpretations of the results. Students proficient at level 1 (358-420 points) At Level 1, students can answer questions involving familiar contexts where all relevant information is present and the questions are clearly defined. They are able to identify information and to carry out routine procedures according to direct instructions in explicit situations. They can perform actions that are obvious and that follow immediately from the given stimuli. Students below level 1 (below 358 score points) Students with below 358 score points on any of the mathematics scales were classified as below Level 1. Such students were not necessarily incapable of performing any mathematical operation. However, they were unable to utilize mathematical skills in the situations required by the easiest PISA tasks. Source: OECD
These findings suggest that factors outside the teaching and learning of the indi-vidual domain lie behind mean achievement scores and that underlying factors
______________________________________________
Overall Performance 43
are at work – or put in different terms that the three skills domains to a great extent measure the same underlying dimension. “Student abilities” or “student learning abilities” may be the most relevant – even if rather broad and imprecise – terms for describing this underlying dimen-sion. Several factors, including the educational background and the socio-economic resources of parents, may in turn affect this underlying dimension. The analysis in chapter 5 and 6 identifies the significance of a number of such background factors. As regards the seven European countries in the top-10, Finland scores signifi-cantly higher than the average across all three domains. The Netherlands, Bel-gium, Sweden, Ireland, and France, also perform well. In the upper end of top-10 are the pupils from the East Asian countries – South Korea, HK China, and Japan. These three countries are generally among the five best performing coun-tries, and their results are only exceeded by those of Finland. The table also illustrates the existence of a group of four relatively low-performing countries – Turkey, Greece, Portugal, and Italy – with mean achievement scores across domains substantially below the overall average. As regards reading, this means for example that whereas the average achievement scores of the students in all the other countries are at PISA level 3, the average achievement score of the students from these countries are at level 2. The same goes for mathematics, where the average achievement scores of the students from these countries are also one level below the average of the students from the other countries, and even two levels below the two top performing countries: Japan and HK China.7 For several of the countries included in Table 4.1, data collection and analyses have been carried out at sub-national, regional levels in PISA 2003. This goes for Belgium, Italy, Spain, Finland and the UK. An overview over the results on the mathematics scale is found in Table A3 in Annex 4.
Mean Achievement Scores do not Reflect Differences in Share of Immigrants The overall achievement scores will be subject to closer analysis in later sec-tions. However, it is relevant already at this point to investigate for the share of immigrants among the tested samples of students. Thus, it is well known that the percentage of students with foreign ethnic back-ground differs significantly among the countries covered in the study. This is illustrated in table 4.2. In the table, “students with foreign ethnic background” are students who are either born in the country of the assessment but whose par-ents were born in another country, or students who are born outside the country of assessment and whose parents were also born in another country.
7 No levels are yet defined for science literacy. This will be done in connection with the implementation of PISA 2006.

______________________________________________
Overall Performance 44
At the same time, students with a foreign ethnic background often score signifi-cantly lower on average in proficiency tests in reading, mathematics, and sci-ence, as we shall return to later. It is thus an obvious possibility that the share of students with a foreign ethnic background is a factor which can explain a signifi-cant part of the variation in average country achievement scores, and that the rank order of the included countries will change significantly when considering only native students. Table 4.2: The Share of Students with Foreign Ethnic Background in Selected Countries
Country Pct. Students with Foreign Background
HK China 43 Luxembourg 33 Germany 15 France 14 USA 14 Austria 13 Belgium 12 Sweden 12 Netherlands 11 Latvia 9 UK 8 EU average 7 Denmark 7 Greece 7 Norway 6 Portugal 5 Ireland 4 Spain 3 Finland 2 Hungary 2 Italy 2 Czech Republic 1 Iceland 1 Slovakia 1 Turkey 1 Poland 0 Japan 0 Korea 0
Source: PISA dataset 2003. This has been tested, and the result is negative. The relation between the variable measuring the percentage of immigrants in the country and the average achieve-ment score is statistically insignificant. Furthermore, the rank order of the mean achievement scores of the participating countries is not affected when excluding students of foreign ethnic background from the analysis. TIMSS 2003: Average Country Scores in Mathematics and Science How do the overall results of the PISA 2003 survey in terms of the relative posi-tion of countries’ student populations differ from the results of the TIMSS 2003

______________________________________________
Overall Performance 45
survey? The table below displays the average country scores of the TIMSS 2003 survey for the countries that were also participating in PISA 2003 plus Estonia, Lithuania, and Cyprus.8 The table below shows a high degree of convergence between the PISA rankings in mathematics and science and those of TIMSS in the same domains: Three East Asian countries, Korea, HK China, and Japan, are among the top perform-ers in both surveys, with the Dutch also performing well on average. At the lower end of the ranking scale, the average TIMSS performance of Slovakia, Latvia, and Italy, also corresponds roughly to the relative placement of these two countries in PISA 2003.
Table 4.3: Average Mathematics and Science Scores, 8th Grade Students, TIMSS 2003 Overall
Rank Mathematics Score
95% confidence interval
Mathematics Rank
Science Score
95% confidence interval
Science Rank
Singapore 1 605 7,1 1 578 8,4 1
Korea 2 589 4,3 2 558 3,1 2
Hong Kong 3 586 6,5 3 556 5,9 3
Japan 4 570 4,1 4 552 3,3 4
Estonia 5 531 5,9 7 552 4,9 4
Netherlands 6 536 7,4 6 536 6,1 6
Hungary 7 529 6,3 8 543 5,5 5
Belgium (fl.) 8 537 5,5 5 516 4,9 10
United States 9 504 6,5 10 527 6,1 7
Slovakia 10 508 6,5 9 517 6,3 11
Sweden 10 499 5,1 12 524 5,3 8
Latvia 12 508 6,3 9 512 5,1 12
Lithuania 12 502 4,9 11 519 4,1 10
Slovenia 14 493 4,3 14 520 3,5 9
Scotland 15 498 7,3 13 512 6,7 12
Italy 16 484 6,3 15 491 6,1 14
Norway 17 461 4,9 16 494 4,3 13
Cyprus 18 459 3,3 17 441 3,9 15 Source: TIMSS 2003 data set. 95% confidence intervals in brackets.
In PISA, Swedish and Norwegian students' performance is relatively poorer in science and mathematics than in reading, and their relative performance in these two domains in TIMSS reflects this well, even if the relative performance for Norway is somewhat poorer in TIMSS than in PISA. This may reflect differ-ences in the average age of the sampled students in TIMSS and factors related to
8 As in PISA, the scale of the TIMSS achievement results has a mean of 500 and a standard deviation of 100. Since they measure somewhat different age groups and content areas of mathematics and science, the re-sults are not directly comparable, however. Furthermore, since the groups of participating countries differ for the two surveys, the mean score of 500 refers to the results of different countries. Consequently, the compari-son of PISA and TIMSS data in mathematics and science should only be seen as a rough indication of simi-larities in results or trends.

______________________________________________
Overall Performance 46
this: Norwegian students in TIMSS were less than 14 years old on average, which is below the international average of 14,5 years. In PISA, all students are approximately 15 years old and there are no systemic differences between coun-tries.9 A number of countries that participated in PISA 2003 did not participate in TIMSS 2003. Among this group is Finland, the top performing European coun-try in PISA 2003.
A Note on Reading Achievement Scores in PIRLS 2001 Based on data collected in 2001, the PIRLS study (Progress in International Reading Literacy Study) also calculated the average achievement scores of stu-dents across countries. However, compared to PISA and TIMSS, PIRLS covers a different age group, namely 4th grade students of an average age between 9,7 years and 11,2 years. Because of the differences in the test populations and the contents of tests, it is not surprising if test results differ between the reading achievement scores of PIRLS and those of PISA.
Table 4.4: Average Reading Scores, 15 Year Olds and 4th Grade Students, PISA 2003 and PIRLS 2001. PISA 2003
Reading Score
PISA Rank PIRLS Rank PIRLS 2001 Reading
score
Score Point Difference
PISA-PIRLS
Sweden 514 (4,7) 1 1 561 (4,3) -47 Netherlands 513 (5,6) 2 2 554 (4,9) -41 Hong Kong China 510 (7,2) 3 9 528 (6,1) -18 Norway 500 (5,4) 4 13 499 (5,7) 1
France 496 (5,2) 5 10 525 (4,7) -29
USA 495 (6,3) 6 5 542 (7,4) -47
Iceland 492 (3,1) 7 12 512 (2,4) -20
Germany 491 (6,6) 8 7 539 (3,7) -48
Latvia 491 (7,2) 9 3 545 (4,5) -54
Czech Republic 489 (6,8) 10 8 537 (4,5) -48
Hungary 482 (4,8) 11 4 543 (4,3) -61
Italy 476 (6,0) 12 6 541 (4,7) -65
Greece 472 (8,0) 13 11 524 (6,9) -52
Turkey 441 (11,3) 14 14 449 (6,9) -8 Sources: Pisa 2003 dataset. PIRLS 2001 dataset. 95% confidence intervals in brackets.
The relevant countries which participated in both PIRLS 2001 and PISA 2003 are the Czech Republic, France, Germany, Greece, Hungary, Italy, Latvia, the Netherlands, Sweden, Turkey, Norway, Iceland, HK China, and the USA (a total of 14 countries). Table 4.4 below displays the differences in mean achievement scores for the countries covered in both surveys. 9 PISA covers students who are aged between 15 years and 3 months and 16 years and 2 months at the time of the assessment, regardless the grade or type of institution in which they are enrolled and of whether they are in full-time or part-time education.

______________________________________________
Overall Performance 47
The absolute mean achievement levels are not comparable between the surveys. This is also illustrated by the fact that PIRLS scores are higher on average than PISA reading scores. As mentioned previously, PISA and PIRLS do not measure identical phenomena via identical methods. For this reason, comparisons should be made only very cautiously. However, comparisons are still feasible, given that both surveys at-tempt to measure broadly defined reading skills. Against this background, PIRLS would seem to support the finding from PISA that pupils in Sweden and the Netherlands perform relatively well in reading, and similarly that students from Greece and Turkey perform relatively poorly. As regards the results of Hong Kong China, Norway, and France, the data from PIRLS would seem to suggest that pupils from these countries make greater ad-vances in reading than other countries in the period from the 4th grade (the measuring point of time of PIRLS) to the age of 15 (the measuring point of time of PISA). The Development in Mean Scores The aim of the ongoing PISA, TIMSS, and PIRLS surveys is not only to meas-ure the relative performance of each country. It is also to provide longitudinal data in order measure developments in performances. Box 4.3 Interpreting Differences in PISA Achievement Scores What is meant by a difference of, for instance, 50 points between the scores of two different groups of students? In reading, a difference of 73 points on the PISA scale represents one proficiency level. A difference of one proficiency level can be consid-ered a comparatively large difference in student performance in substantive terms. Students proficient at Level 3 (481 to 552 points) are capable of moderately complex reading tasks, such as locating multiple pieces of information, drawing links between different parts of the text, and relating the text to familiar everyday knowledge. Stu-dents proficient at Level 2 (408 to 480 points) are capable of basic reading tasks, such as locating straightforward information, making low-level inferences of various types, deciding what a well-defined part of the text means and using some outside knowledge to understand it. Whereas table 4.1 displayed the mean achievement scores of the countries in the PISA 2003 survey, the table below shows the development in average achieve-ment scores from 2000 to 2003. Too far-reaching conclusions on this basis of measurements in only two points in time should be avoided. Only when further measurements are carried out at different points of time will it be possible to determine whether developments are part of a systematic tendency rather than a one-time fluctuation.

______________________________________________
Overall Performance 48
The table shows that in particular Latvia and Poland, but also Belgium and Ger-many, have experienced significant improvements in the average achievement scores. For Latvia and Poland, improvements have taken place across all three domains. Portugal, the Czech Republic, and Finland, have also witnessed mod-erate overall improvements combined with minor setbacks in one or more do-mains. Several of these differences are not statistically significant, however. Table 4.5: Difference in Mean Achievement Score in Reading, Mathematical, and Science Literacy, 2000-2003 Country Aggregate
difference Reading, difference
Math, difference10
Science, difference
Latvia 96 33 34 29 EU average 62 -2 30 33 Poland 53 18 20 15 Belgium 41 0 28 13 Germany 36 7 14 15 Portugal 26 7 10 9 Czech Republic 26 -3 17 12 Finland 13 -3 6 10 Italy 12 -11 15 8 Hungary 10 2 1 7 France 9 -9 7 11 Korea 9 9 14 -14 Greece 5 -2 -13 20 Hong Kong China -2 -15 15 -2 United States -6 -9 11 -8 Spain -13 -12 3 -4 Ireland -18 -12 2 -8 Denmark -25 -5 -14 -6 Sweden -25 -2 -12 -6 Norway -29 -5 -7 -16 Iceland -31 -15 -15 -1 Austria -39 -16 5 -28 Japan -38 -24 -12 -2 Source: PISA 2000 and 2003 datasets. Only countries where there are valid and comparable data from both 2000 and 2003 have been included. Bold: Differences are statistically significant11. The table also illustrates that although students from HK China, Sweden, and Japan still perform very well on average compared to those from other countries, they have experienced setbacks in several connections. Along with Iceland and Austria, Japan has witnessed a considerable and statistically significant worsen-ing in the average reading performance. Norway and Austria have seen a statisti-cally significant decrease in the average science performance of students. 10 Mathematics was the subject of major development work from PISA 2000 to PISA 2003, and the PISA 2003 mathematics assessment was more comprehensive than the PISA 2000 mathematics assessment – the PISA 2000 assessment covered two of the four areas of mathematics that are covered in 2003. For this reason, the figures in the table concern only developments from 2000 to 2003 in one of the four content areas: The space and shape scale. This scale is comparable from 2000 to 2003. 11 A standardized difference has been calculated for each country. This standardized difference consists of the difference in mean score between 2000 and 2003 divided by the standard error of this difference. If the stan-dardized difference falls outside the interval [-1.96; 1.96] the difference from one year to another is significant at the 95 per cent confidence level.
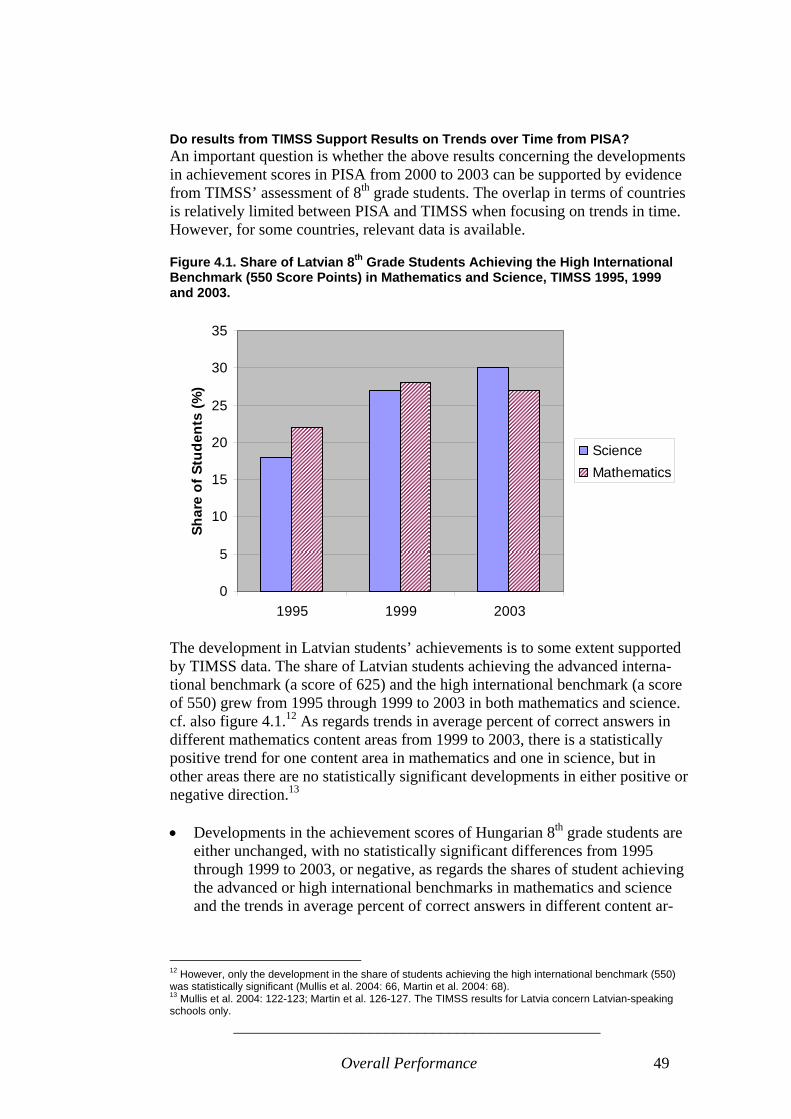
______________________________________________
Overall Performance 49
Do results from TIMSS Support Results on Trends over Time from PISA? An important question is whether the above results concerning the developments in achievement scores in PISA from 2000 to 2003 can be supported by evidence from TIMSS’ assessment of 8th grade students. The overlap in terms of countries is relatively limited between PISA and TIMSS when focusing on trends in time. However, for some countries, relevant data is available.
Figure 4.1. Share of Latvian 8th Grade Students Achieving the High International Benchmark (550 Score Points) in Mathematics and Science, TIMSS 1995, 1999 and 2003.
0
5
10
15
20
25
30
35
1995 1999 2003
Shar
e of
Stu
dent
s (%
)
ScienceMathematics
The development in Latvian students’ achievements is to some extent supported by TIMSS data. The share of Latvian students achieving the advanced interna-tional benchmark (a score of 625) and the high international benchmark (a score of 550) grew from 1995 through 1999 to 2003 in both mathematics and science. cf. also figure 4.1.12 As regards trends in average percent of correct answers in different mathematics content areas from 1999 to 2003, there is a statistically positive trend for one content area in mathematics and one in science, but in other areas there are no statistically significant developments in either positive or negative direction.13 • Developments in the achievement scores of Hungarian 8th grade students are
either unchanged, with no statistically significant differences from 1995 through 1999 to 2003, or negative, as regards the shares of student achieving the advanced or high international benchmarks in mathematics and science and the trends in average percent of correct answers in different content ar-
12 However, only the development in the share of students achieving the high international benchmark (550) was statistically significant (Mullis et al. 2004: 66, Martin et al. 2004: 68). 13 Mullis et al. 2004: 122-123; Martin et al. 126-127. The TIMSS results for Latvia concern Latvian-speaking schools only.

______________________________________________
Overall Performance 50
eas (Mullis et al. 2004: 68, 122-123; Martin et al. 2004: 126-127). These re-sults are largely compatible with the trend in the PISA data for Hungary.
Box 4.4 Development and Policy Reform: Latvia and Poland Measured in terms of the development in average achievement scores from 2000 to 2003, two countries stand out: Latvia and Poland. In both countries, there has been a notable increase in the achievement scores of 15-year old pupils. While it is not possible to establish firm causal relationships, education in Latvia and Poland has undergone important changes during the past years. Most changes oc-curred in the late 1990s, and it is plausible that results in terms of improved student achievement would emerge a number of years after reforms had been decided. In Latvia, comprehensive reform in the Education Law of 1998 included a transition to a program-of-study approach in general education; mandatory school attendance until the completion of the basic program or until the student turns 18; and financial reforms in education based on enrolment. The National Standard of Basic Education was also developed and approved in 1998, determining the compulsory content / curriculum and the content of the final national examinations of the basic education. The Special Edu-cation Concept was also developed in 1998. The main goal of this program was the gradual integration of special needs children into general education schools. In Poland, the reform of primary and secondary education adopted in September 1999 was primarily aimed at raising the overall attainment level. The most conspicuous change is a change in structure from eight years of primary school to six years of pri-mary school and three years of gymnasium. The education reform also includes a new syllabus and curriculum, new teaching methods, improved assessment and evaluation, and teacher development. In January 1999, an amendment to the teachers' charter was adopted, introducing a new career system in which promotion depends on obtain-ing higher qualifications, and aiming to solve the significant problem of unequal salaries among teaching staff in order to attract competent, dedicated teachers. Sources: Mazura 1999;, MEN 1999; Hoopengardner 1999; Levitas and Herczynski, 2001. For more details see Annex 3. • There are few statistically significant developments in the performance of
Italian students in TIMSS for mathematics and science from 2000 to 2003, measured as the share of 8th grade students who achieve the advanced inter-national (625 points) and the high international benchmark (550 points) and as trends in the percentage of correct answers in different content areas. The only statistically significant development is that there is a negative trend in the share of Italian students from 1999 to 2003 in the share of 8th grade stu-dents who achieve the advanced international benchmark in science. These results tend to give a slightly more negative picture of developments in Italy than the PISA results, at least for mathematics.
• Developments from 1995 to 2003 in the achievements of Norwegian 8th grade students are negative in both science and mathematics, measured as the share of students achieving the advanced international benchmark and the high international benchmark (Mullis et al. 2004: 66-67; Martin et al.
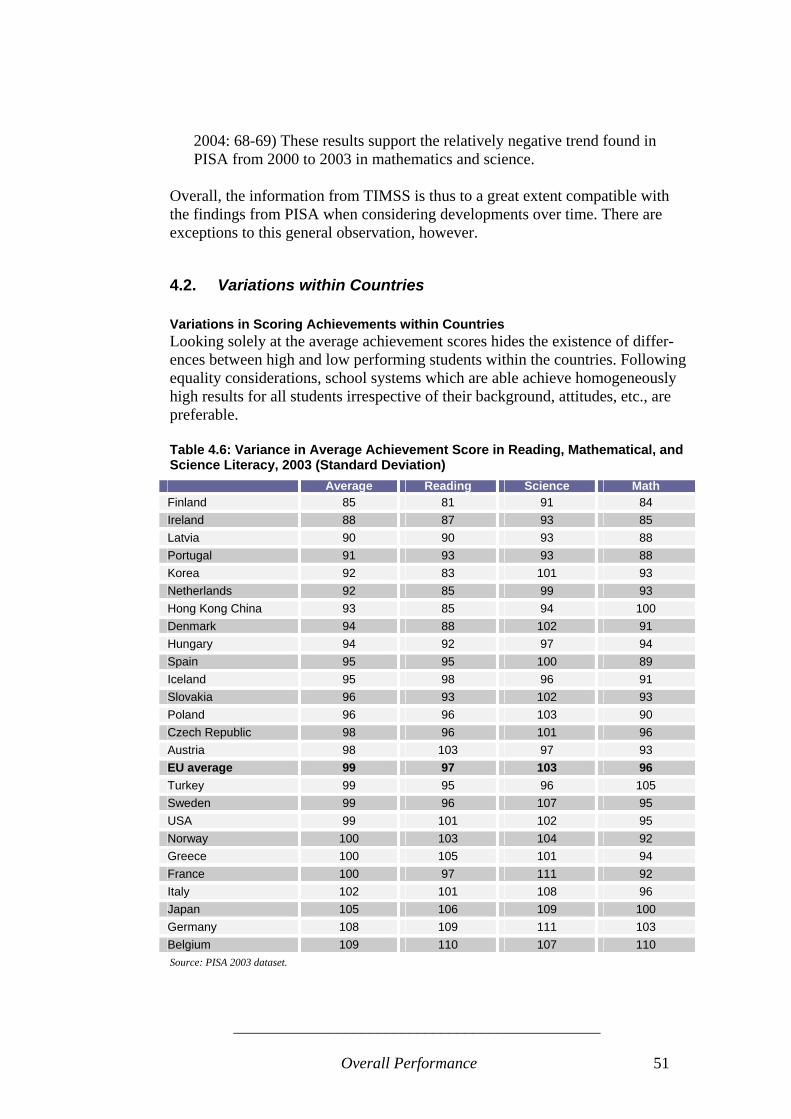
______________________________________________
Overall Performance 51
2004: 68-69) These results support the relatively negative trend found in PISA from 2000 to 2003 in mathematics and science.
Overall, the information from TIMSS is thus to a great extent compatible with the findings from PISA when considering developments over time. There are exceptions to this general observation, however.
4.2. Variations within Countries Variations in Scoring Achievements within Countries Looking solely at the average achievement scores hides the existence of differ-ences between high and low performing students within the countries. Following equality considerations, school systems which are able achieve homogeneously high results for all students irrespective of their background, attitudes, etc., are preferable. Table 4.6: Variance in Average Achievement Score in Reading, Mathematical, and Science Literacy, 2003 (Standard Deviation) Average Reading Science Math Finland 85 81 91 84 Ireland 88 87 93 85 Latvia 90 90 93 88 Portugal 91 93 93 88 Korea 92 83 101 93 Netherlands 92 85 99 93 Hong Kong China 93 85 94 100 Denmark 94 88 102 91 Hungary 94 92 97 94 Spain 95 95 100 89 Iceland 95 98 96 91 Slovakia 96 93 102 93 Poland 96 96 103 90 Czech Republic 98 96 101 96 Austria 98 103 97 93 EU average 99 97 103 96 Turkey 99 95 96 105 Sweden 99 96 107 95 USA 99 101 102 95 Norway 100 103 104 92 Greece 100 105 101 94 France 100 97 111 92 Italy 102 101 108 96 Japan 105 106 109 100 Germany 108 109 111 103 Belgium 109 110 107 110 Source: PISA 2003 dataset.

______________________________________________
Overall Performance 52
Table 4.6 displays the variances (standard deviations) of the participating coun-tries’ mean scores in PISA 2003. The standard deviation is a relevant measure of the degree to which student performances differ from the average performance within the respective countries. In the table the countries are ranked according to the mean standard deviation in reading, math, and science literacy achievement scores.
Figure 4.2. The Relation between Average Reading Score and the Standard Devia-tion in Reading at the Level of Countries (N=26)
420
440
460
480
500
520
540
560
75 85 95 105 115
SD Reading
Rea
ding
Sco
re
Source: PISA 2003 dataset. The three best performing countries as regards the average achievement scores across skills domains – Finland, Korea, and Hong Kong China - are among the seven countries with the lowest average standard deviation. Among the ten best performing countries with respect to the mean achievement scores, five countries – Finland, Ireland, Korea, the Netherlands, and Hong Kong China – combine high average achievement scores with a relatively low standard deviation. Higher degrees of standard deviation are found in Italy, Japan, Germany, and Belgium. Again, Finland shows outstanding results combining the highest mean achievement score in each domain with the lowest standard deviation. The table further illustrates that countries with high degree of variance in achie-vement scores in one domain also tend to have high degrees of variance in scores as regards the other domains. Again, this fact calls for broader structural explanations at for example school system level, in contrast to explanations linked to the individual domains. In one of the three domains, there is a relationship between the mean achieve-ment scores and the standard deviation of this score. This is in the domain of

______________________________________________
Overall Performance 53
reading: The higher the standard deviation, the lower the mean reading achieve-ment score (R2=0,17). Can Educational Structures Explain Variance Within Countries? An interesting question is whether educational structures can explain differences in the variance of student performance around the country average. Theoretical-ly, tracking systems, where children are divided into different educational tracks at a relatively early age, for instance following 5 or 6 years of primary school-ing, could result in a higher variance as it could be expected to divide the popu-lation of students into relatively high-performing and relatively low-performing groups of students, both of these groups deviating in their performance from the average. This could be expected to be the case where tracking systems can be assumed to result in different conditions of teaching and learning at the different tracks, tracking levels for the academically less well-performing pupils being associated with less efficient modes of teaching and learning. Figure 4.3 illustrates the results of an analysis which compares the standard de-viations of countries with tracking systems to the standard deviations of coun-tries with comprehensive school systems, focusing on reading achievement scores in PISA 2003. A tracking system is defined as a system where pupils are placed in different educational tracks at the age of 12 or earlier. A comprehen-sive system is defined as a system where there is no separation of children into separate tracks before after the age of 12 – typically as pupils enter upper secon-dary school.
Figure 4.3. Average Standard Deviations Around Countries’ Average Reading Score, PISA 2003 – Tracking vs. Comprehensive Systems
88,0
90,0
92,0
94,0
96,0
98,0
100,0
102,0
104,0
ComprehensiveSystem
Tracking System
Avg
. SD
Average SD 1Average SD 2
According to these criteria, Germany, Belgium (Flemish and French speaking communities), Austria, the Netherlands, the Czech Republic and Slovakia qual-

______________________________________________
Overall Performance 54
ify as tracking systems, whereas all the other remaining countries in table 4.6 represent different variants of comprehensive school structures.14 Figure 4.3 illustrates that the average standard deviation is somewhat higher in tracking systems than in comprehensive systems (SD1): The average standard deviation around the mean is almost 100 in tracking systems as opposed to about 94 in comprehensive systems (figures for Average Standard Deviation 1). It can be discussed whether the education system in the Netherlands represents as tracking system. At the age of 12, pupils are placed in one of three types of secondary education (VMBO, HAVO and VWO). Moreover, in 1999/2000 the VMBO was introduced as a new track to replace VMBO and HAVO, containing four different learning pathways. However, most schools are combined schools offering several types of secondary education so that pupils can transfer easily from one to another. If the Netherlands is not included among the countries with a tracking system, the differences between the average standard deviations of comprehensive sys-tems and tracking systems become larger (SD2): The average standard deviation of the reading scores of Belgium, Austria, and Germany is more than 102, as opposed to an average standard deviation of less than 94 for the remaining coun-tries including the Netherlands. This statistical relation cannot be taken as an explanation – we cannot claim that the educational structure causes differences in variance between students. Other factors may explain the statistical relation. However, the relation found is com-patible with a hypothesis that tracking systems lead to greater variances in stu-dent performances. Development in Variation 2000 to 2003 Looking at the development in the standard deviation from 2000 – 2003, it is clear that particularly Latvia and to some degree Poland have experienced de-creasing standard deviations. Portugal also witnessed a decrease in standard deviation in particular in mathe-matics (space and shape scale). Austria, Italy, Iceland, Korea, and Japan, on the other hand, have witnessed increased standard deviation. Consequently, Japan was among the countries with the highest standard deviation in 2003. As regards the other countries, the standard deviation is more or less unchanged from 2000 to 2003.
14 Source: Eurydice: Eurybase 2005, Riley et al 1998, Riley et al. 1999, MOE 2004, Murad 2004. OECD 2004c (261) uses a different definition of tracking vs. comprehensive systems in the analysis of PISA 2003 data (the number of school types or educational programmes available for 15 year olds), for which reason more coun-tries are categorised as non-comprehensive systems.

______________________________________________
Overall Performance 55
Table 4.7: Development in Standard Deviation 2000 – 2003, PISA 2003 Survey. Average Reading Science Math
Latvia -11 -12 -5 -16 Poland -5 -4 5 -16 Portugal -4 -4 4 -13 Ireland -3 -7 1 -2 Finland -3 -8 5 -5 EU average -1 -2 -3 1 United States -1 -4 1 1 Greece 1 8 4 -9 Czech Republic 1 0 7 -4 Hungary 1 -2 -6 10 Denmark 1 -10 -1 15 Norway 2 -2 8 -1 Belgium 2 3 -4 7 Germany 2 -2 9 -1 Sweden 4 4 14 -6 Spain 4 10 5 -4 HK China 5 1 9 4 France 7 5 9 6 Austria 7 10 6 6 Italy 8 10 10 3 Iceland 8 6 8 11 Korea 11 13 20 0 Japan 13 20 19 1
Source: PISA 2003 dataset. Bold: Differences are statistically significant. Note: The figures for mathematics concern the mathematics space and shape scale.
Developments in the standard deviation in Latvia and Poland may again high-light the significance of education reform in these countries. Thus, the decrease in standard deviation in the two countries is to a great extent explained by the fact that there have been improvements in the average achievement scores among the lower performing students. This corresponds well with the overall objectives of education reform. Variance in Student Performance Between and Within Schools Variance around the mean at the country level is one important feature of student achievement scores. Other important factors to consider are variance in student performance between schools and within schools. Differences in country profiles as regards the character and distribution of vari-ance may reflect the ways in which education systems seek to cater for the needs of a diverse student body and narrow the gaps in student performance: Some countries have comprehensive school systems with no or only limited institu-tional differentiation. Other countries respond to diversity in student back-grounds and capabilities by grouping students through tracking or streaming, whether between schools or between classes within schools.

______________________________________________
Overall Performance 56
Table 4.8 contains information on several different aspects of the variance in student performance in the included countries, focusing on the mathematics scale. In the third column, total variance in student performance (SP) is ex-pressed as a percentage of the average variance in student performance in the OECD countries. For each country, a distinction is made between the variance attributable to differences in student results attained by students in different schools (the first column, between-school differences) and that attributable to the range of student results within schools (the second column, within-school differ-ences).
Table 4.8: Variance Between and Within Schools, Mathematics Scale, PISA 2003. Total variance in
SP between schools
Total variance in SP within schools
Total variance in Student Per-
formance
Mean Mathemat-ics
Score Iceland 3,6 90,9 94,5 515 Finland 3,9 77,3 81,2 544 Norway 6,5 91,7 98,1 495 Sweden 10,9 92,8 103,3 509 Poland 12,0 83,1 94,7 490 Denmark 13,1 84,2 96,5 514 Ireland 13,4 71,2 83,9 503 Spain 17,2 70,2 90,8 485 Latvia 20,6 71,0 90,2 483 United States 27,1 78,3 104,9 483 Portugal 30,3 60,0 89,0 466 Luxembourg 31,2 67,6 98,1 493 Greece 38,9 68,1 101,8 445 Slovakia 41,5 58,0 98,7 498 Korea 42,0 58,2 99,3 542 Czech Republic 50,5 55,2 99,9 516 HK China 52,8 60,4 115,7 550 Netherlands 54,5 39,5 91,9 538 Austria 55,5 49,5 98,4 506 Germany 56,4 52,6 108,3 503 Italy 56,8 52,0 106,5 466 Belgium 56,9 66,7 121,8 529 Japan 62,1 55,0 116,3 534 Hungary 66,0 47,3 101,5 490 Turkey 68,7 56,5 127,4 423
Source: PISA 2003 dataset and OECD 2004c. Total variance in student performance is expressed as a percentage of the average variance in student performance across OECD countries. The sum of the between- and within-school variance components, as an estimate from a sample, does not necessarily add up to the total.
The table shows considerable differences between countries. This is the case both as regards the total variance in student performance and as regards the dis-tribution of variance in student performance between schools and within schools. As for total variance in student performance, expressed as a percentage of the OECD average, it varies between a low of 81,2 percent for Finland and a high of
______________________________________________
Overall Performance 57
127,4 for Turkey. As for between-school variance in student performance, dif-ferences between countries are even larger, ranging from a low in Iceland and Finland of less than 4 per cent to a high in Japan, Hungary, and Turkey of more than 60 per cent. Box 4.5 The Principle of Equity in the Nordic Education Systems It is characteristic of the Nordic education systems that they rest on a long-standing principle of equity. Providing all students with equal access to education and removing obstacles to learning, especially among students from a disadvantaged background, have been leading objectives in Nordic education policy. The Nordic strategy for build-ing up both high quality and equality in education has been based on constructing a publicly funded comprehensive school system without selecting, tracking, or streaming students during basic education until the age of 16. Part of the strategy is to spread the school network so that pupils have a school near their homes whenever possible. In-clusion of special education and instructional efforts to minimize low achievement are also typical to Nordic educational systems. Sources: Lie et al. 2003, Husén 1974. As a general rule, countries with relatively low between-school variance in stu-dent performance are also countries with a below average total variance in stu-dent performance. This is the case for all the 9 countries with the lowest be-tween-school variance, except Sweden. For seven countries (Iceland, Finland, Norway, Sweden, Poland, Denmark, and Ireland) it is the case that between-school variance makes up less than one-fifth of within-school variance. It is notable that several countries with above average mean mathematics scores are also countries with low between-school variance in student performance. Among the countries included in the table, this is the case for four Nordic coun-tries: Iceland, Finland, Sweden, and Denmark. On the other hand, there are also top performing countries in terms of the mean mathematics score where be-tween-school variance is relatively high. This is the case, for instance, for Japan and Belgium, and also for the Netherlands and Hong Kong China. It cannot be concluded, therefore, that low between-school variance in student performance - obtained for instance via the Nordic strategy of a publicly funded comprehensive school system without streaming or tracking, supported by spe-cial education efforts to minimize low achievements - is strongly associated with high mean achievement scores. Several countries where between-school vari-ance is relatively high perform very well with respect to the average achieve-ment score. What can be concluded, however, is that there is no necessary conflict between an objective of equity and an objective of quality: Educational policies for secur-ing similar student performance among schools do not impede the objective of high average performance. As the Nordic countries, and Finland in particular,

______________________________________________
Overall Performance 58
demonstrate, high quality can be achieved without neglecting a concern for equality in educational opportunity. Box 4.6 The Netherlands: Quality in Diversity The case of the Netherlands illustrates that the Nordic strategy of a system of public comprehensive schools focusing on equity in educational opportunities is not the only way to achieve high quality in education outcomes. The Dutch education system is characterized by the statutory equality of public and private schools. The Constitution guarantees the freedom to found schools (freedom of establishment), to organize the teaching in schools (freedom of organization of teach-ing), and to determine the principles on which they are based (freedom of conviction). People have the right to found schools and to provide teaching based on religious, ideological, or educational beliefs. As a result, there are both publicly run and privately run schools in the Netherlands, and some 70 per cent of pupils attend privately run schools. The freedom to organize teaching means that private schools are free to determine what is taught and how. This freedom is, however, limited by the qualitative standards set by the Ministry of Education, Culture and Science in educational legislation. These standards, which apply to both public and private education, prescribe the subjects to be studied, the attainment targets or examination syllabuses and the content of na-tional examinations, the number of teaching periods per year, the qualifications which teachers are required to have, parent and pupil influence on school matters, planning and reporting obligations, and so on. The Constitution places public and private schools on an equal financial footing. This means that government expenditure on public education must be matched by spending on private education. Source: Eurydice, PISA 2003 dataset.
Tracking Systems and Between-School Variance It could be expected that variance between schools would be larger in educa-tional systems with early tracking of students than in comprehensive school sys-tems. This could be the case to the extent that tracking systems entail a concen-tration of students with similar performance scores in specific schools.. Figure 4.4 illustrates that this relation can be found. The average between-school variance is larger (almost 56) in countries with a tracking system (Austria, Bel-gium (Flemish and French communities), the Czech Republic, Germany, Slova-kia, and the Netherlands) than in countries with a comprehensive school system (average between-school variance almost 32).15
15 The distinction between tracking and non-tracking system is based on information in Eurydice (2005), cf. footnote 14 above.

______________________________________________
Overall Performance 59
Figure 4.4. Average Variance in Student Performance Between Schools, Compre-hensive School Systems and Tracking Systems, PISA 2003 Mathematics Scale.
0
10
20
30
40
50
60
Comprehensive systems Tracking systems
Avg.
Var
ianc
e in
SP
However, considering the figures in table 4.8, it is clear that there are also a number of countries which formally operate comprehensive school systems, but where between school variance is relatively large. This is the case for Turkey, Hungary, Japan, and Italy. A hypothesis that can be formulated against this background is that a comprehensive school system constitutes a necessary but not a sufficient condition for low between-school variance in student perform-ance. This hypothesis is consistent with data. Low-Achieving Groups of Students How do countries compare with respect to the performance of the weakest stu-dents? The tables below contain information on this. Table 4.9 describes the share of low-performing students according to the PISA reading levels (level 1 and lower). The first column contains the share of students performing below level 1, scoring up to 335 score points. The second column displays the share of students scoring at level 1, i.e. achieving between 335 and 407 score points. The final column is the combined share of students scoring at level 1 and lower, i.e. achieving below 407 score points. There is a high correlation between the mean achievement scores and the share of students achieving low score levels in reading (R2=0,93). Among the five countries where the share of low scoring students is the lowest (Finland, Korea, Ireland, the Netherlands, and Hong Kong China), the four are in the top-five list as regards the average achievement scores in reading. The only top-five country as regards the share of low-performing students in reading which is not at the same time in top-five as regards the average achievement score in reading is Hong Kong China, and this country ranks 6th in reading in the PISA 2003 data-set. Countries with a relatively large share of low-performing students in reading show a similar pattern. Among the four countries whose students achieve the lowest average scores in reading, three are also among the four countries with
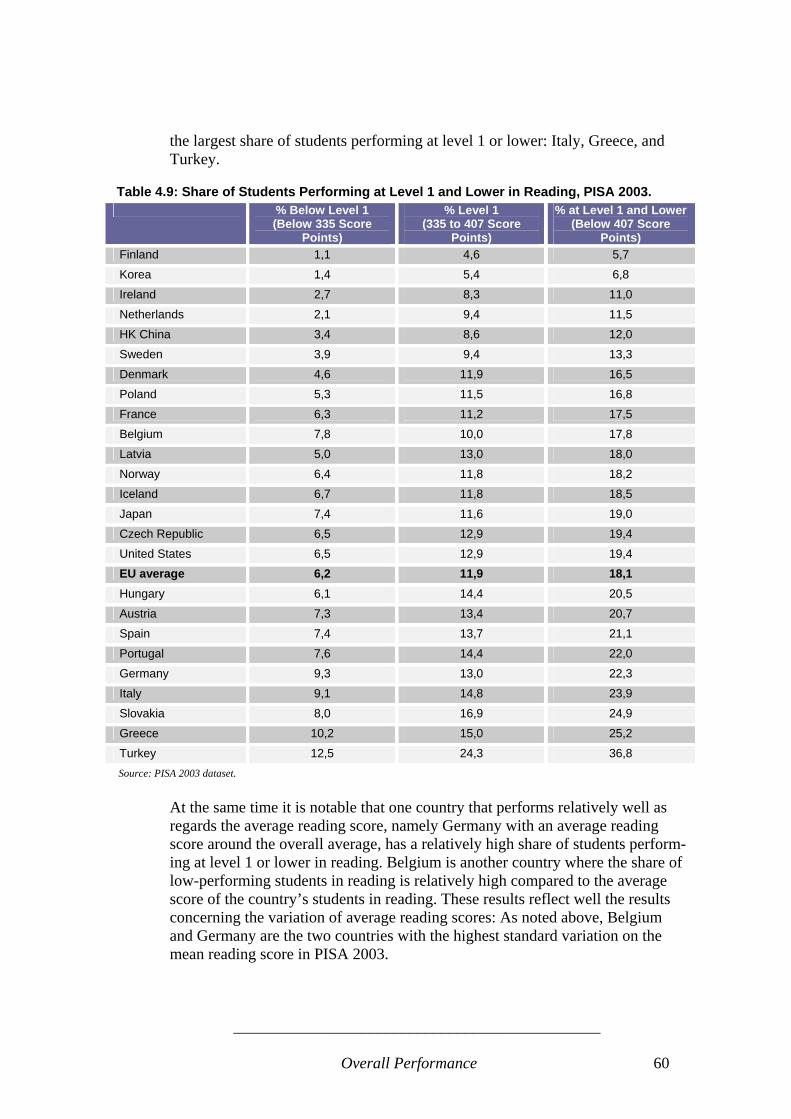
______________________________________________
Overall Performance 60
the largest share of students performing at level 1 or lower: Italy, Greece, and Turkey.
Table 4.9: Share of Students Performing at Level 1 and Lower in Reading, PISA 2003. % Below Level 1
(Below 335 Score Points)
% Level 1 (335 to 407 Score
Points)
% at Level 1 and Lower (Below 407 Score
Points) Finland 1,1 4,6 5,7
Korea 1,4 5,4 6,8
Ireland 2,7 8,3 11,0
Netherlands 2,1 9,4 11,5
HK China 3,4 8,6 12,0
Sweden 3,9 9,4 13,3
Denmark 4,6 11,9 16,5
Poland 5,3 11,5 16,8
France 6,3 11,2 17,5
Belgium 7,8 10,0 17,8
Latvia 5,0 13,0 18,0
Norway 6,4 11,8 18,2
Iceland 6,7 11,8 18,5
Japan 7,4 11,6 19,0
Czech Republic 6,5 12,9 19,4
United States 6,5 12,9 19,4 EU average 6,2 11,9 18,1 Hungary 6,1 14,4 20,5
Austria 7,3 13,4 20,7
Spain 7,4 13,7 21,1
Portugal 7,6 14,4 22,0
Germany 9,3 13,0 22,3
Italy 9,1 14,8 23,9
Slovakia 8,0 16,9 24,9
Greece 10,2 15,0 25,2
Turkey 12,5 24,3 36,8 Source: PISA 2003 dataset.
At the same time it is notable that one country that performs relatively well as regards the average reading score, namely Germany with an average reading score around the overall average, has a relatively high share of students perform-ing at level 1 or lower in reading. Belgium is another country where the share of low-performing students in reading is relatively high compared to the average score of the country’s students in reading. These results reflect well the results concerning the variation of average reading scores: As noted above, Belgium and Germany are the two countries with the highest standard variation on the mean reading score in PISA 2003.

______________________________________________
Overall Performance 61
Table 4.10: Development in Shares of Students Performing at Level 1 and Lower in Reading, PISA 2000-2003. Development in Percentage Points. Trend Below Level 1
(Below 335 Score Points) Trend Level 1
(335 to 407 Score Points)
Latvia -7,7 -4,9 Poland -3,4 -3,1 Portugal -2 -2,3
Hungary -0,8 -1,4
Belgium 0,1 -1,3
Greece 1,5 -0,7
Finland -0,6 -0,6
Denmark -1,3 -0,1
Sweden 0,6 0,1
France 2,1 0,2
Germany -0,6 0,3
Ireland -0,4 0,4
Korea 0,5 0,6
Norway 0,1 0,6
Iceland 2,7 1,3
Italy 3,7 1,3
United States 0,1 1,4
Czech Republic 0,4 1,5
Spain 3,3 1,5
HK China 0,8 2,1 Austria 2,9 3,2 Japan 4,7 4,3
Source: PISA 2003 and 2000 datasets. Bold: Differences are statistically significant, cf. footnote 11. The development from 2000 to 2003 in the share of lowest performing students in reading can be calculated. The results are displayed in the table below. There are statistically significant developments in a positive direction for Latvia and Poland. In these two countries, the share of students performing at level 1 or lower has decreased significantly from 2000 to 2003. As regards developments in the opposite direction, the period from 2000 to 2003 has witnessed an increase in the relatively poorly performing students in Austria and Japan. For the other countries there are very few statistically significant results. Another way of looking at developments from 2000 to 2003 among the lowest performing groups of students is to look at the average achievement scores in the different percentiles of the total sample of students. This is done in table 4.11, where we focus on the lowest 5th percentile of stu-dents and the development in the average score of these students across the skills domains from 2000 to 2003. Including a focus on a broader range of the weakest performing students, for instance the percentile comprising students with a per-formance which places them among the 85 – 95 per cent poorest performing
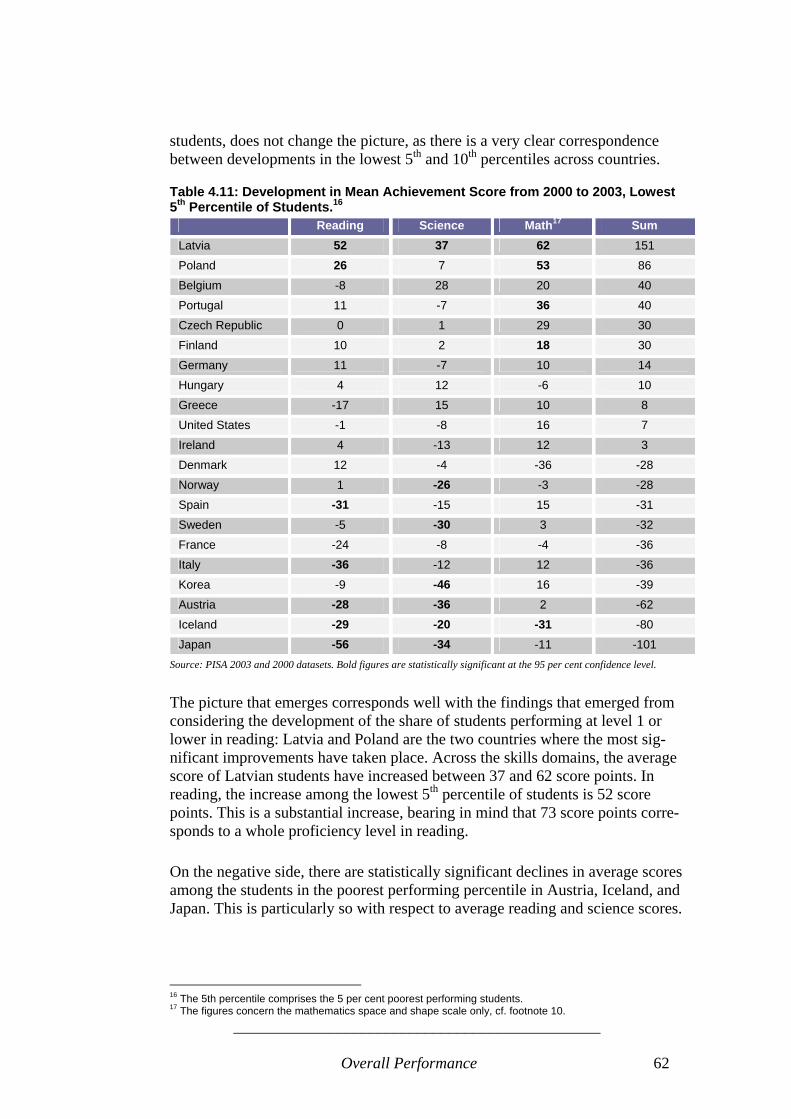
______________________________________________
Overall Performance 62
students, does not change the picture, as there is a very clear correspondence between developments in the lowest 5th and 10th percentiles across countries.
Table 4.11: Development in Mean Achievement Score from 2000 to 2003, Lowest 5th Percentile of Students.16
Reading Science Math17 Sum Latvia 52 37 62 151
Poland 26 7 53 86
Belgium -8 28 20 40
Portugal 11 -7 36 40
Czech Republic 0 1 29 30
Finland 10 2 18 30
Germany 11 -7 10 14
Hungary 4 12 -6 10
Greece -17 15 10 8
United States -1 -8 16 7
Ireland 4 -13 12 3
Denmark 12 -4 -36 -28
Norway 1 -26 -3 -28
Spain -31 -15 15 -31
Sweden -5 -30 3 -32
France -24 -8 -4 -36
Italy -36 -12 12 -36
Korea -9 -46 16 -39
Austria -28 -36 2 -62
Iceland -29 -20 -31 -80
Japan -56 -34 -11 -101 Source: PISA 2003 and 2000 datasets. Bold figures are statistically significant at the 95 per cent confidence level. The picture that emerges corresponds well with the findings that emerged from considering the development of the share of students performing at level 1 or lower in reading: Latvia and Poland are the two countries where the most sig-nificant improvements have taken place. Across the skills domains, the average score of Latvian students have increased between 37 and 62 score points. In reading, the increase among the lowest 5th percentile of students is 52 score points. This is a substantial increase, bearing in mind that 73 score points corre-sponds to a whole proficiency level in reading. On the negative side, there are statistically significant declines in average scores among the students in the poorest performing percentile in Austria, Iceland, and Japan. This is particularly so with respect to average reading and science scores.
16 The 5th percentile comprises the 5 per cent poorest performing students. 17 The figures concern the mathematics space and shape scale only, cf. footnote 10.

______________________________________________
Overall Performance 63
4.3. Economic Resources and PISA Achievement Scores To what extent do the average achievement scores in reading, science, and mathematics, reflect the economic resources of the countries participating in international surveys like PISA, TIMSS, and PIRLS? This is the question which is addressed in this section. A positive relation between wealth and educational outcomes is to be expected. Thus, relative prosperity of countries allows these countries to spend more on education, while other countries find themselves constrained by relatively lower national income. Good educational outcomes may also, in turn, be expected to impact positively on economic growth and hence – in the longer run – on wealth.18
Figure 4.5. The Relation Between Countries’ Mean Science Score and 2002 GDP per Capita, USD in Purchasing Power Parities (N=22), R2=0,04.
460
470
480
490
500
510
520
530
540
550
560
5000 15000 25000 35000GDP per capita
Mea
n sc
ienc
e sc
ore
Source: 2003 PISA dataset, OECD 2004a. Based on analysis of the relation between year 2002 GDP per capita (in purchas-ing power parities) and performance in the PISA 2003 survey for 28 countries including Mexico and Turkey, the OECD (OECD 2004c: 99-100) reports a posi-tive correlation between per capita GDP and average mathematics performance on country level (R2=0,28).
18 In a review of research on the growth effects of human capital investment, Fuente and Ciccone (2002:) conclude that in a typical OECD-country, human capital accounted for 22 per cent of observed productivity growth 1960-1990. Roughly two-thirds of this figure reflected the direct of immediate impact of schooling on the level of productivity, and the remaining third captures its contribution to technological progress.

______________________________________________
Overall Performance 64
Analysing 24 countries including Mexico and Turkey, a positive correlation can also be found as regards the relation between 2002 GDP per capita and the aver-age reading score (R2=0,31) and the average science score (R2=0,14). This means that GDP per capita can explain more than 30% of total variation between countries’ mean scores for reading and 14% of total variation between countries’ mean scores for mathematics. These results are, however, quite sensitive; since the number of countries is small, correlations are strongly affected by the characteristics of individual coun-tries. This is illustrated in figure 4.5, based on data from 22 European countries, Turkey not included, plus the United States and Japan.
Figure 4.6. The Relation Between Countries’ Mean Mathematics Score and 2002 GDP per Capita USD in Purchasing Power Parities (N=22), R2=0,21.
400
420
440
460
480
500
520
540
560
5000 15000 25000 35000GDP per capita
Mea
n m
athe
mat
ics
scor
e
Source: 2003 PISA dataset, OECD 2004a. It appears that when only these 22 countries plus USA and Japan are considered, the relationship between GDP per capita and the mean science score in PISA 2003 is virtually non-existent (R2=0,04). When considering the relation between GDP per capita on the one hand and mean achievement scores on the other hand for the same countries in reading and mathematics, a positive relationship re-mains, with the explained variance being 30% for reading and 21% for mathe-matics. The overall conclusion is that there is a tendency for economic prosperity to be related to higher mean achievement scores in PISA, but that in some respects

______________________________________________
Overall Performance 65
this relation is weaker when looking at relatively affluent societies only than when including less prosperous countries such as Turkey and Mexico. Moreover, the relationship is clearly not deterministic. Even if there is a positive relationship between GDP per capita and mean achievement scores, some coun-tries perform better than would be predicted on the basis of their GDP per capita (countries above the trend line in the figures). Similarly, countries below the trend line in the figures below perform worse than would be predicted from their GDP per capita.
Figure 4.7. The Relation Between Countries’ Mean Reading Score and 2002 GDP per Capita, USD in Purchasing Power Parities (N=22), R2=0,30.
460
470
480
490
500
510
520
530
540
550
5000 15000 25000 35000
GDP per capita
Mea
n re
adin
g sc
ore
Source: 2003 PISA dataset, OECD 2004a. Countries performing significantly above the trend line in mathematics include two of the top performers as regards the mean achievement score, Korea and Finland.19 Japan, the Netherlands, Belgium, and the Czech Republic, also per-form clearly above the trend line. Portugal, Italy, and Greece, perform well be-low the trend line.20
19 Korea’s mean achievement score is 44 score points above the values predicted by the trend line. The simi-lar figures for Finland, the Netherlands, Belgium, and the Czech Republic, are 38, 31, 28, 23 and 19. Data from a third top performing country in mathematics, Hong Kong, has not been included. 20 The difference between the mean achievement scores and the values predicted by the trend line is -33, -39 and -54 for Portugal, Greece, and Italy respectively.

______________________________________________
Overall Performance 66
A similar pattern is found as regards reading: The two countries performing most significantly above the trend line are Korea and Finland. These countries are also the two top performing countries as regards the mean achievement score in reading. Among the countries performing most clearly below the trend line, we find Slovakia, Greece, and Italy. The relation between student performance and spending per student can also be calculated, using the cumulative expenditure on educational institutions per stu-dent between the ages of 6 and 15 years as the measure of spending per student. A positive relation can be found. In an analysis covering 22 European countries, Turkey not included, plus Japan and the United States, the variable explains 15 per cent of total between-country variance in mathematics and 17 per cent of the between-country variance in reading (R2=0,15). For the same 24 countries, the relation between spending per student and science score is negative, however (R2=0,15).21 Analysis of data from TIMSS supports this conclusion. Based on TIMSS 1995 data, Wössmann (2003) concludes that the correlation coefficient between ex-penditure per student (adjusted for purchasing power parity) and average TIMSS test scores is a mere 0,13 in the 4th grade and 0,16 in the 8th grade.
4.4. Policy Implications A number of implications for policy and for public policy makers can be ex-tracted from the results presented in the sections above.
Avoid Excessive Focus on Inter-Country Differences - The evidence from PISA, and also from TIMSS and PIRLS, has indicated that pupils from different countries perform differently in the domains of reading, mathematics, and science. This finding has attracted considerable attention in many countries, both in public debate and among policy makers. At the same time, however, it is an important point that the greatest share of variation in per-formance occurs within countries rather than between countries. • To improve the level of basic skills among students, policy makers should
focus their attention on how basic skills performance varies between differ-ent groups of pupils and different schools within each country. The compari-son between countries should not impede this.
Searching intensively for factors which can explain differences in average coun-try achievement scores in basic skills risks focusing on country-level factors which are only of modest importance relative to other factors crucial to indi-viduals’ acquisition of basic skills and thereby to the future ability of individuals
21 Analysing PISA 2000 data, Fuchs and Wössmann (2004a) find a statistically significant positive relation between the cumulative expenditure on educational institutions per student and mathematics performance, a weakly statistically significant relation with science performance, and a statistically insignificant relation with reading performance.
______________________________________________
Overall Performance 67
to be an integral part of society and of the labour market. Factors at the level of schools and individuals are more important that factors at country level. Subsequent chapters in this report will focus attention on factors which allow us to understand the basic skills levels of individuals and specific segments of populations.
- But there are Significant Differences Between Countries A number of points can nevertheless be made as regards the relative perform-ance of students from different countries, for there are differences in the average performances of students across countries. In PISA 2003, the difference among the included countries between the average achievement scores of the best per-forming country and the poorest performing country is more than 100 score points. In reading, this corresponds to significantly more than a whole profi-ciency level. In mathematics, the difference between the average of the top per-forming countries and the poorest performing countries corresponds to about two whole proficiency levels. The TIMSS and PIRLS studies confirm that there are significant differences in the average performance of students across coun-tries in reading and mathematics.
Basic Skills Acquisition Depends on Other Factors than Economic Resources The findings clearly suggest that even if there is a correlation between the wealth of countries and the spending per student on the one hand, and the average achievement scores of countries in international assessments such as PISA on the other hand, the relation is very far from deterministic. Per capita income ex-plains only up to 30 per cent of the total variation of average achievement scores across countries, and often less than this. Other factors thus explain more than 70 per cent of the variance. Spending per student explains between 15 and 17 per cent of total variance between countries as regards the average PISA achieve-ment score in reading and mathematics. However, for science the relation be-tween spending per student and the average achievement score is not even posi-tive. Relatively low wealth cannot, in other words, be used as a general excuse for low average achievement scores at the level of countries, and relative affluence does not necessarily lead to high average achievement scores. The relation be-tween spending per student and the average achievement scores of students is weak. • Economic prosperity and resources devoted to education should only be seen
as one among many factors which influence learning outcomes. The relation between economic resources and learning outcomes is far from determinis-tic, leaving policy makers considerable scope for the improvement of educa-tional systems within the given framework of resources available.
This point is also illustrated by the fact that a number of countries perform sig-nificantly better in terms of the average achievement scores of their students
______________________________________________
Overall Performance 68
than the relation between GDP per capita and achievement scores would predict. Korea and Finland are prominent examples.
Policy Reforms Matter Indeed In this connection it is highly relevant that average achievement scores of coun-tries participating in surveys such as PISA can change over time, and that such change can frequently be associated with reforms of the educational systems of the countries concerned. Statistically significant improvements in the average PISA achievements scores from 2000 to 2003 can be found for Latvia and Po-land across the learning domains – reading, mathematics, and science. Statisti-cally significant improvements can be found in mathematics and science for Belgium and Germany. Focusing on developments in Latvia and Poland, improvements in the average achievements scores of these countries make sense as the result of reforms of the educational systems of these countries. In both countries, the 1990s and early 2000s have been characterized by dramatic changes in the overall education sys-tem as well as in the contents of teaching and learning. In Latvia, reforms have taken place within the framework of a Strategic Programme for education devel-opment. Significant reform elements have included: the adoption of a National Standard of Basic Education, which defines a set of requirements that aim to guarantee high quality basic education, and a centralized system of national ex-aminations; the introduction of a Special Education Concept, which aims to en-sure the gradual integration of children with special needs into general education schools; the transition to a program-of-study approach; and the development and introduction of new curricula and educational materials. In Poland, the structure of primary and secondary education has been fundamen-tally reformed since 1999 with the aim of raising overall attainment levels. In placing greater emphasis on general education than on vocational training, the creation of a new tier of lower secondary education is designed to prepare more children for upper secondary education. The 1999 education reform also in-cluded a new syllabus and new curriculum definitions and placed emphasis on new teaching methods, improved assessment and evaluation, and teacher devel-opment. • The examples of Latvia and Poland illustrate how policy reform can serve to
improve the basic skills achieved by students in the general education sys-tem. Both institutional reforms and reforms aimed to change the form and content of teaching and learning appear important.
• In both Latvia and Poland, changes in the contents of teaching and learning appear important, in combination with the introduction of centralized learn-ing objectives and assessment systems.
• Notably, improvements in the Latvian education system have taken place without a greater share of available economic resources being devoted to education. From 1998 to 2002, public expenditure on education as a percent-age of GDP fell from 6.29 to 5.82, albeit in the context of relatively strong economic growth. In the same period, the share of Polish public expenditure

______________________________________________
Overall Performance 69
devoted to education grew from 5.09 per cent of GDP to 5.6 per cent of GDP, an increase of 10 per cent (Eurostat 2005).
Cross-Domain Factors are Important for Basic Skills Acquisition Reforms of education in Poland and Latvia have been comprehensive, cutting across learning domains. This is a highly justifiable approach, since the PISA data indicates that average performances on the country level are closely corre-lated across skills domains. Thus, in countries where there is a relatively high average performance among the students in one skills domain, the average per-formance in the other skills domains is in general also relatively high. Moreover, countries with a high degree of variance in achievement scores in one domain also tend to have high degrees of variance in achievement scores in other do-mains. • The high correlation of average achievement scores across skills domains
suggests that cross-curricular factors, outside the teaching and learning of the individual domain, affect the mean achievement scores; put differently, the three scales to a great extent measure the same underlying dimension. This means that in the search for ways to improve students’ acquisition of basic skills, policy makers are well advised to focus on factors that are of rele-vance across skills domains.
The correlation between average achievement scores across skills domains is not perfect, however, and there are instances where it would seem reasonable to fo-cus attention on specific skills domains. In the PISA 2003 survey, the average achievement scores of Danish and Norwegian students was, for instance, signifi-cantly lower in science than in reading and mathematics.
- But for Reading, Low Variance is Associated with High Average Scores Even if the correlation between average achievement scores is high between skills domains, a particular feature characterizes the domain of reading: In this domain there is a negative correlation between the standard deviation of each country’s average reading score and the average reading scores: The lower the standard deviation, the higher the average reading score.
- And Top Performing Countries Frequently have Low Variation around the Mean Furthermore, there is a tendency that the countries which achieve the highest average achievement scores are countries where the degree of variation of results around the means is relatively low. The top-three countries in terms of average achievement scores across the three skills domains are among the seven coun-tries with the lowest average standard deviation around the mean. Among the top ten countries in terms of overall average achievement scores, five countries combine a high average achievement score with a relatively low standard devia-tion around the average. • Basic skills acquisition at a high level is not generally related to large differ-
ences within countries in the distribution of basic skills. On the contrary, there is a certain tendency that high average performance in the PISA read-
______________________________________________
Overall Performance 70
ing, mathematics, and science tests, is associated with a relatively high de-gree of equality in the distribution of skills within countries. Focusing on groups with lower skills levels and on reducing skills disparities within the student population would appear to be an efficient strategy for pursuing lev-els of basic skills that are in the high end of the international spectrum.
The cases of Germany and Belgium illustrate, however, that this is not the only option available. The average achievement scores of Germany in PISA 2003 are close to the international average, and those of Belgium are close to (reading and science) or above (mathematics) the international average. Yet the two countries are those with the highest variance (standard deviation) around the average scores.
Reforms can Reduce Variance and Improve Performance at Lowest Levels The cases of Latvia and Poland illustrate that education reform can, indeed, suc-cessfully pursue the strategy of lower inequality. These two countries are not only the countries that have witnessed the largest increase in average PISA achievement scores from 2000 to 2003. They are also the two countries where there has been the largest decrease in variance (standard deviation) around the average scores from 2000 to 2003; where the share of students performing at level 1 or lower in reading has decreased the most from 2000 to 2003; and where the mean achievement score of the lowest 5th percentile of students has increased the most across all three skills domains. Across the skills domains, the average score of the worst performing 5 per cent of the Latvian students has increased between 37 and 62 score points. This is a substantial increase. • Improving the performance of the weakest students through education re-
form is a viable policy option. The case of Latvia illustrates how policy re-forms which introduce clear learning objectives at central level determining a compulsory curriculum as well as the content of the final national examina-tions of basic education, combined with improvements in systems of special education, can yield substantial results. The case of Poland illustrates how an enhanced focus on general education (as opposed to vocational training) and on teaching and curriculum development can generate improvements at the low end of the skills proficiency spectrum.
This point does, however, need to be seen in context: Both Poland and Latvia have been developing their education systems from a starting point which was very different from that of the typical contemporary Western European educa-tion system. Development and changes with results of the type experienced in these two countries may not be possible in other countries where the starting point is very different. Low Between-School Variance does not Conflict with High Average Achievement A final point concerns between-school variance. As noted above, average stu-dent performance at a high level is not in general associated with large differ-ences within countries in the distribution of such skills. On the contrary, top-performing countries frequently have low variation around the mean.
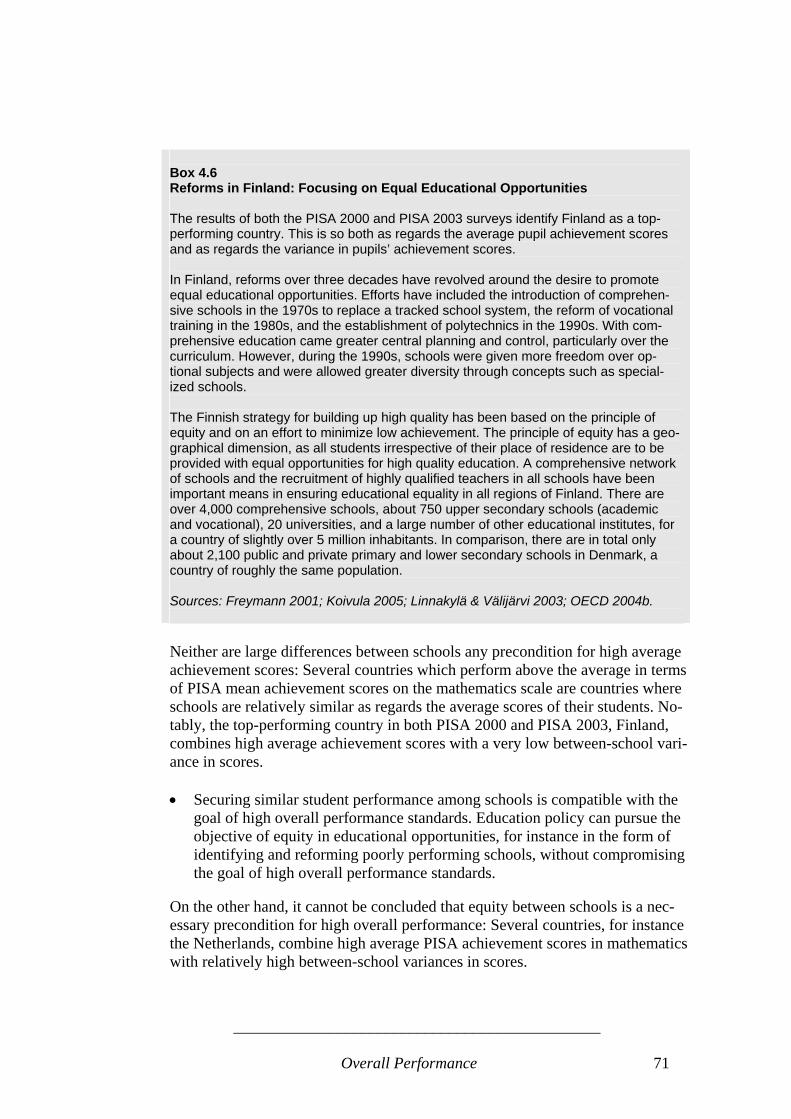
______________________________________________
Overall Performance 71
Box 4.6 Reforms in Finland: Focusing on Equal Educational Opportunities The results of both the PISA 2000 and PISA 2003 surveys identify Finland as a top-performing country. This is so both as regards the average pupil achievement scores and as regards the variance in pupils’ achievement scores. In Finland, reforms over three decades have revolved around the desire to promote equal educational opportunities. Efforts have included the introduction of comprehen-sive schools in the 1970s to replace a tracked school system, the reform of vocational training in the 1980s, and the establishment of polytechnics in the 1990s. With com-prehensive education came greater central planning and control, particularly over the curriculum. However, during the 1990s, schools were given more freedom over op-tional subjects and were allowed greater diversity through concepts such as special-ized schools. The Finnish strategy for building up high quality has been based on the principle of equity and on an effort to minimize low achievement. The principle of equity has a geo-graphical dimension, as all students irrespective of their place of residence are to be provided with equal opportunities for high quality education. A comprehensive network of schools and the recruitment of highly qualified teachers in all schools have been important means in ensuring educational equality in all regions of Finland. There are over 4,000 comprehensive schools, about 750 upper secondary schools (academic and vocational), 20 universities, and a large number of other educational institutes, for a country of slightly over 5 million inhabitants. In comparison, there are in total only about 2,100 public and private primary and lower secondary schools in Denmark, a country of roughly the same population. Sources: Freymann 2001; Koivula 2005; Linnakylä & Välijärvi 2003; OECD 2004b. Neither are large differences between schools any precondition for high average achievement scores: Several countries which perform above the average in terms of PISA mean achievement scores on the mathematics scale are countries where schools are relatively similar as regards the average scores of their students. No-tably, the top-performing country in both PISA 2000 and PISA 2003, Finland, combines high average achievement scores with a very low between-school vari-ance in scores. • Securing similar student performance among schools is compatible with the
goal of high overall performance standards. Education policy can pursue the objective of equity in educational opportunities, for instance in the form of identifying and reforming poorly performing schools, without compromising the goal of high overall performance standards.
On the other hand, it cannot be concluded that equity between schools is a nec-essary precondition for high overall performance: Several countries, for instance the Netherlands, combine high average PISA achievement scores in mathematics with relatively high between-school variances in scores.
______________________________________________
Student Background 72
5. Student Background and Basic Skills One of the major challenges to European education systems is to provide equal opportunities and thus to compensate for any differences in the students’ back-ground which may disadvantage certain groups. This section focuses on this issue. The chapter analyses the relation between on the one hand achievement scores in mathematics, reading, and science, and on the other hand specific student characteristics: Gender, ethnicity, and socioeco-nomic background. The analysis is at the level of individuals, but the results are generally broken down by countries. This allows comparisons of the strength and direction of relations between factors across countries, and an assessment of the significance of educational systems in this connection.
5.1. Foreign Background and Basic Skills Among the major challenges for the school systems in many OECD countries is the situation of students with foreign ethnic background. The provision of basic skills to these students is important, not only to facilitate their daily lives, but also in order to support their wider integration into the respective societies.
Differences between Native Students and Students with Foreign Background The table below shows the share of students with foreign background and the difference in average achievement score between “native students” and students with foreign background. Native students are students who are born in the country of assessment or who have at least one parent born in that country. Students with foreign background are students who are either born in the country of the assessment but whose par-ents were born in another country, or students who are born outside the country of assessment and whose parents were also born in another country. The table demonstrates that the share of students with foreign background varies considerably between countries. The share of students with foreign background is 5 per cent or less in several countries and above 5 per cent in 13 countries. How do students with a foreign background perform in the PISA tests, compared to native students? There is a considerable variance between countries. As re-gards the group of countries with more than 5 per cent students with a foreign background, Belgium and Germany stand out. In these two countries, the differ-ences in the average achievement score between native students and students with foreign background are larger than in other countries, to the disadvantage of the students with foreign background. The differences in Sweden, Norway, the Netherlands, Denmark, and France, are at a lower level but still high. The differ-ences in the USA are at a relatively lower level although the share of foreign
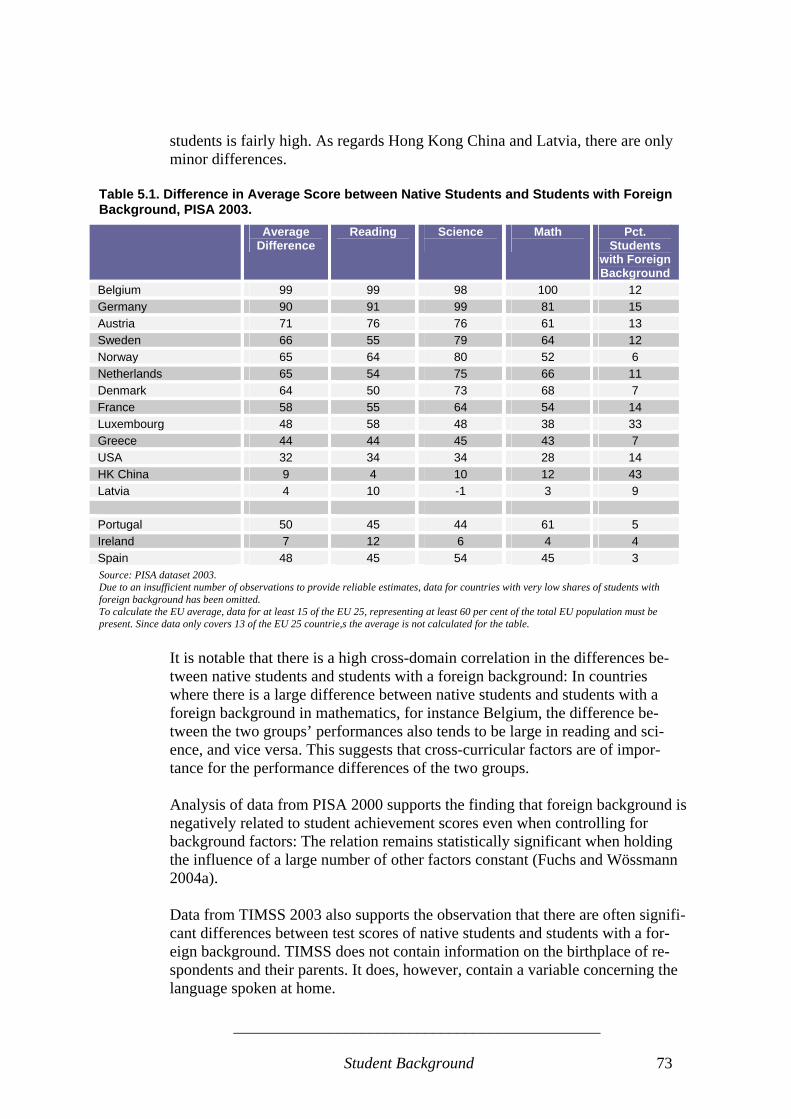
______________________________________________
Student Background 73
students is fairly high. As regards Hong Kong China and Latvia, there are only minor differences.
Table 5.1. Difference in Average Score between Native Students and Students with Foreign Background, PISA 2003.
Average Difference
Reading
Science
Math
Pct. Students
with Foreign Background
Belgium 99 99 98 100 12 Germany 90 91 99 81 15 Austria 71 76 76 61 13 Sweden 66 55 79 64 12 Norway 65 64 80 52 6 Netherlands 65 54 75 66 11 Denmark 64 50 73 68 7 France 58 55 64 54 14 Luxembourg 48 58 48 38 33 Greece 44 44 45 43 7 USA 32 34 34 28 14 HK China 9 4 10 12 43 Latvia 4 10 -1 3 9 Portugal 50 45 44 61 5 Ireland 7 12 6 4 4 Spain 48 45 54 45 3 Source: PISA dataset 2003. Due to an insufficient number of observations to provide reliable estimates, data for countries with very low shares of students with foreign background has been omitted. To calculate the EU average, data for at least 15 of the EU 25, representing at least 60 per cent of the total EU population must be present. Since data only covers 13 of the EU 25 countrie,s the average is not calculated for the table.
It is notable that there is a high cross-domain correlation in the differences be-tween native students and students with a foreign background: In countries where there is a large difference between native students and students with a foreign background in mathematics, for instance Belgium, the difference be-tween the two groups’ performances also tends to be large in reading and sci-ence, and vice versa. This suggests that cross-curricular factors are of impor-tance for the performance differences of the two groups. Analysis of data from PISA 2000 supports the finding that foreign background is negatively related to student achievement scores even when controlling for background factors: The relation remains statistically significant when holding the influence of a large number of other factors constant (Fuchs and Wössmann 2004a). Data from TIMSS 2003 also supports the observation that there are often signifi-cant differences between test scores of native students and students with a for-eign background. TIMSS does not contain information on the birthplace of re-spondents and their parents. It does, however, contain a variable concerning the language spoken at home.
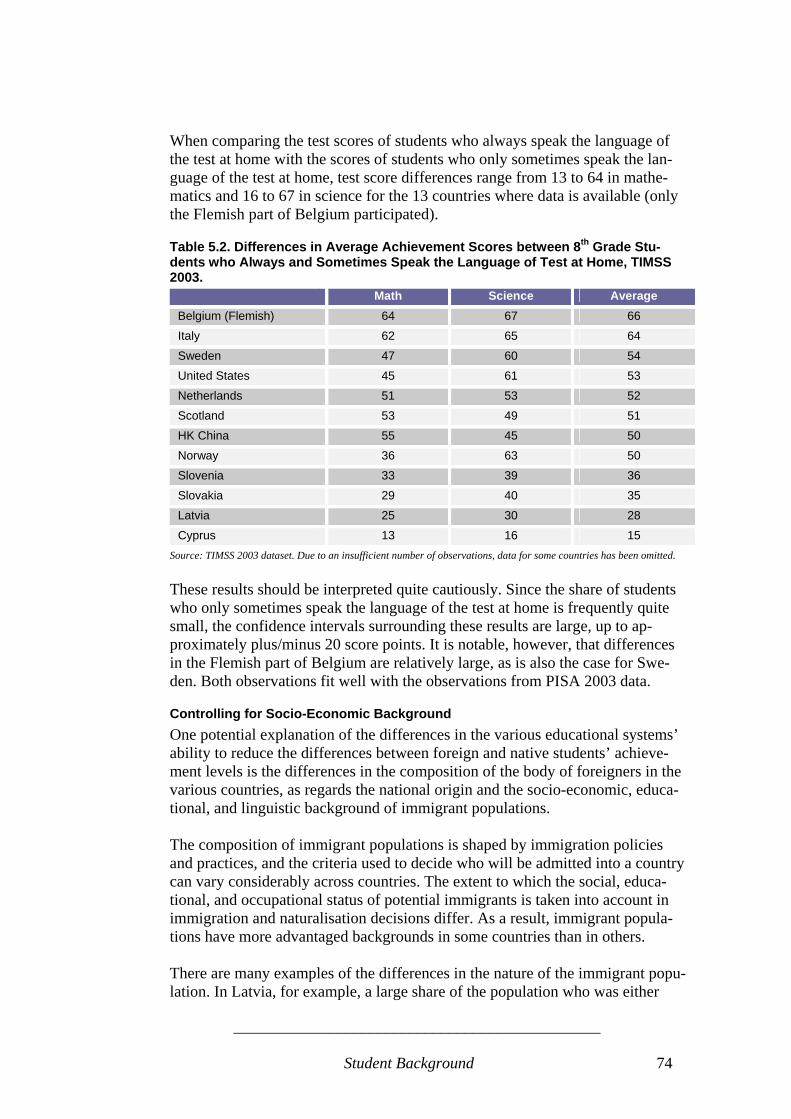
______________________________________________
Student Background 74
When comparing the test scores of students who always speak the language of the test at home with the scores of students who only sometimes speak the lan-guage of the test at home, test score differences range from 13 to 64 in mathe-matics and 16 to 67 in science for the 13 countries where data is available (only the Flemish part of Belgium participated).
Table 5.2. Differences in Average Achievement Scores between 8th Grade Stu-dents who Always and Sometimes Speak the Language of Test at Home, TIMSS 2003.
Math Science Average Belgium (Flemish) 64 67 66
Italy 62 65 64
Sweden 47 60 54
United States 45 61 53
Netherlands 51 53 52
Scotland 53 49 51
HK China 55 45 50
Norway 36 63 50
Slovenia 33 39 36
Slovakia 29 40 35
Latvia 25 30 28
Cyprus 13 16 15 Source: TIMSS 2003 dataset. Due to an insufficient number of observations, data for some countries has been omitted. These results should be interpreted quite cautiously. Since the share of students who only sometimes speak the language of the test at home is frequently quite small, the confidence intervals surrounding these results are large, up to ap-proximately plus/minus 20 score points. It is notable, however, that differences in the Flemish part of Belgium are relatively large, as is also the case for Swe-den. Both observations fit well with the observations from PISA 2003 data.
Controlling for Socio-Economic Background One potential explanation of the differences in the various educational systems’ ability to reduce the differences between foreign and native students’ achieve-ment levels is the differences in the composition of the body of foreigners in the various countries, as regards the national origin and the socio-economic, educa-tional, and linguistic background of immigrant populations. The composition of immigrant populations is shaped by immigration policies and practices, and the criteria used to decide who will be admitted into a country can vary considerably across countries. The extent to which the social, educa-tional, and occupational status of potential immigrants is taken into account in immigration and naturalisation decisions differ. As a result, immigrant popula-tions have more advantaged backgrounds in some countries than in others. There are many examples of the differences in the nature of the immigrant popu-lation. In Latvia, for example, a large share of the population who was either

______________________________________________
Student Background 75
born outside the country or whose parents were born in a different country be-longs to the Russian minority which traditionally has had a relatively strong so-cial and economic position in society. In the majority of the western European countries, in contrast, a larger share of immigrants stems from the Middle East, Africa, or Asia, and is in a weaker position in the society in various respects (Eu-rydice 2004). Although many differences between countries can undoubtedly be explained due to differences in the composition of the foreign population, there are still signifi-cant differences between countries with relatively uniform bodies of foreign stu-dents. Unfortunately, the PISA dataset does not contain information on the coun-try of origin of the students with foreign background. Eurostat data does, how-ever, provide information on the continent of origin of the foreign population originating from outside the EU15. • Based on this data it is notable, for instance, that although Denmark and
Germany have similar profiles of non-European foreign nationals with re-spect to the continent of origin (Eurydice 2004: 22), German students with a foreign background perform relatively worse in the PISA 2003 survey than Danish students with a foreign background.
• A similar point can be made comparing Belgium and France: The share of non-European nationals originating from Africa is relatively high in both countries, even though it is higher in France than in Belgium (Eurydice 2004: 22). Nevertheless, Belgian students with a foreign background perform significantly worse across the skills domains than French students with a for-eign background.
How may these differences be understood? Before attempting to answer this question, it will be useful to see if these differences remain if the socio-economic background of non-native students is taken into account in assessing PISA achievement scores. Indeed, the socio-economic background of the foreign students can be seen as a more important piece of information than the country of origin of foreign students, since nationality as such is likely to be of little or no importance in itself for educational performances. In the table below, an adjustment for the socio-economic background of students is made. Focusing on differences in average mathematics scores, the first column restates the differences between native and foreign students in PISA 2003. The second column contains the difference between the average mathematics scores of native students and students with a foreign background, when taking into ac-count students’ socio-economic background as measured by the PISA index of economic, social, and cultural status, ESCS. 22 The third column displays the effect of adjusting for socio-economic background. 22 The index of economic, social, and cultural status (ESCS) captures a number of aspects of a student’s family and home background. Based on student self-reports, it is derived from the following variables: 1) the highest international socio-economic index of occupational status of the father or the mother; 2) the highest level of education of the father or mother converted into years of schooling; and 3) the number of books at home as well as access to home educational and cultural resources, obtained by asking students whether
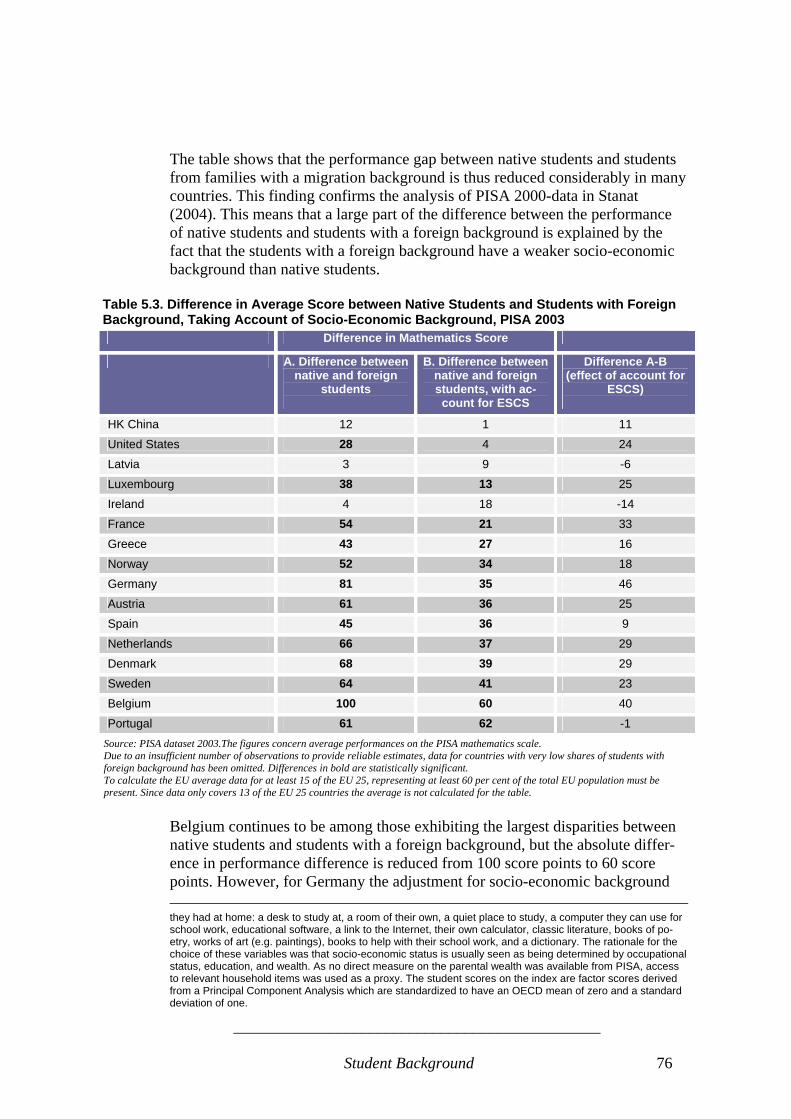
______________________________________________
Student Background 76
The table shows that the performance gap between native students and students from families with a migration background is thus reduced considerably in many countries. This finding confirms the analysis of PISA 2000-data in Stanat (2004). This means that a large part of the difference between the performance of native students and students with a foreign background is explained by the fact that the students with a foreign background have a weaker socio-economic background than native students.
Table 5.3. Difference in Average Score between Native Students and Students with Foreign Background, Taking Account of Socio-Economic Background, PISA 2003 Difference in Mathematics Score
A. Difference between native and foreign
students
B. Difference between native and foreign students, with ac-count for ESCS
Difference A-B (effect of account for
ESCS)
HK China 12 1 11
United States 28 4 24
Latvia 3 9 -6
Luxembourg 38 13 25
Ireland 4 18 -14
France 54 21 33
Greece 43 27 16
Norway 52 34 18
Germany 81 35 46
Austria 61 36 25
Spain 45 36 9
Netherlands 66 37 29
Denmark 68 39 29
Sweden 64 41 23
Belgium 100 60 40
Portugal 61 62 -1 Source: PISA dataset 2003.The figures concern average performances on the PISA mathematics scale. Due to an insufficient number of observations to provide reliable estimates, data for countries with very low shares of students with foreign background has been omitted. Differences in bold are statistically significant. To calculate the EU average data for at least 15 of the EU 25, representing at least 60 per cent of the total EU population must be present. Since data only covers 13 of the EU 25 countries the average is not calculated for the table.
Belgium continues to be among those exhibiting the largest disparities between native students and students with a foreign background, but the absolute differ-ence in performance difference is reduced from 100 score points to 60 score points. However, for Germany the adjustment for socio-economic background they had at home: a desk to study at, a room of their own, a quiet place to study, a computer they can use for school work, educational software, a link to the Internet, their own calculator, classic literature, books of po-etry, works of art (e.g. paintings), books to help with their school work, and a dictionary. The rationale for the choice of these variables was that socio-economic status is usually seen as being determined by occupational status, education, and wealth. As no direct measure on the parental wealth was available from PISA, access to relevant household items was used as a proxy. The student scores on the index are factor scores derived from a Principal Component Analysis which are standardized to have an OECD mean of zero and a standard deviation of one.

______________________________________________
Student Background 77
means that differences are reduced even more significantly, resulting in the per-formance difference between native and foreign students being lower than in a number of other countries. Thus, a very significant share of the performance difference between native students and students with a foreign background in Germany is accounted for by the fact that German students with a foreign back-ground have a weaker socio-economic background than native students. The average socio-economic status of Portuguese students with a foreign back-ground is close to the average of native students. This appears from the fact that there is virtually no adjustment effect of accounting for socio-economic status. This means that when adjusting for socio-economic background, Portugal is among the countries with the highest difference in average achievement scores between native students and students with a foreign background. Nevertheless, between-country differences in the performance of native and non-native students remain substantial, even when adjusting for socio-economic background. Furthermore, for most countries, the ranking of countries in terms of native vs. non-native performance differences persists, and the analysis of PISA 2003 data in several respects confirms the ranking of countries with re-spect to these differences that were found in Stanat (2004). This suggests that, in addition to the composition of countries’ immigrant popu-lations, other factors determine between-country differences in non-native stu-dents’ relative performance.
Controlling for Socio-Economic Background and Home Language One factor which could be considered here is the language background of immi-grants. The extent to which immigrants have to overcome language barriers var-ies considerably across countries, for instance depending on whether the country has a colonial history, so that many immigrants already speak the official lan-guage of the country at the time of their arrival. Taking this factor into account, as has been done in table 5.4, does not remove differences between native students and students with a foreign background. In this table’s third column, the difference between native students and students with a foreign background is considered for students with similar socio-econo-mic and language background.23 Differences are reduced slightly, but they remain. Most of the differences which were found between countries also remain: Differences between the perform-ances of native and non-native students remain significantly higher in Belgium than for instance in France.
23 All non-native students included speak a language at home that is different from the language of instruction in schools.
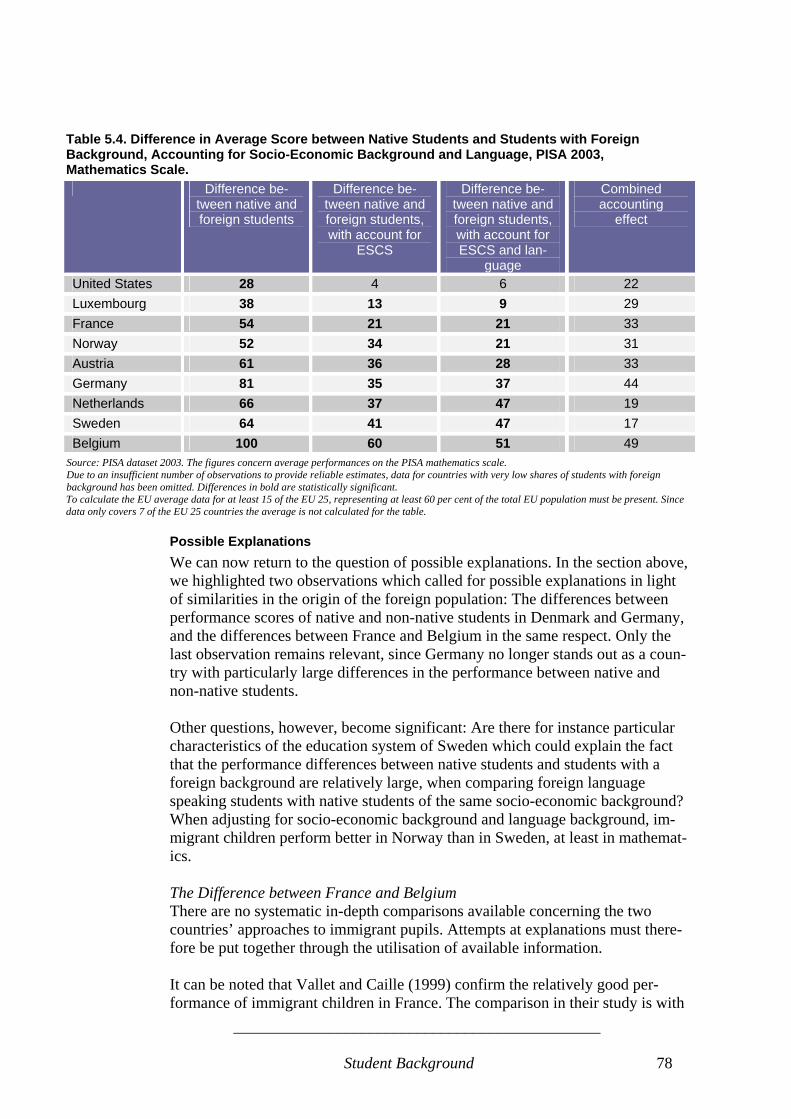
______________________________________________
Student Background 78
Table 5.4. Difference in Average Score between Native Students and Students with Foreign Background, Accounting for Socio-Economic Background and Language, PISA 2003, Mathematics Scale. Difference be-
tween native and foreign students
Difference be-tween native and foreign students, with account for
ESCS
Difference be-tween native and foreign students, with account for ESCS and lan-
guage
Combined accounting
effect
United States 28 4 6 22 Luxembourg 38 13 9 29 France 54 21 21 33 Norway 52 34 21 31 Austria 61 36 28 33 Germany 81 35 37 44 Netherlands 66 37 47 19 Sweden 64 41 47 17 Belgium 100 60 51 49
Source: PISA dataset 2003. The figures concern average performances on the PISA mathematics scale. Due to an insufficient number of observations to provide reliable estimates, data for countries with very low shares of students with foreign background has been omitted. Differences in bold are statistically significant. To calculate the EU average data for at least 15 of the EU 25, representing at least 60 per cent of the total EU population must be present. Since data only covers 7 of the EU 25 countries the average is not calculated for the table.
Possible Explanations We can now return to the question of possible explanations. In the section above, we highlighted two observations which called for possible explanations in light of similarities in the origin of the foreign population: The differences between performance scores of native and non-native students in Denmark and Germany, and the differences between France and Belgium in the same respect. Only the last observation remains relevant, since Germany no longer stands out as a coun-try with particularly large differences in the performance between native and non-native students. Other questions, however, become significant: Are there for instance particular characteristics of the education system of Sweden which could explain the fact that the performance differences between native students and students with a foreign background are relatively large, when comparing foreign language speaking students with native students of the same socio-economic background? When adjusting for socio-economic background and language background, im-migrant children perform better in Norway than in Sweden, at least in mathemat-ics. The Difference between France and Belgium There are no systematic in-depth comparisons available concerning the two countries’ approaches to immigrant pupils. Attempts at explanations must there-fore be put together through the utilisation of available information. It can be noted that Vallet and Caille (1999) confirm the relatively good per-formance of immigrant children in France. The comparison in their study is with

______________________________________________
Student Background 79
native French students, however, not with immigrant children in other countries: After adjusting for socio-economic background and family background, immi-grants’ children perform better than native children in the baccalauréat examina-tion after seven years in secondary school. The authors conclude that immigrant parents in France invest in education in order to improve their children’s future, and they develop strong educational aspirations for them. This is reflected the educational attainment of their children. As for the difference between France and Belgium, Eurydice (2004) contains some relevant information on educational approaches. • It does not seem likely that the differences between the two countries can be
explained by a different approach to language training for newly arrived children. Both countries apply specific measures for “new arrivals” for pro-viding language support (Eurydice 2004: 35).
• Neither do the two countries adopt different strategies of integration by means of schools for immigrants. Both in France and in the Flemish, Ger-man, and French-speaking regions of Belgium, emphasis is put on an inte-grated model in which immigrant children are allocated to classes consisting of children in mainstream education. Here they follow methods and the cur-ricular content intended for native pupils. Furthermore, transitional support is provided for immigrant children in both Belgium and France (Eurydice 2004: 42).
• A possible explanatory factor concerns procedures for determining the ap-propriate level of schooling. In France, schools rely on case-by-case assess-ments in the pupil’s previous language of instruction, if possible. The pupil is not, however, placed in a class more than two years below that of his/her age. In Belgium, in contrast, pupils who hold a foreign certificate or diploma can apply for equal recognition (Eurydice 2004: 40). This may mean that more non-native pupils at the age of 15 in Belgium than in France are receiv-ing instruction at a level of schooling which is not suited to the level of the student.
• Another possible explanation concerns the possibility of smaller classes or special norms for classes with many immigrant children. This is a possibility in France, where special reception classes can be formed for pupils who have not previously attended school. According to Eurydice, this not the case in Belgium (Eurydice 2004: 46, 82).
• Most likely, however, other factors on which no information is available explain a large part of the differences between the performance of non-native students in Belgium and France. Other differences in the composition of the group of students with a foreign background than the ones adjusted for above may be significant. Other differences in the approach to education of immi-grant children may also be important. Finally, it is a possibility that the vari-ables measuring socio-economic background are not precise enough.
• The overall conclusion is therefore that the PISA 2003 results raise an inter-esting question that can be fruitfully explored: Why is it that after adjusting for socio-economic background and language, children with a foreign back-
______________________________________________
Student Background 80
ground perform relatively better on the PISA mathematics scale in France than in Belgium?
The Difference between Norway and Sweden There are several important aspects to consider regarding the difference in the performance of non-native students in Norway and Sweden. First is the question of whether the difference persists when reading performances rather than mathematics performances are examined. Second, the question of mother-tongue instruction could be important, as there is solid evidence that mother-tongue based schooling has positive effects on academic performances (e.g. Thomas and Collier 2001, Benson 2005). Third is the question of the share of non-native students in the two countries. • Does the difference between the performance of non-native students when
adjusting for socio-economic background and language persist when reading is examined instead of mathematics? Even though the information is not di-rectly comparable, data from PISA 2000 casts some doubt on this: When ad-justing for socio-economic status, parent education, language spoken at home, the labour market situation of the father, and the gender of the pupil, Skolverket (2003) reports that the net effect of foreign background for read-ing scores is larger among Swedish than Norwegian students only among students born in the test country.
• As for the question of mother-tongue instruction, both Sweden and Norway provide this possibility as a formal right to non-native students in primary and lower secondary education. This places the two countries as an excep-tion to the general rule (Eurydice 2004: 46).24 In Norway, non-native stu-dents have a right to learn a non-Norwegian mother tongue, to bilingual in-struction of other subjects, and to special education in Norwegian. The mu-nicipalities report, however, that it is sometimes difficult to fulfil these rights. (UFD 2003). In Sweden, identical principles for mother-tongue edu-cation apply (Skolverket 2005). Presumably, the status of mother-tongue education can therefore not explain differences between comparable groups of non-native students in Norway and Sweden. Whether mother-tongue in-struction is implemented similarly in the two countries, however, is difficult to determine.
• There is the question of the share of non-native students in the two countries and the consequences of this. It appears from table 4.2 in Chapter 4 that there are relatively fewer students with a foreign background in Norway than in Sweden: In the 2003 PISA survey, 6 per cent of the participants in the Nor-wegian survey had a foreign background, as opposed to 12 per cent in Swe-den. At the same time, analysis of PISA 2000 data has suggested that the density of non-native students in schools has an independent negative effect on student performances in both Sweden and Norway (Skolverket 2003: 14-
24 According to Eurydice (2004), among the 30 European countries considered in the analysis, bi-lingual tuition is offered in only Sweden, Norway, and Finland, as well as in Estonia, Latvia, and Cyprus (Eurydice 2004: 46). The Norwegian legislation on mother tongue instruction was changed in 2004 (cf. the considera-tions in UFD 2003), allowing municipalities a wider scope for deciding how they will fulfill the general obliga-tion to provide special language training for pupils who do not speak Norwegian well enough to follow normal education. This constitutes a relative weakening of the right to bi-lingual tuition.

______________________________________________
Student Background 81
15).25 However, it is a reasonable assumption that this effect on the average performances of non-native students will be greater in Sweden than in Nor-way, as there are relatively more schools with a high density of non-native students in Sweden.
• An altogether convincing interpretation of differences between Norway and Sweden cannot be provided on the basis of existing information, however. Other factors than those considered may be of importance.
Density of Non-Native Students Negatively Correlated With Achievement Scores for Non-Native Students Given that the achievement scores of non-native students are generally lower than those of native students - due to cultural, socio-economic, and linguistic barriers - we will test the hypothesis that the density of non-native students in schools is negatively correlated with achievement. The logic behind this hy-pothesis is that the more non-native students are mixed with native students, the more their educational integration learning and is reinforced. In the PISA survey, school principals have been asked what share of students in their school has a first language which is not the same as the language of instruc-tion in the country concerned. Based on this data, we have compared the average mathematics, reading, and science achievement scores of non-native students from schools with different densities of non-native students: 40 per cent or more non-native students, 20-39 per cent non-native students, 10–19 per cent non-native students and less than 10 per cent non-native students. The results in Table 5.5 illustrate that non-native students who attend schools with high densities (40% or more) of non-native students have lower achieve-ments than non-native students who attend schools with low densities (less than 10%).The more non-native students are mixed with native students, the better are their achievements as regards basic skills. This tendency generally applies for both mathematics, reading, and science, and remains when adjusting for the socio-economic background of the non-native students. In other words: When studying non-native students with similar socioeconomic background, the aver-age achievement score of these students depends on the density of non-native students in the school they attend. In some countries, the percentage of non-native students attending schools with high densities of non-native students (40 per cent or more) is high. In reading, this is the case for the Netherlands (34,7 per cent), Sweden (31 per cent), Ger-many (28,1 per cent), Norway (26 per cent), Austria (26 per cent), and Denmark (25,3 per cent). In these countries, the average achievement scores of these students are consid-erably lower than students attending schools with a density of non-native stu-dents below 10 per cent: Germany (132 points lower), Sweden (67 points lower),
25 Schools with a high density of non-native students are defined as schools where at least 40 per cent of all students have another mother tongue than the test language of the country concerned.

______________________________________________
Student Background 82
the Netherlands (51 points lower), Austria (66 points lower) and Denmark (33 points lower).26
Table 5.5 Average Reading Scores Among 15-Year-Old Non-Native Students Attending Schools with Different Densities of Non-Native Students (PISA 2003) Density of Non-Native Students
40 per cent or more Less than 10 per cent Country Share of Non-
Native Students in Schools with High Density of Non-Native Stu-dents
Avg. Reading Achievement Score for Non-Native Students
Share of Non-Native Students in Schools with Low Density of Non-Native stu-dents
Avg. Read-ing Achievement Score for Non-Native Students
Score Difference (Low-High Density)
Slovakia 3,3 282 76,2 452 170
Hungary 1,0 346 98,5 484 138
Portugal 5,1 335 60,8 469 134
Germany 28,1 359 28,6 491 132
Sweden 31,7 428 27,5 495 66
United States 14,8 431 43,1 496 66
Austria 26,0 389 35,8 454 66
The Netherlands 34,7 448 35,9 499 51 EU average 39,7 431 37,5 472 42 Italy 6,7 391 82,0 432 41
Greece 16,5 411 53,5 445 35
Belgium 15,9 399 61,1 432 34
Denmark 25,3 430 41,5 463 33
Iceland 6,2 408 80,0 432 23
Latvia 24,3 476 59,8 488 12
Norway 26,1 426 50,1 438 12
Spain 11,6 440 56,3 441 2
Turkey 3,8 467 96,2 453 -13
Finland 0,4 516 83,2 455 -61
Source: PISA 2003 dataset. Data not available for the Czech Republic, France, Ireland, HK China, Japan, and Korea.
The implication is that in this group of countries, the high percentage of non-native students attending schools with a high density of non-native students may be a problem in itself, reinforcing low achievements. Consequently, these coun-tries should reflect on possible initiatives for reducing the density of non-native students in particular schools.
5.2. Socio-Economic Background and Basic Skills Social heritage is often used as a label for the supposed strong positive relation-ship between students' school achievements and the social status of their parents. 26 A separate analysis of Swedish conditions and the previously mentioned comparison of Norway and Swe-den confirm this finding, cf. Skolverket (2003, 2004).
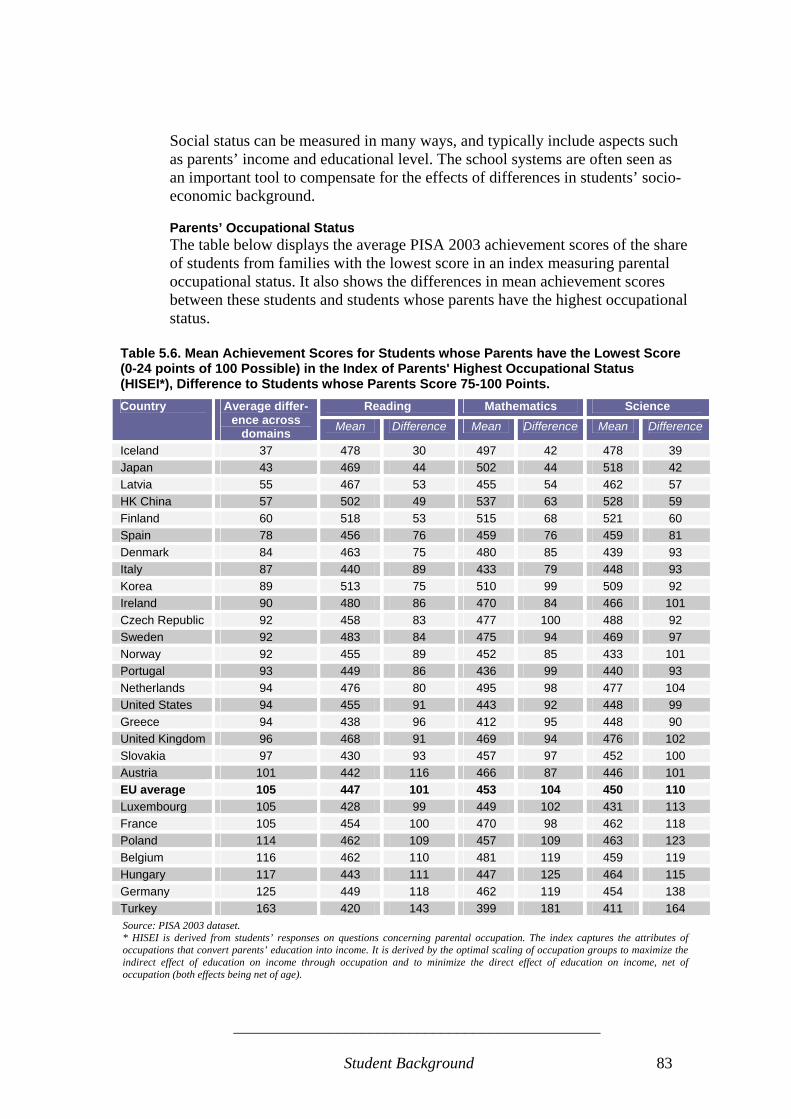
______________________________________________
Student Background 83
Social status can be measured in many ways, and typically include aspects such as parents’ income and educational level. The school systems are often seen as an important tool to compensate for the effects of differences in students’ socio-economic background. Parents’ Occupational Status The table below displays the average PISA 2003 achievement scores of the share of students from families with the lowest score in an index measuring parental occupational status. It also shows the differences in mean achievement scores between these students and students whose parents have the highest occupational status.
Table 5.6. Mean Achievement Scores for Students whose Parents have the Lowest Score (0-24 points of 100 Possible) in the Index of Parents' Highest Occupational Status (HISEI*), Difference to Students whose Parents Score 75-100 Points.
Reading Mathematics Science Country Average differ-ence across
domains Mean Difference Mean Difference Mean Difference
Iceland 37 478 30 497 42 478 39 Japan 43 469 44 502 44 518 42 Latvia 55 467 53 455 54 462 57 HK China 57 502 49 537 63 528 59 Finland 60 518 53 515 68 521 60 Spain 78 456 76 459 76 459 81 Denmark 84 463 75 480 85 439 93 Italy 87 440 89 433 79 448 93 Korea 89 513 75 510 99 509 92 Ireland 90 480 86 470 84 466 101 Czech Republic 92 458 83 477 100 488 92 Sweden 92 483 84 475 94 469 97 Norway 92 455 89 452 85 433 101 Portugal 93 449 86 436 99 440 93 Netherlands 94 476 80 495 98 477 104 United States 94 455 91 443 92 448 99 Greece 94 438 96 412 95 448 90 United Kingdom 96 468 91 469 94 476 102 Slovakia 97 430 93 457 97 452 100 Austria 101 442 116 466 87 446 101 EU average 105 447 101 453 104 450 110 Luxembourg 105 428 99 449 102 431 113 France 105 454 100 470 98 462 118 Poland 114 462 109 457 109 463 123 Belgium 116 462 110 481 119 459 119 Hungary 117 443 111 447 125 464 115 Germany 125 449 118 462 119 454 138 Turkey 163 420 143 399 181 411 164 Source: PISA 2003 dataset. * HISEI is derived from students’ responses on questions concerning parental occupation. The index captures the attributes of occupations that convert parents’ education into income. It is derived by the optimal scaling of occupation groups to maximize the indirect effect of education on income through occupation and to minimize the direct effect of education on income, net of occupation (both effects being net of age).
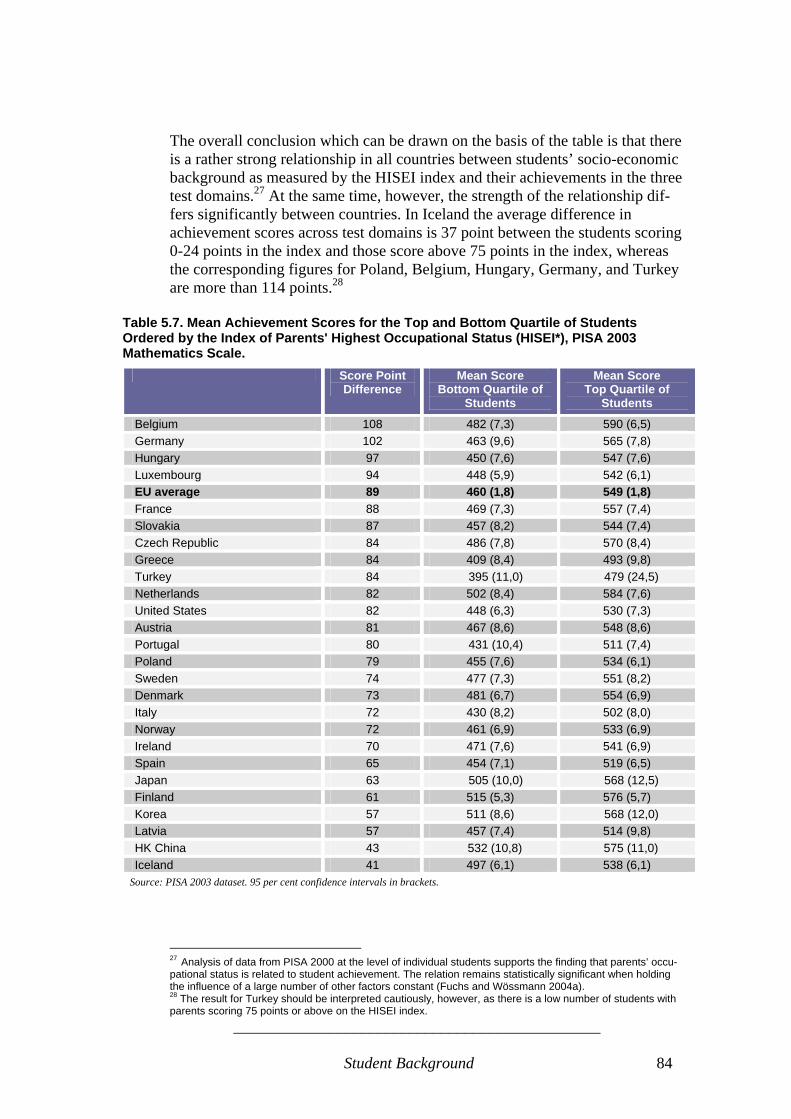
______________________________________________
Student Background 84
The overall conclusion which can be drawn on the basis of the table is that there is a rather strong relationship in all countries between students’ socio-economic background as measured by the HISEI index and their achievements in the three test domains.27 At the same time, however, the strength of the relationship dif-fers significantly between countries. In Iceland the average difference in achievement scores across test domains is 37 point between the students scoring 0-24 points in the index and those score above 75 points in the index, whereas the corresponding figures for Poland, Belgium, Hungary, Germany, and Turkey are more than 114 points.28
Table 5.7. Mean Achievement Scores for the Top and Bottom Quartile of Students Ordered by the Index of Parents' Highest Occupational Status (HISEI*), PISA 2003 Mathematics Scale.
Score Point Difference
Mean Score Bottom Quartile of
Students
Mean Score Top Quartile of
Students
Belgium 108 482 (7,3) 590 (6,5) Germany 102 463 (9,6) 565 (7,8) Hungary 97 450 (7,6) 547 (7,6) Luxembourg 94 448 (5,9) 542 (6,1) EU average 89 460 (1,8) 549 (1,8) France 88 469 (7,3) 557 (7,4) Slovakia 87 457 (8,2) 544 (7,4) Czech Republic 84 486 (7,8) 570 (8,4) Greece 84 409 (8,4) 493 (9,8) Turkey 84 395 (11,0) 479 (24,5) Netherlands 82 502 (8,4) 584 (7,6) United States 82 448 (6,3) 530 (7,3) Austria 81 467 (8,6) 548 (8,6) Portugal 80 431 (10,4) 511 (7,4) Poland 79 455 (7,6) 534 (6,1) Sweden 74 477 (7,3) 551 (8,2) Denmark 73 481 (6,7) 554 (6,9) Italy 72 430 (8,2) 502 (8,0) Norway 72 461 (6,9) 533 (6,9) Ireland 70 471 (7,6) 541 (6,9) Spain 65 454 (7,1) 519 (6,5) Japan 63 505 (10,0) 568 (12,5) Finland 61 515 (5,3) 576 (5,7) Korea 57 511 (8,6) 568 (12,0) Latvia 57 457 (7,4) 514 (9,8) HK China 43 532 (10,8) 575 (11,0) Iceland 41 497 (6,1) 538 (6,1)
Source: PISA 2003 dataset. 95 per cent confidence intervals in brackets.
27 Analysis of data from PISA 2000 at the level of individual students supports the finding that parents’ occu-pational status is related to student achievement. The relation remains statistically significant when holding the influence of a large number of other factors constant (Fuchs and Wössmann 2004a). 28 The result for Turkey should be interpreted cautiously, however, as there is a low number of students with parents scoring 75 points or above on the HISEI index.
______________________________________________
Student Background 85
It thus appears that across skills domains, Iceland, Japan, Latvia, Hong Kong China, and Finland, are the five countries where the parents’ occupational status matters the least. In contrast, Poland, Belgium, Hungary, Germany, and Turkey, are the five countries with the largest differences between students whose par-ents have low scores on the occupational index and those whose parents have high scores on the index. Students’ parental occupational background as meas-ured by the HISEI index matters significantly more in these countries than for instance in Iceland and Finland. The significance of parental occupation can also be assessed by looking at the average performance gap between the quartile of students with parents with the highest occupational status and the quartile of students with parents with the lowest occupational status. This is done in the table above, which focuses on the mathematics scale. The results largely confirm the results of the previous table, with Iceland, Hong Kong China, Latvia, Korea, and Finland, being the countries with the smallest difference between the quartile of students with the highest parental occupational status and the quartile of students with the lowest parental occupational status. Similarly, Belgium, Germany, and Hungary, are among the countries where parental occupational status is of greatest significance. Differences the top and bottom quartile of students in terms of parental occupa-tion are relatively smaller in Turkey and Poland when compared to the previous analysis where students with parents of high occupational status are compared to students with parents of low occupational status. This difference is probably accounted for by the fact that there are relatively fewer students with very high scores on the parental occupational index in these countries than in many other countries.
Parents’ Education Parental education may also be important for children’s educational perform-ance, and the data shows positive and statistically significant relationships in the great majority of countries between both mothers’ and fathers’ educational at-tainment on the one hand and students’ performances on the PISA mathematics, reading, and science scales. The table below illustrates the relation between mothers’ educational attainment and PISA achievement scores across the skills domains, focusing on the differ-ence between students whose mothers have completed upper secondary educa-tion and students whose mothers have completed primary or lower secondary education. It appears that in selected countries, the average achievement scores of students is up to 90 score points higher for students whose mothers have completed upper secondary education than for students whose mothers have completed only pri-mary or lower secondary education. The significance of mothers' education is higher in Slovakia, Germany, Turkey, and Hungary than in Spain, Finland, Ice-land, and the Netherlands. In the Netherlands, the effect of mothers’ education is not even statistically significant.
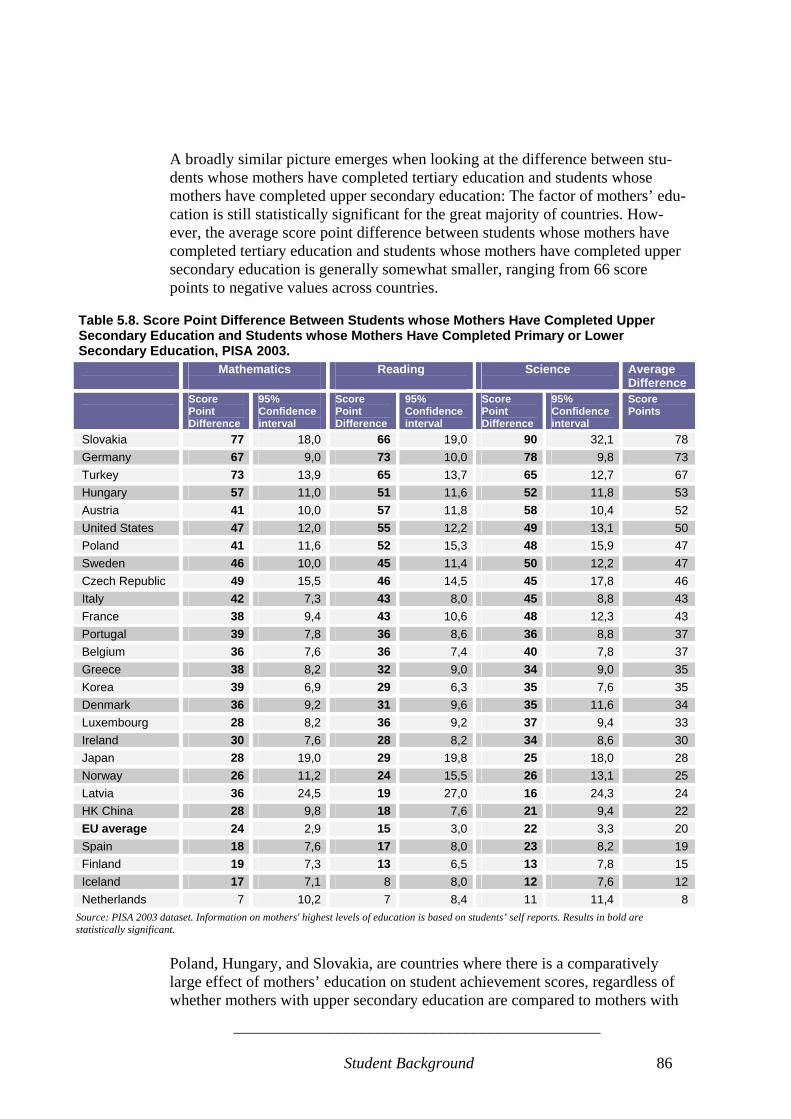
______________________________________________
Student Background 86
A broadly similar picture emerges when looking at the difference between stu-dents whose mothers have completed tertiary education and students whose mothers have completed upper secondary education: The factor of mothers’ edu-cation is still statistically significant for the great majority of countries. How-ever, the average score point difference between students whose mothers have completed tertiary education and students whose mothers have completed upper secondary education is generally somewhat smaller, ranging from 66 score points to negative values across countries.
Table 5.8. Score Point Difference Between Students whose Mothers Have Completed Upper Secondary Education and Students whose Mothers Have Completed Primary or Lower Secondary Education, PISA 2003. Mathematics
Reading
Science
Average Difference
Score Point Difference
95% Confidence interval
Score Point Difference
95% Confidence interval
Score Point Difference
95% Confidence interval
Score Points
Slovakia 77 18,0 66 19,0 90 32,1 78 Germany 67 9,0 73 10,0 78 9,8 73 Turkey 73 13,9 65 13,7 65 12,7 67 Hungary 57 11,0 51 11,6 52 11,8 53 Austria 41 10,0 57 11,8 58 10,4 52 United States 47 12,0 55 12,2 49 13,1 50 Poland 41 11,6 52 15,3 48 15,9 47 Sweden 46 10,0 45 11,4 50 12,2 47 Czech Republic 49 15,5 46 14,5 45 17,8 46 Italy 42 7,3 43 8,0 45 8,8 43 France 38 9,4 43 10,6 48 12,3 43 Portugal 39 7,8 36 8,6 36 8,8 37 Belgium 36 7,6 36 7,4 40 7,8 37 Greece 38 8,2 32 9,0 34 9,0 35 Korea 39 6,9 29 6,3 35 7,6 35 Denmark 36 9,2 31 9,6 35 11,6 34 Luxembourg 28 8,2 36 9,2 37 9,4 33 Ireland 30 7,6 28 8,2 34 8,6 30 Japan 28 19,0 29 19,8 25 18,0 28 Norway 26 11,2 24 15,5 26 13,1 25 Latvia 36 24,5 19 27,0 16 24,3 24 HK China 28 9,8 18 7,6 21 9,4 22 EU average 24 2,9 15 3,0 22 3,3 20 Spain 18 7,6 17 8,0 23 8,2 19 Finland 19 7,3 13 6,5 13 7,8 15 Iceland 17 7,1 8 8,0 12 7,6 12 Netherlands 7 10,2 7 8,4 11 11,4 8
Source: PISA 2003 dataset. Information on mothers' highest levels of education is based on students’ self reports. Results in bold are statistically significant.
Poland, Hungary, and Slovakia, are countries where there is a comparatively large effect of mothers’ education on student achievement scores, regardless of whether mothers with upper secondary education are compared to mothers with

______________________________________________
Student Background 87
primary and lower secondary education, or whether mothers with tertiary educa-tion are compared to mothers with upper secondary education. Similarly, Finland and Hong Kong China are among the countries where there is a rela-tively small effect of mothers’ education, regardless of the levels of education that are compared. As for the educational background of fathers, this factor is also significant for the great majority of countries, with the difference in the score between students whose fathers have completed upper secondary education and those whose fa-thers have completed only primary and lower secondary education being larger on the average than the difference between fathers with tertiary and fathers with upper secondary education. As was the case when considering the significance of mothers’ education, Slovakia, Germany, and Hungary, are among the coun-tries where the fathers’ education matters the most when comparing students of fathers who have completed upper secondary education to those whose fathers have completed primary or lower secondary education. When comparing fathers with tertiary education to those with upper secondary education, Poland, Slova-kia, and Hungary, are among the countries where this matters the most for stu-dents’ achievement scores across skills domains. Overall there is therefore also a high correlation between countries where the mother’s education and the father’s education matters. If the mother’s education has a considerable significance for average achievement scores, so does the fa-ther’s education. No doubt, this fact to a great extent reflects a high correlation between fathers’ and mothers’ education. Undoubtedly, there is also a correlation between the parents’ level of education and other socio-economic factors such as their occupational status. However, even when controlling for a number of other socio-economic factors, each addi-tional year of formal education of parents adds an average of 3,3 score points to the achievement score for students of the countries included in the analysis.29
Single-Parent Families A supportive family environment can help to improve academic performance. Parents may read to young children and help them with homework. For older students, attendance at meetings with teachers or school administrators, encour-agement, and assistance with homework, can also be important. For both young children and older students, providing these kinds of support can be difficult for single parents, since single parents will often have relatively fewer resources available for this purpose in terms of time and energy. Table 5.9 illustrates that the family structure of students is indeed of importance for student performance. Focusing on the PISA 2003 mathematics scale, it illus- 29 Arithmetic average of the score point difference associated with highest parents level of education for 26 countries, when controlling for highest occupational status of parents, possessions related to classical culture, single parent status, immigration status, and language spoken at home (cf. OECD 2004c: 385). Analysis of data from PISA 2000 at the level of individual students supports the finding that there is a statistically signifi-cant relation between parents’ education and student achievement when holding the influence of a large number of other factors constant (Fuchs and Wössmann 2004a).

______________________________________________
Student Background 88
trates that for a number of countries, the difference in the mean performance score between students from single-parent families and students from other types of families is more than 30 score points. 30 The differences are largest in the United States and Belgium, with a score point difference of 43 and 42 respec-tively. It is much smaller and at statistically insignificant levels in Korea, Ice-land, Latvia, the Czech Republic, Turkey, Slovakia, and Austria.
Table 5.9. Family Structure and Performance on the PISA 2003 Mathematics Scale. Single-parent Families Other families Mean Score 95%
Confidence Interval
Mean Score 95% Confidence Interval
Score Point Difference
United States 454 7,6 497 5,7 -43 Belgium 499 8,2 541 4,9 -42 Ireland 475 8,2 508 4,9 -33 Netherlands 517 10,6 548 5,7 -31 Sweden 488 6,7 517 5,1 -29 Denmark 495 7,6 521 5,7 -26 EU average 471 2,4 493 2,7 -22 Norway 480 6,3 502 5,3 -22 HK China 535 11,6 555 8,6 -20 Greece 431 11,4 450 7,8 -19 Luxembourg 478 7,3 497 2,5 -19 France 498 8,4 516 4,9 -18 Hungary 478 7,1 493 5,9 -16 Italy 454 8,8 469 6,1 -15 Poland 479 10,2 492 4,9 -13 Spain 475 8,6 487 4,9 -12 Germany 504 11,2 514 6,7 -10 Portugal 458 10,0 468 6,7 -10 Finland 538 6,5 546 3,7 -9 Korea 535 8,8 544 6,3 -9 Iceland 509 8,6 517 3,1 -8 Latvia 480 9,2 485 7,6 -6 Czech Republic 518 8,4 523 6,7 -5 Turkey 421 14,1 426 13,7 -5 Slovakia 496 10,4 500 6,7 -4 Austria 505 9,0 508 6,5 -3
Source: PISA 2003 dataset. Information on family structure based on students’ self reports. Results in bold are statistically significant. No data available for Japan.
The effect of family structure for achievement scores was also analysed for read-ing achievement on the basis of PISA 2000 data. These results confirm the ob-servation from PISA 2003: Among the countries included in Table 5.9, the sig-nificance of family structure was relatively largest in the United States, Belgium, and Ireland, with a relatively large effect also being found for the Scandinavian countries. 30 Analysis of data from PISA 2000 at the level of individual students supports this finding: There is a statisti-cally significant relation between family status and student achievement which remains significant when hold-ing the influence of a large number of other factors constant (Fuchs and Wössmann 2004a).
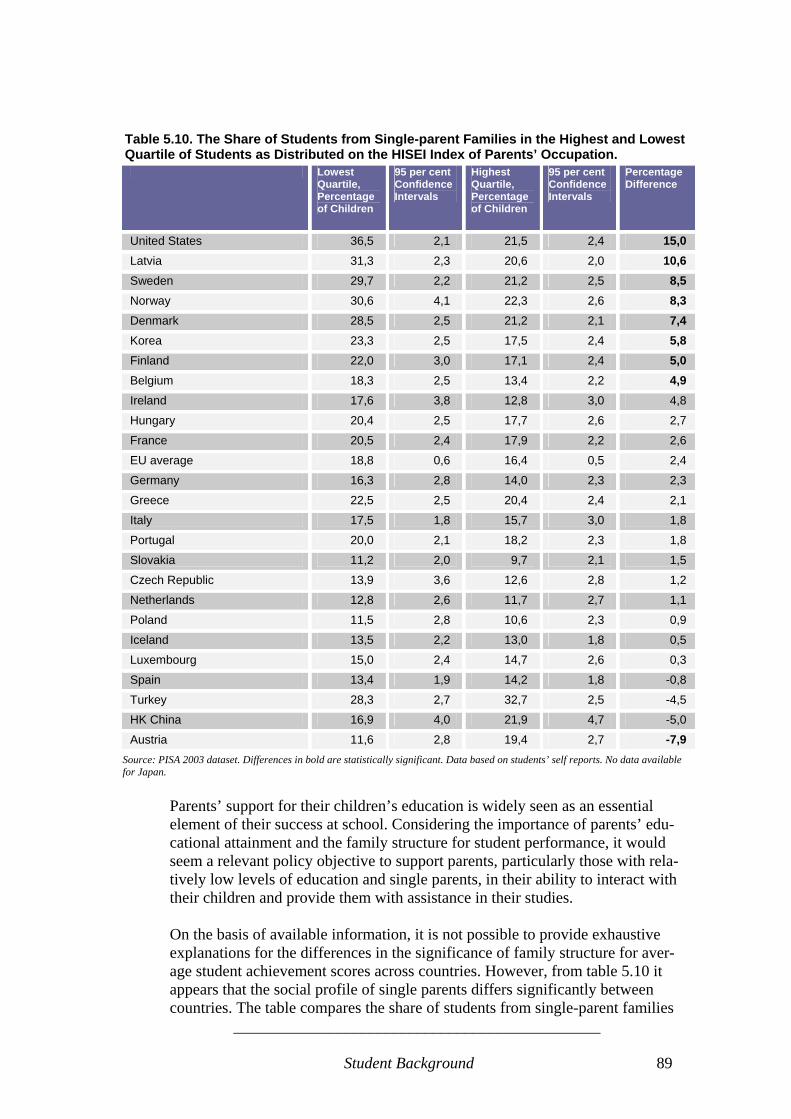
______________________________________________
Student Background 89
Table 5.10. The Share of Students from Single-parent Families in the Highest and Lowest Quartile of Students as Distributed on the HISEI Index of Parents’ Occupation. Lowest
Quartile, Percentage of Children
95 per cent Confidence Intervals
Highest Quartile, Percentage of Children
95 per cent Confidence Intervals
Percentage Difference
United States 36,5 2,1 21,5 2,4 15,0 Latvia 31,3 2,3 20,6 2,0 10,6 Sweden 29,7 2,2 21,2 2,5 8,5 Norway 30,6 4,1 22,3 2,6 8,3 Denmark 28,5 2,5 21,2 2,1 7,4 Korea 23,3 2,5 17,5 2,4 5,8 Finland 22,0 3,0 17,1 2,4 5,0 Belgium 18,3 2,5 13,4 2,2 4,9 Ireland 17,6 3,8 12,8 3,0 4,8
Hungary 20,4 2,5 17,7 2,6 2,7
France 20,5 2,4 17,9 2,2 2,6
EU average 18,8 0,6 16,4 0,5 2,4
Germany 16,3 2,8 14,0 2,3 2,3
Greece 22,5 2,5 20,4 2,4 2,1
Italy 17,5 1,8 15,7 3,0 1,8
Portugal 20,0 2,1 18,2 2,3 1,8
Slovakia 11,2 2,0 9,7 2,1 1,5
Czech Republic 13,9 3,6 12,6 2,8 1,2
Netherlands 12,8 2,6 11,7 2,7 1,1
Poland 11,5 2,8 10,6 2,3 0,9
Iceland 13,5 2,2 13,0 1,8 0,5
Luxembourg 15,0 2,4 14,7 2,6 0,3
Spain 13,4 1,9 14,2 1,8 -0,8
Turkey 28,3 2,7 32,7 2,5 -4,5
HK China 16,9 4,0 21,9 4,7 -5,0
Austria 11,6 2,8 19,4 2,7 -7,9 Source: PISA 2003 dataset. Differences in bold are statistically significant. Data based on students’ self reports. No data available for Japan.
Parents’ support for their children’s education is widely seen as an essential element of their success at school. Considering the importance of parents’ edu-cational attainment and the family structure for student performance, it would seem a relevant policy objective to support parents, particularly those with rela-tively low levels of education and single parents, in their ability to interact with their children and provide them with assistance in their studies. On the basis of available information, it is not possible to provide exhaustive explanations for the differences in the significance of family structure for aver-age student achievement scores across countries. However, from table 5.10 it appears that the social profile of single parents differs significantly between countries. The table compares the share of students from single-parent families

______________________________________________
Student Background 90
in families with a relatively low occupational status to the share of students from single-parent families in families with a relatively high occupational status. In a number of countries, the share of single-parent families is significantly higher in low-occupational status families. This is the case, among others, for the United States, Latvia, Sweden, Norway, and Denmark. In Austria, on the other hand, the share of single-parent families is larger in high-occupational status families than among low occupational status families. Other explanations are also possible. It is notable, however, that the effect of family structure remains in the great majority of countries when controlling for a number of other socio-economic factors: In this situation, the average negative score point effect on the mathematics scale of the family structure being single parent remains -11,4 for the 25 countries included in table 5.6.31 It is also notable that the provision of child care facilities for small children does not seem to be correlated to the significance of family structure for PISA achie-vement scores. This correlation could have been expected, since taking care of smaller children could prevent single parents from being supportive to larger children’s’ education. Statistical evidence on the provision of child care in the European Union is scant (Eurostat 2002, see also Abrahamson, Boje and Greve forthcoming), but on the basis of available information it can be noted that en-rolment rates in child care facilities of all types is larger in Denmark and Sweden than in Austria, for instance. Even so, the effect of family structure on student achievement scores is larger in these two countries than in Austria (Eurostat 2002: 8).
Possessions and Activities Related to “Classical Culture” Works of art, books of poetry, and the availability of classical literature in the homes of students, may be associated with stronger academic performance. Most likely this is not the case in the way that there is any direct causal linkage between these possessions and performance. However, possessions and activities related to “classical culture” may serve to stimulate the intellectual openness and curiosity of the student. PISA 2003 contains data that shows a relatively clear positive relationship be-tween performance scores and possessions and activities related to “classical culture”. Across countries, score point differences between the bottom quartile and the top quartile of students in relation to the index of cultural possessions in the family home range between 34 and 86 on the mathematics scale, with the largest positive differences being found in Hungary, Belgium, and Denmark, and relatively smaller differences being found in Ireland, Finland, and Iceland. Com-pared to the parents’ education and the students’ family structure, the variation
31 Arithmetic average of the score point difference associated with highest parents level of education for the 25 countries included in Table 4.6, when correcting for highest occupational status of parents, parents’ education, possessions related to classical culture, immigration status, and language spoken at home (cf. OECD 2004c: 385).

______________________________________________
Student Background 91
between countries as regards the significance of classical cultural activities and possessions is relatively small.
Table 5.11. Index of Classical Cultural Possessions and Performance on the PISA 2003 Mathematics Scale. Bottom quartile Top Quartile
Mean 95% Confidence Interval
Mean 95% Confidence Interval
Score Point Difference
Hungary 435 8,0 521 8,0 86 Belgium 497 8,4 579 5,5 82 Denmark 473 6,9 554 7,1 81 Sweden 467 7,3 545 7,6 78 France 469 8,2 545 7,3 76 Austria 476 8,4 550 7,4 74 Portugal 431 8,4 505 8,2 74 United States 450 7,8 523 7,3 73 Norway 456 7,1 528 7,4 72 Greece 406 9,4 477 10,8 71 Turkey 395 11,0 464 22,0 69 Germany 488 9,0 554 7,6 66 Korea 508 7,8 574 10,4 66 Luxembourg 468 5,5 534 5,5 66 EU average 471 1,9 531 1,7 60 Netherlands 518 10,0 578 8,2 60 Spain 453 6,7 513 6,3 60 Italy 435 7,8 491 8,6 56 Japan 507 10,2 563 11,4 56 Latvia 447 9,0 502 8,8 55 Czech Republic 492 7,6 546 7,4 54 Poland 459 8,2 512 7,6 53 Slovakia 468 11,4 519 6,3 51 HK China 528 11,8 579 13,1 51 Ireland 485 6,9 530 6,7 45 Finland 520 6,1 564 6,3 44 Iceland 491 6,7 525 7,4 34
Source: PISA 2003 dataset. Information on family structure based on students’ self reports While the advantages of cultural possessions are certainly related to other home background characteristics, their significance remains after controlling for a number of other socio-economic background factors. The significance of this factor is greater than that of the parents’ educational background, as each unit of the index of cultural possessions is associated with an average score difference of 16 for the 26 countries covered in table 5.11.32 32 Arithmetic average of the score point difference associated with highest parents level of education for the 26 countries included in Table 5.11, when controlling for highest occupational status of parents, parents educa-tion, single parent status, immigration status and language spoken at home (cf. OECD 2004c: 385).
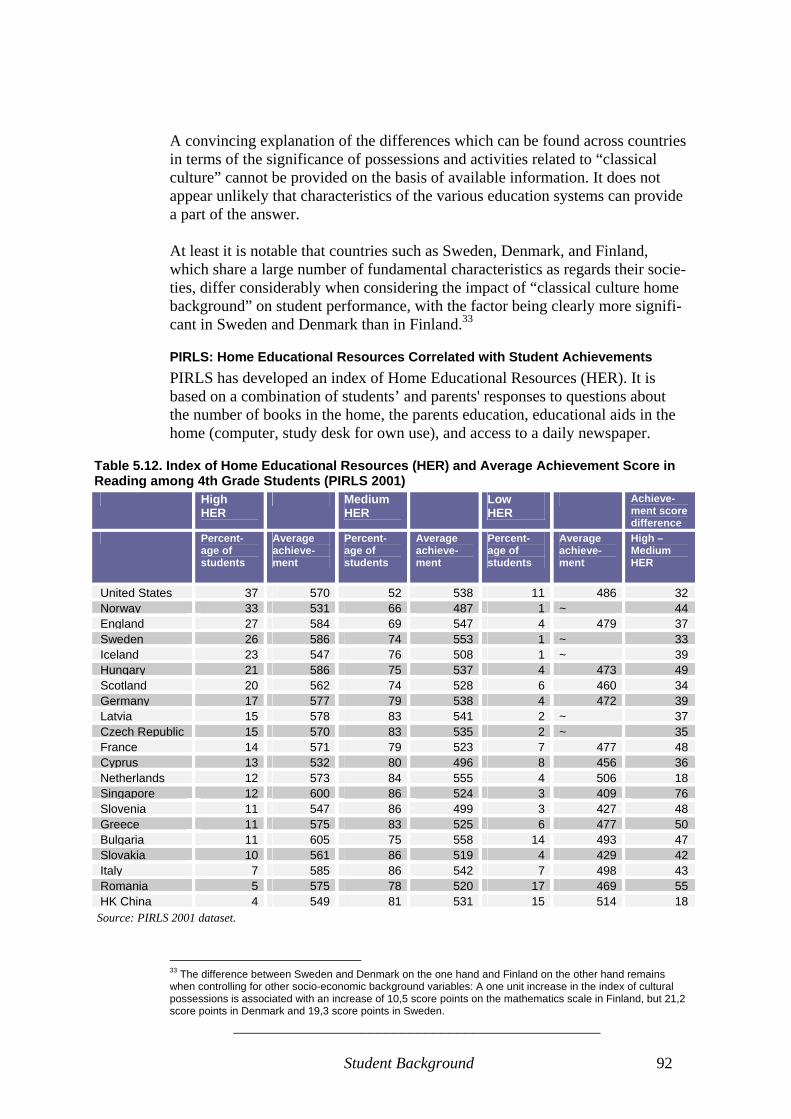
______________________________________________
Student Background 92
A convincing explanation of the differences which can be found across countries in terms of the significance of possessions and activities related to “classical culture” cannot be provided on the basis of available information. It does not appear unlikely that characteristics of the various education systems can provide a part of the answer. At least it is notable that countries such as Sweden, Denmark, and Finland, which share a large number of fundamental characteristics as regards their socie-ties, differ considerably when considering the impact of “classical culture home background” on student performance, with the factor being clearly more signifi-cant in Sweden and Denmark than in Finland.33
PIRLS: Home Educational Resources Correlated with Student Achievements PIRLS has developed an index of Home Educational Resources (HER). It is based on a combination of students’ and parents' responses to questions about the number of books in the home, the parents education, educational aids in the home (computer, study desk for own use), and access to a daily newspaper.
Table 5.12. Index of Home Educational Resources (HER) and Average Achievement Score in Reading among 4th Grade Students (PIRLS 2001) High
HER Medium
HER Low
HER Achieve-
ment score difference
Percent-age of students
Average achieve-ment
Percent-age of students
Average achieve-ment
Percent-age of students
Average achieve-ment
High – Medium HER
United States 37 570 52 538 11 486 32Norway 33 531 66 487 1 ~ 44England 27 584 69 547 4 479 37Sweden 26 586 74 553 1 ~ 33Iceland 23 547 76 508 1 ~ 39Hungary 21 586 75 537 4 473 49Scotland 20 562 74 528 6 460 34Germany 17 577 79 538 4 472 39Latvia 15 578 83 541 2 ~ 37Czech Republic 15 570 83 535 2 ~ 35France 14 571 79 523 7 477 48Cyprus 13 532 80 496 8 456 36Netherlands 12 573 84 555 4 506 18Singapore 12 600 86 524 3 409 76Slovenia 11 547 86 499 3 427 48Greece 11 575 83 525 6 477 50Bulgaria 11 605 75 558 14 493 47Slovakia 10 561 86 519 4 429 42Italy 7 585 86 542 7 498 43Romania 5 575 78 520 17 469 55HK China 4 549 81 531 15 514 18
Source: PIRLS 2001 dataset. 33 The difference between Sweden and Denmark on the one hand and Finland on the other hand remains when controlling for other socio-economic background variables: A one unit increase in the index of cultural possessions is associated with an increase of 10,5 score points on the mathematics scale in Finland, but 21,2 score points in Denmark and 19,3 score points in Sweden.
______________________________________________
Student Background 93
The data from PIRLS confirms the findings of PISA. There is a clear relation between a high index value of home educational resources and average reading scores. In most countries, only a small percentage of the students have low index values on the HER-index, so it may be more relevant to compare differences in students’ average score between the high and medium level on the HER index. When comparing high and medium levels of HER, there are differences between the countries as to the strength of the relation. In Norway and Sweden the dif-ference in average score of students with high HER values and students with medium HER values is 44 and 33 points, while in Greece and Singapore the dif-ferences are about 50 and 75 points respectively. Hong Kong China is a deviant case: Relatively many students from this country have medium (54 per cent) or low (30 per cent) HER index values, but the dif-ferences in average achievements scores are quite small. This suggests that schools manage to compensate for home educational resources to a great extent in providing students with reading skills. Other explanations are also possible, however.
PIRLS: Parents’ Levels of Support Influence Achievements Another aspect of the students’ family background is the extent to which parents actively prepare or support their children for learning processes. Parental support can be in the form of helping and motivating the students in doing their home-work as well as active participation in school-home cooperation activities. A high level of parent support could be expected to be positively correlated with students’ achievements as regards basic skills. In PIRLS, an index of Early Home Literacy Activities (EHLA) has been devel-oped, based on parents’ responses to questions about the frequency of the fol-lowing activities engaged in with their child prior to entry into primary school: Reading books, telling stories, singing songs, playing with alphabet toys, playing word games, etc. Table 5.13 illustrates that the level of EHLA has a significant influence on the achievements in reading in several countries. When comparing the average scores of students with high and low levels of EHLA, their differences are quite high in countries such as England (65 points), Norway (44 points), and Iceland (37 points).34 Comparing the countries, there are considerable differences as to the percentage of students with a high level of EHLA. In England most students (83 per cent) have a high index values on the EHLA-index. This is almost twice as much as among Norwegian students (47 per cent). 34 These findings are supported by multivariate analysis of data from PISA 2000 at the level of individual students (Fuchs and Wössmann 2004a): When holding the influence of a large number of other factors con-stant, students in schools whose principals reported that learning was strongly hindered by lack of parental support performed significantly worse in all subjects than students in schools where principals did not indicate this. The opposite was true for students in schools whose principals reported that learning was not at all hin-dered by lack of parental support.
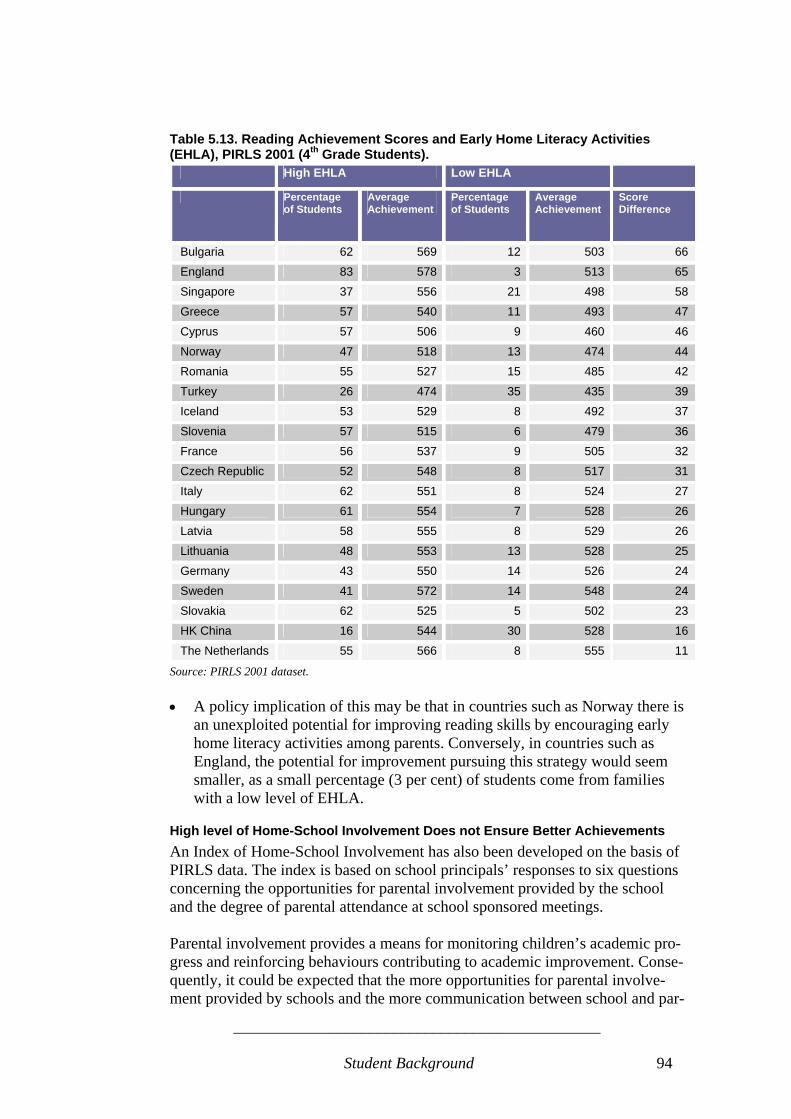
______________________________________________
Student Background 94
Table 5.13. Reading Achievement Scores and Early Home Literacy Activities (EHLA), PIRLS 2001 (4th Grade Students).
High EHLA Low EHLA
Percentage of Students
Average Achievement
Percentage of Students
Average Achievement
Score Difference
Bulgaria 62 569 12 503 66
England 83 578 3 513 65
Singapore 37 556 21 498 58
Greece 57 540 11 493 47
Cyprus 57 506 9 460 46
Norway 47 518 13 474 44
Romania 55 527 15 485 42
Turkey 26 474 35 435 39
Iceland 53 529 8 492 37
Slovenia 57 515 6 479 36
France 56 537 9 505 32
Czech Republic 52 548 8 517 31
Italy 62 551 8 524 27
Hungary 61 554 7 528 26
Latvia 58 555 8 529 26
Lithuania 48 553 13 528 25
Germany 43 550 14 526 24
Sweden 41 572 14 548 24
Slovakia 62 525 5 502 23
HK China 16 544 30 528 16
The Netherlands 55 566 8 555 11
Source: PIRLS 2001 dataset. • A policy implication of this may be that in countries such as Norway there is
an unexploited potential for improving reading skills by encouraging early home literacy activities among parents. Conversely, in countries such as England, the potential for improvement pursuing this strategy would seem smaller, as a small percentage (3 per cent) of students come from families with a low level of EHLA.
High level of Home-School Involvement Does not Ensure Better Achievements An Index of Home-School Involvement has also been developed on the basis of PIRLS data. The index is based on school principals’ responses to six questions concerning the opportunities for parental involvement provided by the school and the degree of parental attendance at school sponsored meetings. Parental involvement provides a means for monitoring children’s academic pro-gress and reinforcing behaviours contributing to academic improvement. Conse-quently, it could be expected that the more opportunities for parental involve-ment provided by schools and the more communication between school and par-
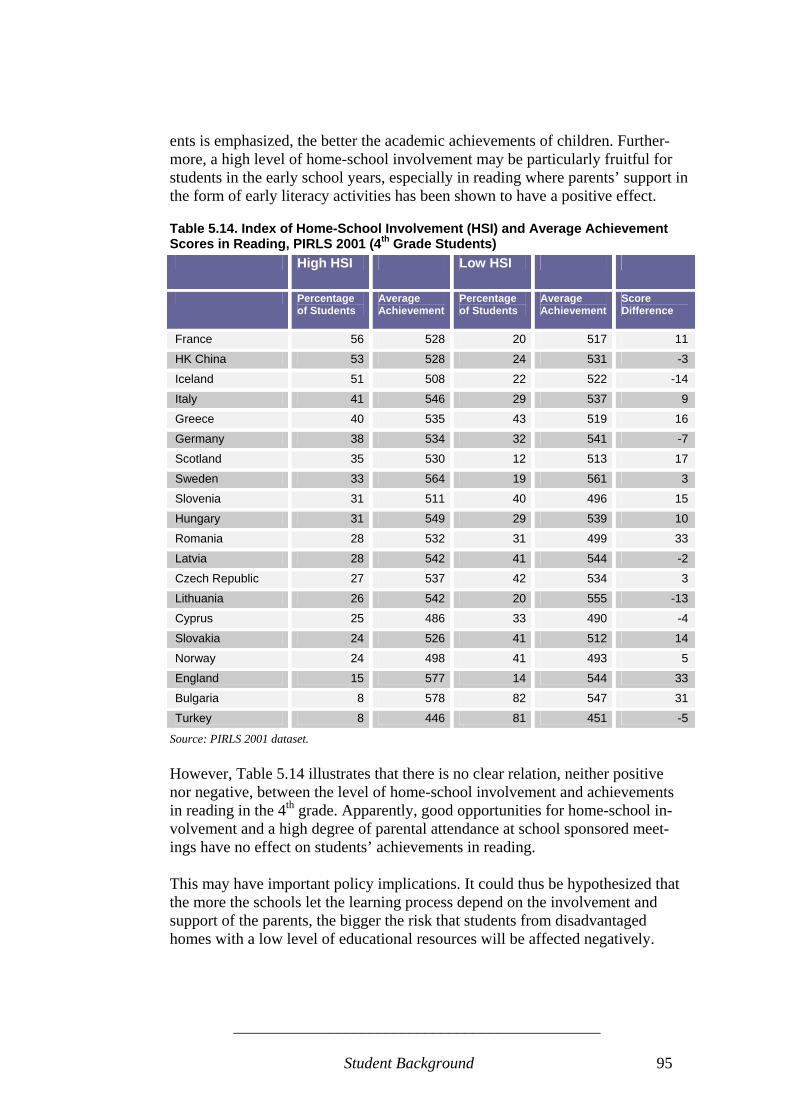
______________________________________________
Student Background 95
ents is emphasized, the better the academic achievements of children. Further-more, a high level of home-school involvement may be particularly fruitful for students in the early school years, especially in reading where parents’ support in the form of early literacy activities has been shown to have a positive effect.
Table 5.14. Index of Home-School Involvement (HSI) and Average Achievement Scores in Reading, PIRLS 2001 (4th Grade Students) High HSI Low HSI
Percentage of Students
Average Achievement
Percentage of Students
Average Achievement
Score Difference
France 56 528 20 517 11
HK China 53 528 24 531 -3
Iceland 51 508 22 522 -14
Italy 41 546 29 537 9
Greece 40 535 43 519 16
Germany 38 534 32 541 -7
Scotland 35 530 12 513 17
Sweden 33 564 19 561 3
Slovenia 31 511 40 496 15
Hungary 31 549 29 539 10
Romania 28 532 31 499 33
Latvia 28 542 41 544 -2
Czech Republic 27 537 42 534 3
Lithuania 26 542 20 555 -13
Cyprus 25 486 33 490 -4
Slovakia 24 526 41 512 14
Norway 24 498 41 493 5
England 15 577 14 544 33
Bulgaria 8 578 82 547 31
Turkey 8 446 81 451 -5
Source: PIRLS 2001 dataset. However, Table 5.14 illustrates that there is no clear relation, neither positive nor negative, between the level of home-school involvement and achievements in reading in the 4th grade. Apparently, good opportunities for home-school in-volvement and a high degree of parental attendance at school sponsored meet-ings have no effect on students’ achievements in reading. This may have important policy implications. It could thus be hypothesized that the more the schools let the learning process depend on the involvement and support of the parents, the bigger the risk that students from disadvantaged homes with a low level of educational resources will be affected negatively.
______________________________________________
Student Background 96
5.3. Gender and Basic Skills In recent decades, gender inequality has been an important political issue, with particular attention being paid to the disadvantages faced by females. As regards education, significant progress can be noted in several areas. Younger women today are far more likely to have completed a tertiary education than 30 years ago: In 18 of 30 comparable OECD countries, more than twice as many women aged 25 to 24 have completed tertiary education than women aged 55 to 64 years. University-level graduation rates for women now equal or exceed those for men in 21 of 27 OECD countries for which data are comparable. However, in mathematics and computer science, gender differences in tertiary qualifications remain persistently high: The proportion of women among univer-sity graduates in mathematics and computer science is only 30 per cent, on aver-age, among the OECD countries (OECD 2004a). What does the data tell us about gender differences in the acquisition of basic skills and on the performance of different education systems in providing gender equality? Table 5.15 shows the differences in average achievement scores be-tween male and female students in reading, mathematical, and science literacy in PISA 2003. It also shows the overall difference across domains. Negative values indicate that females have the best mean scores. Positive values indicate the op-posite. Low values (positive or negative) indicate a low degree of differences between males and females. In all the countries concerned, females achieve significantly higher average scores in reading than males. In many countries, the difference corresponds to half a proficiency level or more. In science and mathematics the opposite is true, even if the gender difference is smaller than with respect to reading and the gen-der difference is statistically significant for only a part of the included coun-tries.35 For science, this is the case for 8 of the 26 countries covered. For mathe-matical literacy, it is the case for 16 of the 26 countries. Overall, these results were also found in PISA 2000: Females performing significantly better than males in reading, and males performing somewhat better in some countries in science and mathematics. In the table, the aggregate measure in the first column illustrates that the Nether-lands is the country with the lowest differences between males and females across the domains, followed by Japan, Hong Kong China, and Hungary. For the other countries the differences are larger. In Iceland, males’ performance is weaker than females across all three skills domains.
35 These findings are supported by analysis of data from PISA 2000 at the level of individual students: Girls are found to be statistically significantly better readers and boys statistically significantly better in mathematics and science, even when holding the influence of a large number of other factors constant (Fuchs and Wöss-mann 2004a).

______________________________________________
Student Background 97
A conclusion which can be drawn from the table is that the largest share of the overall difference between males and females in each country in the three skills domains is accounted for by differences in reading, as girls are significantly bet-ter readers than boys. Table 5.15. Gender Difference in Average Scores (Male minus Female), PISA 2003. Accumulated
Absolute Dif-ference Across
Domains
Reading Science Math
Netherlands 31 -21 5 5 Japan 34 -22 4 8 HK China 39 -32 -3 4 Hungary 40 -31 -1 8 USA 43 -32 5 6 Belgium 45 -37 0 8 Latvia 46 -39 -4 3 Ireland 46 -29 2 15 France 47 -38 0 9 Turkey 48 -33 0 15 Sweden 49 -37 5 7 EU average 52 -35 5 11 Spain 52 -39 4 9 Czech Republic 52 -31 6 15 Poland 53 -40 7 6 Portugal 54 -36 6 12 Finland 57 -44 -6 7 Norway 57 -49 2 6 Austria 58 -47 -3 8 Denmark 59 -25 17 17 Germany 57 -42 6 9 Korea 62 -21 18 23 Italy 63 -39 6 18 Luxembourg 63 -33 13 17 Slovakia 67 -33 15 19 Greece 68 -37 12 19 Iceland 83 -58 -10 -15 Source: PISA 2003 dataset. Bold: Differences are statistically significant.36 Both the relative underperformance of boys in reading and the relative underper-formance of girls in mathematics and science should be considered a problem. The tendency for females to perform worse than males in mathematics and sci-ence in a number of countries should be considered a problem, as it corresponds to the aforementioned clear tendency for female under-representation in tertiary education in mathematics and science. The relative underperformance of boys in reading should be considered a problem, since good reading skills are a prereq-uisite for the acquisition of many other types of skills and competences.
36 A standardized difference between genders has been calculated for each country. This standardized differ-ence consists of the difference in mean score between males and females divided by the standard error of this difference. If the standardized difference falls outside the interval [-1.96; 1.96] the difference between genders is significant at the 95 per cent confidence level.

______________________________________________
Student Background 98
It can be noted that countries where significant development has been achieved as regards gender equality, for instance in terms of labour market participation, are not necessarily countries with the smallest gender differences in PISA basic skills performances. In 2003, Hungary had a female employment rate of 50,9 per cent among the 15-64 year-olds. In Denmark, the corresponding figure was 70,5 per cent (Eurostat 2005). But in terms of gender differences in basic skills among 15 year olds, differences were significantly larger in Denmark. Box 5.1 More Pronounced Gender Differences in Mathematics and Science at Higher Grade Levels The TIMSS 1995 survey revealed statistically significant gender differences in mathe-matics among fourth-grade students in only 3 out of 16 participating countries (Japan, Korea, and the Netherlands). In grade eight, there were statistically significant differ-ences in mathematics in 6 of the same 16 participating countries. Finally, in the last year of upper secondary schooling, gender differences in mathe-matical literacy were large and statistically significant in all participating countries ex-cept Hungary and the United States. All differences favoured males. A similar and even more pronounced picture emerged in science. The results suggest that gender differences in science and mathematics become more pronounced in many countries at higher grade levels. Sources: Beaton et al. 1996; Mullis et al. 1998; Mullis et al. 2000; OECD 2004c.
5.4. The Overall Significance of Student Background Based on PISA 2003 data, table 5.16 contains a combined analysis of the various socio-economic background factors, barring gender, that have been considered in this chapter. The table summarizes the degree to which various features of students’ home background are associated with mathematics performance on the PISA 2003 mathematics scale. The background factors that are considered are parental occupational status; parents’ level of education converted into years of schooling; possessions related to “classical culture”; family structure; students’ nationality and that of their parents; and the language spoken at home. These features tend to correlate to some extent. For this reason, the table shows the influence of the factors taken together and the variance in student perform-ance explained by each factor once the influence of the other factors has been accounted for: Unique variance is the variance explained by each factor in addi-tion to the variance explained by the other factors in the model. Common ex-plained variance is variance explained by more than one factor.
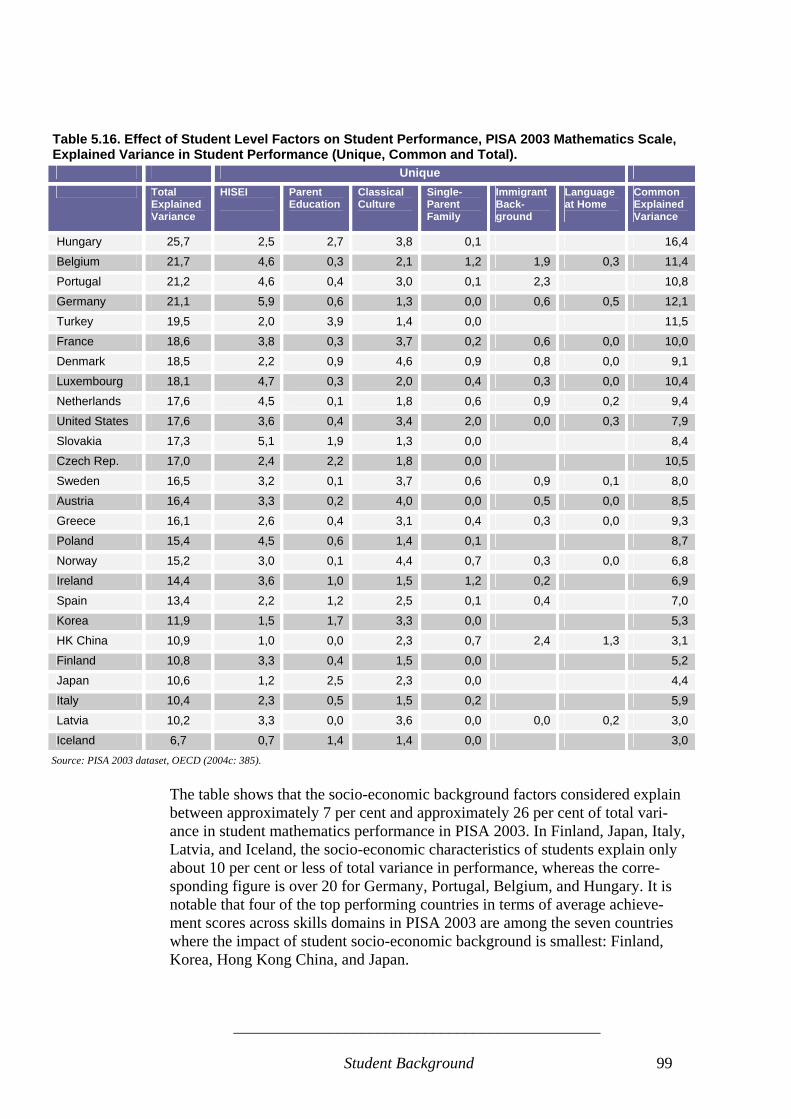
______________________________________________
Student Background 99
Table 5.16. Effect of Student Level Factors on Student Performance, PISA 2003 Mathematics Scale, Explained Variance in Student Performance (Unique, Common and Total). Unique Total
Explained Variance
HISEI
Parent Education
Classical Culture
Single-Parent Family
Immigrant Back-ground
Language at Home
Common Explained Variance
Hungary 25,7 2,5 2,7 3,8 0,1 16,4
Belgium 21,7 4,6 0,3 2,1 1,2 1,9 0,3 11,4
Portugal 21,2 4,6 0,4 3,0 0,1 2,3 10,8
Germany 21,1 5,9 0,6 1,3 0,0 0,6 0,5 12,1
Turkey 19,5 2,0 3,9 1,4 0,0 11,5
France 18,6 3,8 0,3 3,7 0,2 0,6 0,0 10,0
Denmark 18,5 2,2 0,9 4,6 0,9 0,8 0,0 9,1
Luxembourg 18,1 4,7 0,3 2,0 0,4 0,3 0,0 10,4
Netherlands 17,6 4,5 0,1 1,8 0,6 0,9 0,2 9,4
United States 17,6 3,6 0,4 3,4 2,0 0,0 0,3 7,9
Slovakia 17,3 5,1 1,9 1,3 0,0 8,4
Czech Rep. 17,0 2,4 2,2 1,8 0,0 10,5
Sweden 16,5 3,2 0,1 3,7 0,6 0,9 0,1 8,0
Austria 16,4 3,3 0,2 4,0 0,0 0,5 0,0 8,5
Greece 16,1 2,6 0,4 3,1 0,4 0,3 0,0 9,3
Poland 15,4 4,5 0,6 1,4 0,1 8,7
Norway 15,2 3,0 0,1 4,4 0,7 0,3 0,0 6,8
Ireland 14,4 3,6 1,0 1,5 1,2 0,2 6,9
Spain 13,4 2,2 1,2 2,5 0,1 0,4 7,0
Korea 11,9 1,5 1,7 3,3 0,0 5,3
HK China 10,9 1,0 0,0 2,3 0,7 2,4 1,3 3,1
Finland 10,8 3,3 0,4 1,5 0,0 5,2
Japan 10,6 1,2 2,5 2,3 0,0 4,4
Italy 10,4 2,3 0,5 1,5 0,2 5,9
Latvia 10,2 3,3 0,0 3,6 0,0 0,0 0,2 3,0
Iceland 6,7 0,7 1,4 1,4 0,0 3,0 Source: PISA 2003 dataset, OECD (2004c: 385).
The table shows that the socio-economic background factors considered explain between approximately 7 per cent and approximately 26 per cent of total vari-ance in student mathematics performance in PISA 2003. In Finland, Japan, Italy, Latvia, and Iceland, the socio-economic characteristics of students explain only about 10 per cent or less of total variance in performance, whereas the corre-sponding figure is over 20 for Germany, Portugal, Belgium, and Hungary. It is notable that four of the top performing countries in terms of average achieve-ment scores across skills domains in PISA 2003 are among the seven countries where the impact of student socio-economic background is smallest: Finland, Korea, Hong Kong China, and Japan.

______________________________________________
Student Background 100
One overall conclusion which can be formulated against the background of the information in the table is that there is no determinism in the relation between socio-economic background and academic performance. There is a significant relation between socio-economic background and performance, but the fact that this relation varies between countries suggests that factors that differ between countries affect the relation.
Table 5.17. Slope of the Socio-Economic Gradient, and Total Variance Explained, ECSC Index and PISA 2003 Mathematics Performance Score Point
Difference As-sociated with One Unit on the ECSC
95 % Confidence Interval
Explained Variance
95 % Confidence Interval
Belgium 55 3,3 24,1 2,5
Hungary 55 4,5 27,0 3,6
Slovakia 53 5,1 22,3 3,5
Czech Republic 51 4,1 19,5 2,9
Germany 47 3,3 22,8 2,9
Japan 46 8,0 11,6 3,4
Netherlands 45 4,7 18,6 3,3
Poland 45 3,5 16,7 2,5
Turkey 45 9,4 22,3 7,5
United States 45 3,1 19,0 2,3
Denmark 44 3,9 17,6 2,7
Norway 44 3,3 14,1 2,3 EU average 43 0,9 18,5 0,8 Austria 43 4,5 16,0 3,0
France 43 4,3 19,6 3,5
Sweden 42 4,1 15,3 2,6
Korea 41 6,1 14,2 3,8
Ireland 39 3,9 16,3 3,1
Latvia 38 4,5 10,5 2,6
Greece 37 4,3 15,9 3,8
Luxembourg 35 2,4 17,1 2,0
Italy 34 3,9 13,6 2,7
Finland 33 3,1 10,9 2,0
Spain 33 3,3 14,0 2,6
HK China 31 5,7 6,5 2,6
Portugal 29 2,4 17,5 2,8
Iceland 28 3,3 6,5 1,7 Source: Pisa 2003 dataset.
Another way to analyse this is to focus on how the socio-economic gradient dif-fers between countries (cf. OECD 2004c: 176-183). The socio-economic gradi-ent is defined as the line which is the best fitting line showing the association between academic performance as measured by the PISA 2003 mathematics

______________________________________________
Student Background 101
scale and socio-economic status in a bivariate plot diagram. In this analysis, a number of the above socio-economic background factors are thus combined into a single index which constitutes one variable in the bivariate regression analy-sis.37 For all of the countries analysed, the slope of the socio-economic gradient is positive, and for most countries the shape of the line is nearly a straight line. As mentioned above, the total variance explained also differs between countries.38 However, the upward slope of the line differs between countries: An increase in one unit of the ECSC-index results in an increase in score point performance on the mathematics scale of 55 points in Belgium and Hungary, but only around 30 score points in Finland, Spain, Hong Kong China, Portugal, and Iceland. Hun-gary, Belgium, and Germany, are countries where the socio-economic gradient is relatively steep and where the total variance explained by various socio-economic characteristics of students is relatively large, considering either the factors included in the ECSC index or the factors included in table 4.16. These results mirror those observed in PISA 2000 for mathematics (cf. OECD 2004c: 398). However, there are certain exceptions: The relationship between student performance and socio-economic background appears somewhat weaker in 2003 than in 2000 for the United States (with a score point difference associ-ated with a one unit change on the ECSC index of 50 in 2000 and 45 in 2003), and somewhat stronger in 2003 than in 2000 for Belgium and Italy (a score point difference associated with a one unit change on the ECSC index of 49 for Bel-gium in 2000 as opposed to 55 in 1993, and of 25 for Italy in 2000 as opposed to 34 in 2003). Characteristics of the educational systems of countries concerned is a prominent and likely possibility when trying to understand these differences. Other factors may also be of significance, however, for instance differences in broadly shared cultural values at the national level regarding school, education, and learning.
5.5. Policy Implications The agenda set by the European Union’s Lisbon Strategy points to improvement in educational performances as an important objective. Not least, this is the case for low-performing groups: In the context of the Lisbon Strategy, the objective is to increase the inclusiveness of the European societies while at the same time improving economic growth and competitiveness. One possible way forward in
37 The ESCS index includes HISEI (the Highest International Socio-Economic Index of Occupational Status) of the parents or guardians, the highest level of education of the parents converted into years of education, an index of educational resources in the home (students’ reports on having at their home a desk to study at, a room of their own, a quiet place to study, a computer they can use for school work, educational software, a link to the Internet, their own calculator, classic literature, books of poetry, works of art, books to help with their school work, and a dictionary), and the number of books at home. 38 The ECSC index differs somewhat from the factors included in the model behind Table 4.10. This explains the differences in the total variance explained in table 4.10 and 4.11.

______________________________________________
Student Background 102
this respect in the medium to long term is to improve the skills acquisition of disadvantaged groups of pupils and students.
Social Inclusiveness in Educational Systems Does not Lead to Lower Quality It has sometimes been argued that if school systems become more inclusive, then quality is bound to suffer. However, the evidence presented in this chapter does not support such a conclusion. On the contrary, the comparisons of the relation-ship between student performance and the various aspects of socio-economic background considered here suggest that for some of the best performing coun-tries in terms of average achievement scores (Finland, Hong Kong China, Japan, Korea), the socio-economic background of students matters the least. • The data contradicts a thesis that average student performance decreases as
the importance of socio-economic background of students decreases. Equal-ity in education outcomes irrespective of socio-economic background is not in conflict with a high quality of outcomes. It is a viable policy option to fo-cus on equity in performance outcomes and the same time strive for high av-erage performance outcomes.
School Systems can Indeed Adjust for Socio-Economic Background Existing national level research has tended to focus on the persistent significance of socio-economic background for academic results. In a longitudinal study tracking children’s vocabulary development, Hart and Risely (1995) found that growth trajectories for children from differing socio-economic backgrounds be-gin to differ at an early stage, and that when children enter school, the impact of socio-economic background on both cognitive skills and behaviour is already well established. Furthermore, research suggests that in the primary and lower secondary school years, children whose parents have low incomes and levels of education, or are unemployed or working in low-prestige occupations, are less likely to do well academically or to be engaged in curricular or extra-curricular school activities than children growing up in advantaged socio-economic con-texts (e.g. Datcher 1982; Finn and Rock 1997; Johnson et al. 2001; Voelkl 1995). While the results from PISA 2003 confirm that socio-economic background mat-ters, they also point to the possibility that the degree to which it matters can be affected by educational policies and by approaches focusing on providing all children, irrespective of background, with high quality education. This is re-flected in the fact that the degree to which socio-economic background matters differs significantly across countries. In focusing on increasing the compensatory efficiency of education systems for socio-economically disadvantaged groups, these results thus strike a more opti-mistic chord than analyses at the national level have frequently resulted in. • The data suggests that it is possible for educational policies and school sys-
tems to compensate for the learning disadvantages associated with a dis-advantaged socio-economic background. Evidently, other factors than educa-
______________________________________________
Student Background 103
tional policy and education systems may be of significance for the fact that a number of high-performing countries in terms of average PISA achievement scores are also countries where the socio-economic background of students influences performance the least. However, it is likely that educational sys-tems play an important role.
• In the EU, Belgium, Hungary, Slovakia, the Czech Republic, and Germany, may consider whether there are possibilities of adjusting educational struc-tures and systems with a view to increasing the ability of education systems to compensate for students’ socio-economic background, cf. table 4.16 above.
Not all Significant Socio-Economic Background Factors are Politically Relevant The analysis has demonstrated that several aspects of students’ socio-economic background are significant for achievement scores. Parents’ occupation and edu-cation are both important, as are possessions and activities related to classical culture. However, affecting these factors for disadvantaged parents with a view to improving the school performance of their children is not a policy option in the short to medium term, even though the data suggests that efforts to increase the educational attainment level of the adult population is a possibility which is likely to have positive effects on children’s academic performances in the long term.
Increasing the Support to Single-parent Families is Likely to Have Positive Effects However, for one of the factors which have been considered, namely family structure, policy reforms seem both relevant and likely to have some effect in the short to medium term. PISA 2000 and 2003 suggest that the academic perform-ance of children from families with a single parent is worse than that of children from other family structures. While the factor of family structure certainly inter-acts with other socio-economic background factors, this is a finding which is intuitively understandable, as the resources available from adults to assist chil-dren with their school work and other activities related to school and education are likely to be smaller in single-parent families than in other families. • Policy makers are well advised to consider whether sufficient support is pro-
vided within the framework of existing school and education systems for children of single-parent families. In the EU, this question is particularly relevant for Belgium, Ireland, the Netherlands, Denmark, Sweden, and Nor-way.
• It seems likely that relevant support to children from single-parent families is that which focuses on providing the kinds of assistance to children which it may frequently be difficult for single mothers or fathers to provide to a suffi-cient degree, for instance assistance with homework and with other school-related activities. Support may also, however, focus on assisting single par-ents in other ways, thereby freeing parent resources to assist their children.
Foreign Background Matters Less in Some Countries than in Others Students with a foreign background perform significantly worse than native stu-dents in many countries. This can be seen as a problem in its own right, calling

______________________________________________
Student Background 104
for political responses. Moreover, the analysis has revealed that there are signifi-cant differences across countries in the performance differences between stu-dents with a foreign background and native students, even when considering the socio-economic and language differences in the composition of the group of foreign students. • It appears that some countries are better than others in providing students
with adequate levels of skills, regardless of the students’ background in terms of nationality, ethnicity, and language. Policy makers are well advised to seek to learn from each other with respect to successful ways for promot-ing the provision of basic skills to students with a foreign background.More research is needed, however, as to the factors which can enable us to under-stand significant inter-country differences.
• We have noted how the PISA 2003 data suggests that French students with a foreign background perform relatively better than students with a foreign background in other countries, when adjusting for socio-economic back-ground and language background.
• For Belgium, Sweden, and the Netherlands, it is notable, in contrast, that students with a foreign background perform relatively poorly, even when ad-justing for socio-economic background and language background. Policy makers in these countries may consider whether enough is done to adjust for the disadvantages of foreign background in educational systems and at school level.
Diffusion of Non-Native Students Likely to be Important Policy Option Our analyses have identified significant differences in the average achievement scores of non-native students who attend schools with a high density of non-native students and non-native students who attend schools with a low density of non-native students. These differences are relatively large in a number of coun-tries where a large share of non-native students attends schools with a high den-sity of non-native students: Germany, Sweden, the Netherlands, Austria, and Denmark.39 This finding is also found in other studies relying on PISA data (Rangvid 2005 for Denmark and Skolverket 2003 for Norway and Sweden). The important policy implication is that there are likely to be significant benefits in considering ways to achieve a higher degree of dispersion of non-native stu-dents among schools: Non-native students in schools with a relatively low share of non-native students perform better on average than non-native students in schools with a relatively high share of non-native students. Taking into account the socio-economic background of non-native students does not change this con-clusion. • Policy makers should consider whether enough is done to ensure an adequate
dispersion of non-native students among schools. To the extent that a large share of non-native students is attending schools with a large share of non-
39 The finding may be relevant for other EU countries, but data has not been available for all countries.
______________________________________________
Student Background 105
native students, there are likely to be important benefits in terms of basic skills in a higher degree of dispersion of non-native students.
Skills of Students with Foreign Background would Benefit from Bilingual Tuition There is solid evidence from research that bilingual tuition and mother-tongue instruction affects the academic performances of students positively, where such instruction is relevant (e.g. Benson 2005; Krashen 1999; Krashen 1996; Skolverket 1993; Hakuta and Garcia 1989; Garcia 1988; Hakuta, 1986; Smith 1994; Verhoeven 1991; California State Department of Education 1981; 1986; Willig 1985; Wong-Fillmore and Valadez 1986; Appel 1984; Goodman, 1982). However, in the EU only a minority of Member States presently offer this possi-bility. In the 30 European countries covered in Eurydice (2004), only Estonia, Cyprus, Latvia, Finland, and Sweden are registered as offering bilingual tuition. This would seem to be a particularly large problem in countries where the differ-ence in student performance between native students and students with a foreign background is relatively large, regardless of whether differences are rooted in the socio-economic profile of students with a foreign background or not, and where a large share of students with a foreign background speaks a different language than the test language at home. • With a view to improving the level of basic skills possessed by students with
a foreign background, policy makers should consider improving the possi-bilities for bilingual tuition for students who are not proficient in the domi-nant or official language(s) of the country concerned.
• This possibility is particularly important for countries where there are large performance differences between native students and students with a foreign background, where many students with a foreign background speak a differ-ent language than the test language at home, and where bilingual tuition is not presently offered. Currently, these countries are Belgium, Germany, Aus-tria, the Netherlands, Denmark, and France. In these countries, improved possibilities for bilingual tuition are likely to positively affect skills levels of students with a foreign background.
Benefits in Focusing on Math and Science Performance of Girls In several of the countries covered, relative weaknesses in the performance of girls are found as regards mathematics and science. Taking into account the ten-dency to female under-representation in tertiary education in mathematics and science, there are potential benefits to be realized in focusing on these weak-nesses. • In Denmark, Italy, Luxembourg, Slovakia, and Greece, and to a lesser extent
in Ireland and the Czech Republic, there would seem to be potential benefits in increasing the focus on the performance of girls in the school system as regards mathematics and science. Various options are possible, for instance reviews of teaching material and instruction methods with a view to increas-ing subject attractiveness and learning efficiency in reading for girls.

______________________________________________
Student Background 106
Benefits in Focusing on the Reading Performance of Boys The relative underperformance of boys in reading should also be a matter of concern. Good reading skills must be seen as a prerequisite for the acquisition of a large number of other skills and competences. However, according to data from PISA 2003, boys perform significantly worse than girls in reading in all the countries studied, with the score point difference ranging between 21 and 58 score points. • In all the countries studied, there would seem to be potentials in increasing
the focus on the reading performance of boys in the school system. Teaching material and instruction methods could be reviewed with the objective of in-creasing the attractiveness of reading to boys.
______________________________________________
Attitudes and Behaviour 107
6. Student Attitudes and Behaviour and Basic Skills This chapter concerns the relationship between students’ academic performance on the one hand and student learner characteristics - learning behaviour and atti-tudes to learning – on the other hand. Due to the assumed connection between academic performance and approaches to learning, a relevant question in a pol-icy perspective is how schools can foster and strengthen positive learner charac-teristics. Positive learner characteristics can also be assumed to be important facilitators for life-long learning, and could hence be considered important in their own right. The review will primarily be based on the PISA survey, since TIMSS and PIRLS only to a limited degree contain information about learner characteristics. As the focus of PISA 2000 and 2003 is on reading and mathematical literacy, it is also these two academic domains which are included in this review. A study relating learner characteristics to scientific literacy performance has to await the results of PISA 2006. However, data from PISA 2000 and 2003 indicates that the relation between the different learner characteristics and academic perform-ance is relatively uniform across subject areas. The PISA approach is designed to illuminate the relation between learner char-acteristics and academic performance. Evidence from earlier research on this topic has played an important role in framing the PISA approach: Both in estab-lishing which learner characteristics are important, and in terms of developing accurate measures of these. The learner characteristics in PISA 2000 and 2003 can be grouped under five broad headings: Motivation, self-related beliefs, learning situations, emotional factors, and control strategies. Table 5.1 below illustrates the indicators of learner characteristics grouped under each heading. Each of the student characteristics is illuminated by the students’ answers on a series of related question items. These questions were presented to the student in a separate student questionnaire. The questions were selected from larger con-structs on the basis of theoretical considerations and previous research. Struc-tural equation modelling was used to confirm the theoretically expected behav-iour of the indices and to validate their comparability across countries. In order to create a single measure of each student characteristic, several indices have been created. The index values range from -2.5 and +2.5. Indices are con-structed so that the average score across OECD countries is 0 and two-thirds score between the values 1 and -1. A positive value on the index indicates a score higher than the OECD average and a negative value indicates the opposite.

______________________________________________
Attitudes and Behaviour 108
Table 6.1: Selected Student Characteristics
Heading Indicators
Motivation • Interest in and enjoyment • Instrumental motivation • Attitudes towards school
• Sense of belonging at school
Self-related beliefs • Self-concept • Self-efficacy
Learning Strategies • Elaboration Strategies • Control strategies • Memorisation strategies
Learning Situations • Competitive learning • Co-operative learning
Emotional Factors • Anxiety
In order to interpret the results of the analysis, two methodological aspects should be taken into consideration (OECD, 2003): • The student characteristics are based on student self-reports and not on direct
observation of their learning behaviour. Although students’ views on how they see themselves might be a good indicator of their actual learning behav-iour, this is not necessarily so.
• The students’ responses to the questionnaire items on which the indices are based may vary across countries, as the answers may reflect a specific cul-tural setting. Therefore cross-country comparisons of a number of student characteristics can be problematic.
In order to analyze the relation between student characteristics and academic performance, bivariate correlation analyses are carried out on the relation be-tween student characteristics and academic performance in reading literacy and mathematical literacy, treating academic performance as the dependent variable and the student characteristic as the independent variable. The results of the bivariate correlation analysis are presented in a series of tables in the sections below. Box 6.1 explains how to read these tables. Although evidence of statistical relationships between various student character-istics and academic performance may be found, the question about causality re-mains difficult to answer. The existence of specific student characteristics and academic performance can for example be mutually reinforcing or both variables can be impacted by other factors.
______________________________________________
Attitudes and Behaviour 109
Box 6.1 How to read the tables of this section • The first column shows the score of each country on the various indices. The
index value 0 represents the OECD average. Positive values indicate scores above the OECD average, whereas negative values indicate the opposite. This means that negative values in an index do not necessarily imply that students re-sponded negatively to the underlying questions. A negative value merely indi-cates that the students responded less positively that the average. Finally, it should be noted that it is not possible to compare index values from different indi-ces, and tht comparisons of index values across countries as regards a single in-dex can in some cases be difficult.
• The second column shows the average increase in the dependent variable (per-formance score) when the index values are increased by one index point. An in-crease of one index point on the scale of interest in reading corresponds, for ex-ample, on average across OECD countries, to 28 score points on the reading per-formance scale.
• The second column shows the explained degree of variance in the dependent variable which can be explained by the independent variables. An explained vari-ance of 0 indicates a lack of statistical connection between the dependent and the independent variables.
6.1. Motivational Factors Motivation is often considered the driving force behind learning. PISA includes four motivational factors, whereas TIMSS and PIRLS only include one motiva-tional factor. The motivational factors are: • Intrinsic motivation, which can be described as the students’ interest in and
enjoyment of a specific subject area. Intrinsic motivation is covered in the PISA 2000 (reading) and PISA 2003 (mathematics) surveys. Although the question items used to measure intrinsic motivation differ, both clusters of question items should be reliable measures of intrinsic motivation.
• Extrinsic motivation, which best can be described as instrumental motivation in a subject area. Extrinsic motivation is covered in the PISA 2000, PISA 2003, and TIMSS 2003 surveys. Students were asked to what extent they are encouraged to learn by external rewards such as good job prospects etc. Again, the question items used differ in the surveys. It should be noted that the questionnaire items used in PISA 2000 focus on students’ instrumental approach to schooling in general. In contrast, the questionnaire items used in PISA 2003 as well as in TIMSS focus on students’ instrumental approach to mathematics.
• Attitudes toward school. This dimension is only included in the PISA 2003 survey. Students were asked to think about what they had learned at school in relation to how the school had prepared them for adult life: Whether the school has given them confidence to make decisions, taught them things that could be useful in their job, or been a waste of time.
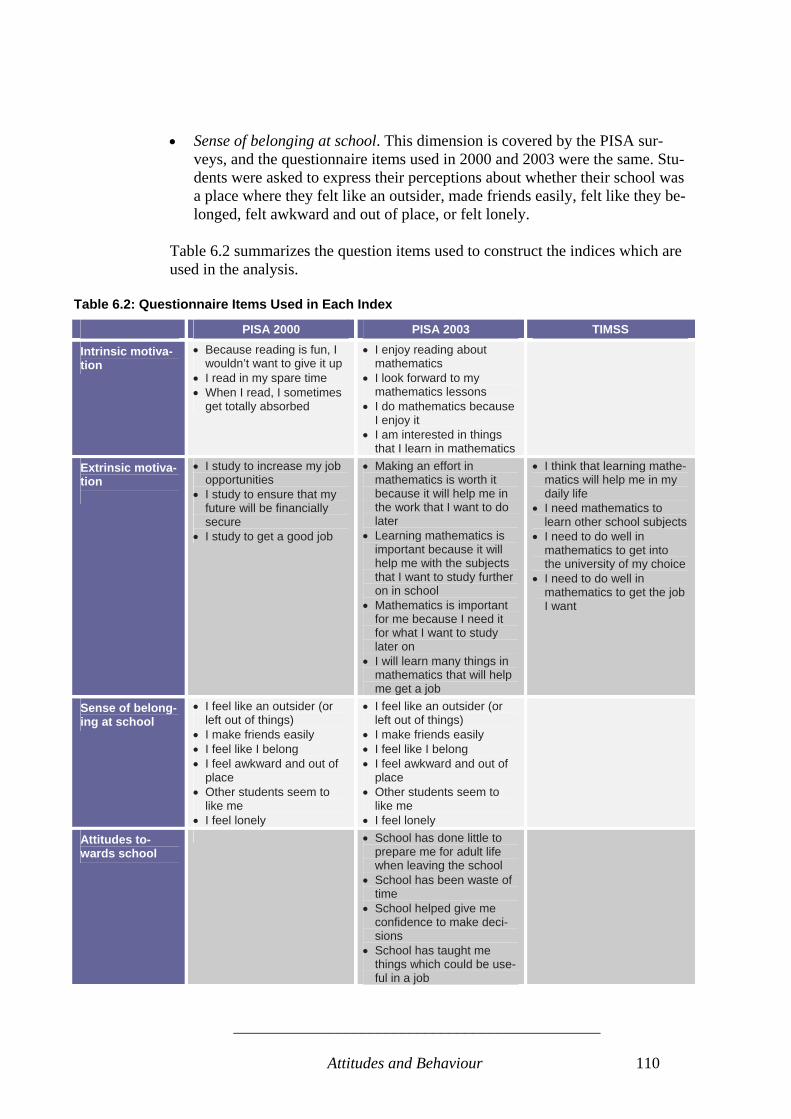
______________________________________________
Attitudes and Behaviour 110
• Sense of belonging at school. This dimension is covered by the PISA sur-veys, and the questionnaire items used in 2000 and 2003 were the same. Stu-dents were asked to express their perceptions about whether their school was a place where they felt like an outsider, made friends easily, felt like they be-longed, felt awkward and out of place, or felt lonely.
Table 6.2 summarizes the question items used to construct the indices which are used in the analysis.
Table 6.2: Questionnaire Items Used in Each Index
PISA 2000 PISA 2003 TIMSS
Intrinsic motiva-tion
• Because reading is fun, I wouldn’t want to give it up
• I read in my spare time • When I read, I sometimes
get totally absorbed
• I enjoy reading about mathematics
• I look forward to my mathematics lessons
• I do mathematics because I enjoy it
• I am interested in things that I learn in mathematics
Extrinsic motiva-tion
• I study to increase my job opportunities
• I study to ensure that my future will be financially secure
• I study to get a good job
• Making an effort in mathematics is worth it because it will help me in the work that I want to do later
• Learning mathematics is important because it will help me with the subjects that I want to study further on in school
• Mathematics is important for me because I need it for what I want to study later on
• I will learn many things in mathematics that will help me get a job
• I think that learning mathe-matics will help me in my daily life
• I need mathematics to learn other school subjects
• I need to do well in mathematics to get into the university of my choice
• I need to do well in mathematics to get the job I want
Sense of belong-ing at school
• I feel like an outsider (or left out of things)
• I make friends easily • I feel like I belong • I feel awkward and out of
place • Other students seem to
like me • I feel lonely
• I feel like an outsider (or left out of things)
• I make friends easily • I feel like I belong • I feel awkward and out of
place • Other students seem to
like me • I feel lonely
Attitudes to-wards school
• School has done little to prepare me for adult life when leaving the school
• School has been waste of time
• School helped give me confidence to make deci-sions
• School has taught me things which could be use-ful in a job
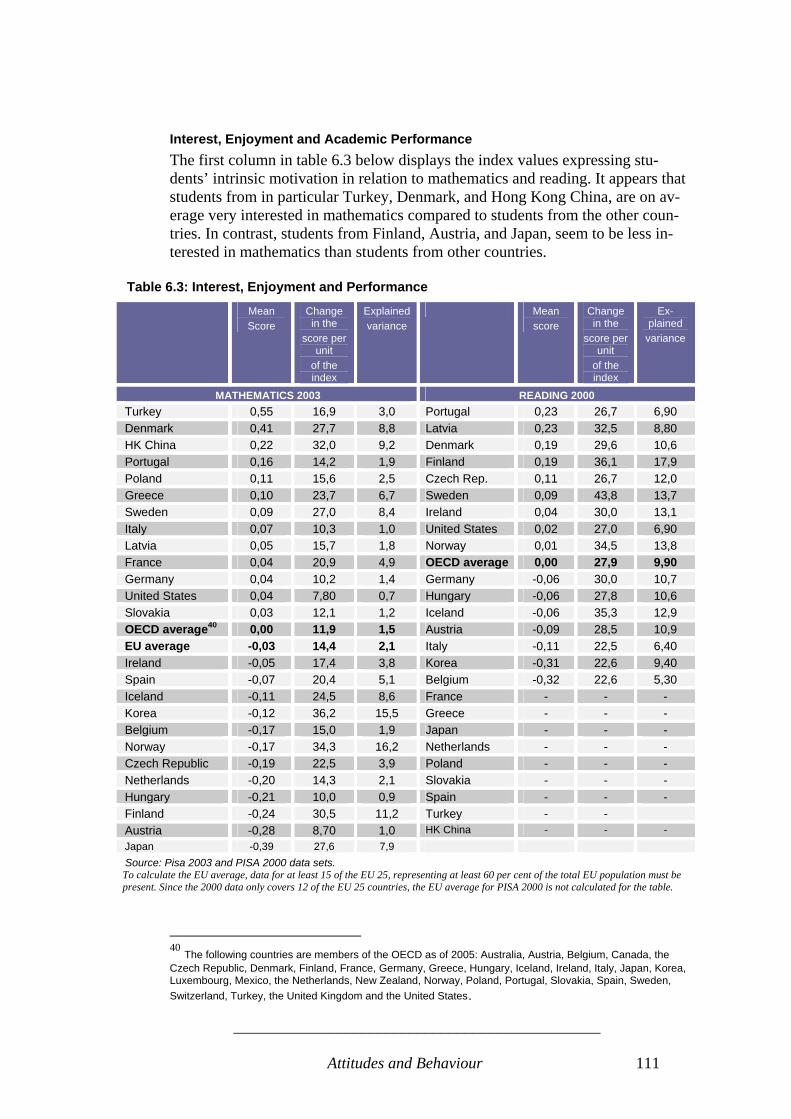
______________________________________________
Attitudes and Behaviour 111
Interest, Enjoyment and Academic Performance The first column in table 6.3 below displays the index values expressing stu-dents’ intrinsic motivation in relation to mathematics and reading. It appears that students from in particular Turkey, Denmark, and Hong Kong China, are on av-erage very interested in mathematics compared to students from the other coun-tries. In contrast, students from Finland, Austria, and Japan, seem to be less in-terested in mathematics than students from other countries.
Table 6.3: Interest, Enjoyment and Performance
Mean Score
Change in the
score per unit
of the index
Explained variance
Mean score
Change in the
score per unit
of the index
Ex-plained
variance
MATHEMATICS 2003 READING 2000 Turkey 0,55 16,9 3,0 Portugal 0,23 26,7 6,90 Denmark 0,41 27,7 8,8 Latvia 0,23 32,5 8,80 HK China 0,22 32,0 9,2 Denmark 0,19 29,6 10,6 Portugal 0,16 14,2 1,9 Finland 0,19 36,1 17,9 Poland 0,11 15,6 2,5 Czech Rep. 0,11 26,7 12,0 Greece 0,10 23,7 6,7 Sweden 0,09 43,8 13,7 Sweden 0,09 27,0 8,4 Ireland 0,04 30,0 13,1 Italy 0,07 10,3 1,0 United States 0,02 27,0 6,90 Latvia 0,05 15,7 1,8 Norway 0,01 34,5 13,8 France 0,04 20,9 4,9 OECD average 0,00 27,9 9,90 Germany 0,04 10,2 1,4 Germany -0,06 30,0 10,7 United States 0,04 7,80 0,7 Hungary -0,06 27,8 10,6 Slovakia 0,03 12,1 1,2 Iceland -0,06 35,3 12,9 OECD average40 0,00 11,9 1,5 Austria -0,09 28,5 10,9 EU average -0,03 14,4 2,1 Italy -0,11 22,5 6,40 Ireland -0,05 17,4 3,8 Korea -0,31 22,6 9,40 Spain -0,07 20,4 5,1 Belgium -0,32 22,6 5,30 Iceland -0,11 24,5 8,6 France - - - Korea -0,12 36,2 15,5 Greece - - - Belgium -0,17 15,0 1,9 Japan - - - Norway -0,17 34,3 16,2 Netherlands - - - Czech Republic -0,19 22,5 3,9 Poland - - - Netherlands -0,20 14,3 2,1 Slovakia - - - Hungary -0,21 10,0 0,9 Spain - - - Finland -0,24 30,5 11,2 Turkey - - Austria -0,28 8,70 1,0 HK China - - - Japan -0,39 27,6 7,9 Source: Pisa 2003 and PISA 2000 data sets. To calculate the EU average, data for at least 15 of the EU 25, representing at least 60 per cent of the total EU population must be present. Since the 2000 data only covers 12 of the EU 25 countries, the EU average for PISA 2000 is not calculated for the table.
40 The following countries are members of the OECD as of 2005: Australia, Austria, Belgium, Canada, the Czech Republic, Denmark, Finland, France, Germany, Greece, Hungary, Iceland, Ireland, Italy, Japan, Korea, Luxembourg, Mexico, the Netherlands, New Zealand, Norway, Poland, Portugal, Slovakia, Spain, Sweden, Switzerland, Turkey, the United Kingdom and the United States.

______________________________________________
Attitudes and Behaviour 112
As regard interest in and enjoyment of reading, students from Portugal, Latvia, Denmark, and Finland, have the highest index scores, whereas students from in particular Korea and Belgium have low scores. Comparing reading and mathematics, the table - with notable exceptions – shows that countries with index scores above the OECD average in reading also tend to have scores above the OECD average in mathematics. This observation points to the thesis that certain structural characteristics influence the students’ level of interest and enjoyment across subject fields. System- or school-related factors may be elements of such structural characteristics. There appears to be an association between the level of intrinsic student motiva-tion and academic performance. The second column in table 5.3 shows that an increase of one index point on the scale of interest in mathematics corresponds, on average across OECD countries, to an increase of 11,9 score points on the mathematics performance scale. Data from PISA 2000 confirms this result as regards reading literacy. Interest in reading is even more strongly linked to reading literacy performance. An in-crease of one index point on the scale of interest in reading corresponds, on av-erage across OECD countries, to 28 score points on the reading performance scale, which is about half a proficiency level. • One observation is that countries with more interested students do not neces-
sarily achieve better average achievement scores than countries with less in-terested students. Students from Japan and Finland, for example, have rela-tively low levels of interest in mathematics, although students from these countries achieve some of the highest mean achievement scores in mathemat-ics. As regards reading, Korean students in 2000 reported an interest in read-ing which was well below the OECD average. At the same time, the country had the second highest average achievement score.
Although countries with more interested students do not necessarily achieve better average achievement scores than countries with less interested students, students with greater interest in a subject domain tend to achieve better results compared to students with lesser interest in the given domain.
Extrinsic Motivation and Performance Table 6.4 shows that students from in particular Denmark but also Iceland, Por-tugal, and Turkey, have an above average instrumental approach to learning mathematics. This is far less pronounced in Japan, Austria, Korea, and Belgium, which are the countries with the lowest index values. There are important similarities between the countries’ rank as regards the index of intrinsic motivation and the index of extrinsic (instrumental) motivation. For both indices, students from Japan, Austria, Finland, Hungary, and the Nether-lands, achieve comparatively low index scores, whereas students from Turkey,

______________________________________________
Attitudes and Behaviour 113
Denmark, and Portugal, have replied in ways that result in relatively high index scores. Also instrumental motivation seems to be positively correlated with reading lit-eracy performance, although the relationship is weaker than was the case with intrinsic motivation. An increase of one index point on the scale of instrumental motivation in mathematics corresponds, on average across OECD countries, to 8,5 score points on the mathematical performance scale. The corresponding fig-ure as regards reading is 3,1 score points.
Table 6.4: Instrumental Motivation
Mean Score
Change in the
score per unit
of the index
Explained variance
Mean Score
Change in the score
per unit of the index
Ex-plained
variance
MATHEMATICS 2003 Reading 2000 Denmark 0,37 20,9 4,3 Hungary 0,45 3,50 0,12 Iceland 0,31 17,7 4,0 Sweden 0,31 10,55 1,28 Portugal 0,27 17,3 3,5 Portugal 0,29 19,00 3,34 Turkey 0,23 12,9 1,5 Bulgaria 0,23 7,41 0,56 United States 0,17 13,6 2,0 Austria 0,21 -4,72 0,26 Norway 0,15 28,5 10,1 United Kingdom 0,16 13,98 1,80 Ireland 0,10 7,7 0,7 Romania 0,16 -0,10 0,00 Latvia 0,07 19,7 3,6 Luxemburg 0,13 11,16 1,52 Finland 0,06 26,9 8,5 EU average 0,09 3,79 0,14 Poland 0,04 17,0 2,4 Czech Rep. 0,08 6,12 0,44 Sweden 0,02 23 5,3 Germany 0,07 -3,63 0,13 Czech Republic 0,01 10,7 1,0 Latvia 0,06 30,35 6,23 OECD average 0,00 8,5 0,7 Island 0,04 10,50 1,36 Germany -0,04 1,1 0,0 Belgium 0,02 -1,39 0,02 EU average -0,05 10,2 1,1 OECD average 0,00 3,10 0,10 Greece -0,05 14,9 2,6 Finland -0,02 21,66 4,38 Slovakia -0,05 6,3 0,3 Norway -0,07 24,08 5,30 Spain -0,05 19,4 5,1 Netherlands -0,08 -7,36 0,60 France -0,08 13,7 2,4 Denmark -0,08 4,10 0,15 Hungary -0,11 7,9 0,5 Ireland -0,11 5,00 0,39 HK China -0,12 25,9 4,9 Italy -0,13 -5,72 0,45 Italy -0,15 8,5 0,7 HK China -0,18 9,80 1,38 Netherlands -0,26 6,1 0,4 Korea -0,42 10,38 2,07 Belgium -0,32 11,0 1,1 United States -0,42 -0,48 0,00 Korea -0,44 32,8 12,0 Austria -0,49 -3,7 0,2 Japan -0,66 23,9 6,2
Source: Pisa 2003 and PISA 2000 data sets. Looking behind the average figure, the strength of the relation between intrinsic and extrinsic motivation on the one hand and academic performance on the other hand differs across countries. The strongest relations for both types of motiva-tion are to be found in countries as different as Denmark, Finland, Sweden, and Norway on the one hand, and on the other hand Japan, Korea, and Hong Kong

______________________________________________
Attitudes and Behaviour 114
China. The causal nature of the relationship between reading and mathematical literacy performance on the one hand and interest in the subjects on the other may well be complex and is difficult to discern. Interest in the subject and per-formance may be mutually reinforcing and may also be affected by other factors, such as the social backgrounds of students and the socio-economic composition of schools’ pupils.
Sense of Belonging to a School The third of the motivational factors is the students’ sense of belonging to their schools. Table 6.5 shows the countries’ rank on the index of sense of belonging to a school.
Table 6.5: Sense of Belonging Mean
score Change in the score
per unit of the index
Ex-plained
variance
Mean Score
Change in the
score per unit
of the index
Explained variance
MATHEMATICS 2003 READING 2000 Austria 0,44 2,9 0,1 Sweden 0,27 -2,09 0,06Sweden 0,25 0,3 0,0 Austria 0,26 5,10 0,36Germany 0,24 -1,4 0,0 Germany 0,18 8,33 0,66Norway 0,24 0,1 0,0 Hungary 0,14 16,82 3,10Spain 0,20 2,4 0,1 Island 0,14 2,06 0,06Iceland 0,16 0,5 0,0 Denmark 0,13 5,79 0,39Portugal 0,09 15,7 2,8 Great Britain 0,13 6,26 0,41Hungary 0,08 10,0 1,1 Norway 0,12 6,58 0,45Ireland 0,08 -5,2 0,4 Ireland 0,08 -0,21 0,00Italy 0,05 -3,7 0,1 Luxemburg 0,05 16,64 3,80Greece 0,04 5,8 0,3 Finland 0,02 -2,54 0,08EU average 0,02 2,7 0,1 Portugal 0,01 29,41 7,29Denmark 0,01 3,1 0,1 Romania 0,01 12,12 1,30OECD average 0,00 3,5 0,1 OECD average 0,00 7,90 0,60Finland -0,02 -1,9 0,0 Italy 0,00 -0,74 0,01Netherlands -0,06 7,0 0,4 EU average -0,01 10,07 1,00Slovakia -0,16 3,1 0,1 Spain -0,01 5,37 0,34Poland -0,17 7,7 0,6 Netherlands -0,01 13,60 1,67France -0,18 1,2 0,0 Greece -0,02 11,15 1,20Latvia -0,21 13,1 1,5 United States -0,06 12,83 1,89Czech Republic -0,27 12,7 1,3 France -0,14 5,70 0,35Belgium -0,28 6,3 0,3 Bulgaria -0,19 24,91 4,54Korea -0,39 11,1 1,0 Belgium -0,21 9,83 0,71Turkey -0,44 21,0 3,1 Czech Republic -0,29 19,28 2,44Japan -0,53 12,9 1,3 Japan -0,35 8,35 0,75HK China -0,61 16,3 1,3 Latvia -0,36 16,65 1,70United States M M M Korea -0,39 9,42 1,21 Poland -0,39 21,44 3,47 HK China -0,42 12,87 1,28Source: Pisa 2003 and PISA 2000 data sets.
The countries with the highest score on the index are Austria, Sweden, Germany, Norway, Spain, and Iceland. The index scores of these countries are significantly above the OECD average. In contrast, the lowest ranking countries are Belgium, Korea, Turkey, Japan, and Hong Kong China.
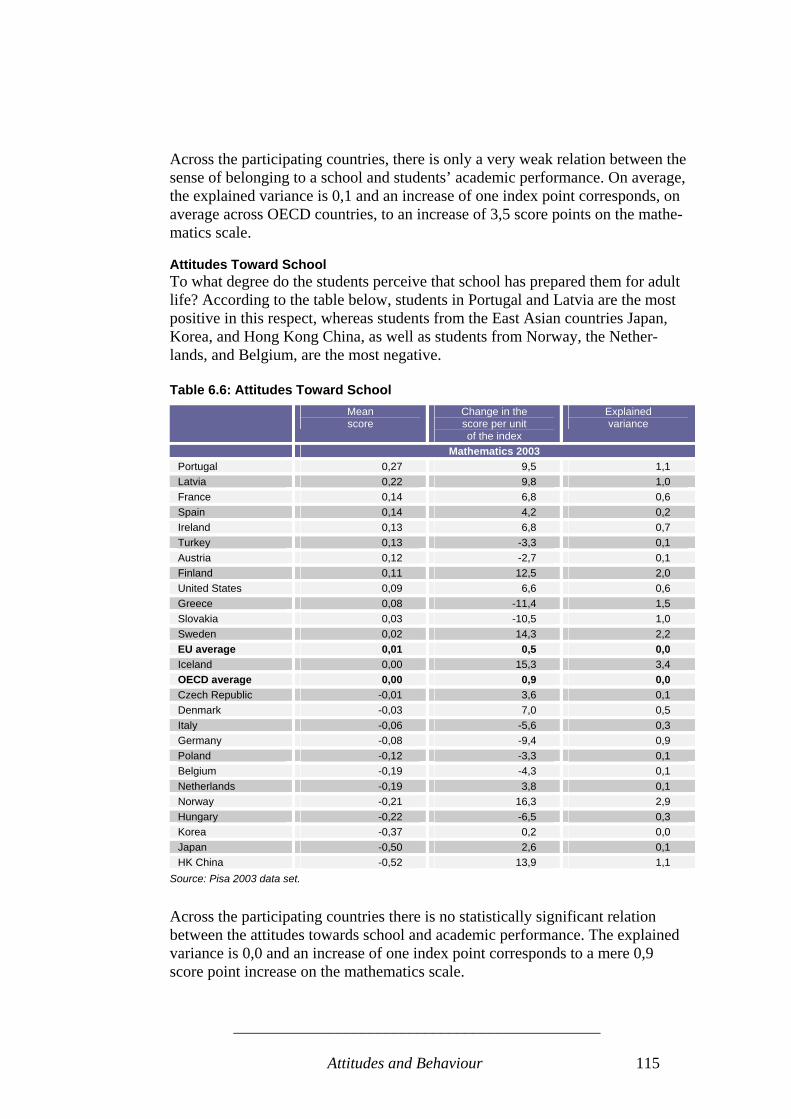
______________________________________________
Attitudes and Behaviour 115
Across the participating countries, there is only a very weak relation between the sense of belonging to a school and students’ academic performance. On average, the explained variance is 0,1 and an increase of one index point corresponds, on average across OECD countries, to an increase of 3,5 score points on the mathe-matics scale. Attitudes Toward School To what degree do the students perceive that school has prepared them for adult life? According to the table below, students in Portugal and Latvia are the most positive in this respect, whereas students from the East Asian countries Japan, Korea, and Hong Kong China, as well as students from Norway, the Nether-lands, and Belgium, are the most negative. Table 6.6: Attitudes Toward School
Mean score
Change in the score per unit of the index
Explained variance
Mathematics 2003 Portugal 0,27 9,5 1,1 Latvia 0,22 9,8 1,0 France 0,14 6,8 0,6 Spain 0,14 4,2 0,2 Ireland 0,13 6,8 0,7 Turkey 0,13 -3,3 0,1 Austria 0,12 -2,7 0,1 Finland 0,11 12,5 2,0 United States 0,09 6,6 0,6 Greece 0,08 -11,4 1,5 Slovakia 0,03 -10,5 1,0 Sweden 0,02 14,3 2,2 EU average 0,01 0,5 0,0 Iceland 0,00 15,3 3,4 OECD average 0,00 0,9 0,0 Czech Republic -0,01 3,6 0,1 Denmark -0,03 7,0 0,5 Italy -0,06 -5,6 0,3 Germany -0,08 -9,4 0,9 Poland -0,12 -3,3 0,1 Belgium -0,19 -4,3 0,1 Netherlands -0,19 3,8 0,1 Norway -0,21 16,3 2,9 Hungary -0,22 -6,5 0,3 Korea -0,37 0,2 0,0 Japan -0,50 2,6 0,1 HK China -0,52 13,9 1,1
Source: Pisa 2003 data set. Across the participating countries there is no statistically significant relation between the attitudes towards school and academic performance. The explained variance is 0,0 and an increase of one index point corresponds to a mere 0,9 score point increase on the mathematics scale.

______________________________________________
Attitudes and Behaviour 116
Below-Average Student Motivation in East Asia It is noticeable from the above observations that on average, students from the East Asian countries, in particular Japan, score below average in relation to both intrinsic and extrinsic motivation, students’ sense of belonging to their school, and students attitudes as regards the degree to which school has prepared them for adult life. At the same time, the students of the East Asian countries on aver-age perform very well in the PISA mathematics, reading, and science tests, cf. Table 4.1. • As we shall return to, it thus appears that the East Asian approach to learn-
ing, which stresses competition and intensive testing, is connected with a number of costs concerning students’ motivation and attitudes. Whereas these costs do not materialize in the form of weak PISA test results, it may be that there are some longer-term costs, for instance in relation to attitudes towards lifelong learning in later life.
• Policy makers in the European Union should be aware of the possible costs of adopting reform paths which stress increased student competition and in-tensified testing of students. While such an approach may contribute to the improvement of test scores in tests such as PISA, there may be more impor-tant longer term costs in the form of more negative attitudes towards learning among adults.
6.2. Self-Related Beliefs Learners have their own perceptions of their competences and learning charac-teristics. These perceptions influence broad aspects of their approach to learning. Two ways of defining these perceptions are: • Self-concept: Students’ belief in their own abilities. • Self-efficacy: How well students think that they can handle even difficult
tasks. These two constructs are closely associated with one another, but nonetheless distinct. Self-related beliefs are sometimes referred to in terms of self-confi-dence, indicating that such beliefs are positive. In both cases, confidence in one-self has important benefits for motivation and for the way in which students ap-proach learning tasks. • Self-concept in reading and mathematics. This dimension is covered in PISA
2000, PISA 2003, and TIMSS 2003. Students were asked about their belief in their own reading and mathematical competence, but the question items differ across studies. Belief in one’s own abilities is highly relevant to suc-cessful learning, as well as being a goal in its own right.
• Self-efficacy in reading and mathematics. This dimension is included in PISA 2000 (reading) and PISA 2003 (mathematics). The PISA index of self-efficacy in mathematics was derived from students’ reported level of confi-
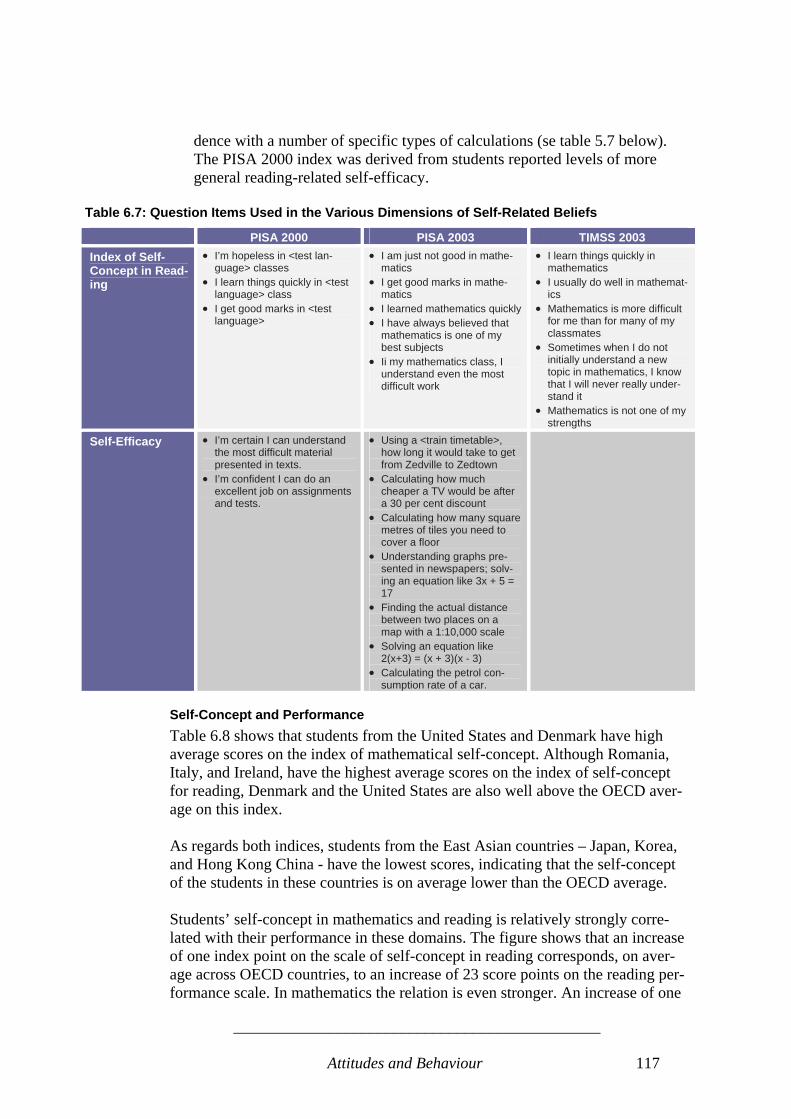
______________________________________________
Attitudes and Behaviour 117
dence with a number of specific types of calculations (se table 5.7 below). The PISA 2000 index was derived from students reported levels of more general reading-related self-efficacy.
Table 6.7: Question Items Used in the Various Dimensions of Self-Related Beliefs
PISA 2000 PISA 2003 TIMSS 2003 Index of Self-Concept in Read-ing
• I’m hopeless in <test lan-guage> classes
• I learn things quickly in <test language> class
• I get good marks in <test language>
• I am just not good in mathe-matics
• I get good marks in mathe-matics
• I learned mathematics quickly • I have always believed that
mathematics is one of my best subjects
• Ii my mathematics class, I understand even the most difficult work
• I learn things quickly in mathematics
• I usually do well in mathemat-ics
• Mathematics is more difficult for me than for many of my classmates
• Sometimes when I do not initially understand a new topic in mathematics, I know that I will never really under-stand it
• Mathematics is not one of my strengths
Self-Efficacy • I’m certain I can understand the most difficult material presented in texts.
• I’m confident I can do an excellent job on assignments and tests.
• Using a <train timetable>, how long it would take to get from Zedville to Zedtown
• Calculating how much cheaper a TV would be after a 30 per cent discount
• Calculating how many square metres of tiles you need to cover a floor
• Understanding graphs pre-sented in newspapers; solv-ing an equation like 3x + 5 = 17
• Finding the actual distance between two places on a map with a 1:10,000 scale
• Solving an equation like 2(x+3) = (x + 3)(x - 3)
• Calculating the petrol con-sumption rate of a car.
Self-Concept and Performance Table 6.8 shows that students from the United States and Denmark have high average scores on the index of mathematical self-concept. Although Romania, Italy, and Ireland, have the highest average scores on the index of self-concept for reading, Denmark and the United States are also well above the OECD aver-age on this index. As regards both indices, students from the East Asian countries – Japan, Korea, and Hong Kong China - have the lowest scores, indicating that the self-concept of the students in these countries is on average lower than the OECD average. Students’ self-concept in mathematics and reading is relatively strongly corre-lated with their performance in these domains. The figure shows that an increase of one index point on the scale of self-concept in reading corresponds, on aver-age across OECD countries, to an increase of 23 score points on the reading per-formance scale. In mathematics the relation is even stronger. An increase of one

______________________________________________
Attitudes and Behaviour 118
index point on the scale of self-concept in mathematics corresponds to 32 score points on the mathematical performance scale on average across the OECD countries.
Table 6.8: Self-Concept and Performance in Mathematics and Reading, PISA 2003 and PISA 2000
Mean score
Change in the
score per unit
of the index
Explained variance
Mean score
Change in the
score per unit
of the index
Ex-plained
variance
MATHEMATICS READING United States 0,25 35,1 14,6 Romania 0,40 14,99 2,50 Denmark 0,24 46,5 27,6 Denmark 0,36 33,98 13,09 Germany 0,15 22,7 7,1 Italy 0,30 21,10 6,56 Sweden 0,13 47,0 24,4 Ireland 0,27 9,82 1,39 Greece 0,11 42,6 16,6 USA 0,26 28,87 9,81 Austria 0,07 25,7 8,9 UK 0,23 16,12 2,97 Iceland 0,03 39,7 26,4 Luxemburg 0,16 25,66 9,74 Poland 0,03 46,0 21,6 Latvia 0,11 34,05 11,19 Turkey 0,02 34,8 11,0 EU average 0,04 23,11 5,90 Finland 0,01 45,5 33,0 Austria 0,04 22,79 7,00 Italy 0,00 25,3 7,1 Sweden 0,04 36,23 11,01 Netherlands 0,00 22,2 6,1 Bulgaria 0,01 21,98 5,50 OECD average 0,00 32,4 10,8 Netherlands 0,01 13,41 2,09 EU average -0,01 33,8 12,2 OECD Average 0,00 23,14 5,39 Belgium -0,03 23,3 4,8 Norway -0,04 33,73 12,07 Ireland -0,03 34,4 14,1 Island -0,05 29,17 10,66 Slovakia -0,05 44,5 16,1 Finland -0,06 33,21 12,81 Czech Republic -0,09 39,8 15,8 Portugal -0,07 30,68 9,35 Latvia -0,11 44,6 16,7 Germany -0,11 20,35 4,65 Hungary -0,15 28,4 6,6 Hungary -0,14 27,59 8,21 France -0,17 28,3 10,3 Belgium -0,18 15,87 1,85 Norway -0,18 46,6 31,6 Czech Republic -0,26 21,71 6,44 Portugal -0,18 36,8 15,4 HK China -0,30 13,17 1,91 Spain -0,19 31,9 13,2 Korea -0,35 22,37 7,82 HK China -0,26 38,4 12,1 Korea -0,35 47,3 21,4 Japan -0,53 21,2 4,1 Source: Pisa 2003 and PISA 2000 data sets.
Self-Efficacy and Performance As was the case with students’ self-concept, the East Asian countries in general display very low average index scores as regards self-efficacy. This is the case for both reading and mathematics. On the upper end of the index there seems to be no clear pattern in how the countries are ranked. The only tendency which appears is that the countries which are above the OECD average with regard to one domain or characteristics also tend to be above the OECD average with regard to the other domains and characteristics.
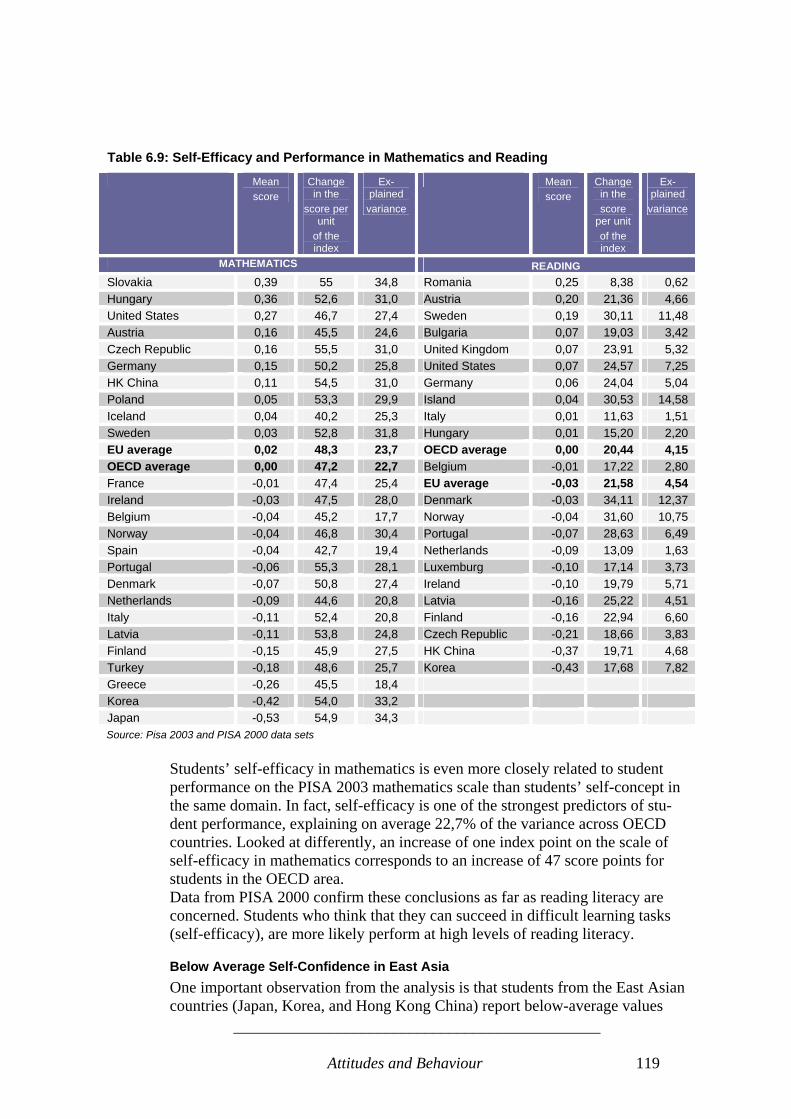
______________________________________________
Attitudes and Behaviour 119
Table 6.9: Self-Efficacy and Performance in Mathematics and Reading
Mean score
Change in the
score per unit
of the index
Ex-plained
variance
Mean score
Change in the score
per unit of the index
Ex-plained
variance
MATHEMATICS READING Slovakia 0,39 55 34,8 Romania 0,25 8,38 0,62 Hungary 0,36 52,6 31,0 Austria 0,20 21,36 4,66 United States 0,27 46,7 27,4 Sweden 0,19 30,11 11,48 Austria 0,16 45,5 24,6 Bulgaria 0,07 19,03 3,42 Czech Republic 0,16 55,5 31,0 United Kingdom 0,07 23,91 5,32 Germany 0,15 50,2 25,8 United States 0,07 24,57 7,25 HK China 0,11 54,5 31,0 Germany 0,06 24,04 5,04 Poland 0,05 53,3 29,9 Island 0,04 30,53 14,58 Iceland 0,04 40,2 25,3 Italy 0,01 11,63 1,51 Sweden 0,03 52,8 31,8 Hungary 0,01 15,20 2,20 EU average 0,02 48,3 23,7 OECD average 0,00 20,44 4,15 OECD average 0,00 47,2 22,7 Belgium -0,01 17,22 2,80 France -0,01 47,4 25,4 EU average -0,03 21,58 4,54 Ireland -0,03 47,5 28,0 Denmark -0,03 34,11 12,37 Belgium -0,04 45,2 17,7 Norway -0,04 31,60 10,75 Norway -0,04 46,8 30,4 Portugal -0,07 28,63 6,49 Spain -0,04 42,7 19,4 Netherlands -0,09 13,09 1,63 Portugal -0,06 55,3 28,1 Luxemburg -0,10 17,14 3,73 Denmark -0,07 50,8 27,4 Ireland -0,10 19,79 5,71 Netherlands -0,09 44,6 20,8 Latvia -0,16 25,22 4,51 Italy -0,11 52,4 20,8 Finland -0,16 22,94 6,60 Latvia -0,11 53,8 24,8 Czech Republic -0,21 18,66 3,83 Finland -0,15 45,9 27,5 HK China -0,37 19,71 4,68 Turkey -0,18 48,6 25,7 Korea -0,43 17,68 7,82 Greece -0,26 45,5 18,4 Korea -0,42 54,0 33,2 Japan -0,53 54,9 34,3 Source: Pisa 2003 and PISA 2000 data sets
Students’ self-efficacy in mathematics is even more closely related to student performance on the PISA 2003 mathematics scale than students’ self-concept in the same domain. In fact, self-efficacy is one of the strongest predictors of stu-dent performance, explaining on average 22,7% of the variance across OECD countries. Looked at differently, an increase of one index point on the scale of self-efficacy in mathematics corresponds to an increase of 47 score points for students in the OECD area. Data from PISA 2000 confirm these conclusions as far as reading literacy are concerned. Students who think that they can succeed in difficult learning tasks (self-efficacy), are more likely perform at high levels of reading literacy.
Below Average Self-Confidence in East Asia One important observation from the analysis is that students from the East Asian countries (Japan, Korea, and Hong Kong China) report below-average values
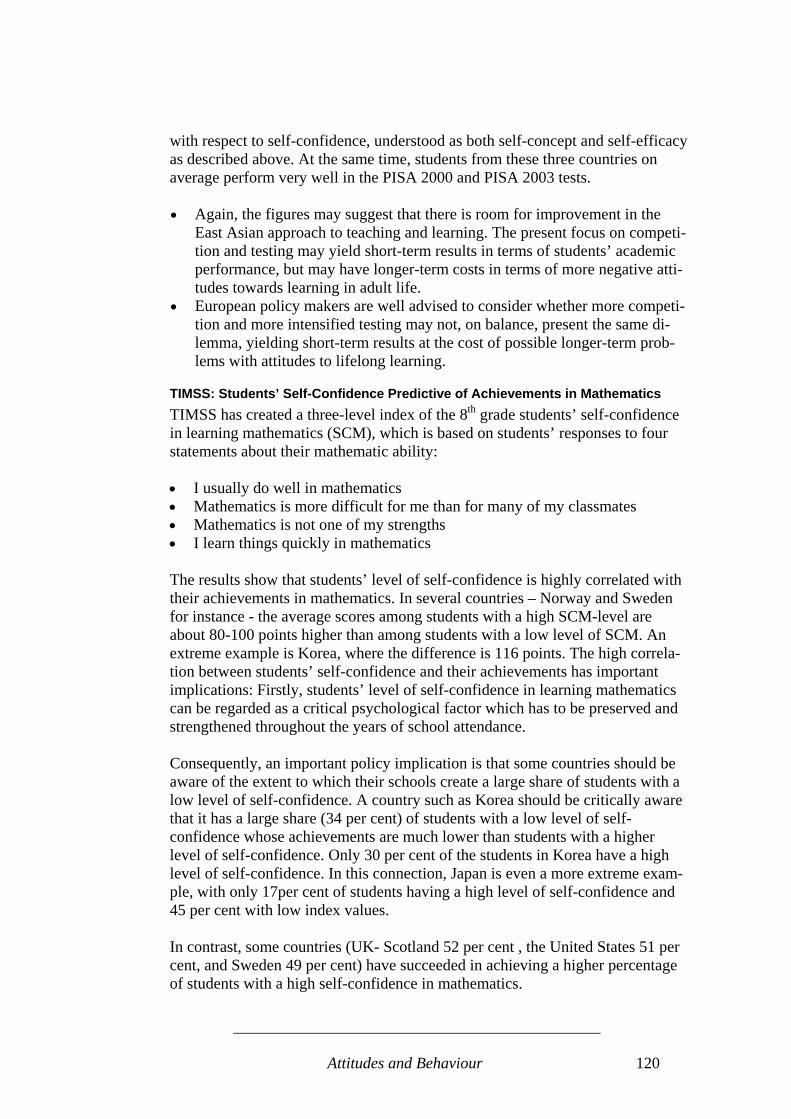
______________________________________________
Attitudes and Behaviour 120
with respect to self-confidence, understood as both self-concept and self-efficacy as described above. At the same time, students from these three countries on average perform very well in the PISA 2000 and PISA 2003 tests. • Again, the figures may suggest that there is room for improvement in the
East Asian approach to teaching and learning. The present focus on competi-tion and testing may yield short-term results in terms of students’ academic performance, but may have longer-term costs in terms of more negative atti-tudes towards learning in adult life.
• European policy makers are well advised to consider whether more competi-tion and more intensified testing may not, on balance, present the same di-lemma, yielding short-term results at the cost of possible longer-term prob-lems with attitudes to lifelong learning.
TIMSS: Students’ Self-Confidence Predictive of Achievements in Mathematics TIMSS has created a three-level index of the 8th grade students’ self-confidence in learning mathematics (SCM), which is based on students’ responses to four statements about their mathematic ability: • I usually do well in mathematics • Mathematics is more difficult for me than for many of my classmates • Mathematics is not one of my strengths • I learn things quickly in mathematics The results show that students’ level of self-confidence is highly correlated with their achievements in mathematics. In several countries – Norway and Sweden for instance - the average scores among students with a high SCM-level are about 80-100 points higher than among students with a low level of SCM. An extreme example is Korea, where the difference is 116 points. The high correla-tion between students’ self-confidence and their achievements has important implications: Firstly, students’ level of self-confidence in learning mathematics can be regarded as a critical psychological factor which has to be preserved and strengthened throughout the years of school attendance. Consequently, an important policy implication is that some countries should be aware of the extent to which their schools create a large share of students with a low level of self-confidence. A country such as Korea should be critically aware that it has a large share (34 per cent) of students with a low level of self-confidence whose achievements are much lower than students with a higher level of self-confidence. Only 30 per cent of the students in Korea have a high level of self-confidence. In this connection, Japan is even a more extreme exam-ple, with only 17per cent of students having a high level of self-confidence and 45 per cent with low index values. In contrast, some countries (UK- Scotland 52 per cent , the United States 51 per cent, and Sweden 49 per cent) have succeeded in achieving a higher percentage of students with a high self-confidence in mathematics.

______________________________________________
Attitudes and Behaviour 121
Table 6.10. TIMSS: Index of 8th Grade Students’ Self-Confidence in Learning Mathematics (SCM) and Average Achievement Scores High SCM Low SCM
Country Percent of students
Average achievement
Percent of students
Average achie-vement
Score difference
Korea 30 650 34 534 116 Norway 46 502 21 405 97 Cyprus 46 503 22 407 96 Lithuania 36 552 26 456 96 Japan 17 634 45 538 96 Hungary 44 574 24 479 95 Slovakia 40 556 25 462 94 Romania 30 533 25 442 91 Sweden 49 534 16 446 88 Italy 46 521 25 439 82 Latvia 34 555 33 473 82 Estonia 41 569 28 489 80 Slovenia 40 533 20 453 80 Bulgaria 33 519 28 445 74 United States 51 534 20 461 73 HK China 30 627 33 556 71 Basque Ctry., Spain 46 518 24 449 69 Scotland (UK) 52 524 15 456 68 Singapore 39 639 27 571 68 England 47 526 19 468 58 Netherlands 45 557 23 511 46 Belgium 45 556 25 518 38
Source: TIMSS 2003 dataset Secondly, the competitiveness in the East Asian educational systems (Japan, Korea, and Hong Kong China, further described below), may be a contributing factor to the high average achievement scores in mathematics compared to other countries. However, these countries can be considered as having unexploited potentials, as there is a large share of students with lower self-confidence and lower average achievements than the small “elite” of self-confident students. This pattern may be a result of the competitive school systems.
6.3. Learning Strategies Learning strategies are the plans students select to achieve their goals: The abil-ity to do so distinguishes competent learners who can regulate their learning. Cognitive strategies that require information processing skills include, but are not limited to, memorisation and elaboration. Meta-cognitive strategies, entailing conscious regulation of one’s own learning, are measured in the concept of con-trol strategies (PISA 2003).

______________________________________________
Attitudes and Behaviour 122
Table 6.11: Question Items Used in the Various Dimensions of Learning Strategies
PISA 2000 PISA 2003 Control strategies
• I start by figuring out exactly what I need to learn
• I force myself to check to see if I remember what I have learned.
• I try to figure out which concepts I still ha-ven’t really understood.
• I make sure that I remember the most impor-tant things
• When I don’t understand something I look for additional information
• When I study for a mathematics test, I try to work out what are the most important parts to learn
• When I study mathematics I make myself check to see if I remember the work I have already done
• When I study mathematics I try to figure out concepts I still have not understood properly
• When I cannot understand something in mathematics, I always search for more in-formation to clarify the problem
• When I study mathematics I start by working out exactly what I need to learn
Memorization strategies
• I try to memorize everything that might be covered
• I memorize as much as possible • I memorize all new material so that I can
recite it • I practise by saying the material to myself
over and over
• I go over some problems in mathematics so often that I feel as I could solve them in my sleep
• When I study mathematics I try to learn the answers to problems by heart
• In order to remember the method for solving mathematics problems I go through exam-ples again and again
• To learn mathematics, I try to remember every step in a procedure
Elaboration strategies
• I try to relate new material to things I have learned in other subjects.
• I figure out how the information might be useful in the real world.
• I try to understand the material better by relating it to things I already know.
• I figure out how the material fits in with what I have already learned.
• When I am solving mathematical problems I often think of new ways to get answers
• I think how the mathematics I have learned can be used in everyday life
• I try to understand new concepts in mathe-matics by relating them to things I know
• When I am solving mathematics problems, I often think about how solutions might be ap-plied to other interesting questions
• When learning mathematics, I try to relate the work to things I have learnt in other sub-jects
• Control strategies. Students were asked about their use of learning strategies
for mathematics that involve checking what one has learned and working out what one still needs to learn, allowing learners to adapt their learning to the task at hand. These strategies are used to ensure that one’s learning goals are reached and are at the heart of the approaches to learning measured by PISA.
• Memorisation/rehearsal strategies. Students were asked about their use of learning strategies for mathematics that involve representations of know-ledge and procedures stored in memory with little or no further processing.
• Elaboration strategies. Students were asked about their use of learning strategies for mathematics that involve connecting new material to prior learning. By exploring how knowledge learned in other contexts relates to new material, students acquire greater understanding than through simple memorisation.
Control Strategies and Performance Table 6.12 shows the mean scores on the index for control strategies. Students in Austria, Germany, and Italy, have relatively high index scores, whereas students from Japan, Korea, Sweden, and Finland, have the lowest scores.
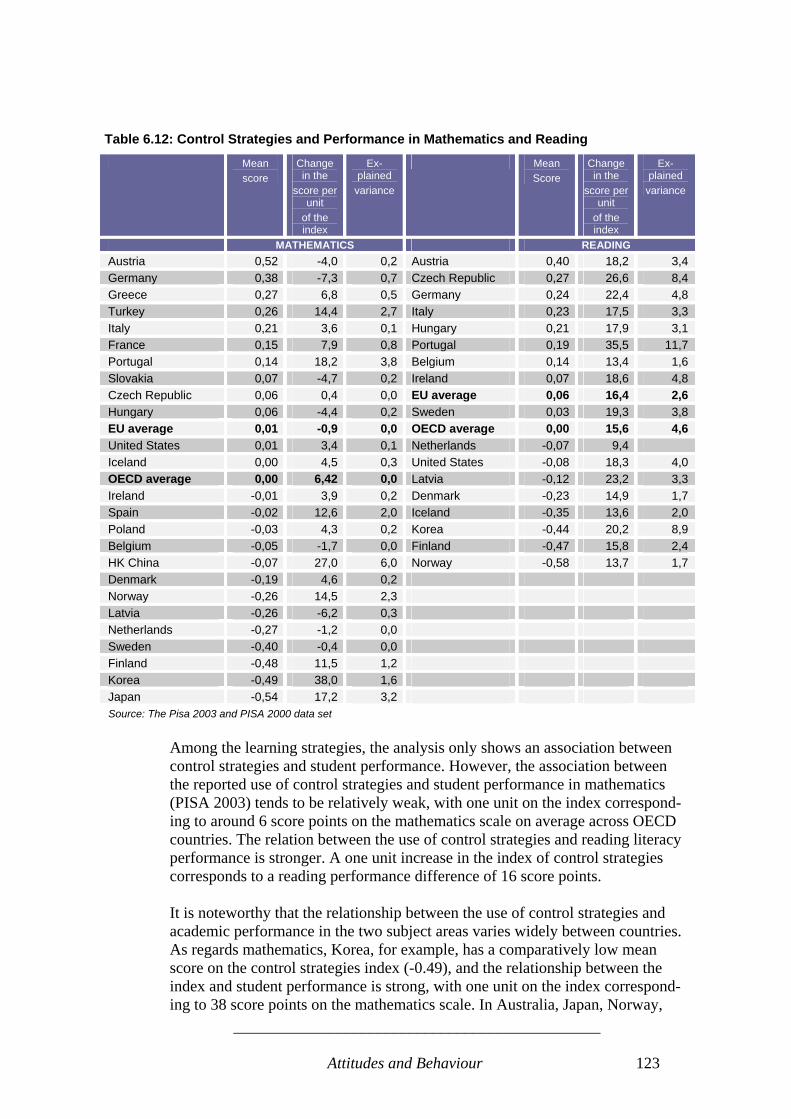
______________________________________________
Attitudes and Behaviour 123
Table 6.12: Control Strategies and Performance in Mathematics and Reading
Mean score
Change in the
score per unit
of the index
Ex-plained
variance
Mean Score
Change in the
score per unit
of the index
Ex-plained
variance
MATHEMATICS READING Austria 0,52 -4,0 0,2 Austria 0,40 18,2 3,4 Germany 0,38 -7,3 0,7 Czech Republic 0,27 26,6 8,4 Greece 0,27 6,8 0,5 Germany 0,24 22,4 4,8 Turkey 0,26 14,4 2,7 Italy 0,23 17,5 3,3 Italy 0,21 3,6 0,1 Hungary 0,21 17,9 3,1 France 0,15 7,9 0,8 Portugal 0,19 35,5 11,7 Portugal 0,14 18,2 3,8 Belgium 0,14 13,4 1,6 Slovakia 0,07 -4,7 0,2 Ireland 0,07 18,6 4,8 Czech Republic 0,06 0,4 0,0 EU average 0,06 16,4 2,6 Hungary 0,06 -4,4 0,2 Sweden 0,03 19,3 3,8 EU average 0,01 -0,9 0,0 OECD average 0,00 15,6 4,6 United States 0,01 3,4 0,1 Netherlands -0,07 9,4 Iceland 0,00 4,5 0,3 United States -0,08 18,3 4,0 OECD average 0,00 6,42 0,0 Latvia -0,12 23,2 3,3 Ireland -0,01 3,9 0,2 Denmark -0,23 14,9 1,7 Spain -0,02 12,6 2,0 Iceland -0,35 13,6 2,0 Poland -0,03 4,3 0,2 Korea -0,44 20,2 8,9 Belgium -0,05 -1,7 0,0 Finland -0,47 15,8 2,4 HK China -0,07 27,0 6,0 Norway -0,58 13,7 1,7 Denmark -0,19 4,6 0,2 Norway -0,26 14,5 2,3 Latvia -0,26 -6,2 0,3 Netherlands -0,27 -1,2 0,0 Sweden -0,40 -0,4 0,0 Finland -0,48 11,5 1,2 Korea -0,49 38,0 1,6 Japan -0,54 17,2 3,2 Source: The Pisa 2003 and PISA 2000 data set
Among the learning strategies, the analysis only shows an association between control strategies and student performance. However, the association between the reported use of control strategies and student performance in mathematics (PISA 2003) tends to be relatively weak, with one unit on the index correspond-ing to around 6 score points on the mathematics scale on average across OECD countries. The relation between the use of control strategies and reading literacy performance is stronger. A one unit increase in the index of control strategies corresponds to a reading performance difference of 16 score points. It is noteworthy that the relationship between the use of control strategies and academic performance in the two subject areas varies widely between countries. As regards mathematics, Korea, for example, has a comparatively low mean score on the control strategies index (-0.49), and the relationship between the index and student performance is strong, with one unit on the index correspond-ing to 38 score points on the mathematics scale. In Australia, Japan, Norway,

______________________________________________
Attitudes and Behaviour 124
Portugal, Turkey, and Hong Kong China, one unit corresponds to between 14 and 27 score points. In contrast, in other countries the relationship is not strong or even slightly negative. Memorization Strategies One of the conclusions which can be drawn on the basis of table 6.13 is that countries in which students who apply memorisation strategies in mathematics to a relatively great extent are not necessarily the same countries whose students use these strategies to a comparable degree in reading.
Table 6.13: Memorisation Strategies Mean
score Change in score per
unit of the index
Explained variance
Mean score
Change in the
score per unit
of the index
Explained variance
MATHEMATICS READING United States 0,31 0,3 0 Hungary 0,89 15,53 2,14
Greece 0,20 -2,9 0,1 Romania 0,44 1,30 0,01
Hungary 0,16 -7,3 0,5 UK 0,36 3,67 0,1
Poland 0,15 -4,5 0,2 Ireland 0,27 6,03 0,43
Slovakia 0,13 -10,5 0,9 Bulgaria 0,21 -4,79 0,16
Ireland 0,11 5,0 0,3 Latvia 0,17 11,77 0,7
Turkey 0,10 1,2 0,0 Sweden 0,17 8,07 0,64
Spain 0,07 7,7 0,7 United States 0,09 1,95 0,04
Austria 0,06 -18,5 5,1 HK China 0,08 18,67 4,03
Italy 0,03 -11,8 1,2 Belgium 0,06 -8,43 0,88
OECD average 0,00 -4,5 0,2 EU average 0,05 -1,26 0,02 EU average -0,01 -4,8 0,2 Denmark 0,05 5,72 0,2
Iceland -0,03 -0,7 0,0 Germany 0,03 -1,36 0,02
Czech Republic -0,05 -14,2 1,7 Portugal 0,03 -1,18 0,01
France -0,06 -0,9 0,0 OECD average 0,00 0,21 0,00 Germany -0,06 -17,9 5,1 Netherlands -0,02 -6,00 0,3
Sweden -0,08 14,1 2,2 Austria -0,03 -11,79 1,74
Belgium -0,09 -9,3 0,7 Czech Rep. -0,06 -11,11 1,59
Portugal -0,11 -5,4 0,4 Luxembourg -0,09 -2,60 0,1
Norway -0,12 22,3 6,7 Finland -0,11 7,69 0,47
Latvia -0,14 -2,5 0,0 Korea -0,15 6,54 0,77
HK China -0,15 6,7 0,4 Iceland -0,27 -2,249 0,05
Netherlands -0,16 12,8 1,4 Norway -0,6 -2,612 0,07
Finland -0,19 6,7 0,6 Italy -0,69 -15,419 2,4
Denmark -0,27 9,3 0,9
Korea -0,35 19,6 3,6
Japan -0,56 13,9 1,9
Source: The Pisa 2003 and PISA 2000 data sets The country rank is very different across the two domains. The East Asian and Nordic countries again have the lowest index scores both in relation to mathe-matics and reading.
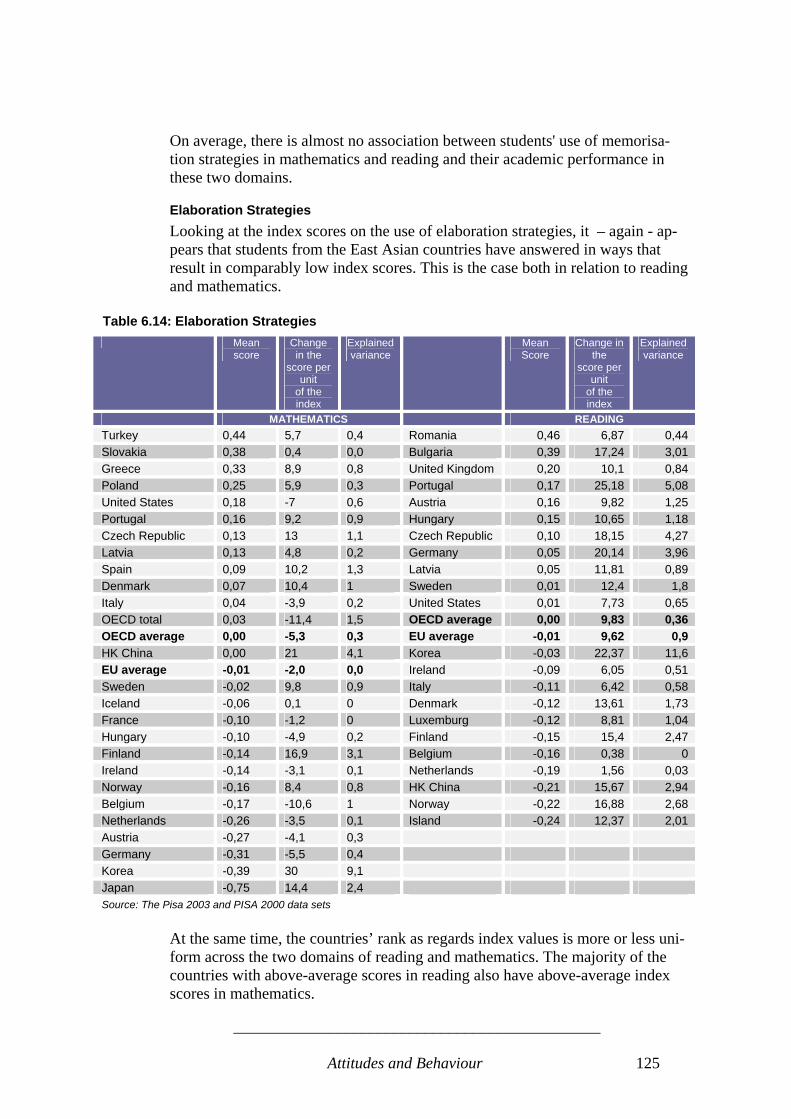
______________________________________________
Attitudes and Behaviour 125
On average, there is almost no association between students' use of memorisa-tion strategies in mathematics and reading and their academic performance in these two domains.
Elaboration Strategies Looking at the index scores on the use of elaboration strategies, it – again - ap-pears that students from the East Asian countries have answered in ways that result in comparably low index scores. This is the case both in relation to reading and mathematics.
Table 6.14: Elaboration Strategies Mean
score Change in the
score per unit
of the index
Explained variance
Mean Score
Change in the
score per unit
of the index
Explained variance
MATHEMATICS READING Turkey 0,44 5,7 0,4 Romania 0,46 6,87 0,44 Slovakia 0,38 0,4 0,0 Bulgaria 0,39 17,24 3,01 Greece 0,33 8,9 0,8 United Kingdom 0,20 10,1 0,84 Poland 0,25 5,9 0,3 Portugal 0,17 25,18 5,08 United States 0,18 -7 0,6 Austria 0,16 9,82 1,25 Portugal 0,16 9,2 0,9 Hungary 0,15 10,65 1,18 Czech Republic 0,13 13 1,1 Czech Republic 0,10 18,15 4,27 Latvia 0,13 4,8 0,2 Germany 0,05 20,14 3,96 Spain 0,09 10,2 1,3 Latvia 0,05 11,81 0,89 Denmark 0,07 10,4 1 Sweden 0,01 12,4 1,8 Italy 0,04 -3,9 0,2 United States 0,01 7,73 0,65 OECD total 0,03 -11,4 1,5 OECD average 0,00 9,83 0,36 OECD average 0,00 -5,3 0,3 EU average -0,01 9,62 0,9 HK China 0,00 21 4,1 Korea -0,03 22,37 11,6 EU average -0,01 -2,0 0,0 Ireland -0,09 6,05 0,51 Sweden -0,02 9,8 0,9 Italy -0,11 6,42 0,58 Iceland -0,06 0,1 0 Denmark -0,12 13,61 1,73 France -0,10 -1,2 0 Luxemburg -0,12 8,81 1,04 Hungary -0,10 -4,9 0,2 Finland -0,15 15,4 2,47 Finland -0,14 16,9 3,1 Belgium -0,16 0,38 0 Ireland -0,14 -3,1 0,1 Netherlands -0,19 1,56 0,03 Norway -0,16 8,4 0,8 HK China -0,21 15,67 2,94 Belgium -0,17 -10,6 1 Norway -0,22 16,88 2,68 Netherlands -0,26 -3,5 0,1 Island -0,24 12,37 2,01 Austria -0,27 -4,1 0,3 Germany -0,31 -5,5 0,4 Korea -0,39 30 9,1 Japan -0,75 14,4 2,4 Source: The Pisa 2003 and PISA 2000 data sets
At the same time, the countries’ rank as regards index values is more or less uni-form across the two domains of reading and mathematics. The majority of the countries with above-average scores in reading also have above-average index scores in mathematics.

______________________________________________
Attitudes and Behaviour 126
PISA 2003 data reveals no association between student performance in mathe-matical literacy and the use of elaboration strategies. PISA 2000 points to a rela-tion - but a rather weak one - between the use of elaboration strategies and read-ing literacy performance.
6.4. Learning Situations Regarding learning situations, there is a distinction in the PISA data between the students’ ability to learn independently and learn in a group, while at the same time there is recognition of the fact that these learning situations are not mutu-ally exclusive. The PISA study looked at students’ preferences for these two learning situations in order to obtain some indication of the approach students will take to co-operative projects in working life. Learning situations are meas-ured in two respects: Table 6.15: Question Items Used in the Various Dimensions of Learning Strate-gies
PISA 2000 PISA 2003 Co-operative lear-ning
• I like to work with other students
• I learn most when I work with other students
• I like to help other people do well in a group
• It is helpful to put together everyone’s ideas when working on a project
• I like to work with other students • I learn most when I work with other
students • I like to help other people do well in
a group • It is helpful to put together every-
one’s ideas when working on a pro-ject
Competitive learn-ing
• I like to try to be better than other students
• Trying to be better than others makes me work well
• I would like to be the best at something
• I learn faster if I’m trying to do better than the oth-ers
• I like to try to be better than other students
• Trying to be better than others makes me work well
• I would like to be the best at some-thing
• I learn faster if I’m trying to do better than the others
• Preference for co-operative learning. Students were asked to state their
agreement in statements like: I learn the most when I work with other stu-dents
• Preference for competitive learning. Students were asked to state their agreement in statements like: Trying to be better than others makes me work well.
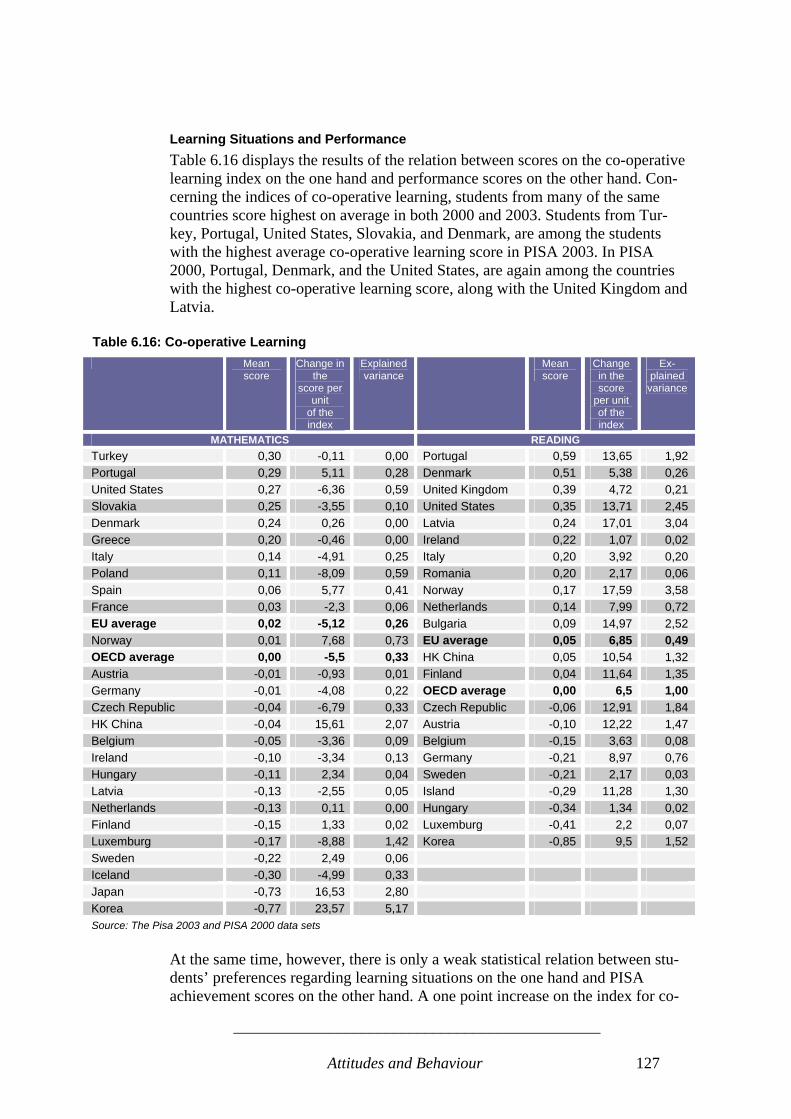
______________________________________________
Attitudes and Behaviour 127
Learning Situations and Performance Table 6.16 displays the results of the relation between scores on the co-operative learning index on the one hand and performance scores on the other hand. Con-cerning the indices of co-operative learning, students from many of the same countries score highest on average in both 2000 and 2003. Students from Tur-key, Portugal, United States, Slovakia, and Denmark, are among the students with the highest average co-operative learning score in PISA 2003. In PISA 2000, Portugal, Denmark, and the United States, are again among the countries with the highest co-operative learning score, along with the United Kingdom and Latvia.
Table 6.16: Co-operative Learning Mean
score Change in
the score per
unit of the index
Explained variance
Mean score
Change in the score
per unit of the index
Ex-plained
variance
MATHEMATICS READING Turkey 0,30 -0,11 0,00 Portugal 0,59 13,65 1,92 Portugal 0,29 5,11 0,28 Denmark 0,51 5,38 0,26 United States 0,27 -6,36 0,59 United Kingdom 0,39 4,72 0,21 Slovakia 0,25 -3,55 0,10 United States 0,35 13,71 2,45 Denmark 0,24 0,26 0,00 Latvia 0,24 17,01 3,04 Greece 0,20 -0,46 0,00 Ireland 0,22 1,07 0,02 Italy 0,14 -4,91 0,25 Italy 0,20 3,92 0,20 Poland 0,11 -8,09 0,59 Romania 0,20 2,17 0,06 Spain 0,06 5,77 0,41 Norway 0,17 17,59 3,58 France 0,03 -2,3 0,06 Netherlands 0,14 7,99 0,72 EU average 0,02 -5,12 0,26 Bulgaria 0,09 14,97 2,52 Norway 0,01 7,68 0,73 EU average 0,05 6,85 0,49 OECD average 0,00 -5,5 0,33 HK China 0,05 10,54 1,32 Austria -0,01 -0,93 0,01 Finland 0,04 11,64 1,35 Germany -0,01 -4,08 0,22 OECD average 0,00 6,5 1,00 Czech Republic -0,04 -6,79 0,33 Czech Republic -0,06 12,91 1,84 HK China -0,04 15,61 2,07 Austria -0,10 12,22 1,47 Belgium -0,05 -3,36 0,09 Belgium -0,15 3,63 0,08 Ireland -0,10 -3,34 0,13 Germany -0,21 8,97 0,76 Hungary -0,11 2,34 0,04 Sweden -0,21 2,17 0,03 Latvia -0,13 -2,55 0,05 Island -0,29 11,28 1,30 Netherlands -0,13 0,11 0,00 Hungary -0,34 1,34 0,02 Finland -0,15 1,33 0,02 Luxemburg -0,41 2,2 0,07 Luxemburg -0,17 -8,88 1,42 Korea -0,85 9,5 1,52 Sweden -0,22 2,49 0,06 Iceland -0,30 -4,99 0,33 Japan -0,73 16,53 2,80 Korea -0,77 23,57 5,17 Source: The Pisa 2003 and PISA 2000 data sets
At the same time, however, there is only a weak statistical relation between stu-dents’ preferences regarding learning situations on the one hand and PISA achievement scores on the other hand. A one point increase on the index for co-

______________________________________________
Attitudes and Behaviour 128
operative learning corresponds to a average decrease of 5,5 score points on the mathematics scale (PISA 2003) and an average increase of 6,5 score points on the reading scale (PISA 2000). There are some differences between countries, however. For students in Japan and Korea, there is a positive correlation between the score on the co-operative learning index and achievement scores in mathematics: For these two countries, a one point increase in the index results in an increase of between 17 score points (Japan) and 24 score points (Korea).
Table 6.17: Competitive Learning Mean
score Change in the
score per unit
of the index
Explained variance
Mean Score
Change in the score
per unit of the index
Explained variance
MATHEMATICS READING Turkey 0,65 7,85 0,56 Romania 0,77 13,45 1,91 United States 0,41 -1,79 0,03 HK China 0,67 21,17 5,5 Greece 0,28 1,59 0,02 Bulgaria 0,31 12,64 1,79 Island 0,26 1,06 0,01 United States 0,27 24,71 6,48 HK China 0,10 11,01 0,91 Latvia 0,22 27,79 6,15 Italy 0,10 -14,04 1,92 Denmark 0,19 15,95 3,08 Poland 0,09 -3,62 0,11 United Kingdom 0,18 12,14 1,73 Ireland 0,08 -3,33 0,12 Ireland 0,15 13,5 2,76 Slovakia 0,08 -0,09 0,00 Czech Republic 0,14 16,75 3,22 Spain 0,03 4,82 0,29 Hungary 0,10 18,49 3,57 OECD Average 0,00 0,21 0,00 EU average 0,05 8,63 0,79 Luxemburg -0,01 -9,73 1,49 Island 0,01 19,55 4,98 Germany -0,03 -16,7 3,53 Italy 0,00 4,29 0,25 Denmark -0,04 2,38 0,07 OECD Average 0,00 11,10 2,80 Korea -0,05 27,19 7,56 Sweden -0,01 12,92 1,55 Sweden -0,06 2,52 0,07 Norway -0,03 24,55 7,29 EU average -0,08 1,46 0,02 Germany -0,07 15,52 2,06 Portugal -0,08 -8,97 0,90 Korea -0,14 18,53 7,14 Czech Republic -0,10 -0,33 0,00 Luxemburg -0,18 3,02 0,11 Latvia -0,10 2,88 0,05 Austria -0,19 9,51 0,96 France -0,14 -7,73 0,72 Portugal -0,22 -5,54 0,34 Belgium -0,29 -12,97 1,41 Finland -0,25 18,11 3,56 Austria -0,31 -16,84 3,93 Netherlands -0,25 -0,79 0,01 Norway -0,31 7,91 0,81 Belgium -0,38 -2,92 0,07 Finland -0,32 3,95 0,20 Hungary -0,45 -7,06 0,43 Netherlands -0,45 -13,12 1,58 Japan -0,47 11,91 1,92 Source: Pisa 2003 and PISA 2000 data sets.
For competitive learning it seems to be the case, paradoxically, that many coun-tries where students have relatively high scores on the index of co-operative learning are also the countries where students have correspondingly high scores on the index of competitive learning, and vice versa.

______________________________________________
Attitudes and Behaviour 129
Illustrative examples are the United States where the students score relatively high scores across subject areas both with regard to co-operative and competitive learning, and Japan, where students score relatively low scores on both the co-operative learning index and the competitive learning index. It appears from table 6.17 that there is no strong statistical relation between stu-dents’ preferences for competitive learning situations and their academic per-formance in reading and mathematics. For reading, the relation is relatively weak, with a one point increase in the index value resulting in a score point in-crease of 11 points. For mathematics, the relation is absent.
6.5. Emotional Factors Students’ avoidance of mathematics due to emotional stress is reported to be widespread in many countries. Some research treats this construct as part of gen-eral attitudes to mathematics, although it is generally considered distinct from attitudinal variables. • Anxiety in mathematics: In PISA 2003, students were asked to what extent
they feel helpless and under emotional stress when dealing with mathemat-ics. The effects of anxiety in mathematics are indirect, once self-related cog-nitions are taken into account.
Questionnaire items used to construct the index of anxiety were: • I often worry that it will be difficult for me in mathematics classes • I get very tense when I have to do mathematics homework • I get very nervous doing mathematics problems • I feel helpless when doing a mathematics problem • I worry that I will get poor marks in mathematics
Emotional Factors and Performance As is to be expected, anxiety in mathematics is negatively related to student per-formance. A one-point increase on the PISA index of anxiety in mathematics corresponds, on average across OECD countries, to a 35-point drop in the mathematics score, which is just over half a proficiency level. Students in the bottom quartile of the index of anxiety in mathematics are half as likely to be among the bottom quartile of performers compared to the average student. This negative association remains even if other learner characteristics – such as students’ interest in and enjoyment of mathematics, self-efficacy in mathematics, and use of control strategies – are accounted for.

______________________________________________
Attitudes and Behaviour 130
It appears that that students from Japan, Korea, France and Turkey have the highest perceptions of anxiety, whereas students from Scandinavia and Northern Europe in general experience comparatively lower degrees of anxiety. As was the case with self-efficacy, the association between anxiety in mathemat-ics and mathematics performance is not only strong at student level. In most countries, there is also a clear tendency for students in lower-performing schools to report higher levels of anxiety in mathematics, with 7 per cent of the perform-ance variance among schools explained by the average levels of students’ anxi-ety in mathematics at school.
Table 6.18: Anxiety and Mathematics Performance
Mean Score
Change in the score per unit of the index
Explained variance
MATHEMATICS 2003 Japan 0,44 -14,3 2,1 Korea 0,41 -24,5 4,8 France 0,34 -25,0 6,4 Turkey 0,34 -34,6 11,7 Italy 0,29 -33,2 8,6 Spain 0,28 -26,7 6,9 HK China 0,23 -31,5 7,9 Greece 0,16 -34,5 12,4 Portugal 0,15 -34,2 10,7 Latvia 0,12 -47,3 17,6 Belgium 0,09 -26,1 5,6 Ireland 0,07 -32,9 13,2 Poland 0,04 -46,4 24,0 Slovakia 0,04 -44,8 16,7 OECD average 0,00 -35,3 12,7 Hungary -0,01 -33,2 10,1 EU average -0,04 -35,5 13,4 Czech Republic -0,05 -42,1 16,8 Norway -0,05 -42,1 24,5 United States -0,10 -34,4 15,7 Iceland -0,20 -33,4 15,9 Germany -0,25 -28,1 11,6 Austria -0,27 -25,1 9,8 Finland -0,31 -41,9 19,7 Netherlands -0,38 -22,6 4,9 Denmark -0,46 -44,6 26,5 Sweden -0,49 -42,8 19,9
Source: The Pisa 2003 data set.
PIRLS: Students’ Motivation and Interest in Reading Strongly Related to Perform-ance The acquirement of good reading skills is not confined to a classroom setting or school context. After having learned the alphabet and the basic reading skills, further progression entails that students develop a life-long personal motivation for reading on their own. To be an active citizen in today’s information society

______________________________________________
Attitudes and Behaviour 131
increasingly requires strong competences in finding, understanding, and sorting out large amounts of information. Consequently, this requires more advanced reading skills such as the ability to survey information and carry out quick scans of texts, combined with learning-to-learn competences regarding the ability to evaluate and seek out relevant information. Based on PIRLS data, an index measuring the students’ attitude towards reading has been developed (SATR). The index is based on the students’ responses as to whether they enjoy reading or only read when they have to.
Table 6.19. Index Level of Attitudes Toward Reading (SATR) and Average Score in Reading, 4th Grade, PIRLS 2001. High
SATR Medium
SATR Low
SATR
Country Share of Students (%)
Average Achievement
Share of Students (%)
Average Achievement
Share of Students (%)
Average Achievement
Score Difference*
Norway 44 529 47 481 9 460 69
France 58 548 39 499 3 480 68
Iceland 49 538 45 495 6 471 67
Bulgaria 60 573 36 524 4 510 63
England 44 584 43 531 13 521 63
Sweden 54 581 39 542 7 520 61
Czech Republic 40 561 52 525 7 500 61
Scotland 47 554 42 510 11 498 56
United States 42 569 44 528 13 513 56
Singapore 54 561 42 490 5 506 55
Slovenia 59 523 35 475 6 469 54
Germany 50 563 40 520 10 510 53
Netherlands 43 575 42 543 15 528 47
Slovakia 44 540 50 504 6 495 45
Hungary 50 565 40 525 10 522 43
Latvia 43 566 49 530 8 528 38
Lithuania 46 560 48 531 6 524 36
HK China 49 545 46 513 5 510 35
Italy 56 555 38 524 6 523 32
Greece 61 536 33 509 6 507 29
Cyprus 57 513 37 471 7 486 27
Source: PIRLS 2001 dataset. Data not available for Romania and Turkey. Difference between the average achievement score of students with high SATR and students with low SATR.
Table 6.19 illustrates that there is a strong correlation between students’ attitudes towards reading and their performance. When comparing the average reading score of students with high values on the SATR index with those of students with low index values on the SATR index, there are considerable differences in all countries, for instance Norway (69 points), Sweden (61), England (63) and the Netherlands (47). This may have several policy implications:
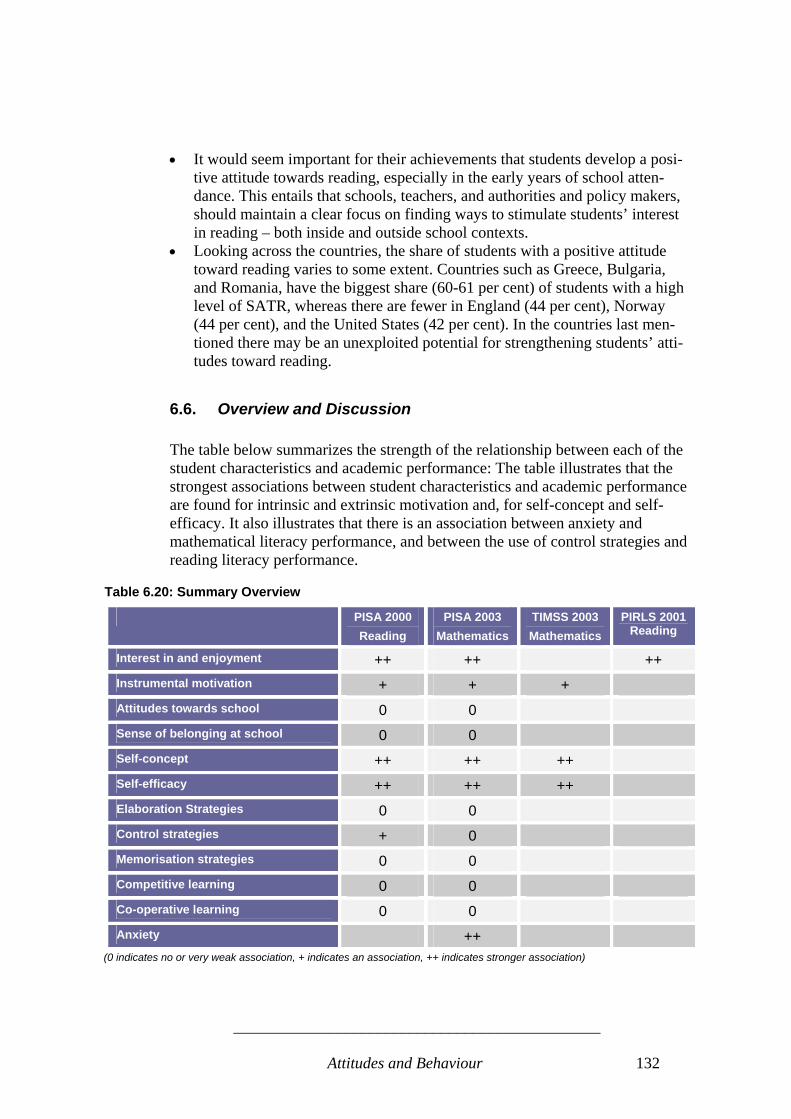
______________________________________________
Attitudes and Behaviour 132
• It would seem important for their achievements that students develop a posi-
tive attitude towards reading, especially in the early years of school atten-dance. This entails that schools, teachers, and authorities and policy makers, should maintain a clear focus on finding ways to stimulate students’ interest in reading – both inside and outside school contexts.
• Looking across the countries, the share of students with a positive attitude toward reading varies to some extent. Countries such as Greece, Bulgaria, and Romania, have the biggest share (60-61 per cent) of students with a high level of SATR, whereas there are fewer in England (44 per cent), Norway (44 per cent), and the United States (42 per cent). In the countries last men-tioned there may be an unexploited potential for strengthening students’ atti-tudes toward reading.
6.6. Overview and Discussion The table below summarizes the strength of the relationship between each of the student characteristics and academic performance: The table illustrates that the strongest associations between student characteristics and academic performance are found for intrinsic and extrinsic motivation and, for self-concept and self-efficacy. It also illustrates that there is an association between anxiety and mathematical literacy performance, and between the use of control strategies and reading literacy performance.
Table 6.20: Summary Overview
PISA 2000 Reading
PISA 2003 Mathematics
TIMSS 2003 Mathematics
PIRLS 2001 Reading
Interest in and enjoyment ++ ++ ++ Instrumental motivation + + + Attitudes towards school 0 0 Sense of belonging at school 0 0 Self-concept ++ ++ ++ Self-efficacy ++ ++ ++ Elaboration Strategies 0 0 Control strategies + 0 Memorisation strategies 0 0 Competitive learning 0 0 Co-operative learning 0 0 Anxiety ++
(0 indicates no or very weak association, + indicates an association, ++ indicates stronger association)
______________________________________________
Attitudes and Behaviour 133
A note on Japan, Korea and Hong Kong China It is remarkable that Japan, Korea, and to a certain degree Hong Kong China, have average index scores among their students that are relatively low compared to those of other countries. This is the case for indices where there is a positive relation between index scores and achievement scores in mathematics and read-ing: Interest and enjoyment, instrumental motivation, and self-concept and self-efficacy. Box 6.2 Extreme competition in East Asian educational systems: The cases of Japan, Korea, and Hong Kong China Students from Korea, Japan, and Hong Kong China, are among those achieving the highest test scores in the PISA surveys. At the same time, students from these coun-tries in general display below-average scores as regards the motivational indices ex-amined above, below-average sense of belonging to schools, more negative attitudes than the average student as regards schools’ ability to prepare students for adult life, and above-average levels of anxiety in mathematics. What can explain this combination of high academic performance, high anxiety, and low intrinsic motivation? One plausible explanation points to the extremely competitive nature of the educational systems of Korea, Japan, and Hong Kong China. Students are able to advance only after passing a series of public examinations, and entering into prestigious colleges is extremely competitive. In Japan, for example, the competitive process of entering good colleges is well sym-bolized by the term “juken jigoku” (examination hell, Stevenson & Baker, 1992:1642). In Korea, some high school students even commit suicide as the result of poor school results. According to a survey conducted in this country, 33 per cent of all middle school and high school students have thought of committing suicide. The main reason was according to 19 percent of the students stress or depression related to academic performance (Choi, 2004, cited from Kim et al., 2004; cf. also Murad 2004). Many high school graduates may spend one or more additional years preparing for college entrance exams in order to be able to enter a college of their choice. In 2003, the number of repeat applications for universities and junior colleges was 19,7 of total applicants in Japan. The corresponding figure in Korea was 27,4 (Kim et al., 2004). Moreover, due to the extreme competition, after-school shadow education (the so-called cram-school phenomenon, termed “Juku” in Japan and “Hogwan” in Korea has emerged as a serious social problem. In 1980 14,9 pct. of all students in Korea were reportedly involved in shadow education, with the percentage having increased to 58,1% in 2000 (Kim et al., 2004) The results of PISA suggest that Japan, Korea, and Hong Kong China, have been suc-cessful in setting up high-performance educational systems. Still, anxiety and low lev-els of intrinsic motivation may suggest that the countries have failed to build up educa-tional environments in which students’ aptitudes are best served.
As we have seen, students in Japan and Korea also on average have higher anxi-ety levels in relation to mathematics, a variable which is strongly negatively cor-

______________________________________________
Attitudes and Behaviour 134
related with mathematics performance. Yet Japan, Korea, and Hong Kong China, are also among the countries where average student performance is among the very best among all countries participating in the PISA studies. • It seems a clear possibility that other factors than those related to individual
student attitudes and behaviours explain this observation. Indeed, it is not unlikely that factors related to the school or system level at one and the same time have negative impacts on student attitudes and anxiety levels and posi-tive impacts on average student performance in reading and mathematics.
• At the same time, since the abovementioned variables are frequently rather significant for student performance in Japan, Korea, and Hong Kong China, there seem to be potentials for improving academic performance in these countries by means of targeted approaches to foster and strengthen positive learner attitudes.
Results from Multivariate Analysis In the above sections, the different learner characteristics have been examined individually. But it is in fact difficult to separate out the effects of the individual learner characteristics in order to estimate student performance, because the learner characteristics are associated. It may for example be the case that high performance of students who are interested in reading is explained by the fact that these students also tend to use control strategies more frequently or are more self-confident. By conducting multivariable regression analysis, it is possible to separate out the effect of each individual variable while controlling for the impact of other vari-ables. Multivariable analysis carried out by the OECD (2004c: 147) confirms that there is interaction among indices and variables. The model, which seeks to predict students' mathematical literacy performance on the basis of their interest in and enjoyment of mathematics, the frequency of their use of control strate-gies, and their degree of anxiety in mathematics, reveals the following: • Those students with an absence of anxiety about mathematics tend to per-
form strongly regardless of other learner characteristics.41 • When other factors are controlled for, students’ interest in and enjoyment of
mathematics have on average no clear association with mathematical literacy performance.
• When other factors are taken into account, the frequency of the students’ use of control strategies is not associated with their literacy performance. This is primarily explained by the fact that the degree to which students use control strategies is heavily influenced by their interest in and enjoyment of mathe-matics.
41 The causality in this connection may go both ways: Low anxiety facilitates high performance, or high per-formance facilitates low levels of anxiety.
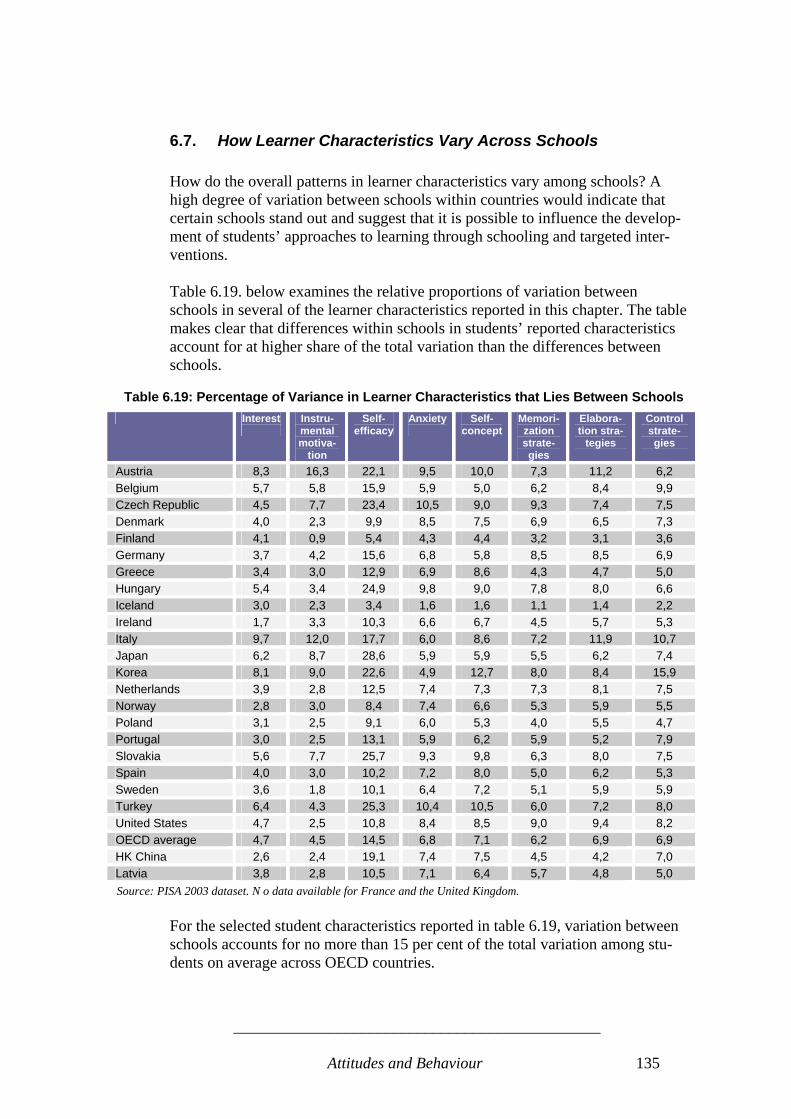
______________________________________________
Attitudes and Behaviour 135
6.7. How Learner Characteristics Vary Across Schools How do the overall patterns in learner characteristics vary among schools? A high degree of variation between schools within countries would indicate that certain schools stand out and suggest that it is possible to influence the develop-ment of students’ approaches to learning through schooling and targeted inter-ventions. Table 6.19. below examines the relative proportions of variation between schools in several of the learner characteristics reported in this chapter. The table makes clear that differences within schools in students’ reported characteristics account for at higher share of the total variation than the differences between schools.
Table 6.19: Percentage of Variance in Learner Characteristics that Lies Between Schools Interest
Instru-mental motiva-
tion
Self-efficacy
Anxiety
Self- concept
Memori-zation strate-gies
Elabora-tion stra-
tegies
Control strate-gies
Austria 8,3 16,3 22,1 9,5 10,0 7,3 11,2 6,2 Belgium 5,7 5,8 15,9 5,9 5,0 6,2 8,4 9,9 Czech Republic 4,5 7,7 23,4 10,5 9,0 9,3 7,4 7,5 Denmark 4,0 2,3 9,9 8,5 7,5 6,9 6,5 7,3 Finland 4,1 0,9 5,4 4,3 4,4 3,2 3,1 3,6 Germany 3,7 4,2 15,6 6,8 5,8 8,5 8,5 6,9 Greece 3,4 3,0 12,9 6,9 8,6 4,3 4,7 5,0 Hungary 5,4 3,4 24,9 9,8 9,0 7,8 8,0 6,6 Iceland 3,0 2,3 3,4 1,6 1,6 1,1 1,4 2,2 Ireland 1,7 3,3 10,3 6,6 6,7 4,5 5,7 5,3 Italy 9,7 12,0 17,7 6,0 8,6 7,2 11,9 10,7 Japan 6,2 8,7 28,6 5,9 5,9 5,5 6,2 7,4 Korea 8,1 9,0 22,6 4,9 12,7 8,0 8,4 15,9 Netherlands 3,9 2,8 12,5 7,4 7,3 7,3 8,1 7,5 Norway 2,8 3,0 8,4 7,4 6,6 5,3 5,9 5,5 Poland 3,1 2,5 9,1 6,0 5,3 4,0 5,5 4,7 Portugal 3,0 2,5 13,1 5,9 6,2 5,9 5,2 7,9 Slovakia 5,6 7,7 25,7 9,3 9,8 6,3 8,0 7,5 Spain 4,0 3,0 10,2 7,2 8,0 5,0 6,2 5,3 Sweden 3,6 1,8 10,1 6,4 7,2 5,1 5,9 5,9 Turkey 6,4 4,3 25,3 10,4 10,5 6,0 7,2 8,0 United States 4,7 2,5 10,8 8,4 8,5 9,0 9,4 8,2 OECD average 4,7 4,5 14,5 6,8 7,1 6,2 6,9 6,9 HK China 2,6 2,4 19,1 7,4 7,5 4,5 4,2 7,0 Latvia 3,8 2,8 10,5 7,1 6,4 5,7 4,8 5,0 Source: PISA 2003 dataset. N o data available for France and the United Kingdom.
For the selected student characteristics reported in table 6.19, variation between schools accounts for no more than 15 per cent of the total variation among stu-dents on average across OECD countries.

______________________________________________
Attitudes and Behaviour 136
• This may suggest that, in most countries, comparatively few schools stand out as being particularly likely to have students who report being well-moti-vated, confident, and using effective learning strategies.
The table reveals that the countries characterized by the relatively highest levels of between-school variations are Austria, Korea, Italy, Slovakia, and Turkey. The countries with the lowest between school variations are specially Iceland and Finland but also Poland, Ireland Sweden and Latvia have low between-school variations. • An interesting question to be approached on the basis of table 6.19 is if coun-
tries in which the students follow various tracking systems are characterized by a higher degree of variation between schools compared to countries with comprehensive schooling systems.
The finding that individual schools do not vary greatly in the profile of students’ self-reported approaches to learning nevertheless has important implications, even if it does not imply that all schools are similar with regard to the learner characteristics of their intake. What it does highlight is the large variation in learner characteristics among stu-dents within schools. The large proportion of within-school variation underlines the importance for teachers to be able to engage constructively with the hetero-geneity not only of students' abilities but also of students' approaches to learning. Even in schools that perform well, there are students who lack confidence and motivation and who are not inclined to set and monitor their own learning goals.
6.8. Policy Implications This chapter has focused on student attitudes and student learning behaviour and the relation between these factors and student performance. The results of the analysis should be interpreted cautiously, as the data is based on student self-reports. These self-reports may be influenced by among other things cultural differences between countries. This reservation having been made, we arrive at a number of policy implications from the analysis.
Motivation Matters – Mostly for Reading Performance The analysis has demonstrated that motivation matters for learning outcomes. There is a positive relation between interest in and enjoyment of a subject (mathematics or reading) and the PISA as well as the PIRLS achievement scores of students. The relationship is stronger in reading than in mathematics, with a one point increase in the index for intrinsic motivation for reading resulting in an average increase in student achievement scores of almost 30 points across the OECD countries, and with the index explaining almost 10 per cent of overall variance in student reading performance.
______________________________________________
Attitudes and Behaviour 137
However, interest in and enjoyment of a subject is neither a sufficient nor a nec-essary precondition for high average achievement scores among students. Thus, two of the top-performing countries as regards average PISA mathematics achievement scores, Japan and Finland, are also among the countries in which students express the lowest interest in and enjoyment of mathematics. • In order to promote the reading skills of students, policy makers may con-
sider initiatives which can increase the awareness among students of the in-dividual rewards related to reading. Thus, improving reading skills among students may follow not only from improved teaching and learning of read-ing, but to a great extent also from improving students’ motivation to read. Initiatives which open the eyes of more students to the thrills of reading are likely to have positive effects on reading performances.
Self-Confidence and Anxiety Matter More Data from PISA and TIMSS suggests that students are more likely to achieve high outcome scores if they believe in their own capacities and do not feel anx-ious about the learning process. This picture is valid across the countries ana-lysed. Thus, there is a clear statistical relation between self-confidence – defined in this connection as a positive self-concept and high self-efficacy – and average achie-vement scores in reading and mathematics. Self-concept (students’ self-perception of their skills and abilities in mathematics and reading) explains more than 10 per cent of overall variation in student per-formance for mathematics across OECD countries (PISA 2003) and almost 25 per cent of overall variation in student performance for reading (PISA 2001). Data from TIMSS (2003) confirms the strong relation between self-confidence and performance in mathematics. Self-efficacy – measuring how well students think that they can handle even difficult tasks – explains more than 20 per cent of total variation in student performance in both mathematics (PISA 2003) and reading (PISA 2000). Along these lines, anxiety is negatively related to performance in mathematics, with students’ perceived level of anxiety explaining almost 13 per cent of the total variation in student performance in mathematics in the PISA 2003 survey and more than 15 per cent of total variation in student achievement scores in a number of countries. Multivariate analysis of PISA 2003 data confirms that even when accounting for several other factors, the significance of anxiety for per-formance in mathematics remains. • Since a number of background factors can be expected to affect students’
self-confidence and levels of anxiety in relation to academic performance, policy makers may consider whether enough is done in each country’s edu-cation system to stimulate students’ self-confidence and – as regards the learning of mathematics - reduce anxiety.
______________________________________________
Attitudes and Behaviour 138
Different Learning Strategies Not Related to Performance The PISA-surveys highlight that different learning strategies (control, memoriza-tion, elaboration) are not related to the achievement scores of students in mathe-matics and reading. Similarly, the relation between different learning situations (cooperative learning, competitive learning) and performance in mathematics and reading is very weak. • The data from PISA 2000 and 2003 does not suggest that there are specific
and clearly identifiable advantages related to specific learning strategies and learning situations. Policy makers are well advised, therefore, to avoid poli-cies and initiatives which focus too one-sidedly on specific learning strate-gies and learning situations.
Intense Competition May Yield Results, But Possibly at a Cost Students from the studied East Asian countries (Japan, Hong Kong China, and Korea) display above-average levels of anxiety, lower levels of intrinsic motiva-tion (interest in and enjoyment of a subject area),42 low instrumental motivation (the significance for motivation accorded to external rewards), and a low sense of belonging to schools and negative attitudes towards schools’ ability to prepare students for adult life. In contrast, students from Denmark have above-average self-confidence in mathematics and reading, below-average levels of anxiety in mathematics, and are among the students with the highest intrinsic motivation in reading and mathematics. The low levels of enjoyment and interest and the high levels of anxiety and the negative attitudes towards schools’ ability to prepare students for adult life make sense as a result of the extremely competitive nature of the education systems in Hong Kong China, Japan, and Korea. These findings have no immediate bearing on the average student achievement scores in mathematics and reading. On average, the students of Japan, Hong Kong China, and Korea, are among the best in these two subject areas, cf. Table 4.1. However, it cannot be ruled out that there may be longer term costs that are not captured by tests such as PISA. The prospects of adults engaging actively and enthusiastically in life-long learning may be affected negatively if their ex-periences from primary and secondary education have been characterized by high levels of stress and anxiety. • In looking for ways to improve the level of basic skills in their populations,
policy makers are well advised to adopt a long-term perspective. Increased competition among students in educational systems may yield short-term benefits in for instance tests such as those employed by PISA. But there may be negative long-term effects of experiences from extremely competitive learning environments.
42 Students from Hong Kong China in PISA 2003 (mathematics) are the exception to the rule in this respect.

______________________________________________
Attitudes and Behaviour 139
Larger Differences within Schools than Between Schools The analysis suggests that differences between schools in students’ self-reported characteristics are far less pronounced than the differences within schools. This means that in most countries, comparatively few schools stand out as being par-ticularly likely to have students who report being well-motivated, confident and using effective learning strategies. In other words: the heterogeneity is higher within schools than between schools. This fact supports the thesis that the school factors only to a relatively limited extent influence students’ attitudes to learning, compared to for example student background or systemic factors. The high degree of heterogeneity within schools points to the importance for schools to engage with the heterogeneity of the student body. This is the case not only with respect to students’ abilities but also with respect to their attitudes and approaches to learning. This may have implications at the level of educational systems, as the results suggest that education systems need to invest in pedagogical approaches that address the individual student’s attitudes and learning behaviour both in order to improve his or her performance and as a goal in its own right to facilitate life-long learning. It may also have implications for the education and training of teachers who have to handle the heterogeneity of the student body in their daily interaction with the students. • Policy makers should consider whether enough is done in their respective
countries’ approaches to education to address the heterogeneity of students and students’ motivation and attitudes.
• Initiatives for increasing the attention being paid to student heterogeneity and individual needs in terms of attitudes and learning behaviour may pertain to both the education of teachers and the organization of education.

______________________________________________
Implications and Recommendations 140
7. The Educational Environment and Basic Skills This chapter focuses on the educational environment of students and the relation between this environment and performance at the level of schools and students. In accordance with the analytical framework in Chapter 3, we first analyse a number factors related to the organization of education. Key factors that are con-sidered are the degree of school autonomy, public vs. private organization of schooling, the degree of institutional differentiation in primary and secondary education structure, and the significance of pre-schooling. In the second part of the chapter we address a separate set of factors under the heading of the learning environment of students. In this context, the learning environment concerns factors related to the actual teaching and learning proc-esses at school and classroom level. These include the use of student assess-ments, the disciplinary climate of schools, the extent of learning (time devoted to teaching and learning inside and outside of school), and also factors concerning the conditions of learning related to economic scarcity: the availability of quali-fied teachers, physical school infrastructure, and educational resources (instruc-tion material, computers etc.).
7.1. The Organization of Education In Section 4.3 we briefly analysed the significance of education structure for the variance of student performance and for between-school variance, one conclu-sion being that in tracking systems, the standard deviation around average stu-dent performance scores was higher than in comprehensive systems, and that between-school variance in average achievement scores is higher in tracking systems than in comprehensive systems. This section takes a closer look at a number of aspects of the structure of educa-tion systems and the implications for achievement scores in PISA, TIMSS, and PIRLS. For PISA, the dependent variable is most often the average student achievement score in mathematics. The results are broadly identical if the aver-age achievement score in reading is taken as the dependent variable. It must be emphasized that large-scale quantitative tests and surveys like PISA, TIMSS, and PIRLS, are only able to capture a limited range of school policies and practices that can be easily quantified by school principals and (in the case of TIMSS and PIRLS) teachers, and where cross-country comparisons can be made.
School Management and School Autonomy In PISA 2003, a number of characteristics of school management and school autonomy were examined. School principals were asked to report whether teach-
______________________________________________
Implications and Recommendations 141
ers, department heads, the principal, or an appointed or elected board, had re-sponsibility for following range of decisions: • appointing teachers • dismissing teachers • establishing teachers’ starting salaries • determining teachers' salary increases • formulating school budgets • allocating budgets within the school • establishing student disciplinary policies • establishing student assessment policies • approving students for admittance to school • choosing which textbooks to use • determining course content, and • deciding which courses that were offered. The questionnaire data from PISA 2003 suggests that schools tend to have little control over teacher salaries, but more over the hiring and firing of teachers. The majority of 15-year-olds are also enrolled in schools where schools report play-ing a role in course content and course offerings. The degrees to which schools play a role in the formulation of their budgets vary greatly between countries. Only a low share of schools (15 per cent) in Austria, Germany, and Luxembourg, report some responsibility in this area, whereas this is the case in more than 80 per cent of the schools in Belgium, the Czech Repub-lic, Finland, Hungary, Portugal, Slovakia, Spain, Sweden, and the United States, and more than 90 per cent in Denmark, Iceland, Korea, and the Netherlands. Almost all schools (OECD average 95 per cent) report having some responsibil-ity for decisions concerning how money is spent. On average, most school principals also report that schools have some responsi-bility with respect to disciplinary policies, the choice of textbooks and admis-sions. In most countries, the majority of 15-year-olds are enrolled in schools whose principals report that regional or national authorities have a direct influ-ence on decision-making as regards student assessments (tests etc.).
School Autonomy and Student Performance The relation between the different aspects of school autonomy and management on the one hand and student performance on the other hand is weak when focus is on student performance within a given country. This is not surprising, since national legislation frequently specifies the distribution of decision-making re-sponsibilities. Consequently, there is often very little variation within countries in the degree of school autonomy in various respects. However, when looking at differences in average student performance across countries, the data in table 7.1 suggests that:
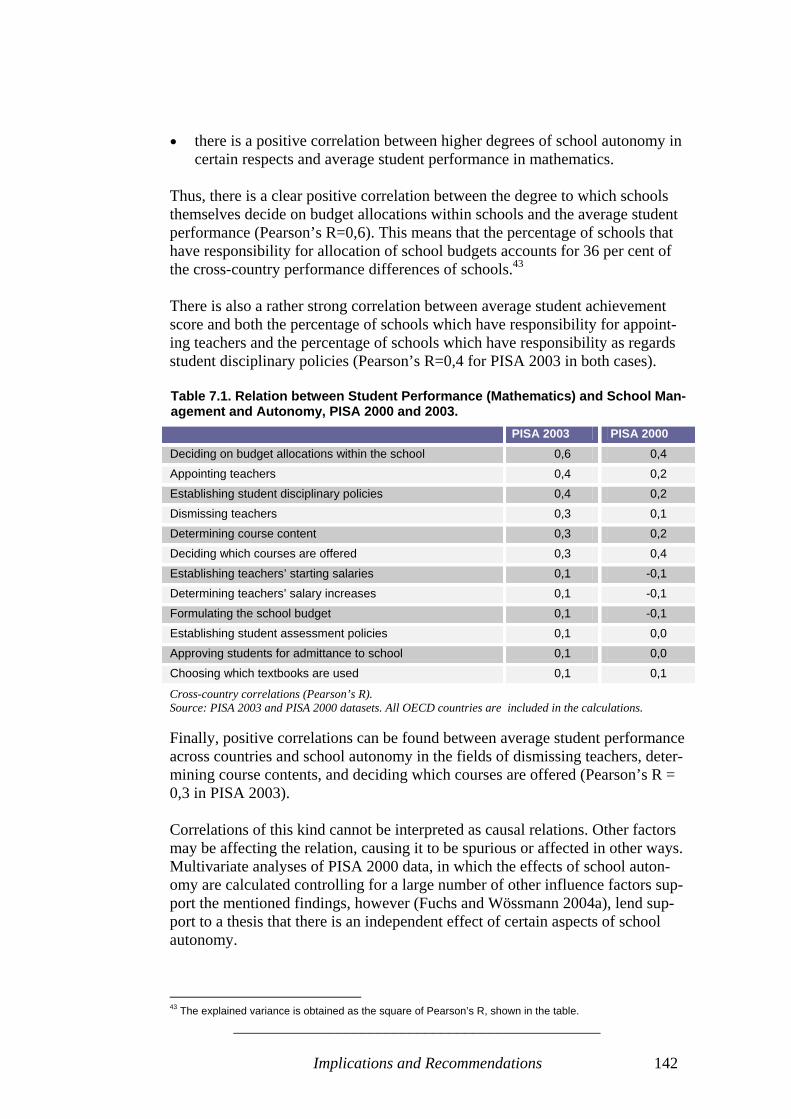
______________________________________________
Implications and Recommendations 142
• there is a positive correlation between higher degrees of school autonomy in certain respects and average student performance in mathematics.
Thus, there is a clear positive correlation between the degree to which schools themselves decide on budget allocations within schools and the average student performance (Pearson’s R=0,6). This means that the percentage of schools that have responsibility for allocation of school budgets accounts for 36 per cent of the cross-country performance differences of schools.43 There is also a rather strong correlation between average student achievement score and both the percentage of schools which have responsibility for appoint-ing teachers and the percentage of schools which have responsibility as regards student disciplinary policies (Pearson’s R=0,4 for PISA 2003 in both cases). Table 7.1. Relation between Student Performance (Mathematics) and School Man-agement and Autonomy, PISA 2000 and 2003. PISA 2003 PISA 2000 Deciding on budget allocations within the school 0,6 0,4
Appointing teachers 0,4 0,2
Establishing student disciplinary policies 0,4 0,2
Dismissing teachers 0,3 0,1
Determining course content 0,3 0,2
Deciding which courses are offered 0,3 0,4
Establishing teachers’ starting salaries 0,1 -0,1
Determining teachers’ salary increases 0,1 -0,1
Formulating the school budget 0,1 -0,1
Establishing student assessment policies 0,1 0,0
Approving students for admittance to school 0,1 0,0
Choosing which textbooks are used 0,1 0,1
Cross-country correlations (Pearson’s R). Source: PISA 2003 and PISA 2000 datasets. All OECD countries are included in the calculations. Finally, positive correlations can be found between average student performance across countries and school autonomy in the fields of dismissing teachers, deter-mining course contents, and deciding which courses are offered (Pearson’s R = 0,3 in PISA 2003). Correlations of this kind cannot be interpreted as causal relations. Other factors may be affecting the relation, causing it to be spurious or affected in other ways. Multivariate analyses of PISA 2000 data, in which the effects of school auton-omy are calculated controlling for a large number of other influence factors sup-port the mentioned findings, however (Fuchs and Wössmann 2004a), lend sup-port to a thesis that there is an independent effect of certain aspects of school autonomy.
43 The explained variance is obtained as the square of Pearson’s R, shown in the table.
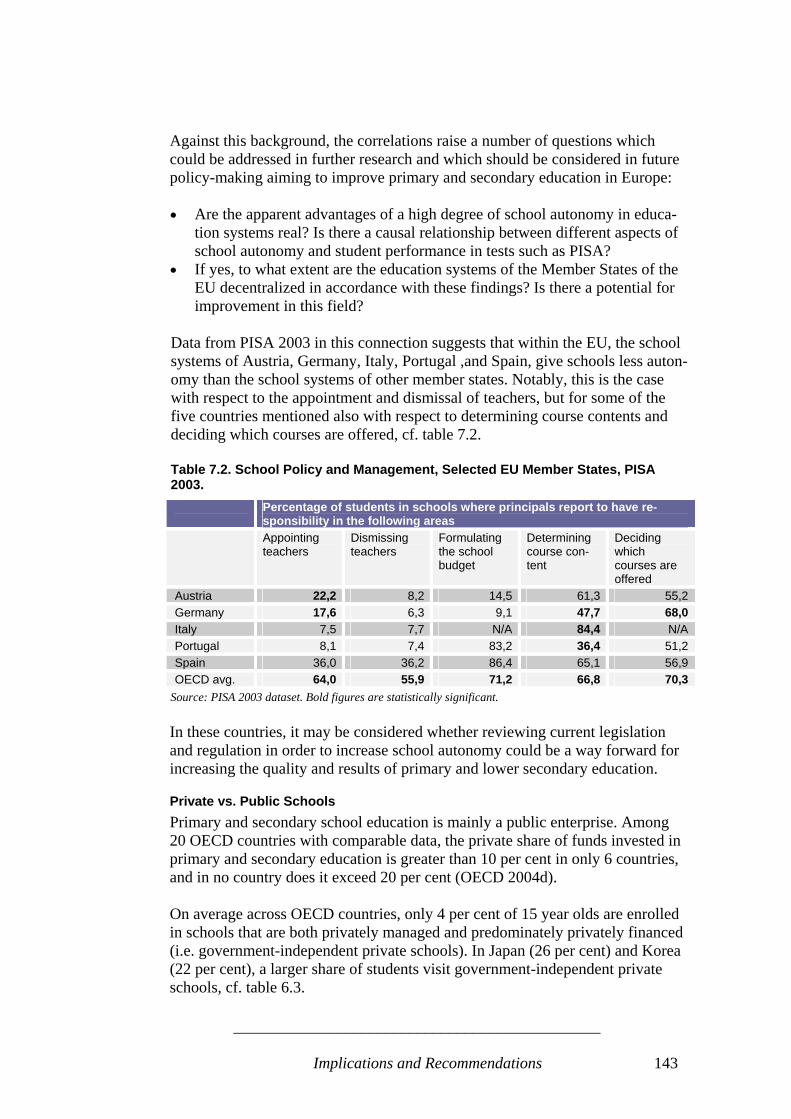
______________________________________________
Implications and Recommendations 143
Against this background, the correlations raise a number of questions which could be addressed in further research and which should be considered in future policy-making aiming to improve primary and secondary education in Europe: • Are the apparent advantages of a high degree of school autonomy in educa-
tion systems real? Is there a causal relationship between different aspects of school autonomy and student performance in tests such as PISA?
• If yes, to what extent are the education systems of the Member States of the EU decentralized in accordance with these findings? Is there a potential for improvement in this field?
Data from PISA 2003 in this connection suggests that within the EU, the school systems of Austria, Germany, Italy, Portugal ,and Spain, give schools less auton-omy than the school systems of other member states. Notably, this is the case with respect to the appointment and dismissal of teachers, but for some of the five countries mentioned also with respect to determining course contents and deciding which courses are offered, cf. table 7.2. Table 7.2. School Policy and Management, Selected EU Member States, PISA 2003. Percentage of students in schools where principals report to have re-
sponsibility in the following areas Appointing
teachers Dismissing teachers
Formulating the school budget
Determining course con-tent
Deciding which courses are offered
Austria 22,2 8,2 14,5 61,3 55,2 Germany 17,6 6,3 9,1 47,7 68,0 Italy 7,5 7,7 N/A 84,4 N/A Portugal 8,1 7,4 83,2 36,4 51,2 Spain 36,0 36,2 86,4 65,1 56,9 OECD avg. 64,0 55,9 71,2 66,8 70,3
Source: PISA 2003 dataset. Bold figures are statistically significant. In these countries, it may be considered whether reviewing current legislation and regulation in order to increase school autonomy could be a way forward for increasing the quality and results of primary and lower secondary education.
Private vs. Public Schools Primary and secondary school education is mainly a public enterprise. Among 20 OECD countries with comparable data, the private share of funds invested in primary and secondary education is greater than 10 per cent in only 6 countries, and in no country does it exceed 20 per cent (OECD 2004d). On average across OECD countries, only 4 per cent of 15 year olds are enrolled in schools that are both privately managed and predominately privately financed (i.e. government-independent private schools). In Japan (26 per cent) and Korea (22 per cent), a larger share of students visit government-independent private schools, cf. table 6.3.

______________________________________________
Implications and Recommendations 144
Schools that are privately managed but predominately financed by public funds (i.e. government-dependent private schools) are more common. On average across the OECD, 13 per cent of 15 year olds are enrolled in such government-dependent private schools. In the Netherlands, Ireland, Korea, Spain, and Den-mark, the share of students in government-dependent private schools is signifi-cantly higher than this, according to reports from school principals ranging from more than 75 per cent in the Netherlands to 22 per cent in Denmark. Table 7.3. Distribution of Students across Types of Schools, PISA 2003. Government-
Independent PrivateGovernment-
Dependent Private Public
Japan 26 1 73
Korea 22 36 42
Spain 8 28 64
United States 6 0 94
Italy 4 0 96
Greece 3 0 97 EU average 2 11 87 Portugal 2 4 94
Austria 1 7 92
Hungary 1 10 89
Turkey 1 0 99
Latvia 1 0 99
Ireland 1 58 42
Czech Republic 1 6 93
Denmark 1 22 78
Iceland 1 0 100
Germany 0 8 92
HK China 0 7 93
Poland 0 0 99
Netherlands 0 77 23
Luxembourg 0 14 86
Slovakia 0 13 87
Finland 0 7 93
Sweden 0 4 96
Norway 0 1 99
Source: PISA 2003 dataset. Based on reports from principals. Data not available from Belgium, France, and the United Kingdom. It should be noted that there are frequently important qualitative differences be-tween private schools in different countries, even within the group of govern-ment-independent private schools or within the group of government-dependent private schools. In some countries, private schools tend to be elitist in terms of the socio-economic or other profile of their student intake. In other countries, private schools are to a higher extent founded on specific pedagogical, religious,
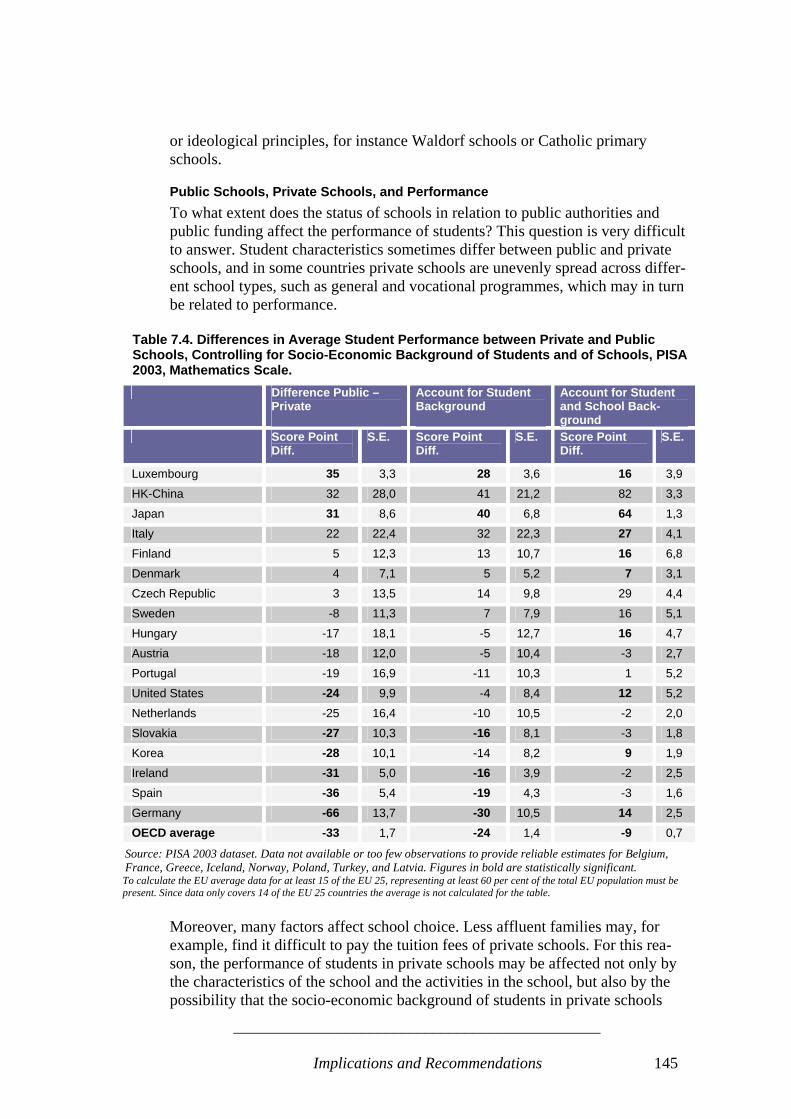
______________________________________________
Implications and Recommendations 145
or ideological principles, for instance Waldorf schools or Catholic primary schools.
Public Schools, Private Schools, and Performance To what extent does the status of schools in relation to public authorities and public funding affect the performance of students? This question is very difficult to answer. Student characteristics sometimes differ between public and private schools, and in some countries private schools are unevenly spread across differ-ent school types, such as general and vocational programmes, which may in turn be related to performance.
Table 7.4. Differences in Average Student Performance between Private and Public Schools, Controlling for Socio-Economic Background of Students and of Schools, PISA 2003, Mathematics Scale. Difference Public –
Private
Account for Student Background
Account for Student and School Back-ground
Score Point Diff.
S.E. Score Point Diff.
S.E. Score Point Diff.
S.E.
Luxembourg 35 3,3 28 3,6 16 3,9
HK-China 32 28,0 41 21,2 82 3,3
Japan 31 8,6 40 6,8 64 1,3
Italy 22 22,4 32 22,3 27 4,1
Finland 5 12,3 13 10,7 16 6,8
Denmark 4 7,1 5 5,2 7 3,1
Czech Republic 3 13,5 14 9,8 29 4,4
Sweden -8 11,3 7 7,9 16 5,1
Hungary -17 18,1 -5 12,7 16 4,7
Austria -18 12,0 -5 10,4 -3 2,7
Portugal -19 16,9 -11 10,3 1 5,2
United States -24 9,9 -4 8,4 12 5,2
Netherlands -25 16,4 -10 10,5 -2 2,0
Slovakia -27 10,3 -16 8,1 -3 1,8
Korea -28 10,1 -14 8,2 9 1,9
Ireland -31 5,0 -16 3,9 -2 2,5
Spain -36 5,4 -19 4,3 -3 1,6
Germany -66 13,7 -30 10,5 14 2,5 OECD average -33 1,7 -24 1,4 -9 0,7
Source: PISA 2003 dataset. Data not available or too few observations to provide reliable estimates for Belgium, France, Greece, Iceland, Norway, Poland, Turkey, and Latvia. Figures in bold are statistically significant. To calculate the EU average data for at least 15 of the EU 25, representing at least 60 per cent of the total EU population must be present. Since data only covers 14 of the EU 25 countries the average is not calculated for the table.
Moreover, many factors affect school choice. Less affluent families may, for example, find it difficult to pay the tuition fees of private schools. For this rea-son, the performance of students in private schools may be affected not only by the characteristics of the school and the activities in the school, but also by the possibility that the socio-economic background of students in private schools

______________________________________________
Implications and Recommendations 146
differs systematically from the socio-economic background of students in public schools. In Table 7.4 some of these reservations are taken into account. The second col-umn displays the difference in average student achievement scores between stu-dents enrolled in public schools and students enrolled in private (government-dependent or government-independent) schools. Negative figures point to a per-formance advantage for private schools, positive figures to a performance advan-tage for public schools. It appears that overall, students from private schools perform better than students from public schools, even if there are significant differences between countries. In Luxembourg, Hong-Kong China, Japan, and Italy, students from public schools appear to perform better. However, these differences to a great extent disappear when controlling for the socio-economic background of students (col-umn 4) and even more so when controlling both for the socio-economic back-ground of students and the socio-economic intake of schools (column 6). On the basis of PISA 2003 data, one cannot therefore conclude that private schools deliver better results in terms of achievement scores in tests such as those in PISA. The fact that in most countries, students from private schools perform better, is due to the fact that these students have a socio-economic background which is more stimulating for their academic performance than stu-dents in public schools, just as private schools benefit from a more favourable intake of students in terms of socio-economic background. However, in a multivariate analysis of PISA 2000-data performed at the level of individuals, Fuchs and Wössmann (2004a) find that students in schools that are privately operated perform better than students from schools that are publicly operated. This finding is calculated holding a large number of other influence factors constant, at it is thus robust to controlling for the composition of the stu-dent population in the different types of schools. In contrast, the share of private funding that a school receives is not related to superior performance. The authors conclude that it seems conducive to student performance if schools are privately operated but at the same time mainly publicly financed.
Institutional Differentiation School systems differ as regards the degree to which differentiations are made between students. Some countries have comprehensive, non-selective school systems that aim to provide all students with similar opportunities for learning. The guiding principle is to require from each school that it can cater for the full range of students, regardless of initial student abilities and performance. In other systems, differences in student abilities and performances are responded to by forming groups of students through selection, either between schools or between classes within schools. The guiding principle in such systems is that teaching and learning will yield the best overall results when students are divi-

______________________________________________
Implications and Recommendations 147
ded according to their academic potential and/or interests in specific program-mes. However, the question whether school systems follow a strategy of non-selec-tiveness or a strategy of differentiation is not clear cut. All existing systems con-tain elements of differentiation, but the degree and character of differentiation can vary. The spectrum from comprehensive systems to differentiated systems is therefore a continuous spectrum where a number of characteristics of school systems are relevant. Table 7.5: Degrees of Institutional Differentiation in School Systems
Average of the standardized indices
Netherlands 1,60
Austria 1,21
Germany 1,15
Belgium 0,94
Turkey 0,76
Luxembourg 0,74
Czech Republic 0,73
Hungary 0,50
Slovakia 0,49
France 0,41
Ireland 0,25
Portugal 0,14
Korea 0,11
Italy -0,03
Greece -0,15
Japan -0,22
Poland -0,27
Spain -0,43
United States -0,76
Norway -0,88
Denmark -0,89
Sweden -0,89
Finland -0,90
Iceland -0,92
Source: PISA 2003 dataset, OECD 2004c. Data not available for HK China and the United Kingdom. Based on PISA 2003 data, Table 7.5 displays an overview for a number of coun-tries of the degree to which school systems are differentiated school systems. The figures are the average of the standardized indices for 4 variables: a) the first age of selection in the education system (the age of the first differentiation of students), b) the number of school types or distinct educational programmes available to 15-year-olds, c) the proportion of grade repeaters in primary educa-tion, lower secondary education, and upper secondary education, and d) the pro-

______________________________________________
Implications and Recommendations 148
portion of 15-year-olds enrolled in programmes that give access to vocational studies at the next programme level or direct access to the labour market. Index values can range from -2 to +2. In the table, the higher the value, the higher the degree of institutional differentiation in the country’s school system. It appears that on the basis of these 4 types of variables, the school systems of the Netherlands, Austria, Germany, and Belgium, are the most differentiated systems among the countries concerned. On the opposite end of the scale, the Nordic countries (Denmark, Sweden, Norway, Finland, and Iceland) are the countries with the least differentiated school systems.
Institutional Differentiation and Performance Does institutional differentiation affect the mean performance of students in tests such as the ones operated in PISA? The correlation matrix in Table 7.6 provides an overview of the statistical relations between a number of the variables related to institutional differentiation as well as between these variables and the mean mathematics achievement score. Other variables that are included in the table are the standard deviation of per-formance scores on the mathematics scale, total variance in student performance between schools, and the strength of the relationship between the PISA index of economic, social, and cultural background, and student performance. • One result is that there is no clear statistical relation between the average
performance of students on the mathematics scale and the various variables measuring the institutional differentiation of school systems.
This is also intuitively clear when considering in Table 7.5 that countries with relatively high average achievement scores (e.g. Finland and the Netherlands) are located at opposite ends of the institutional differentiation continuum. From Table 7.6 it appears that the relation between the number of school types or distinct educational programmes available to 15-year-olds and mean achieve-ment scores on the mathematics scale is virtually absent (column 2, row 8). Cor-relations are somewhat stronger for the other variables measuring institutional differentiation, but none of them are statistically significant. However, there is a relatively strong correlation (R=0,62) between the number of school types or distinct educational programmes available to 15-year-olds and the total variance in student performance between schools (column 2, row 10 in Table 7.6). This means that the number of distinct school types or educational programmes accounts for 39 per cent of the share of the OECD average variation that lies between schools.44 There is also a strong correlation between the proportion of 15-year-olds en-rolled in programmes that give access to vocational studies at the next pro-
44 The proportion of explained variation is obtained by squaring the correlation shown in Table 6.6.
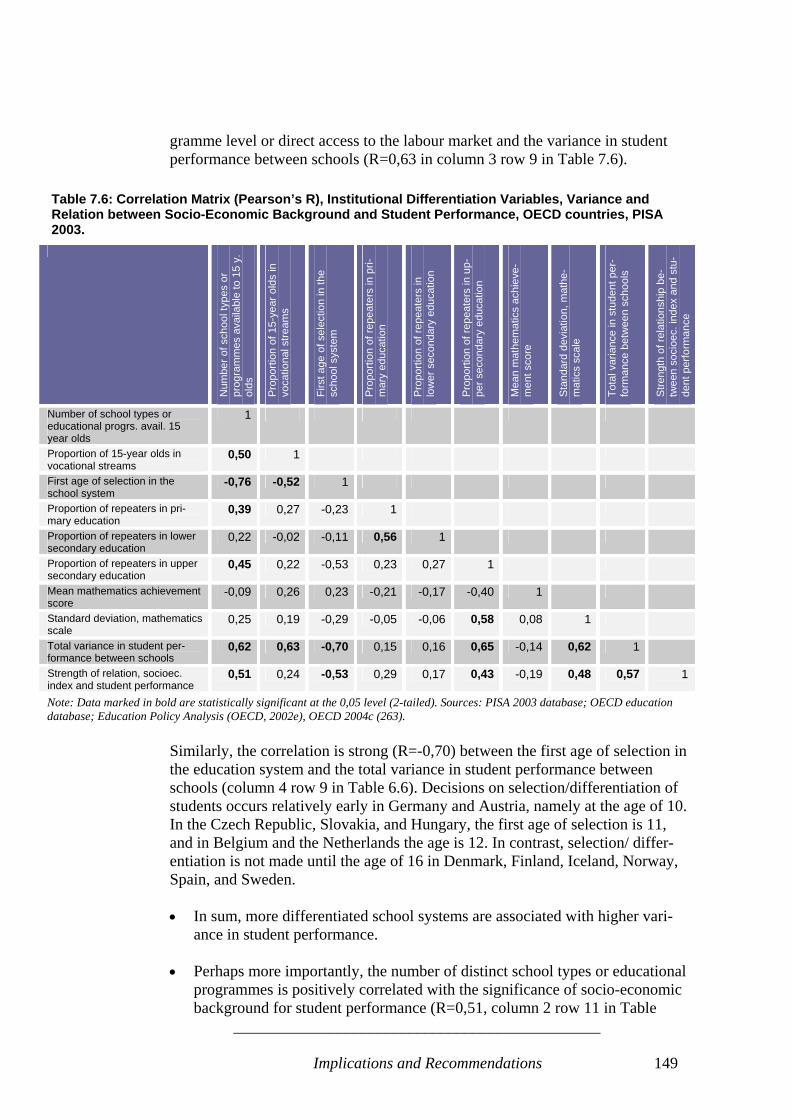
______________________________________________
Implications and Recommendations 149
gramme level or direct access to the labour market and the variance in student performance between schools (R=0,63 in column 3 row 9 in Table 7.6).
Table 7.6: Correlation Matrix (Pearson’s R), Institutional Differentiation Variables, Variance and Relation between Socio-Economic Background and Student Performance, OECD countries, PISA 2003.
Num
ber o
f sch
ool t
ypes
or
prog
ram
mes
ava
ilabl
e to
15
y.
olds
Pro
porti
on o
f 15-
year
old
s in
vo
catio
nal s
tream
s
Firs
t age
of s
elec
tion
in th
e sc
hool
sys
tem
Pro
porti
on o
f rep
eate
rs in
pri-
mar
y ed
ucat
ion
Pro
porti
on o
f rep
eate
rs in
lo
wer
sec
onda
ry e
duca
tion
Pro
porti
on o
f rep
eate
rs in
up-
per s
econ
dary
edu
catio
n
Mea
n m
athe
mat
ics
achi
eve-
men
t sco
re
Sta
ndar
d de
viat
ion,
mat
he-
mat
ics
scal
e
Tota
l var
ianc
e in
stu
dent
per
-fo
rman
ce b
etw
een
scho
ols
Stre
ngth
of r
elat
ions
hip
be-
twee
n so
cioe
c. in
dex
and
stu-
dent
per
form
ance
Number of school types or educational progrs. avail. 15 year olds
1
Proportion of 15-year olds in vocational streams
0,50 1
First age of selection in the school system
-0,76 -0,52 1
Proportion of repeaters in pri-mary education
0,39 0,27 -0,23 1
Proportion of repeaters in lower secondary education
0,22 -0,02 -0,11 0,56 1
Proportion of repeaters in upper secondary education
0,45 0,22 -0,53 0,23 0,27 1
Mean mathematics achievement score
-0,09 0,26 0,23 -0,21 -0,17 -0,40 1
Standard deviation, mathematics scale
0,25 0,19 -0,29 -0,05 -0,06 0,58 0,08 1
Total variance in student per-formance between schools
0,62 0,63 -0,70 0,15 0,16 0,65 -0,14 0,62 1
Strength of relation, socioec. index and student performance
0,51 0,24 -0,53 0,29 0,17 0,43 -0,19 0,48 0,57 1
Note: Data marked in bold are statistically significant at the 0,05 level (2-tailed). Sources: PISA 2003 database; OECD education database; Education Policy Analysis (OECD, 2002e), OECD 2004c (263).
Similarly, the correlation is strong (R=-0,70) between the first age of selection in the education system and the total variance in student performance between schools (column 4 row 9 in Table 6.6). Decisions on selection/differentiation of students occurs relatively early in Germany and Austria, namely at the age of 10. In the Czech Republic, Slovakia, and Hungary, the first age of selection is 11, and in Belgium and the Netherlands the age is 12. In contrast, selection/ differ-entiation is not made until the age of 16 in Denmark, Finland, Iceland, Norway, Spain, and Sweden. • In sum, more differentiated school systems are associated with higher vari-
ance in student performance. • Perhaps more importantly, the number of distinct school types or educational
programmes is positively correlated with the significance of socio-economic background for student performance (R=0,51, column 2 row 11 in Table
______________________________________________
Implications and Recommendations 150
7.6). This means that the number of school types or educational programmes accounts for 26 per cent of the cross-country variation among countries in the strength of the relation between socio-economic background and student performance.
This is also reflected in the fact that there is a positive relation between the first age of selection (differentiation) of students in the school system and the strength of the relation between student socio-economic background and student performance. The correlation displayed in column 4, row 11 is -0,53, meaning that the first age of selection accounts for 28 per cent of the cross-country variation among coun-tries in the strength of the relation between socio-economic background and stu-dent performance. Education systems with lower ages of selection thus tend to have much larger social disparities. • Students’ socio-economic background thus matters more for their perform-
ance in more differentiated school systems than in less differentiated school systems. Or in other words: Less differentiated, more comprehensive school systems are more efficient in adjusting for students’ socio-economic back-ground and thus in providing equal learning opportunities for students.
Students in Differentiated School Systems Receive Less Teacher Support It is noteworthy in this connection, that the majority of the countries in which students report a comparatively low level of individual support from their teach-ers are also those with a particularly high degree of institutional differentiation, cf. Table 7.7. In Austria, Germany, the Netherlands, the Czech Republic and Slovakia, and Luxembourg - 6 countries that are among the 9 most differentiated school sys-tems in Table 7.5 above – less than half or only about half of the students thus say that their mathematics teacher shows interest in every student’s learning in most lessons or every lesson. Moreover, in these five countries only little more than half of the students say that their teachers provide an opportunity of students to express their opinions in most or every lesson, and only between 45 and 59 per cent of students say that their teachers help them with their learning in most lessons or all lessons. In contrast, the students of the Nordic countries – the least differentiated school systems – report relatively high levels of teacher support in mathematics. • Countries with a relatively high degree of differentiation in their school sys-
tems (not least Austria, Germany, the Netherlands, and Belgium) may con-sider whether their systems tend to reinforce social disparities in ways that are detrimental to the overall development of the societies concerned.
• They may also consider whether sufficient teacher support is provided to the pupils most in need of this support.
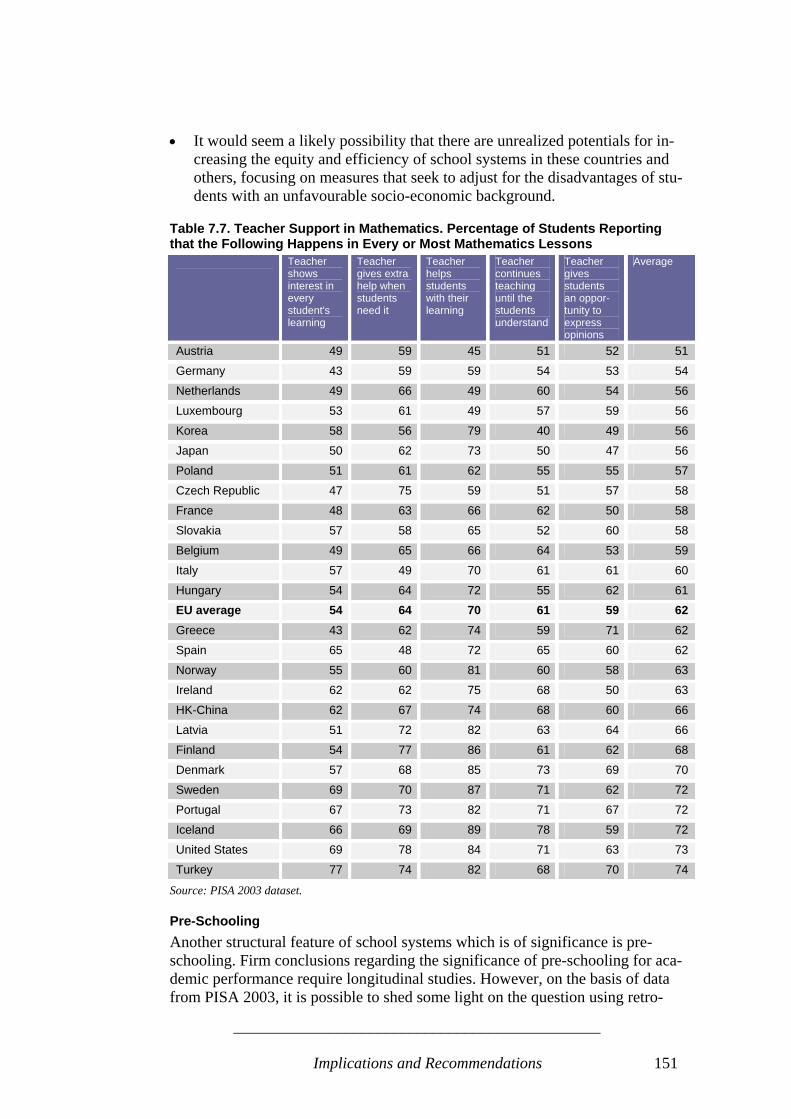
______________________________________________
Implications and Recommendations 151
• It would seem a likely possibility that there are unrealized potentials for in-creasing the equity and efficiency of school systems in these countries and others, focusing on measures that seek to adjust for the disadvantages of stu-dents with an unfavourable socio-economic background.
Table 7.7. Teacher Support in Mathematics. Percentage of Students Reporting that the Following Happens in Every or Most Mathematics Lessons Teacher
shows interest in every student's learning
Teacher gives extra help when students need it
Teacher helps students with their learning
Teacher continues teaching until the students understand
Teacher gives students an oppor-tunity to express opinions
Average
Austria 49 59 45 51 52 51
Germany 43 59 59 54 53 54
Netherlands 49 66 49 60 54 56
Luxembourg 53 61 49 57 59 56
Korea 58 56 79 40 49 56
Japan 50 62 73 50 47 56
Poland 51 61 62 55 55 57
Czech Republic 47 75 59 51 57 58
France 48 63 66 62 50 58
Slovakia 57 58 65 52 60 58
Belgium 49 65 66 64 53 59
Italy 57 49 70 61 61 60
Hungary 54 64 72 55 62 61 EU average 54 64 70 61 59 62 Greece 43 62 74 59 71 62
Spain 65 48 72 65 60 62
Norway 55 60 81 60 58 63
Ireland 62 62 75 68 50 63
HK-China 62 67 74 68 60 66
Latvia 51 72 82 63 64 66
Finland 54 77 86 61 62 68
Denmark 57 68 85 73 69 70
Sweden 69 70 87 71 62 72
Portugal 67 73 82 71 67 72
Iceland 66 69 89 78 59 72
United States 69 78 84 71 63 73
Turkey 77 74 82 68 70 74
Source: PISA 2003 dataset.
Pre-Schooling Another structural feature of school systems which is of significance is pre-schooling. Firm conclusions regarding the significance of pre-schooling for aca-demic performance require longitudinal studies. However, on the basis of data from PISA 2003, it is possible to shed some light on the question using retro-
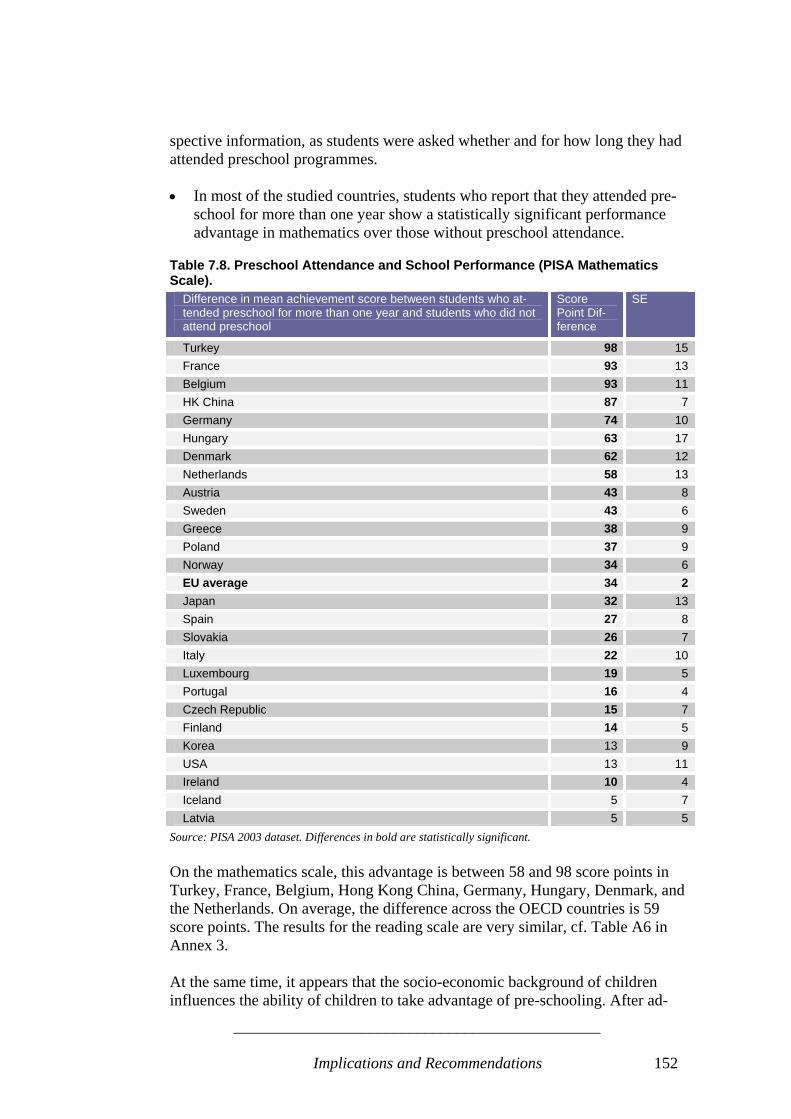
______________________________________________
Implications and Recommendations 152
spective information, as students were asked whether and for how long they had attended preschool programmes. • In most of the studied countries, students who report that they attended pre-
school for more than one year show a statistically significant performance advantage in mathematics over those without preschool attendance.
Table 7.8. Preschool Attendance and School Performance (PISA Mathematics Scale).
Difference in mean achievement score between students who at-tended preschool for more than one year and students who did not attend preschool
Score Point Dif-ference
SE
Turkey 98 15 France 93 13 Belgium 93 11 HK China 87 7 Germany 74 10 Hungary 63 17 Denmark 62 12 Netherlands 58 13 Austria 43 8 Sweden 43 6 Greece 38 9 Poland 37 9 Norway 34 6 EU average 34 2 Japan 32 13 Spain 27 8 Slovakia 26 7 Italy 22 10 Luxembourg 19 5 Portugal 16 4 Czech Republic 15 7 Finland 14 5 Korea 13 9 USA 13 11 Ireland 10 4 Iceland 5 7 Latvia 5 5
Source: PISA 2003 dataset. Differences in bold are statistically significant. On the mathematics scale, this advantage is between 58 and 98 score points in Turkey, France, Belgium, Hong Kong China, Germany, Hungary, Denmark, and the Netherlands. On average, the difference across the OECD countries is 59 score points. The results for the reading scale are very similar, cf. Table A6 in Annex 3. At the same time, it appears that the socio-economic background of children influences the ability of children to take advantage of pre-schooling. After ad-
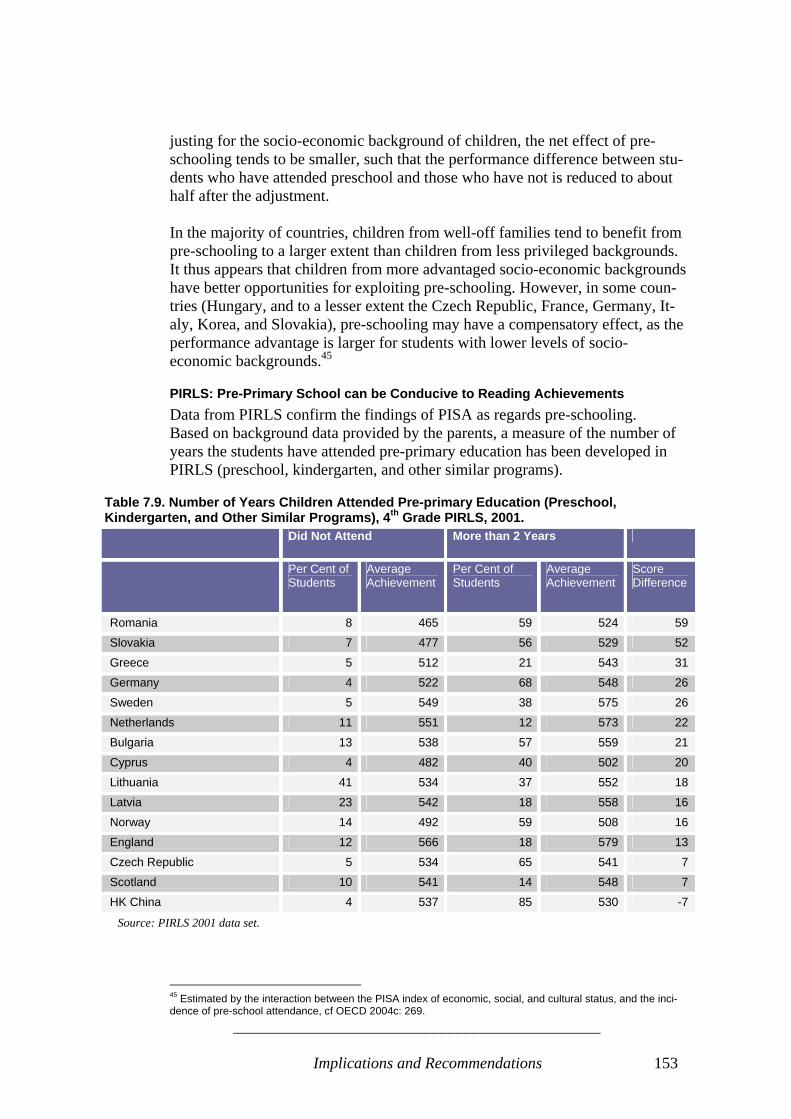
______________________________________________
Implications and Recommendations 153
justing for the socio-economic background of children, the net effect of pre-schooling tends to be smaller, such that the performance difference between stu-dents who have attended preschool and those who have not is reduced to about half after the adjustment. In the majority of countries, children from well-off families tend to benefit from pre-schooling to a larger extent than children from less privileged backgrounds. It thus appears that children from more advantaged socio-economic backgrounds have better opportunities for exploiting pre-schooling. However, in some coun-tries (Hungary, and to a lesser extent the Czech Republic, France, Germany, It-aly, Korea, and Slovakia), pre-schooling may have a compensatory effect, as the performance advantage is larger for students with lower levels of socio-economic backgrounds.45
PIRLS: Pre-Primary School can be Conducive to Reading Achievements Data from PIRLS confirm the findings of PISA as regards pre-schooling. Based on background data provided by the parents, a measure of the number of years the students have attended pre-primary education has been developed in PIRLS (preschool, kindergarten, and other similar programs).
Table 7.9. Number of Years Children Attended Pre-primary Education (Preschool, Kindergarten, and Other Similar Programs), 4th Grade PIRLS, 2001. Did Not Attend More than 2 Years
Per Cent of Students
Average Achievement
Per Cent of Students
Average Achievement
Score Difference
Romania 8 465 59 524 59
Slovakia 7 477 56 529 52
Greece 5 512 21 543 31
Germany 4 522 68 548 26
Sweden 5 549 38 575 26
Netherlands 11 551 12 573 22
Bulgaria 13 538 57 559 21
Cyprus 4 482 40 502 20
Lithuania 41 534 37 552 18
Latvia 23 542 18 558 16
Norway 14 492 59 508 16
England 12 566 18 579 13
Czech Republic 5 534 65 541 7
Scotland 10 541 14 548 7
HK China 4 537 85 530 -7
Source: PIRLS 2001 data set.
45 Estimated by the interaction between the PISA index of economic, social, and cultural status, and the inci-dence of pre-school attendance, cf OECD 2004c: 269.
______________________________________________
Implications and Recommendations 154
Table 7.9 thus shows that in most countries there is a relatively clear difference in the average reading score between students who have attended no pre-primary school and students who have attended more than two years of pre-primary school. The difference is significant in countries such as Romania (59 score points), Slovakia (52 points), Greece (31 points), Germany (24 points), and Swe-den (26 points).
PIRLS: Early School Start and Reading Achievement not Related PIRLS background data from the parents contains information about whether students began primary school when they were either 7, 6, or 5 years old, or younger. In most countries, the average reading scores do not differ significantly between students who started early (when they were 6) and students who started when they were 7 or 8. Exceptions to this pattern are Greece and France, where stu-dents who started at the age of 6 have average scores which are 28-32 points higher than the scores of students who started when they were 7 years old.
7.2. The Learning Environment This section addresses a number of factors that are related to the actual practices of teaching and learning at the level of schools and classrooms. We focus on: 1) the significance of certain school policies and practices (assessments, admit-
tance policies), 2) the significance of school climate (student behaviour at school, students’
perceptions of the disciplinary climate in their mathematics lessons, and teacher related factors affecting the school climate),
3) the significance of student time invested in learning, and 4) the organization of instruction. The final section analyses the significance of three factors related to the scarcity of resources in the learning environment: Teacher shortages, the physical infra-structure of learning, and educational resources (instruction materials, computers etc.).
Approaches to Assessment of Student Performance A range of assessment methods can be used in order to assess students' progress in attaining academic objectives. Commonly used methods include standardized tests, the assessment of student portfolios, judgemental ratings carried out by teachers, regular teacher-developed tests, and assessments of student assign-ments, projects, and homework.

______________________________________________
Implications and Recommendations 155
The use of these assessment methods is widespread among the countries studied here, but there is considerable variation in the intensity of their use:46 • Standardized tests are used 3 times or more a year for between approxi-
mately 6% and more than 50% of the students in the countries concerned. The testing intensity appears highest in Korea, and relatively high in Sweden and the Netherlands.
• The use of student portfolios varies just as much, as 16% of the students from Finland are subject to this method at least 3 times a year according to school principals, whereas this is the case for more than 90% of students in Spain and more than 80 % of students in countries such as Denmark, Japan, and Iceland.
Table 7.10. Performance Differences between Students in Schools Using Teacher-Developed Tests 3 Times a Year or more and 2 Times a Year or Less, PISA 2003. Performance difference, score
point avg. / mathematics scale
SE
Austria 50 11,5
Turkey 37 15,6
Czech Republic 30 13,4
Slovakia 27 13,7
Belgium 16 10,7
Latvia 16 27,1
Greece 9 14,7
Denmark 3 5,9
Indonesia 1 11,8
Ireland -1 7,7
Luxembourg -3 3,1
Iceland -8 7,9
Poland -9 12
Italy -16 17,8
Germany -20 30
Sweden -25 23,9
HK China -30 27,6
Source: PISA 2003 dataset. Based on reports from school principals. Data not available, not relevant, too few observations, or data withdrawn, for Finland, France, Hungary, Japan, Korea, the Netherlands, Nor-way, Portugal, Spain, and the United States. Figures in bold are statistically significant. To calculate the EU average, data for at least 15 of the EU 25, representing at least 60 per cent of the total EU popula-tion must be present. Since data only covers 13 of the EU 25 countries, the average is not calculated for the table. • Judgemental ratings by teachers are used at least 3 times a year for the clear
majority of students in most countries, the only notable exceptions being Po-land and Turkey, where this practise is less widespread.
46 The quoted results stem from the PISA 2003 dataset, which is in turn in this connection based on reports from school principals, and reported proportionate to the number of 15-year-olds enrolled in the school of the principals concerned.

______________________________________________
Implications and Recommendations 156
• Teacher-developed tests and assessment of student assignments, projects, or homework, are the most widespread and frequently used assessment meth-ods, being used at least 3 times a year for the clear majority of students in all the countries concerned except Turkey and – in the case of student assign-ments – Greece, where the frequent use is less common.
To relate the use of assessments of student learning to outcomes at the national level is very difficult. Such assessments differ widely in nature and quality, and assessment policies and practices are often applied in different ways across school and programme types. From table 7.10 it appears, however, that there is a slight tendency for schools in which teacher-developed tests are applied more frequently to perform better, at least in some countries: The performance difference in mathematics between students in schools where teacher-developed tests are used 3 times or more per year and schools where this method is used 2 times or less per year is statisti-cally significant in Austria, Turkey, and the Czech Republic. On average across OECD countries, the performance difference between schools with more frequent use of teacher-developed tests and schools with less frequent use of such tests is 22 score points to the advantage of schools with frequent tests. The explained variance for student performance is quite low, however. Across the OECD-countries, the frequency of teacher-developed tests explains 0,3 per cent of total variance in student performance on the mathematics scale. For the other assessment methods, the explanatory power in relation to student performance is also very low, and there are no clear directions in statistical rela-tions. In some countries, the frequent use of the methods is associated with a somewhat higher average student performance, whereas the opposite is true for other countries.
PISA 2000 and TIMSS 1995: Evidence on Centrally Set Examinations It can be added that analysing data from PISA 2000 and TIMSS 1995, Bishop (1997), Wössmann (2003), and Fuchs and Wössmann, conclude that students in countries with centralized examination systems perform better than students in countries without centralized examination systems. In Wössmann (2003), ana-lysing TIMSS 1995 data, students in countries with centralized examination sys-tems scored 16,1 points higher in mathematics and 10,7 points higher in science than students in countries without a centralized examination system, both results being statistically significant at the 1% level.47 In Fuchs and Wössmann (2004a), using PISA 200 data in a multivariate student level analysis, students in schools with external exit exams perform statistically significantly better by 19,1 achievement points in mathematics than students in school systems without external exit exams. This relation is also statistically
47 For a theoretical justification of these results, making use of a principal-agent argumentation, see Bishop and Wössmann (2004).
______________________________________________
Implications and Recommendations 157
significant in science, while it is positive but not statistically significant in read-ing. These effects were calculated holding all other influence factors constant.
The Use of Assessment Methods in School Management Assessment methods and results can be used not only to provide feedback di-rectly to the individual student. They can also be used to monitor the perform-ance of teachers and schools and as a method to make priorities on the allocation of resources to schools. Other ways assessment results can be used are to make decisions about students’ retention or promotion to the next steps of the educa-tional programme concerned, and to inform parents about their child’s progress. Data from PISA 2003 reveals that the use of assessment methods for these dif-ferent purposes varies considerably between countries. There is very frequent use of assessments to monitor schools’ progress and make decisions about stu-dent promotion or retention, as well as to inform parents about their child’s pro-gress. The use of assessments in order to assess teachers’ effectiveness is less widespread but varies a lot across countries.
Interaction Between School Autonomy and External Exit Exams The statistical relations between the different uses of assessment data and stu-dent performance are rather weak and unclear, and it is difficult to arrive at pre-cise policy implications on the basis of this data. However, analysing data from PISA 2000, Fuchs and Wössmann (2004a) identi-fies a pattern of interaction between the existence of external exit exams and one aspect of school autonomy - the determination of course content - which points to the effects of external exit exams as an accountability tool: In school systems without external exit exams, students in schools that have autonomy in determin-ing course contents perform statistically significantly worse than otherwise. That is: The effect of school autonomy in this area seems to be negative if there are no external exit exams to hold schools accountable for what they are doing.
Admittance Policies In PISA 2003, school principals were asked to describe their use of different practices in terms of admittance of new students to their school. There were asked to what extent they give consideration to students’ academic records, rec-ommendations from feeder schools, and students’ needs or desires for a specific programme. Among these criteria, students’ academic records tended to be the most fre-quently reported one, being used very frequently (in schools accounting for more than half of students) in Austria, the Czech Republic, Hungary, Japan, Korea, Luxembourg and the Netherlands.48 On the other hand, students’ academic re-cords are given high priority or considered a prerequisite in relatively few schools, accounting for less than 10 per cent of students, in Denmark, Finland, Greece, Ireland, Italy, Portugal, Spain, and Sweden. 48 Frequencies concern the share of school principals in these countries who reported that students’ academic records are a prerequisite or of high priority for admittance.
______________________________________________
Implications and Recommendations 158
A statistical relation between school admittance policies and student perform-ance is difficult to interpret. More selective schools may perform better simply because they only accept better-performing students, and not necessarily because they provide better opportunities for teaching and learning. In addition, the statistical relations between school admittance policies and stu-dent performance are weak. There is a tendency at the cross-country level that the prevalence of some of the attributes of high academic selectivity are posi-tively related to country performance, but only weakly, and the relations are not statistically significant, explaining only between 6 and 10 per cent of cross-country variation.
School Climate: Support from Teachers Weakly Related to Performance In table 7.7 above, we addressed the question of individual support from teach-ers to students in their learning process, concluding that in PISA 2003, students differ significantly in their perceptions of teacher support across countries, and that school systems with a high degree of selectivity and institutional differentia-tion were characterized by less positive assessments of teacher support. What are the impacts of support from teachers on student performance? The data suggests that the significance of such support is very modest, student perceptions of it explaining almost none of the variance in student performance in the coun-tries concerned. This is not surprising, considering that there may be a number of reasons for teachers providing individual support to students or deciding not to provide this support: Teachers may typically use more supportive practices for weaker stu-dents of for classes attended by a majority of less able students. To the extent this is the case, the relation between support and performance would be expected to be negative. On the other hand, to the extent that supportive practices are ef-fective, it could be expected that performance would be higher among students who receive more support than among students who do not.
School Climate: Student-Related Factors Matter More for Performance In PISA 2003, school principals were asked to assess the degree to which a number of factors related to student behaviour hindered student learning: Stu-dent absenteeism, disruption of classes by students, students skipping classes, students lacking respect for teachers, students’ use of alcohol or illegal drugs, and students intimidating or bullying other students. Table 7.11 highlights the results, indicating the share of students in each country where the school principal has answered that he or she agrees or agrees strongly that the aforementioned factors hinder student learning. The results should be interpreted cautiously, as school principals’ assessments may not accurately re-flect real conditions, and cultural differences between countries may affect school principals’ assessments.

______________________________________________
Implications and Recommendations 159
These reservations having been made, it appears that there are large differences across the countries concerned as regards school climate. On average, the per-ceptions of school principals are most positive in Japan, Korea, Denmark, and Belgium, and least positive in Italy, Ireland, Turkey, and Greece.
Table 7.11. Student-Related Factors Affecting the School Climate, Percentage of Students in Schools where Principals Agree or Agree Strongly that Factors Hinder Learning. Student
absentee-ism
Disrup-tion of
classes
Skipping classes
No re-spect for teachers
Alcohol or drugs
Intimida-tion and bullying
Average
Korea 17 18 13 23 13 13 16
Japan 39 13 23 32 1 7 19
Denmark 39 42 14 13 1 7 19
Belgium 34 26 21 18 7 14 20
Czech Republic 65 36 24 16 2 2 24
Luxembourg 39 45 25 16 9 15 25
HK China 27 31 21 28 18 25 25
Hungary 56 42 26 14 6 8 25
Finland 56 39 34 12 4 7 25
Germany 35 51 25 22 9 24 28
Poland 47 40 45 21 10 8 29
Sweden 48 50 28 25 5 17 29
Netherlands 43 43 30 28 7 22 29
Portugal 61 35 50 16 3 9 29
Austria 53 38 43 17 9 15 29 EU average 50 45 35 24 8 15 30 Iceland 38 62 28 22 5 25 30
Norway 37 74 20 35 3 12 30
United States 69 27 36 22 21 14 32
Spain 44 59 38 34 5 13 32
Latvia 79 24 57 14 11 8 32
Italy 68 41 63 17 1 8 33
Ireland 63 47 21 23 24 21 33
Turkey 70 46 45 37 22 32 42
Greece 66 52 46 47 31 23 44
Source: PISA 2003 dataset. It is notable that among the 7 countries where school principals’ assessments of school climate is the most positive, 4 are among the top 6 performers as regards the average performance of students across the disciplines (Korea, HK China, Japan, and Belgium). On the other hand, school climate as assessed by school principals can explain only a modest share of total variance in student perform-ance (mathematics scale). On average across OECD-countries, less than 4 per cent of total variance is explained. It should be highlighted that there are important differences across countries as regards which of the dimensions of school climate that appear problematic or
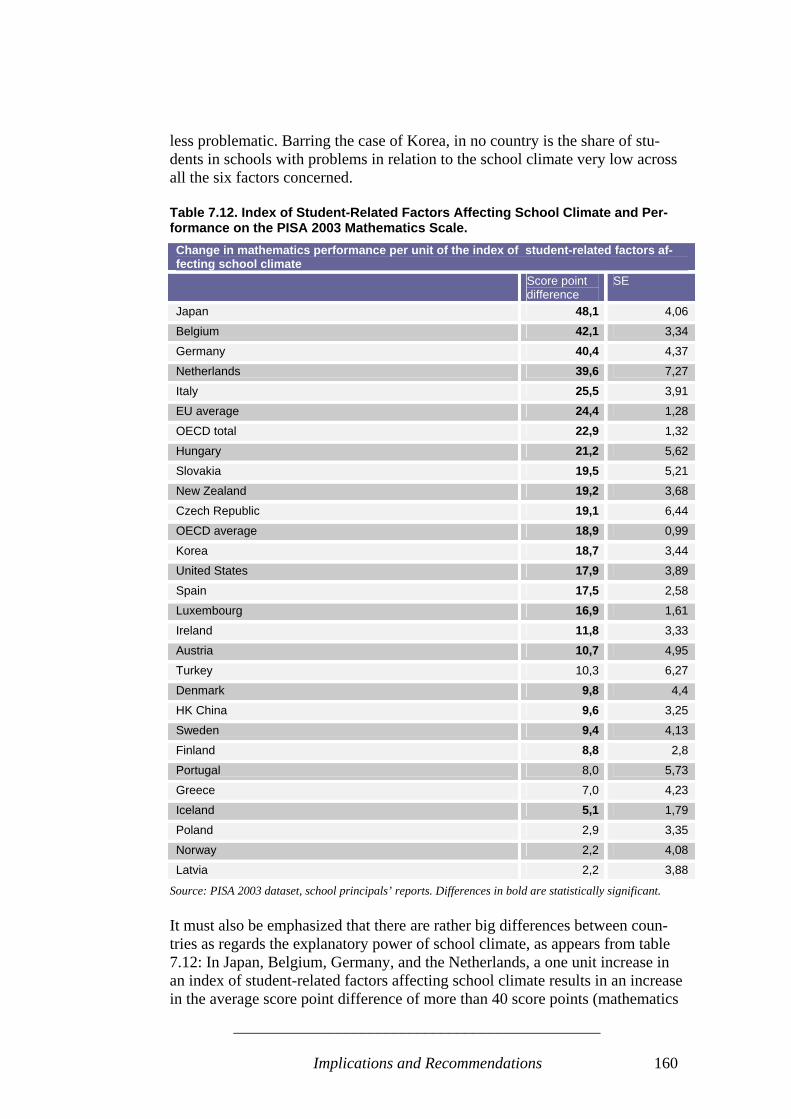
______________________________________________
Implications and Recommendations 160
less problematic. Barring the case of Korea, in no country is the share of stu-dents in schools with problems in relation to the school climate very low across all the six factors concerned. Table 7.12. Index of Student-Related Factors Affecting School Climate and Per-formance on the PISA 2003 Mathematics Scale. Change in mathematics performance per unit of the index of student-related factors af-fecting school climate Score point
difference SE
Japan 48,1 4,06
Belgium 42,1 3,34
Germany 40,4 4,37
Netherlands 39,6 7,27
Italy 25,5 3,91
EU average 24,4 1,28
OECD total 22,9 1,32
Hungary 21,2 5,62
Slovakia 19,5 5,21
New Zealand 19,2 3,68
Czech Republic 19,1 6,44
OECD average 18,9 0,99
Korea 18,7 3,44
United States 17,9 3,89
Spain 17,5 2,58
Luxembourg 16,9 1,61
Ireland 11,8 3,33
Austria 10,7 4,95
Turkey 10,3 6,27
Denmark 9,8 4,4
HK China 9,6 3,25
Sweden 9,4 4,13
Finland 8,8 2,8
Portugal 8,0 5,73
Greece 7,0 4,23
Iceland 5,1 1,79
Poland 2,9 3,35
Norway 2,2 4,08
Latvia 2,2 3,88
Source: PISA 2003 dataset, school principals’ reports. Differences in bold are statistically significant. It must also be emphasized that there are rather big differences between coun-tries as regards the explanatory power of school climate, as appears from table 7.12: In Japan, Belgium, Germany, and the Netherlands, a one unit increase in an index of student-related factors affecting school climate results in an increase in the average score point difference of more than 40 score points (mathematics
______________________________________________
Implications and Recommendations 161
scale). Correspondingly, in these countries, student-related school climate fac-tors explain a larger share of total variance in student performance, from 22 per cent in Japan to 12 per cent in the Netherlands. It is notable that among the four countries where school climate factors matter the most, three (Belgium, Germany, and the Netherlands) are among the coun-tries where the institutional differentiation of the school system is most far-reaching, cf. Table 7.5 above. This may suggest that in these countries, problems concerning the school climate are concentrated in relatively few schools. To the extent this is the case, policy makers could consider whether there could be overall advantages in terms of efficiency and equity of educational opportunities in focusing efforts for improv-ing the school climate on these schools.49 • There seem likely to be overall benefits for the efficiency and effectiveness
of the school systems of Belgium, Germany, and the Netherlands in a) iden-tifying schools with particular problems as regards school climate and b) fo-cusing efforts towards improving school climate in such schools.
The overall patterns of responses from school principals as regards the discipli-nary climate in schools are reasonably consisted with those observed in PISA 2000.
Student-Related School Climate Factors from the Perspective of Students In PISA 2003, school climate factors were also examined from the perspective of students, the relevant variables being whether mathematics lessons where affected frequently by students not listening to the teacher; noise and disorder; the teacher having to wait a long time for students to quiet down; students not being able to work well; and students not starting working for a long time after the lessons begin. The results are found in Table A4 and A5 in Annex 4. Compared to the data based on school principals’ reports, there are some differ-ences as regards the countries in which disciplinary problems are frequent and less frequent. Differences may be ascribed to the fact that as opposed to school principals, students were asked to assess disciplinary problems specifically in their mathematics lessons. However, Japan, Hong-Kong China, and Korea, are among the countries with the least disciplinary problems in both measurements, just as Japan, Belgium, and Germany, are among the countries where students’ perceptions of the disciplinary climate have a statistically significant effect on average mathematics performance.
49 An indicative analysis based on PISA 2003 data suggests that the share of schools with index values at or below -1 on the index of student-related factors affecting school climate is larger in the Netherlands (18,2% af schools), Germany (17,6% of schools), and Belgium (14,8% of schools), than for instance in the Nordic coun-tries (e.g. Finland 10,2 % of schools, Denmark 4,4% of schools). The analysis is indicative, as the number of sampled schools is relatively small and as the sampling design of PISA aims at producing optimal samples at the student level, not the school level.
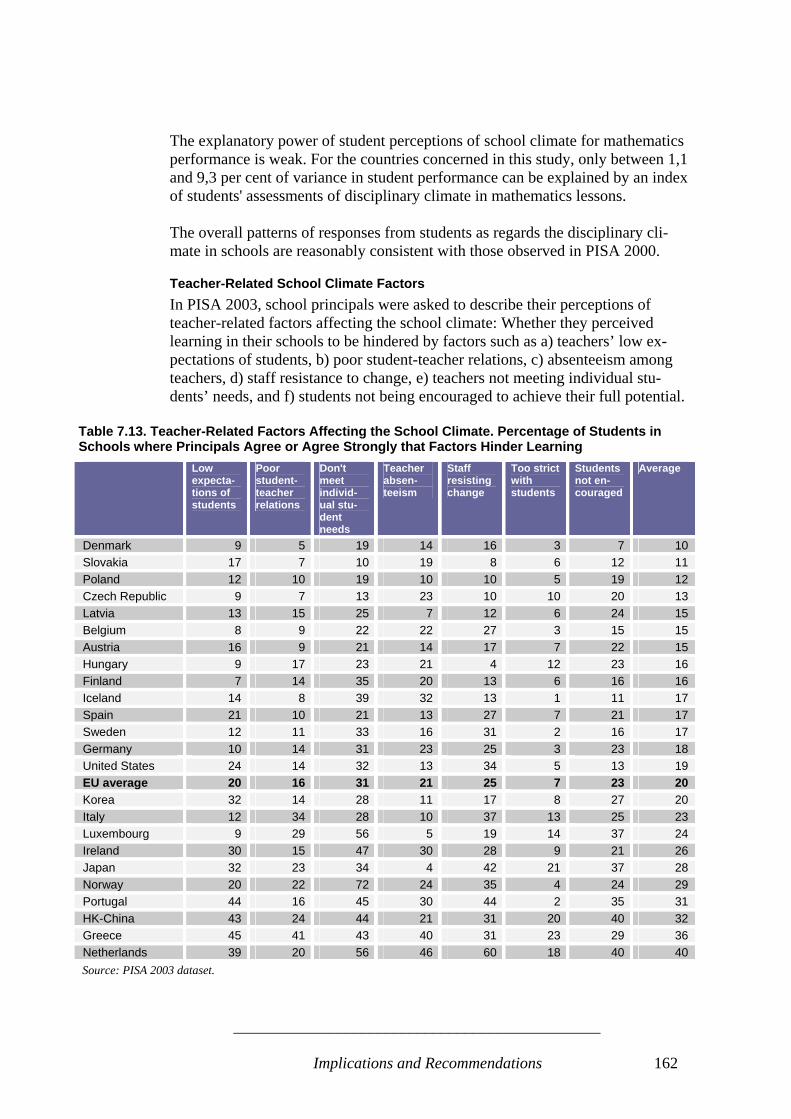
______________________________________________
Implications and Recommendations 162
The explanatory power of student perceptions of school climate for mathematics performance is weak. For the countries concerned in this study, only between 1,1 and 9,3 per cent of variance in student performance can be explained by an index of students' assessments of disciplinary climate in mathematics lessons. The overall patterns of responses from students as regards the disciplinary cli-mate in schools are reasonably consistent with those observed in PISA 2000.
Teacher-Related School Climate Factors In PISA 2003, school principals were asked to describe their perceptions of teacher-related factors affecting the school climate: Whether they perceived learning in their schools to be hindered by factors such as a) teachers’ low ex-pectations of students, b) poor student-teacher relations, c) absenteeism among teachers, d) staff resistance to change, e) teachers not meeting individual stu-dents’ needs, and f) students not being encouraged to achieve their full potential.
Table 7.13. Teacher-Related Factors Affecting the School Climate. Percentage of Students in Schools where Principals Agree or Agree Strongly that Factors Hinder Learning Low
expecta-tions of students
Poor student-teacher relations
Don't meet individ-ual stu-dent needs
Teacher absen-teeism
Staff resisting change
Too strict with students
Students not en-couraged
Average
Denmark 9 5 19 14 16 3 7 10 Slovakia 17 7 10 19 8 6 12 11 Poland 12 10 19 10 10 5 19 12 Czech Republic 9 7 13 23 10 10 20 13 Latvia 13 15 25 7 12 6 24 15 Belgium 8 9 22 22 27 3 15 15 Austria 16 9 21 14 17 7 22 15 Hungary 9 17 23 21 4 12 23 16 Finland 7 14 35 20 13 6 16 16 Iceland 14 8 39 32 13 1 11 17 Spain 21 10 21 13 27 7 21 17 Sweden 12 11 33 16 31 2 16 17 Germany 10 14 31 23 25 3 23 18 United States 24 14 32 13 34 5 13 19 EU average 20 16 31 21 25 7 23 20 Korea 32 14 28 11 17 8 27 20 Italy 12 34 28 10 37 13 25 23 Luxembourg 9 29 56 5 19 14 37 24 Ireland 30 15 47 30 28 9 21 26 Japan 32 23 34 4 42 21 37 28 Norway 20 22 72 24 35 4 24 29 Portugal 44 16 45 30 44 2 35 31 HK-China 43 24 44 21 31 20 40 32 Greece 45 41 43 40 31 23 29 36 Netherlands 39 20 56 46 60 18 40 40 Source: PISA 2003 dataset.
______________________________________________
Implications and Recommendations 163
On average, school principals paint a rather positive picture of teachers in this respect. However, there are differences between countries, as is displayed in Table 7.13. On average, school principals are most positive in their evaluation of teachers in Denmark, Slovakia, Poland, and the Czech Republic. On the other hand, assessments are relatively negative in the Netherlands, Greece, Hong-Kong China, and Portugal. The explanatory power of teacher-related factors concerning school climate is low. Between 0 and 2,5 per cent of total variance in student performance (mathematics) is explained by an index of the teacher-related factors in the great majority of countries, the only exception being Japan, where teacher-related fac-tors account for more than 13 per cent of variation in student performance. • Nevertheless, the education authorities of the Netherlands, Greece, and Por-
tugal, could consider the factors explaining the relatively negative assess-ment of teachers by school principals in these countries.
• In this connection, authorities may consider whether efforts targeted towards increasing teacher commitment, performance, and willingness to consider change, could be beneficial for the overall performance of the education sys-tems in terms of efficiency and equity of educational opportunity.
In most countries, school principals’ assessments in PISA 2003 of teacher-related factors affecting the school climate were rather similar to the assessments in PISA 2000. However, it is noticeable that assessments were even more nega-tive in Greece in 2000 than in 2003, which may suggest that teachers are increas-ingly contributing positively to students’ learning, even of the overall assessment is still relatively negative compared to other of the countries studied.50
Student Time Devoted to Learning A further key factor which should be analysed is the amount of student time de-voted to teaching and learning. Thus, no doubt student learning time is the over-all most valuable resource in the educational process. But is there a relation be-tween the time devoted to instruction and to out-of-school learning activities, and students’ performance? This is the question which we address in the follow-ing. In PISA 2003, students were asked how many minutes there are, on average, in a class period. They were also asked how many periods they had spent in their school in the preceding week in total. From table 7.14, it appears that there are large differences between the student time devoted to learning in the countries studied. The figures were obtained through simple multiplication of the average length of class periods and the av-erage number of periods in the preceding week, the assumption being that the preceding week is typical for an average school week in the school year. In addi- 50 For example, the proportion of 15-year-olds enrolled in schools where principals reported learning to be hindered to some extent or a lot by poor student-teacher relations dropped significantly from 62 per cent in 2000 to 41 per cent in 2003.

______________________________________________
Implications and Recommendations 164
tion, students were asked to indicate how many hours in the preceding week they had spent on various forms of learning outside the classroom setting.51
Table 7.14. Instructional and Out-of-School Learning Activities for All Subjects Per Week Time in hours per week for all subjects
Total instruction
Total out of school
Total hrs.
Korea 37,1 12,8 49,9 Turkey 28,0 17,6 45,6 Greece 26,6 18,3 44,9 Italy 28,0 12,8 40,8 Latvia 26,2 14,0 40,2 Ireland 28,3 11,2 39,5 Spain 27,0 11,9 38,9 Hungary 24,8 13,4 38,2 HK-China 28,3 9,2 37,5 EU average 25,5 9,4 34,9 Luxembourg 24,8 9,9 34,7 Slovakia 24,6 10,0 34,6 Austria 27,9 6,6 34,5 Belgium 27,4 7,1 34,5 Poland 24,9 9,6 34,5 Portugal 25,8 7,8 33,6 France 25,6 7,9 33,5 Canada 25,5 7,7 33,2 Iceland 27,3 5,9 33,2 United States 25,2 7,9 33,1 Japan 25,7 6,4 32,1 Germany 23,3 8,3 31,6 Netherlands 24,9 5,9 30,8 Czech Republic 24,3 5,8 30,1 Finland 24,7 5,0 29,7 Denmark 22,5 6,6 29,1 Norway 22,6 5,9 28,5 Sweden 22,9 5,1 28,0 Source: PISA 2003 dataset, student self-reports. In Korea, Turkey, and Greece, students spend significantly more than 40 hours per week on learning activities, counting both direct instruction time and various learning-related out-of-school activities. At the opposite end of the scale, stu-dents in 4 of the Nordic countries (Finland, Denmark, Norway, and Sweden) spend less than 30 hours per week on learning-related activities. It appears from Table 7.14 that there is no clear relation between the average time spent on learning activities for 15-year-olds and the mean achievement scores in PISA: Korean students on average perform very well compared to stu-dents in other countries, cf. table 4.1. However, so do students from Finland, the
51 Homework or other study set by their teachers, working with a tutor, attending out-of-school classes, other study.
______________________________________________
Implications and Recommendations 165
Netherlands, and Japan, three countries where the average time devoted to learn-ing is significantly lower than in Korea. On the other hand, a multivariate analysis of PISA 2000 data at the level of indi-vidual students found a positive relation between homework and student per-formance (Fuchs and Wössmann 2004a). Students reporting that they spent more than one hour on homework and study per week in the specific subject per-formed statistically better than students who spent less than one hour on home-work per week. In mathematics and science, students who spent more than three hours per week doing homework performed even better. Fuchs and Wössmann (2004a) only report quite small effects of instruction time on student performance, however, with instruction time positively related to per-formance in mathematics and science but negatively related to performance in reading. These effects were calculated holding a large number of other influence factors constant.
PISA: No Clear Relation Between Instructional Weeks and Student Achievements A weak relation between student time devoted to learning among 15-year-olds and average student performance in PISA 2003 is also illustrated in table A7 in Annex 4, which displays the number of instructional weeks per year in the coun-tries concerned. The average number of instructional weeks is highest in the Czech Republic, Germany, and Denmark, three countries where the students perform on average close to the OECD average. The number of instructional weeks is lower in for instance Hong-Kong China and Korea, where students on average perform better in PISA 2003.
PIRLS: No Explanatory Power of Weekly Number of Teaching Hours In PIRLS 2001, it is teachers who have assessed the number of hours reading is taught weekly. Table A8 in Annex 4 confirms that there are significant differ-ences between the countries as to the amount of instructional time. In the United States, for instance, 65 per cent of the students in the 4th grade are subject to more than 6 hours of instruction a week whereas the percentages are consider-ably lower in the Netherlands (5 per cent) and England (13 per cent). However, there is no positive relation between the number of hours reading is taught weekly and the average score in reading. In several countries, we find the opposite relation: That the average score among students who have been sub-jected to more than 6 hours of instruction a week is slightly lower than among students subjected to fewer hours. This is the case in the Netherlands, Germany, and England.
TIMSS: No Explanatory Power of the Amount of Homework Assigned In TIMSS (2003), an index of time students spend doing homework in a normal school week has also been developed, based on students’ responses to the fre-quency and amount of homework they are assigned. Analysis of this data con-
______________________________________________
Implications and Recommendations 166
firms that in most countries there is no positive correlation between the amount of homework assigned and the achievements in mathematics among students in the 8th grade. The results from TIMSS thus confirm the findings based on PIRLS 2001 and PISA 2003 data.
Complex Possible Causal Relations between Learning Time and Achievements The inconclusive evidence on the statistical relation between student time de-voted to learning and average achievement scores should not come as a surprise. The relation is complicated by several factors: Teachers may assign more homework to those students who need it the most in order to improve their per-formance; alternatively, slower learners may need more time to complete the same amount of homework. In other words: Highly able students need less time to do the homework. Stu-dents’ socio-economic background may also affect their homework practices, with the more advantaged students having better opportunities to work effi-ciently. Highly able students' higher efficiency in doing homework could explain that in PIRLS (2001) and TIMSS (2003) we find a slightly negative correlation for some countries between the amount of time spent on homework and the average score in reading and mathematics, respectively, especially when comparing stu-dents on the high and medium level of the index. The same pattern is found when analysing a similar index calculated for 8th grade students in science in TIMSS (2003). Finally, countries clearly vary considerably in how instruction time is allocated over the different levels of education, and the average performance of students in for instance mathematics, reading, and science, must be expected to be the result of the cumulated learning from the start of education and onwards. Germany, for instance, invests a larger number of instruction hours in 12 to 14-years-olds than Sweden, while the reverse is true for pupils in the age span 6 to 7 (OECD 2004d). • Nevertheless, the results remind policy makers that there is no clear-cut and
simple relation between instruction time and academic results, although there is of course a lower limit to instruction time below which student achieve-ment will necessarily be affected negatively. More instruction hours do not necessarily lead to better academic performance among students. The teach-ing and learning experience appears to be more important than the amount of time allocated to teaching and learning.
• Policy makers are therefore well advised to consider whether sufficient re-sources are devoted to the actual contents of learning.
• Policy makers in some EU countries (notably Greece, Italy, Latvia, Ireland, and Spain) could also consider, a) whether the PISA data on instructional time for 15-year-olds is representative for other age groups, b) if yes: whether resources could be freed in the education system by reducing the number of instruction hours, and c) whether the resources that are freed in

______________________________________________
Implications and Recommendations 167
this manner could be applied to improving the contents of teaching and learning.
PIRLS: Organization of Reading Instruction as a Whole-Class Activity or Individ-ual Instruction In general, most recent reforms of primary education have emphasized more individualized instruction approaches adapting instruction to each student’s needs and capabilities. Teaching organized as whole-class activity is often seen as an old-fashioned contrast, with the image of consisting of a centralized, one-way communication between teacher and students.
Table 7.16. Average Reading Score and Teachers’ Approach to Reading Instruction in 4th Grade (PIRLS 2001)
Teaching Reading as Whole-Class Activity
Using Individualized Instruc-tion or a Variety of Organiza-tional Approaches*
Average Achievement
Percentage of students whose teacher mostly uses strategy
Average Achievement
Percentage of students whose teacher mostly uses strategy
Score Difference
Slovenia 485 8,1 503 86,7 18,3 Greece 521 71,1 539 26,6 17,3 England 548 25,3 558 55,7 10,5 Hungary 536 10,9 545 69,9 9,2 Netherlands 548 15,1 554 61,1 6,0 Bulgaria 547 77,5 551 41,7 4,3 Czech Republic 536 38,1 540 45,6 4,3 Singapore 523 33,1 526 52,6 3,7 Sweden 560 14,9 562 69,4 2,1 Germany 538 30,4 540 61,9 2,0 Turkey 450 26,3 452 64,2 1,9 Italy 539 56,9 540 42,8 0,4 Romania 512 80,3 512 43,6 0,1 Cyprus 496 31,5 496 51,9 -0,1 Norway 502 14,5 500 79,1 -1,4 HK China 530 72,7 528 24,7 -1,7 United States 547 42,5 544 44,0 -2,7 Lithuania 544 27,7 541 65,4 -2,8 Iceland 516 29,7 512 61,8 -3,9 France 529 25,7 524 62,9 -4,6 Latvia 547 57,8 539 43,1 -7,9 Scotland 614 1,1 539 33,1 -76,0 Source: PIRLS 2001 data set.
Does individualized instruction lead to better achievements than instruction as a whole-class activity? In PIRLS teachers have described how they always or al-most always organize reading instruction. The different ways of organising in-struction range from “teaching reading as a whole-class-activity” over “creating different groups of students” to individualized instruction.
______________________________________________
Implications and Recommendations 168
Table 7.16 compares the average reading scores between students whose teacher prefer reading as a whole-class activity versus students whose teachers use indi-vidualized instruction or a variety of organizational approaches. There are considerable differences as to the percentage of students who are sub-jected to reading instruction as a whole-class activity versus individual instruc-tion. In countries such as Romania, Bulgaria, Hong Kong China, and Greece, most students (over 70-80 per cent ) are subject to instruction as whole-class activity, while most students in England, the Netherlands, Sweden, and Norway, are subject to individualized instruction. Apparently, there is a tendency towards a predominant instruction strategy in different countries, as teachers in different countries choose either the strategy of individualized instruction or the whole class-strategy. In Netherlands and Norway, for instance, only 14-15 per cent of teachers prefer teaching reading as a whole-class activity. However, we find no significant relation between the students’ average reading score and the use of instruction as whole-class activity versus individualized instruction. With a view to the big differences between the countries’ instruction strategies, this observation may have certain policy implications. Thus, in countries where individualized reading instruction is predominant and regarded as the modern approach, teachers, principals, and policy makers, should be aware that indi-vidualisation does not in itself lead to high student achievement. In these coun-tries, there may be unexploited potentials in a more frequent use of reading as whole-class activity.
Human Resources and Teacher Shortage: Low Explanatory Power Data from PISA 2003 also makes possible an analysis of the availability and quality of human resources in education and the significance of this factor for student performance. Data in this connection consists of school principals’ perception of the severity of various problems: School principals’ reports as to whether the school’s capac-ity to provide instruction is hindered to some extent or a lot by a shortage or in-adequacy of a) qualified mathematics teachers, b) qualified science teachers, c) qualified testing language teachers, d) qualified foreign language teachers, and e) experienced teachers. Perhaps not very surprisingly, the data reveals significant differences in school principals’ perceptions across countries. Among European countries and other countries studied here, human resource shortages are more frequently reported in Belgium, Greece, the Netherlands, and Germany, and less frequently in Spain, Portugal, Finland, Austria, and Korea. The explanatory power of the teacher shortage variables is rather low, however. A combined index of teacher shortage explains between 0 and 6 per cent of the variance in student performance (mathematics).

______________________________________________
Implications and Recommendations 169
The Quality of Infrastructure and Educational Resources PISA 2003 also contains data on the quality of schools’ physical infrastructure and educational resources. As with the information concerning teacher short-ages, this data rests on school principals’ perceptions. On the basis of a series of questions concerning the perceived extent to which material and educational resources hinder learning among the 15-year-old stu-dents, two composite indices were created: One on the quality of the school’s physical infrastructure (school buildings and grounds; heating, cooling and light-ing systems; instructional space), and the other on the quality of educational re-sources (instructional materials, computers and software for instruction, calcula-tors, library materials, audio-visual resources, and science laboratory equipment and materials). There are clear differences between countries, both as regards the school princi-pals’ assessments of school infrastructure and as regards their assessment of the quality of educational resources, cf. Tables A9 and A10 in Annex 4. Greece, Turkey, and Norway, are among the countries where school principals fre-quently report that the quality of their school’s physical infrastructure hinders learning. In contrast, in the Czech Republic and Korea, relatively few principals report that the school’s infrastructure hinders learning. As regards educational resources, Greece and Turkey are also among the coun-tries where school principals frequently point to inadequacies, along with school principals from Poland and Slovakia, whereas school principals in Korea and the Netherlands less frequently point to shortcomings of educational resources.
Weak Relation Between Infrastructure, Education Resources and Achievements For both school infrastructure and educational resources available at schools, the relation between these variables on the one hand and educational outcomes in PISA 2003 on the other hand is weak. As for physical school infrastructure, only in a few countries are there any rela-tionships with school performance, the PISA index of the physical infrastructure of schools explaining only 1 per cent of the variation in mathematics perform-ance on average across OECD countries. As for educational resources (instruc-tional materials, computers etc.) the relationship with average school perform-ance is slightly stronger, but still very weak, the PISA index of the quality of educational resources of schools explaining 2,5 per cent of the variation in mathematics performance across OECD countries. Analysing PISA 2000 data, Fuchs and Wössmann (2004a) in a multivariate analysis find that students in schools whose principals reported no hindrance due to a lack of instructional material performed significantly better than students in schools whose principals reported a lot of hindrance. • However, Fuchs and Wössmann (2004a, 2004b) also conclude that there is
no positive relation between the availability of computers and student

______________________________________________
Implications and Recommendations 170
achievements. While bivariate results would suggest that there is a positive relationship between the availability of computers at home and in school and student achievement, these results are spurious. Once other features of stu-dent, family, and school background are held constant, computer availability at home shows a strong statistically significant negative relationship to math and reading performance, and computer availability at school is unrelated to performance.
PIRLS and TIMSS: Weak Relation Between School Resources and Performance In PIRLS (2001) an Index of Availability of School Resources was created. Re-sembling the corresponding indices in PISA, the index is based school princi-pals’ responses as regards how much the capacity for instruction is affected by a shortage of: instructional staff, teachers qualified to teach reading, instructional materials, instructional space, special equipment for physically disabled, com-puters, library books, and several others items. A high index level indicates that the capacity to provide reading instruction is, according to the principal’s con-sideration, not significantly affected. It appears from Table A11 in Annex 4 that there are clear differences across the countries as to the percentage of students whose instruction is considered af-fected by shortages of school resources. In affluent countries such as the Nether-lands, Iceland, and Sweden, most (about 80 per cent) of the students’ instruction is not affected (a high ASR index), whereas the percentages are considerably lower in less affluent countries such as Romania (28 per cent) and Turkey (4 per cent). However, the data from PIRLS confirms that there is no positive relation be-tween the availability of resources supporting instruction and the average score in reading, neither between nor within countries. The 82% of the students in the Netherlands who are instructed under a high ASR index only have a slightly higher average score (555) than the students with a medium ASR (546). In some countries, in Sweden for instance, the results are the opposite of the expected: The average score of students with high ASR (560) is even a little lower than that of students with a medium ASR (565). The same pattern is appears in TIMSS (2003), which has developed a similar index measuring the availability of school resources for instruction in mathemat-ics.
School Resources and Achievements: Questions and Hypotheses In sum, our data suggests that, contrary to expectations, shortages of school re-sources for instruction do not affect students’ average performances. This raises further questions with possible policy implications: • Are available resources for instruction used efficiently? Given that the group
of students from schools with relatively many resources do not on average perform better than those from schools with fewer resources, the question emerges whether available resources are used effectively in resource-rich
______________________________________________
Implications and Recommendations 171
schools. The availability of technology in classrooms has increased signifi-cantly in recent years, especially students’ access to computers for instruc-tion purposes and for accessing the Internet. But effective use of these new facilities in learning also depends on the implementation of new learning forms and on the teaching staff developing pedagogical competences accord-ingly.52
• The growing use of computers for instructional purposes may demand more self-management and learning-to-learn competences from students. In some countries, considerable percentages of students in the 4th grade use instruc-tional software to develop reading skills and strategies (PIRLS 2001).53 The use of instructional software in reading may require more self-conduct and learning-to-learn competences from each individual student. Consequently, instructional software may be of greater advantage to advantaged students with good reading skills, while students with weak skills may need more in-dividual assistance in order to benefit from the tools. To the extent this is the case, the question is whether schools and teachers are adequately equipped to deal with these challenges.
• How do some schools compensate for shortages of school resources? Appar-ently, some students have high average scores in reading (PIRLS) despite be-ing instructed under circumstance of shortages of school resources. These schools may provide cases of good practice as to how to accomplish good re-sults by managing existing resources well and making efficient use of re-sources.
7.3. Policy Implications This chapter has considered first a number factors related to the organization of education: The degree of school autonomy, public vs. private organization of schooling, the degree of institutional differentiation in primary and secondary education structure, and the significance of pre-schooling. Second, we have addressed a separate set of factors under the heading of the learning environment of students: Approaches to assessment of students, the disciplinary climate of schools, the extent of learning (time devoted to teaching and learning inside and outside of school), and finally, three factors concerning scarcity of resources in education: Teacher shortages, physical school infrastruc-ture, and education resources.
52 As to the availability and use of computers, it is illustrative to compare for instance countries such as the Netherlands and Bulgaria. In the Netherlands, 97 % of 4th grade students in PIRLS (2003) had computers available in the school. In Bulgaria, the corresponding figure is 19 per cent. Nevertheless, the average score of Bulgarian students with a low level of ASR (low level of school resources) is 551, which almost the same as the average score for students with a high level of ASR (high level of school resources) in the Netherlands (555). 53 For instance, in England and Norway respectively 55 per cent and 47 per cent of the students had a teacher who let them use instructional software in reading.

______________________________________________
Implications and Recommendations 172
School Autonomy: Room for Improvement? The analysis has revealed that there is a positive correlation between higher de-grees of school autonomy in certain respects and average student performance in mathematics. Across schools in the different countries participating in the PISA surveys, there is a clear positive correlation between the degree to which schools themselves decide on budget allocations within schools and the average student perform-ance. There is also a rather strong correlation between average student achievement score and on the one hand the percentage of schools which have responsibility for appointing teachers, and on the other hand the percentage of schools which have responsibility as regards student disciplinary policies. Finally, positive cor-relations can be found between average student performance across countries and school autonomy in the fields of dismissing teachers, determining course contents, and deciding which courses are offered. • In acting to improve the provision of basic skills, policy makers are well
advised to consider, whether their educational systems confer sufficient autonomy upon schools as regards budget allocation decisions, the appoint-ment and dismissal of teachers, disciplinary policies and practices, and other relevant respects.
Thus, while the interpretation of statistical correlations as causal relations should be avoided, the findings from PISA are compatible with a hypothesis that “free-dom under responsibility” for schools is a fruitful development path with respect to the further improvement of primary and secondary education in Europe.
Some EU Member States Confer Relatively Little Autonomy on Schools Data from PISA 2003 in this connection suggests that within the EU, the school systems of Austria, Germany, Italy, Portugal, and Spain, provide schools with less autonomy than the school systems of other member states. Notably, this is the case with respect to the appointment and dismissal of teachers, but for some of the five countries mentioned also with respect to determining course contents and deciding which courses are offered • Specifically, policy makers in Austria, Germany, Italy, Portugal, and Spain,
may consider the extent to which the provision of primary and secondary education could be improved through increased autonomy for schools.
Privatization Should be Approached Cautiously Is increased privatization of primary and lower secondary education a relevant policy option in the quest for higher quality in educational outcomes? The analy-sis of data from PISA 2003 suggests that this is not the case. On average, students from private schools tend to perform better in the PISA tests than students from public schools. The explanation is, however, found in
______________________________________________
Implications and Recommendations 173
the socio-economic profile of the intake of private and public schools. Once this factor is taken into consideration, differences between the performance of stu-dents from private schools and the performance of students from public schools largely disappear. Thus, the fact that in most countries, students from private schools perform better is due to the fact that these students have a socio-economic background which is more stimulating for their academic performance than students in public schools, just as private schools benefit from a more fa-vourable intake of students in terms of socio-economic background. On the other hand, multivariate analysis of data from PISA 2000 suggests that it seems conducive to student performance if schools are privately operated but at the same time mainly publicly financed. This finding remains valid even when taking account of differences in the student composition of public and private schools. • To the extent that policy makers consider increased privatization of school
systems as a policy option for improved quality and efficiency in primary and secondary education, the data from PISA thus suggests that this option should be approached cautiously. Across countries, there is inconclusive evi-dence that private schools provide better education than public schools.
Tracking Increases Diversity in Student Performance, not Average Performance The evidence from PISA suggests that the school systems of the Netherlands, Austria, Germany, Belgium, Luxembourg, Hungary, and the Czech Republic and Slovakia, are the institutionally most differentiated systems among the coun-tries concerned. On the opposite end of the scale, the Nordic countries (Den-mark, Sweden, Norway, Finland, and Iceland), are the countries with the least differentiated / most comprehensive school systems. At the same time, evidence from PISA suggests that there is no clear statistical relation between the degree of institutional differentiation of school systems and average student performance. There is, however, a clear statistical correlation between the degree of institutional differentiation on the one hand, and variance in student performance on the other hand. • The political implication is that increased institutional differentiation (for
instance the introduction of tracking systems at an earlier age or more fre-quent use of grade repetition for weak students) cannot plausibly be expected to result in improved average academic performances of students. The most likely result is greater diversity in student performance, as weak students be-come weaker and strong students become stronger.
Institutional Differentiation Means that Socio-Economic Background Matters More Perhaps even more importantly, the number of distinct school types or educa-tional programmes is positively correlated with the significance of socio-economic background for student performance.
______________________________________________
Implications and Recommendations 174
In other words, the data from PISA suggests that the more and the earlier stu-dents are divided into separate groups according to their academic performance, the more the students’ socio-economic background matters for their academic performance. Educational systems’ ability to adjust for the socio-economic background of students and provide all students with equal opportunities of learning thus appears to diminish as tracking systems and institutional differen-tiation become more important in education systems. • In school systems where tracking and other forms of differentiation of stu-
dents into separate streams are in particular widely used, policy makers may consider whether there are unrealized potentials in terms of social cohesion, social inclusion, and equal educational opportunities, in developing educa-tion systems towards more comprehensive systems with a lower degree of institutional differentiation among students.
Differentiated Systems: Potentials in Better Teacher Support for Weak Students At the same time, the majority of the countries with a particularly high degree of institutional differentiation in their educational systems are also countries in which students in PISA 2003 report a comparatively low level of individual sup-port from their teachers. In Austria, Germany, the Netherlands, the Czech Republic, and Luxembourg – countries where school systems are among the most differentiated – less than half or only about half of the students thus say that their mathematics teacher shows interest in every student’s learning in most lessons or every lesson. More-over, in these five countries only little more than half of the students say that their teachers provide an opportunity for students to express their opinions in most or every lesson, and only between 45 and 59 per cent of students say that their teachers help them with their learning in most lessons or all lessons. • Countries with a relatively high degree of differentiation in their school sys-
tems (not least Austria, Germany, the Netherlands, and Belgium), may con-sider whether sufficient teacher support is provided to the pupils most in need of this support.
• It would seem a likely possibility that there are unrealized potentials for in-creasing the equity and efficiency of school systems in these countries and others, focusing on measures that seek to adjust for the disadvantages of stu-dents with an unfavourable socio-economic background.
Increased Use of Pre-Schooling Should be Considered Firm conclusions regarding the significance of pre-schooling for academic per-formance requires longitudinal studies. However, on the basis of data from PISA 2003 and PIRLS 2001, it is possible to conclude that in most of the studied countries, students who report that they attended preschool for more than one year show a statistically significant performance advantage in mathematics over those without preschool attendance. In PISA2003, this advantage is between 58 and 98 score points in Turkey, France, Belgium, Hong Kong China, Germany,
______________________________________________
Implications and Recommendations 175
Hungary, Denmark, and the Netherlands. On average, the difference across the OECD countries is 59 score points. At the same time, it appears that the socio-economic background of children influences the ability of children to take advantage of pre-schooling. After ad-justing for the socio-economic background of children, the net effect of pre-schooling tends to be smaller, such that the performance difference between stu-dents who have attended preschool and those who have not is reduced to about half after the adjustment. • Policy makers should consider whether the increased use of pre-schooling is
a relevant option in their educational systems. Attention needs to be paid to forms of pre-schooling that may strengthen the academic performance of students in the long run without affecting negatively the overall personal de-velopment of small children.
• Policy makers could consider whether there are relevant approaches to pre-schooling which could help children from less advantaged socio-economic backgrounds to a good start in the education system. If such approaches are successful, it seems likely that there will be significant benefits, both for the individuals concerned and for society at large.
Certain Types of Student Assessments May Facilitate Student Performance A range of assessment methods can be used in order to assess students’ aca-demic progress: Standardized tests, the assessment of student portfolios, judge-mental ratings carried out by teachers, regular teacher-developed tests and as-sessments of student assignments, projects, and homework. The use of these assessments methods is widespread among the countries studied, but there is considerable variation in the intensity of their use. Assessments differ widely in nature and quality, and assessment policies and practices are often applied in different ways across school and programme types. For these reasons, it is difficult to relate the use of student assessments to student performances as measured in for instance PISA. However, there is a slight tendency for schools in which teacher-developed tests are applied more frequently to perform better, at least in some countries: In PISA 2003, there is a statistically significant performance difference in Austria, Turkey and the Czech Republic. The explained variance for student performance is quite low, however. Across the OECD-countries, the frequency of teacher-developed tests explains 0,3 per cent of total variance in student performance on the mathematics scale. Frequent teacher-developed tests are positively related to student performance in some countries, but there is little evidence overall that tests and other forms of assessments improve the academic performance of students. Thus, the use of standardized tests, the assessment of student portfolios, judgemental ratings car-ried out by teachers, and assessments of student assignments, projects, and
______________________________________________
Implications and Recommendations 176
homework, cannot explain variance in student performance, and there are no clear directions in statistical relations. Analyses of data from PISA 2000 and TIMSS 1995 do, however, point to a posi-tive impact of centrally set examinations and performance in mathematics and science, even when controlling for the influence of a large number of other in-fluence factors. Analysis of data from PISA 2000 specifically point to an ac-countability effect of external exit exams, as students from schools with auton-omy in determining course contents perform better within a system of external exit exams than without a system of external exit exams. • More frequent use of tests and other forms of student assessments is often
emphasized in public debates about the further development of education systems as a quick and simple way to improve education systems. Data from PISA 2003 suggests that this argumentation is not very clearly supported by evidence. Data from PISA 2000 and TIMSS 1995 do, however, provide some evidence that certain types of assessments or exams may facilitate stu-dent performance, and may increase the performance of autonomous schools.
Positive Student-Related School Climate Factors May be Necessary Precondition for Good Outcomes In PISA 2003, school principals were asked to assess to what extent learning was hindered by student absenteeism, disruption of classes by students, students skipping classes, students lacking respect for teachers, students’ use of alcohol or illegal drugs, and students intimidating or bullying other students. Among the 7 countries where school principals’ assessments of school climate is the most positive, 4 are among the top 6 performers as regards the average per-formance of students across the disciplines (Korea, HK China, Japan, and Bel-gium). On the other hand, school climate as assessed by school principals can explain only a modest share of total variance in student performance: On aver-age across OECD-countries, less than 4 per cent of total variance is explained. • It can be hypothesized that a positive school climate is a necessary but not a
sufficient condition for strong academic performance among students. • To the extent this hypothesis holds true, policy makers are well advised to
consider whether specific initiatives can be initiated in order to strengthen the overall climate of each country’s schools. It should be borne in mind in this connection, that there are probably benefits in respecting overall school autonomy.
• One option that may be relevant in several countries could be to focus on schools with a particularly poor school climate and consider possibilities for restructuring of schools and/or the relocation of parts of the student body to other schools.
Countries differ as regards the significance of school climate for academic per-formance. It is notable that among the four countries where school climate fac-tors matter the most, three (Belgium, Germany, and the Netherlands) are among

______________________________________________
Implications and Recommendations 177
the countries where the institutional differentiation of the school system is most far-reaching. This may suggest that in these countries, problems concerning the school climate are concentrated in relatively few schools with a high concentration of students who have been separated from other groups of students on the grounds of weak academic performance or other disadvantages. • To the extent this is the case, policy makers could consider whether there
could be overall advantages in terms of efficiency and equity of educational opportunities in focusing efforts for improving the school climate on particu-larly disadvantaged schools.
• Other options that could be considered are the restructuring of schools or a redistribution of students between schools, so as to achieve a higher degree of diffusion of students with particular problems that contribute negatively to school climate.
Thus, there seem likely to be beneficial effects for the school systems of Bel-gium, Germany, and the Netherlands, if schools with particular problems as re-gards school climate could be identified, and targeted efforts focusing on im-proving school climate in these schools could be implemented.
Netherlands, Greece, and Portugal: Policy Makers could Act Upon Negative As-sessment of Teachers by Principals Teacher-related school climate factors (comprising factors such as teachers’ ex-pectations of students, student-teacher relations, absenteeism among teachers, and teachers’ attitudes towards change) are only weakly related to average stu-dent performance. • Nevertheless, the education authorities of the Netherlands, Greece, and Por-
tugal, could consider the reasons explaining the relatively negative assess-ment of teachers by school principals in these countries.
• Authorities may consider whether efforts targeted towards increasing teacher commitment, performance, and willingness to consider change, could be beneficial for the overall performance of the education systems in terms of efficiency and equity of educational opportunity.
Complex Possible Causal Relations between Learning Time and Achievements Data from both PISA, TIMSS, and PIRLS, point to a weak statistical relation between student time devoted to learning and average achievement scores. This is not surprising, in so far as the relation is complicated by a number of factors: Teachers may assign more homework to those students most in need of it, for instance, and slower learners may need more time to complete the same amount of homework. Students’ socio-economic background may also affect their homework practices, with the more advantaged students having better opportunities to work effi-ciently. Finally, countries vary considerably in how instruction time is allocated

______________________________________________
Implications and Recommendations 178
over the different levels of education, and the average performance of students in for instance mathematics, reading, and science, must be expected to be the result of the cumulated learning from the start of education and onwards.
Increased Instruction and Homework Time is not a Simple Solution The inconclusive evidence on the statistical relation between student time de-voted to learning and student achievement scores reminds policy makers that there is no clear-cut and simple relation between instruction time and academic results. More instruction hours do not necessarily lead to better academic per-formance among students. The contents of teaching and learning may be more important than the amount of time allocated to teaching and learning. • Policy makers are therefore well advised to consider whether sufficient re-
sources are devoted to the actual contents of learning, rather than to focus on the quantitative amount of teaching and learning time.
• Policy makers in some EU countries (notably Greece, Italy, Latvia, Ireland, and Spain), could consider whether the PISA data on instructional time for 15-year-olds is representative for other age groups; if yes: whether resources could be freed in the education system by reducing the number of instruction hours; and finally whether the resources that are freed in this manner could be applied in improving the contents of teaching and learning.
No Single Approach to Instruction in Reading Better than Others There are considerable differences as to the percentage of students who are sub-jected to reading instruction as a whole-class activity versus individual instruc-tion. There is a tendency towards a predominant instruction strategy in different countries, as teachers in different countries choose either the strategy of indi-vidualized instruction or the whole class-strategy. However, there is no signifi-cant relation between the students’ average reading score and the use of instruc-tion as whole-class activity versus individualized instruction. For this reason, teachers, principals, and policy makers, in countries where indi-vidualized reading instruction is predominant and regarded as the modern ap-proach, are well advised to be aware that individualisation does not in itself lead to high student achievement. In these countries, there may be unexploited poten-tials in a more frequent use of reading as whole-class activity.
Educational Resources not Very Important for Outcomes - This Raises Questions Data from PISA, TIMSS, and PIRLS, suggests that contrary to expectations, shortages of educational resources do not significantly affect students’ average performances. This raises a number of questions that policy makers should con-sider: • Are available resources for instruction used efficiently? Considering that the
group of students from schools with relatively many educational resources do not on average perform better than those from schools with relatively fewer resources, the question is whether available resources are used effec-tively in resource-rich schools?

______________________________________________
Implications and Recommendations 179
• Some groups of students achieve high average scores in reading (PIRLS 2001) despite being instructed under circumstances of shortages of school resources. These schools may provide cases of good practice as to how to accomplish good results by managing existing resources well and making ef-ficient use of resources. How do some schools compensate for shortages of school resources? Policy makers and other relevant actors could consider analysing in more detail the approaches adopted in schools that manage to achieve good results in spite of scarce resources.
• The growing use of computers for instructional purposes may demand more self-management and learning-to-learn competences from students. The use of instructional software in for instance reading may require more self-conduct and learning-to-learn competences from each individual student. The question emerges whether schools and teachers are adequately equipped to deal with the challenges posed by such new requirements to students.
______________________________________________
Literature 180
Literature Abrahamson, Peter, Thomas P. Boje and Bent Greve, forthcoming. Welfare and Families in Europe. Ashgate Publishing. Appel, Rene. 1984. Immigrant children learning Dutch. Dordrecht, The Nether-lands: Foris. Beaton, A.E., M.O. Martin, I.V.S. Mullis, E.J. Gonzales, T.A. Smith and D.L. Kelly, 1996. Science Achievement in the Middle School Years. IEA’s Third In-ternational Mathematics and Science Study (TIMSS), Center for the Study of Testing, Evaluation, and Educational Policy, Boston College, Chestnut Hill, M.A. Benson, Carol, 2005. “The Importance of Mother Tongue-Based Schooling for Educational Quality”, Paper Commissioned for EFA Global Monitoring Report. Bishop, John H., 1997. “The Effect of National Standards and Curriculum-Based Examinations on Achievement. American Economic Review, vol. 87, no. 2, pp. 260-264. Bishop, John H. and L. Wössmann (2004). “Institutional Effects in a Simple Model of Educational Production”, Education Economics vol. 12, no. 1, pp. 17-38. California State Department of Education, 1981. Schooling and language minor-ity students. Los Angeles, CA: California State University, Evaluation, Dissemi-nation, and Assessment Center.
California State Department of Education, 1986. Beyond language: Social and cultural factors in schooling language minority students. Los Angeles, CA: Cali-fornia State University, Evaluation, Dissemination, and Assessment Center. Datcher, L., 1982. “Effects of Community and Family Background on Achieve-ment”, Review of Economics and Statistics, vol. 31, issue 6, pp. 445-475. DTI (Danish Technological Institute), RAND Europe and SKOPE, 2004. ‘Defin-ing a Strategy for the Direct Assessment of Skills’, Aarhus: November. European Commission, 2003. Working Group on Basic Skills. Brussels. European Commission, 2004. “Key Competences for Lifelong Learning. A European Reference Framework. November. Working Group B. Key Compe-tences. Brussels: European Commission, DG Education and Culture.

______________________________________________
Literature 181
Eurostat 2002. Feasibility Study on the Availability of Comparable Child Care Statistics in the European Union. Eurostat Working Paper. Luxembourg, Office for the Official Publications of the European Communities. Eurostat 2005. Structural Economic Indicators for the EU25 countries. Available via europa.eu.int. Eurydice – The Information Network on Education in Europe, http://www.eurydice.org. Eurydice, 2002. Key Data on Education in Europe. Brussels: European Com-mission, DG Education and Culture. Eurydice, 2004. Integrating Immigrant Children into Schools in Europe, Brus-sels: European Commission, DG for Education and Culture. Finn, J. and D. A. Rock, 1997. “Academic Success Among Students at Risk for School Failure”, Journal of Applied Psychology, vol. 82. no. 2, pp. 221-234. Freymann, Thelma von, 2001. „Warum ausgerechnet Finnland? Anmerkungen zu den finnischen PISA-Ergebnissen“, Sonderdruck „PISA 2002“, Hrsg: Lan-deselternschaft der Gymnasien in Nordrhein-Westfalen e.V., Mai 2002, S. 29. Fuchs T. and Wössmann, L., 2004a. “What Accounts for International Differ-ences in Student Performance? A Re-Examination Using PISA Data”, CESIFO Working Paper No. 1235. http://www.CESifo.de Fuchs, T. and Wössmann, L., 2004b. “Computers and Student Learning: Bivari-ate and Multivariate Evidence on the Availability and Use of Computers at Home and at School”, Working Paper, Ifo Institute for Economic Research at the University of Munich. http://www.res.org.uk/econometrics/504.pdf de la Fuente, Angel and Antonio Ciccone, 2002. Human capital in a global and knowledge-based Economy, Brussels: European Commission, DG Employment and Social Affairs. Garcia, E., 1988. “Attributes of effective schools for language minority stu-dents”. Education and Urban Society, 20(4), 387-398. Gonzales, E.J. and Kennedy, A.M., 2003. PIRLS User Guide for the Interna-tional Database, Boston: Boston College. Goodman, Kenneth, 1982. Language, literacy, and learning. London: Routledge & Kegan Paul. Hakuta, Kenji, 1986. Mirror of language: The debate on bilingualism. New York: Basic Books.
______________________________________________
Literature 182
Hakuta, K., & Garcia, E., 1989. “Bilingualism and education”. American Psy-chologist, 44(2), 374-379. Hart, B. and T. R. Risely, 1995. Meaningful Differences in the Everyday Experi-ence of Young American Children. Baltimore M.D.: Brookes. Hoopengardner, Thomas, 1999. “Will Polish Education Reform Improve Educa-tion Quality and Efficiency?” World Bank Quarterly Bulletin of Poland, No. 5, May. Husén, T., 1974. Learning Society. London: Methuen. Johnson, M. K., R Crosnoe, and G. H. Elder, 2001. “Students’ Attachment and Academic Engagement: The Role of Race and Ethnicity”, Sociology of Educa-tion, vol. 74, pp. 318-340. Kim et al (2004): “Trends and Differentials in School Transition in Japan and Korea”, paper prepared for presentation at the conference “Inequality and Strati-fication: Broadening the Comparative Scope” of Research Committee 28 (Social Stratification and Mobility) of the International Sociological Association, Au-gust 7-9, Rio de Janeiro, Barzil, 2004. Accessible at http://www.kli.re.kr/20_english/02_work/file/2004_Brazil_Phang&Kim.pdf Koivula, Pirjo, 2005. “Special Support in Education”, Senior Adviser, Finnish National Board of Education. Powerpoint presentation at Finland in PISA-studies - Reasons behind the Results, International Conference in Helsinki 14 - 16 March 2005. Stephen Krashen, 1999. “Bilingual Education: Arguments For and (Bogus) Ar-guments Against”, University of Southern California. http://ourworld.compuserve.com/homepages/jwcrawford/Krashen3.htm Krashen, Stephen, 1996. Under attack: The case against bilingual education. Culver City, CA: Language Education Associates. Linnakylä, Pirjo & Jouni Välijärvi, ”Finnish Students’ Performance in PISA – Why Such a Success?” Institute for Educational Research University of Jyväskylä. Published as: Linnakylä, P. &Välijärvi, J. 2003. ”Das erfolgreiche Abschneiden von finnischen Schülern bei de PISA-Studie. Welche Erklärungen gibt es dafür?” Forum Jugendarbeit International / Dirk Hänisch, Reinhard Schwalbach (toim). Bonn: Internationaler Jugendaustausch- und Besucherdienst der Bundesrepublik Deutschland, 284-295. Levitas, Tony and Jan Herczynski, “Decentralization, Local Governments and Education Reform in Post-Communist Poland”, May 2001. Paper Prepared for the Open Society Institute's Local Government Initiative Program.

______________________________________________
Literature 183
Lie, Svein, Pirjo Linnakylä, and Astrid Roe (eds.), 2003. Northern Lights on PISA. Unity and Diversity in the Nordic Countries in PISA 2000. Oslo: Depart-ment of Teacher Education and School Development, University of Oslo. Martin, Michael O., Ina V.S. Mullis, Steven J. Chrostowski (IEA), 2004. TIMSS 2003 Technical Report Boston: International Association for the Evaluation of Educational Achievement. Center for the Study of Testing, Evaluation, and Edu-cational Policy, Boston College, Chestnut Hill, M.A. Mazura, Antra, 1999. National Report, Republic of Latvia, Education for All. The Year 2000 Assessment. Developed in the framework of the UNESCO Edu-cation for All framework. MOE - Ministry for Education and Human Resources, Republic of Korea, 2004. Education in Korea. http://www.moe.go.kr/en/etc/education.html. MEN 1999. Ministerstwo Edukacji Narodowej o reformie programowej - gim-nazjum, Biblioteczka Reformy 9, Warszawa. Mullis, I.V.S., Martin, M.O., A. E. Beaton, E. J. Gonzalez, D. L. Kelly, and T. A. Smith (IEA) 1998. Mathematics and Science Achievement in the Final Years of Secondary School: IEA's Third International Mathematics and Science Re-port. Center for the Study of Testing, Evaluation, and Educational Policy, Bos-ton College, Chestnut Hill, M.A. Mullis, I. V. S., Michael O. Martin, Edward G. Fierros, Amie L. Goldberg, Ste-ven E. Stemler (IEA), 2000. Gender Differences in Achievement IEA’s Third International Mathematics and Science Study (TIMSS). Murad, Linda C. 2004. “Hong Kong’s Education System: Challenge for the Fu-ture”, Working Paper, Lehigh University, www.lehigh.edu/~incntr/publications/ perspectives/v20/Murad.pdf. OECD 2001, Knowledge and Skills for Life. First Results from the OECD Pro-gramme for International Student Assessment (PISA) 2000. Paris: OECD. OECD 2002. Lifelong Learning in Norway. Reviews of National Policies for Education. Paris. OECD 2003a. The PISA Assessment Framework – Mathematics, Reading, Sci-ence and Problem Solving Knowledge and Skills, Paris: OECD. OECD 2004a. Education at a Glance. OECD Indicators 2004. Paris: OECD. OECD 2004b. What Makes School Systems Perform? Seeing School Systems Through the Prism of PISA. Paris: OECD.

______________________________________________
Literature 184
OECD 2004c. Learning for Tomorrows World – First Results from PISA 2003. Paris: OECD. OECD 2004d. Attracting, Developing and Retaining Effective Teachers. Paris: OECD. OECD 2004e. Problem Solving for Tomorrow’s World – First Measures of Cross-Curricular Competences from PISA 2003. Paris: OECD. OECD 2005a. PISA 2003 Technical Report. Paris: OECD. OECD 2005b. University Education in Denmark, Reviews of National Policies for Education. Paris. Olsen, Rolf Vegar, 2004. “The OECD PISA assessment of scientific literacy: how can it contribute to science education research?” Working paper, OECD PISA in Norway, http://www.pisa.no/dok_vit.html. Rangvid, Beatrice Schindler, 2005. “Sources of Immigrants’ Underachievement: Results from PISA-Copenhagen”. Copenhagen: AKF. Riley, Richard W., R. T. Takai and J. C. Conaty, 1998. “The Educational System in Japan: Case Study Findings”, http://www.ed.gov/pubs/JapanCaseStudy/index.html Riley, Richard W., C. K. McGuire and J. C. Conaty, 1999. “The Educational System in the United States: Case Study Findings”, http://www.ed.gov/pubs/USCaseStudy/index.html Robitaille, David F., 2001. “The Relevance of TIMSS for Policy Making in Edu-cation”. Working Paper, University of British Columbia. Sammons, P., Sylva, K., Melhuish, E., Siraj-Blatchford, I., Taggart, B. and El-liot, K., 2002. Measuring the Impact of Pre-Schooling on Children’s Cognitive Progress over the Pre-School Period, Technical Paper 8a, London: Institute of Education / Department for Education and Skills. Scott, Elios, 2004. “Comparing NAEP, TIMSS, and PISA in Mathematics and Science”, U.S. Department of Education, Washington D.C. Skolverket, 2003. Läsförståelse hos elever med utländsk bakgrund. Särtryck av rapport 227, Stockholm. Skolverket, 2004. Elever med utländsk bakgrund, Stockholm. Skolverket, 2005. "Undervisning för elever med utländsk bakgrund och för na-tionella minoriteter", Stockholm.

______________________________________________
Literature 185
Smith, Frank, 1994. Understanding reading. Fifth edition. Hillsdale, NJ: Erl-baum. Stanat, Petra, 2004. “The Role of Migration Background for Student Perform-ance: An International Comparison”, Paper presented at the 2004 Annual Meet-ing of the American Educational Research Association, April 12-16 in San Diego, California. Thomas, W. P. and V. P. Collier, 2001. “A National Study of School Effective-ness for Language Minority Students’ Long-Term Academic Achievement. http://www.crede.org/research/llaa/1.1_final.html UFD – Utdannings- og Forskningsdepartementet (Norwegian Department for Education and Research, 2003. Høring - Forslag om endringer i opplæringsloven § 2-8 og friskoleloven § 3-5, http://odin.dep.no. Vallet, L. A and Jean-Paul Caille, “Migration and Integration in France. Aca-demic Careers of Immigrants’ Children in Lower and Upper Secondary School”, Paper prepared for the ESF Conference “European Societies or European Soci-ety? Migrations and Inter-Ethnic Relations in Europe”, Obernai September 23-28 1999. Verhoeven, L., 1991. Acquisition of biliteracy. AILA Review 8: 61-74. Voelkl, K. E., 1995. “School Warmth, Student Participation, and Achievement”. Journal of Experimental Education, vol. 63, no. 2, pp. 127-138. Willig, A., 1985. “A meta-analysis of selected studies on the effectiveness of bilingual education”. Review of Educational Research, 55, 269-317. Wössmann, Ludger, 2003. “Schooling Resources, Educational Institutions and Student Performance: The International Evidence”, Oxford Bulletin of Econom-ics and Statistics, vol. 65, no. 2, pp. 117-170. Wong-Fillmore, L., & Valadez, C., 1986. “Teaching bilingual learners”. In M. Wittrock (Ed.), Handbook on research on teaching, pp. 648-685. Washington, DC: American Educational Research Association.
______________________________________________
Annexes 186
Annex 1: New Analysis and Data Collection Activities Several methodological challenges have been encountered in the course of carry-ing out the present study. Some have been overcome; others are fundamental for the project and will remain. Experiences from implementing the present study should be utilized in the European Commission’s further work for improving basic skills education in Europe.
Findings and Recommendations Rather General - Much of the analysis in the present report has focused on the country level and on trying to identify patterns and relations with policy implications and policy relevance at this level. The policy implications of the findings are frequently at a rather general level. There are several reasons for this. At the country level, one factor is the “small-n”- problem: Given the low number of units of investigation and the large number of potentially relevant independent variables, it is not possible to isolate the effects of each indendent variable on the dependent variable. From a statis-tical point of view, it is therefore not possible to answer the question why some countries perform better than others in terms of achievement scores. The small-n problem has been evident in connection with the focus in the pre-sent study on the Finnish education system and its performance. Various expla-nations for the Finnish success are floating the public debate, some more con-vincing than others. A German researcher has even pointed to the long Finnish winter nights as a plausible explanation for high average reading scores. Another example: Danish nutritional researchers have recently claimed that free school meals in Finland and Sweden explain the difference in PISA achievement scores between these two countries and Denmark and Norway, where no free meals are provided. More convincing accounts of the Finnish success story have been presented by members of the Finnish PISA research team. However, even these explanations rest on assessments and judgements, and they have to do so since the independ-ent effect of various factors cannot be identified.
- And This Must Necessarily be So More generally, there are inherent limits to the degree of detail in the back-ground variables which can be included in large-scale quantitative surveys. As the OECD itself notes frequently in its analysis of PISA-data, quantitative sur-veys can only go some of the way in providing valid description of school prac-tices, of the relations between teachers and students, and more generally in pro-viding rich and valid pictures of “good schools” as well as “bad schools”. A relatively high level of aggregation has also been made necessary in the study, considering that it covers 27 countries, 3 skills domains, and 3 major interna-tional skills surveys, each of them having been carried out several times. Finally,

______________________________________________
Annexes 187
many statistical relations between the study’s key variables have been revealed to be weak or contingent. Frequently, such findings do not allow the formulation of very strong policy implications and policy recommendations, even if they can sometimes be used to refute simplistic understandings of causal relations and relevant policy options.
The Strength of PISA, TIMSS, and PIRLS: To Generate Questions and Stir Debate This does not mean that the findings generated by the data from PISA, TIMSS, and PIRLS are uninteresting or irrelevant. As the present report hopefully dem-onstrates, it is indeed possible to arrive at both interesting and controversial con-clusions on the basis of data from the three international surveys. However, on the basis of our experiences, it seems that the strength of PISA, TIMSS, and PIRLS, is more in their ability to highlight differences in educa-tional outcomes across countries and to generate debate and raise (often uncom-fortable) questions against this background, than in their being tools for generat-ing explanations of educational outcomes and pointing to very specific solutions in terms of good practices.
Limited Use of PISA, TIMSS, and PIRLS, for Research in Teaching and Learning This observation is underpinned by the fact that the educational research estab-lishment has only to a limited extent made use of PISA, TIMSS, and PIRLS, for research purposes. This is the case at least for pedagogical education research (cf. Olsen 2004), whereas the situation appears different in the field of educa-tional economics research, where data from PISA, TIMSS, and PIRLS, has been used more extensively.
Implications: Quantitative Data to be Supplemented by Qualitative Information These observations have implications for the kinds of information and data which can best inform future policy making on the provision of basic skills in the European Union. In our assessment, the development of education policy via mutual learning in the EU cannot rest alone on quantitative data of the sort gen-erated by PISA, TIMSS, and PIRLS. There are benefits in supplementing quanti-tative information of this kind with more qualitative types of information. There are several possibilities that are relevant for supplementing data from PISA, TIMSS, and PIRLS with other kinds of knowledge: Existing educational research on for instance pedagogical approaches and learning practices could be utilized systematically to generate policy recommendations. It is a challenge to transpose basic research in this respect into policy-relevant implications and rec-ommendations, and evidently there are many conflicting views on best teaching and learning practices. However, the potential advantages are large and the at-tempt should be made. Similarly, existing research on factors such as school management practices and teacher education practices could be analysed on an international basis and util-ized wherever relevant.

______________________________________________
Annexes 188
New systematic, research-based activities could be initiated for generating rele-vant conclusions on good practices as regards factors such as teacher training, school management, and teaching and learning practices. It seems likely to us that international comparisons could very well form an important element in such research. On the other hand, research designs would probably only rely on quantitative data collection tools to a limited extent, as such tools cannot be ex-pected to capture all relevant aspects of the objects of study. Recommendations: • In stimulating mutual learning about educational systems and educational
policy, the European Commission should make increased use of qualitative educational research on for instance school management practices, teacher training approaches, and pedagogical approaches and learning practices, to generate policy recommendations.
• In this connection, the European Commission should consider establishing a virtual centre of good education practice. Such a centre could hold and make available across Europe data from innovators and independent assessors in different forms (reports, PowerPoint-presentations, videos, etc.), concerning good and innovative education practice.
• The European Commission should also consider launching targeted re-search-based activities for generating relevant conclusions on good prac-tices as regards for instance teacher training, school management, and teaching and learning.
• The European Commission should discuss with the member states the option of introducing qualitative in-depth reviews of national education systems in the framework of the EU, along the lines of the qualitative OECD country reviews in education (e.g. OECD 2002; OECD 2005b).
Handling PISA, TIMSS, and PIRLS Data Requires Some Expertise The European Commission’ Directorate General for Education and Culture is considering to carry out its own statistical analysis of data from PISA, TIMSS, and PIRLS. In this connection, the Commission needs to consider that such data analysis will require some expertise if the results are going to be valid and ac-cepted as valid. In particular, the development of further multivariate regression analyses than those that have already been developed in the framework of the OECD in con-nection with PISA will require advanced statistical expertise and some develop-ment work. The sampling strategy in PISA, TIMSS, and PIRLS, is thus con-nected with difficulties in relation to multivariate analyses. Schools get selected first and, within each selected school, students (PISA) or classes (TIMSS and PIRLS) are randomly sampled.54 54 The sampling uncertainty associated with any population parameter estimate (i.e. the standard error) will be greater for a two-stage sample than for a simple random sample of the same size. The computation of sam-pling variances for two-stage samples is available for some sampling designs, but it is rather complex to compute for multivariate indices. This has consequences for the possibilities of carrying out valid multivariate analyses, for instance multivariate regression analyses using factor analyses: Without valid estimates of standard errors, the analysis will result in too many factors being statistically significant.
______________________________________________
Annexes 189
The Commission also needs to balance the value-added of further analyses of data from PISA, TIMSS, and PIRLS, with the costs of a) developing an internal capacity for carrying out such analyses, or alternatively b) contracting out fur-ther analysis, possibly with a narrower focus than the focus of the present study.
More Analysis Will not Yield Qualitatively Different Types of Conclusions In this connection, the Commission should consider that results from further analysis of data from PISA, TIMSS, and PIRLS, are likely to be at the same level of generality as the ones presented in this report. Increasing the intensity of statistical analysis does not entail a qualitative change in the nature of conclu-sions. The limits of the findings will continue to be defined by the methodologi-cal frameworks of the three surveys, the fact that large-scale quantitative nature of the surveys imposes limits on the types of variables that are involved, and the small n-problem in the case of analysis at the country level, to mention the most important constraints. There may still be aspects, however, where more analysis can provide a better understanding.
- But There Is a Need to Translate Data and Research Into Recommendations Morever, the present study in our assessment fulfils a need among educational policy makers and authorities in the EU, namely bridging the gap between (fre-quently research-based) data collection and data analysis on the one hand and the policy-oriented recommendations that are requested by educational decision makers on the other hand. It seems to us that there will be a continuing need for targeted analyses which can translate the results of both quantitative and qualita-tive education research into conclusions that are directly relevant for policy. Recommendations: • The European Commission should identify particular focus areas where ad-
ditional analysis could be carried out of existing educational research in or-der to inform education policy development in the EU and formulate policy recommendations
• The European Commission could launch an international conference to this end, focusing on the relation between educational research and educational policy. Conference participants could be invited to submit proposals for ways in which the relation could be invigorated and for subjects that merit particular attention.
• The European Commission’s Centre for Research on Education and Lifelong Learning (CRELL), which will be fully operational at the spring of 2006, may to some extent be able to carry out policy-oriented analysis of existing educational research. To the extent this is not the case, the European Com-mission should consider establishing a separate unit for educational analy-sis, or in the event this is not economically feasible, contracting out specific analytical tasks to independent agencies.
• The European Commission should not, however, allocate significant new resources to an ongoing analysis of data from PISA, TIMSS, and PIRLS.
______________________________________________
Annexes 190
Several Factors Must be Considered When Deciding on New Data Collection Based on the experiences from the present study, is there a need for new quanti-tative data collection activities in relation to basic skills? The scope of skills covered by PISA, TIMSS, and PIRLS, is relatively limited: Apart from reading, mathematics, and science, the only additional skill domain covered is problem solving, included in the PISA 2003 survey but not covered in the present study. A broad spectrum of other skill domains is frequently considered important if individuals are to be able to participate actively in tomorrow’s societies (cf. DTI et al. 2004). Among the most important are foreign language skills, ICT skills, entrepreneurial skills, learning-to-learn skills, and certain social skills. Several others could be mentioned. In deciding on whether new skill domains should be covered by future interna-tional skills surveys among students, several factors must be taken into account: What is likely to be the informational value-added of including new skills? What are the costs of doing so? Is it methodologically feasible to do so? Are there spe-cific advantages in carrying out such skills assessments on an international ba-sis?
Correlation Between Different Skills Points to Cross-Curricular Factors On the basis of the insights of the present study, some preliminary answers can be provided to these questions. A first point to be made concerns the fact that the correlation between student performance on the different scales (mathematics, reading, and science) is high (for example r = 0,77 between mathematics and reading and r = 0,82 between mathematics and science in PISA 2003, cf. Table A1 in Annex 3). These high correlations are reflected, of course, at the level of countries, where there is a clear tendency that countries with high average achie-vement scores on one scale also have high average achievement scores on other scales. Including the problem-solving scale in PISA 2003 does not affect this conclusion. The high cross-domain correlations suggest that cross-curricular factors, outside the teaching and learning of the individual skill domain, affect the achievement scores of students or – put differently - that the three scales to a great extent measure the same underlying dimension.55 Extrapolating from this observation, it is likely that for several new skills domains, the inclusion of new skills will not yield substantially different results in terms of different rankings of countries or students than the assessments of reading, mathematics, and science. In this respect, the information value-added could therefore be expected to be limited.
Foreign Language Skills May Not Correlate With Other Skills However, this conclusion cannot be expected to hold true for all types of skills. In particular, it could be expected that foreign language skills will correlate closely with the priority given to foreign language training in individual school 55 “Student learning abilities” seems a relevant – even if rather broad and imprecise – term. Different factors, including the educational background and the socio-economic resources of parents, may in turn affect this underlying dimension. Chapters 5 and 6 of the report analyse the significance of a number of such factors.
______________________________________________
Annexes 191
systems. This priority can, in turn, be expected to vary significantly between school systems. A weak correlation between reading, mathematics, and science on the one hand and other types of skills on the other hand may be found for other skills domains as well.
Information on Absolute Skill Levels Also Relevant Moreover, the most interesting information from the perspective of policy mak-ers may often be the absolute level of skills among students rather than their performance relative to students of other countries. For instance, the most impor-tant information with respect to reading may be the proportion of students who are functionally illiterate. Similarly, it may be more important for policy makers to obtain information on the proportion of students that are “ICT-illiterate” or incapable of communicating in a foreign language, than obtaining information on the performance of students relative to students in other school systems.
The International Perspective is Essential in the EU Information on the absolute level of skills in new domains does not necessarily have to be provided on an international basis. However, from the perspective of the European Union, the international perspective is essential: With the Lisbon Strategy, the member states of the EU have committed themselves to working in common towards a number of long-term objectives, and many of these objec-tives pertain to education and basic skills.
Tests are Costly and Not Feasible for Many Types of Skills There is a general presumption in favour of testing as the best method of assess-ing individuals’ skills, because tests are “objective”; they do not suffer from the potential biases that can come from dependent parties, especially the individual being assessed. Tests therefore start with a presumption of superior reliability over other methods of assessment. The series of student tests carried out under the auspices of the OECD (PISA) and the IEA (The International Association for the Evaluation of Educational Achievement, coordinating TIMSS and PIRLS) have shown that certain skills are testable, and it is generally agreed that they do measure up to reasonably acceptable standards of international comparability. They have therefore achieved sufficient reputation and respectability. On the negative side, however, the experience of PISA, TIMSS, and PIRLS, as well as of other international skills assessments, suggests that testing is limited to a relatively narrow range of skills. For other skills, it has not (to date) proved possible to devise tests that are sufficiently valid and reliable, and equally so in many countries. A second negative aspect of these existing tests is that the de-velopment and execution of skills tests has been expensive. The design of tests occupies quite a large part of the central cost. A recent study (DTI et al. 2004) concluded that in relation to adult skills assessment, testing must be restricted to a narrow range of skills. Apart from literacy and numeracy, these might also include foreign language skills and ICT skills. Taking into account the significance of foreign language skills and ICT skills in the EU’s Lisbon Strategy; taking into account that the development of test tools

______________________________________________
Annexes 192
in these two domains is relatively advanced; and taking into account that infor-mation on the absolute skills levels among students in these two domains can be expected to be of relevance to policy makers, we recommend the following: Recommendation: • The European Commission should consider launching specific test-based
data collection activities on foreign language proficiency and ICT skills among students in the EU member states. Where relevant, these activities should be coordinated with activities under the auspices of the OECD (PISA).
There Are Differences between PISA, TIMSS, and PIRLS PISA differs from TIMSS and PIRLS in a number of respects. The most impor-tant differences concern the methodological framework, the sampling strategy, and the populations targeted in the different surveys. As for the test framework, PISA seeks to measure ‘knowledge and skills that are essential for full partici-pation in society’, whereas TIMSS focuses on tests aimed at measuring the extent to which the intended and implemented curriculum is reflected in indi-vidual students’ competences. As for the sampling strategy, PIRLS and TIMSS sample classes within a sample of schools, whereas PISA samples individual students within a sample of schools. As for the populations that are targeted, PISA is age-based, targeting 15-year-olds, whereas as TIMSS and PIRLS are grade based, targeting 4th and 8th grade students. There are advantages and disadvantages to each approach, and each approach can potentially generate different kinds of information that is useful in different contexts. But do the advantages of parallel implementation of different types of large scale international skills assessments among students outweigh the costs of doing so?
- But There Are Few Real Benefits from Different Approaches On the basis of experiences from the analyses in the present report, the benefits from implementing parallel yet different international skills surveys appear lim-ited. There is a rather high correlation between the average student achievement scores of school systems in PISA and TIMSS (8th grade): Countries where stu-dents perform well in PISA also tend to be countries where students perform well in TIMSS (8th grade) and vice versa. This suggests that both surveys to a great extent measure the same underlying dimensions, regardless of differences in test frameworks. In contrast to PISA, the framework of TIMSS holds the promise of making pos-sible a fuller analysis of teacher- and classroom-related factors in school sys-tems. However, it seems clear that there are inherent limits to the extent to which questionnaire data can meaningfully shed light on subjects such as instructional practices and forms of teacher-pupil interactions, and the analyses in the present report have generated few insights that can be traced directly to the class-based design of tests and sampling in TIMSS.

______________________________________________
Annexes 193
Neither has the focus on curriculum in the test framework of TIMSS (8th grade) generated insights that differ substantially from the insights generated in PISA. This may be attributed to the relatively high level of aggregation in the present study, and it is possible that there are advantages in the curriculum-based ap-proach in TIMSS if the focus is on specific curriculum elements and student performance in this relation. However, the limited use of data from TIMSS in educational research so far does not inspire confidence that TIMSS data can generate insights that are qualitatively different and more directly relevant to educational policy and educational practice than PISA.
Participation in Parallel International Student Assessments Could be Avoided Based on the experiences and insights from the present study, the EU member states may consider to limit their future participation in parallel international skills surveys. The 4th grade surveys in PIRLS and TIMSS target a different population than PISA, and there may be good reasons for countries that are already participating in these surveys to continue to do so, and for new countries to consider participating in the future. However, for the age group 15-16 year-olds/the 8th grade, the costs of participation in both TIMSS and PISA may not outweigh the benefits. Furthermore, from the perspective of the EU and the Lisbon Strategy’s objec-tives, it is important for policy-making purposes that as many EU member states as possible take part in the same international survey in order to generate infor-mation on progress towards the stated objectives concerning basic skills. Against this background, the EU member states could consider to give priority to partici-pation in the 2006 and 2009 PISA surveys, and the European Commission should encourage the member states to participate in the PISA 2006 and 2009 surveys. Recommendations: • The European Commission and the EU member states should encourage the
OECD and the IEA to maximise the complementarity of the PISA and TIMSS surveys in future data collection rounds.
• Taking into account the priority accorded to basic skills in the Lisbon Strategy, all EU member states are recommended to participate in the PISA survey from 2006 onwards (Malta and Cyprus are presently not planning to participate).
______________________________________________
Annexes 194
Annex 2: What Lies Behind the Case of Finland, the Top Performing Country? The results of the PISA 2003 survey identify Finland as a top-performing coun-try. This is so both as regards the average pupil achievement scores in reading, mathematics, and science, and as regards the variance in pupils’ achievement scores. As for reading and science, the average achievement scores of the Fin-nish pupils are the highest among the participating countries; as for mathematics, only the pupils of Hong Kong performed better on average. The PISA 2000 survey yielded similar results: The average achievement score of the Finnish students was the best as regards reading literacy, the fourth best as regards mathematical literacy, and the third best as regards scientific literacy (OECD 2001). Finland also tops the list of countries as regards the average variation of stu-dents’ achievement scores (standard deviation). In reading, mathematics, and science, student performances vary less in Finland than in any of the other coun-tries in the 2003 PISA survey. Furthermore, the standard deviation of Finnish students has decreased from 2000 to 2003. Key Characteristics of the Finnish Education System Reforms of the Finnish Educational System In Finland, reforms over three decades have revolved around the desire to pro-mote equal educational opportunities as well as the principle of lifelong learning. Efforts have included the introduction of comprehensive schools in the 1970s to replace a tracked school system, the reform of vocational training in the 1980s, and the establishment of polytechnics in the 1990s. With comprehensive educa-tion came greater central planning and control, particularly over the curriculum. However, during the 1990s schools were given more freedom over optional sub-jects and were allowed greater diversity through concepts such as specialized schools. Every four years the government details its priorities for education in a development plan. Priorities in the 1999-2003 plan included: • Focusing on ICT, mathematics, and science • Promoting high levels of foreign language competence • Requiring educational institutions and local authorities to carry out evalua-
tions in order to raise quality. • Improving co-operation between schools and the world of work. • Establishing standards in pre-service and in-service teacher training. School Governance In the 1980s and 1990s, Finland transferred competences for a formerly state-run school administration to local municipalities. Schools themselves can now make their own decisions on operational activities, but since these are based on na-
______________________________________________
Annexes 195
tional objectives, the position and importance of assessment and evaluation has been strengthened. The Ministry of Education and the National Board of Education set a core cur-riculum comprising common subjects to be studied and national targets for learning. They also specify the number of lessons and assessment criteria in core subjects at the primary and lower secondary levels. Clear performance targets have been identified in terms of “minimum competences to be achieved”. Mu-nicipalities and schools develop their curricula on the basis of the specified core. While the core includes a wide range of subjects, 20% of teaching time is re-served for optional subjects. The core curriculum starts in the voluntary year of preschool education, now received by 90% of each age-cohort of children. The preschool core curriculum emphasizes children’s individuality, co-operation and the acquisition of social and cognitive abilities in a playful environment. System Monitoring Studies and evaluations aim to ensure adherence to guidelines and decisions es-tablished by the political administration and/or the national curriculum. Those entrusted with this task must determine whether policy is actually implemented. Test results indicate whether students are achieving performance expectations to a uniform standard. A particular object of study is performance differences be-tween schools, in order to target poorly performing schools for support. Teachers and principals are also involved in the evaluations, which repeatedly change em-phasis by focusing successively on different topics. Thus the evaluation system is seen as a tool oriented towards helping schools improve, rather than simply publicising weak performance. Institutions responsible for evaluation – ranging from the National Board of Education and its development of a model allowing schools to evaluate them-selves, to municipal-level evaluation measures - are assigned essential support functions. Assessment Systems and Learning Processes Finland’s assessment system relies heavily on self-assessment and other mecha-nisms that put relatively little emphasis on tests. Homework is of great impor-tance, and it serves as a means of monitoring student commitment. Learning progress is monitored on individual student report sheets and discussed with each student. Students are encouraged to undertake self-observations and self-assessment. Rather than formally evaluating children, educators intensely monitor their pro-gress. Until the age of 13, such close nurturing of children is conducted by class teachers, who continue to have charge of school children until specialized tuition begins.
______________________________________________
Annexes 196
Finnish schools tend to group students more according to their interest in certain subjects than to their intellectual potential. Only 2.5% of children attend special schools, and Finnish classrooms are heterogeneous in terms of students’ abilities and backgrounds. This demands efficient learning in small groups, with teachers ready to arrange new groups where necessary. Research appears to indicate that in Finland, mixed-ability classes have greatly benefited lower-achieving students, while higher-achieving students are not greatly affected by changes in the composition of a learning group. Teachers are trained early to deal with heterogeneity, using a broad spectrum of methods. An extended counselling system supports students in selecting courses for their further education and their career planning. Students with learning dif-ficulties attend individual tuition or tuition in small groups once or twice a week, in addition to receiving support from special-needs teachers inside or outside their classrooms. Professional Development of Teachers Only 10% of applicants successfully pass the rigorous selection procedure to enter teacher-training in Finland. The selection procedure includes an aptitude test and other forms of assessment. Teacher-training takes place in universities. The universities operate a unified training system requiring students to undertake an initial B.A. degree and then a Masters. Educational components are dominant for primary school teachers, but are only a small part of secondary courses. At the end of pre-service training, teachers must take tests in which they either “pass” or are required to do further work. Teaching appears to have lost some status in the past 30 years in Finland, but remains one of the most popular careers for university graduates. Teachers ex-plain this fact with their continued high esteem in society. Teacher salary is relatively low compared to that of other professiosn, but work-loads are moderate, with 15-23 hours of teaching a week and a high ratio of staff to students. Provisions for continuing training of teachers include in-service training days and an expectation that schools will spend around 1% of their payroll for train-ing. Possible Explanations The Finnish achievements have been widely debated in a number of countries, and a number of explanations have offered for the relative success of the Finnish education system. Based on an analysis of PISA 2000 data, which do not differ significantly from 2003 data as regards the main conclusions for Finland, Linna-kylä & Välijärvi (2003) from the Finnish PISA team highlight the following
______________________________________________
Annexes 197
factors, emphasising that no single factor or simple explanation can account for the results: • At on overall level, the success of the Finnish strategy for building up high
quality, based on the principle of equity and on an effort to minimize low achievement.
• The reading motivation and interest of Finnish students • The principles of the comprehensive school • The status of teachers in Finland • The right to special education for all • Flexibility in curriculum, and finally • Cultural homogeneity. High quality of educational outcomes – high equality of educational opportunities The Finnish strategy for building up high quality has been based on the principle of equity and on an effort to minimize low achievement. One of the most rele-vant findings of the PISA data, therefore, is the low gap between high and low performers in Finland, and the fact that the lowest scoring students, in particular, showed a different pattern of performance as compared to their fellow students in the other OECD countries. The difference between Finnish top performers and the OECD average, on the other hand, tended to be much less pronounced. As regards equal opportunities for learning, the PISA results also show that Finland displays a relatively low impact of parents’ socio-economic status on student performance compared to other OECD-countries. These results suggest that the Finnish comprehensive school has built up literacy competence that is not only of a high quality but also signifies relatively high equality from the perspective of students’ social background. As a token of equal educational opportunities in Finland, the differences be-tween schools were among the smallest of all the OECD countries. While differ-ences between schools accounted for 36 per cent of the variation in student read-ing performance in the OECD countries on average, in Finland only 5 per cent of the variation was between schools. Even the weakest performing schools in Finland achieved the OECD average. PISA results show that small between-school variation is one of the key predictors of high student performance. Coun-tries with the highest performance in reading literacy usually display compara-tively small differences between schools. Finland has also sought to provide all students irrespective of their place of resi-dence with equal opportunities for high-quality education. A comprehensive network of schools and the recruitment of highly qualified teachers in all schools have been important means in ensuring educational equality in all regions of Finland. There are over 4,000 comprehensive schools, about 750 upper secon-dary schools (academic and vocational), 20 universities, and a big number of other educational institutes, for the country of slightly over 5 million inhabitants.

______________________________________________
Annexes 198
The results can be clearly identified, which can be seen in PISA in that differ-ences among schools between the different regions as well as between urban and rural areas of Finland have proven relatively small. In Finland it is thus of little consequence indeed where students live and which school they go to. The oppor-tunities to learn are virtually the same all over the country.
Factors Behind High Reading Literacy Achievement The results of the PISA surveys reveal that there is no one single factor behind the high reading literacy achievement of Finnish students. Rather, a whole net-work of interrelated factors was associated with good performance. This network connects students' own interest and engagement in reading, their learning strate-gies, leisure activities in the learning environments provided by school and homes, and students’ own and their parents’ and teachers' values, aims, and ex-pectations.
Based on regression analyses of the PISA data, the single key factors which proved most powerful for the variance in young Finns' reading literacy scores were students’ own interests, attitudes, and activities: first of all, engagement (explains 22% of the variance) and interest in reading (18%). The next strongest factors derive from the home background: its cultural communication (6%), cul-tural products provided (6%), and parents' socio-economic status (6%). An equally strong associate is student's self-concept as a mother-tongue learner (6%).
Comparison of the Finnish and the German results reveal both similarities and differences with regard to the major background factors. Also in Germany, en-gagement (16%) and interest (11%) in reading were strong associates, although their respective explanatory power was clearly lower than in Finland. Cultural communication and possessions related to culture at home played quite similar roles in both countries. Parents' socio-economic status, however, explained a clearly larger part of achievement in Austria (16%) and in the OECD-countries on average (11%) than it did in Finland (6%). These findings suggest that in Finland, students’ own interest and engagement in reading play an important role in reducing the gap between reading proficiency scores of students coming from different social backgrounds. Finnish students also displayed the highest level of interest and the third highest level of engage-ment in reading in the PISA countries. In Finland, 41 per cent of the students, for example, reported that reading was one of their favourite hobbies. For girls the figure was 60 per cent. Finnish students also spend more their free time read-ing than German students do. Also the text types and contents of reading are more diverse in Finland than in Germany. Finnish students are most active newspaper readers and they borrow books from the library more frequently than in Germany or in any other OECD country. The comprehensive network of mu-nicipality libraries supports students’ interest and engagement in reading in Finland.

______________________________________________
Annexes 199
The results reflect a long-standing culture of reading in Finland. At 3,8%, illiter-acy rates were already among the lowest in the world at the beginning of the 20th century. The Principles of the Comprehensive School One effort to strengthen the principle of equity in Finland has been to build up a comprehensive school that every child attends free of charge for nine years from the age of 7 to the age of 15 or 16. Comprehensive school is, however, also a matter of pedagogical philosophy and practice. It accentuates that school is for each child and the school has to adjust for each child’s needs. The pedagogy is built up to fit heterogeneous student groups. Teachers cannot exclude anybody or send him or her to another school. In the comprehensive pedagogy, students’ own interests and choices are taken into consideration in the selection of contents, books, learning strategies, and methods, as well as assess-ment devices. In the heterogeneous student groups, the class size has to be rather small, of course. PISA shows that in Finland, the class size is one of the smallest. Flexible, school-based, and teacher-planned curriculum, student-centred instruc-tion, counselling, and remedial teaching, are widely used. Finally, in relation to the comprehensive schools, there is an extensive system of special support in education which is successful in capturing students with learn-ing problems at an early stage. Every year about 20% of the student population is in contact with the special support system on a part-time basis. This compares to for instance about 4% in Germany. The Status of Teachers In order to succeed in a heterogeneous group, a teacher has to be well educated and a real pedagogical expert, which Finnish teachers are. All teachers have a master’s degree either in educational science or in a subject area. They are paid relatively well compared to the most other OECD countries. The teacher’s - especially the class teacher’s - profession is valued and popular in Finland. In Finnish culture, the profession of teacher has been seen as one of the most important professions of society, and a lot of resources have consequently been invested in teacher-training. Teachers have also been trusted to do their best as true professionals. Accordingly Finnish teachers have been entrusted with con-siderable pedagogical independence in the classroom, and schools have like-wise enjoyed substantial autonomy in organising their work within the flexible limits of the national core curriculum. While teachers are considered educational experts, they are also relied on when it comes to student assessment, which is usually based on students’ class work, projects, teacher-made exams, and portfolios. Students in the comprehensive school do not have to take any national test or examination at the end of or dur-ing the school years. Even though there are national standards for grading stu-dents, these standards are not strict; students' effort and activity are always taken into consideration. The outcomes of the whole nine-year comprehensive

______________________________________________
Annexes 200
school are monitored by sample-based surveys in core subjects (math, science, mother tongue, and foreign languages). Finnish teachers set high expectations on students’ literacy skills and interests. A Nordic observation study conducted by Danish researchers after the IEA study in 1993 revealed that Finnish and Swedish teachers’ expectations were much higher than those of other countries. And the countries with highest ex-pectations also performed best in international tests. Right to Special Education for All Special education has likewise played an important role in Finland in catering for students who have problems following regular teaching. But in Finnish schools, special education is not only for students with serious problems in their studies: every student is entitled to ask for special help in a school. Special education is usually closely integrated into normal teaching and is highly inclusive by nature. Only about two per cent of students attend separate special education institutions. A student with problems in a certain subject or subjects typically has the opportu-nity of studying once or twice a week in a small group of 2-5 students, or even individually, with a special teacher. Sometimes also a subject teacher is present on these occasions. On the primary level (grades 1 to 6) where class teachers have the main responsibility for instruction, priority is given to reading and writing skills along with mathematics. On the lower secondary level, foreign languages also cause difficulties for a number of students. A student’s right to special educa-tion is written in the school laws. All schools also have a broadly based system of counselling that underpins the development of the pupil and provides guidance in studying, career planning, and choice of further studies. The task of counselling is to ensure that every young person leaving school is aware of what choices of further education are open to him or her and what working in the adult world entails, and has a clear plan for his or her own future. School Autonomy and Flexibility in Curriculum Until the 90s, the Finnish national core curriculum was strict and detailed and textbooks were meticulously controlled, the goal being (adequate) educational consistency across schools and classrooms. The structure, organization, contents, and resources of the comprehensive school were minutely detailed in the curricu-lum. A profound change in curricular philosophy and practice took place in the early 90s. The national curriculum underwent reorganization, whereby it became more flexible, decentralized, and less detailed. At the same time, questions about the accountability of schools and about the need for national testing programmes and national standards for student grading gained momentum in Finland. Today, Finland has national guidelines for grading students’ achievement as “good”, but they allow students' effort and activity to be taken into consideration as well. The learning outcomes of nine-year comprehensive schools are monitored by sample-based surveys. Yet these, too, are published on the system level alone,

______________________________________________
Annexes 201
while the results of individual schools are delivered only to the schools in ques-tion. Finnish schools still have a high degree of autonomy in pedagogical and cur-ricular practices. This is also confirmed by the findings of PISA 2000, which reveal that Finnish teachers are vested with a considerable degree of decision-making authority as concerns school policy and management. Finnish teachers, as an example, have almost exclusive responsibility for the choice of textbooks. They also have more to say than their colleagues in the OCED countries, on average, in determining course content, establishing student assessment policies, deciding which courses the school should offer, and allocating budgets within the school. Governing bodies of schools and local educational authorities, in contrast, have less decision-making power in Finland than in the other OECD countries. The results of PISA further show that countries with greater degrees of school auton-omy, including Finland, attained higher average levels of student performance than did those with lower levels of school autonomy. A high degree of school and teacher autonomy in decision-making may thus be assumed to have been one de-cisive factor contributing to Finland’s high performance in PISA. Cultural Homogeneity In the long-term perspective, the development of the Finnish comprehensive school has been underpinned by an exceptionally broad cultural and political con-sensus about the main lines of national education policy. In Finnish culture, seri-ous political conflicts and sudden changes in educational thinking have been rela-tively rare. Throughout the 20th century, educational services were developed evenly and in accordance with the needs of different population groups and re-gions. Today – largely thanks to high quality teacher training – first class educa-tion is thus provided at every school. This, again, is reflected in Finland’s below-average variation in educational outcomes both at the individual and system level. As a culturally homogeneous country, Finland has further been exemplary in taking care of its minorities. In Finland there are two official languages, Finnish (94 per cent of the inhabitants) and Swedish (6 per cent). Both of these language groups are equally entitled to and have equal resources for education in their own language from the primary level up to the university level. Other minorities, however, are still relatively small in Finland. In the PISA 2000 data, for example, non-native students in Finland accounted for a mere 1 per cent (the OECD average being 4,7 per cent), and those not speaking the language of assessment for 1,3 per cent (compared to the OECD average of 5,5 per cent). Owing to the cultural homogeneity of a small nation, it has been comparatively easy in Finland to reach mutual understanding on national education policy and the means for developing the educational system. Even the comprehensive school reform in the 1970s was introduced without huge political contradictions. There was, in fact, a broad national consensus in the 1960s and 1970s that the tracking system should be replaced by a more equitable comprehensive system.

______________________________________________
Annexes 202
Education has always played an important part in Finnish national programmes aiming at cultural development. In a small and remote country with a strange lan-guage, the provision of education for all has been considered a necessary means for keeping the nation’s culture alive. A small country cannot afford to exclude anyone from high-quality education. Sources: Freymann 2001; Koivula 2005; Linnakylä & Välijärvi 2003; OECD 2004b.
______________________________________________
Annexes 203
Annex 3: Development and Policy Reform: Latvia and Po-land Measured in terms of the development in average achievement scores from 2000 to 2003, two countries stand out: Latvia and Poland. In both countries, there has been a notable increase in the achievement scores of 15-year old pupils, both as regards reading competences and skills and knowledge in science and mathemat-ics. How can this development be understood?
Does Policy Reform Work? The Case of Latvia While it is not possible to establish firm causal relationships, it is certainly true that education in Latvia has undergone important changes during the past years, that have seemingly had consequences for PISA and TIMSS achievement scores, suggesting that yes: policy reform can work: A new Education Law was passed on October 29, 1998 and ratified on June 1, 1999. Also in 1998, the strategic educational program "Education 1998 – 2003" was formulated. Several other relevant reforms have been initiated. • The strategic programme provided the first significant evaluation of the re-
forms that had been implemented since independence in 1991 and defined future goals in all areas and levels of education in Latvia. The most notewor-thy are the following: - The de-politicization of education; - The guarantee of choice in education; - The abolishment of the national educational monopoly; - The decentralization of the board of education; - The development of new curricula and educational materials for a de-
mocratic society in a market economy; - Instruction of certain subjects in Latvian at minority language facilities; - The development of a system of certification for school directors; - The development and implementation of a centralized system of national
examinations; development of an objective and international system of rating the quality of education in Latvia.
• The Education Law of 1998 reflected many of the objectives in the strategic programme. Among other elements, it included the following key compo-nents: - Transition to a program-of-study approach in general education; - Mandatory school attendance until the completion of the basic program
or until the student turns 18; - Establishment of equivalency programs and classes for students over 18
who have not completed the basic program of study; - Financial reforms in education based on enrolment.
• The National Standard of Basic Education was developed and approved in 1998. A unified set of requirements was developed and approved in order to guarantee a basic educational program of high quality. The National Basic
______________________________________________
Annexes 204
Education Standard determines the compulsory content / curriculum, and the content of the final national examinations of the basic education.
• The Special Education Concept was developed in 1998. The main goal of this program was the gradual integration of special-needs children into gen-eral education schools.
• Latvia was awarded a USD 40 million World Bank loan in 1999 for educa-tional development, focusing on school infrastructure and education quality improvement.
Education Reform in Poland In a similar way it is likely that the considerable development in Poland’s’ aver-age achievement scores reflect profound changes in the Polish education system during the past years. Thus, Polish education has been undergoing major restruc-turing ever since the early 1990s. To address the needs of the reformed econ-omy, changes have been made to the curriculum, and new training requirements have been introduced for some professions and also for workers and technicians. In addition, steps have been taken to reorganize vocational training along the lines of academic education and to make the country's system of higher educa-tion more compatible with other European systems. Primary and secondary education systems have also undergone extensive re-forms during the 1990s. Responsibility for primary and secondary schools was gradually taken over by local government. The reform of primary and secondary education adopted in September 1999 was primarily aimed at raising the overall attainment level. Poland here opted for a secondary education system that puts greater emphasis on general technical and higher education with a view to increasing school-leavers' mobility in the labour market. The education reform included a number of mutually reinforcing elements. The most conspicuous is a change in structure from eight years of primary school to six years of primary school and three years of gymnasium, with a corresponding reduction in secondary school from four to three years. A second structural change is the transformation of the vast majority of professional schools, voca-tional schools, and lyceums, into new lyceums with a professional profile (Pro-filed Lyceums). The creation of the new tier of three year, lower secondary schools (the gymna-siums) is designed to prepare more children for lyceum type schooling later on, encouraging more children to stay in school longer, and placing greater empha-sis on general education as compared with vocational education. Separating older children from younger ones is also motivated by "stages of child develop-ment" considerations. The education reform includes a new syllabus and curriculum, new teaching methods, improved assessment and evaluation, and teacher development. In January 1999, an amendment to the teachers' charter was adopted, introducing a

______________________________________________
Annexes 205
new career system in which promotion depends on obtaining higher qualifica-tions. The aim of the charter was to solve the significant problem of unequal salaries among teaching staff in order to attract competent, dedicated teachers. Most accounts consider these "intangible" aspects of education reform to be more important than the change in structure. At transition from Communist rule in 1989, 45 per cent of the secondary school students were studying at three-year basic vocational schools leading to worker qualifications, with the other 55 per cent were at general or vocational secondary schools that gave access to higher education through competitive examinations. By 1999, the number of students enrolling in the shorter vocational courses had dropped to 30 percent, marking a shift of emphasis from the provision of pro-duction workers to graduating better-qualified students able to proceed to higher education. Sources: Mazura 1999; MEN 1999; Hoopengardner 1999; Levitas and Herczynski, 2001.
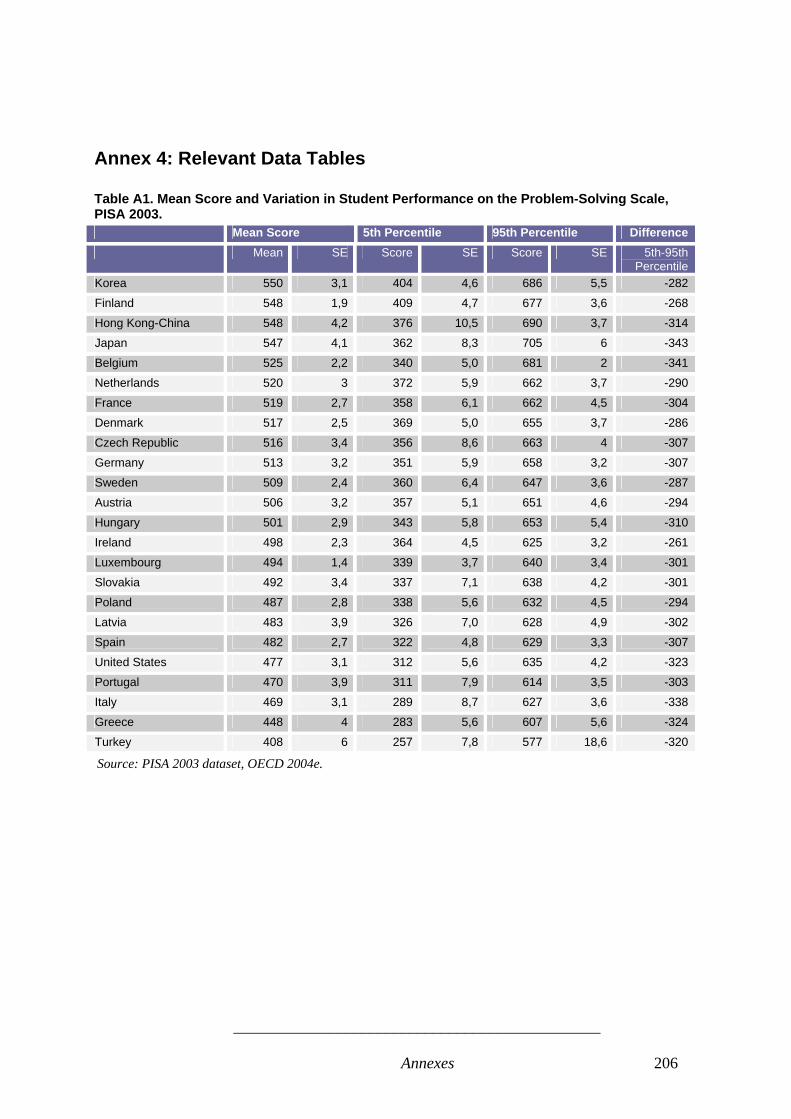
______________________________________________
Annexes 206
Annex 4: Relevant Data Tables
Table A1. Mean Score and Variation in Student Performance on the Problem-Solving Scale, PISA 2003. Mean Score 5th Percentile 95th Percentile Difference Mean SE Score SE Score SE 5th-95th
Percentile Korea 550 3,1 404 4,6 686 5,5 -282
Finland 548 1,9 409 4,7 677 3,6 -268
Hong Kong-China 548 4,2 376 10,5 690 3,7 -314
Japan 547 4,1 362 8,3 705 6 -343
Belgium 525 2,2 340 5,0 681 2 -341
Netherlands 520 3 372 5,9 662 3,7 -290
France 519 2,7 358 6,1 662 4,5 -304
Denmark 517 2,5 369 5,0 655 3,7 -286
Czech Republic 516 3,4 356 8,6 663 4 -307
Germany 513 3,2 351 5,9 658 3,2 -307
Sweden 509 2,4 360 6,4 647 3,6 -287
Austria 506 3,2 357 5,1 651 4,6 -294
Hungary 501 2,9 343 5,8 653 5,4 -310
Ireland 498 2,3 364 4,5 625 3,2 -261
Luxembourg 494 1,4 339 3,7 640 3,4 -301
Slovakia 492 3,4 337 7,1 638 4,2 -301
Poland 487 2,8 338 5,6 632 4,5 -294
Latvia 483 3,9 326 7,0 628 4,9 -302
Spain 482 2,7 322 4,8 629 3,3 -307
United States 477 3,1 312 5,6 635 4,2 -323
Portugal 470 3,9 311 7,9 614 3,5 -303
Italy 469 3,1 289 8,7 627 3,6 -338
Greece 448 4 283 5,6 607 5,6 -324
Turkey 408 6 257 7,8 577 18,6 -320
Source: PISA 2003 dataset, OECD 2004e.
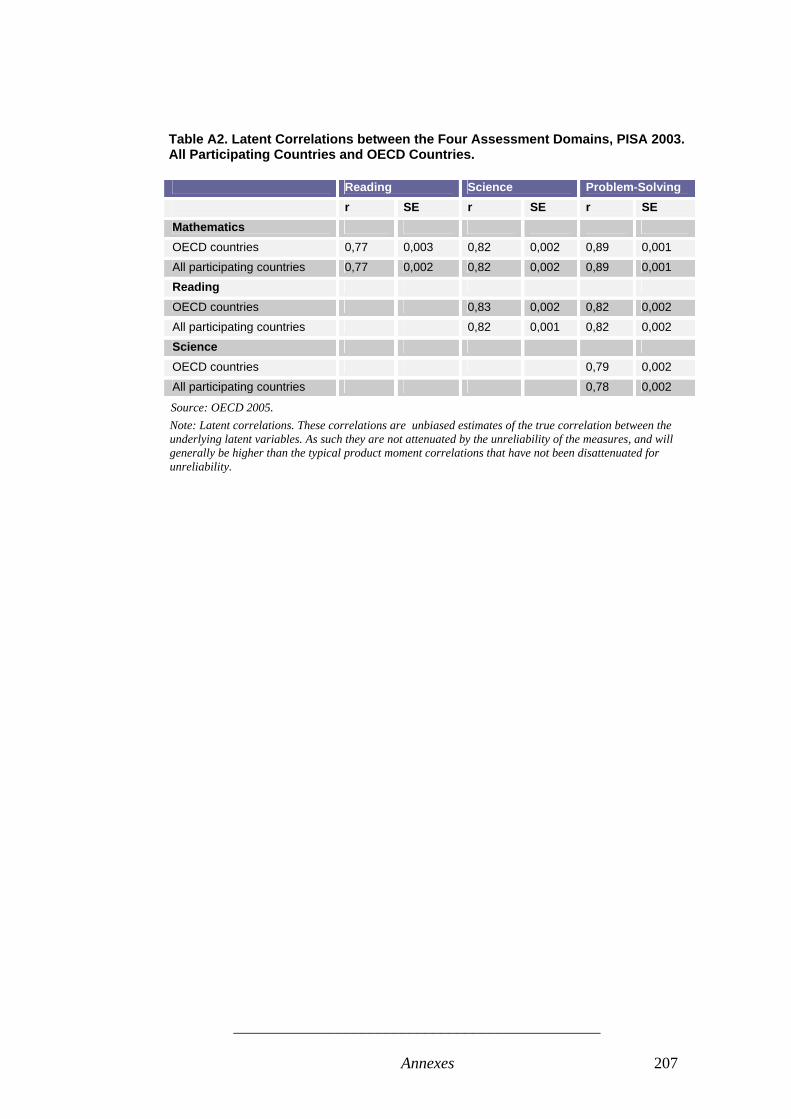
______________________________________________
Annexes 207
Table A2. Latent Correlations between the Four Assessment Domains, PISA 2003. All Participating Countries and OECD Countries.
Reading Science Problem-Solving r SE r SE r SE Mathematics
OECD countries 0,77 0,003 0,82 0,002 0,89 0,001
All participating countries 0,77 0,002 0,82 0,002 0,89 0,001 Reading
OECD countries 0,83 0,002 0,82 0,002
All participating countries 0,82 0,001 0,82 0,002 Science
OECD countries 0,79 0,002
All participating countries 0,78 0,002
Source: OECD 2005. Note: Latent correlations. These correlations are unbiased estimates of the true correlation between the underlying latent variables. As such they are not attenuated by the unreliability of the measures, and will generally be higher than the typical product moment correlations that have not been disattenuated for unreliability.

______________________________________________
Annexes 208
Table A3. Mean Achievement Scores at Regional Level, PISA 2003 Mathematics Scale
Mean Score
95% confidence interval
Adjudicated regions
Italy (Provincia Autonoma di Trento) 547 5,9
Italy (Provincia Autonoma di Bolzano) 536 9,4
United Kingdom (Scotland) 524 4,5
Italy (Regione Lombardia) 519 14,3
Italy (Regione Veneto) 511 10,8
Spain (Castile and Leon) 503 7,8
Spain (Basque Country) 502 5,5
Italy (Regione Piemonte) 494 9,6
Spain (Catalonia) 494 9,2
Italy (Regione Toscana) 492 8,4 Non-adjudicated regions
Belgium (Flemish Community) 553 4,1
Finland (Finnish speaking) 545 3,9
Finland (Swedish speaking) 534 4,5
Belgium (German-speaking Community) 515 5,9
United Kingdom (Northern Ireland) 515 5,5
Belgium (French Community) 498 8,4
United Kingdom (Wales) 498 21,2
Source: PISA 2003 dataset.
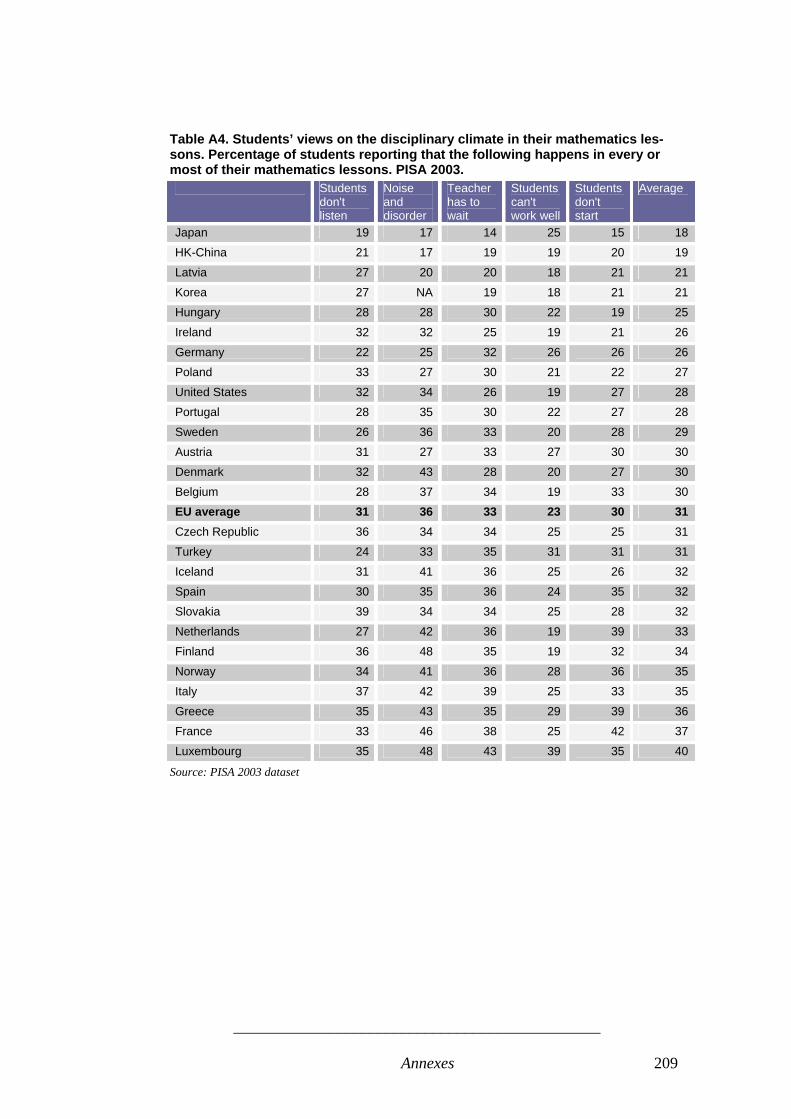
______________________________________________
Annexes 209
Table A4. Students’ views on the disciplinary climate in their mathematics les-sons. Percentage of students reporting that the following happens in every or most of their mathematics lessons. PISA 2003. Students
don't listen
Noise and disorder
Teacher has to wait
Students can't work well
Students don't start
Average
Japan 19 17 14 25 15 18
HK-China 21 17 19 19 20 19
Latvia 27 20 20 18 21 21
Korea 27 NA 19 18 21 21
Hungary 28 28 30 22 19 25
Ireland 32 32 25 19 21 26
Germany 22 25 32 26 26 26
Poland 33 27 30 21 22 27
United States 32 34 26 19 27 28
Portugal 28 35 30 22 27 28
Sweden 26 36 33 20 28 29
Austria 31 27 33 27 30 30
Denmark 32 43 28 20 27 30
Belgium 28 37 34 19 33 30 EU average 31 36 33 23 30 31 Czech Republic 36 34 34 25 25 31
Turkey 24 33 35 31 31 31
Iceland 31 41 36 25 26 32
Spain 30 35 36 24 35 32
Slovakia 39 34 34 25 28 32
Netherlands 27 42 36 19 39 33
Finland 36 48 35 19 32 34
Norway 34 41 36 28 36 35
Italy 37 42 39 25 33 35
Greece 35 43 35 29 39 36
France 33 46 38 25 42 37
Luxembourg 35 48 43 39 35 40
Source: PISA 2003 dataset

______________________________________________
Annexes 210
Table A5. Index of Student-Related Factors Affecting School Climate and Per-formance on the PISA 2003 Mathematics Scale. Based on Student Self-Reports of Occurrence of Disciplinary Problems in Mathematics Lessons. Change in mathematics performance per unit of the index of student-related factors affect-ing school climate Score
point dif-ference
SE
Japan 33 2,9
Turkey 30 4,4
United States 26 1,4
Portugal 24 2,1
Belgium 24 1,6
Hong Kong-China 23 2,3
Hungary 20 2,3
Austria 19 2,0
Germany 19 1,7
Spain 17 1,7
Czech Republic 17 2,1
EU average 16 0,4
Ireland 16 1,6
Sweden 15 2,1
Latvia 15 2,3
Korea 15 2,2
Greece 14 3,0
Luxembourg 14 1,4
Slovakia 14 1,6
Poland 14 2,0
Iceland 13 1,7
Italy 13 1,8
Netherlands 12 2,4
France 12 1,8
Norway 12 1,9
Denmark 10 2,1
Finland 10 1,5
Source: PISA 2003 dataset. Differences in bold are statistically significant.

______________________________________________
Annexes 211
Table A6. Preschool Attendance and School Performance (PISA Reading Scale). Difference in mean achievement score between stu-dents who attended preschool for more than one year and students who did not attend preschool
Score Point Difference in
Reading
SE
France 101 15
Belgium 96 11
Germany 84 9
Turkey 72 13
Hong Kong 62 7
United Kingdom 58 7
Hungary 54 18
Austria 53 9
Netherlands 49 12
Denmark 45 12
Greece 44 9
Poland 44 10
Sweden 43 7
Norway 40 7
Japan 39 15
Spain 30 7
Luxembourg 30 5
United States 26 13 European Average 25 2
Slovakia 24 6
Italy 24 9
Ireland 21 6
Czech Republic 15 7
Finland 13 5
Korea 10 6
Portugal 5 5
Iceland -5 8
Latvia -6 5
Source: PISA 2003 dataset. Differences in bold are statistically significant.

______________________________________________
Annexes 212
Table A7. Instructional Weeks Per Year for 15-Year-Olds Mean SE Czech Republic 41,0 0,2 Germany 39,7 0,2 Denmark 39,6 0,1 Slovakia 39,2 0,3 Japan 38,9 0,3 Poland 38,3 0,2 Finland 38,1 0,0 Netherlands 38,1 0,2 Norway 38,0 0,0 Austria 36,7 0,8 Iceland 36,7 0,0 OECD average 36,7 0,0 Hungary 36,6 0,1 Sweden 36,6 0,1 Belgium 36,2 0,2 OECD total 36,1 0,1 Luxembourg 36,0 0,0 United States 36,0 0,0 Turkey 35,7 0,3 Korea 35,6 0,3 Portugal 35,4 0,2 Spain 35,4 0,2 HK China 35,4 0,4 Latvia 34,9 0,1 Greece 34,3 0,2 Italy 33,5 0,2 Ireland 33,1 0,2
Source: PISA 2003 dataset, school principals’ reports.

______________________________________________
Annexes 213
Table A8. Reading Score Achievement and Frequency of Reading Homework Assign-ment, PIRLS 2001. 3 or More Times a Week Less than Once a Week
Percent of Students
Average Achieve-ment
Percent of Students
Average Achieve-ment
Score Difference
Greece 87 531 5 468 63
Slovakia 87 521 5 511 10
Cyprus 85 501 6 462 39
Lithuania 85 546 6 525 21
Romania 80 517 7 495 22
Iceland 79 514 8 508 6
Turkey 78 452 6 423 29
Hungary 76 543 8 546 -3
Latvia 76 547 7 534 13
Bulgaria 71 556 9 556 0
Norway 70 501 6 466 35
Italy 60 542 12 539 3
International Avg. 60 500 14 496 4
Slovenia 49 492 23 511 -19
France 44 522 23 525 -3
United States 44 540 19 547 -7
Sweden 38 557 16 558 -1
England 36 558 22 553 5
Singapore 36 513 22 538 -25
Scotland 34 509 13 518 -9
Czech Republic 33 537 29 536 1
Hong Kong 31 525 32 529 -4
Germany 30 529 37 545 -16
Netherlands 19 545 30 558 -13
Source: PIRLS 2001 data set.

______________________________________________
Annexes 214
Table A9. Index of the quality of the school's physical infrastructure, PISA 2003. Based on School Principals’ Reports and reported proportionate to the number of 15-year-olds enrolled in the school. Average index value SETurkey -1,11 0,10
Norway -0,50 0,06
Greece -0,42 0,14
Slovakia -0,31 0,05
Ireland -0,28 0,10
Finland -0,24 0,08
Hungary -0,18 0,08
Denmark -0,17 0,07
Luxembourg -0,15 0,00
Japan -0,09 0,10
Italy -0,03 0,07
Hong Kong-China -0,01 0,07
Sweden 0,03 0,06
Portugal 0,03 0,07 EU average 0,04 0,03 Latvia 0,06 0,07
Belgium 0,08 0,06
Spain 0,13 0,07
Austria 0,13 0,10
Germany 0,14 0,08
Netherlands 0,28 0,09
United States 0,29 0,06
Poland 0,29 0,07
Iceland 0,33 0,00
Korea 0,57 0,06
Czech Republic 0,57 0,05
Source: PISA 2003 dataset Note: The index has an average of 0 and a standard deviation of 1 across OECD countries. Positive values indicate above average assessment of the quality of schools’ physical infrastructure (school buildings and grounds; heating, cooling and lighting systems; instructional space).
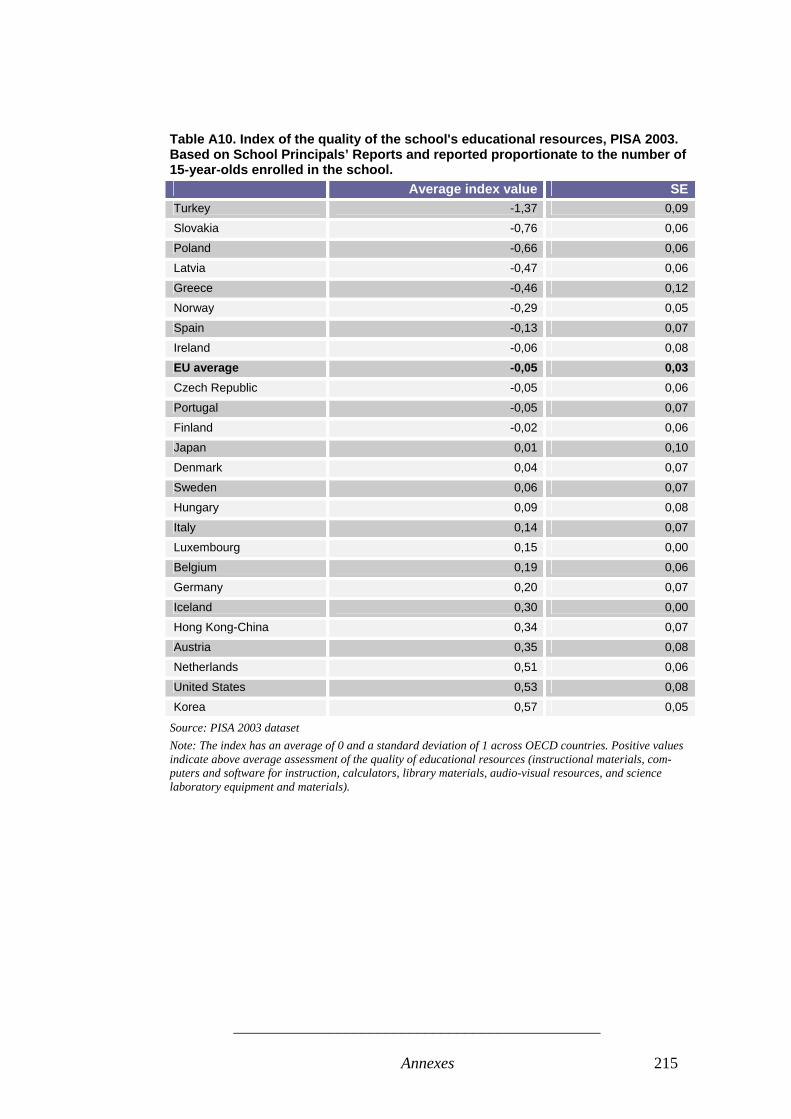
______________________________________________
Annexes 215
Table A10. Index of the quality of the school's educational resources, PISA 2003. Based on School Principals’ Reports and reported proportionate to the number of 15-year-olds enrolled in the school. Average index value SETurkey -1,37 0,09
Slovakia -0,76 0,06
Poland -0,66 0,06
Latvia -0,47 0,06
Greece -0,46 0,12
Norway -0,29 0,05
Spain -0,13 0,07
Ireland -0,06 0,08 EU average -0,05 0,03 Czech Republic -0,05 0,06
Portugal -0,05 0,07
Finland -0,02 0,06
Japan 0,01 0,10
Denmark 0,04 0,07
Sweden 0,06 0,07
Hungary 0,09 0,08
Italy 0,14 0,07
Luxembourg 0,15 0,00
Belgium 0,19 0,06
Germany 0,20 0,07
Iceland 0,30 0,00
Hong Kong-China 0,34 0,07
Austria 0,35 0,08
Netherlands 0,51 0,06
United States 0,53 0,08
Korea 0,57 0,05
Source: PISA 2003 dataset Note: The index has an average of 0 and a standard deviation of 1 across OECD countries. Positive values indicate above average assessment of the quality of educational resources (instructional materials, com-puters and software for instruction, calculators, library materials, audio-visual resources, and science laboratory equipment and materials).
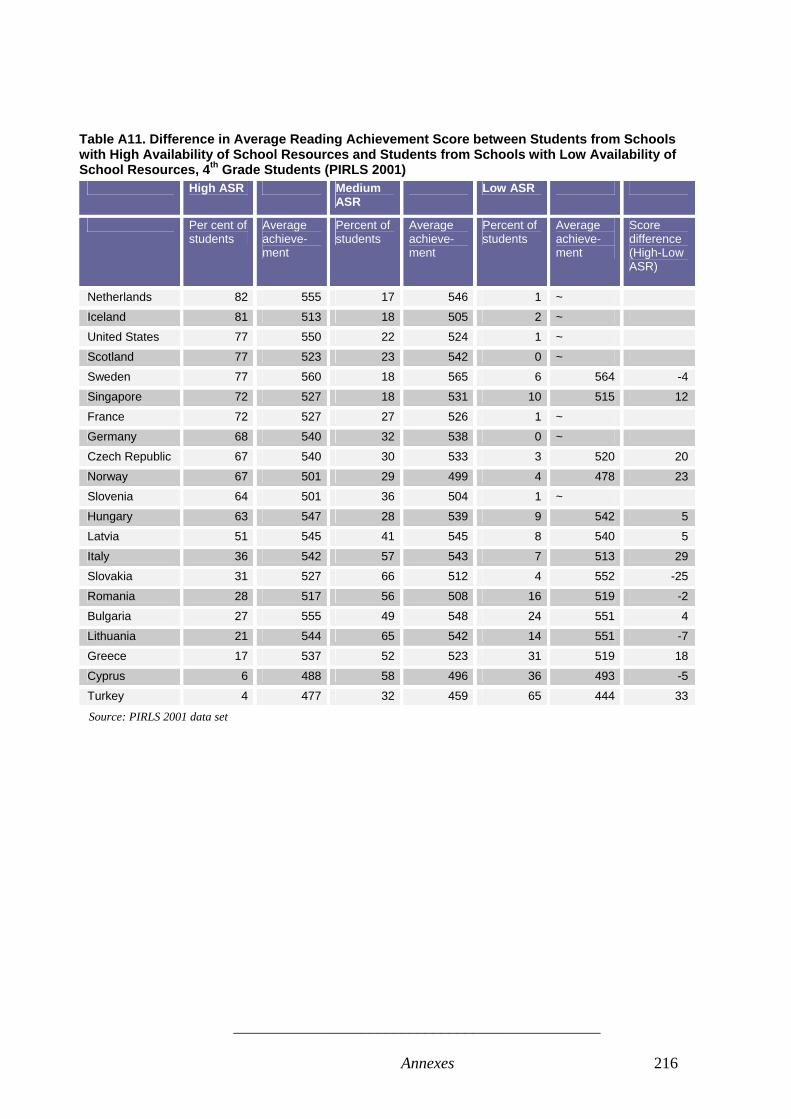
______________________________________________
Annexes 216
Table A11. Difference in Average Reading Achievement Score between Students from Schools with High Availability of School Resources and Students from Schools with Low Availability of School Resources, 4th Grade Students (PIRLS 2001)
High ASR Medium ASR
Low ASR
Per cent of students
Average achieve-ment
Percent of students
Average achieve-ment
Percent of students
Average achieve-ment
Score difference (High-Low ASR)
Netherlands 82 555 17 546 1 ~
Iceland 81 513 18 505 2 ~
United States 77 550 22 524 1 ~
Scotland 77 523 23 542 0 ~
Sweden 77 560 18 565 6 564 -4
Singapore 72 527 18 531 10 515 12
France 72 527 27 526 1 ~
Germany 68 540 32 538 0 ~
Czech Republic 67 540 30 533 3 520 20
Norway 67 501 29 499 4 478 23
Slovenia 64 501 36 504 1 ~
Hungary 63 547 28 539 9 542 5
Latvia 51 545 41 545 8 540 5
Italy 36 542 57 543 7 513 29
Slovakia 31 527 66 512 4 552 -25
Romania 28 517 56 508 16 519 -2
Bulgaria 27 555 49 548 24 551 4
Lithuania 21 544 65 542 14 551 -7
Greece 17 537 52 523 31 519 18
Cyprus 6 488 58 496 36 493 -5
Turkey 4 477 32 459 65 444 33
Source: PIRLS 2001 data set
Related Documents