Explaining reduction of pedestrian motor vehicle crashes in Arkhangelsk, Russia, in 20052010 Alexander V. Kudryavtsev 1,2 *, Odd Nilssen 1 , Johan Lund 3 , Andrej M. Grjibovski 1,2,4 and Børge Ytterstad 1 1 Department of Community Medicine, University of Tromsø, Tromsø, Norway; 2 International School of Public Health, Northern State Medical University, Arkhangelsk, Russia; 3 Institute of Health and Society, University of Oslo, Oslo, Norway; 4 Department of International Public Health, Norwegian Institute of Public Health Oslo, Norway Objective. To explain a reduction in pedestrianmotor vehicle crashes in Arkhangelsk, Russia, in 20052010. Study design. Retrospective ecological study. Methods. For 20052010, police data on pedestrianmotor vehicle crashes, traffic violations, and total motor vehicles (MVs) were combined with data on changes in national road traffic legislation and municipal road infrastructure. Negative binomial regression was used to investigate trends in monthly rates of pedestrian motor vehicle crashes per total MVs and estimate changes in these rates per unit changes in the safety measures. Results. During the 6 years, the police registered 2,565 pedestrianmotor vehicle crashes: 1,597 (62%) outside crosswalks, 766 (30%) on non-signalized crosswalks, and 202 (8%) on signalized crosswalks. Crash rates outside crosswalks and on signalized crosswalks decreased on average by 1.1% per month, whereas the crash rate on non-signalized crosswalks remained unchanged. Numbers of signalized and non-signalized crosswalks increased by 14 and 19%, respectively. Also, 10% of non-signalized crosswalks were combined with speed humps, and 4% with light-reflecting vertical signs. Pedestrian penalties for traffic violations increased 4-fold. Driver penalties for ignoring prohibiting signal and failure to give way to pedestrian on non-signalized crosswalk increased 7- and 8-fold, respectively. The rate of total registered drivers’traffic violations per total MVs decreased on average by 0.3% per month. All studied infrastructure and legislative measures had inverse associationswith the rate of crashes outside crosswalks. The rate of crashes on signalized crosswalks showed inverse associations with related monetary penalties. Conclusions. The introduction of infrastructure and legislative measures is the most probable explanation of the reduction of pedestrianmotor vehicle crashes in Arkhangelsk. The overall reduction is due to decreases in rates of crashes outside crosswalks and on signalized crosswalks. No change was observed in the rate of crashes on non-signalized crosswalks. Keywords: pedestrian; crash; infrastructure measures; legislative measures; law enforcement; Russia Received: 10 July 2012; Revised: 29 August 2012; Accepted: 3 September 2012; Published: 24 September 2012 G lobally, road traffic crashes cause over 1.2 million deaths and up to 50 million non-fatal injuries per year (1). Over 400,000 global traffic fatalities are pedestrians, about 95% cases occurring in low- and middle-income countries (2). The Russian Federation ranks second highest on the road traffic mortality (25.2 per 100,000 population) in the WHO European region (1). The 20092011 annual numbers of traffic deaths and non-fatal injuries exceeded 26,000 and 250,000, respectively (3,4). Every third traffic crash in Russia involves a pedestrian (4). The global tendency is that pedestrians are at most risk in urban settings with high pedestrian and vehicle activity (5). International publications show effectiveness of several pedestrian safety measures: infrastructure solutions, enhancement of road traffic legislation, law enforcement, education, media campaigns, and their combinations (617). Many of these measures were introduced in Russia during the last decade by implementation of the nationwide Road Safety Improvement Federal Target æ ORIGINAL RESEARCH ARTICLE Int J Circumpolar Health 2012. # 2012 Alexander V. Kudryavtsev et al. This is an Open Access article distributed under the terms of the Creative Commons Attribution-Noncommercial 3.0 Unported License (http://creativecommons.org/licenses/by-nc/3.0/), permitting all non-commercial use, distribution, and reproduction in any medium, provided the original work is properly cited. 1 Citation: Int J Circumpolar Health 2012, 71: 19107 - http://dx.doi.org/10.3402/ijch.v71i0.19107 (page number not for citation purpose)

Welcome message from author
This document is posted to help you gain knowledge. Please leave a comment to let me know what you think about it! Share it to your friends and learn new things together.
Transcript
Explaining reduction of pedestrian�motor vehicle crashes in Arkhangelsk,Russia, in 2005�2010
Alexander V. Kudryavtsev1,2*, Odd Nilssen1, Johan Lund3,Andrej M. Grjibovski1,2,4 and Børge Ytterstad1
1Department of Community Medicine, University of Tromsø, Tromsø, Norway; 2International School of PublicHealth, Northern State Medical University, Arkhangelsk, Russia; 3Institute of Health and Society, Universityof Oslo, Oslo, Norway; 4Department of International Public Health, Norwegian Institute of Public HealthOslo, Norway
Objective. To explain a reduction in pedestrian�motor vehicle crashes in Arkhangelsk, Russia, in 2005�2010.
Study design. Retrospective ecological study.
Methods. For 2005�2010, police data on pedestrian�motor vehicle crashes, traffic violations, and total motor
vehicles (MVs) were combined with data on changes in national road traffic legislation and municipal road
infrastructure. Negative binomial regression was used to investigate trends in monthly rates of pedestrian�motor vehicle crashes per total MVs and estimate changes in these rates per unit changes in the safety
measures.
Results. During the 6 years, the police registered 2,565 pedestrian�motor vehicle crashes: 1,597 (62%) outside
crosswalks, 766 (30%) on non-signalized crosswalks, and 202 (8%) on signalized crosswalks. Crash rates
outside crosswalks and on signalized crosswalks decreased on average by 1.1% per month, whereas the crash
rate on non-signalized crosswalks remained unchanged. Numbers of signalized and non-signalized crosswalks
increased by 14 and 19%, respectively. Also, 10% of non-signalized crosswalks were combined with speed
humps, and 4% with light-reflecting vertical signs. Pedestrian penalties for traffic violations increased 4-fold.
Driver penalties for ignoring prohibiting signal and failure to give way to pedestrian on non-signalized
crosswalk increased 7- and 8-fold, respectively. The rate of total registered drivers’ traffic violations per total
MVs decreased on average by 0.3% per month. All studied infrastructure and legislative measures had inverse
associations with the rate of crashes outside crosswalks. The rate of crashes on signalized crosswalks showed
inverse associations with related monetary penalties.
Conclusions. The introduction of infrastructure and legislative measures is the most probable explanation of
the reduction of pedestrian�motor vehicle crashes in Arkhangelsk. The overall reduction is due to decreases
in rates of crashes outside crosswalks and on signalized crosswalks. No change was observed in the rate of
crashes on non-signalized crosswalks.
Keywords: pedestrian; crash; infrastructure measures; legislative measures; law enforcement; Russia
Received: 10 July 2012; Revised: 29 August 2012; Accepted: 3 September 2012; Published: 24 September 2012
Globally, road traffic crashes cause over 1.2
million deaths and up to 50 million non-fatal
injuries per year (1). Over 400,000 global traffic
fatalities are pedestrians, about 95% cases occurring in
low- and middle-income countries (2). The Russian
Federation ranks second highest on the road traffic
mortality (25.2 per 100,000 population) in the WHO
European region (1). The 2009�2011 annual numbers of
traffic deaths and non-fatal injuries exceeded 26,000 and
250,000, respectively (3,4). Every third traffic crash in
Russia involves a pedestrian (4). The global tendency
is that pedestrians are at most risk in urban settings with
high pedestrian and vehicle activity (5).
International publications show effectiveness of several
pedestrian safety measures: infrastructure solutions,
enhancement of road traffic legislation, law enforcement,
education, media campaigns, and their combinations
(6�17). Many of these measures were introduced in
Russia during the last decade by implementation of the
nationwide Road Safety Improvement Federal Target
�ORIGINAL RESEARCH ARTICLE
Int J Circumpolar Health 2012. # 2012 Alexander V. Kudryavtsev et al. This is an Open Access article distributed under the terms of the Creative CommonsAttribution-Noncommercial 3.0 Unported License (http://creativecommons.org/licenses/by-nc/3.0/), permitting all non-commercial use, distribution, andreproduction in any medium, provided the original work is properly cited.
1
Citation: Int J Circumpolar Health 2012, 71: 19107 - http://dx.doi.org/10.3402/ijch.v71i0.19107(page number not for citation purpose)

Program 2006�2012 (18,19). The main nationwide pedes-
trian safety measures were increases in penalties for
related traffic violations and traffic safety promotion
activities in mass media and schools (18). Locally,
pedestrian safety was addressed by infrastructure mea-
sures, for example, installation of traffic signals, speed
humps, and light-reflecting traffic signs.
A previous study in Arkhangelsk, Russia, has shown
that pedestrians constituted 54% of all traffic fatalities
and 45% of non-fatal injuries during 2005�2010 (20).
This study also identified reductions in pedestrian�motor
vehicle crash rates per total motor vehicles (MVs)
and total population during this period. The purpose of
the present article is to explain the reduction by
investigating its associations with national legislative
measures, local infrastructure changes, and law enforce-
ment measures.
Materials and methods
Study design and siteThis retrospective ecological study was performed in
Arkhangelsk � a Northwestern Russian city. The study
period covered 6 years, from 1 January 2005 to 31
December 2010. During the period, Arkhangelsk popula-
tion decreased by 0.6% (from 357,733 at baseline to
355,556 at end-point), whereas the total number of MVs
increased by 37.3% (from 59,961 to 82,311, respectively),
and the total length of the city road network remained
constant (512 km) (20).
Data sourcesData on pedestrian�motor vehicle crashes, called later
pedestrian crashes, were obtained from the Arkhangelsk
police database on fatal and non-fatal road traffic
crashes. Description and reliability estimates of this
source are presented elsewhere (20,21). The police also
provided data on traffic violations and total number
of MVs registered in the city. Data on infrastructure
measures were obtained from the Arkhangelsk municipal
department of road safety. Data on legislative measures
were taken from national legislative acts. Data on total
city population were obtained from the Ministry of
Health of the Arkhangelsk region.
Data descriptionData on all pedestrian crashes and traffic violations
registered by the police in Arkhangelsk in 2005�2010
were used. A pedestrian crash is defined by the police as
an event on a road where a vehicle (motorized or animal-
drawn) in motion collides with a pedestrian, resulting in
an injury. Events where a pedestrian is hit by a vehicle in
consequence of any other crash type, for example, vehicle
collision or rollover, are accounted by the police in
accordance with their origin and are not included in this
study. For each pedestrian crash, the data included date
(day, month, year), time (hour, minute), type of place
(signalized crosswalk at junction/span, non-signalized
crosswalk at junction/span, and junction/span with no
crosswalk), related traffic violations, and health outcome
for every involved pedestrian (fatal or non-fatal injury).
For each traffic violation, the available data included date
(day, month, and year), type of traffic violation (135
types), type of penalty (oral warning, monetary penalty,
withdrawal of driving license, and imprisonment), and
the amount of Russian rubles (RUB; 1 USD:30 RUB)
for a monetary penalty.
Data on infrastructure measures included information
on changes in characteristics and numbers of non-
signalized and signalized crosswalks in Arkhangelsk in
2005�2010. Notably, all the crosswalks in Arkhangelsk
are marked with vertical traffic signs. They are also
marked with stripes, but stripes are commonly obliterated
during November�March (winter months) and are re-
newed in June�August. Therefore, stripes are absent on
many crosswalks during winter and spring months. The
studied changes in characteristics of crosswalks included
installation of traffic signals, speed humps, and light-
reflecting vertical traffic signs (with fluorescent yellow�green outer frames) at non-signalized crosswalks. The new
traffic signals and speed humps were installed on the
‘‘black spotted’’ non-signalized crosswalks where there
had been 3 or more traffic crashes of any kind within a
year. Traffic signals were preferred to speed humps at
spots where improvements in the traffic regulations were
clearly required. Replacement of regular vertical signs
‘‘pedestrian crossing’’ by new light-reflecting signs began
from non-signalized crosswalks in the central part of
Arkhangelsk in 2010. For all described infrastructure
measures, addresses (street, closest building) and dates
(month, year) were obtained. Due to administrative
reasons (change of the responsible institution and loss
of data in 2008), the same data variables on establishment
of new non-signalized crosswalks and changes in their
total number were available only for 2009�2010. New
non-signalized crosswalks were established on pedestrian
crash ‘‘black spots,’’ at places where crosswalks were
requested by the public, as well as within the continuous
process of road renovation. Other introduced infrastruc-
ture measures (pedestrian barriers on sidewalks, refugee
islands) were not considered in the study because of small
numbers.
The legislative measures were nationwide increases in
monetary penalties for common pedestrian-crash-related
traffic violations: (a) driver failure to give way to pedes-
trian on non-signalized crosswalk; (b) ignoring prohibit-
ing traffic signal by driver or pedestrian; (c) crossing
outside crosswalk and walking on road by pedestrian. For
a penalty raise, date (day, month, year) and size (‘‘from�to’’) in RUB was obtained.
Alexander V. Kudryavtsev et al.
2(page number not for citation purpose)
Citation: Int J Circumpolar Health 2012, 71: 19107 - http://dx.doi.org/10.3402/ijch.v71i0.19107
The data on the total number of MVs and total
population in the city were available for 1 January of
every year, starting 2005 to 2011.
Data analysesFor investigation of time trends of monthly crash data and
their associations with safety measures, the total number
of pedestrian crashes was split into 3 categories: (a)
outside crosswalks; (b) on non-signalized crosswalks;
and (c) on signalized crosswalks. For the first category,
the pedestrian primary fault was presumed, although the
police could also document a driver fault. For the second
category, the driver primary fault was always documented
by the police. The category of crashes on signalized
crosswalks was further split into crashes due to pedestrian
violations and crashes due to driver violations, according
to police documentation. To be used as denominators
in rate calculations, the mid-month estimates of total
MVs and total population in the city were calculated
from annual data with the assumption of linear monthly
changes in these variables within each year. Consequently,
crashes of each category were aggregated into
monthly counts, and monthly rates per 10,000 MVs were
estimated.
The data on registered traffic violations were split
into data on violations by drivers, pedestrians, and others.
The monthly numbers of driver violations were trans-
formed into monthly rates per 100 MVs, giving estimates
of monthly percentage of drivers caught by the police on
violations. Similarly, the monthly counts of pedestrian
violations were transformed into monthly rates per 100
population, giving estimates of monthly percentage of
total residents caught on violations as pedestrians. The
two resulting rates were used in the analyses as proxy
measures for intensity of police enforcement regarding
drivers and pedestrians.
The data on infrastructure measures were treated as
count variables. A value in each of these variables was
a total of specified infrastructure units in the city in the
corresponding month. The legislative measures were
analyzed as categorical ‘‘before�after’’ variables.
To allow for over-dispersion in the data, negative
binomial and zero-inflated negative binomial (ZINB)
regressions (22) with a time regressor variable were
applied to estimate trends and average percent changes
(APCs) in the monthly occurrence of pedestrian crashes,
with 95% confidence intervals (CI). Similar analyses were
performed to estimate APCs in monthly occurrences of
pedestrian crashes per unit changes in the safety measure
variables. A Vuong test was used to select between the
standard negative binomial and the ZINB model for each
particular situation. Robust standard errors were calcu-
lated for all estimates to adjust for heterogeneity in the
models. To account for changes in the traffic volume, the
logarithm of the mid-month total MVs was included in all
regression models as an offset variable. Therefore, the
APCs reflect changes in pedestrian crash rates per total
MVs. The seasonal variation was modeled using sine and
cosine functions with a periodicity of 12 months (23).
Multivariable analyses of the associations between safety
measures and crash occurrence were not applicable due to
multicollinearity. Therefore, all the presented associations
are unadjusted for each other (crude). All analyses were
performed using STATA v.12.0 (24).
Ethical considerationsThis study was approved on 23 March 2009 by the
Ethical Committee of the Northern State Medical Uni-
versity, Arkhangelsk, Russia. None of the data variables
in the study contained information allowing personal
identification.
ResultsIn total, the police registered 2,565 pedestrian crashes in
Arkhangelsk during 2005�2010. This resulted in 117
pedestrian fatalities and 2,556 non-fatal pedestrian in-
juries. In addition, 97 pedestrians were non-fatally injured
due to other types of crashes, which have not been
considered in this study.
Pedestrian crashes occurred most often in October�December (34%). Most crashes occurred on Fridays
(17%) while the least occurred on Sundays (11%). Within
a day, most crashes occurred between 3:00 pm and 6:00
pm (23%). Out of the total, 77 (3%) pedestrian crashes
involved drunk drivers or drivers who refused alcohol
testing, 222 (9%) involved drunk pedestrians, and 456
(18%) were ‘‘hit-and-run’’ cases.
Changes in pedestrian crash ratesThere were registered 1,597 (62% of the total) pedestrian
crashes outside crosswalks, 766 (30%) on non-signalized
crosswalks, and 202 (8%) on signalized crosswalks
(including 132 due to driver violations and 70 due to
pedestrian violations). During the study period, the rate
of pedestrian crashes outside crosswalks decreased on
average by 1.1% per month (95% CI, from �1.4 to �0.8;
pB0.001) (Fig. 1). The rate of pedestrian crashes on
signalized crosswalks decreased on average by 1.1% per
month (95% CI, from �1.8 to �0.4; p�0.002). The rate
of pedestrian crashes on non-signalized crosswalks
remained unchanged (APC��0.2, 95% CI, from �0.6
to 0.2; p�0.414).
Infrastructure changesAt baseline, the total number of signalized crosswalks in
Arkhangelsk was 237. Within the study period, traffic
signals were installed at 32 non-signalized crosswalks
(increase of 14%; Fig. 2). In 2009�2010, 50 new non-
signalized crosswalks were established while three of the
existing non-signalized crosswalks were equipped with
signals (increase of 19%). All the changes in numbers
Pedestrian�motor vehicle crashes in Northwestern Russia
Citation: Int J Circumpolar Health 2012, 71: 19107 - http://dx.doi.org/10.3402/ijch.v71i0.19107 3(page number not for citation purpose)

of crosswalks took place in periods from June to
September.
There were no speed humps in Arkhangelsk at the
baseline. During 2005�2010, 31 non-signalized crosswalks
were equipped with speed humps, and one of them further
changed into a signalized crosswalk, followed by removal
of the earlier installed humps. Therefore, 30 (10%) non-
signalized crosswalks in Arkhangelsk had speed humps at
the end of the observation period. Thirty installations of
speed humps occurred between May and September, and
one in January. Twenty-six of the installed speed humps
were monolith, seven of them de facto being elevated
crosswalks. The rest had prefabricated demountable
constructions.
Twelve non-signalized crosswalks were equipped with
new light-reflecting signs instead of old ones in 2010 (4%
of the total number). The replacements took place
between February and July.
Changes in road traffic legislationPedestrian penalties for traffic violations (ignoring pro-
hibiting traffic signal, crossing outside crosswalk, and
walking on the road) were hiked twice during the study
period: (a) from 50 to 100 RUB on 7 July 2007 and
(b) from 100 to 200 RUB on 23 May 2009. Driver penalty
for ignoring prohibiting traffic signal increased from
100 to 700 RUB on 1 January 2008, and driver penalty
for failure to give way to a pedestrian on non-signalized
crosswalk increased from 100 to 800�1,000 RUB on
23 May 2009. Similarly, the average monetary penalties
for these traffic violations increased in Arkhangelsk
(Fig. 3).
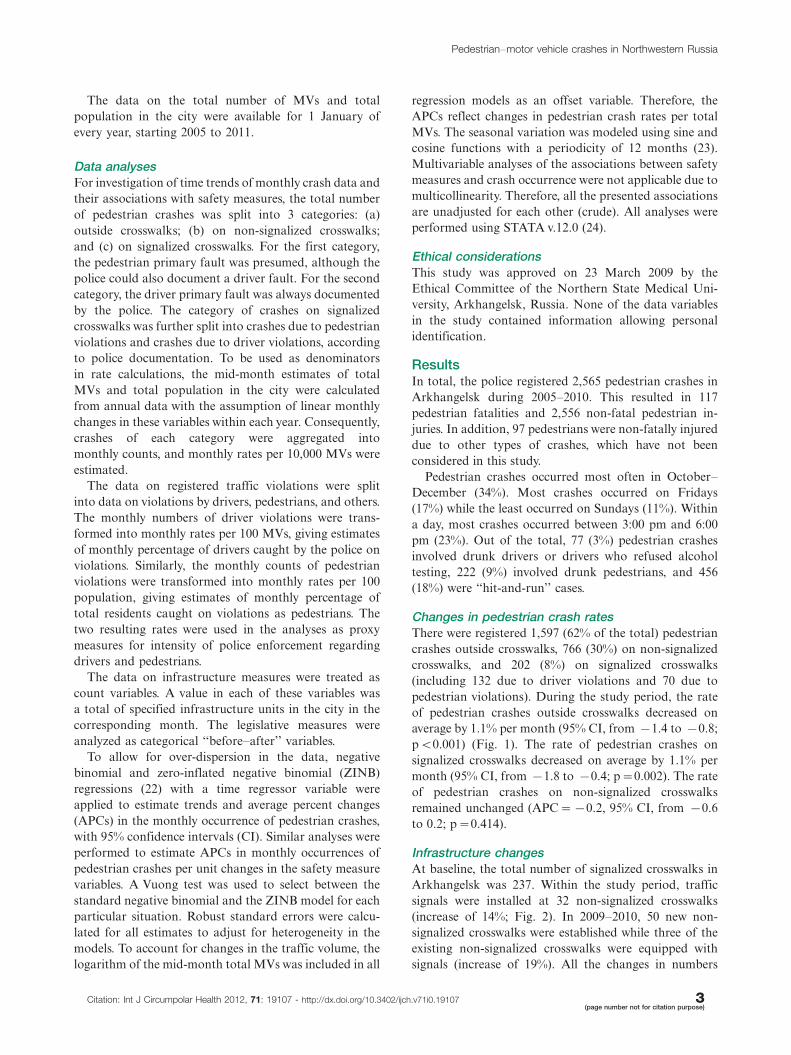
Traffic law enforcementDuring the study period, the police registered 747,943
traffic violations. These included 659,476 (88%) violations
by drivers, 85,625 (11%) by pedestrians, and 2,842 (B1%)
by others (mainly administrative officials). Mean monthly
rate of registered driver violations was 12.7 per 100 MVs,
while the mean monthly rate of registered pedestrian
violations was 0.3 per 100 residents. The rate of driver
violations per 100 MVs decreased on average by 0.3% per
month (95% CI, from �0.4 to �0.3; pB0.001) (Fig. 4).
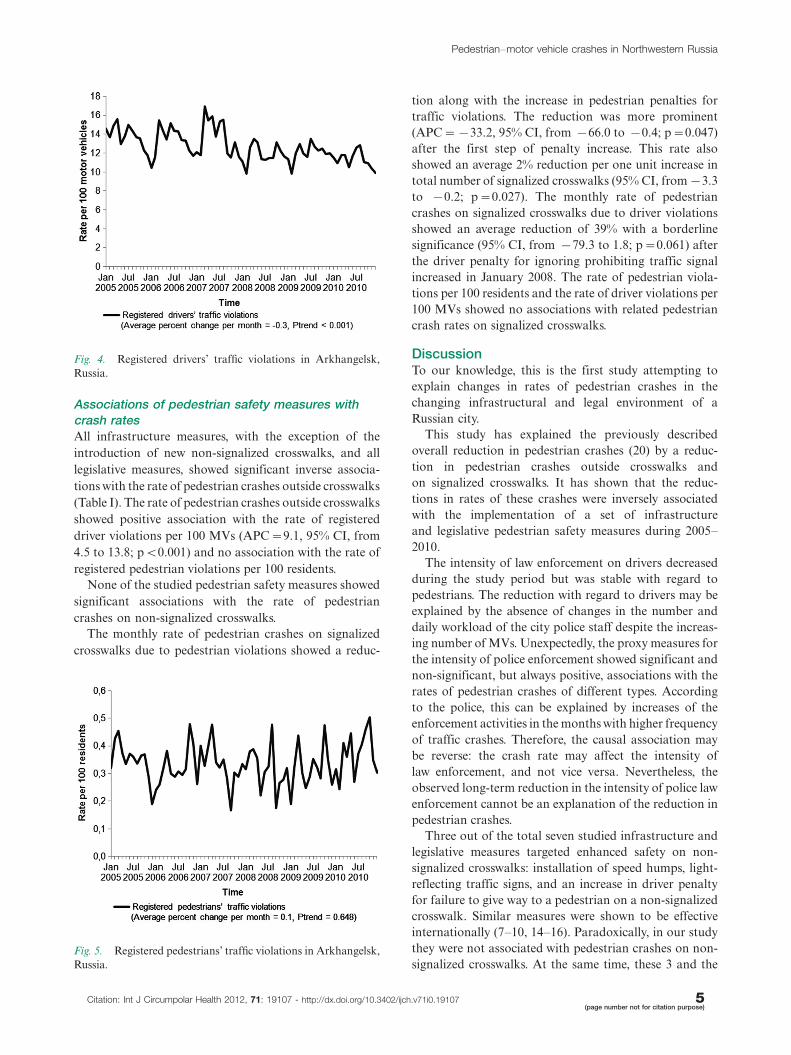
The rate of pedestrian violations per 100 population
showed no change (APC�0.1, 95% CI, from �0.2 to 0.3;
p�0.648) (Fig. 5).
Fig. 2. Infrastructure�pedestrian safety measures in
Arkhangelsk, Russia.
Fig. 3. Monetary penalties for traffic violations in Arkhangelsk,
Russia.
Fig. 1. Pedestrian�motor vehicle crashes by type in Arkhangelsk,
Russia.
Alexander V. Kudryavtsev et al.
4(page number not for citation purpose)
Citation: Int J Circumpolar Health 2012, 71: 19107 - http://dx.doi.org/10.3402/ijch.v71i0.19107
Associations of pedestrian safety measures withcrash ratesAll infrastructure measures, with the exception of the
introduction of new non-signalized crosswalks, and all
legislative measures, showed significant inverse associa-
tions with the rate of pedestrian crashes outside crosswalks
(Table I). The rate of pedestrian crashes outside crosswalks
showed positive association with the rate of registered
driver violations per 100 MVs (APC�9.1, 95% CI, from
4.5 to 13.8; pB0.001) and no association with the rate of
registered pedestrian violations per 100 residents.
None of the studied pedestrian safety measures showed
significant associations with the rate of pedestrian
crashes on non-signalized crosswalks.
The monthly rate of pedestrian crashes on signalized
crosswalks due to pedestrian violations showed a reduc-
tion along with the increase in pedestrian penalties for
traffic violations. The reduction was more prominent
(APC��33.2, 95% CI, from �66.0 to �0.4; p�0.047)
after the first step of penalty increase. This rate also
showed an average 2% reduction per one unit increase in
total number of signalized crosswalks (95% CI, from �3.3
to �0.2; p�0.027). The monthly rate of pedestrian
crashes on signalized crosswalks due to driver violations
showed an average reduction of 39% with a borderline
significance (95% CI, from �79.3 to 1.8; p�0.061) after
the driver penalty for ignoring prohibiting traffic signal
increased in January 2008. The rate of pedestrian viola-
tions per 100 residents and the rate of driver violations per
100 MVs showed no associations with related pedestrian
crash rates on signalized crosswalks.
DiscussionTo our knowledge, this is the first study attempting to
explain changes in rates of pedestrian crashes in the
changing infrastructural and legal environment of a
Russian city.
This study has explained the previously described
overall reduction in pedestrian crashes (20) by a reduc-
tion in pedestrian crashes outside crosswalks and
on signalized crosswalks. It has shown that the reduc-
tions in rates of these crashes were inversely associated
with the implementation of a set of infrastructure
and legislative pedestrian safety measures during 2005�2010.
The intensity of law enforcement on drivers decreased
during the study period but was stable with regard to
pedestrians. The reduction with regard to drivers may be
explained by the absence of changes in the number and
daily workload of the city police staff despite the increas-
ing number of MVs. Unexpectedly, the proxy measures for
the intensity of police enforcement showed significant and
non-significant, but always positive, associations with the
rates of pedestrian crashes of different types. According
to the police, this can be explained by increases of the
enforcement activities in the months with higher frequency
of traffic crashes. Therefore, the causal association may
be reverse: the crash rate may affect the intensity of
law enforcement, and not vice versa. Nevertheless, the
observed long-term reduction in the intensity of police law
enforcement cannot be an explanation of the reduction in
pedestrian crashes.
Three out of the total seven studied infrastructure and
legislative measures targeted enhanced safety on non-
signalized crosswalks: installation of speed humps, light-
reflecting traffic signs, and an increase in driver penalty
for failure to give way to a pedestrian on a non-signalized
crosswalk. Similar measures were shown to be effective
internationally (7�10, 14�16). Paradoxically, in our study
they were not associated with pedestrian crashes on non-
signalized crosswalks. At the same time, these 3 and the
Fig. 4. Registered drivers’ traffic violations in Arkhangelsk,
Russia.
Fig. 5. Registered pedestrians’ traffic violations in Arkhangelsk,
Russia.
Pedestrian�motor vehicle crashes in Northwestern Russia
Citation: Int J Circumpolar Health 2012, 71: 19107 - http://dx.doi.org/10.3402/ijch.v71i0.19107 5(page number not for citation purpose)

other 4 measures were strongly associated with pedestrian
crashes outside crosswalks.
To solve this puzzle, one has to take into considera-
tion the purposes of the set of introduced measures. Two
of the measures aimed at preventing pedestrians from
crossing roads in improper places and on prohibiting
signals. They were: (a) the establishment of new cross-
walks and (b) the increase in pedestrian penalties for
traffic violations. Other measures promoted pedestrian
priority on crosswalks: increases in driver penalties for
not giving way to pedestrians on signalized and non-
signalized crosswalks. Finally, a set of measures aimed
at promoting pedestrian safety as well as their feeling of
safety on crosswalks: installation of signals, speed
humps, and light-reflecting vertical signs. The combina-
tion of these measures may have created a ‘‘carrot and
stick effect,’’ both motivating and coercing pedestrians
to use crosswalks. Therefore, a putative migration of
Table I. Crudea estimates of average percent changes (APCs) in monthly ratesb of pedestrian�motor vehicle crashes per one unit
changes in pedestrian safety measures (Arkhangelsk, Russia, 2005�2010)
Pedestrian�motor vehicle crash types
Outside crosswalks,
pedestrian primary fault
presumed (n�1,597)
On non-signalized
crosswalks, driver
primary fault
presumed (n�766)
On signalized crosswalks
Pedestrian fault
documented (n�132)
Driver fault
documented
(n�70)
APC (95% CI) APC (95% CI) APC (95% CI) APC (95% CI)
Infrastructure measures (count
variables)
Signalized crosswalks, total
number
�2.1 (�2.7, �1.4) n.a. �1.8 (�3.3, �0.2) �0.8 (�2.7, 1.1)
Non-signalized crosswalks, total
numberc�0.6 (�1.3, 0.0) 0.2 (�1.0, 1.4) n.a. n.a.
Number of non-signalized crosswalks
with speed humps
�2.7 (�3.6, �1.9) �0.4 (�1.5, 0.7) n.a. n.a.
Number of non-signalized crosswalks
with light-reflecting vertical signs
�3.8 (�5.9, �1.6) �0.9 (�3.3, 1.5) n.a. n.a.
Legislative measures (event variables)
Pedestrian penalty for a traffic
violation raised
from 50 to 100 RUB in July 2007d �21.1 (�33.7, �8.4) �8.5 (�27.0, 10.0) �33.2 (�66.0, �0.4) n.a.
from 100 to 200 RUB in May 2009e �31.1 (�47.4, �14.7) �1.9 (�21.1, 17.3) �21.1 (�55.6, 13.5) n.a.
Driver penalty for ignoring prohibiting
signal raised from 100 to 700 RUB in
January 2008
�39.6 (�52.0, �27.3) n.a. n.a. �38.8 (�79.3, 1.8)
Driver penalty for failure to give way to
pedestrian at non-signalized
crosswalk raised from 100 to
800�1,000 RUB in May 2009
�41.2 (�56.8, �25.6) �7.1 (�25.7, 11.4) n.a. n.a.
Police law enforcement (rate variables)
Registered driver violations
per 100 MVs
9.1 (4.5, 13.8) 3.2 (�1.6, 8.0) n.a. 7.1 (�4.0, 18.1)
Registered pedestrian violations
per 100 population
22.4 (�85.5, 130.5) n.a. 91.4 (�83.0, 265.8) n.a.
n.a.: not applicable.aUnadjusted for each other.bRates are calculated per total number of registered motor vehicles.cAPCs estimated using data for January 2009�December 2010.dAPCs estimated using data for January 2005�April 2009.eAPCs estimated using data for July 2007�December 2010.
Alexander V. Kudryavtsev et al.
6(page number not for citation purpose)
Citation: Int J Circumpolar Health 2012, 71: 19107 - http://dx.doi.org/10.3402/ijch.v71i0.19107
pedestrians from outside crosswalks to crosswalks may
have increased exposure at the latter. This inference is
largely supported by the data: the numbers of crashes
outside crosswalks decreased. It also explains the
confusing absence of any associations of the safety
measures installed at the non-signalized crosswalks with
the related crash rate. These associations may be masked
by the increase in number of crosswalks and the in-
migrating pedestrian exposure. By the same reason, the
observed associations between the safety measures
targeting signalized crosswalks and crash rates on these
crosswalks may be underestimated.
The phenomenon � a ‘‘masked (or migrating) effect’’
of measures to improve safety on crosswalks � may be
observed in other circumstances. For example, Norway
ranks second lowest in Europe on pedestrian fatality
rate (6.7 per 100,000 population) and has the lowest rate
of pedestrian fatalities outside crosswalks out of total
pedestrian fatalities (45%), but the proportion of
pedestrian fatalities on crosswalks is the highest (55%)
(25). This explanation may be similar to our inferences:
with high road infrastructure standards, high density of
crosswalks, and pedestrian trust in and obedience to
traffic rules, the crosswalks become the most likely
places for rare pedestrian crashes to occur. An alter-
native explanation regarding both our study and the
situation in Norway is that granting high priority to
pedestrians on crosswalks may result in a false feeling of
full safety there. This may provoke pedestrian careless-
ness of the danger of not being noticed by a driver,
resulting in increased likelihood of a pedestrian crash at
a crosswalk (7).
LimitationsAbsence of data on volume of pedestrian exposure in the
city and its changes during the period is the major
weakness of this study. For instance, one can argue that
a reduction in pedestrian crashes can be explained by
a decreasing number of pedestrians along with an
increasing number of MVs and a relatively stable total
population (26). However, this cannot bias our results
substantially as is clear from simple calculations: (a)
knowing the total population and the total MVs on the
starting point of the study (approx. 60,000 and 358,000,
respectively) and assuming that each MV carries on
average 2 persons at a time, one can expect that the
number of pedestrian residents could be up to 238,000; (b)
the same estimate of the maximum number of pedestrian
residents at the end of the period (ca. 356,000 population
and 82,000 MVs) would be 192,000; (c) therefore, the
rough estimate of the reduction in maximum pedestrian
exposure is 20%, whereas the rates of pedestrian crashes
outside crosswalks and on signalized crosswalks more
than halved.
Consequently, the absence of data on changes in the
distribution of pedestrian exposure leaves our conjectures
about migration of pedestrian crash risks from outside
crosswalks to crosswalks only partly confirmed by logical
derivations from the observed crash trends but not by
factual data on pedestrian behavior. Therefore, our
guidance for further studies on pedestrian safety is that
the data on volume and distribution of pedestrian ex-
posure has to be collected for accurate assessment of risks
and evaluation of interventions.
Lack of confounding control is another possible threat
to the validity of the study. At least to some degree,
the detected associations may be explained by the effects
of a number of factors that may have been changing
in the study period in line with implementation of the
investigated pedestrian safety measures. These include:
(a) an increase in general public awareness of the
pedestrian safety due to ongoing educational and mass
media campaigns; (b) an overall toughening of the traffic-
related legislation; and (c) a reduction in the speed of
motor transport due to increased traffic volume on the
unchanged total length of municipal road networks.
Control of some of these confounders was not performed
because it was not possible to measure them, particularly
in the retrospective. Moreover, control for these factors
was likely to be impossible due to their potential
collinearity in time with the investigated factors just in
the same way as adjustment of the associations of
investigated factors for each other was not possible due
to the multicollinearity problem.
ConclusionReduction of pedestrian crash rates in Arkhangelsk in
2005�2010 was associated with an increase of infrastruc-
tural interventions and legislative safety measures. The
overall reduction in pedestrian crashes was due to a
reduction in rates of crashes outside crosswalks and on
signalized crosswalks. No change in the rate of crashes on
non-signalized crosswalks was observed in spite of the
measures to improve their safety. This may be due to an
increase in their number and in-migration of pedestrian
exposure from outside crosswalks.
Acknowledgements
We thank SpareBank1 Nord-Norge and Department of Community
Medicine, University of Tromsø, for financial support of the
study. We also thank Alexey Maximov, Andrei Stolyarov, Marina
Ermolina, Alexey Kuznetsov, and other officers of the Arkhangelsk
road police for their help in data management and interpretation of
the results.
Conflict of interest and fundingThe authors have not received any funding or benefits from
industry or elsewhere to conduct this study, except for what
is mentioned in the Acknowledgements. The authors declare
no conflicts of interest.
Pedestrian�motor vehicle crashes in Northwestern Russia
Citation: Int J Circumpolar Health 2012, 71: 19107 - http://dx.doi.org/10.3402/ijch.v71i0.19107 7(page number not for citation purpose)

References
1. World Health Organization. Global status report on road
safety: time for action. Geneva: World Health Organization;
2009. 287 p.
2. Naci H, Chisholm D, Baker TD. Distribution of road traffic
deaths by road user group: a global comparison. Inj Prev.
2009;15:55�9.
3. State Traffic Safety Inspectorate of the Ministry of Internal
Affairs of the Russian Federation. Statistika avarijnosti za
2010 god (Road traffic accident statistics for 2010). 2011 [cited
2011 Apr 6]. Available from: http://www.gibdd.ru/news/672. [in
Russian]
4. Directorate for management of the Federal Target Program
‘Road safety improvement in 2006�2012 years’. Portal bezo-
pasnosti dorozhnogo dvizhenia. Informacionnaya systema
monitoringa i analiza (Road safety portal. Information system
for monitoring and analysis). 2011 [cited 2012 Mar 21].
Available from: http://83.234.171.56/pbdd/. [in Russian]
5. Zegeer CV, Bushell M. Pedestrian crash trends and potential
countermeasures from around the world. Accid Anal Prev.
2012;44:3�11.
6. Retting RA, Ferguson SA, McCartt AT. A Review of
evidence-based traffic engineering measures designed to
reduce pedestrian�motor vehicle crashes. Am J Public Health.
2003;93:1456�63.
7. Elvik R, Høye A, Vaa T, Sørensen M. The handbook of road
safety measures, 2nd edition. Bradford UK: Emerald Group
Publishing Limited; 2009. 1124 p.
8. Tester JM, Rutherford GW, Wald Z, Rutherford MW.
A matched case-control study evaluating the effectiveness of
speed humps in reducing child pedestrian injuries. Am J Public
Health. 2004;94:646�50.
9. Road Safety and Environmental Benefit-Cost and Cost-
Effectiveness Analysis for Use in Decision-Making (ROSE-
BUD). Examples of assessed road safety measures * a short
handbook; European Commission, 2006 [cited 2012 Jul 3].
Available from: http://ec.europa.eu/transport/road_safety/
projects/doc/rosebud_examples.pdf
10. Yannis G, Evgenikos P, Papadimitriou E. Best practices
for cost-effective road safety infrastructure investments.
Conference of European Road Directors (CEDR); CEDR’s
Secretariat General, 2008 [cited 2012 Jun 14]. Available from:
http://www.cedr.fr/home/fileadmin/user_upload/Publications/
2008/e_Road_Safety_Investments_Report.pdf.
11. SUPREME. Best practices in road safety. Handbook for mea-
sures at the country level; European Commission, 2007 [cited
2012 Mar 15]. Available from: http://ec.europa.eu/transport/
roadsafety_library/publications/supreme_c_handbook_for_
measures_at_the_country_level.pdf.
12. Campbell BJ, Zegeer CV, Huang HH, Cynecki MJ. A review
of pedestrian safety research in the United States and
abroad. U.S. Department of Transportation, Federal Highway
Administration. Publication number FHWA-RD-03-042;
U.S. Department of Transportation, 2003 [cited 2012 Mar
06]. Available from: http://www.fhwa.dot.gov/publications/
research/safety/pedbike/03042/.
13. Lund J, Aarø LE. Accident prevention. Presentation of a
model placing emphasis on human, structural and cultural
factors. Saf Sci. 2004;42:271�324.
14. Chen L, Chen C, Ewing R, McKnight CE, Srinivasan R,
Roe M. Safety countermeasures and crash reduction in
New York city*experience and lessons learned. Accid Anal
Prev. 2012 May 31 [Epub ahead of print].
15. Peden M, Scurfield R, Sleet D, Mohan D, Hyder AA, Jarawan
EJ, et al. World report on road traffic injury prevention.
Geneva: World Health Organization; 2004 [cited 2012 Mar 07].
Available from: http://whqlibdoc.who.int/publications/2004/
9241562609.pdf.
16. Forjuoh SN. Traffic-related injury prevention interventions
for low-income countries. Inj Control Saf Promot. 2003;10:
109�18.
17. Rivara FP. Child pedestrian injuries in the United States:
current status of the problem, potential interventions, and
future research needs. Arch Pediatr Adolesc Med.
1990;144:692�6.
18. Directorate for management of the Federal Target Program
‘Road safety improvement in 2006�2012 years’. Pravitel’stvo
Rossyuskoj Federacii. Postanovlenie ot 20 fevralya 2006 N 100
O Federalnoi celevoj programme ‘Povishenie bezopasnosti
dorozhnogo dvizhenia v 2006�2012 godah’ (Government of
the Russian Federation. Regulation No. 100 of 20.02.2006 On
the Federal Target Program ‘Road safety improvement in
2006�2012 years’). [cited 2012 Mar 20] Available from: http://
www.fcp-pbdd.ru/about_program/. [in Russian]
19. Kuzmin AG. Dorozhno-transportnie proishestvia kak nacio-
nalnaya problema (Road accidents as national problem).
Ekologiya cheloveka (Hum Ecol.). 2011;3:44�9. [in Russian]
20. Kudryavtsev AV, Lund J, Nilssen O, Grjibovski AM, Ytterstad
B. Road traffic crashes with fatal and non-fatal injuries in
Arkhangelsk, Russia in 2005�2010. Unpublished Manuscript
under Review.
21. Kudryavtsev AV, Kleshchinov N, Ermolina M, Lund J,
Grjibovski AM, Ytterstad B. Road traffic fatalities in Arkhan-
gelsk, Russia in 2005�2010: reliability of police and healthcare
data. Unpublished Manuscript under Review.
22. Long S, Freese J. Regression models for categorical dependent
variables using Stata. College Station, TX: StataCorp; 2006.
23. Schwartz J, Spix C, Touloumi G, Bacharova L,
Barumamdzadeh T, le Tertre A, et al. Methodological issues
in studies of air pollution and daily counts of deaths or
hospital admissions. J Epidemiol Community Health. 1996;50:
S3�11.
24. StataCorp. Stata Statistical Software: release 12. College
Station, TX: StataCorp LP; 2011.
25. EuroTest. Pedestrian crossings survey in Europe. Euro
Test, 2008 [cited 2012 Mar 26]. Available from: http://www.
eurotestmobility.com/images/filelib/final_report_p_crossings_
290108_v3_1795.pdf.
26. Keall MD. Pedestrian exposure to risk of road accident in
New Zealand. Accid Anal Prev. 1995;27:729�40.
*Alexander V. KudryavtsevArkhangelsk International School of Public HealthNorthern State Medical UniversityTroitsky Av. 51, Office 1501Arkhangelsk 163001, RussiaTel: �7 (8182) 287936Fax: �7 (8182) 263226Mobile: �7 921 7212125Email: [email protected]
Alexander V. Kudryavtsev et al.
8(page number not for citation purpose)
Citation: Int J Circumpolar Health 2012, 71: 19107 - http://dx.doi.org/10.3402/ijch.v71i0.19107
http://www.cedr.fr/home/fileadmin/user_upload/Publications/2008/e_Road_Safety_Investments_Report.pdf
Related Documents