EXPLAINING DIFFERENCES IN THE DOMESTIC SAVINGS RATIO ACROSS COUNTRIES: A PANEL DATA STUDY Khaled A. Hussein and A. P. Thirlwall February 1999 Abstract This paper seeks to analyse the major determinants of differences in the domestic savings ratio between countries using panel data for 62 countries over the period 1967-1995. A basic distinction is made between the determinants of the capacity to save and the willingness to save. The capacity to save depends primarily on the level of per capita income (but non-linearly) and the growth of income (the life cycle hypothesis), and the empirics strongly support these hypotheses. The willingness to save is assumed to depend on financial variables such as the rate of interest, the level of financial deepening and inflation. We find no support for a positive interest rate effect, but strong support for the level of financial deepening measured by the ratio of quasi-liquid liabilities to GDP. Inflation exerts a mild positive effect on saving but soon turns negative. Total saving also depends on government saving, and a surprisingly strong negative relation is found between the ratio of tax revenue to GDP and the domestic savings ratio. JEL Classification: E21 Keywords: Domestic savings, income, financial variables, tax. Address for correspondence: Professor A. P. Thirlwall, Department of Economics, University of Kent at Canterbury, CT2 7NP, UK; email: [email protected].

Welcome message from author
This document is posted to help you gain knowledge. Please leave a comment to let me know what you think about it! Share it to your friends and learn new things together.
Transcript

EXPLAINING DIFFERENCES IN THE DOMESTIC SAVINGS RATIO
ACROSS COUNTRIES: A PANEL DATA STUDY
Khaled A. Hussein and A. P. Thirlwall
February 1999
AbstractThis paper seeks to analyse the major determinants of differences inthe domestic savings ratio between countries using panel data for 62countries over the period 1967-1995. A basic distinction is madebetween the determinants of the capacity to save and the willingness tosave. The capacity to save depends primarily on the level of per capitaincome (but non-linearly) and the growth of income (the life cyclehypothesis), and the empirics strongly support these hypotheses. Thewillingness to save is assumed to depend on financial variables suchas the rate of interest, the level of financial deepening and inflation.We find no support for a positive interest rate effect, but strongsupport for the level of financial deepening measured by the ratio ofquasi-liquid liabilities to GDP. Inflation exerts a mild positive effecton saving but soon turns negative. Total saving also depends ongovernment saving, and a surprisingly strong negative relation isfound between the ratio of tax revenue to GDP and the domesticsavings ratio.
JEL Classification: E21
Keywords: Domestic savings, income, financial variables, tax.
Address for correspondence: Professor A. P. Thirlwall, Department of Economics,University of Kent at Canterbury, CT2 7NP, UK; email: [email protected].

1
EXPLAINING DIFFERENCES IN THE DOMESTIC SAVINGS RATIO
ACROSS COUNTRIES: A PANEL DATA STUDY
1. Introduction
Across the world, there are huge differences between countries in the ratio of domestic
savings to national income. In a sample of 62 countries over the period 1967 to 1995, shown
in Table 1 (taken from the World Development Indicators, 1998), the mean domestic savings
ratio is 17.8 percent; the standard deviation is 8.9, and the range is from 1.6 percent in
Rwanda to 41.4 percent in Saudi Arabia. The countries taken were dictated by the consistency
of data over the chosen time period. In this paper, an attempt is made to account for these
differences in country savings performance, distinguishing between variables that affect the
capacity or ability to save on the one hand and the willingness to save on the other. Important
variables that determine the ability to save include the level of per capita income; the growth
of income (which comprises the growth of per capita income and population growth); the age
structure of the population (or dependency ratio) if population is not in balanced growth, and
the distribution of income. Key variables that determine the willingness to save include the
rate of interest, the degree of financial deepening, and the rate of inflation. The overall
domestic savings ratio will also be affected by the government’s fiscal stance.
There has been no recent study of this nature taking such a large data set for so many
countries over such a long period of time. The study that comes closest is that by Edwards
(1996) which takes panel data for 36 countries over the period 1970 to 1992, distinguishing
between private and government savings. As explanatory variables, he takes a vector of life-
cycle factors; monetary and fiscal variables (including measures of macroeconomic stability);
external indicators, and political variables. The results are interesting, and Edwards himself
highlights the following conclusions: per capita income growth is an important determinant of

2
private and public saving; higher government saving crowds out private saving, but less than
proportionately; government social security systems affect private saving negatively; high
foreign saving is associated with lower domestic saving, and lastly the level of financial
development is an important determinant of private saving. There are no particular surprises
here. What is surprising, however, is the neglect of any discussion of the potential importance
of the level of per capita income (PCY, hereafter) as a measure of the capacity to save, and
how this variable should be specified in empirical estimation. The regression equations in
Edwards’ study include the variable in linear form, but PCY is not highlighted as an important
determinant of savings performance because its statistical significance is relatively low
compared with other variables.
This neglect is serious for two reasons. First, it ignores the most basic theory of all of
what determines the level of consumption and saving. Secondly, it is very clear from casual
inspection of the data that when the savings ratio of countries is plotted against the level of
PCY, the relationship is strong, but non-linear. That is, the savings ratio rises as PCY rises but
at a decreasing rate, and eventually levels off at around 20-25 percent of national income. This
is shown for our own data set in Figure 1.
This means that entering the level of PCY in linear form in equations to explain
differences in the savings ratio can lead to seriously misleading results and conclusions
concerning the importance of income. Indeed, in our own sample of countries, using a non-
linear specification, nearly 40 percent of the variation in the domestic savings ratio between
countries can be explained by differences in the level of PCY. Basic Keynesian theory predicts
such a non-linear relation, as demonstrated below.

3
2. Per Capita Income as a Determinant of Saving
One of the most important innovations that Keynes made in his General Theory was to
link, for the first time, consumption (and therefore saving) to the level of income through the
innovation of the consumption function. More explicitly, there is the suggestion that the
consumption or savings function is non-proportional; that is, that the rich (people or countries)
consume proportionately less, and save proportionately more, of their income than the poor.
One way of expressing this idea is to start with the savings function:
��
���
���
P
Yba
P
S11 (1)
where PS is the level of savings per head of population )(P , and PY is PCY. The negative
constant term means that the marginal propensity to save is above the average, so raising the
average as PCY rises.
To convert this function so that the savings ratio is the dependent variable, multiply both
sides of equation (1) by P and divide by Y. This gives:
1
11
�
��
���
��
P
Yab
Y
S(2)
where the savings ratio is a non-linear function of the level of PCY, as depicted in Figure 2.
As PY approaches , 1bYS � . In other words, as PCY rises, the savings ratio approaches
the asymptote 1b .
This is broadly the pattern we observe in Figure 1. The savings ratio is lower in poor
countries than in rich countries, but the ratio does not continue rising linearly as PCY rises. It
increases at a diminishing rate and then levels off. Indeed, there is even some indication that it
starts falling at very high levels of income. In an early study, one of the present authors
(Thirlwall, 1974a) tested this simple relationship in equation (2) across 63 countries over the

4
period 1958-68, and estimated an asymptote of 20.9 percent, with 40 percent of the variation
in the savings ratio explained by the level of PCY alone.1 One of the striking features of our
new research, taking a different set of countries over a much longer time period, is that this
result is hardly changed (see later).
It is evident from Figure 1, however, that there is quite a wide dispersion of scatter
points around the relation between YS and PCY; that at the same level of PCY, some
countries are saving much more than others. The question is why? As indicated in the
introduction, this must relate to other differences in the capacity to save, and in the
willingness to save, and it is to these factors that we now turn. Following a brief description of
the theory behind each of the variables to be considered, we then proceed to examine whether
each of the variables is separately significant, and then test for the robustness of the variables
using the methodology of Levine and Renelt (1992). We shall conclude with our preferred
equation for understanding differences in the savings performance of countries across the
world.
3. The Capacity to Save
Apart from the absolute level of income, another major determinant of the domestic
savings ratio is likely to be the growth of income as suggested by the life-cycle hypothesis of
saving. The basis of the hypothesis, as originally formulated by Modigliani and Brumberg
(1954), is that individuals and households attempt to spread out consumption evenly over their
lifetime so that decisions to save are assumed to be a function of total lifetime earnings and
1 The precise equation estimated was: 1)(393.993846.20 �
� PYYS , with a t-value for theregression coefficient of 6, and an R2 = 0.402.

5
the stage reached in the earnings cycle. A typical pattern of behaviour would be dissaving in
youth, positive saving in middle-age and dissaving in retirement, breaking even on death (on
the assumption of no bequests). Consider now the effect of income growth within this
framework. If income is rising over time, this means that the life earnings and consumption of
each successive age group will be higher than the preceding one. If each successive age group
is aiming for a higher level of consumption in retirement, the volume of saving of the active
households will exceed the dissaving of the currently retired households with a lower level of
lifetime consumption. The savings ratio will then tend to rise with the rate of growth of
income because the higher the growth rate, the greater the gap between the target consumption
levels of the current generation of working households and the dissaving of retired people
from a less prosperous generation. Thus, countries with higher growth rates might be expected
to have at least higher personal savings ratios than countries with lower growth rates.
But income growth comprises two components: the growth of income per head and the
growth of population. Income growth due to population growth will affect the savings ratio
according to how population growth affects the ratio of active to non-active households. If
population is in balanced growth (i.e. it has stabilised at a particular rate over a long period),
the population growth rate and the age structure of the population will be uniquely related, and
the effect of population growth on the savings ratio will be the same as the growth of income
per head. If population is not in balanced growth, however, it is difficult to say what the
relation between population growth and the savings ratio will be. It will depend on the balance
between the extra consumption demands made on society by a growing child-dependency
ratio in the early stages of rapid population growth and the increase in saving that comes about
as a result of a rise in the ratio of the active to retired households as the population growth
persists. Thus, there are two possible tests of the life-cycle hypothesis. The first is to test the
simple relation between the savings ratio and the growth of per capita income. The second is

6
to disaggregate the growth of income into the growth of per capita income and the growth of
population, and to examine the separate effects. If the effect of population growth is
insignificant or negative, a third test is to relate the savings ratio to the growth of per capita
income and to the age structure of the population (or dependency ratio). Pioneer studies of this
nature include Leff (1969) and Modigliani (1970).
Another potentially important factor determining the amount of saving is the
distribution of income. If, for example, the propensity to save of the rich is higher than that of
the poor, the aggregate savings ratio will be positively related to the degree of inequality both
in the personal income distribution, and also in the functional distribution on the assumption
that the propensity to save out of profits is higher than out of wages. Indeed, movements in the
income distribution, both personal and functional, may be an independent explanation of why
the savings ratio first rises with the level of PCY and then levels off. The transformation of
economies from Rostow’s traditional and transitional stages through ‘take-off’ to high mass
consumption is bound to be accompanied in the early stages by widening disparities between
individuals and a rise in the share of profits in national income. Some individuals are more
enterprising, and more adept at accumulating wealth, than others. Profits, too, are a feature of
capitalist development and will increase as a proportion of national income as the capitalist
sector grows in importance, and as the share of profits in capitalist income rises because
increasing returns prevail in industry and labour is available to industry at a constant real wage
(although not for ever). In other words, the savings ratio may be expected to rise as PCY rises
and then level off, if the distribution of income also grows more unequal but at a decreasing
rate, and ultimately becomes more egalitarian. The pioneering work of Adelman and Morris
(1971), extended by Paukert (1973), for developing countries shows fairly conclusively that
income inequality increases up to a certain stage of development and then declines,
graphically tracing out an inverted U-shape similar to the original historical findings of Kravis

7
(1960) and Kuznets (1966) for the developed countries. The most up-to-date study of income
inequality across the world by Deininger and Squire (1996) of the World Bank also shows
this. We know of no study that considers the personal distribution of income as a determinant
of inter-country differences in the savings ratio, as measured, say, by the Gini ratio or by the
proportion of income received by the top 10 percent of the income distribution, which is the
measure we shall take in this study.2
4. The Willingness to Save
Saving represents an intertemporal choice between consumption today and consumption
tomorrow. It might be expected, therefore, that the price of present consumption, namely the
rate of interest, will affect saving positively. This assumed positive relation also reflects the
classical idea of the rate of interest as the reward for waiting, and lies behind the financial
liberalisation programmes in developing countries which seek to raise the real interest rate in
order to maximise saving, investment and growth. In the last twenty years or so there has been
extensive testing of the financial liberalisation hypothesis, and the role of the interest rate in
promoting saving, with mixed and largely inconclusive results. Perhaps this is not surprising
since the financial liberalisation argument largely refers to financial saving, but financial
saving is only one component of total saving. If interest rates rise, financial saving may rise
but at the expense of other assets, leaving total saving unchanged (see Warman and Thirlwall,
2 An early study by Modigliani (1970) considered the functional distribution of income,relating the savings ratio across 33 countries to the profits-income ratio as measured by theratio of non-wage income (including income from self-employment) to total income. Therelation turned out to be negative which Modigliani rationalised in terms of large amounts ofself-employment in agriculture in low income/low savings countries. Taking a sample of 19developed countries, however, gave a positive and significant relation between the profitsratio and the savings ratio.

8
1994). It is also standard theory that any price change has both income and substitution
effects. The substitution effect promotes saving, but the income effect reduces saving, and the
two effects may cancel each other out. In his extensive overview of the literature, Maxwell
Fry (1995) concludes: ‘What is agreed … is that if an effect [on saving] exists at all, it is
relatively small’ and that ‘positive interest effects are easier to find in Asia than in other parts
of the world, but even in Asia the effects appear to have diminished over the past two
decades’. We shall look at the impact of the real interest rate is our own sample of countries as
a measure of the willingness to save.
Probably a more important determinant of the willingness to save, however, is the
existence of financial institutions and the range and availability of financial assets to suit
savers. There is no single measure that can capture these institutional determinants of the
willingness to save. It is necessary to proceed by trial and error using different measures. The
number, proximity and diversity of financial institutions serving the different needs of savers
could be important. Equally, the volume and range of financial assets might matter as a
measure of financial deepening. Here we take as indicators: money and quasi-money as a
percentage of GDP; money and quasi money growth, and quasi-liquid liabilities as a
percentage of GDP. We also look at domestic credit provided by the banking sector as a
percentage of GDP on the hypothesis that bank credit finances investment and growth, which
in turn generates saving.
Finally, the rate of inflation can be expected to affect the willingness to save, but the
effect is ambiguous. On the one hand, inflation acts as a tax on money balance holdings. If
individuals wish to restore the real value of their money balance holdings (the so-called real
balance effect), saving will rise with the rate of inflation. On the other hand, it is natural to
expect individuals to avoid the tax if it becomes burdensome in relation to the convenience of
holding money. It can be shown (Friedman, 1971) that the yield from the inflation tax will be

9
maximised when the elasticity of the tax base (the level of real money balance holdings) with
respect to the rate of inflation is minus unity. Even if private saving does increase, however,
total saving may not increase if the government fully consumes the proceeds of the inflation
tax. Inflation may also discourage other forms of voluntary saving because its real value is
falling.
Inflation will also redistribute income from wages to profits within the private sector if
the wage-price coefficient is less than unity. This will increase saving if the propensity to save
out of profits is higher than out of wages (see earlier), but this process can only last as long as
there is money illusion (or as long as real wages rise slower than productivity growth in the
growing economy3). The most likely relation between inflation and the savings ratio is a
quadratic showing saving rising with mild inflation and then falling as inflation becomes
excessive. This type of non-linear relation is also suggested by the evidence we have on the
relation between inflation and economic growth (Sarel, 1996 and Bruno and Easterly, 1998).
We shall enter inflation both linearly and non-linearly into our equations.
5. Government Saving
Total domestic saving consists of private saving and government saving. Edwards
(1996) tests for the determinants of government saving, and uses largely the same independent
variables that are employed to explain private saving, which in our view does not make a great
deal of economic sense. Government saving/dissaving depends on whether the government
budget is in surplus or deficit on current account and therefore depends on the willingness and
ability to tax and spend. In the model here we test for the influence of government on total
3 See Thirlwall (1974a) for a full discussion.

10
domestic saving by examining the relation between the domestic savings ratio and the ratio of
tax revenue to GDP. In other words, do countries which tax more, save more? If the relation is
positive, this suggests that countries with higher tax ratios run larger surpluses/smaller deficits
than countries with lower tax ratios. A negative relation would indicate that a high tax ratio
either discourages private saving or that countries with high tax ratios still have larger budget
deficits/smaller surpluses.
6. Empirical Results
The empirical results are presented in sequence, first examining the variables
determining the capacity or ability to save, and then the variables determining the willingness
to save. We test for the robustness of results using a modification of the approach adopted by
Levine and Renelt (1992). Consider the equation:
��� ZbIbY zi
where I is the variable of interest, and Z is a set of other variables added to the equation. First
the regression is run with the variable of interest (I). Then other variables are added. If the
coefficient on the variable of interest remains statistically significant without changing sign,
the variable is regarded as ‘robust’. Otherwise, it is considered ‘fragile’. In our results, PCY is
always a robust variable whatever other variables are included in the equations and we include
it in every equation. Other variables are also robust but are not included in every equation. To
anticipate the results and conclusions, differences in the savings ratio between countries can
largely be explained by differences in the level of PCY; the growth of income (or the growth
of PCY and population separately); the quasi-liquid liabilities ratio (as a measure of financial
deepening); the tax ratio (negatively), and inflation (non-linearly). All other variables turn out

11
to be ‘fragile’.
Owing to the varying availability of data for different variables, the sample size varies
according to the variable of interest, but in all cases (especially with the panel data) the sample
size is always sufficiently large to draw statistical inference. The variation in the sample size
also becomes another convenient test of the robustness of the results; that is, whether the
significance of key variables changes as the sample size changes. We find that they do not.
In reporting the results of our empirical investigations, two model specifications are
used (i) cross section estimates taking mean values of the variables for each country over the
sample period, and (ii) panel estimates (taking pooled time series and cross section data). The
panel data estimator is the ‘two way’ fixed effects model where it allows an overall constant
as well as a ‘group’ effect for each country and a ‘time’ effect for each period. The bracketed
terms in all equations are t values. A * signifies significance of the regression at the 95 percent
confidence level or above.4
The Keynes Absolute Income Hypothesis
We first report the simple non-linear relation between the savings ratio and the level of
PCY as expressed in equation (2).
<< Table 2 about here >>
In the cross section of 62 countries over the period 1967 to 1995, 40 percent of the
difference in the savings ratio is accounted for by differences in the level of income when
PCY is entered non-linearly, with the savings ratio reaching an asymptote of 24 percent. This
result is strikingly similar to that obtained in Thirlwall (1974a) mentioned earlier where for a
different set of 63 countries over the period 1958-68, also 40 percent of the variance in the
5 The statistical package used throughout is LIMDEP.

12
savings ratio was explained by differences in PCY, and the asymptote was nearly 21 percent.
From the estimate of the regression coefficient we can work out the change in YS from a
specific change in PCY. Since the relation between YS and PCY is non-linear, the impact
will be a function of the level of PCY taken. Differentiating equation (3) with respect to PCY
gives the change in YS as 3665 (1/PCY2). For example, at PCY level $500, the change in
YS for a $100 change in PCY would be approximately 3665 (1/5002) 100 = 1.47 percentage
points. At PCY level $1000, the change in YS for the same change in PCY would be
3665(1/10002) 100 = 0.37 percentage points, and so on.
Using panel data, abstracting from individual country fixed effects, 70 percent of the
variation in the savings ratio is accounted for by differences in the level of PCY. This is very
strong support for the Keynes absolute income hypothesis, provided the non-linearity of the
relationship is allowed for. The linear relation is much weaker in the cross section with only
17 percent of the variance explained, and slightly weaker in the panel with 60 percent of the
variance explained.5
The Life Cycle Hypothesis
The life-cycle hypothesis of saving is tested in two parts: First, we take the growth of
income (G), and then we look at the influence of the two components of the growth of
income, namely the growth of PCY (GPCY) and population growth (POPG). In Table 3, these
variables are considered alone (equations (5) and (6) in the cross section and equations (9) and
(10) in the panel), and also when combined with PCY (equations (7) and (8) in the cross
section and equation (11) and (12) in the panel).
5 The linear specification of PCY becomes much weaker in the panel when other variables areconsidered.

13
<< Table 3 about here >>
It can be said straight away that both in the cross section and in the panel data results
there is strong support for the life-cycle hypothesis of saving whether the growth of income or
the growth of PCY is taken. Equation (5) shows that the growth of income by itself is a
significant determinant of differences in the savings ratio but not as powerful as the level of
PCY. It retains its significance when combined with the level of PCY (equation 7). Splitting
the growth of output into its two components shows the growth of PCY is significant, but the
effect of population growth is negative (but insignificant) (equation 6). The cross section
results suggest that allowing for differences in the level of PCY, a one percentage point
difference in the growth rate is associated with a 1.5 percentage point difference in YS . The
panel results suggest a smaller impact but nonetheless significant. The growth of PCY retains
its significance when combined with the level of PCY (equation 8). The panel data results
show much stronger effects of growth, and population growth is now significantly positive
(equations (10) and (12)). Given these strong positive effects of population growth, we have
not explored further the effect of the dependency ratio on the savings ratio.
Income Distribution
To consider the effect of the income distribution on the savings ratio, we took the ratio
of income received by the top 10 percent of income earners. Observations were obtained for
39 countries, but in none of the equations estimated was the income distribution variable
statistically significant.
The Real Interest Rate
To test the significance of the real interest rate (R) we take a sample of 22 countries for
which consistent and reliable data are available and a panel of 396 observations. When

14
considered by itself, the variable is positive but insignificant in the cross section, but
significantly negative in the panel (equations (13) and (15)). When the interest rate variable is
combined with PCY, the sign is consistently negative (equations (14) and (16)). The same is
true when the growth of income and other variables are added to the equations (not reported
here). Two possible explanations for the negative relationship suggest themselves. The first is
the standard theoretical possibility that the positive income effect of high real interest rates
offsets the negative substitution effect. The second possibility is that high real interest rates
are associated with a higher ratio of foreign capital inflows to GDP which in accounting terms
shows up as a lower domestic savings ratio if a part of the capital inflows is consumed.
Whatever the explanation, there is no support here for the view that high real interest rates
raise the domestic savings ratio.
<< Table 4 about here >>
Financial Variables
There are several variables that it is possible to take to test the hypothesis that the
willingness to save depends on the degree of financial sophistication of economies. Here we
have explored the role of four variables: money and quasi money as a percentage of GDP
(M2); domestic credit provided by the banking system as a percentage of GDP (BC); money
and quasi money growth (mg), and quasi-liquid liabilities as a percentage of GDP (QLL). We
take 59 countries and 1770 panel observations. The M2, BC and mg variables all give either
insignificant or fragile results. Really strong and robust results emerge when quasi liquid
liabilities of the banking system are taken as the indicator of financial deepening and the
willingness to save. The formal definition of quasi-liquid liabilities is: ‘time and saving
deposits, foreign currency transferable deposits, certificates of deposit, and securities
repurchase arrangements, travellers cheques, foreign currency time deposits, commercial

15
paper and shares of mutual funds or market funds held by residents’6.
<< Table 5 about here >>
Both in the cross section of 62 countries and in the panel estimates there is a strong relation
between the savings ratio and the QLL ratio alone (equations (17) and (21)). The variable
stays robust when PCY, growth, the growth of PCY and population growth are added to the
equations. Over 50 percent of the variance in the savings ratio is accounted for by these
variables in the cross section and over 70 percent in the panel. All the results show that a one
percentage point difference in the QLL ratio is associated with a difference in YS of between
0.1 and 0.2 percentage points, whether or not allowance is made for other variables.
Inflation
The rate of inflation (�) in this study is measured by the rate of change of the GDP
deflator. We first examine the relation between the savings ratio and inflation using a linear
specification and then non-linearly using a quadratic function (�2). The cross section results
show no significant positive or negative relation for a sample of 55 countries (not reported
here), but the panel results reveal a significant positive but non-linear relation between savings
and inflation using 1595 observations. Equation (25) shows a surprisingly strong result, and
solving for the rate of inflation which maximises the savings ratio gives a very low rate of
1.36 percent. When other variables are added in equations (26), (27) and (28), the inflation
variable(s) remain robust. Equation (28) which includes PCY, life cycle variables and the
quasi-liquid liabilities ratio now explains 75 percent of the variance in the savings ratio.
<< Table 6 about here >>
6 Taken from the World Development Indicators 1998, issued by the World Bank.

16
Compulsory Saving
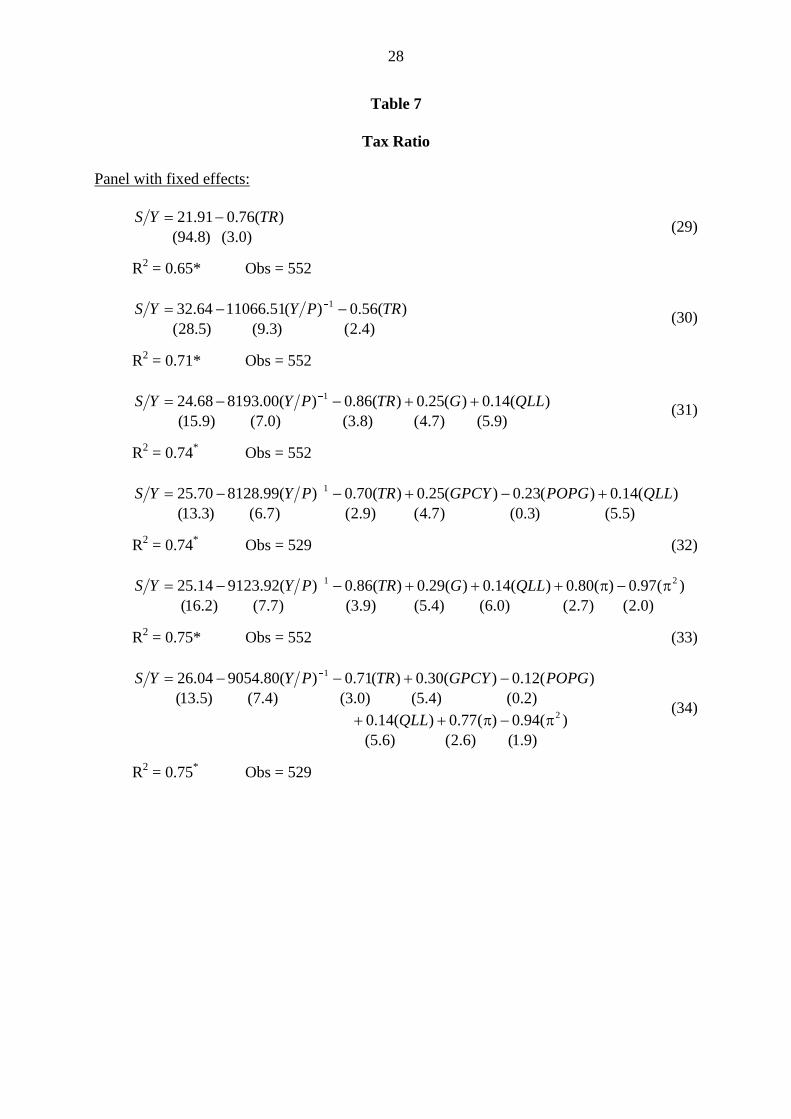
The effect of the tax ratio variable (TR) is consistently negative both in the cross section
results for 23 countries, and in the panel data results using 552 observations. We report here
only the panel estimates. It appears that the more governments tax as a proportion of GDP, the
lower the overall savings ratio. The coefficient on TR is significantly negative by itself in
equation (29), and remains robustly negative when other significant independent variables are
added to the equations. All the results show that a one percentage point difference in the tax
ratio is associated (negatively) with a difference in the savings ratio of between 0.5 and 1.0
percentage point. This negative effect of the tax ratio is open to three interpretations. Firstly,
high tax ratios could be discouraging personal and private saving. Secondly, and related, high
tax ratios could be a reflection of the extent of redistribution policies which make
precautionary private savings less necessary. Thirdly, higher tax ratios could go hand in hand
with higher budget deficits on current account. Taxation is used to finance deficits but never
adequately. The strength of this result surprises us.
<< Table 7 about here>>
7. Conclusions and Policy Implications
In this study we have reverted to conventional theories of the determination of saving in
an attempt to explain differences in the domestic savings ratio across a wide cross section of
countries, taking advantage of panel data from the World Bank. Herein lies one of the study’s
strengths. We are able to account for up to 75 percent of the difference in the savings ratio
between countries in terms of the level of PCY, the growth of PCY, population growth, the
quasi-liquid liabilities ratio, inflation, and the tax ratio (see, for example, equations (28) or

17
(34)).7 In contrast to the most recent study by Edwards (1996), we rehabilitate the Keynesian
absolute income hypothesis, and give theoretical reasons why it is important to enter the PCY
variable non-linearly. The life cycle hypothesis of saving has strong support, and so does the
financial deepening hypothesis measured by the ratio of quasi-liquid liabilities to GDP. We
are surprised by the robustness of the non-linear relation between inflation and savings and the
negative effect of the tax ratio on the savings ratio. These are new results. The policy
implications of our analysis are fairly clear-cut, but not so easy to act on directly. A rise in
PCY, which should bring about a rise in the savings ratio automatically, is a function of many
factors not under the direct influence of policy-makers. The major determinant of the level of
PCY is labour productivity which depends on investment per worker and technical progress.
How to raise the level of investment (which is not the same as saving) and to enhance
technical dynamism is the big challenge facing virtually all developing economies. Investment
will be promoted by a stable macroeconomic environment, and through the creation of
financial institutions willing to lend. Our results show that the degree of financial deepening
clearly matters for saving, and governments have a role to play here in providing the right
regulatory and legal framework in which the banking system can operate safely and
efficiently. The growth of income and growth of PCY are also important determinants of
saving, and again will be a function of investment and technical dynamism. Inflation (or the
inflation tax) appears to play a role in raising the domestic savings ratio, but it would be
clearly unwise to recommend more inflation in most developing countries. Equally, however,
it would seem to be a mistake from the evidence here for governments to attempt to squeeze
inflation out of the system entirely. It is also difficult to recommend reductions in the tax ratio
when most developing countries need all the tax they can raise to finance basic expenditure.
7 Although population growth is ‘fragile’.

18
By far the strongest determinants of savings performance are living standards and the growth
of income. This should not be a controversial conclusion, but one that has not been so fully
documented in recent years.

19
REFERENCES
I. Adelman and C.T. Morris (1971), ‘An Anatomy of Income Distribution Patterns inDeveloping Countries’, AID Development Digest, October.
M. Bruno and W. Easterly (1998), ‘Inflation Crises and Long Run Growth’, Journal ofMonetary Economics, Vol. 41, pp.3-26.
K. Deininger and L. Squire (1996), ‘A New Data Set Measuring Income Inequalities’, WorldBank Economic Review, Vol. 10, pp.565-591.
S. Edwards (1996), ‘Why are Latin America’s Savings Rates so Low? An InternationalComparative Analysis’, Journal of Development Economics, Vol 51, pp.5-44.
M. Friedman (1971), ‘Government Revenue from Inflation’, Journal of Political Economy,Vol.79, pp.846-856.
M. Fry (1995), Money, Interest and Banking in Economic Development, Baltimore MD: JohnHopkins University Press.
I.B. Kravis (1960), ‘International Differences in the Distribution of Income’, Review ofEconomics and Statistics, Vol. 42, pp.408-416.
S. Kuznets (1966), Economic Growth and Structure, London: Heinemann.
N. Leff (1969), ‘Dependency Rates and Savings Rates’, American Economic Review, Vol. 59,pp.886-896.
R. Levine and D. Renelt (1992), ‘A Sensitivity Analysis of Cross-Country GrowthRegressions’, American Economic Review, Vol. 82, pp.942-963.
F. Modigliani (1970), ‘The Life Cycle Hypothesis of Saving and Intercountry Differences inthe Savings Ratio’ in W. Eltis et al. (eds.), Induction, Trade and Growth: Essays inHonour of Sir Roy Harrod, Oxford: Oxford University Press.
F. Modigliani and R. Brumberg (1954), ‘Utility Analysis and the Consumption Function: AnIntegration of Cross Section Data’ in K.K. Kurihara (ed.), Post-Keynesian Economics,New Brunswick NJ: Rutgers University Press.
E. Paukert (1973), ‘Income Distribution at Different Levels of Development: A Survey ofEvidence’, International Labour Review, Vol. 106, pp.97-125.
M. Sarel (1996), ‘Nonlinear Effects of Inflation on Economic Growth’, IMF Staff Papers, Vol.43, pp.199-215.
A.P. Thirlwall (1974a), Inflation, Saving and Growth in Developing Economies, London:Macmillan.
A.P. Thirlwall (1974b), ‘Inflation and the Savings Ratio Across Countries’, Journal ofDevelopment Studies, Vol. 10, pp.154-174.

20
F. Warman and A.P. Thirlwall (1994), ‘Interest Rates, Saving, Investment and Growth inMexico 1960-90: Tests of the Financial Liberalisation Hypothesis’, Journal ofDevelopment Studies, Vol. 30, pp.629-649.

21
Table 1
The Average Domestic Savings Ratio for 62 Countries over the Period 1967-1995
Country Savings Ratio % Per Capita Income US$
1. Algeria2. Argentina3. Benin4. Brazil5. Borkina Faso6. Cameroon7. Canada8. Central African Rep9. Chile10. Colombia11. Congo Dem. Rep.12. Congo Rep.13. Costa Rica14. Cote d’Ivoire15. Denmark16. Dominican Rep17. Ecuador18. Egypt19. El Salvador20. Fiji21. Finland22. Gambia23. Ghana24. Guatemala25. Guyana26. Honduras27. Israel28. India29. Jamaica30. Japan31. Kenya32. Korea33. Madagascar34. Malawi35. Malaysia36. Mauritania37. Mauritius38. Mexico39. Morocco40. Nepal41. Nicaragua42. Niger43. Nigeria
33.523.02.9
21.72.0
19.523.02.4
20.219.610.820.319.522.020.815.920.613.19.8
17.525.73.67.0
11.519.116.622.719.519.633.520.027.13.89.8
31.511.920.221.314.99.27.66.3
20.0
24723599344
1737235841
13324458
16231020239907
16081023
17519760
1064671950
168914947
266427889517881
17252296
143117161
3442521285152
1746516
15161720749167
1432403309

22
44. Pakistan45. Paraguay46. Peru47. Philippines48. Rwanda49. Saudi Arabia50. Senegal51. Sierra Leone52. Singapore53. South Africa54. Thailand55. Togo56. Trinidad and Tobago57. Tunisia58. Turkey59. USA60. Uruguay61. Venezuela62. Zambia
10.217.821.021.11.6
41.46.04.8
35.827.026.318.128.523.615.317.916.730.022.5
279872319588294
7181685232
68422572862398
401611041443
1710622842940371
Source: World Development Indicators, 1998.

23
Table 2
Absolute Income Hypothesis
Cross Section:
)3.6()2.18(
)(37.366597.23 1�� PYYS
(3)
R2 = 0.40* Obs = 62
Panel with fixed effects:
)2.15()6.41()(36.593673.27 1�
� PYYS (4)
R2 = 0.70* Obs = 1798

24
Table 3
Life Cycle Hypothesis
Cross Section:
)8.3()5.4()(11.225.10 GYS �
(5)
R2 = 0.20* Obs = 62
)2.1()4.4()8.5()(54.1)(14.231.18 POPGGPCYYS ��
(6)
R2 = 0.33* Obs = 61
)3.3()8.5()0.8()(49.1)(20.324386.17 1 GPYYS ��
�
(7)
R2 = 0.49* Obs = 62
)5.0()7.3()6.4()9.6()(51.0)(61.1)(83.277902.19 1 POPGGPCYPYYS ���
�
(8)
R2 = 0.51* Obs = 61
Panel with fixed effects:
)8.9()6.87()(31.076.16 GYS �
(9)
R2 = 0.71* Obs = 1798
)5.6()9.6()5.25()(51.1)(19.084.13 POPGGPCYYS ��
(10)
R2 = 0.68* Obs = 1769
)4.7()1.13()1.37()(23.0)(02.536195.25 1 GPYYS ��
�
(11)
R2 = 0.71* Obs = 1798
)4.6()6.4()8.14()6.28()(39.1)(12.0)(37.538225.23 1 POPGGPCYPYYS ���
�
(12)
R2 = 0.72* Obs = 1769

25
Table 4
Real Interest Rate
Cross Section:
)5.0()2.7()(15.01.19 RYS �
(13)
R2 = 0.01 Obs = 22
)1.1()7.3()0.9()(29.0)(59.525748.27 1 RPYYS ��
�
(14)
R2 = 0.12 Obs = 22
Panel with fixed effects:
)1.5()2.78()(13.050.20 RYS �
(15)
R2 = 0.83* Obs = 396
)1.5()6.3()8.17()(13.0)(81.431159.25 1 RPYYS ��
�
(16)
R2 = 0.84* Obs = 396

26
Table 5
Quasi-Liquid Liabilities
Cross Section:
)9.4()9.9()(24.033.13 QLLYS �
(17)
R2 = 0.29* Obs = 62
)1.3()8.4()1.11()(14.0)(70.286185.19 1 QLLPYYS ��
�
(18)
R2 = 0.48* Obs = 62
)4.2()4.2()7.4()1.7()(14.1)(11.0)(24.274020.16 1 GQLLPYYS ���
�
(19)
R2 = 0.53* Obs = 62
)1.3()8.1()1.3()1.5()1.3(
)(48.3)(90.0)(17.0)(3.298225.10 1 POPGGPCYQLLPYYS �����
(20)
R2 = 0.57* Obs = 62
Panel with fixed effects:
)1.4()6.97()(18.052.17 QLLYS �
(21)
R2 = 0.66* Obs = 1798
)3.3()9.14()3.40()(14.0)(73.584831.27 1 QLLPYYS ��
�
(22)
R2 = 0.70* Obs = 1798
)5.7()5.3()4.13()9.35()(23.0)(15.0)(36.526149.25 1 GQLLPYYS ���
�
(23)
R2 = 0.71* Obs = 1798
)7.5()2.6()0.4()5.12()9.24()(03.1)(20.0)(23.0)(1.501942.22 1 POPGGPCYQLLPYYS ����
�
(24)
R2 = 0.72* Obs = 1736

27
Table 6
Inflation
Panel with fixed effects:
)1.2()3.2()2.98()(35.0)(95.072.17 2����YS (25)
R2 = 0.68* Obs = 1595
)1.3()6.3()6.15()3.37()(47.0)(13.0)(55.756997.29 21 ����� �PYYS (26)
R2 = 0.72* Obs = 1595
)3.2()8.7()6.3()0.4()5.13()2.27()(40.0)(25.0)(53.0)(15.0)(59.665362.26 21 QLLGPYYS ������� �
(27)
R2 = 0.74* Obs = 1595
)4.2()8.5()6.6()7.3()1.4()7.12()3.20()(43.0)(34.1)(22.0)(54.0)(15.0)(3.639768.23 21 QLLPOPGGPCYPYYS �������� �
R2 = 0.75* Obs = 1540 (28)
28
Table 7
Tax Ratio
Panel with fixed effects:
)0.3()8.94()(76.091.21 TRYS �
(29)
R2 = 0.65* Obs = 552
)4.2()3.9()5.28()(56.0)(51.1106664.32 1 TRPYYS �� �
(30)
R2 = 0.71* Obs = 552
)9.5()7.4()8.3()0.7()9.15()(14.0)(25.0)(86.0)(00.819368.24 1 QLLGTRPYYS ���� �
(31)
R2 = 0.74* Obs = 552
)5.5()3.0()7.4()9.2()7.6()3.13()(14.0)(23.0)(25.0)(70.0)(99.812870.25 1 QLLPOPGGPCYTRPYYS ����� �
R2 = 0.74* Obs = 529 (32)
)0.2()7.2()0.6()4.5()9.3()7.7()2.16()(97.0)(80.0)(14.0)(29.0)(86.0)(92.912314.25 21 �������� � QLLGTRPYYS
R2 = 0.75* Obs = 552 (33)
)9.1()6.2()6.5()(94.0)(77.0)(14.0
)2.0()4.5()0.3()4.7()5.13()(12.0)(30.0)(71.0)(80.905404.26
2
1
�����
���� �
QLL
POPGGPCYTRPYYS
(34)
R2 = 0.75* Obs = 529

29
Figure 1
Average Savings Rat io and Average Per Capi ta Income: 1967-95s
av
ing
s r
ati
o (
%)
per capi ta income (US$)0 1000 2000 3000 4000 5000 20000
/\\/1500010000
0
10
20
30
40

30
Figure 2
1b
1 1b/a0P C Y
S/Y

31
APPENDIX
This appendix discusses variable definitions, where the data source is the World Bank CD(World Development Indicators, 1998).
Gross domestic savings (% of GDP)Gross domestic savings are the difference between GDP and total consumption.
Tax revenue (% of GDP)Tax revenue comprises compulsory, unrequited, nonrepayable receipts for public purposescollected by central governments. It includes interest collected on tax arrears and penaltiescollected on nonpayment or late payments of taxes and is shown net of refunds and othercorrective transactions.
Real interest rate (%)Real interest rate is the deposit interest rate less the rate of inflation measured by the GDPdeflator. Deposit interest rate is the rate paid by commercial or similar banks for demand,time, or savings deposits.
Money and quasi money (M2) as % of GDPMoney and quasi money comprise the sum of currency outside banks, demand deposits otherthan those of the central government, and the time, savings, and foreign currency deposits ofresident sectors other than the central government.
Inflation, GDP deflator (annual %)Inflation as measured by the annual growth rate of the GDP implicit deflator. GDP implicitdeflator measures the average annual rate of price change in the economy as a whole.
Real GDPReal GDP is estimated using data for GDP at market prices (constant 1987 US$). Dollarfigures for GDP are converted from domestic currencies using 1987 official exchange rates.For a few countries where the official exchange rate does not reflect the rate effectivelyapplied to actual foreign exchange transactions, an alternative conversion factor is used.
Quasi-liquid liabilities (% of GDP)Quasi-liquid liabilities are the sum of currency and deposits in the central bank (M0), plustime and savings deposits, foreign currency transferable deposits, certificates of deposit, andsecurities repurchase agreements, plus travellers’ checks, foreign currency time deposits,commercial paper, and shares of mutual funds or market funds held by residents. They equalthe M3 money supply less transferable deposits and electronic currency (M1).
Distribution of incomeDistribution of income measures the percentage share of income received by the richest 10percent of population.
PopulationTotal population is based on the de facto definition of population, which counts all residentsregardless of legal status or citizenship. Refugees not permanently settled in the country ofasylum are generally considered to be part of the population of their country of origin.

32
Domestic credit provided by banking sector (% of GDP)Domestic credit provided by the banking sector includes all credit to various sectors on agross basis, with the exception of credit to the central government, which is net. The bankingsector includes monetary authorities and deposit money banks, as well as other bankinginstitutions where data are available (including institutions that do not accept transferabledeposits but do incur such liabilities as time and savings deposits). Examples of other bankinginstitutions are savings and mortgage loan institutions and building and loan associations.
Related Documents


