Explaining Changes in Extreme U.S. Climate Events Gerald A. Meehl Julie Arblaster, Claudia Tebaldi

Explaining Changes in Extreme U.S. Climate Events Gerald A. Meehl Julie Arblaster, Claudia Tebaldi.
Dec 22, 2015
Welcome message from author
This document is posted to help you gain knowledge. Please leave a comment to let me know what you think about it! Share it to your friends and learn new things together.
Transcript
Explaining Changes in Extreme U.S. Climate Events
Gerald A. Meehl
Julie Arblaster, Claudia Tebaldi
“Explaining changes” implies attributing those changes to some cause
There are few attribution studies to date for changes of extremes
Typically the candidates are natural factors (inherent variability, volcanoes and solar), or anthropogenic (GHGs, aerosols, ozone)
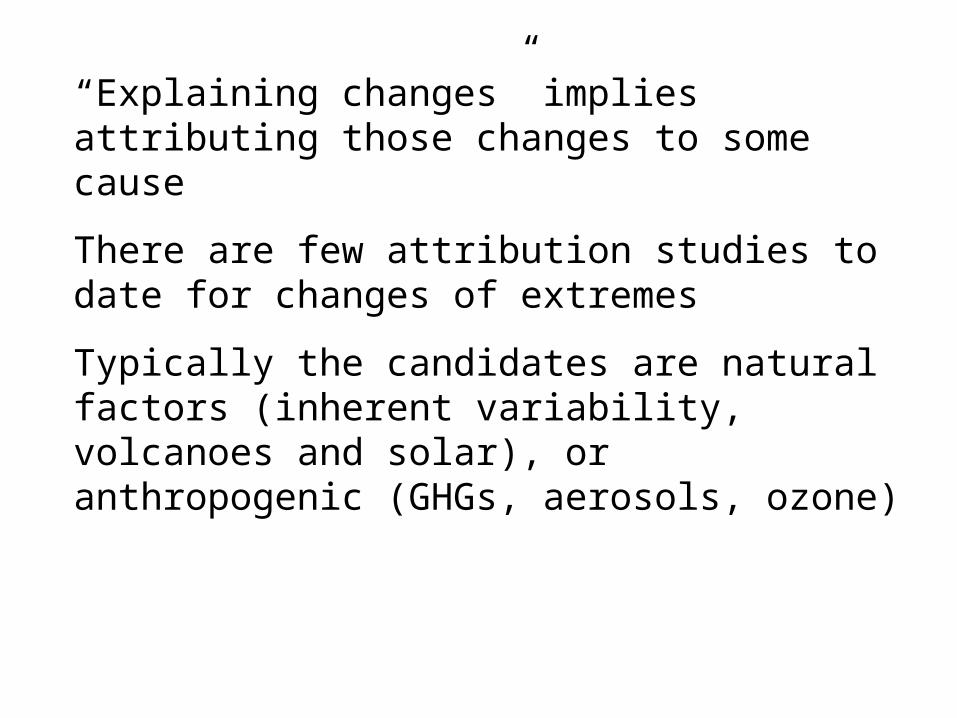
Natural forcings do not fully explain observed late 20th century warming
(uncertainty in climate model response is reduced by demonstrating that 20th century
temperatures are directly related to the relevant forcings)• Climate models with
only “natural” forcings (volcanic and solar) do not reproduce observed late 20th century warming
• When increases in anthropogenic greenhouse gases and sulfate aerosols are included, models are able reproduce observed late 20th century warming
Meehl, G.A., W.M. Washington, C. Ammann, J.M. Arblaster, T.M.L. Wigley, and C. Tebaldi, 2004: Combinations of natural and anthropogenic forcings and 20th century climate. J. Climate, 17, 3721-3727.
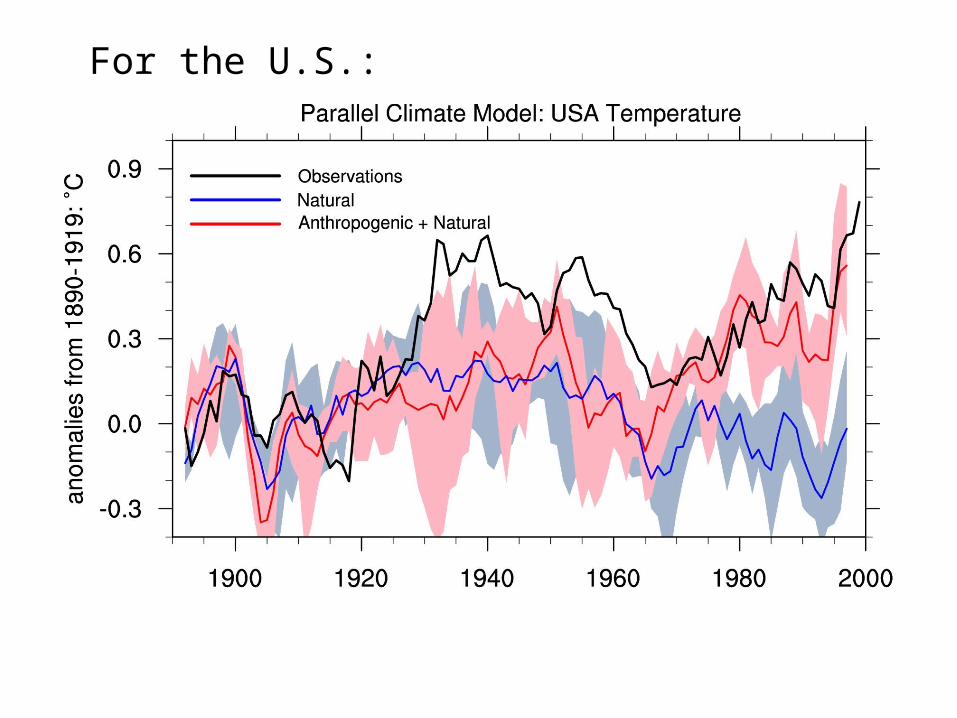
For the U.S.:
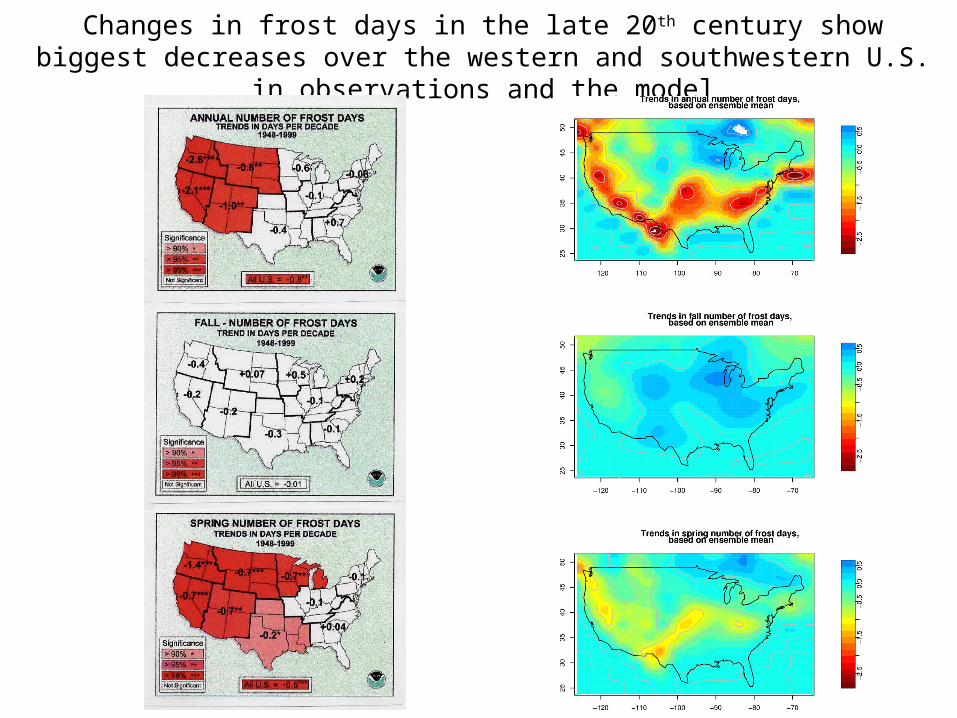
Changes in frost days in the late 20th century show biggest decreases over the western and southwestern U.S. in observations and the model
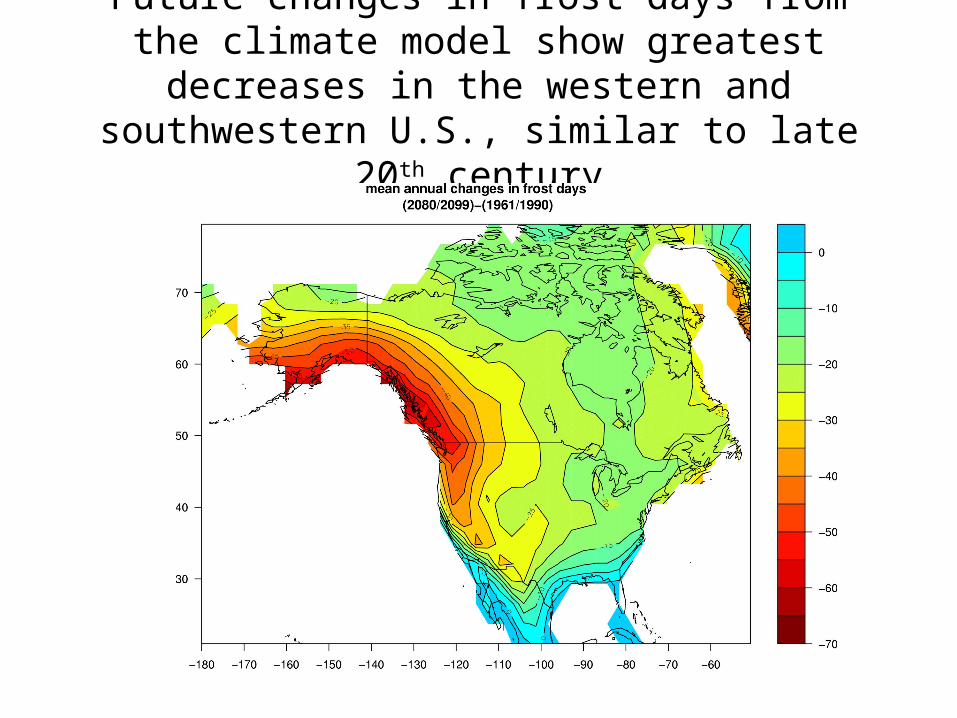
Future changes in frost days from the climate model show greatest decreases in the western
and southwestern U.S., similar to late 20th century
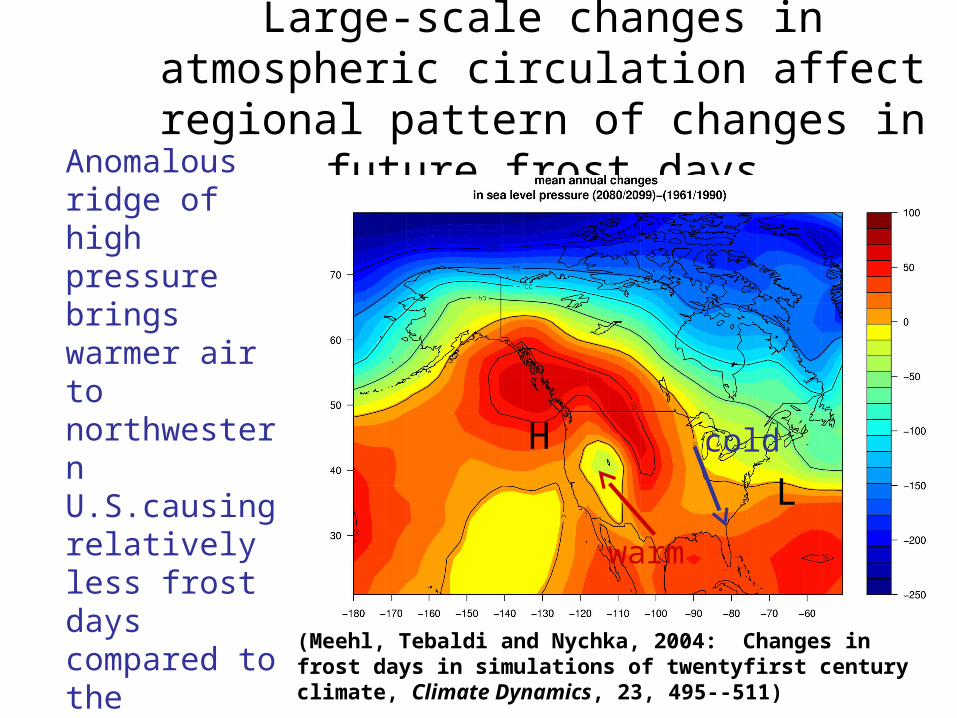
Large-scale changes in atmospheric circulation affect regional pattern of
changes in future frost days
H
L
Anomalous ridge of high pressure brings warmer air to northwestern U.S.causing relatively less frost days compared to the northeastern U.S. where an anomalous trough brings colder air from north
cold
warm
(Meehl, Tebaldi and Nychka, 2004: Changes in frost days in simulations of twentyfirst century climate, Climate Dynamics, 23, 495--511)
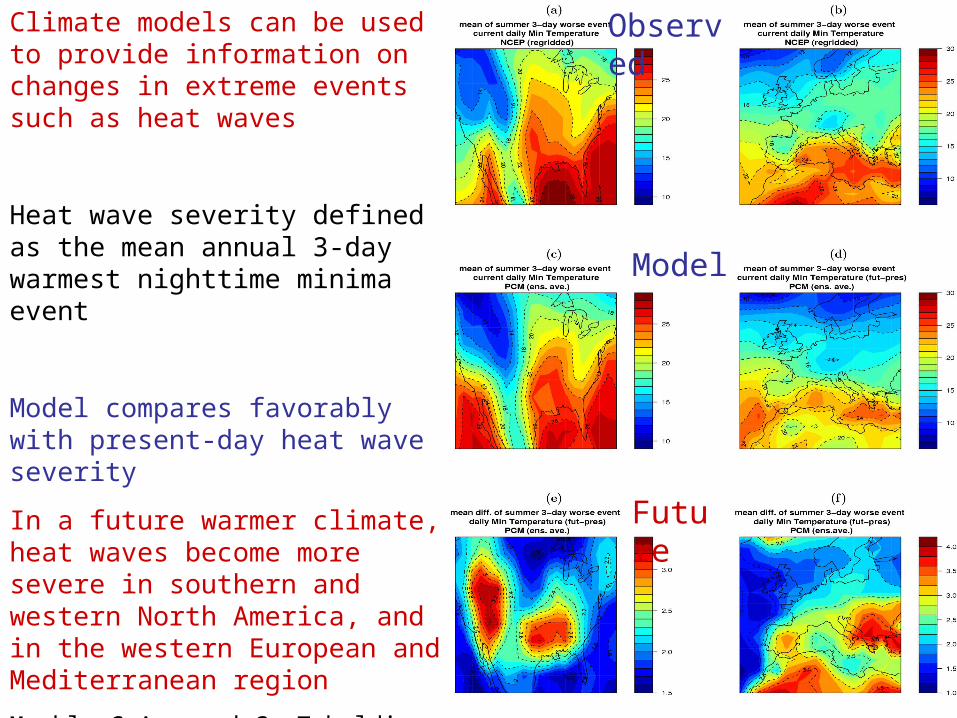
Climate models can be used to provide information on changes in extreme events such as heat waves
Heat wave severity defined as the mean annual 3-day warmest nighttime minima event
Model compares favorably with present-day heat wave severity
In a future warmer climate, heat waves become more severe in southern and western North America, and in the western European and Mediterranean region
Meehl, G.A., and C. Tebaldi, 2004: More intense, more frequent and longer lasting heat waves in the 21st century. Science, 305, 994--997.
Observed
Model
Future
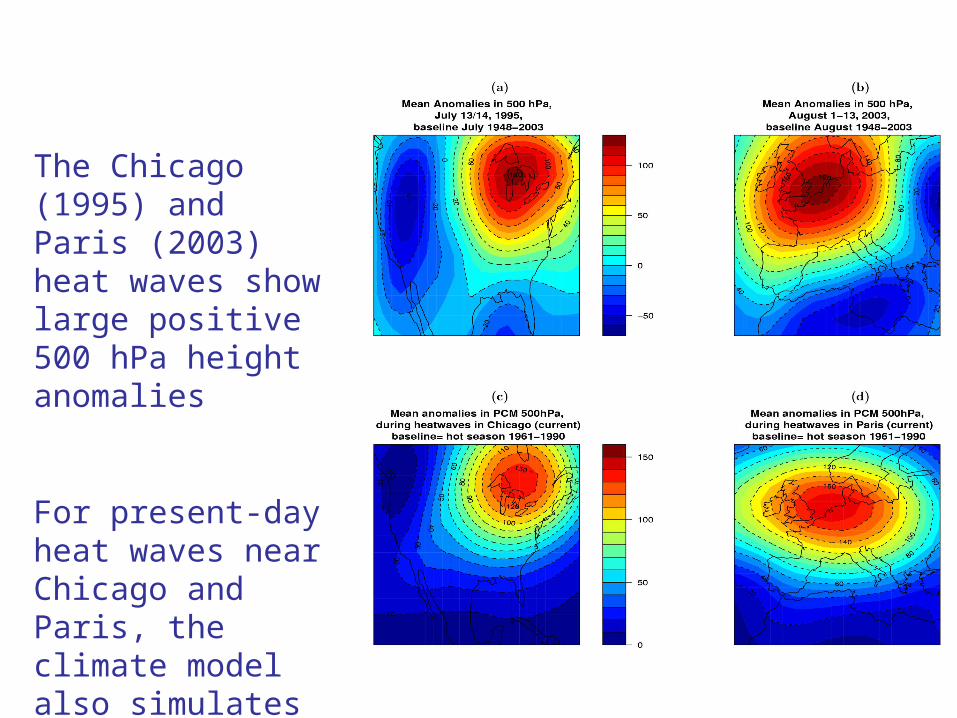
The Chicago (1995) and Paris (2003) heat waves show large positive 500 hPa height anomalies
For present-day heat waves near Chicago and Paris, the climate model also simulates large positive 500 hpa height anomalies
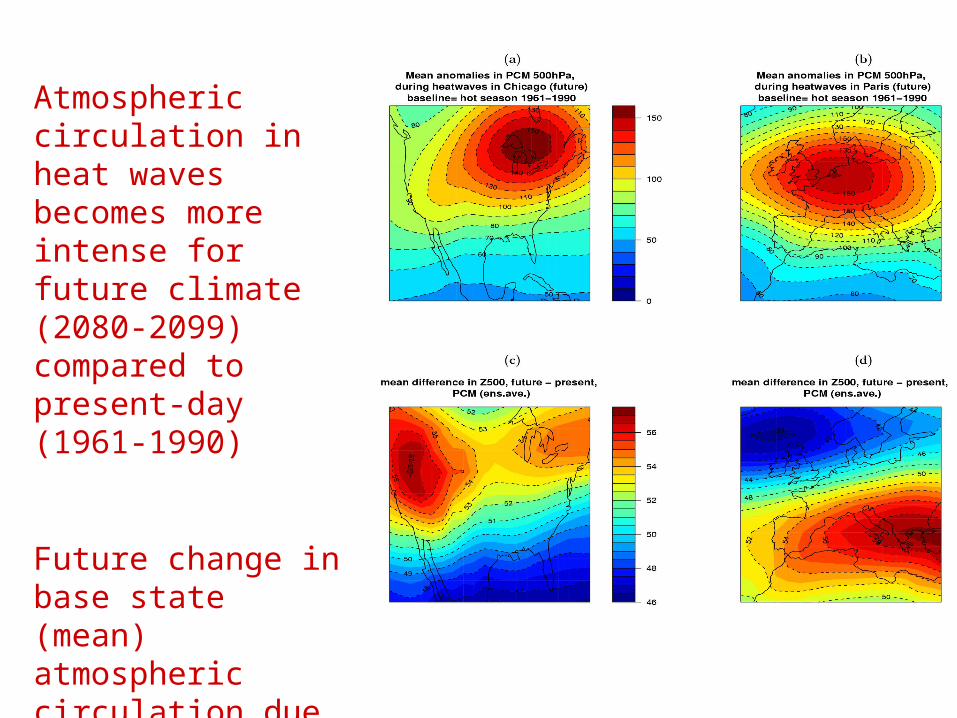
Atmospheric circulation in heat waves becomes more intense for future climate (2080-2099) compared to present-day (1961-1990)
Future change in base state (mean) atmospheric circulation due to increased CO2 is conducive to more intense heat waves
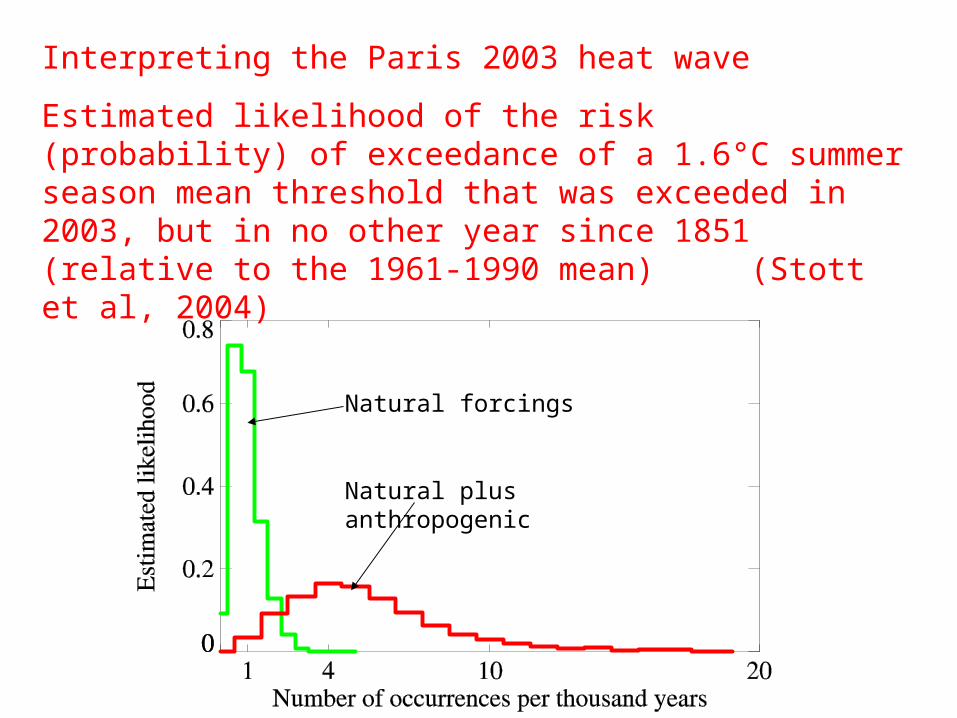
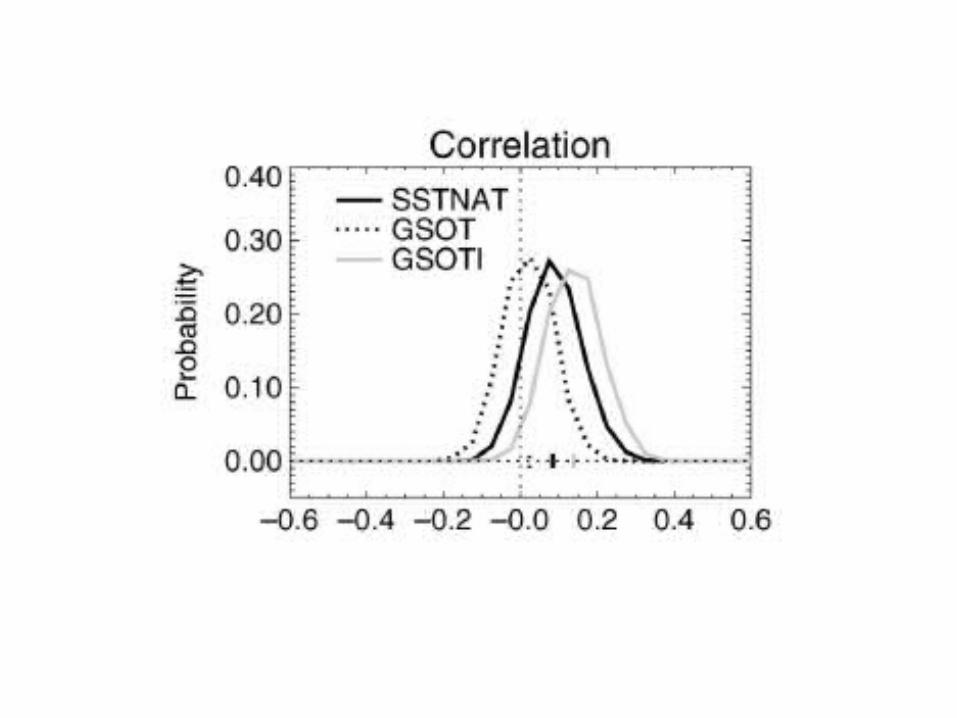
Interpreting the Paris 2003 heat wave
Estimated likelihood of the risk (probability) of exceedance of a 1.6°C summer season mean threshold that was exceeded in 2003, but in no other year since 1851 (relative to the 1961-1990 mean) (Stott et al, 2004)
Natural forcings
Natural plus anthropogenic
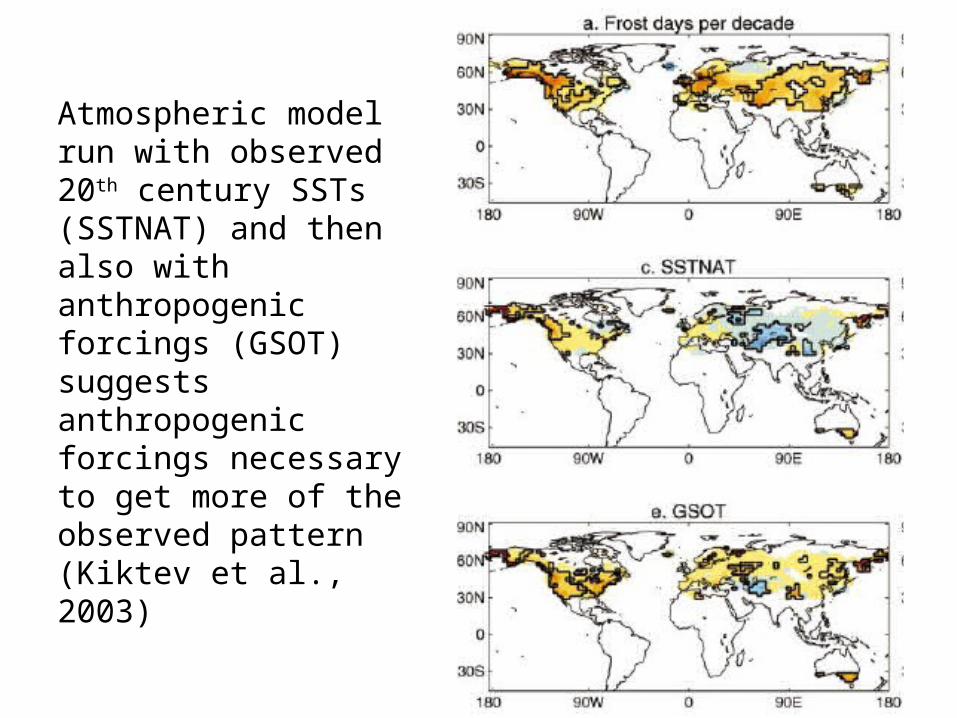
Atmospheric model run with observed 20th century SSTs (SSTNAT) and then also with anthropogenic forcings (GSOT) suggests anthropogenic forcings necessary to get more of the observed pattern (Kiktev et al., 2003)
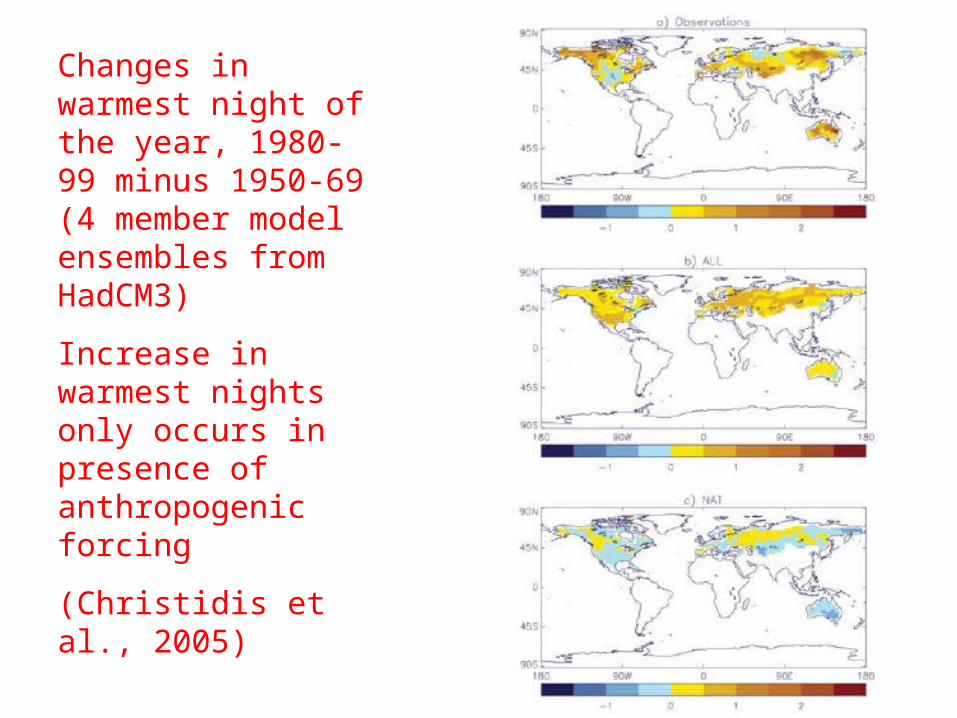
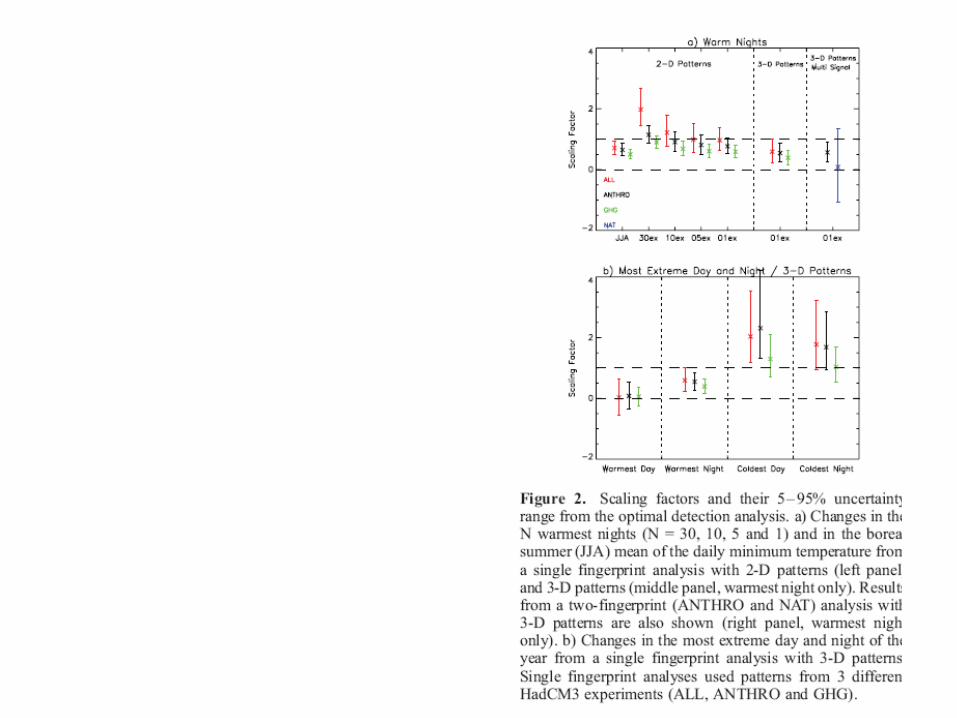
Changes in warmest night of the year, 1980-99 minus 1950-69 (4 member model ensembles from HadCM3)
Increase in warmest nights only occurs in presence of anthropogenic forcing
(Christidis et al., 2005)
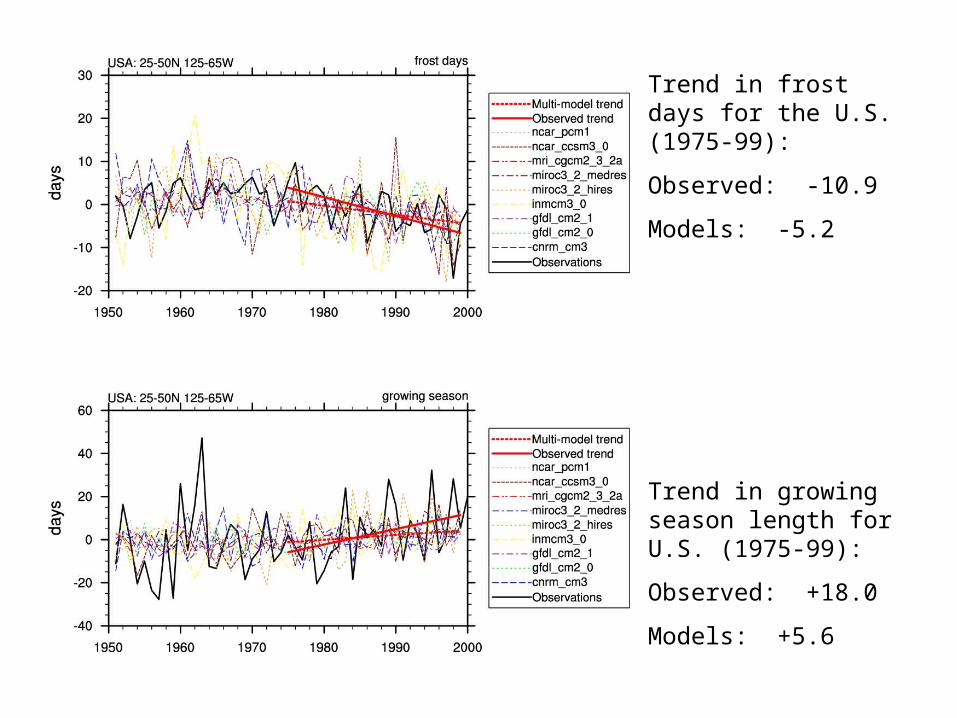
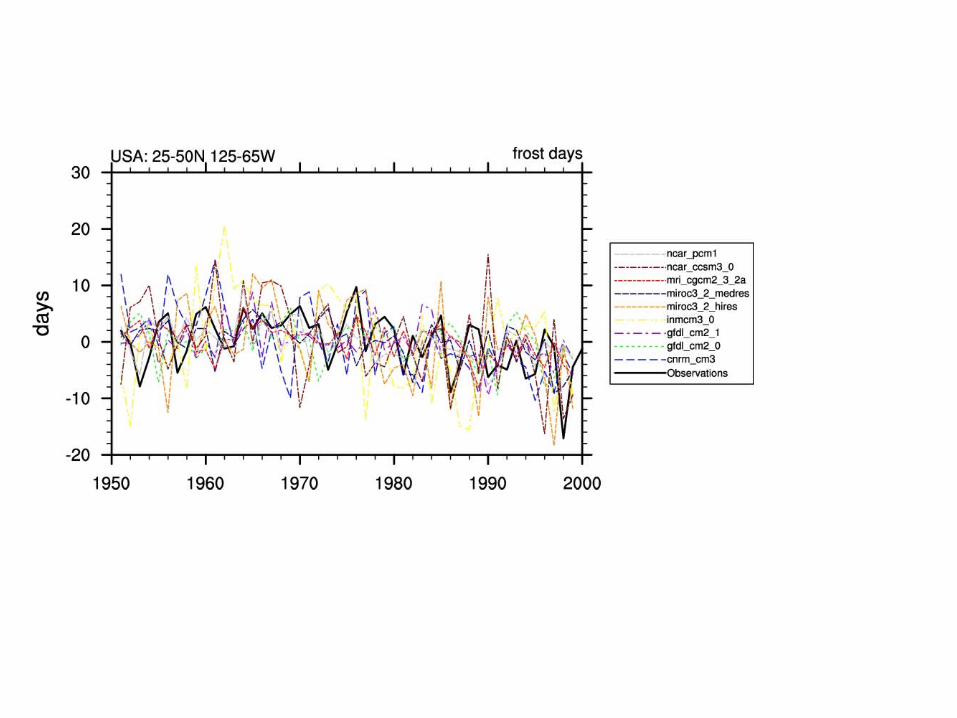
Trend in frost days for the U.S. (1975-99):
Observed: -10.9
Models: -5.2
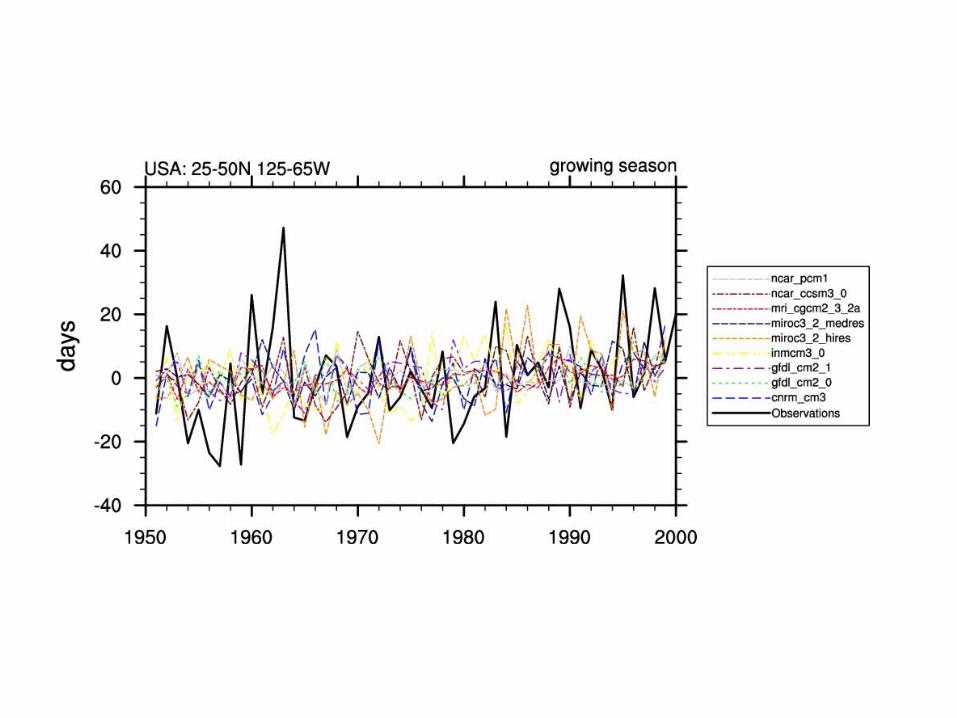
Trend in growing season length for U.S. (1975-99):
Observed: +18.0
Models: +5.6
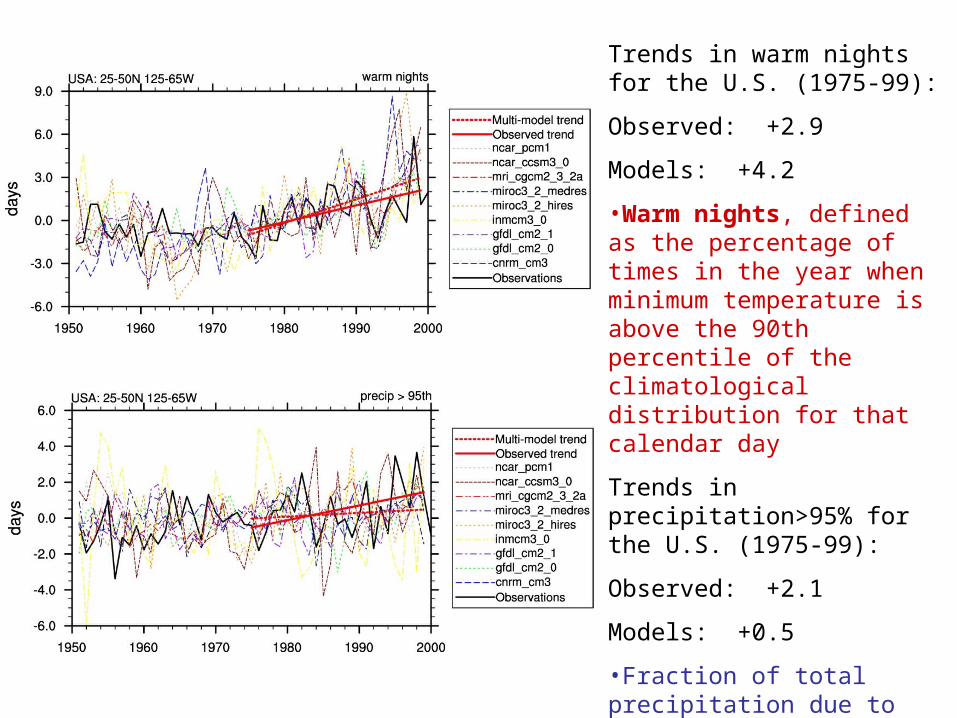
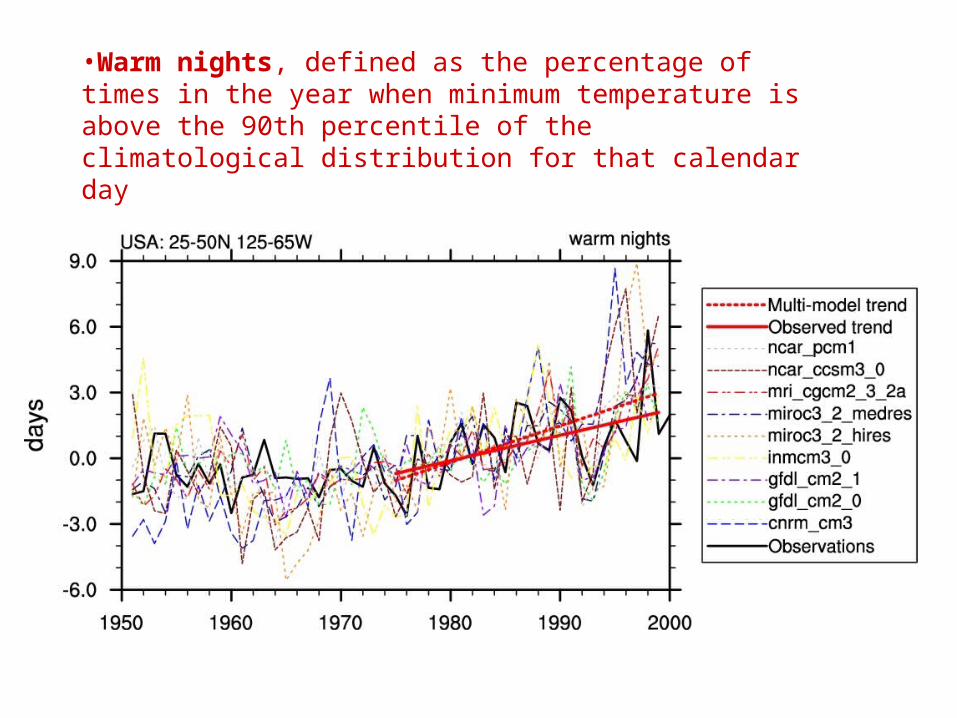
Trends in warm nights for the U.S. (1975-99):
Observed: +2.9
Models: +4.2
•Warm nights, defined as the percentage of times in the year when minimum temperature is above the 90th percentile of the climatological distribution for that calendar day
Trends in precipitation>95% for the U.S. (1975-99):
Observed: +2.1
Models: +0.5
•Fraction of total precipitation due to events exceeding the 95th percentile of the climatological distribution for wet day amounts
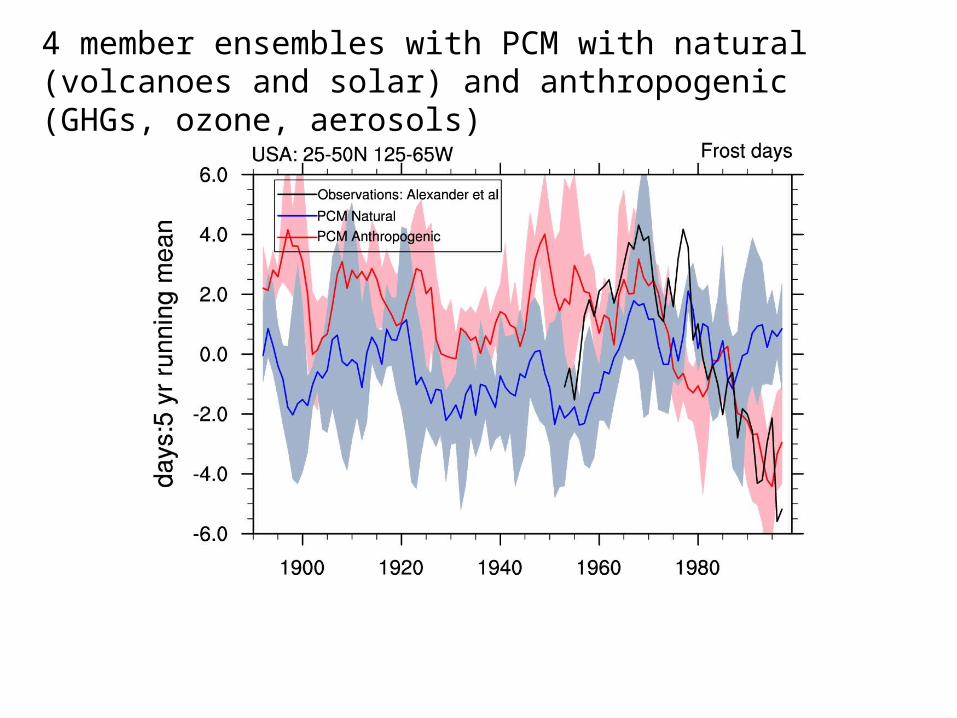
4 member ensembles with PCM with natural (volcanoes and solar) and anthropogenic (GHGs, ozone, aerosols)
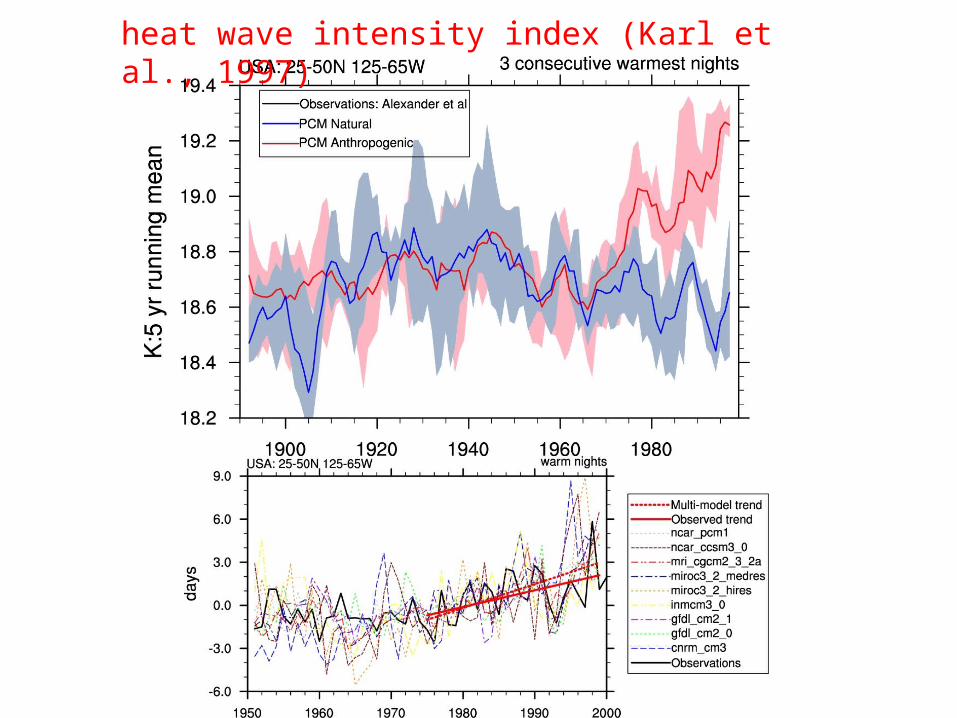
heat wave intensity index (Karl et al., 1997)
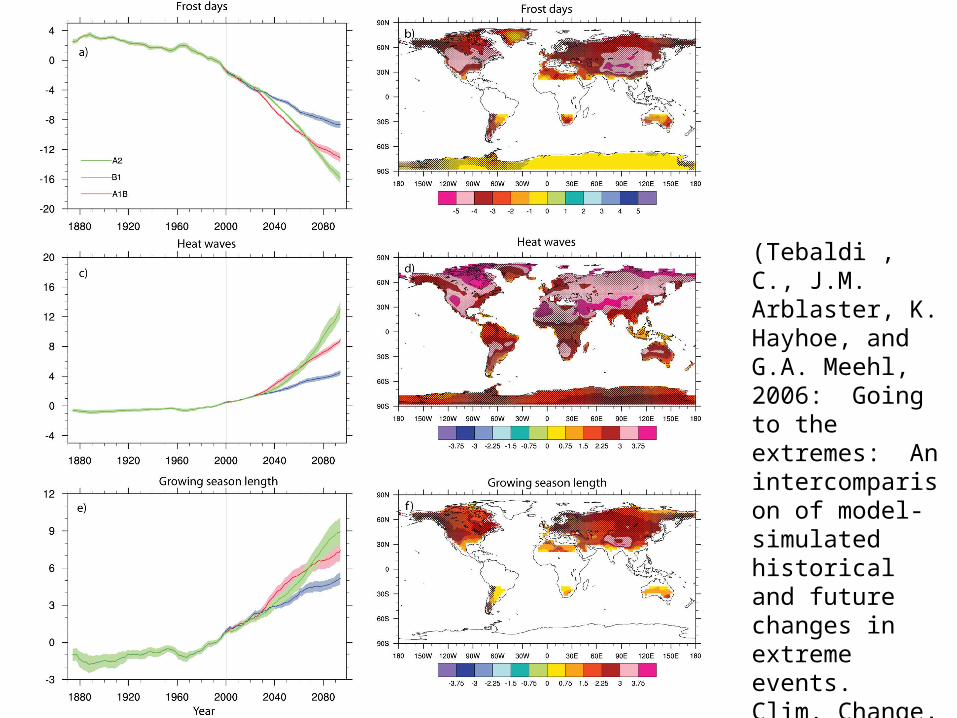
(Tebaldi , C., J.M. Arblaster, K. Hayhoe, and G.A. Meehl, 2006: Going to theextremes: An intercomparison of model-simulated historical and future changes in extreme events. Clim. Change, 79, doi 10.1007/s10584-006-9051-4.)
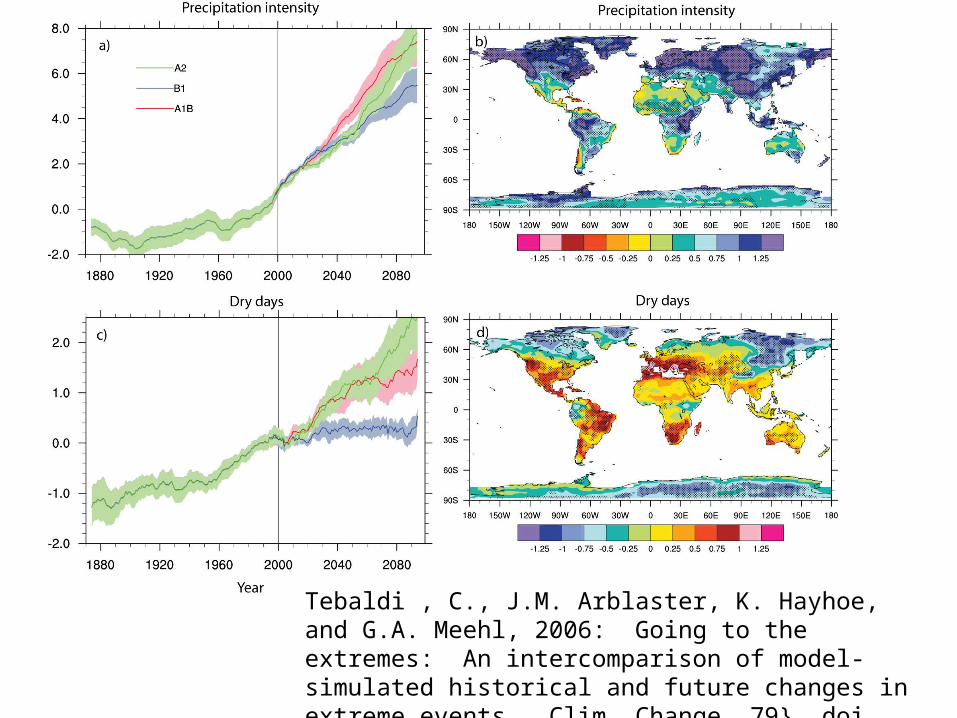
Tebaldi , C., J.M. Arblaster, K. Hayhoe, and G.A. Meehl, 2006: Going to the extremes: An intercomparison of model-simulated historical and future changes in extreme events. Clim. Change, 79}, doi 10.1007/s10584-006-9051-4..
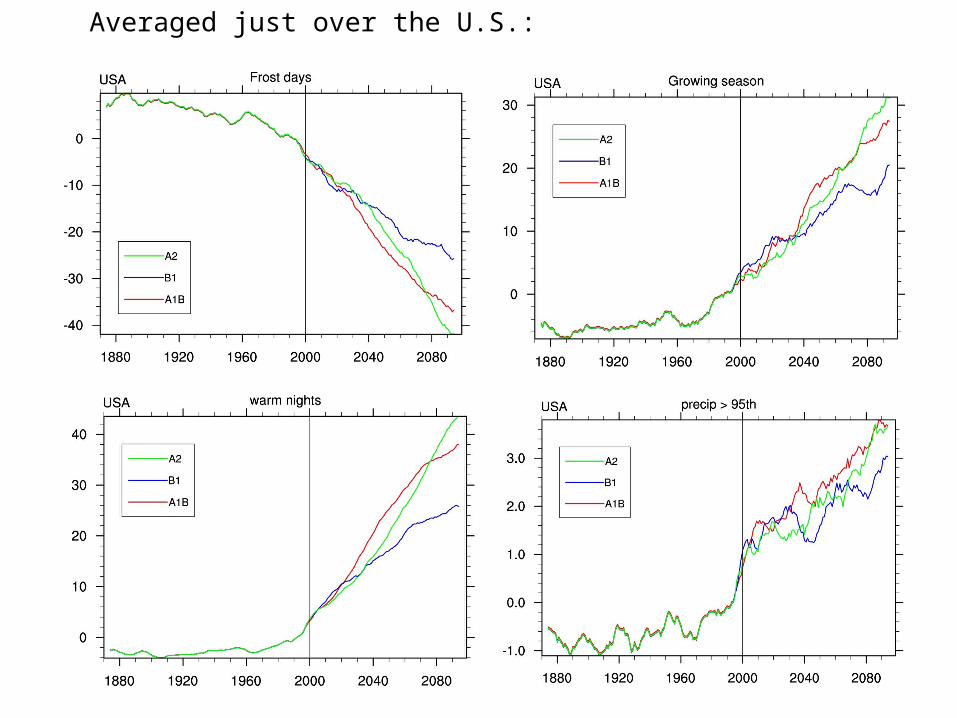
Averaged just over the U.S.:
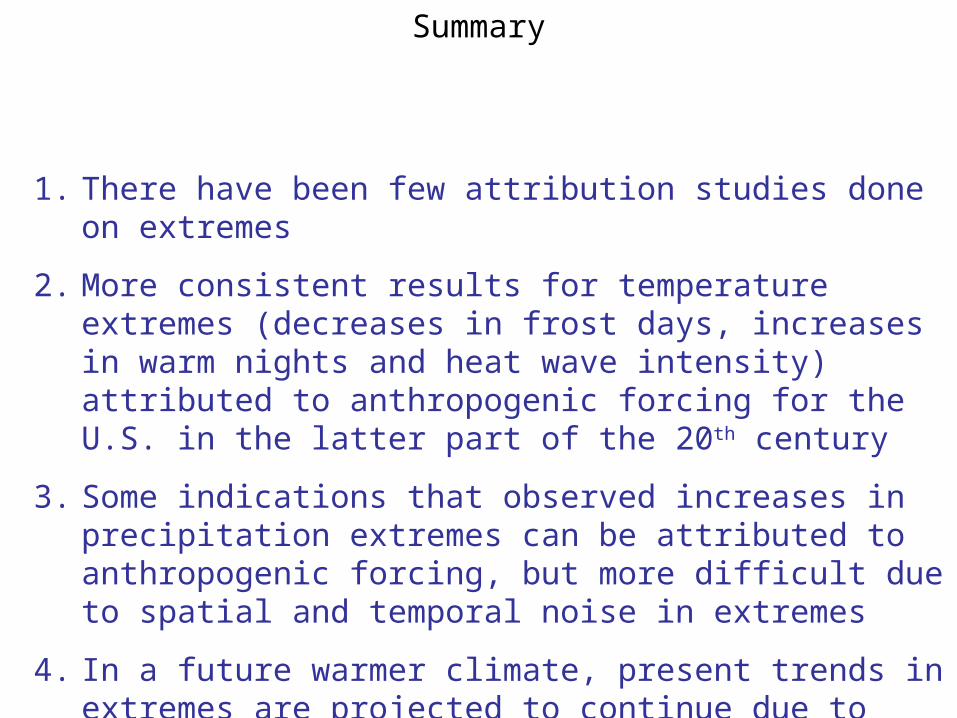
Summary
1. There have been few attribution studies done on extremes
2. More consistent results for temperature extremes (decreases in frost days, increases in warm nights and heat wave intensity) attributed to anthropogenic forcing for the U.S. in the latter part of the 20th century
3. Some indications that observed increases in precipitation extremes can be attributed to anthropogenic forcing, but more difficult due to spatial and temporal noise in extremes
4. In a future warmer climate, present trends in extremes are projected to continue due to increasing anthropogenic forcing

What is the documented evidence for trends in climate
extremes over the U.S.?
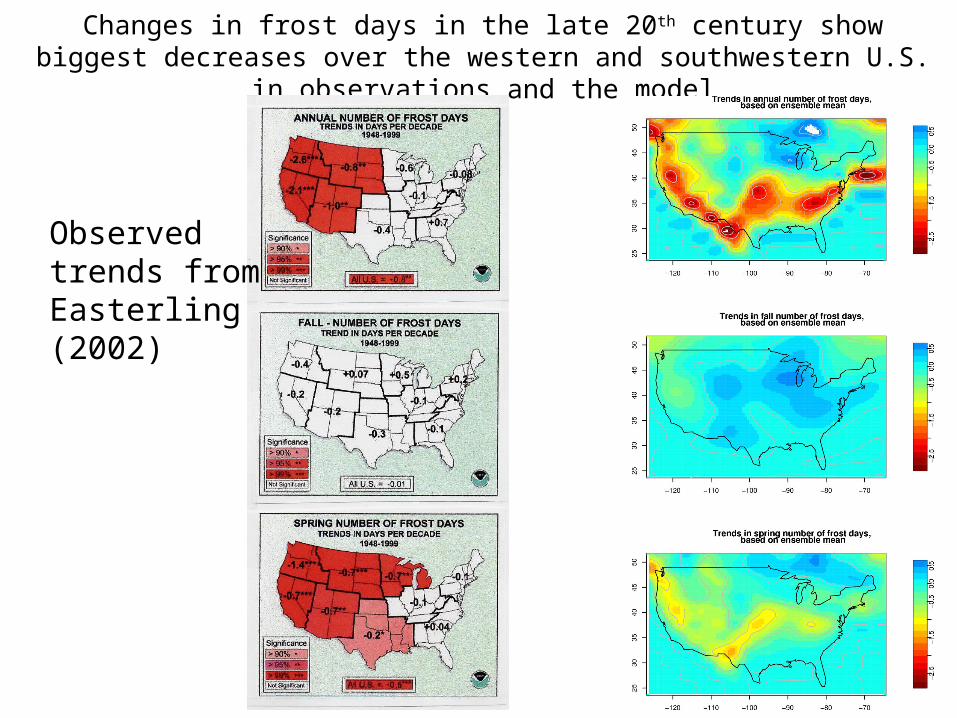
Changes in frost days in the late 20th century show biggest decreases over the western and southwestern U.S. in observations and the model
Observed trends from Easterling (2002)

•Warm nights, defined as the percentage of times in the year when minimum temperature is above the 90th percentile of the climatological distribution for that calendar day
Conclusions
1. Very few extremes attribution studies done to date
2. Even fewer focused on the U.S.

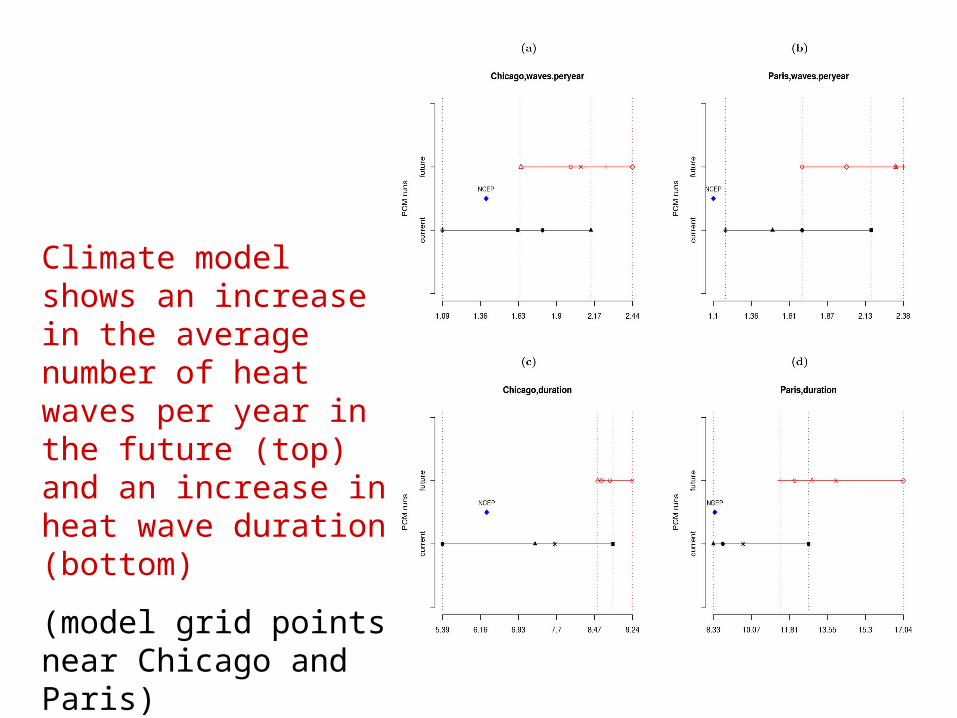
Climate model shows an increase in the average number of heat waves per year in the future (top) and an increase in heat wave duration (bottom)
(model grid points near Chicago and Paris)
Related Documents