Explaining and analyzing audiences: A social cognitive approach to selectivity and media use OSCAR PETERS, MATTHIAS RICKES, SVEN JÖCKEL, CHRISTIAN VON CRIEGERN and ALEXANDER VAN DEURSEN Abstract This study explored LaRose and Eastin’s (2004) model of media atten- dance, within a European context. It extended the uses and gratifications (U and G) paradigm within the framework of social cognitive theory (SCT) by instituting new operational measures of gratifications sought, reconstructed as outcome expectations. Although the model of media atten- dance offers some promising steps forward in measuring media selectivity and usage, and to some extent is applicable to another context of media use, the relative importance of outcome expectancies in explaining media usage and selectivity is not fully supported. Keywords: media use, social cognitive theory, uses and gratifications Introduction One of the most prominent research approaches in communication re- search that focuses on media use and selectivity is the U and G approach. Although the descriptive benefits of U and G are very extensive and sig- nificant and may well be sufficient to account for the continued appeal of the approach (McQuail, 2001), the explaining and predicting quality of U and G for media use and selectivity is less pronounced. Also, there is criticism about the measurement and analysis of retrospective self- reported gratifications (e.g., Babrow, 1988; Messaris, 1977; Hendriks Vettehen and Van Snippenburg, 2002; Peters and Ben Allouch, 2005). Despite attempts to produce a more rigorous and comprehensive theory, several flaws continued to plague the perspective, and U and G fell out of favor with some mass communication scholars for several decades (Ruggiero, 2000). The arrival of new media (especially the Internet) and new uses of existing media have been a stimulus to research, and one of the strengths of the U and G approach came into its own the capacity Communications 31 (2006), 279308 03412059/2006/0310279 DOI 10.1515/COMMUN.2006.019 Walter de Gruyter

Welcome message from author
This document is posted to help you gain knowledge. Please leave a comment to let me know what you think about it! Share it to your friends and learn new things together.
Transcript
Explaining and analyzing audiences: A socialcognitive approach to selectivity and media use
OSCAR PETERS, MATTHIAS RICKES, SVEN JÖCKEL,CHRISTIAN VON CRIEGERN and ALEXANDER VAN DEURSEN
Abstract
This study explored LaRose and Eastin’s (2004) model of media atten-dance, within a European context. It extended the uses and gratifications(U and G) paradigm within the framework of social cognitive theory(SCT) by instituting new operational measures of gratifications sought,reconstructed as outcome expectations. Although the model of media atten-dance offers some promising steps forward in measuring media selectivityand usage, and to some extent is applicable to another context of mediause, the relative importance of outcome expectancies in explaining mediausage and selectivity is not fully supported.
Keywords: media use, social cognitive theory, uses and gratifications
Introduction
One of the most prominent research approaches in communication re-search that focuses on media use and selectivity is the U and G approach.Although the descriptive benefits of U and G are very extensive and sig-nificant and may well be sufficient to account for the continued appealof the approach (McQuail, 2001), the explaining and predicting qualityof U and G for media use and selectivity is less pronounced. Also, thereis criticism about the measurement and analysis of retrospective self-reported gratifications (e. g., Babrow, 1988; Messaris, 1977; HendriksVettehen and Van Snippenburg, 2002; Peters and Ben Allouch, 2005).Despite attempts to produce a more rigorous and comprehensive theory,several flaws continued to plague the perspective, and U and G fell outof favor with some mass communication scholars for several decades(Ruggiero, 2000). The arrival of new media (especially the Internet) andnew uses of existing media have been a stimulus to research, and one ofthe strengths of the U and G approach came into its own � the capacity
Communications 31 (2006), 279�308 03412059/2006/031�0279DOI 10.1515/COMMUN.2006.019 � Walter de Gruyter
280 O. Peters, M. Rickes, S. Jöckel, C. v. Criegern and A.v. Deursen
for comparative analysis of the appeal � for different audiences(McQuail, 2001).
Early U and G researchers tried to explain media use by inventoryingthe consequences of media use that people experienced. These experi-enced gratifications were used to explain media use. Typical for thesegratifications is that the gratifications are the result of media use. Herelies one of the main criticisms of U and G, namely that media use isexplained by the consequences it has for the user. According to HendriksVettehen (1998), a circular argument seemed to have been used: Useleads to desired gratifications, but the desire to receive these gratifica-tions is also the reason for use. A number of media scholars (e. g., Katz,Blumler, and Gurevitch, 1974) stressed the need to distinguish betweenthe motives for media consumption and the gratifications perceived fromthis experience. Greenberg (1974) is one of the first authors who sepa-rated the concept gratification into two different concepts, namely ‘grati-fications sought’ and ‘gratifications obtained’. Rosegren (1974) intro-duced a similar distinction as he called gratification sought ‘motives’,and instead of gratifications obtained he used the concept ‘evaluation’.With the division of the general concept gratification into the concept ofmotives followed by media use and the concept evaluation after mediause, there was no longer a circular argument to explain media use (Hen-driks Vettehen, 1998). By the division of gratification into the two con-cepts, it is now theoretically possible to explain the changes in media useand selectivity by the discrepancy between gratifications sought (mo-tives) and gratifications obtained (evaluation). Unfortunately, severalstudies have shown that the central concept motive is not distinguishablefrom concrete behavior and its social or mental background. Lometti,Reeves, and Bybee (1977) suggested that it is not possible to isolate grati-fications sought and gratifications obtained on an empirical level. Ac-cording to LaRose et al. (2001), attempts made by U and G researchers(e. g., Babrow and Swanson, 1988) to distinguish gratifications from for-mulations involving outcome expectations were to no avail and failed toproduce more robust explanations of media exposure.
Media use and selectivity and social cognitive theory (SCT)
According to LaRose, Mastro, and Eastin (2001), the gratificationssought-gratifications obtained formulation is seemingly indistinguish-able from an important mechanism in SCT (Bandura, 1986); i. e., en-active learning. Enactive learning describes how humans learn from ex-perience. In the social-cognitive view, interactions with the environmentinfluence media exposure by continually reforming expectations aboutthe likely outcomes of future media consumption behavior. Seemingly,
A social cognitive approach to selectivity and media use 281
this represents the same process that describes the relationship amonggratifications sought, media behavior, and gratifications obtained (Palm-green, Wenner, and Rosegren, 1985). According to LaRose et al. (2001),the outcome expectation construct parsimoniously bridges the gulf be-tween gratifications sought and gratifications obtained in U and G research.
According to Stone (1998), SCT stems from social learning theory,which has a rich historical background dating back to the late 1800s. Itsearly foundation was laid by behavioral and social psychologists, and itevolved under the umbrella of behaviorism. Within SCT, human behav-ior is defined as a triadic, dynamic, and reciprocal interaction of per-sonal factors, behavior, and the environment (Bandura, 1986). The tri-adic causal mechanism is mediated by symbolizing capabilities thattransform sensory experiences into cognitive models that guide actions.While there are several versions of SCT to which researchers currentlysubscribe (Stone, 1998), they all share three basic tenets: a) responseconsequences (such as rewards or punishments) influence the likelihoodthat a person will perform a particular behavior again in a given situa-tion (enactive learning); b) humans can learn by observing others (vicari-ous learning) in addition to learning by participating in an act person-ally; and c) individuals are most likely to model behavior observed byothers they identify with.
The comprehensiveness and complexity of the SCT make it somewhatdifficult to operationalize, and many applications of SCT focus on oneor two constructs, such as self-efficacy (e. g., Hofstetter, Zuniga, andDozier, 2001), while ignoring the others (Stone, 1998). Although SCT isa broad theory of human behavior, it has also been applied to media useand selectivity (e. g., Bandura, 2002).
A new model of media attendance
The results of an empirical study by Larose and Eastin (2004) to test anew model of media attendance within the framework of SCT both af-firm the U and G paradigm according to Larose and Eastin (2004) andextend it to a theory of media attendance grounded in SCT. By institut-ing new operational measures of expected gratifications, it was possible,according to Larose and Eastin (2004), to predict media consumption toan unprecedented degree, and new variables from SCT improved theexplanatory power of gratifications, reconstructed as outcome expecta-tions. According to LaRose and Eastin (2004), outcome expectationsreflect current beliefs about the outcomes of prospective future behavior,but are predicated on comparisons between expected incentives and in-centives attained in the past. Outcome expectations, defined as judg-ments of the likely consequences of behavior (Bandura, 1997), provide
282 O. Peters, M. Rickes, S. Jöckel, C. v. Criegern and A.v. Deursen
incentives for enacting behavior, while expectations of aversive outcomesprovide disincentives (Bandura, 1986). According to LaRose et al.(2001), food, drink, and physical contact are primary incentives thatmotivate human behavior from infancy, but adults respond to symbolicincentives as well. These include monetary incentives, social incentives(such as obtaining approval from others), and status incentives. Sensoryincentives involve exposure to pleasing or novel sensations. Preferencesfor enjoyable activities are the basis for activity incentives. There are alsointernal, self-reactive incentives resulting from comparisons of personalactions with standards for behavior.
However, according to LaRose and Eastin (2004), expectations arealso shaped by vicarious learning, based on observations of the experi-ences of others. Another important determinant of behavior accordingto LaRose and Eastin (2004) is self-efficacy, or belief in one’s capabilityto organize and execute a particular course of action (Bandura, 1997).Those who perceive themselves to be highly efficacious with reference toa particular task will invest sufficient levels of effort to achieve successfuloutcomes, whereas those with low levels of self-efficacy will not persist.According to LaRose and Eastin (2004), humans also possess a self-regulatory capability that provides the basis for purposive actionthrough the subfunctions of self-monitoring, judgmental process, andself-reaction (Bandura, 1986, 1991). Self-monitoring is the observationof one’s own actions to provide diagnostic information about the impactof behavior on the self, others, and the environment (Bandura, 1991).The judgmental process compares self-observations of behavior to per-sonal standards, personal or social norms, and the valuation of the activ-ity, particularly when the locus of control for the behavior resides in theindividual. The self-reactive function supplies the behavioral incentivethrough the satisfaction derived from accomplishing an activity thatmeets desired standards (LaRose and Eastin, 2004). Also, habit strengthand deficient self-regulation are expected to influence ongoing behavior.According to LaRose and Eastin (2004), repetition makes us inattentiveto the reasoning behind our media behavior; our mind no longer devotesattention resources to evaluating it, freeing itself for more importantdecisions. Habit should be causally determined by outcome expectations,which precede habit in time. Habit strength should be preceded by self-efficacy, since users are unlikely to be inattentive to behavior they arestill mastering. LaRose and Eastin (2004) defined deficient self-regula-tion as a state in which conscious self-control is diminished. Althoughhabit and deficient self-regulation have not been clearly empirically dis-tinguished in prior research, LaRose, Lin, and Eastin (2003) proposed apossible theoretical distinction, where habit represents the failure of self-monitoring, and deficient self-regulation represents a failure of the judg-
A social cognitive approach to selectivity and media use 283
mental and self-reactive subfunctions. According to LaRose and Eastin(2004), deficient self-regulation reflects a state of mind distinct from onein which media consumers are inattentive, explaining how both mighthave independent effects on media attendance. Habit strength and defi-cient self-regulation should be related by the fact that persons with defi-cient self-control may also be expected to engage in habitual behavior(LaRose and Eastin, 2004).
Examination of the new model of media attendance within a Europeancontext
To empirically examine the strength of the new model of media atten-dance within a European context, a replication of the original study byLarose and Eastin (2004) on Internet usage should first be undertaken,to validate the new model of media attendance to confirm the proposedconnection between U and G and SCT within a European context.
Because a single test of a newly introduced model is more likely to besuccessful due to the proximity of the postulated hypothesis of the pro-posed model to the empirical base, more stringent follow-up tests areneeded. According to Popper (1989: 214), a single test is not sufficientto state the degree of corroboration; successful tests in other contextswill raise the degree of corroboration. Otherwise a situation will occurthat resembles a Sisyphos-Strategy (Opp, 2002: 206), where the numberof isolated models that belong together will increase, but nothing can besaid about their degree of corroboration. To also test the merits of thenew model of media attendance when applied to a different context ofmedia use, other than the Internet, a second study should be undertakento examine whether instituting new operational measures of expectedgratifications also predict media consumption to an unprecedented de-gree in a different context of media use. The joint findings of both studiesshould indicate whether the proposed value of the new variables fromSCT improve the explanatory power of gratifications, reconstructed asoutcome expectations.
A replication of the model of media attendance within a German context
To examine the new model of media attendance (LaRose and Eastin,2004) within a European context, a replication of the original study byLarose and Eastin (2004) on Internet usage was undertaken to validatethe new model of media attendance.
284 O. Peters, M. Rickes, S. Jöckel, C. v. Criegern and A.v. Deursen
Method: Sample and procedures
In order to validate the model of LaRose and Eastin (2004), a test ofthe complete model was carried out among German Internet users. Thesurvey was posted on www.psychologie-onlineforschung.de and www.w-lab.de, and users of these websites were asked to take part in the survey.A sample of n � 179 completed questionnaires was achieved. Becauseof the self-selection and the special focus of the websites on scholars andstudents, the sample was not representative for all Internet users. How-ever, representativeness was not required as we followed a deductiveresearch strategy. The model is considered universally valid for all In-ternet users and should therefore describe any subgroup too. The sampleconsisted of 62.6 % female and 37.4 % male Internet users. Age rangedfrom 21 to 66 years. The mean age was 32.51 (SD � 9.47). The estima-tion of factor loadings and path coefficients was based on unweightedleast squares (ULS), because there were no normal distributions of vari-ables and ULS was recommended for the sample size. The estimationwas executed with AMOS 5.0.
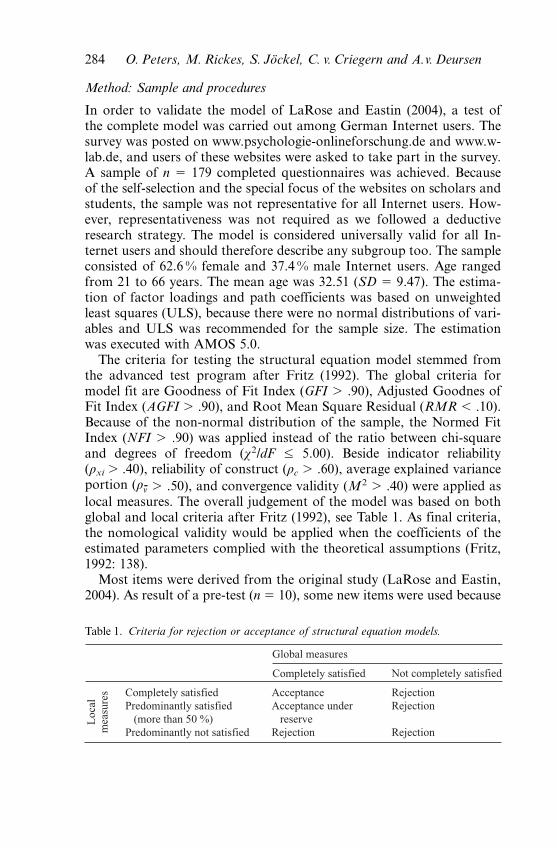
The criteria for testing the structural equation model stemmed fromthe advanced test program after Fritz (1992). The global criteria formodel fit are Goodness of Fit Index (GFI > .90), Adjusted Goodnes ofFit Index (AGFI > .90), and Root Mean Square Residual (RMR < .10).Because of the non-normal distribution of the sample, the Normed FitIndex (NFI > .90) was applied instead of the ratio between chi-squareand degrees of freedom (χ2/dF w 5.00). Beside indicator reliability(ρxi > .40), reliability of construct (ρc > .60), average explained varianceportion (ρ-v > .50), and convergence validity (M2 > .40) were applied aslocal measures. The overall judgement of the model was based on bothglobal and local criteria after Fritz (1992), see Table 1. As final criteria,the nomological validity would be applied when the coefficients of theestimated parameters complied with the theoretical assumptions (Fritz,1992: 138).
Most items were derived from the original study (LaRose and Eastin,2004). As result of a pre-test (n � 10), some new items were used because
Table 1. Criteria for rejection or acceptance of structural equation models.
Global measures
Completely satisfied Not completely satisfied
Completely satisfiedPredominantly satisfied (more than 50 %)Predominantly not satisfied
AcceptanceAcceptance under reserveRejection
RejectionRejection
Rejection
Loc
alm
easu
res
A social cognitive approach to selectivity and media use 285
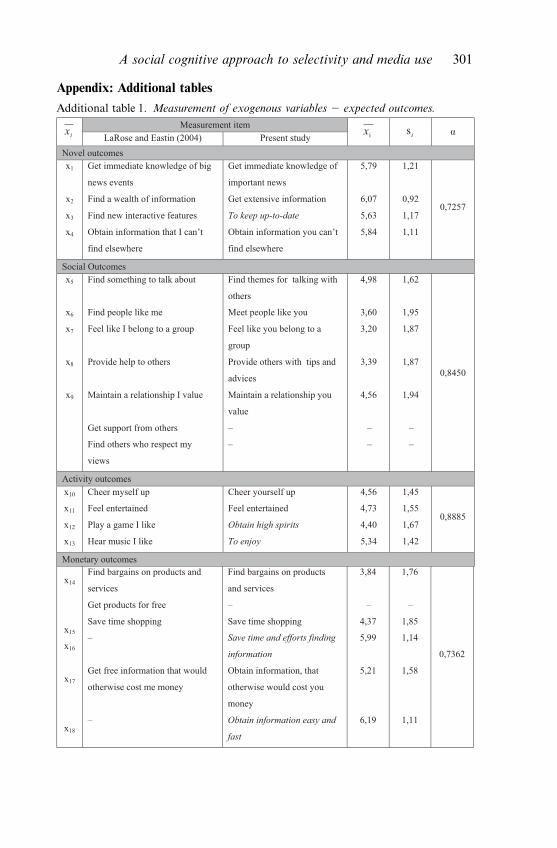
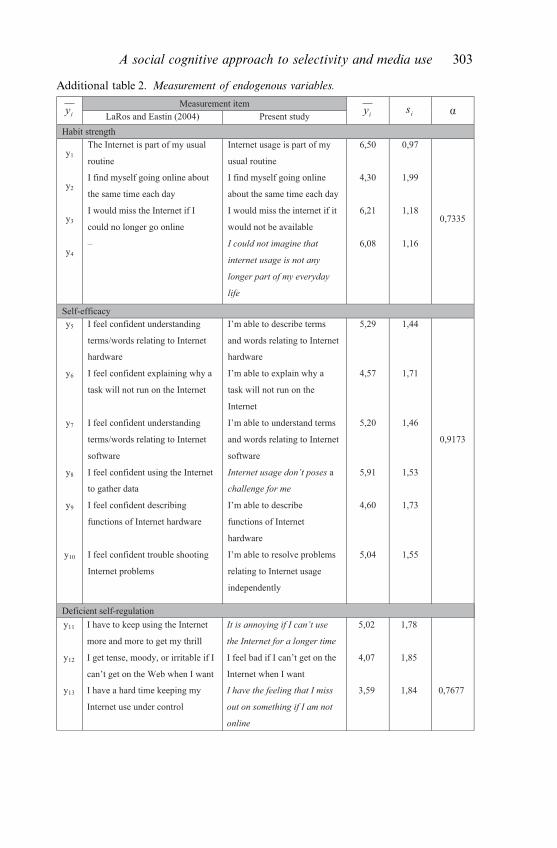
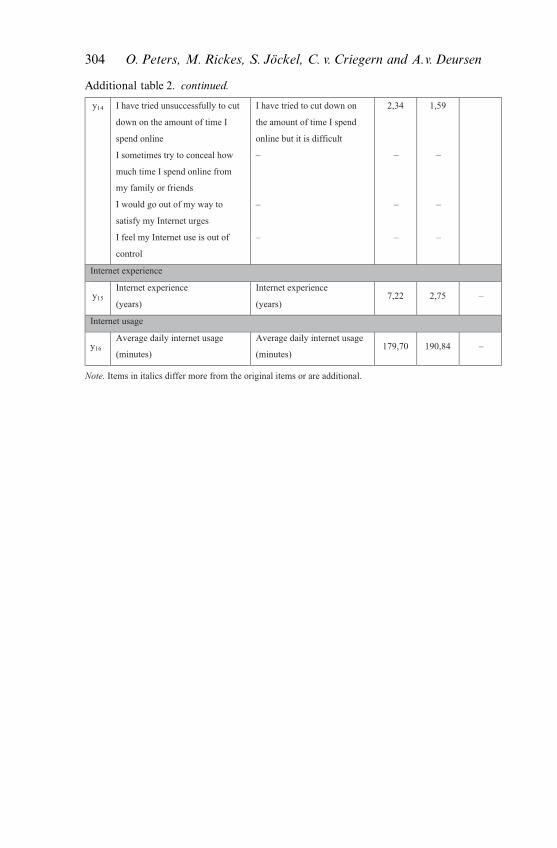
they captured the German language better1. Expected outcomes, self-efficacy, habit strength, and deficient self-regulation were measured onseven-point scales. Internet usage was measured by the sum of two items;i. e., average usage on a typical weekday and average usage on a typicalweekend day. Previous Internet experience was measured in years withone item. All measurement items are reported in additional Tables 1 and2 (see Appendix). These tables also show a direct comparison of theoriginal items with the items used in the present study.
Validation of the measuring model
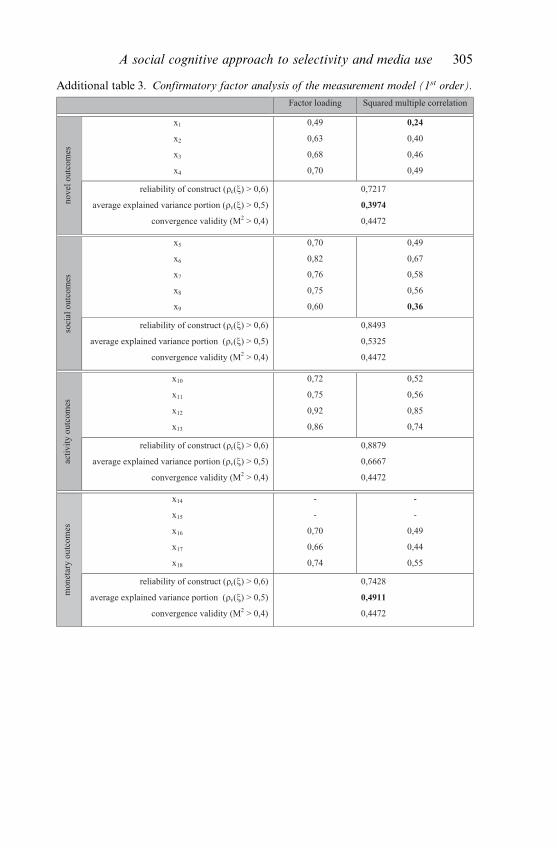
First, a confirmatory factor analysis (1st order) was run to test the struc-ture of expected Internet outcomes. According to SCT, sensory feedbacksdetermine human behavior as behavioral outcomes. News and changesamplify, and in contrast, iteration of events attenuates sensory percep-tion (Bandura, 1986: 233). Pertaining to media use, sensory feedback isconceptualized as novel outcomes (LaRose and Eastin, 2004: 370). Cron-bach’s alpha for the construct of novel outcomes based on four indica-tors was .72. Reliability of the first item ‘get immediate knowledge ofimportant news’ (.24) was too low, but elimination based on item-to-total correlation would decrease alpha. The average explained varianceportion (.39) was below the set point value. The reliability of the con-struct (.72) meets the criteria (Bagozzi and Yi, 1988: 17).
Also, the pursuit of interaction and integration into social groups de-termines media use, which provides social outcomes (Bandura, 1986:235). The social outcomes construct was measured based on five indica-tors (α � .84). Reliability of the construct (.84) and the average explainedvariance portion (.53) both met the criteria. The reliability of item ‘Main-tain a relationship you value’ (.36) was below set point value. In contrastto LaRose and Eastin’s (2004) study, the item ‘Get support from others’was not used because it refers more to support benefits than specificallyto social outcomes. Likewise, the item ‘Find others who respect myviews’ was not used because it is too close to measurement of status out-comes.
Often, media use is driven by the pursuit of fun and entertainment.Corresponding incentives are activity outcomes (Bandura, 1986: 236),which were measured based on four indicators (α � .88). In contrast tothe original study, the items x12 and x13 were formulated as activity out-comes instead of activities (see additional table 1). Reliability of the con-struct (.88) and the average explained variance portion (.66) both metthe criteria.
In SCT perspective, monetary outcomes are important incentives forhuman action and especially media use. In the present study, a wider
286 O. Peters, M. Rickes, S. Jöckel, C. v. Criegern and A.v. Deursen
concept was used for operationalization than in the LaRose and Eastin(2004) study. Instead of the exclusive focus on monetary shopping bene-fits, the five measurement items also referred to saving time and moneywhen searching for information. Item ‘Find bargains on products andservices’ and item ‘Save time shopping’ were eliminated based on item-to-total correlation because of insufficient Cronbach’s alpha (.66). Thealpha for the remaining three items was .73. The average explained vari-ance portion (.49) was only marginally below the set point value. Reli-ability of construct (.74) meets the criteria. There was a difference be-tween the two deleted items and the remaining items. The deleted itemswere explicitly related to monetary shopping benefits. In contrast, theremaining items were related to benefits from saving efforts (time andmoney) when searching for information.
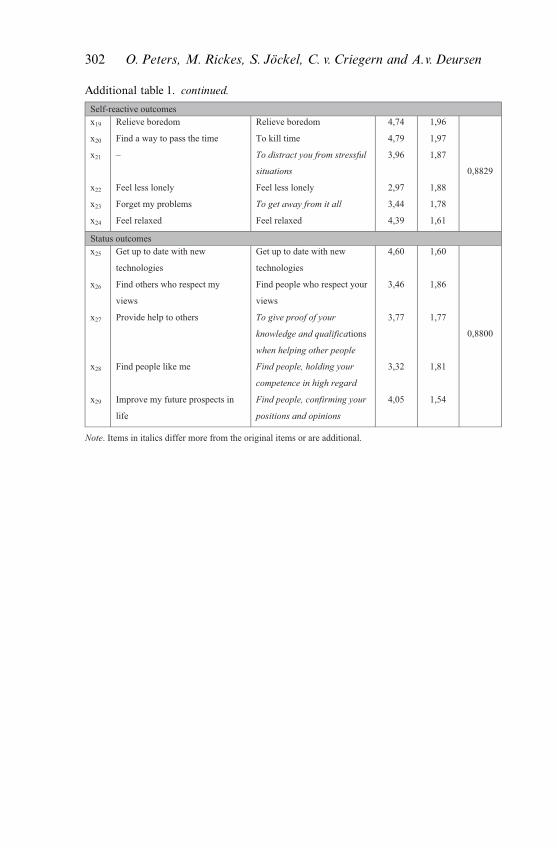
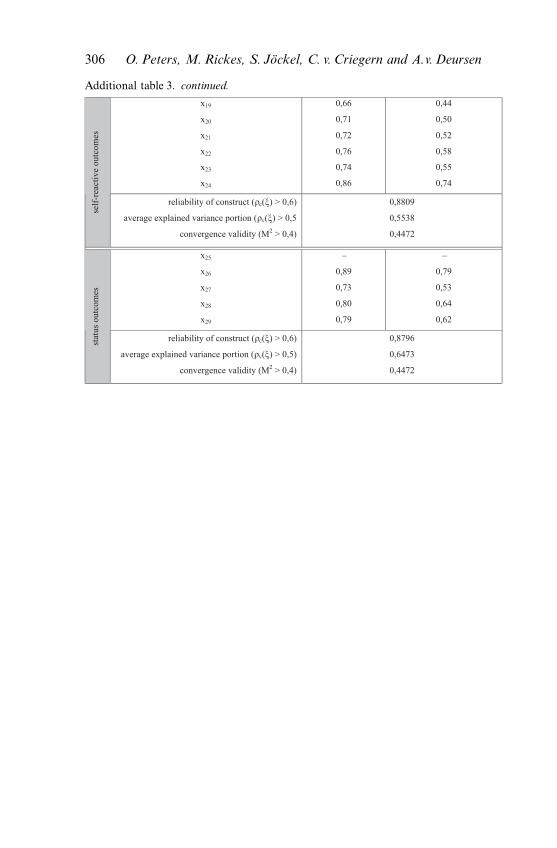
Self-reactive outcomes refer to human self-regulatory capability. Dif-ferences between personal dispositions and individual internal standardscause behavior to compensate these differences. Results of such behaviorare, for example, reductions of boredom or stress (LaRose and Eastin,2004: 370). The construct of self-reactive outcomes was measured basedon six indicators (α � .88). Construct reliability (.88) and average ex-plained variance portion (.55) both met the criteria.
Individuals aspire to status and personal acceptance within socialgroups associated with the feeling of might. The corresponding constructof status outcomes was measured based on five indicators. Status itemsx27�x29 were rephrased with a stronger focus on status. As can be seen inadditional table 1, the items used by LaRose and Eastin do not provide asubstantial distance to items of social outcomes. Item ‘Get up to datewith technologies’ was eliminated based on item-to-total correlation toimprove alpha. Cronbach’s alpha for the construct based on the fourremaining items was .88, and the average explained variance portion (.64)and the construct reliability (.87) were above aspiration level. Addition-ally, convergence validity M2 (.44) of the complete measurement modelwas sufficient (Fornell, Tellis, and Zinkhan, 1982: 406).
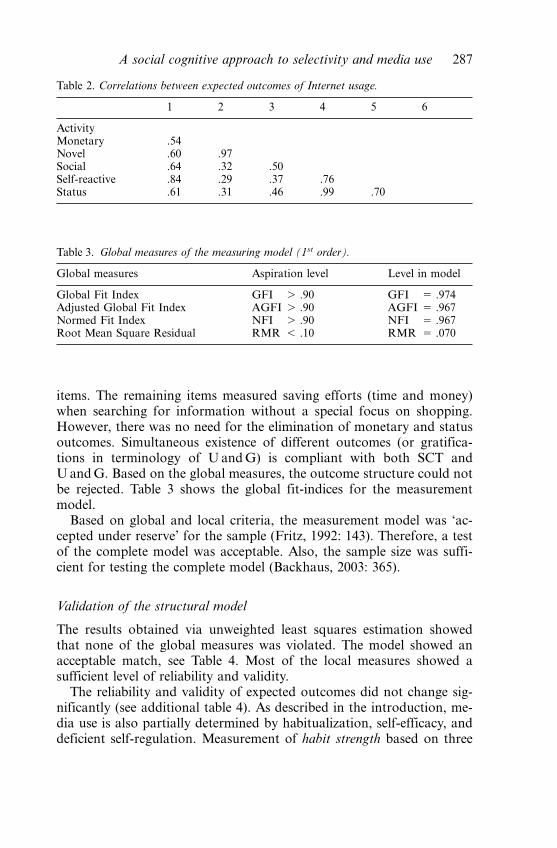
In sum, most of the listed local criteria of the measurement modelwere sufficient (see additional table 3). A special focus should be placedon discriminant validity. Table 2 shows that correlations between noveland monetary outcomes (r � .97) and between social and status out-comes (r � .99) were very high.
Obviously, the criterion of discriminant validity (Fornell et al., 1982:406) was violated. But there is a substantial relationship between socialand status outcomes considering the high correlation. Only, status out-comes will be derived through social contacts, for example, when using achat or forum. Parts of the high correlation between novel and monetaryoutcomes possibly resulted from the elimination of the special shopping
A social cognitive approach to selectivity and media use 287
Table 2. Correlations between expected outcomes of Internet usage.
1 2 3 4 5 6
ActivityMonetary .54Novel .60 .97Social .64 .32 .50Self-reactive .84 .29 .37 .76Status .61 .31 .46 .99 .70
Table 3. Global measures of the measuring model (1st order).
Global measures Aspiration level Level in model
Global Fit Index GFI > .90 GFI � .974Adjusted Global Fit Index AGFI > .90 AGFI � .967Normed Fit Index NFI > .90 NFI � .967Root Mean Square Residual RMR < .10 RMR � .070
items. The remaining items measured saving efforts (time and money)when searching for information without a special focus on shopping.However, there was no need for the elimination of monetary and statusoutcomes. Simultaneous existence of different outcomes (or gratifica-tions in terminology of U and G) is compliant with both SCT andU and G. Based on the global measures, the outcome structure could notbe rejected. Table 3 shows the global fit-indices for the measurementmodel.
Based on global and local criteria, the measurement model was ‘ac-cepted under reserve’ for the sample (Fritz, 1992: 143). Therefore, a testof the complete model was acceptable. Also, the sample size was suffi-cient for testing the complete model (Backhaus, 2003: 365).
Validation of the structural model
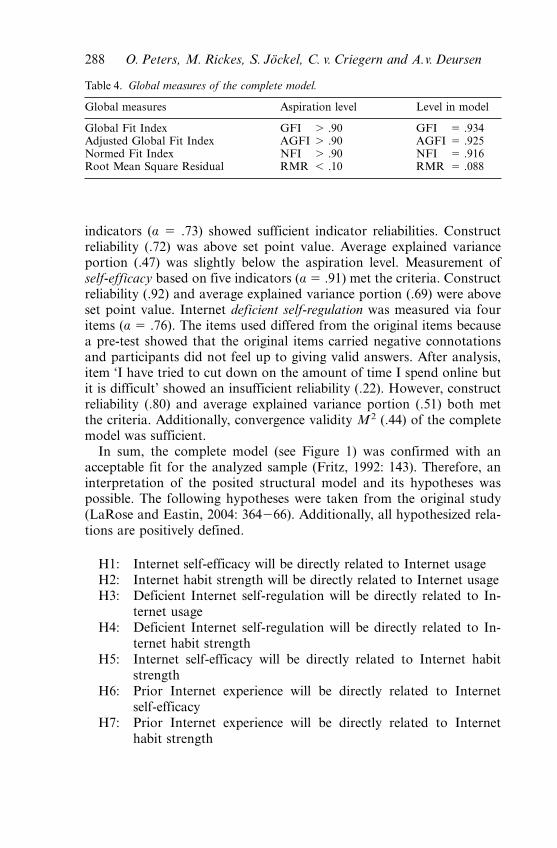
The results obtained via unweighted least squares estimation showedthat none of the global measures was violated. The model showed anacceptable match, see Table 4. Most of the local measures showed asufficient level of reliability and validity.
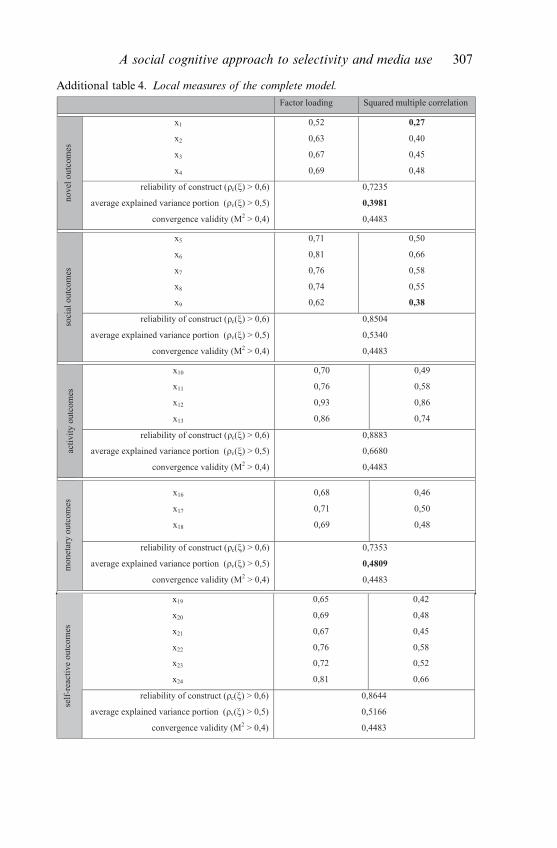
The reliability and validity of expected outcomes did not change sig-nificantly (see additional table 4). As described in the introduction, me-dia use is also partially determined by habitualization, self-efficacy, anddeficient self-regulation. Measurement of habit strength based on three
288 O. Peters, M. Rickes, S. Jöckel, C. v. Criegern and A.v. Deursen
Table 4. Global measures of the complete model.
Global measures Aspiration level Level in model
Global Fit Index GFI > .90 GFI � .934Adjusted Global Fit Index AGFI > .90 AGFI � .925Normed Fit Index NFI > .90 NFI � .916Root Mean Square Residual RMR < .10 RMR � .088
indicators (α � .73) showed sufficient indicator reliabilities. Constructreliability (.72) was above set point value. Average explained varianceportion (.47) was slightly below the aspiration level. Measurement ofself-efficacy based on five indicators (α � .91) met the criteria. Constructreliability (.92) and average explained variance portion (.69) were aboveset point value. Internet deficient self-regulation was measured via fouritems (α � .76). The items used differed from the original items becausea pre-test showed that the original items carried negative connotationsand participants did not feel up to giving valid answers. After analysis,item ‘I have tried to cut down on the amount of time I spend online butit is difficult’ showed an insufficient reliability (.22). However, constructreliability (.80) and average explained variance portion (.51) both metthe criteria. Additionally, convergence validity M2 (.44) of the completemodel was sufficient.
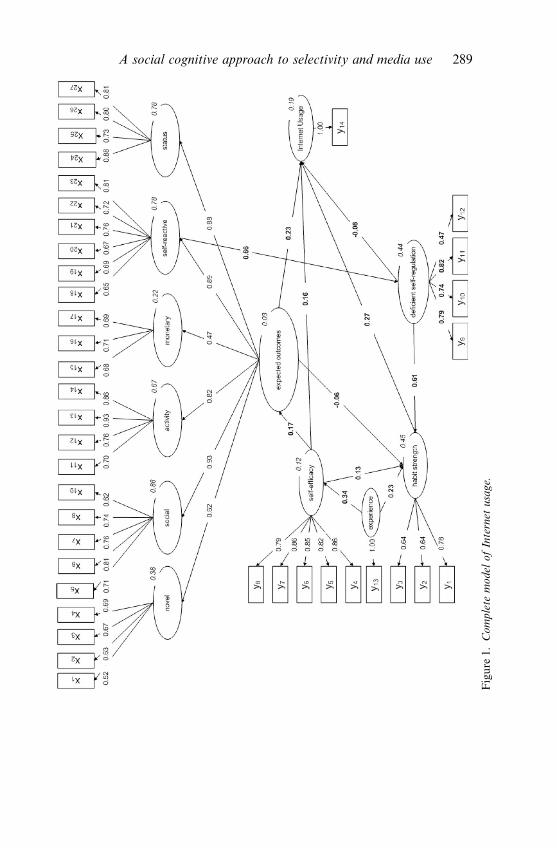
In sum, the complete model (see Figure 1) was confirmed with anacceptable fit for the analyzed sample (Fritz, 1992: 143). Therefore, aninterpretation of the posited structural model and its hypotheses waspossible. The following hypotheses were taken from the original study(LaRose and Eastin, 2004: 364�66). Additionally, all hypothesized rela-tions are positively defined.
H1: Internet self-efficacy will be directly related to Internet usageH2: Internet habit strength will be directly related to Internet usageH3: Deficient Internet self-regulation will be directly related to In-
ternet usageH4: Deficient Internet self-regulation will be directly related to In-
ternet habit strengthH5: Internet self-efficacy will be directly related to Internet habit
strengthH6: Prior Internet experience will be directly related to Internet
self-efficacyH7: Prior Internet experience will be directly related to Internet
habit strength
A social cognitive approach to selectivity and media use 289
Fig
ure
1.C
ompl
ete
mod
elof
Inte
rnet
usag
e.
290 O. Peters, M. Rickes, S. Jöckel, C. v. Criegern and A.v. Deursen
H8: Expected Internet outcomes will be directly related to Internetusage
H9: Internet self-efficacy will be directly related to expected In-ternet outcomes
H10: Expected Internet outcomes will be directly related to Internethabit strength
H11: Self-reactive outcomes of Internet usage will be positively re-lated to deficient Internet self-regulation
The hypotheses refer only to the direct causal relationships between con-structs. Multivariate causal structure also includes indirect effects. There-fore, the standardized indirect effects between the constructs are addi-tionally described in the following section.
Results
The direct effect of Internet self-efficacy on Internet usage (H1) wassupported (standardized regression weight equals .16). Indirect effect(.08) was only marginal. According to H2, there is a direct (.27) but noindirect effect (.00) of Internet habit strength on Internet usage. Theestimated direct effect (�.08) of deficient Internet self-regulation on In-ternet usage did not match the causal relationship posited in H3. Albeitmarginal, in contrast to the original model, the effect was negative. Also,there was a small indirect effect (.16). In sum, the endogenous variablesself-efficacy and habit strength were direct predictors of Internet usage.The direct effects found were very similar to the LaRose and Eastin(2004) findings (.15 and .26). In contrast, the connection between defi-cient self-regulation and Internet usage was not supported by the datain the present study.
The posited direct effect of deficient Internet self-regulation on habitstrength in H4 was fully provided through data (.61), but there was noindirect effect (.00). The direct effect of Internet self-efficacy on habitstrength (.13) provided H5. In the original study this direct effect wasnot significant, although it was theoretically expected. The indirect effect(.05) in the present study was only marginal and in contradiction to theassumption that self-efficacy determines habit strength mediated throughexpected outcomes (LaRose and Eastin, 2004: 373).
There was a direct effect (.34) of prior Internet experience on self-efficacy (H6) but no indirect effect (.00). The direct effect was very simi-lar to the original study (.38). Prior Internet experience also determinedhabit strength (H7) with a direct effect (.23); the indirect effect on habitstrength (.06) was only marginal.
A social cognitive approach to selectivity and media use 291
According to the core assumption of U and G, a direct effect (.23) ofexpected outcomes on Internet usage was found, which supported H8(.43 in the original study). The indirect effect (.03) was only marginal.Expected outcomes were partially determined through self-efficacy. In-ternet users with high levels of self-efficacy were more capable of organ-izing and executing a particular course of action than Internet users withlow levels of self-efficacy. A direct effect of self-efficacy (.17) on expectedoutcomes supported H9 but there was no indirect effect (.00).
The estimated direct effect (�.06) of expected outcomes on habitstrength did not support the causal relationship posited in H10. Albeitonly marginal, in contrast to H10 and also in contrast to the direct effect(.26) in the original model, the effect was negative. On the other hand,there was an indirect effect (.36) of expected outcomes on habit strength.This indirect effect was especially mediated through self-reactive out-comes and deficient self-regulation (see Figure 1). Finally, H11 was fullysupported with a direct effect of self-reactive outcomes on deficient selfregulation (.66), but no indirect effect (.00).
Discussion
With the exception of H3 and H10, the original hypothesized causalrelationships (LaRose and Eastin, 2004: 364�366) could not be rejectedin this study. Subject to the decision to accept or reject the model, thecoefficients of the estimated parameters in H3 and H10 have to be dis-cussed considering a possible violation of nomological validity (Fritz,1992). An explanation to why the effect of deficient Internet self-regula-tion was negative (H3) in contrast to the original study might be specula-tive. Possibly, the difference resulted from the operationalization whichwas too weak. Further research should use more powerful items, al-though the problem of negative connotation is still apparent. A finalconclusion on H3 based on the present data is not possible.
Also in contrast to the original study is the negative direct effect ofexpected outcomes on habit strength (H10). However, this is not a prin-ciple conflict with SCT and U and G; both theories propose that astronger habitualization leads to a diminishing consciousness of expectedoutcomes, respectively gratifications. Habitualization is an individualprocess where in the beginning of habitualization an increase of habitu-alization should lead to an increasing consciousness of expected out-comes. Once more strongly habitualized, further increase of habitualiza-tion should lead to a decreasing consciousness of expected outcomes.Therefore, a more precisely prediction of the correlation between ex-pected outcomes and habitualization depends on the stage of individualhabitualization of the user. Further research should therefore investigate
292 O. Peters, M. Rickes, S. Jöckel, C. v. Criegern and A.v. Deursen
more in depth the correlation between the level of individual habitualiza-tion and the consciousness of expected outcomes. However, this wouldrequire a longitudinal research design. Another possibility would be anoperationalization of habitualization that is more separated from active,target-oriented media usage (e. g., ‘I use the Internet because it’s a habit,even when I’m not looking for something special’). According to thenomological validity criteria, the overall model is ‘accepted under re-serve’ (Fritz, 1992: 143).
Because of the reported measurement problems of expected outcomes,extended item batteries should be developed more specifically for a Ger-man context. To obtain more discriminant validity between social andstatus outcomes, a stronger operationalization of status outcomes isneeded. Likewise, a stronger operationalization of monetary outcomesis needed.
In sum, the replication of the original study by Larose and Eastin(2004) on Internet usage validates the model of media attendance withina German context under reserve. The results of this study demonstratethat the proposed connection between U and G and SCT combined inthe model of media attendance is promising, especially the direct integra-tion of habit strength.
A separate test of the causal relationship between the expected out-comes (2nd order) and Internet usage showed that without integration ofhabit strength, the direct causal connection between expected outcomesand Internet usage is overestimated (standardized effect .31 instead of.23). Furthermore, a direct integration of habitualization and expectedoutcomes in a single model leads to an overestimation of the causaleffect of expected outcomes to habitualization, if at the same time defi-cient self-regulation has not been added to the model. It was demon-strated that parts of this effect resulted from indirect connections whenintegrating deficient self-regulation.
Overall, the structural model explains 19 % of Internet usage variance,which is lower compared to the 42 % explained variance found in theoriginal study (LaRose and Eastin, 2004). In the original study, Maxi-mum Likelihood estimation was applied, which assumes a multi-normaldistribution. Because of the presence of outliners in the distribution ofthe dependent variable Internet usage, Larose and Eastin applied alog10(1�value) transformation. However, this logarithmic transforma-tion could cause an over-interpretation of the differences between thecharacteristics of the variables in the lower area. Therefore, a logarithmictransformation was not applied in the present study, although an inspec-tion of the distribution of the dependent variable revealed the presenceof outliners. The ULS estimation applied in the present study did not
A social cognitive approach to selectivity and media use 293
assume a normal distribution. An examination of the effect of using alogarithmic transformation in the present study revealed an explainedInternet usage variance of 32 %.
An examination of the model of media attendance within the context ofmobile communication technology in the Netherlands
The findings of the replication of the original study (Larose and Eastin,2004) confirm the validity of the model of media attendance within aEuropean context, and also support the hypothesized causal relation-ships. To also empirically examine the merits of the model of mediaattendance (LaRose and Eastin, 2004) when applied in a differentcontext of media use, we adapted the instrument to explain Internetusage in the context of mobile communication technology, i. e., the usageof General Packet Radio Services (GPRS). With the use of GPRS, allkinds of extra mobile services become available on a mobile phone, suchas sending and receiving full-color pictures, sending and receiving e-mail,or even Internet facilities. A Dutch telecommunications company offersa special subscription for ‘closed-user groups’, mainly focussing on uni-versity personnel and students. Subscription to the closed-user group hasspecial benefits compared with subscriptions from other telecommunica-tions companies. Subscribers pay a very small monthly fee, calling withinthe closed-user group is free of charge up to 60 hours a month, and aGPRS bundle of 1 megabyte (MB) is also free. Although the closed-usergroup subscription is an enormous success in terms of number of peoplewho subscribe to this service, GPRS usage is very low. Subscribers donot use this extra mobile service via GPRS, despite the free GPRSbundle.
Method: Sample and procedures
Subscribers of a telecommunications company in the Netherlands (n �2563) were invited via e-mail to participate in the online survey from 4June 2004 until 28 June 2004. A total of 474 participants completed theonline survey, consisting of 23.9 % (n � 123) GPRS users and 75.1 % (n� 351) non-GPRS users. There was a significant difference betweenusers and non-users and gender (χ2 (1) � 47.48, p < .001). Of the GPRSusers, 91.9 % were male and 8.1 % were female. Of the non-users, 57.8 %were male and 42.2 % female. There was a significant effect of age onusers and non-users (tß [265] � �2.79, p < .01). Age ranged from 17 to70 years. The mean age of users was 23.1 year (SD � 6.4) and the meanage of non-users was 25.2 year (SD � 8.9). There was no significantdifference between users and non-users and education.
294 O. Peters, M. Rickes, S. Jöckel, C. v. Criegern and A.v. Deursen
Measurement
The original items by LaRose and Eastin (2004) collected from priorU and G studies, rephrased as outcomes expectations and classified intosix SCT incentive categories (activity, monetary, novel, social, self-re-active, and status), and the original measurement of habit strength, self-regulation, and self-efficacy were rephrased and pre-tested in the contextof mobile communication technology. The measurement of the originalhabit strength scale was not feasible within the group of non-GPRSusers. Therefore, habit strength was rephrased by a measure of owner-ship and use of other information and communication technology (ICTs)such as PDAs, notebooks, digital video cameras, DVD players, gameconsoles, the Internet, and e-mail. A measure of mobile telephone experi-ence was computed by asking the number of years and months it hadbeen since the participants had first started using a mobile phone. Thedependent GPRS usage variable was computed by asking whether theparticipant made use of GPRS. One open-ended question was includedin the survey to ask the respondents to comment why they do or do notuse GPRS. From the theory of diffusion of innovations (Rogers, 2003)we know that adoption is also affected by technological features, suchas relative advantage, compatibility, complexity, and possibilities to tryand observe technological features (Carlsson, Hyvönen, Repo, and Wal-den, 2005). Therefore, four medium measures (screen legibility, screensize, ease of use, and extensiveness of mobile phone) were additionallyincluded in the survey.
Results
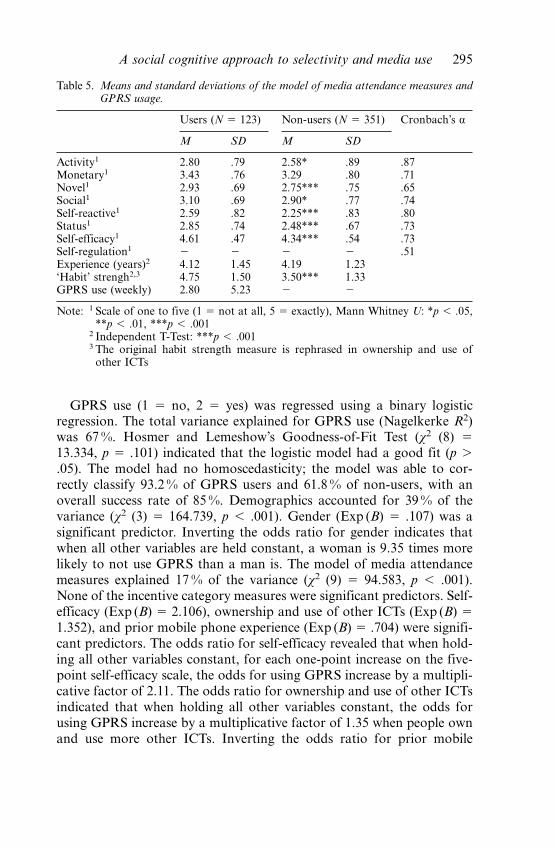
Table 5 summarizes the means and standard deviations of the modelof media attendance measures and GPRS usage. GPRS users differedsignificantly from non-users for all incentive categories, except for mone-tary. For all incentive categories, the mean scores of GPRS users werehigher than the mean scores for non-users. GPRS users differed signifi-cantly from non-users for self-efficacy (U � 14663.50, p < .001). Themean score of GPRS users for self-efficacy was higher than the meanscore for non-users. The Cronbach’s alpha for self-regulation was notreliable (α � .51). Therefore, self-regulation was excluded from furtheranalysis. There was no significant difference between GPRS users andnon-users with respect to mobile phone experience (tß [472] � .468, p �.64). A significant difference was found between users and non-users andthe ownership and use of other ICTs (tß [472] � �8.69, p < .001). TheGPRS users owned and used more information and communicationtechnologies than non-users, with exception of Internet and e-mail. Themean score for GPRS use was 2.8 times a week.
A social cognitive approach to selectivity and media use 295
Table 5. Means and standard deviations of the model of media attendance measures andGPRS usage.
Users (N � 123) Non-users (N � 351) Cronbach’s α
M SD M SD
Activity1 2.80 .79 2.58* .89 .87Monetary1 3.43 .76 3.29 .80 .71Novel1 2.93 .69 2.75*** .75 .65Social1 3.10 .69 2.90* .77 .74Self-reactive1 2.59 .82 2.25*** .83 .80Status1 2.85 .74 2.48*** .67 .73Self-efficacy1 4.61 .47 4.34*** .54 .73Self-regulation1 � � � � .51Experience (years)2 4.12 1.45 4.19 1.23‘Habit’ strengh2,3 4.75 1.50 3.50*** 1.33GPRS use (weekly) 2.80 5.23 � �
Note: 1 Scale of one to five (1 � not at all, 5 � exactly), Mann Whitney U: *p < .05,**p < .01, ***p < .001
2 Independent T-Test: ***p < .0013 The original habit strength measure is rephrased in ownership and use of
other ICTs
GPRS use (1 � no, 2 � yes) was regressed using a binary logisticregression. The total variance explained for GPRS use (Nagelkerke R2)was 67 %. Hosmer and Lemeshow’s Goodness-of-Fit Test (χ2 (8) �13.334, p � .101) indicated that the logistic model had a good fit (p >.05). The model had no homoscedasticity; the model was able to cor-rectly classify 93.2 % of GPRS users and 61.8 % of non-users, with anoverall success rate of 85 %. Demographics accounted for 39 % of thevariance (χ2 (3) � 164.739, p < .001). Gender (Exp (B) � .107) was asignificant predictor. Inverting the odds ratio for gender indicates thatwhen all other variables are held constant, a woman is 9.35 times morelikely to not use GPRS than a man is. The model of media attendancemeasures explained 17 % of the variance (χ2 (9) � 94.583, p < .001).None of the incentive category measures were significant predictors. Self-efficacy (Exp (B) � 2.106), ownership and use of other ICTs (Exp (B) �1.352), and prior mobile phone experience (Exp (B) � .704) were signifi-cant predictors. The odds ratio for self-efficacy revealed that when hold-ing all other variables constant, for each one-point increase on the five-point self-efficacy scale, the odds for using GPRS increase by a multipli-cative factor of 2.11. The odds ratio for ownership and use of other ICTsindicated that when holding all other variables constant, the odds forusing GPRS increase by a multiplicative factor of 1.35 when people ownand use more other ICTs. Inverting the odds ratio for prior mobile
296 O. Peters, M. Rickes, S. Jöckel, C. v. Criegern and A.v. Deursen
phone experience indicated that, when holding all other variables con-stant, the odds for not using GPRS increase by a multiplicative factorof 1.42 when people have more mobile phone experience. The remaining11 % variance was explained by medium variables (χ2 (4) � 68.107, p <.001). Extensiveness of mobile phone (Exp (B) � 1.793) was a significantpredictor. The odds ratio for extensiveness of mobile phone indicatedthat, when holding all other variables constant, the odds for using GPRSincrease by a multiplicative factor of 1.42 when a mobile phone has moreadvanced features.
Discussion
The results of this study showed a remarkably high percentage of ex-plained variance in GPRS usage compared to previous U and G studieson mobile communication technology use (e. g., Dimmick, Kline, andStafford, 2000; Leung and Wei, 2000). This finding might support thetheoretical proposition of the model of media attendance, that prospec-tive measures from a social cognitive perspective would have a largerexplanatory power of variance in media use than the retrospective self-report measures often used in U and G studies. However, none of the sixincentive categories reconstructed as outcome expectations were signifi-cant predictors of GPRS usage. The most significant predictor from themodel of media attendance measures was self-efficacy. Hofstetter et al.(2001) stated that self-efficacy involves a combination of expected out-comes of a task with the belief that one can perform a task adequately.This may partly explain why none of the six incentive categories weresignificant predictors of GPRS usage. GPRS users apparently have lowoutcome expectancies of GPRS, despite the high levels of self-efficacyabout the belief that they know how to make use of GPRS services. Thisis also reflected in the mean scores of the incentive categories measures.Although GPRS users had higher scores on the six incentives categoriesthan non-GPRS users, the means of the GPRS use incentive categoriesdo not indicate that GPRS users are very pronounced in expressing theiruse of GPRS into the six incentive categories reconstructed as outcomeexpectations. The use of GPRS is almost insignificant, i. e., the averageuse was less than three times a week. According to the open-ended ques-tion, respondents did not seem to have a need for GPRS; i. e., it cannotcompete with already existing media such as the Internet and e-mail viapersonal computers. Apparently, the technology and features of GPRSare not a sufficient driver for GPRS services; a missing element of GPRSservices is that it does not add value to people’s mobile communicationneeds. According to LaRose and Eastin (2004) active selection of mediathat best meet personal needs (i. e., outcome expectancies) is not the sole
A social cognitive approach to selectivity and media use 297
mechanism that explains media attendance. Self-efficacy beliefs aboutone’s ability to utilize alternative media channels also contribute to me-dia selection. Active selection dominates when new media alternativesappear or when personal routines are disrupted. But once habits areestablished, users no longer think whether one alternative or another isa better way of obtaining a particular outcome (Larose and Eastin,2004). This may also explain the apparent contradiction that the oddsfor not using GPRS increased when people had more mobile phone ex-perience, although there was no significant difference between GPRSuser and non-users on mobile phone experience. Because of the insignifi-cance of GPRS services as an alternative media channel, there is no needfor GPRS users to adjust their normal mobile communication behaviorbased on the experience that their current mobile phone use perfectlyfulfils their mobile communication needs.
By far the most variance of GPRS use is explained by demographics,with gender as the most powerful predictor. Within SCT, demographicdifferences are, according to LaRose and Eastin (2004), attributed toexplanatory variables (e. g., men have higher GPRS self-efficacy due tothe nature of their past experiences with other ICTs). From the theory ofdiffusion of innovations (Rogers, 2003) it is known that socio-economiccharacteristics such as age, education, and social status influence adop-tion. A secondary analysis of our data indicated no significant differ-ences between male and female GPRS users in relation to the model ofmedia attendance measures. Further empirical research should investi-gate more in depth the role of gender in media usage to better under-stand whether gender is a direct predictor of media usage or that genderis fully attributed to explanatory variables of media usage.
Clearly, this study has some limitations. First, the instrument by La-Rose and Eastin (2004) is translated from English to Dutch and adjustedto another context of media use. Furthermore, the Cronbach’s alpha forself-regulation was not reliable. This could have influenced the results ofthis study. As this study was a first attempt to apply the model of mediaattendance to another context of media use, more research is needed tofurther empirically examine the merits of the model of media attendanceapplied in different contexts of media use.
General discussion
Both studies explored LaRose and Eastin’s (2004) model of media atten-dance, within a European context. This extended the U and G paradigmwithin the framework of SCT by instituting new operational measuresof gratifications sought reconstructed as outcome expectations. The rep-
298 O. Peters, M. Rickes, S. Jöckel, C. v. Criegern and A.v. Deursen
licated model of media attendance within a German context demon-strated that the proposed relation between U and G and SCT is a fruitfulone, especially because of the direct integration of habit strength. With-out this integration, the direct causal connection between expected out-comes and Internet usage could be overestimated. Furthermore, a directintegration of habitualization and expected outcomes in a single modelleads to an overestimation of the direct causal effect of expected out-comes to habitualization. It was demonstrated that parts of this effectresult from indirect connections when integrating self-efficacy and defi-cient self-regulation. In further studies, the operationalization of ex-pected outcomes should be modified to increase the level of discrimantvalidity. Furthermore, the present study made clear that a more in-depthinvestigation of the role of habitualization in the process of media usageis needed.
An examination of the model within the context of mobile communi-cation technology in The Netherlands indicated that the model is appli-cable to other contexts of media use, although the significance of out-come expectancies was not fully supported. Also, the role of demograph-ics as proposed to being attributed to explaining variables in the modelshould be clarified, as gender was a strong direct predictor of mediausage. Interesting is also the significance of technological features of amedium to explain media usage. This might indicate that besides out-come expectations, the technological features of a new media technologyitself are also important in explaining media usage, instead of only theincentive to be expected when using new media technology. This is inaccordance with the three basic tenets of SCT. To predict future useof new media technology requires that potential users should have thepossibility to try (enactive learning) or observe (vicarious learning) thenew media technology. There also may be a reciprocal relationship be-tween self-efficacy and outcome expectations. Further research shouldexplore this possible reciprocal relationship more in depth.
The findings of both the validation of the original model and the ex-amination of the model in another context of use indicate that the pro-posed values of the new variables from SCT reconstructed as outcomeexpectations improve the explanatory power of gratifications, and withthat support the findings of the study by LaRose and Eastin (2004) thatthe new model of media attendance within the framework of SCT bothaffirm the U and G paradigm and extend it to a theory of media atten-dance grounded in SCT. The present study suggests some interestingideas for further research to improve the model of media attendance(e. g., the role of gender, habitualization). The findings of this study showthat the model of media attendance, grounded in both U and G andSCT, is a promising step forward in measuring media selectivity and
A social cognitive approach to selectivity and media use 299
usage, both from the perspective of explained media usage and fromthe perspective of validating and extending theory. As new technologiespresent people with more and more media choices, motivation and satis-faction become even more crucial components of audience analysis(Ruggiero, 2000). The need for alternative measurement and analysis isneeded to better understand people’s needs and desires, which is vital tobe able to offer them products and services that they will actually use.
Note
1. The original German items will be reported in Rickes, Linke, and Criegern (2006).
References
Babrow, A. S. (1988). Theory and method in research on audience motives. Journal ofBroadcasting and Electronic Media, 32(4), 471�487.
Babrow, A. S. and Swanson, D. L. (1988). Disentangling antecedents of audience ex-posure levels: Extending expectancy-value analyses of gratifications sought fromtelevision news. Communication Monographs, 55, 1�21.
Backhaus, K. (Ed.). (2003). Multivariate Analysemethoden. Eine anwendungsorientierteEinführung [Multivariate analysis methods. An application-oriented introduction](10th ed.). Berlin: Springer.
Bagozzi, R. and Yi, Y. (1988). On the evaluation of structural equation models. Workingpaper, University of Michigan.
Bandura, A. (1986). Social foundations of thought and action: A social cognitive theory.Englewood Cliffs, NJ: Prentice Hall.
Bandura, A. (1991). Social cognitive theory of self-regulation. Organizational Behaviorand Human Decision Processes, 50, 248�287.
Bandura, A. (1997). Self-efficacy: The exercise of control. New York: Freeman.Bandura, A. (2002). Social cognitive theory of mass communication. In J. Bryant and
D. Zillman (Eds.), Media effects: Advances in theory and research (2nd ed., pp.121�155). Mahwah, NJ: Erlbaum.
Carlsson, C., Hyvönen, K., Repo, P., and Walden, P. (2005). Asynchronous adoptionpatterns of mobile services. Proceedings of the 38th International Conference onSystem Sciences, IEEE, HI, 2005.
Dimmick, J., Kline, S., and Stafford, L. (2000). The gratification niches of personale-mail and the telephone: Competition, displacement, and complementarity. Com-munication Research, 27(2), 227�248.
Fornell, C., Tellis, G. J., and Zinkhan, G. M. (1982). Validity assessment: A structuralequations approach using partial least squares. In B. Walker (Ed.), An assessmentof marketing thought and practice (pp. 405�409). Chicago, IL: American Market-ing Association.
Fritz, W. (1992). Marktorientierte Unternehmensführung und Unternehmenserfolg:Grundlagen und Ergebnisse einer empirischen Untersuchung [Market-oriented man-agement and company success: bases and results of an empirical research]. Stutt-gart: Schäffer-Poeschel.
Greenberg, B. (1974). Gratfications of television viewing and their correlates for Brit-ish children. In J. G. Blumler and E. Katz (Eds.). The uses of mass communication.Beverly Hills, CA: Sage.
300 O. Peters, M. Rickes, S. Jöckel, C. v. Criegern and A.v. Deursen
Hofstetter, C. R., Zuniga, S., and Dozier, D. M. (2001). Media self-efficacy: Validationof a new concept. Mass communication and Society, 4(1), 61�78.
Hendriks Vettehen, P. G., Van Snippenburg, L. B. (2002). Measuring motivations formedia exposure: A thesis. Quality and Quantity, 36(3), 259�276.
Katz, E., Blumler, J. G., and Gurevitch, M. (1974). Utilization of mass communicationby the individual. In J. G. Blumler and E. Katz (Eds.), The uses of mass communi-cation. Beverly Hills, CA: Sage.
LaRose, R. (1998). Understanding personal telephone behavior. In H. Sawhney andG. Barnett (Eds.), Progress in communication science, Vol. XV: Advances in tele-communications (pp. 1�27). Stamford, CT: Ablex.
LaRose, R., Mastro, D. A., and Eastin, M. S. (2001). Understanding Internet usage:A social cognitive approach to uses and gratifications. Social Science ComputerReview, 19, 395�413.
LaRose, R., Lin, C. A., and Eastin, M. S. (2003). Unregulated Internet usage: Addic-tion, habit, or deficient self-regulation? Media Psychology, 5(3), 224�253.
LaRose, R. and Eastin, M. S. (2004). A social cognitive theory of Internet uses andgratifications: Toward a new model of media attendance. Journal of Broadcastingand Electronic Media, 48(3), 358�377.
Leung, L. and Wei, R. (2000). More than just talk on the move: Uses and gratificationsof the cellular phone. Journalism and Mass Communication Quarterly, 77(2),308�320.
Lometti, G. E., Reeves, B., and Bybee, C. R. (1977). Investigating the assumptions ofuses and gratifications research. Communication Research, 4, 321�338.
Messaris, P. (1977). Biases of self-reported ‘functions’ and ‘gratifications’ of mass me-dia use. A review of general semantics, 34, 316�329.
McQuail, D. (1994). The rise of media of mass communication. In D. McQuail (Ed.),Mass communication theory: An introduction (pp. 1�29). London: Sage.
McQuail, D. (2001). With more hindsight: Conceptual problems and some ways for-ward for media use research. Communications: The European Journal of Communi-cation Research, 26(4), 337�350.
Opp, K. D. (2002). Methodologie der Sozialwissenschaften. Einführung in die Problemeihrer Theoriebildung und praktischen Anwendung [The methodology of social sci-ences. Introduction into the problems of theory-building and their practical appli-cation] (5th revised ed.). Wiesbaden: Westdeutscher Verlag.
Palmgreen, P., Wenner, L., and Rosegren, K. (1985). Uses and gratifications research:The past ten years. In K. Rosegren, L. Wenner, and P. Palmgreen (Eds.), Mediagratifications research (pp. 11�37). Beverly Hills, CA: Sage.
Peters, O. and Ben Allouch, S. (2005). Always connected: A longitudinal field studyof mobile communication. Telematics and Informatics, 22(3), 239�256.
Popper, K. R. (1989). Logik der Forschung [The logic of research] (9th revised ed.).Tübingen: Mohr.
Rickes, M., Linke, J., and Criegern, C. von (2006). Aktive Mediennutzung und Habitu-alisierung. Beitrag der sozial-kognitiven Theorie Banduras zur Integration beiderKonzepte [Active media use and habitualization. The contribution of Bandura’ssocial cognitive theory in integrating both concepts]. Manuscript in preparation.
Rogers, E. M. (2003). Diffusion of Innovations (5th ed.). New York: Free Press.Rosegren, K. E. (1974). Uses and gratifications: A paradigm outlined. In J. G. Blumler
and E. Katz (Eds.), The uses of mass communication. Beverly Hills, CA: Sage.Ruggiero, T. E. (2000). Uses and gratifications theory in the 21st century. Mass Com-
munication and Society, 3(1), 3�37.Stone, D. (1998). Social cognitive theory. Available (consulted 30 January 2006) at:
www.med.usf.edu/~kmbrown/Social_Cognitive_Theory_Overview.htm
A social cognitive approach to selectivity and media use 301
Appendix: Additional tablesAdditional table 1. Measurement of exogenous variables � expected outcomes.
Measurement itemix
LaRose and Eastin (2004) Present study ix is a
Novel outcomes
x1
x2
x3
x4
Get immediate knowledge of big
news events
Find a wealth of information
Find new interactive features
Obtain information that I can’t
find elsewhere
Get immediate knowledge of
important news
Get extensive information
To keep up-to-date
Obtain information you can’t
find elsewhere
5,79
6,07
5,63
5,84
1,21
0,92
1,17
1,11
0,7257
Social Outcomes
x5
x6
x7
x8
x9
Find something to talk about
Find people like me
Feel like I belong to a group
Provide help to others
Maintain a relationship I value
Get support from others
Find others who respect my
views
Find themes for talking with
others
Meet people like you
Feel like you belong to a
group
Provide others with tips and
advices
Maintain a relationship you
value
–
–
4,98
3,60
3,20
3,39
4,56
–
–
1,62
1,95
1,87
1,87
1,94
–
–
0,8450
Activity outcomes
x10
x11
x12
x13
Cheer myself up
Feel entertained
Play a game I like
Hear music I like
Cheer yourself up
Feel entertained
Obtain high spirits
To enjoy
4,56
4,73
4,40
5,34
1,45
1,55
1,67
1,42
0,8885
Monetary outcomes
x14
x15
x16
x17
x18
Find bargains on products and
services
Get products for free
Save time shopping
–
Get free information that would
otherwise cost me money
–
Find bargains on products
and services
–
Save time shopping
Save time and efforts finding
information
Obtain information, that
otherwise would cost you
money
Obtain information easy and
fast
3,84
–
4,37
5,99
5,21
6,19
1,76
–
1,85
1,14
1,58
1,11
0,7362
302 O. Peters, M. Rickes, S. Jöckel, C. v. Criegern and A.v. Deursen
Additional table 1. continued.
Self-reactive outcomes
x19
x20
x21
x22
x23
x24
Relieve boredom
Find a way to pass the time
–
Feel less lonely
Forget my problems
Feel relaxed
Relieve boredom
To kill time
To distract you from stressful
situations
Feel less lonely
To get away from it all
Feel relaxed
4,74
4,79
3,96
2,97
3,44
4,39
1,96
1,97
1,87
1,88
1,78
1,61
0,8829
Status outcomes
x25
x26
x27
x28
x29
Get up to date with new
technologies
Find others who respect my
views
Provide help to others
Find people like me
Improve my future prospects in
life
Get up to date with new
technologies
Find people who respect your
views
To give proof of your
knowledge and qualifications
when helping other people
Find people, holding your
competence in high regard
Find people, confirming your
positions and opinions
4,60
3,46
3,77
3,32
4,05
1,60
1,86
1,77
1,81
1,54
0,8800
Note. Items in italics differ more from the original items or are additional.
A social cognitive approach to selectivity and media use 303
Additional table 2. Measurement of endogenous variables.
Measurement itemiy
LaRos and Eastin (2004) Present study iy is a
Habit strength
y1
y2
y3
y4
The Internet is part of my usual
routine
I find myself going online about
the same time each day
I would miss the Internet if I
could no longer go online
–
Internet usage is part of my
usual routine
I find myself going online
about the same time each day
I would miss the internet if it
would not be available
I could not imagine that
internet usage is not any
longer part of my everyday
life
6,50
4,30
6,21
6,08
0,97
1,99
1,18
1,16
0,7335
Self-efficacy
y5
y6
y7
y8
y9
y10
I feel confident understanding
terms/words relating to Internet
hardware
I feel confident explaining why a
task will not run on the Internet
I feel confident understanding
terms/words relating to Internet
software
I feel confident using the Internet
to gather data
I feel confident describing
functions of Internet hardware
I feel confident trouble shooting
Internet problems
I’m able to describe terms
and words relating to Internet
hardware
I’m able to explain why a
task will not run on the
Internet
I’m able to understand terms
and words relating to Internet
software
Internet usage don’t poses a
challenge for me
I’m able to describe
functions of Internet
hardware
I’m able to resolve problems
relating to Internet usage
independently
5,29
4,57
5,20
5,91
4,60
5,04
1,44
1,71
1,46
1,53
1,73
1,55
0,9173
Deficient self-regulation
y11
y12
y13
I have to keep using the Internet
more and more to get my thrill
I get tense, moody, or irritable if I
can’t get on the Web when I want
I have a hard time keeping my
Internet use under control
It is annoying if I can’t use
the Internet for a longer time
I feel bad if I can’t get on the
Internet when I want
I have the feeling that I miss
out on something if I am not
online
5,02
4,07
3,59
1,78
1,85
1,84 0,7677
304 O. Peters, M. Rickes, S. Jöckel, C. v. Criegern and A.v. Deursen
Additional table 2. continued.
y14 I have tried unsuccessfully to cut
down on the amount of time I
spend online
I sometimes try to conceal how
much time I spend online from
my family or friends
I would go out of my way to
satisfy my Internet urges
I feel my Internet use is out of
control
I have tried to cut down on
the amount of time I spend
online but it is difficult
–
–
–
2,34
–
–
–
1,59
–
–
–
Internet experience
y15
Internet experience
(years)
Internet experience
(years)7,22 2,75 –
Internet usage
y16
Average daily internet usage
(minutes)
Average daily internet usage
(minutes)179,70 190,84 –
Note. Items in italics differ more from the original items or are additional.
A social cognitive approach to selectivity and media use 305
Additional table 3. Confirmatory factor analysis of the measurement model (1st order).
Factor loading Squared multiple correlation
x1
x2
x3
x4
0,49
0,63
0,68
0,70
0,24
0,40
0,46
0,49
novel
outc
om
es
reliability of construct (rc(j) > 0,6)
average explained variance portion (rv(j) > 0,5)
convergence validity (M2 > 0,4)
0,7217
0,3974
0,4472
x5
x6
x7
x8
x9
0,70
0,82
0,76
0,75
0,60
0,49
0,67
0,58
0,56
0,36
soci
al o
utc
om
es
reliability of construct (rc(j) > 0,6)
average explained variance portion (rv(j) > 0,5)
convergence validity (M2 > 0,4)
0,8493
0,5325
0,4472
x10
x11
x12
x13
0,72
0,75
0,92
0,86
0,52
0,56
0,85
0,74
acti
vit
y o
utc
om
es
reliability of construct (rc(j) > 0,6)
average explained variance portion (rv(j) > 0,5)
convergence validity (M2 > 0,4)
0,8879
0,6667
0,4472
x14
x15
x16
x17
x18
-
-
0,70
0,66
0,74
-
-
0,49
0,44
0,55
monet
ary o
utc
om
es
reliability of construct (rc(j) > 0,6)
average explained variance portion (rv(j) > 0,5)
convergence validity (M2 > 0,4)
0,7428
0,4911
0,4472
306 O. Peters, M. Rickes, S. Jöckel, C. v. Criegern and A.v. Deursen
Additional table 3. continued.
x19
x20
x21
x22
x23
x24
0,66
0,71
0,72
0,76
0,74
0,86
0,44
0,50
0,52
0,58
0,55
0,74
self
-rea
ctiv
e o
utc
om
es
reliability of construct (rc(j) > 0,6)
average explained variance portion (rv(j) > 0,5
convergence validity (M2 > 0,4)
0,8809
0,5538
0,4472
x25
x26
x27
x28
x29
–
0,89
0,73
0,80
0,79
–
0,79
0,53
0,64
0,62
stat
us
ou
tco
mes
reliability of construct (rc(j) > 0,6)
average explained variance portion (rv(j) > 0,5)
convergence validity (M2 > 0,4)
0,8796
0,6473
0,4472
A social cognitive approach to selectivity and media use 307
Additional table 4. Local measures of the complete model.
Factor loading Squared multiple correlation
x1
x2
x3
x4
0,52
0,63
0,67
0,69
0,27
0,40
0,45
0,48
novel
outc
om
es
reliability of construct (rc(j) > 0,6)
average explained variance portion (rv(j) > 0,5)
convergence validity (M2 > 0,4)
0,7235
0,3981
0,4483
x5
x6
x7
x8
x9
0,71
0,81
0,76
0,74
0,62
0,50
0,66
0,58
0,55
0,38
soci
al o
utc
om
es
reliability of construct (rc(j) > 0,6)
average explained variance portion (rv(j) > 0,5)
convergence validity (M2 > 0,4)
0,8504
0,5340
0,4483
x10
x11
x12
x13
0,70
0,76
0,93
0,86
0,49
0,58
0,86
0,74
acti
vit
y o
utc
om
es
reliability of construct (rc(j) > 0,6)
average explained variance portion (rv(j) > 0,5)
convergence validity (M2 > 0,4)
0,8883
0,6680
0,4483
x16
x17
x18
0,68
0,71
0,69
0,46
0,50
0,48
monet
ary o
utc
om
es
reliability of construct (rc(j) > 0,6)
average explained variance portion (rv(j) > 0,5)
convergence validity (M2 > 0,4)
0,7353
0,4809
0,4483
x19
x20
x21
x22
x23
x24
0,65
0,69
0,67
0,76
0,72
0,81
0,42
0,48
0,45
0,58
0,52
0,66
self
-rea
ctiv
e outc
om
es
reliability of construct (rc(j) > 0,6)
average explained variance portion (rv(j) > 0,5)
convergence validity (M2 > 0,4)
0,8644
0,5166
0,4483
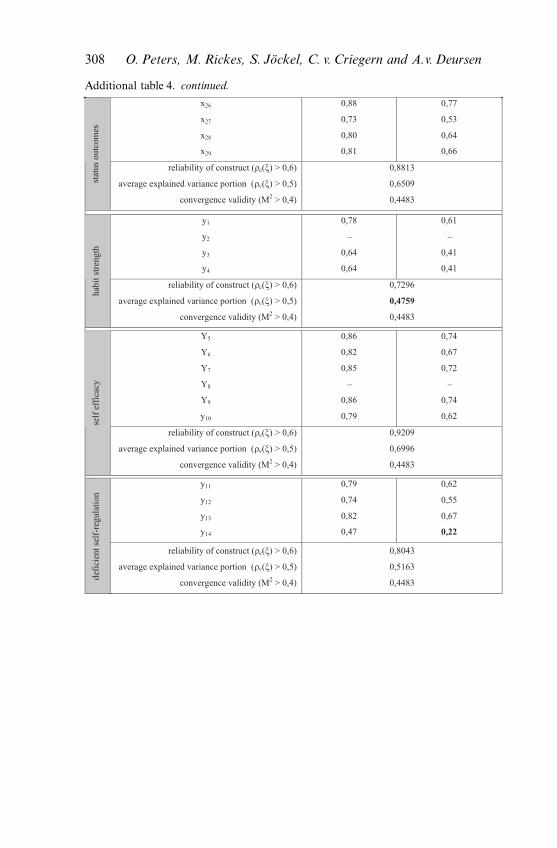
308 O. Peters, M. Rickes, S. Jöckel, C. v. Criegern and A.v. Deursen
Additional table 4. continued.
x26
x27
x28
x29
0,88
0,73
0,80
0,81
0,77
0,53
0,64
0,66
stat
us
outc
om
es
reliability of construct (rc(j) > 0,6)
average explained variance portion (rv(j) > 0,5)
convergence validity (M2 > 0,4)
0,8813
0,6509
0,4483
y1
y2
y3
y4
0,78
–
0,64
0,64
0,61
–
0,41
0,41
hab
it s
tren
gth
reliability of construct (rc(j) > 0,6)
average explained variance portion (rv(j) > 0,5)
convergence validity (M2 > 0,4)
0,7296
0,4759
0,4483
Y5
Y6
Y7
Y8
Y9
y10
0,86
0,82
0,85
–
0,86
0,79
0,74
0,67
0,72
–
0,74
0,62
self
eff
icac
y
reliability of construct (rc(j) > 0,6)
average explained variance portion (rv(j) > 0,5)
convergence validity (M2 > 0,4)
0,9209
0,6996
0,4483
def
icie
nt
self
-reg
ula
tion
y11
y12
y13
y14
0,79
0,74
0,82
0,47
0,62
0,55
0,67
0,22
reliability of construct (rc(j) > 0,6)
average explained variance portion (rv(j) > 0,5)
convergence validity (M2 > 0,4)
0,8043
0,5163
0,4483
Related Documents