Extending market basket analysis with graph mining techniques: A real case Ivan F. Videla-Cavieres ⇑ , Sebastián A. Ríos University of Chile, Department of Industrial Engineering, Business Intelligence Research Center (CEINE), Santiago, Chile article info Keywords: Market basket analysis Graph mining Retail Product network Big data Overlap communities abstract A common problem for many companies, like retail stores, it is to find sets of products that are sold together. The only source of information available is the history of sales transactional data. Common techniques of market basket analysis fail when processing huge amounts of scattered data, finding meaningless relationships. We developed a novel approach for market basket analysis based on graph mining techniques, able to process millions of scattered transactions. We demonstrate the effectiveness of our approach in a wholesale supermarket chain and a retail supermarket chain, processing around 238,000,000 and 128,000,000 transactions respectively compared to classical approach. Ó 2013 Elsevier Ltd. All rights reserved. 1. Introduction Over decades retail chains and department stores have been selling their products without using the transactional data gener- ated by their sales as a source of knowledge. Recently – in the last two decades – companies started to use this data to discover infor- mation. In the 90’s limited computational capabilities made the extraction of knowledge from millions of daily transactions unfea- sible, and only analysis with simple models and reduced datasets were possible. In 1993, Agrawal (Agrawal, Imielinski, & Swami, 1993; Agrawal & Srikant, 1994) showed that many organizations were getting bigger databases with transactional data, consumer data, sales records, etc. Therefore, they proposed the Apriori algo- rithm (Agrawal & Srikant, 1994) for a large data set for those years. Today, computational systems have evolved – both hardware and software – and have been implemented in all areas of companies (CRMs, ERPs, MRPs, Data Marts, Data Warehouses, ad hoc systems, etc.), allowing the storage and processing of huge amounts of data. Similarly, it is possible to develop complex mod- els and algorithms to gather knowledge from such huge databases. A classical approach to getting information from data in retail and department stores is through market basket analysis (MBA), frequent item set discovery and clustering techniques such as K-means (Hartigan & Wong, 1979), SOM (Kohonen, 1990). The main idea behind this is to discover purchasing patterns from transactional data. However, when we used these techniques to process real supermarket chain data, the results obtained were of very poor quality. For example, with K-means techniques only one cluster grouped 93% of transactions and the 7% remaining is not meaningful. Therefore, poor quality information was generated disabling decisions such as finding customers profiles, discount offers generation, supermarket products layout, etc. Thus, we developed a novel approach to perform MBA based on graph min- ing techniques; specifically using overlap communities, that allows to generate highly related products to each other within the community. We benchmarked our method using several traditional approaches applied over millions of transactional data. The results of our evaluation show that our approach out–performs the traditional methods. 2. Definitions and related work This work is focused on generating frequent item sets of prod- ucts based on transactional data generated by a retail chain. The main idea is to obtain sets of meaningful products so we can generate customer profiles, product layout and recommendations from related products. In the following sections we will explain the datasets over which we apply our methods; the classical approach and the state-of-art techniques based on graph mining over transactional data. 2.1. Data We have data from two retail chains in Chile. One is a wholesale supermarket oriented to supply products to grocery store owners, hereafter, referred to as Retail A. The second is member of one of the biggest retail holdings in Chile called Retail B. 0957-4174/$ - see front matter Ó 2013 Elsevier Ltd. All rights reserved. http://dx.doi.org/10.1016/j.eswa.2013.08.088 ⇑ Corresponding author. E-mail addresses: [email protected] (I.F. Videla-Cavieres), [email protected] (S.A. Ríos). URLs: http://www.ceine.cl (I.F. Videla-Cavieres), http://www.ceine.cl (S.A. Ríos). Expert Systems with Applications 41 (2014) 1928–1936 Contents lists available at ScienceDirect Expert Systems with Applications journal homepage: www.elsevier.com/locate/eswa

Welcome message from author
This document is posted to help you gain knowledge. Please leave a comment to let me know what you think about it! Share it to your friends and learn new things together.
Transcript

Expert Systems with Applications 41 (2014) 1928–1936
Contents lists available at ScienceDirect
Expert Systems with Applications
journal homepage: www.elsevier .com/locate /eswa
Extending market basket analysis with graph miningtechniques: A real case
0957-4174/$ - see front matter � 2013 Elsevier Ltd. All rights reserved.http://dx.doi.org/10.1016/j.eswa.2013.08.088
⇑ Corresponding author.E-mail addresses: [email protected] (I.F. Videla-Cavieres), [email protected]
(S.A. Ríos).URLs: http://www.ceine.cl (I.F. Videla-Cavieres), http://www.ceine.cl (S.A. Ríos).
Ivan F. Videla-Cavieres ⇑, Sebastián A. RíosUniversity of Chile, Department of Industrial Engineering, Business Intelligence Research Center (CEINE), Santiago, Chile
a r t i c l e i n f o a b s t r a c t
Keywords:Market basket analysisGraph miningRetailProduct networkBig dataOverlap communities
A common problem for many companies, like retail stores, it is to find sets of products that are soldtogether. The only source of information available is the history of sales transactional data. Commontechniques of market basket analysis fail when processing huge amounts of scattered data, findingmeaningless relationships. We developed a novel approach for market basket analysis based on graphmining techniques, able to process millions of scattered transactions. We demonstrate the effectivenessof our approach in a wholesale supermarket chain and a retail supermarket chain, processing around238,000,000 and 128,000,000 transactions respectively compared to classical approach.
� 2013 Elsevier Ltd. All rights reserved.
1. Introduction
Over decades retail chains and department stores have beenselling their products without using the transactional data gener-ated by their sales as a source of knowledge. Recently – in the lasttwo decades – companies started to use this data to discover infor-mation. In the 90’s limited computational capabilities made theextraction of knowledge from millions of daily transactions unfea-sible, and only analysis with simple models and reduced datasetswere possible. In 1993, Agrawal (Agrawal, Imielinski, & Swami,1993; Agrawal & Srikant, 1994) showed that many organizationswere getting bigger databases with transactional data, consumerdata, sales records, etc. Therefore, they proposed the Apriori algo-rithm (Agrawal & Srikant, 1994) for a large data set for those years.
Today, computational systems have evolved – both hardwareand software – and have been implemented in all areas ofcompanies (CRMs, ERPs, MRPs, Data Marts, Data Warehouses, adhoc systems, etc.), allowing the storage and processing of hugeamounts of data. Similarly, it is possible to develop complex mod-els and algorithms to gather knowledge from such huge databases.
A classical approach to getting information from data in retailand department stores is through market basket analysis (MBA),frequent item set discovery and clustering techniques such asK-means (Hartigan & Wong, 1979), SOM (Kohonen, 1990). Themain idea behind this is to discover purchasing patterns fromtransactional data. However, when we used these techniques toprocess real supermarket chain data, the results obtained were of
very poor quality. For example, with K-means techniques onlyone cluster grouped 93% of transactions and the 7% remaining isnot meaningful. Therefore, poor quality information was generateddisabling decisions such as finding customers profiles, discountoffers generation, supermarket products layout, etc. Thus, wedeveloped a novel approach to perform MBA based on graph min-ing techniques; specifically using overlap communities, that allowsto generate highly related products to each other within thecommunity. We benchmarked our method using severaltraditional approaches applied over millions of transactional data.The results of our evaluation show that our approach out–performsthe traditional methods.
2. Definitions and related work
This work is focused on generating frequent item sets of prod-ucts based on transactional data generated by a retail chain. Themain idea is to obtain sets of meaningful products so we cangenerate customer profiles, product layout and recommendationsfrom related products.
In the following sections we will explain the datasets overwhich we apply our methods; the classical approach and thestate-of-art techniques based on graph mining over transactionaldata.
2.1. Data
We have data from two retail chains in Chile. One is a wholesalesupermarket oriented to supply products to grocery store owners,hereafter, referred to as Retail A. The second is member of one ofthe biggest retail holdings in Chile called Retail B.
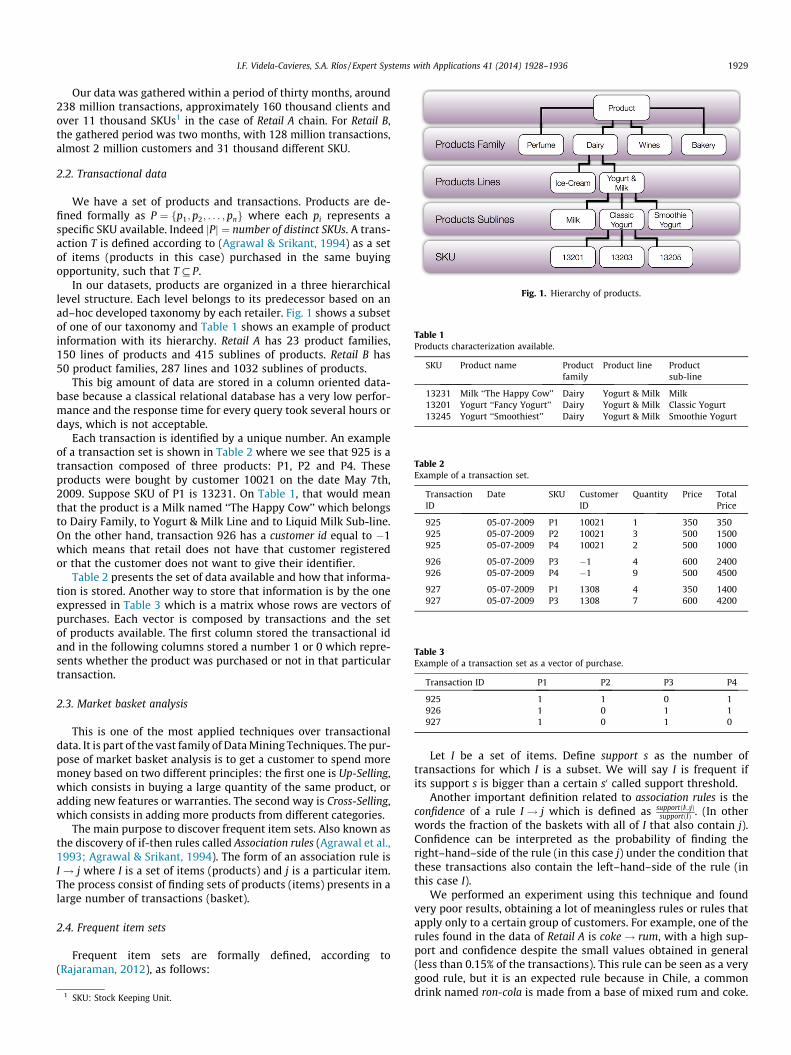
Fig. 1. Hierarchy of products.
Table 1Products characterization available.
SKU Product name Productfamily
Product line Productsub-line
13231 Milk ‘‘The Happy Cow’’ Dairy Yogurt & Milk Milk13201 Yogurt ‘‘Fancy Yogurt’’ Dairy Yogurt & Milk Classic Yogurt13245 Yogurt ‘‘Smoothiest’’ Dairy Yogurt & Milk Smoothie Yogurt
Table 2Example of a transaction set.
TransactionID
Date SKU CustomerID
Quantity Price TotalPrice
925 05-07-2009 P1 10021 1 350 350925 05-07-2009 P2 10021 3 500 1500925 05-07-2009 P4 10021 2 500 1000
926 05-07-2009 P3 �1 4 600 2400926 05-07-2009 P4 �1 9 500 4500
927 05-07-2009 P1 1308 4 350 1400927 05-07-2009 P3 1308 7 600 4200
Table 3Example of a transaction set as a vector of purchase.
Transaction ID P1 P2 P3 P4
925 1 1 0 1926 1 0 1 1927 1 0 1 0
I.F. Videla-Cavieres, S.A. Ríos / Expert Systems with Applications 41 (2014) 1928–1936 1929
Our data was gathered within a period of thirty months, around238 million transactions, approximately 160 thousand clients andover 11 thousand SKUs1 in the case of Retail A chain. For Retail B,the gathered period was two months, with 128 million transactions,almost 2 million customers and 31 thousand different SKU.
2.2. Transactional data
We have a set of products and transactions. Products are de-fined formally as P ¼ fp1; p2; . . . ; png where each pi represents aspecific SKU available. Indeed Pj j ¼ number of distinct SKUs. A trans-action T is defined according to (Agrawal & Srikant, 1994) as a setof items (products in this case) purchased in the same buyingopportunity, such that T # P.
In our datasets, products are organized in a three hierarchicallevel structure. Each level belongs to its predecessor based on anad–hoc developed taxonomy by each retailer. Fig. 1 shows a subsetof one of our taxonomy and Table 1 shows an example of productinformation with its hierarchy. Retail A has 23 product families,150 lines of products and 415 sublines of products. Retail B has50 product families, 287 lines and 1032 sublines of products.
This big amount of data are stored in a column oriented data-base because a classical relational database has a very low perfor-mance and the response time for every query took several hours ordays, which is not acceptable.
Each transaction is identified by a unique number. An exampleof a transaction set is shown in Table 2 where we see that 925 is atransaction composed of three products: P1, P2 and P4. Theseproducts were bought by customer 10021 on the date May 7th,2009. Suppose SKU of P1 is 13231. On Table 1, that would meanthat the product is a Milk named ‘‘The Happy Cow’’ which belongsto Dairy Family, to Yogurt & Milk Line and to Liquid Milk Sub-line.On the other hand, transaction 926 has a customer id equal to �1which means that retail does not have that customer registeredor that the customer does not want to give their identifier.
Table 2 presents the set of data available and how that informa-tion is stored. Another way to store that information is by the oneexpressed in Table 3 which is a matrix whose rows are vectors ofpurchases. Each vector is composed by transactions and the setof products available. The first column stored the transactional idand in the following columns stored a number 1 or 0 which repre-sents whether the product was purchased or not in that particulartransaction.
2.3. Market basket analysis
This is one of the most applied techniques over transactionaldata. It is part of the vast family of Data Mining Techniques. The pur-pose of market basket analysis is to get a customer to spend moremoney based on two different principles: the first one is Up-Selling,which consists in buying a large quantity of the same product, oradding new features or warranties. The second way is Cross-Selling,which consists in adding more products from different categories.
The main purpose to discover frequent item sets. Also known asthe discovery of if-then rules called Association rules (Agrawal et al.,1993; Agrawal & Srikant, 1994). The form of an association rule isI ! j where I is a set of items (products) and j is a particular item.The process consist of finding sets of products (items) presents in alarge number of transactions (basket).
2.4. Frequent item sets
Frequent item sets are formally defined, according to(Rajaraman, 2012), as follows:
1 SKU: Stock Keeping Unit.
Let I be a set of items. Define support s as the number oftransactions for which I is a subset. We will say I is frequent ifits support s is bigger than a certain s0 called support threshold.
Another important definition related to association rules is theconfidence of a rule I ! j which is defined as supportðI[jÞ
supportðIÞ . (In otherwords the fraction of the baskets with all of I that also contain j).Confidence can be interpreted as the probability of finding theright–hand–side of the rule (in this case j) under the condition thatthese transactions also contain the left–hand–side of the rule (inthis case I).
We performed an experiment using this technique and foundvery poor results, obtaining a lot of meaningless rules or rules thatapply only to a certain group of customers. For example, one of therules found in the data of Retail A is coke! rum, with a high sup-port and confidence despite the small values obtained in general(less than 0.15% of the transactions). This rule can be seen as a verygood rule, but it is an expected rule because in Chile, a commondrink named ron-cola is made from a base of mixed rum and coke.

Table 4Top 18 families per cluster after execute K-means algorithm with K ¼ 7.
Clusters Cluster 1 Cluster 2 Cluster 3 Cluster 4 Cluster 5 Cluster 6 Cluster 7
% Transactions involved 5,1 10,8 46,8 5,5 11,4 13,4 7,0Families Yoghurt Soft Drinks Cigarettes French Fries Milk Yoghurt Long Noodles
Milk Nectars Milk Cookies Yoghurt Frozen Desserts SugarSugar Milk Cheese Snacks Frozen Desserts Milk RiceToilet Paper Cookies Cookies Milk Nectars Cookies Tomato SauceVegetable Oil Yoghurt Nectars Souffle Cheese Nectars Vegetable OilTomato Sauce Mineral Water Toilet Paper Yoghurt Margarine Cheese Short NoodlesMargarine Beers Margarine Nectars Butter Milk Toilet PaperJuice (Powder) Cheese Sugar Soft Drinks Cookies Margarine YoghurtCheese Toilet Paper Vegetable Oil Biscuits Soft Drinks Sausage MilkShort Noodles Sausage Sausage Soft Candy Juice (Powder) Toilet Paper TeaRice Wine Juice (Powder) Pretzels Milk Juice (Powder) MargarineLong Noodles French Fries Beers Cookies Toilet Paper Biscuits SaltCookies Juice (Powder) Frozen Desserts Frozen Desserts Sausage Pretzels Juice (Powder)Bleach Sugar Wine Hard Candies Sugar Soft Drinks SausageFrozen Desserts Vegetable Oil Paper Towels Chocolate Sausage Butter BleachNectars Biscuits Flour Juice (Powder) Vegetable Oil Sugar DetergentMayonnaise Margarine Chocolate Cheese Bleach Cereals CookiesTea Pretzels Pretzels Toilet Paper Delicacy Sausage Mayonnaise
1930 I.F. Videla-Cavieres, S.A. Ríos / Expert Systems with Applications 41 (2014) 1928–1936
This rule also only applies to liquor store owners, not to grocerystore owners. In some contexts this can be useful, but for the cus-tomer characterization that we are developing, it is not useful.
2.5. Benchmark experiments
We applied K-means and SOM techniques to our data set,obtaining results that were far from being useful. From K-meanswe basically obtained the same cluster independent of the numberof clusters K that we required. Table 4 shows the top 18 categoriesfound by K-means, each column displayed is sorted by the mem-bership of each product family to the respective cluster.
It is clear from Table 4 that clusters are very similar and show-ing no real difference between them. Also, analysts said that theseclusters are meaningless to them, resulting in no new informationfrom this clusterization. As a manner to depict this fact: Cluster 5and Cluster 6 are very similar. (In fact the top three families arethe same in both clusters.).
In the case of SOM we obtained basically meaningless informa-tion. These facts motivated us to propose a new methodology togenerate clusters of products related between them as we describein Section 3. This methodology tries to find a meaningful item setwith an approach based on product network with overlappingcommunity detection.
3. Proposed methodology
In previous the section we present that classic approach do notgive meaningful results. This motivated us to propose a new meth-odology based on product networks and overlapping communitiesdetection as a frequent item set detection algorithm. In this sectionwe will show how are generated these products network and willshow our proposal of a Temporally Transactional Weighted ProductsNetworks. Later we will present what is understood as communityand their relation with frequent item set.
We present in this section our approach that is a novel way ofgenerating frequent itemsets through community discovery. Fromnow on we will refer to frequent itemsets as community.
3.1. Product network and graph construction
A network is defined as a set of elements interconnectedbetween each other. A common way to represent a network is
using a graph. A graph is a manner to specify relationships betweensets of items. Formally, a graph consists of a set of objects, callednodes with some pairs of them connected by links called edges.
A product network is defined as a network where nodes repre-sent products and edges represent relationships between a pairof them. We have to define what kind of relationship is representedby an edge. In this case, an edge between two products representsthat both products are present in the same ticket from the samebuyer opportunity.
We use a network representation based on transactional datashown in Section 2.2. In this subsection we will show how we buildour product network.
Kim, Kim, and Chen (2012) show a way to build a bipartitecustomer product network, that links users with products, thoughwe believe that this approach is limited because it only generateslinks between customers that have been already identified and losevaluable information that can be obtained by using the whole setof transactions available. We prefer to generate a network of prod-ucts in the same way as (Raeder & Chawla, 2009), based only ontransactions where each product is linked to others because theyappear in the same ticket from the same buyer opportunity, thiskind of network is named co–purchased product network. We thenapply a temporary set of filters to check quality and stability ofthe communities found. We named this generated networksTemporally Transactional Weighted Product Network.
The building process of the temporally transactional weightedproduct network is divided in three equally important phases. Thefirst one is to build a set of temporal (daily, weekly, monthly, quar-terly, semesterly, yearly) information with the same structure asthe one exhibited in Table 3. Once we have this information, westart to build our transactional product bipartite network whereeach transaction is linked to the products that are purchased inthat particular transaction (as in Fig. 2(a)). Here, the set of transac-tions T and products P represents the two disjointed sets requiredto build a bipartite graph. Finally, we move from that bipartite net-work to the co-purchased product network as shown in Fig. 2(b).
After this processing we obtained a product–to–productweighted network. These networks can be represented by anadjacency matrix showing the weight between each pair of prod-ucts. The weight is the number of tickets, in which a couple ofproducts are present simultaneously. In Table 5 we show thisrepresentation.
Similarly to (Raeder & Chawla, 2009) we found the sameproblems, such as very dense products networks with highly
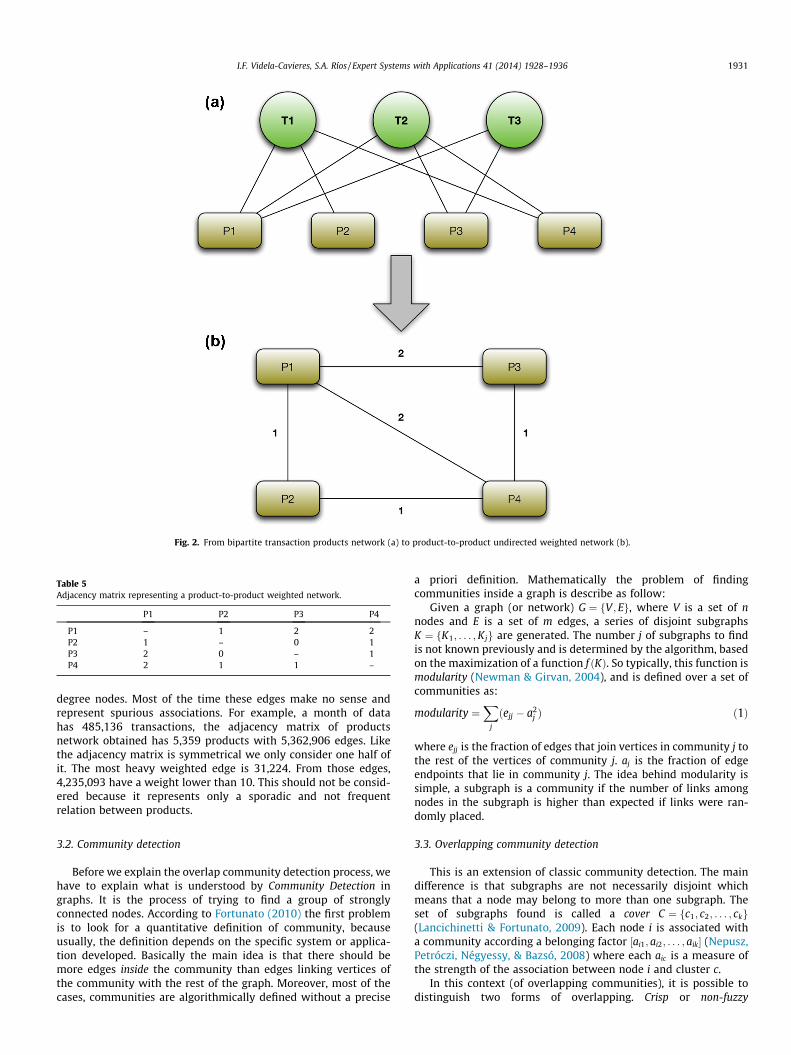
Fig. 2. From bipartite transaction products network (a) to product-to-product undirected weighted network (b).
Table 5Adjacency matrix representing a product-to-product weighted network.
P1 P2 P3 P4
P1 – 1 2 2P2 1 – 0 1P3 2 0 – 1P4 2 1 1 –
I.F. Videla-Cavieres, S.A. Ríos / Expert Systems with Applications 41 (2014) 1928–1936 1931
degree nodes. Most of the time these edges make no sense andrepresent spurious associations. For example, a month of datahas 485,136 transactions, the adjacency matrix of productsnetwork obtained has 5,359 products with 5,362,906 edges. Likethe adjacency matrix is symmetrical we only consider one half ofit. The most heavy weighted edge is 31,224. From those edges,4,235,093 have a weight lower than 10. This should not be consid-ered because it represents only a sporadic and not frequentrelation between products.
3.2. Community detection
Before we explain the overlap community detection process, wehave to explain what is understood by Community Detection ingraphs. It is the process of trying to find a group of stronglyconnected nodes. According to Fortunato (2010) the first problemis to look for a quantitative definition of community, becauseusually, the definition depends on the specific system or applica-tion developed. Basically the main idea is that there should bemore edges inside the community than edges linking vertices ofthe community with the rest of the graph. Moreover, most of thecases, communities are algorithmically defined without a precise
a priori definition. Mathematically the problem of findingcommunities inside a graph is describe as follow:
Given a graph (or network) G ¼ fV ; Eg, where V is a set of nnodes and E is a set of m edges, a series of disjoint subgraphsK ¼ fK1; . . . ;Kjg are generated. The number j of subgraphs to findis not known previously and is determined by the algorithm, basedon the maximization of a function f ðKÞ. So typically, this function ismodularity (Newman & Girvan, 2004), and is defined over a set ofcommunities as:
modularity ¼X
j
ðejj � a2j Þ ð1Þ
where ejj is the fraction of edges that join vertices in community j tothe rest of the vertices of community j. aj is the fraction of edgeendpoints that lie in community j. The idea behind modularity issimple, a subgraph is a community if the number of links amongnodes in the subgraph is higher than expected if links were ran-domly placed.
3.3. Overlapping community detection
This is an extension of classic community detection. The maindifference is that subgraphs are not necessarily disjoint whichmeans that a node may belong to more than one subgraph. Theset of subgraphs found is called a cover C ¼ fc1; c2; . . . ; ckg(Lancichinetti & Fortunato, 2009). Each node i is associated witha community according a belonging factor ½ai1; ai2; . . . ; aik� (Nepusz,Petróczi, Négyessy, & Bazsó, 2008) where each aic is a measure ofthe strength of the association between node i and cluster c.
In this context (of overlapping communities), it is possible todistinguish two forms of overlapping. Crisp or non-fuzzy
1932 I.F. Videla-Cavieres, S.A. Ríos / Expert Systems with Applications 41 (2014) 1928–1936
overlapping where each node belongs to one or more communitieswith equal strength: a network vertex either belongs to a commu-nity or it does not. On the other hand, in fuzzy overlapping, eachvertex may belong to more than one community but the strengthof its membership to each community may vary. In both cases,without loss of generality, this constraint can be assumed:
0 6 aik 6 1; 8i 2 V ; 8k 2 C
and
XjCj
k¼1
aik ¼ 1; 8i 2 V ð2Þ
where jCj is the number of clusters in cover C.
3.4. Algorithms for overlapping community detection
An important number of algorithms have been developed todiscover overlapped communities. These algorithms vary in effec-tiveness and performance depending on the type of network.
Xie, Kelley, and Szymanski (2013) present a state of the art inoverlapping community detection. They present algorithms andcategorized each one into five different classes based on the wayin which communities are identified. Founded on this work (Xieet al., 2013) we decided to use the two algorithms with best perfor-mance –including quality of results and execution time–. These areCOPRA (Gregory, 2010) and SLPA (GANXiS nowadays) (Xie,Szymanski, & Liu, 2011). Both are based on the label propagationalgorithm (Raghavan, Albert, & Kumara, 2007), in which nodeswith the same label form a community. COPRA updates its belong-ing coefficients by averaging the coefficients from all its neighbors.Otherwise SLPA is a general speaker-listener algorithm based inthe process of information propagation. SLPA spreads labelsbetween nodes according to pairwise interaction rules. SLPA pro-vides each node with a memory to store received information indifference to COPRA where a node forgets knowledge gained inthe previous iterations.
3.5. Threshold setup methodology
We showed that these product networks presents high degreenodes with spurious edges between them. To remove spuriousedges, a threshold s has to be defined, then the graph is fully re-vised in the search of edges with a weight s0 lower than s (s0 6 s).The edges that match with this criteria are removed. Raeder andChawla (2009) decided to filter those edges that have a weightlower than 10. Kim et al. (2012) filter the co–purchased networkby choosing a threshold s equal to the average value of all links.
We found that there is no common criteria to choose a thresh-old. This makes it highly necessary to remove these spurious edges,in an objective way, because it is clear that a particular number(constant) like 10 or the average value of all links are very partic-ular thresholds that apply to particular instances or certain data.For instance, in our case, 10 is not a good threshold because thenetwork obtained after applying this threshold still contain spuri-ous edges and isolated nodes that does not produce communitiesof good quality.
We generate this threshold based on a process denominated topthree heavy edges threshold (tthet) which was used in both retailerdata, proving its effectiveness. This approach consists in rankingthe edges E ¼ fE1; E2; . . . ; Emg based on the weight of these in adescendant order. Then tthet is equal to the average of the topthree edges.
tthet ¼ Emax þ E2nd max þ E3rd max
3ð3Þ
where Emax makes reference to the heaviest edge, E2nd max andE3rd max to the second and third heaviest edges respectively.
3.6. Network filter methodology
In the case of Retail A we obtained 1,492 Temporally Transac-tional Weighted Product Networks and in the case of Retail B we ob-tained over 12,000. To each one of these Temporally TransactionalWeighted Product Networks we computed a threshold using Eq. (3).
If we apply the obtained tthet to its corresponding network,only one or two elements would satisfy the minimum edge weightimposed by the threshold. Since tthet allows us to keep the mostrelevant part of the Temporally Transactional Weighted ProductNetwork, making useless the analysis.
This fact prompted us to generate a set of filters using the tthet,that allow gradually incorporating relevant edges and nodes intoour analysis. These filters are a proportion of the top three heavyedges threshold (proportion is a percentage of the threshold). Thepercentages are: Percentage ¼ f5%;10%; . . . ;95%;100%g; thesepercentages give 20 filters (or new thresholds), as a result of adot product between percentage and tthet resulting in:
filters ¼ percentage� tthet
equal to:
filters ¼ f0:05 � tthet;0:1 � tthet; . . . ;0:95 � tthet; tthetg
It is clear that for each threshold we have a set of twenty filtersassociated with the same Temporally Transactional Weighted ProductNetwork.
We applied immediately these filters to Temporally Transac-tional Weighted Product Networks giving as a result a new set thatwe denominated as Filtered Temporally Transactional WeightedProduct Networks composed of a 29,500 filtered networks in RetailA and over 200,000 in the case of Retail B.
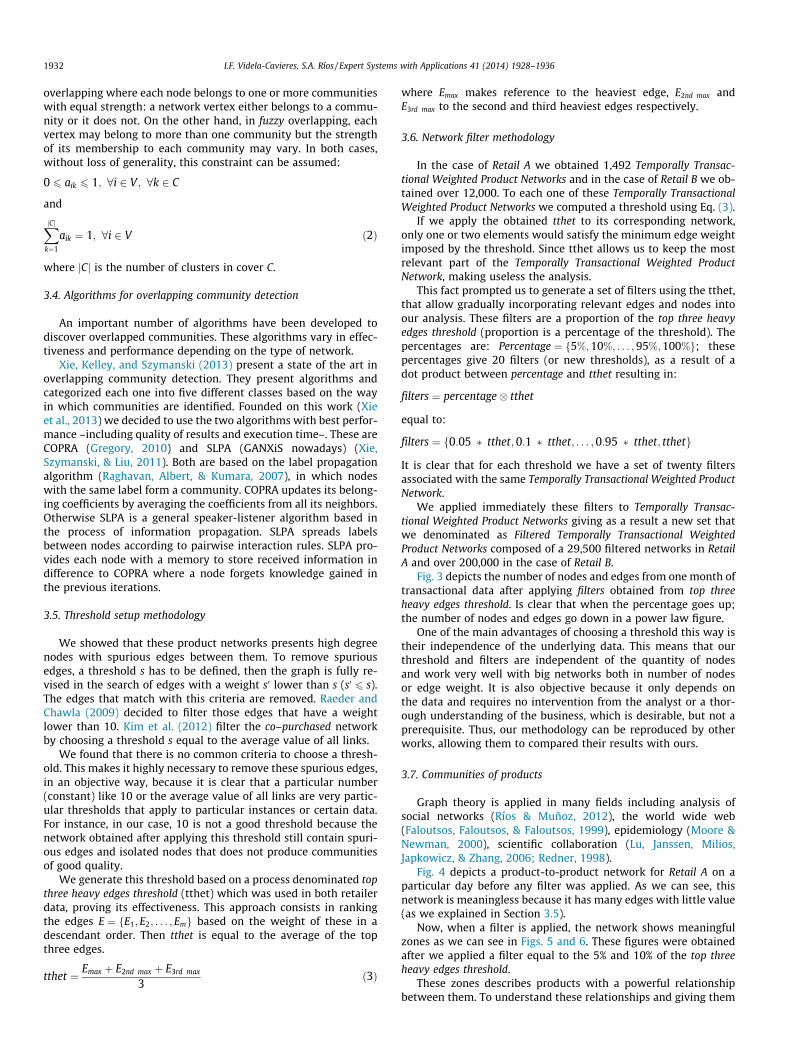
Fig. 3 depicts the number of nodes and edges from one month oftransactional data after applying filters obtained from top threeheavy edges threshold. Is clear that when the percentage goes up;the number of nodes and edges go down in a power law figure.
One of the main advantages of choosing a threshold this way istheir independence of the underlying data. This means that ourthreshold and filters are independent of the quantity of nodesand work very well with big networks both in number of nodesor edge weight. It is also objective because it only depends onthe data and requires no intervention from the analyst or a thor-ough understanding of the business, which is desirable, but not aprerequisite. Thus, our methodology can be reproduced by otherworks, allowing them to compared their results with ours.
3.7. Communities of products
Graph theory is applied in many fields including analysis ofsocial networks (Ríos & Muñoz, 2012), the world wide web(Faloutsos, Faloutsos, & Faloutsos, 1999), epidemiology (Moore &Newman, 2000), scientific collaboration (Lu, Janssen, Milios,Japkowicz, & Zhang, 2006; Redner, 1998).
Fig. 4 depicts a product-to-product network for Retail A on aparticular day before any filter was applied. As we can see, thisnetwork is meaningless because it has many edges with little value(as we explained in Section 3.5).
Now, when a filter is applied, the network shows meaningfulzones as we can see in Figs. 5 and 6. These figures were obtainedafter we applied a filter equal to the 5% and 10% of the top threeheavy edges threshold.
These zones describes products with a powerful relationshipbetween them. To understand these relationships and giving them

0
100
200
300
400
500
600
5% 10% 15% 20% 25% 30% 35% 40% 45% 50% 55% 60% 65% 70% 75% 80% 85% 90% 95% 100% 0
500
1000
1500
2000
2500
Num
ber o
f nod
es
Num
ber o
f edg
es
Threshold as a percent of the top three heavy edges threshold
Number of nodes and edges through different cuts
Nodes
Edges
Fig. 3. Graph depicting the number of nodes and edges through different cuts over a month period.
Fig. 4. Visualization of the product-to-product network without filters.
Fig. 5. Product-to-product network with a 5% filter.
Fig. 6. Product-to-product network with a 10% filter.
I.F. Videla-Cavieres, S.A. Ríos / Expert Systems with Applications 41 (2014) 1928–1936 1933
a meaningful interpretation is that we applied an overlap commu-nity detection process.
After we have generated our set of Filtered Temporally Transac-tional Weighted Products Networks it is time to apply the algorithmsfor overlapping community detection, described previously in Sec-tion 3.4. We apply to each of the Temporally Transactional WeightedProduct Networks (over 29,000 and 12,000 for Retail A and Retail Brespectively) COPRA and SLPA algorithms.
Both algorithms take a network as an input and generate a fileas an output with the communities discovered inside. COPRAgenerates only one file with the communities and SLPA generatesa number of files that are the product of the number of repetitionsthat a user selects –10 in our case– and a threshold r. Taking values
in ½0;1� (r 2 ½0;1� specifically (0.01;0.05;0.1;0.15;. . .;0.5)) and usedas a filter to the number of labels that, a particular node can havechecking if the probability of seeing a particular label during thewhole process is lower than r. If that occurs, this label is removedfrom node’s memory. When r ! 1 the algorithm tends to find dis-jointed communities. This is explain because only nodes in onecommunity can have a high probability that can overcome thethreshold represented by r. After the entire process the nodes aregrouped into communities with the same label. If a node has morethan one label it is grouped into several communities.
SLPA is executed in a series of runs. A run is an execution of anSLPA algorithm. In each run different values of r(r 2 f0:01; . . . ; 0:5g) are used. Every time the algorithm is executed,a new node is chosen randomly making it necessary to run theSLPA algorithm several times, to avoid that because SLPA startedfrom a ‘good’ node the results were improved. We try to find theresults that are maintained over time or between executions.
Once the Filtered Temporally Transactional Weighted ProductNetworks are processed by the algorithms we have as result over3.2 million files in Retail A and over 18 million files in Retail B.
3.8. Evaluating results
Having 101 files for each Filtered Temporally TransactionalWeighted Product Networks it is necessary to find a way to discoverwhich file (from 101 available) has the best community represen-tation based on a criteria. As explained in Section 3.2, this criteria ismodularity.

Table 6Metadata of a temporally transactional weighted product network for november, 2012.
Network # of Nodes # of Edges Period Begin date End date
graph_month_201211 23,615 24,153,638 Monthly 2012-11-01 2012-11-30
1934 I.F. Videla-Cavieres, S.A. Ríos / Expert Systems with Applications 41 (2014) 1928–1936
To obtain modularities we apply a program to each file withtheir corresponding Filtered Temporally Transactional WeightedProduct Network and obtained an equal number of modularity textfiles. These were parsed and inserted into a column orienteddatabase so we could filter by different criteria such as time win-dow, number of nodes, number of edges and modularity value.
As a manner to depict the process we show in Table 6 the meta-data of a Temporally Transactional Weighted Product Network forNovember, 2012 for a set of supermarket stores from Retail B.
In Table 7 the metadata of one of the twenty filtered networksobtained after apply a threshold is shown. The threshold applied isequal to 1,286 –equivalent to the 5 % of the top three heavy edgesthreshold–. Finally, in Table 8, the information of the results gath-ered from the appliance of SLPA and COPRA algorithms arepresented.
We present a subset of the results from SLPA (10 from 101available) and the result obtained from COPRA in Table 8. Thistable shows the results for SLPA algorithm after one run.
Table 7Metadata of a filtered temporally transactional weighted product network fornovember, 2012.
Network # of Nodes # of Edges Threshold
filtered_graph_month_201211 356 1,133 1,286
Table 8Results from one iteration of SLPA and COPRA algorithms.
Network Modularity # ofcommunities
# ofproducts
#overlaps
r
SLPA_1 0,586 28 358 2 0.01SLPA_2 0,602 29 360 4 0.05SLPA_3 0,607 29 358 2 0.10SLPA_4 0,607 29 358 2 0.15SLPA_5 0,607 29 358 2 0.20SLPA_6 0,607 29 358 2 0.25SLPA_7 0,607 29 358 2 0.30SLPA_8 0,610 29 357 1 0.35SLPA_9 0,617 29 356 0 0.40SLPA_10 0,617 29 356 0 0.45SLPA_11 0,607 28 356 0 0.50COPRA_1 0,394 45 361 5 N/A
Table 910 largest communities discovered (order by number of products inside) whichaccount for 85% of the products in the network.
Community # of products Description
1 242 Grocery2 15 Soft Drinks & Beers3 10 Convenience Food4 6 Juice Powder Brand A5 6 Juice Powder Brand B6 6 Liquid Juice Brand C7 5 Yoghurt Brand D8 5 Yoghurt Brand E9 5 Liquid Juice Brand F10 5 Cookies Brand G
As we can see from Table 8; Both algorithms utilize all productsavailable –356 in this case–. For example, in SLPA_7 the number ofproducts is 358, because 2 are overlapped. The COPRA algorithmdiscovered more communities than the SLPA algorithm, butmodularity obtained from COPRA is worst than SLPA due to the factthat 30 communities from COPRA are singletons. On the otherhand, the larger number of overlapped products found by COPRAis explained by the fact that COPRA found similar communitiesthat only differed in one product. For example, for a pair ofcommunities found there is a ¼ f269324;901093;901095g andb ¼ f269324;901096;901095g, which are almost the same com-munity except, for the middle product. A product identified bySKU equal to 901096 is missing in the case of a and SKU equal to901093 in the case of b.
We also found a relationship that is present in almost all resultsobtained from SLPA, that the higher number of overlapped prod-ucts is found when r 6 0:2. This is because when r is small(r ! 0), too many nodes can overcome this threshold, as explainedpreviously.
3.9. Discovered communities
Once the algorithms were applied, we had as a result a set ofcommunities of products, where each product is related to eachother. In this section we will describe the communities found, interms of the meaning of this products within the community.
Table 9 depicts the top ten communities ordered by the numberof products inside. We also provide a description from the analystsfrom Retail B who study the products involved and gave thisdescription.
It is very important to note that these results changed the opin-ion of the business analysts, because they believed that peoplewere not loyal to a specific brand –in the sense of buying productsof the same brand–. However, the results showed that people areloyal to a brand in most cases, the only exception being Drinks &Beers.
The average number of products inside a community is 7, givingto the analyst a manageable number of products, that can be inter-preted and characterized. This is one of the advantages of our work,
Fig. 7. Visualization of the product-to-product network with each product associ-ated to their corresponding community.

Fig. 8. Number of products per community discovered by SLPA.
Fig. 9. Zoom to communities discovered by SLPA.
I.F. Videla-Cavieres, S.A. Ríos / Expert Systems with Applications 41 (2014) 1928–1936 1935
because for a lower quality information from the association rules.A deep and complex analysis must be performed.
We previously present in Section 3.7 how a graph looks after weapply our top three heavy edges threshold. Now in Fig. 7 we showhow the graph looks with each node colored according their corre-sponding community. We found a big community of groceriesaccording to an analyst description depicted in green, and the restof communities in different colors.
We found a property also present in Clauset, Newman, andMoore (2004) and Arenas, Danon, Díaz-Guilera, Gleiser, andGuimerà (2004) that is when a network is partitioned in such away to maximize modularity, the community sizes q appears to
have a power-law form PðqÞ � q�w for some constant w. In this casethis constant is w ’ 1:3 considering all the communities availableand w ’ 0:63 if we exclude the first community. The number ofproducts in each community are depicted in Fig. 8. The respectivepower-law function is also plotted.
Fig. 9 is a zoom of the plot presented in Fig. 8. It leaves the firstcommunity out of the plot and only shows the 28 communitiesremaining. The coefficient of determination denoted by R2 is 0:86considering all the communities and 0:93 if we remove the firstcommunity. From both figures and the value of R2, it is clear thatpower-law function fits very well with the number of elementsfound in each community.

1936 I.F. Videla-Cavieres, S.A. Ríos / Expert Systems with Applications 41 (2014) 1928–1936
4. Conclusion
We have shown a novel approach that uses graph miningtechniques to perform market basket analysis and the use ofoverlapping community detection algorithms as frequent itemset discovery technique. Is also presented as a way to extract usefulinformation from millions of product sales transactions.
We introduce the concept of Temporally Transactional WeightedProduct Network which allows to cover different information needsfrom retailers and other organizations. These networks can besliced by a mix of different criteria, such as time window (daily,weekly, monthly, etc.), a particular store, a cluster of stores orthe entire Retail transactions.
We propose an objective methodology for threshold and filterssetup in order to reduce noisy data (independent from the nodesand edges quantity). Firstly, we proposed the top three heavy edgesthreshold method. An unsupervised threshold that only depends onthe data available. Secondly, we defined filters which are a propor-tion of the top three heavy edges threshold. Combining both, weensure that the study can be reproduced and can also be extendedto other data sets.
Subsequently, we propose the application of overlappingcommunity detection algorithms as a manner to generate frequentitem sets. We performed a benchmark using state–of–the–artalgorithms COPRA and SLPA. We also apply state–of–the–artfrequent item set algorithms such as K-means, SOM and Apriori.The benchmark was realized in a wholesale supermarket chainand a retail supermarket chain, processing around 238;000; 000and 128; 000;000 transactions respectively.
We asked the Retail business experts to compare our methodol-ogy results with traditional market basket analysis algorithms likeApriori, K-Means, and SOM. We discovered that results from tradi-tional techniques were far from being useful, because clusters wereformed by huge amounts of mixed products, thus, a segmentationbased on these results was meaningless. The main reason was thespars nature of supermarket data and the big size of informationinvolved.
However, with our methodology we were able to producemeaningful and useful frequent item sets. For example, using K-means we obtained mainly 2 representative clusters and one ofthese concentrate 93% of the products (around 14,000), versusour method, which found –in the same data– 30 clusters (commu-nities) with an average of 7 products. It is clear that 7 products is amanageable number for any analyst. Another example are Apriorialgorithm results which gave several rules with very low supportand confidence.
Our approach has shown that it can be used as a valid techniqueto discover frequent item sets present in transactional data. Isimportant to remark that the information given is very useful forretail, depicting relationships that were not obvious for the analystof the retail. For example, that people is loyal to a particular brandinstead of a mix of brands as expected.
In future work, one could try to use these communities ofproducts to generate a fuzzy customer profile. This profile couldbe generated based on previous purchases mixed with productcommunities. Amongst other applications, product communities
together with customer profiles could be useful for generatingpersonalized recommendations based on customer’s historicalpreferences.
Acknowledgements
The authors would like to acknowledge the support of theChilean Millennium Institute of Complex Engineering Systems(ICM: P05-004-F FIN. ICM-FIC). We also would like to acknowledgeto the Business Intelligence Research Center (CEINE) for theircontinuous support.
References
Agrawal, R., & Srikant, R. (1994). Fast algorithms for mining association rules. InProceedings of 20th international conference on very large data bases, VLDB (pp. 1–32).
Agrawal, R., Imielinski, T., & Swami, A. (1993). Database mining: A performanceperspective. IEEE Transactions on Knowledge and Data Engineering, 5(6),914–925.
Arenas, A., Danon, L., Díaz-Guilera, A., Gleiser, P. M., & Guimerà, R. (2004).Community analysis in social networks. The European Physical Journal B –Condensed Matter and Complex Systems, 38(2), 373–380.
Clauset, A., Newman, M., & Moore, C. (2004). Finding community structure in verylarge networks. Physical Review E, 70(6), 066111.
Faloutsos, M., Faloutsos, P., & Faloutsos, C. (1999). On power-law relationships ofthe internet topology. ACM SIGCOMM Computer Communication, 29(4), 251–262.
Fortunato, S. (2010). Community detection in graphs. Physics Reports, 486(3),75–174.
Gregory, S. (2010). Finding overlapping communities in networks by labelpropagation. New Journal of Physics, 12(10), 103018.
Hartigan, J., & Wong, M. (1979). Algorithm AS 136: A K-means clustering algorithm.Journal of the Royal Statistical Society. Series C (Applied Statistics), 28(1), 100–108.
Kim, H. K., Kim, J. K., & Chen, Q. Y. (2012). A product network analysis for extendingthe market basket analysis. Expert Systems with Applications, 39(8), 7403–7410.
Kohonen, T. (1990). The self-organizing map. Proceedings of the IEEE, 78(9),1464–1480.
Lancichinetti, A., & Fortunato, S. (2009). Benchmarks for testing communitydetection algorithms on directed and weighted graphs with overlappingcommunities. Physical Review E, 1–9.
Lu, W., Janssen, J., Milios, E., Japkowicz, N., & Zhang, Y. (2006). Node similarity in thecitation graph. Knowledge and Information Systems, 11(1), 105–129.
Moore, C., & Newman, M. (2000). Epidemics and percolation in small-worldnetworks. Physical Review E, 61(5), 5678.
Nepusz, T., Petróczi, A., Négyessy, L., & Bazsó, F. (2008). Fuzzy communities and theconcept of bridgeness in complex networks. Physical Review E, 1, 1–13.
Newman, M., & Girvan, M. (2004). Finding and evaluating community structure innetworks. Physical Review E, 69(2), 026113.
Raeder, T., & Chawla, N. V. (2009). Modeling a store’s product space as a socialnetwork. In 2009 International conference on advances in social network analysisand mining (pp. 164–169). IEEE.
Raghavan, U., Albert, R., & Kumara, S. (2007). Near linear time algorithm to detectcommunity structures in large-scale networks. Physical Review E, 1–12.
Rajaraman, A., & Ullman, J. D. (2012). Mining of massive datasets. CambridgeUniversity Press.
Redner, S. (1998). How popular is your paper? An empirical study of the citationdistribution. The European Physical Journal B – Condensed Matter and ComplexSystems, 200(i), 1–4.
Ríos, S., & Muñoz, R. (2012). Dark Web portal overlapping community detectionbased on topic models. In Proceedings of the ACM SIGKDD workshop onintelligence and security informatics (pp. 1–7).
Xie, J., Szymanski, B., & Liu, X. (2011). SLPA: Uncovering overlapping communities insocial networks via a speaker-listener interaction dynamic process. In ICDMW2011, 11th IEEE international conference on data mining.
Xie, J., Kelley, S., & Szymanski, B. (2013). Overlapping community detection innetworks: The state of the art and comparative study. ACM Computing Surveys,45(4), 1–37.
Related Documents