Welcome message from author
This document is posted to help you gain knowledge. Please leave a comment to let me know what you think about it! Share it to your friends and learn new things together.
Transcript
Expert Group onHousehold Income
Statistics
The Canberra International ExpertGroup on Household IncomeStatistics met between December1996 and May 2000 to developstandards on conceptual andpractical issues related to theproduction of household incomedistribution statistics. The aimwas to improve national andinternational statistics in this field.These recommendations are theculmination of the Group’s work.They will be of interest both to datacompilers and to data analysts aswell as to a wide range of users ofthese important statistics.
ISBN 0-9688524-0-8
cover.p65 2/14/2001, 3:56 PM1

Expert Group onHousehold Income
Statistics
The Canberra group
Final Reportand
Recommendations
Ottawa 2001
ISBN 0-9688524-0-8

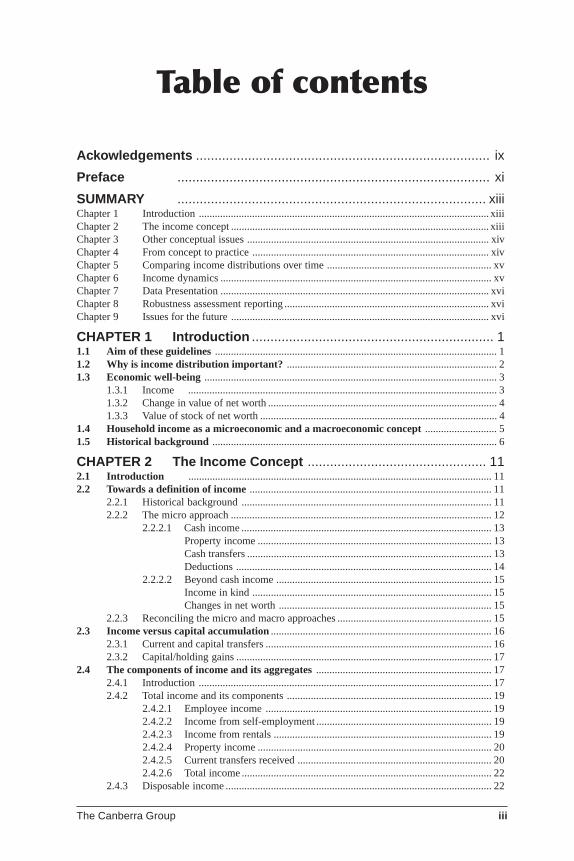
Table of contents
The Canberra Group iii
Ackowledgements ............................................................................... ix
Preface .................................................................................... xi
SUMMARY ................................................................................... xiiiChapter 1 Introduction ............................................................................................................. xiiiChapter 2 The income concept ................................................................................................. xiiiChapter 3 Other conceptual issues ........................................................................................... xivChapter 4 From concept to practice ......................................................................................... xivChapter 5 Comparing income distributions over time .............................................................. xvChapter 6 Income dynamics ...................................................................................................... xvChapter 7 Data Presentation ..................................................................................................... xviChapter 8 Robustness assessment reporting ............................................................................. xviChapter 9 Issues for the future ................................................................................................. xvi
CHAPTER 1 Introduction ................................................................. 11.1 Aim of these guidelines .......................................................................................................... 11.2 Why is income distribution important? ............................................................................... 21.3 Economic well-being .............................................................................................................. 3
1.3.1 Income .................................................................................................................... 31.3.2 Change in value of net worth ...................................................................................... 41.3.3 Value of stock of net worth ......................................................................................... 4
1.4 Household income as a microeconomic and a macroeconomic concept ........................... 51.5 Historical background ........................................................................................................... 6
CHAPTER 2 The Income Concept ................................................ 112.1 Introduction .................................................................................................................. 112.2 Towards a definition of income ........................................................................................... 11
2.2.1 Historical background .............................................................................................. 112.2.2 The micro approach .................................................................................................. 12
2.2.2.1 Cash income .............................................................................................. 13Property income ........................................................................................ 13Cash transfers ............................................................................................ 13Deductions ................................................................................................ 14
2.2.2.2 Beyond cash income ................................................................................. 15Income in kind .......................................................................................... 15Changes in net worth ................................................................................ 15
2.2.3 Reconciling the micro and macro approaches .......................................................... 152.3 Income versus capital accumulation ................................................................................... 16
2.3.1 Current and capital transfers ..................................................................................... 162.3.2 Capital/holding gains ................................................................................................ 17
2.4 The components of income and its aggregates .................................................................. 172.4.1 Introduction .............................................................................................................. 172.4.2 Total income and its components ............................................................................. 19
2.4.2.1 Employee income ..................................................................................... 192.4.2.2 Income from self-employment .................................................................. 192.4.2.3 Income from rentals .................................................................................. 192.4.2.4 Property income ........................................................................................ 202.4.2.5 Current transfers received ......................................................................... 202.4.2.6 Total income .............................................................................................. 22
2.4.3 Disposable income .................................................................................................... 22

Table of contents
iv The Canberra Group
Table of contents2.4.3.1 Current transfers paid ................................................................................ 222.4.3.2 Disposable income .................................................................................... 22
2.4.4 Adjusted disposable income and social transfers in kind ......................................... 222.4.4.1 Social transfers in kind ............................................................................. 22
2.4.5 Choosing between income measures ........................................................................ 242.4.5.1 Total, disposable and adjusted disposable income ................................... 242.4.5.2 Cash only or cash and non-cash income ................................................... 25
2.5 Extension to consumption and accumulation .................................................................... 252.5.1 Introduction .............................................................................................................. 252.5.2 Household consumption expenditure ....................................................................... 25
2.5.2.1 Inter-household transfers .......................................................................... 262.5.2.2 Voluntary transfers between households and other units .......................... 27
Transfers to charities ................................................................................. 27Lotteries and gambling ............................................................................. 27Non-life insurance ..................................................................................... 28
2.5.3 Holdings gains and losses ......................................................................................... 28
CHAPTER 3 Other Conceptual Issues ......................................... 313.1 Introduction .................................................................................................................. 313.2 Accounting period ................................................................................................................ 313.3 Statistical units .................................................................................................................. 32
3.3.1 Introduction .............................................................................................................. 323.3.2 Definitions of statistical units ................................................................................... 33
3.3.2.1 Unattached individuals - Persons not in families: ..................................... 333.3.2.2 Households ............................................................................................... 34
Definition .................................................................................................. 34Impact on the income sharing assumption ............................................... 34Practical measurement implications ......................................................... 35Associating persons with dwellings: ........................................................ 35Definition of a dwelling: ........................................................................... 36
3.3.2.3 Broadly defined families ........................................................................... 36Definition .................................................................................................. 36Impact on the income sharing assumption ............................................... 36
3.3.2.4 Nuclear families ........................................................................................ 36Definition .................................................................................................. 36Impact on the income sharing assumption ............................................... 36
3.3.3 Choice of unit and the measurement of income ....................................................... 373.3.3.1 Owner-occupied housing .......................................................................... 373.3.3.2 Goods and services provided to employee as part of employment
package ..................................................................................................... 373.3.4 Recommendations for harmonised statistical units .................................................. 383.3.5 Equivalence scales .................................................................................................... 403.3.6 Population weighting ................................................................................................ 41
3.4 Use of price indices ............................................................................................................... 423.5 Use of Purchasing Power Parities ....................................................................................... 43
CHAPTER 4 From Concepts to Practice ...................................... 454.1 Introduction .................................................................................................................. 454.2 Data availability .................................................................................................................. 47
4.2.1 Introduction .............................................................................................................. 474.2.2 The metasurvey ......................................................................................................... 474.2.3 The results ................................................................................................................. 48
4.2.3.1 Employee income ..................................................................................... 48

Expert Group on Household Income Statistics
The Canberra Group v
4.2.3.2 Income from self-employment .................................................................. 484.2.3.3 Income from rentals .................................................................................. 494.2.3.4 Property income ........................................................................................ 494.2.3.5 Current transfers received ......................................................................... 494.2.3.6 Deductions of current transfers paid ......................................................... 494.2.3.7 Social transfers in kind ............................................................................. 504.2.3.8 Other items ................................................................................................ 50
4.2.4 Conclusions .............................................................................................................. 504.3 Assessing the validity of income distribution results ......................................................... 51
4.3.1 Introduction .............................................................................................................. 514.3.2 Imperfections and ambiguities in income data ......................................................... 51
4.3.2.1 Incomplete coverage of the population ..................................................... 524.3.2.2 Other groups who may be excluded from surveys are: ............................ 524.3.2.3 Representativeness of sample ................................................................... 534.3.2.4 Inaccurate income data on those who are represented in the dataset ....... 534.3.2.5 Other imperfections in income data .......................................................... 55
4.3.3 Results sensitive to equivalence scales ..................................................................... 564.3.4 Price indices .............................................................................................................. 57
4.4 Options for choice of a practical definition ........................................................................ 584.4.1 Producing comparable estimates .............................................................................. 584.4.2 Experiences from the Luxembourg Income Study (LIS) ......................................... 594.4.3 A practical definition of income for international comparisons ............................... 604.4.4 Towards a more complete income definition ............................................................ 62
4.4.4.1 Property Income, Self-Employment Income and Own AccountProduction ................................................................................................. 63
4.4.4.2 Net Imputed Rent for Owner-Occupied Dwellings. ................................. 634.4.4.3 Social Transfers In-Kind. .......................................................................... 644.4.4.4 Capital gains ............................................................................................. 66
CHAPTER 5 Comparing Income Distributions Over Time .......... 695.1 Introduction .................................................................................................................. 695.2 Impact of measurement error ............................................................................................. 705.3 Issues for the data originator .............................................................................................. 715.4 Issues for secondary dataset producers .............................................................................. 725.5 Issues for the end user .......................................................................................................... 74
5.5.1 Detecting Trends ....................................................................................................... 745.5.2 Significance of Changes ........................................................................................... 775.5.3 Trends versus episodes ............................................................................................. 78
CHAPTER 6 Income Dynamics ..................................................... 816.1 Introduction .................................................................................................................. 816.2 The relative advantages and disadvantages of longitudinal surveys ............................... 816.3 International examples of longitudinal income surveys ................................................... 83
6.3.1 Survey of Labour and Income Dynamics ................................................................. 836.3.2 Panel Study of Income Dynamics ............................................................................ 846.3.3 Survey of Income and Program Participation ........................................................... 846.3.4 European Community Household Panel Survey ...................................................... 84
6.4 Some applications of longitudinal surveys ......................................................................... 846.4.1 Labour Market Dynamics ......................................................................................... 856.4.2 Family Economic Mobility ....................................................................................... 866.4.3 Low income dynamics .............................................................................................. 86
Table of contents

Table of contents
vi The Canberra Group
CHAPTER 7 Data Presentation ..................................................... 897.1 Introduction .................................................................................................................. 897.2 Units of analysis and classification ..................................................................................... 897.3 Summary measures of income level: the mean and the median ...................................... 927.4 Measures of income dispersion ........................................................................................... 93
The frequency diagram .......................................................................................................... 937.4.1 The Lorenz curve ...................................................................................................... 957.4.2 The Gini coefficient .................................................................................................. 967.4.3 Quantile groups ........................................................................................................ 977.4.4 Other summary measures ....................................................................................... 101
7.5 Income composition ........................................................................................................... 102
CHAPTER 8 Robustness Assessment Reporting ..................... 1038.1 Introduction ................................................................................................................ 1038.2 Guiding principles .............................................................................................................. 103
Robustness of income distribution results to data imperfections ........................... 105
CHAPTER 9 Issues for the Future9.1 Introduction ................................................................................................................ 1079.2 Where next for household economic well-being? ............................................................ 108
9.2.1 Transfers within and between households .............................................................. 1089.2.2 Relationships between income, expenditure and wealth ........................................ 1099.2.3 Non-monetary income from household production ............................................... 110
9.3 Challenges for income measurement from economic transformation ........................... 1129.3.1 Changing role of the public and private sectors ..................................................... 1129.3.2 Informal sector ........................................................................................................ 113
Appendix 1 Definitions of the Components of Income ............ 1151. Employee income ................................................................................................................ 115
1.1 Cash wages and salaries ......................................................................................... 1151.2 Tips and bonuses .................................................................................................... 1151.3 Profit sharing including stock options .................................................................... 1161.4 Severance and termination pay ............................................................................... 1161.5 Allowances payable for working in remote locations etc, where part of1.6 Employers’ social insurance contributions ............................................................. 1171.7 Goods and services provided to employee as part of employment package .......... 118
2. Income from self-employment ........................................................................................... 1182.1 Profit/loss from unincorporated enterprise ............................................................. 1182.2 Royalties ................................................................................................................ 1192.3 Income from goods and services produced for barter ............................................ 1202.4 Goods produced for home consumption ................................................................ 1202.5 Income less expenses from owner-occupied dwellings .......................................... 120
3. Income less expenses from rentals, except rent of land .................................................. 1214. Property income received .................................................................................................. 122
4.1 Interest received less interest paid .......................................................................... 1224.2 Dividends received ................................................................................................. 1234.3 Rent from land ........................................................................................................ 123
5. Current transfers received ................................................................................................. 1235.1 Social insurance benefits from employers’ schemes .............................................. 1245.2 Social insurance benefits in cash from government .............................................. 1255.3 Universal (ie not means-tested) social assistance benefits in cash
from government .................................................................................................... 1255.4 Means-tested social assistance benefits in cash ...................................................... 126
Table of contents
Expert Group on Household Income Statistics
The Canberra Group vii
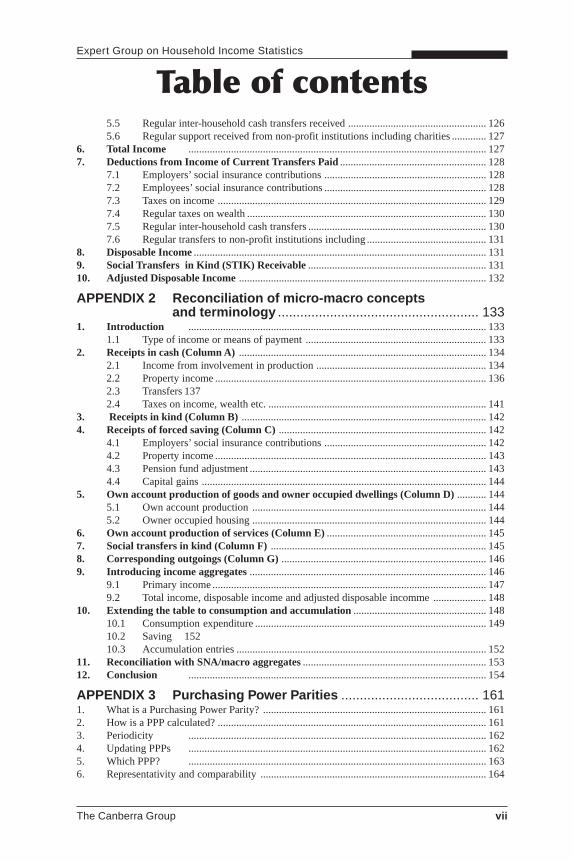
5.5 Regular inter-household cash transfers received .................................................... 1265.6 Regular support received from non-profit institutions including charities ............. 127
6. Total Income ................................................................................................................ 1277. Deductions from Income of Current Transfers Paid ....................................................... 128
7.1 Employers’ social insurance contributions ............................................................. 1287.2 Employees’ social insurance contributions ............................................................. 1287.3 Taxes on income ..................................................................................................... 1297.4 Regular taxes on wealth .......................................................................................... 1307.5 Regular inter-household cash transfers ................................................................... 1307.6 Regular transfers to non-profit institutions including ............................................. 131
8. Disposable Income .............................................................................................................. 1319. Social Transfers in Kind (STIK) Receivable ................................................................... 13110. Adjusted Disposable Income ............................................................................................. 132
APPENDIX 2 Reconciliation of micro-macro conceptsand terminology ...................................................... 133
1. Introduction ................................................................................................................ 1331.1 Type of income or means of payment .................................................................... 133
2. Receipts in cash (Column A) ............................................................................................. 1342.1 Income from involvement in production ................................................................ 1342.2 Property income ...................................................................................................... 1362.3 Transfers 1372.4 Taxes on income, wealth etc. .................................................................................. 141
3. Receipts in kind (Column B) ............................................................................................ 1424. Receipts of forced saving (Column C) .............................................................................. 142
4.1 Employers’ social insurance contributions ............................................................. 1424.2 Property income ...................................................................................................... 1434.3 Pension fund adjustment ......................................................................................... 1434.4 Capital gains ........................................................................................................... 144
5. Own account production of goods and owner occupied dwellings (Column D) ........... 1445.1 Own account production ........................................................................................ 1445.2 Owner occupied housing ........................................................................................ 144
6. Own account production of services (Column E) ............................................................ 1457. Social transfers in kind (Column F) ................................................................................. 1458. Corresponding outgoings (Column G) ............................................................................. 1469. Introducing income aggregates ......................................................................................... 146
9.1 Primary income ....................................................................................................... 1479.2 Total income, disposable income and adjusted disposable incomme .................... 148
10. Extending the table to consumption and accumulation .................................................. 14810.1 Consumption expenditure ....................................................................................... 14910.2 Saving 15210.3 Accumulation entries .............................................................................................. 152
11. Reconciliation with SNA/macro aggregates ..................................................................... 15312. Conclusion ................................................................................................................ 154
APPENDIX 3 Purchasing Power Parities ..................................... 1611. What is a Purchasing Power Parity? .................................................................................... 1612. How is a PPP calculated? ..................................................................................................... 1613. Periodicity ................................................................................................................ 1624. Updating PPPs ................................................................................................................ 1625. Which PPP? ................................................................................................................ 1636. Representativity and comparability ..................................................................................... 164
Table of contents

Table of contents
viii The Canberra Group
7. PPPs for different income groups? ....................................................................................... 1648. Conclusion ................................................................................................................ 166
APPENDIX 4 Availability of Income Data .................................... 167
APPENDIX 5 Robustness of National Accounts Estimates ....... 1791. Overview ................................................................................................................ 1792. The output measure .............................................................................................................. 1793. The income measure ............................................................................................................ 1804. The expenditure measure ..................................................................................................... 1815. Reconciling the three measures ............................................................................................ 182
APPENDIX 6 Robustness Assessment Report for IncomeDistribution Data ..................................................... 183
Appendix 7 Extract from “Recommendations of the TaskForce on Statistics on Social Exclusionand Poverty,” Eurostat, 1998 .................................. 191
Requirements for a First Release or Press Notice and for Statistics in Focus ................................. 191Requirements for more detailed reports .......................................................................................... 192Compendium, anthology or omnibus publications ......................................................................... 193
Bibliography ................................................................................. 195
List of Tables and FiguresTable 2.1 Definitions of income ............................................................................................. 18Table 2.2 Extension of definition of income to consumption and accumulation .................. 30Table 3.1 Canberra Group recommendations for harmonised statistical units ...................... 38Table 4.1 Components of disposable income ......................................................................... 61Appendix 2Table 1 Income distribution from both a micro and macro perspective ........................... 155Table 2 Extension to consumption and accumulation ....................................................... 159Appendix 4Table 1 Income Component code list ................................................................................ 168Table 2 Summary of Income Component Data Collection ............................................... 172
Chapter 5Figure 5.1 Inequality in country X: an illustration of three pitfalls ......................................... 75Figure 5.2 Trends in Income Inequality: Gini Coefficients in country Y ................................ 76Figure 5.3 Trends in Income Inequality: Gini Coefficients (1986=1) in country Z ................ 77Figure 5.4 Trends in Income Inequality (Gini coefficients)Percentage
Change per Year and Absolute Change per Year: 1979-97 ..................................... 78Figure 5.5. Trend in Income Inequality: Gini Coefficients (1983=1) in country H ................. 79
Chapter 7Figure 7.1 Average household equivalent disposable income: by life-stage type,
1996 ($ per year) .................................................................................................... 91Figure 7.2 Changes in mean and median household equivalent disposable income ............... 92Figure 7.3 Frequency distribution of income ........................................................................... 93Figure 7.4 Quasi-exact depiction of the world income distribution ........................................ 94Figure 7.5 Lorenz curves for the distribution of equivalent household disposable income .... 95Figure 7.6 Lorenz curves for the distribution of equivalent household disposable income .... 96Figure 7.7 Share of household disposable income between decile groups ............................. 98Figure 7.8 The distance1 between the 1st and the 4th quintiles and the 1st and 9th deciles ........ 99Figure 7.9 Ratios between decile group shares of income (A) and between
decile points (B) ................................................................................................... 100
Table of contents

Ackowledgements
The Canberra Group ix
This report has been made possible through the contributions of all those listed belowwho attended one or more of the four meetings of the Canberra Group. All tookpart as experts in the field of income distribution statistics rather than as membersof a particular organisation though their institutional affiliation (at the time of themeeting(s) they attended) is also given.
Particular thanks are due to the members of the Editorial Review Board whotook responsibility for agreeing the final text with valuable input from members ofthe whole Canberra Group:
Jenny Church (Consultant Editor)Anne Harrison (OECD)Marion McEwin (Australian Bureau of Statistics)Leon Pietsch (Australian Bureau of Statistics)Mike Sheridan (Statistics Canada)Timothy Smeeding (Luxembourg Income Study)Paul Van Der Laan (Statistics Netherlands)Daniel Weinberg (US Bureau of the Census)
A. National organisationsAUSTRALIAAcademy of Social Sciences
Ian CastlesAustralian Bureau of Statistics
Marion McEwinHarry KroonMaureen McDonaldGeorge Sarossy
Commonwealth TreasuryPhil Gallagher
Department of Social SecurityPeter Whiteford
National Centre for Social andEconomic Modelling
Ann HardingUniversity of Melbourne
Duncan Ironmonger
CANADAInformetrica Limited
Michael McCrackenStatistics Canada
Cathy CottonIan MacredieMike SheridanMaryanne WebberStew Wells
CHINAState Statistical Bureau
Qingxin MengTing Shi
FINLANDStatistics Finland
Veli-Matti TörmälehtoPekka Ruotsalainen

Table of contents
x The Canberra Group
GERMANYGerman Institute for Economic Research
Gert WagnerINDIADepartment of Statistics
Prabhakar JoshiITALYBank of Italy
Giovanni D’AlessioJAPANStatistics Bureau
Takehiro FukuiYoshiyuki Kobayashi
KOREANational Statistical Office
Sa-Im WooMALAYSIADepartment of Statistics
Abdul Rahman HasanSaidah Hashim
MEXICOInstituto Nacional de Estadistica,Geografia e Informática
Patricia Méndez CarniadoNETHERLANDSMinistry of Finance
Leo van den EndeStatistics Netherlands
Wim BosBen GrubbenPaul van der LaanPeter MeuwissenJos SchiepersClemens SiermannLourens Trimp
NEW ZEALANDStatistics New Zealand
Dianne MacaskillJohn ScottHelen Stott
NORWAYStatistics Norway
Jon EplandSWEDENStatistics Sweden
Kjell JanssonLeif Johansson
UNITED KINGDOMDepartment of Social Security
Gordon HarrisOffice for National Statistics
Tim HarrisNigel Stuttard
UNITED STATESBureau of the Census
Daniel WeinbergBureau of Labor Statistics
Thesia Garner
B. International agenciesCentre d’Études de Populations, dePauvreté et de Politiques Socio-économiques/International Network for Studies inTechnology, Environment, Alternatives,
Development (CEPS/INSTEAD)Frédéric BergerUwe Warner
Statistical Office of the EuropeanCommunities (EUROSTAT)
Antonio BaigorriAnne ClemenceauPieter EveraersAlfred Franz (Consultant)Eric MarlierLene MejerJohn Walton (Consultant)Christine Wirtz
Inter-American DevelopmentBank (IADB)
José Antonio MejíaInternational Labour Office (ILO)
Marie-Thérèse DupréSylvester Young
Luxembourg Employment Study(LES) at CEPS/INSTEAD
Jean-Yves BienvenueJean-Marie Jungblut
Luxembourg Income Study (LIS)at CEPS/INSTEAD
Paul AlkemadeAnn MorissensTim SmeedingKoen Vleminckx
Organisation for EconomicCo-operation and Development (OECD)
Heinrich BrünggerAnne HarrisonPeter Scherer
United Nations Economic Commissionfor Latin America and the Caribbean(ECLAC)
Juan Carlos FeresPedro Sáinz
The World BankHaeduck LeeMichael Ward

Preface
The Canberra Group xi
T he initiative to organise an International Expert Group on Household IncomeStatistics was taken by the Australian Bureau of Statistics in order to workon the development of statistics on household economic well-being and
particularly on household income. The initiative was a reaction to a growingawareness that, in advancing the quality of their own household income statistics,national statistical offices shared many problems. In particular the comparative OECDstudy on income distribution (Atkinson et al. 1995) triggered off a renewed discussionon the underlying quality and comparability of household income data. Expectationswere that combining forces would help solve conceptual and methodologicalproblems, and would thus result in more relevant and reliable national statistics whichcould also be used for international comparisons on income distribution.
The International Expert Group met for the first time in Canberra, Australia and,taking its name from the venue of the First Meeting, is known as the ‘CanberraGroup’. It follows a now well-established phenomenon of City-named Expert Groupsset up under the auspices of the United Nations Statistical Commission. The traditionstarted with the Voorburg Group on service statistics, which was first set up in 1986and first met in Voorburg, the Netherlands, in January 1987. According to the UnitedNations Statistical Commission the role of City Group is:
• To contribute actively to the development of international standards in theirrespective areas of work, within the framework set by the international workprogramme;
• To exchange best practices in their area of work;
• To produce specific outputs (advice, classifications, manuals) requested by theStatistical Commission.
Objectives of the Canberra GroupThe primary objective of the Canberra Group was to enhance national householdincome statistics by developing standards on conceptual and practical issues relatedto the production of income distribution statistics. Its work was in support of arevision of international guidelines on income distribution statistics. The Group wouldaddress collectively the common conceptual, definitional and practical problems facedby national and international statistical agencies in this subject area and would actas a forum for expert opinions on conceptual and methodological issues and for

Preface
xii The Canberra Group
obtaining endorsement for guidelines. It was hoped that a combined approach tosolving these conceptual and methodological problems would result not only inimproved national statistics, but also in improved data for international comparisonson household income distribution.
Meetings and participantsThe Canberra Group was designed to be a flexible working group of experts inhousehold income statistics from both national and international organisations.Members of the Group included representatives from national statistical agencies,government departments and research agencies from Europe, North and SouthAmerica, Asia, Australia and New Zealand as well as from a number of internationalorganisations and research agencies. All members attended as experts rather thanofficial representatives of their organisations. A central tenet of all City Groups isthat their members take part in a personal capacity without necessarily committingtheir employers. At the outset, the Group decided that English should be its soleworking language.
From December 1996 to May 2000 the Canberra Group met four times. Over70 participants from 26 national organisations and 7 international organisations wereinvolved in the work of the Canberra Group (See Acknowledgements page at thefront of this volume). Reports of the First, Second and Third Meeting of the CanberraGroup were published in February 1997, May 1998 and November 1999 respectively(See International Expert Group on Household Income Statistics 1997, 1998 and1999). This document represents the final Report of the Group.
The Group’s work has benefited from contributions from other individuals andorganisations. Professor A B Atkinson (Nuffield College, Oxford) and Mr AndreaBrandolini (Bank of Italy, Research Department) have both made major contributionsto papers discussed by the Group. The discussions of the Expert Group meeting onIncome Distribution Statistics convened by Eurostat in December 1999 provided anadditional forum. The International Association for Research into Income and Wealthhas played a major role both in the birth of the Group as a result of a session onInternational Standards on Income and Wealth Distribution at its 24th GeneralConference at Lillehammer, Norway in August 1996, and in enabling peer reviewof the Group’s outputs at a session at the 26th General Conference in Cracow, Polandin August 2000 when some of the draft chapters of this Report were presented anddiscussed.

Summary
The Canberra Group xiii
Chapter 1 Introduction… sets out the aims of these Guidelines and their intended audience, and describestheir historical background. They are a guide to compilers, and also data analystsand other users, on how to prepare harmonised and comparable statistics on householdincome distribution. The manual represents a synthesis of prevailing ideas and triesto be faithful to the concept of income and its theoretical definition, while takingaccount of the practical difficulties of data collection and presentation.
The main motivation for the production of household income statistics is themeasurement of economic well-being. However, income is not the only way in whichthe concept of economic well-being can be characterised, and this introductorychapter also considers the broader conceptual issues underlying its nature.
Although the Guidelines are primarily aimed at the users and producers of micro-level income statistics, the concept of household income is equally familiar to nationalaccounts practitioners. As in practice the two sets of statistics are rarely produced ina harmonised manner, however, the manual attempts to interpret the differences ofapproach and terminology to what is in fact a single concept.
Chapter 2 The income concept… seeks to establish conceptual groundrules for defining and measuring householdincome, ignoring for the time being considerations of data quality and availability.A hierarchy of components of income is built up which provides definitions of total,disposable and adjusted disposable income, described in more detail in Appendix 1.Appendix 2 reconciles these micro concepts with the macro concepts familiar tonational accountants, demonstrating how the different categories of income can beassembled to meet the needs of different types of analyses coming from the twotraditions.
THE CANBERRA GROUP RECOMMENDS THAT THECONCEPTUAL FRAMEWORK SET OUT IN TABLE 2.1 BE ADOPTEDAS THE FRAMEWORK FOR INCOME DISTRIBUTION ANALYSIS,RECOGNISING THAT NOT ALL OF IT CAN BE IMPLEMENTED FORPRACTICAL PURPOSES.
This chapter also explains how the concept of income is related to those ofhousehold consumption and capital accumulation.

Summary
xiv The Canberra Group
Chapter 3 Other conceptual issues… discusses the other important conceptual issues which have to be resolved beforeincome distribution statistics can be compiled. It is necessary to decide whichstatistical units are to be used and the length of the accounting period to which thestatistics refer. If households are the chosen unit, then the effect of variation in theirsize and composition on their relative needs has to be taken into account. The use ofequivalence scales to adjust for such differences is discussed.
THE CANBERRA GROUP RECOMMENDS THAT THE ACCOUNTINGPERIOD TO BE USED FOR INCOME DISTRIBUTION ANALYSISSHOULD BE ONE YEAR, AND THAT THE HOUSEHOLD, ASDEFINED IN TABLE 3.1, BE ADOPTED AS THE BASIC STATISTICALUNIT, WITH THE OTHER UNITS SET OUT IN TABLE 3.1 ASALTERNATIVES FOR PARTICULAR PURPOSES.
THE GROUP FURTHER RECOMMENDS THAT INCOME SHOULDBE ADJUSTED TO TAKE ACCOUNT OF HOUSEHOLD SIZE, USINGEQUIVALENCE SCALES.
Most comparisons of income distribution statistics across time or betweencountries are made in relative terms using measures which are invariant to absolutelevels of income. However, if income distribution statistics expressed in money termsare to be compared either spatially or temporally, an added consideration is how totake account of price differences in order to compare real incomes. For validcomparisons of real incomes between countries or other geographic areas, the useof Purchasing Power Parities is discussed, and for comparisons within a country theuse of relevant price indices is addressed. Appendix 3 provides background onPurchasing Power Parities.
THE CANBERRA GROUP RECOMMENDS THAT WHEN CROSS-COUNTRY COMPARISONS OF REAL INCOMES ARE TO BE MADE,PURCHASING POWER PARITIES SHOULD BE USED INPREFERENCE TO EXCHANGE RATES.
Chapter 4 From concept to practice… provides an overview of the practical considerations which will determine theparameters for the production of a set of income distribution statistics. These are:
• Availability of data
• Quality of available data
• Purposes for which the statistics are required
The Canberra Group carried out a metasurvey of data availability in 25 countriesfrom all continents, the results of which are summarised here (details may be foundin Appendix 4). This illuminates differences in current practice and the extent to

Expert Group on Household Income Statistics
The Canberra Group xv
which they might allow the development and implementation of a consistentdefinition.
It is not enough that data are available from which income distribution statisticscan be compiled: they must be fit for purpose. This chapter goes on to identify themain sources of error or uncertainty which may underlie income distribution results,and draws on a survey of data quality amongst Canberra Group members to indicatewhich difficulties appear to be widespread. National Accounts aggregates are oneyardstick against which the quality of income distribution statistics may be assessed,though these themselves have some uncertainties as discussed in Appendix 5.
Both data availability and data quality will affect the choice of income definition.The options for choice of a practical income definition are discussed in the contextof making cross country comparisons and are developed based on the experience ofthe Luxembourg Income Study.
THE CANBERRA GROUP RECOMMENDS THAT THE PRACTICALDEFINITION OF INCOME SET OUT IN TABLE 4.1 BE ADOPTED FORUSE IN MAKING INTERNATIONAL COMPARISONS OF INCOME
Priorities are also suggested for the development of a more complete incomedefinition.
Chapter 5 Comparing income distributionsover time
… discusses the consistency requirements for making valid cross-time comparisonswithin a country, as well as the additional difficulty of comparing time trends acrosscountries. In this context guidance is provided for primary data producers; for thecompilers of secondary datasets which bring together time series estimates formultiple nations; and for the researchers and analysts who use both primary andsecondary sources.
THE CANBERRA GROUP RECOMMENDS THAT PRIMARY ANDSECONDARY PRODUCERS OF INCOME DISTRIBUTION STATISTICSBE MORE AWARE OF THE NEEDS OF USERS FOR TIME SERIES DATAAND THAT IMPROVEMENTS IN THE AVAILABILITY OF BOTH DATAAND METADATA BE GIVEN PRIORITY
Chapter 6 Income Dynamics… draws attention to the fact that cross-sectional data have a number of limitationsfor the study of change over time in income distributions. Longitudinal (panel) datahave an important role in providing insight into the way in which households ofdifferent types move within the distribution over time. However, they have drawbacksalso, in terms of attrition bias and cost of collection. Examples of panel surveys andtheir use are presented.

Summary
xvi The Canberra Group
Chapter 7 Data Presentation… provides a practical guide to presenting complex income distribution statistics ina clear, unambiguous and user-friendly manner, through the provision of a widevariety of examples. The user is warned of some of the pitfalls in presenting andinterpreting income distribution statistics, based on Canberra Group members’experiences.
Chapter 8 Robustness Assessment Reporting… complements the previous chapter, in that when the results of income distributionstudies are presented, they should always be accompanied by full information onthe sources and methods employed, and an assessment of their quality. It providesrecommendations on the forms of reporting which may be appropriate in individualanalyses and at various stages of producing and using income distribution statistics.A template for a robustness assessment report is set out in Appendix 6, andAppendix 7 presents Eurostat recommendations for presenting robustness data forestimates at varying levels of detail.
THE CANBERRA GROUP RECOMMENDS THAT INCOMEDISTRIBUTION STATISTICS BE ALWAYS ACCOMPANIED BYROBUSTNESS ASSESSMENT REPORTS AS SET OUT IN APPENDIX 6,SO THAT USERS MAY JUDGE THEIR FITNESS FOR PURPOSE.
Chapter 9 Issues for the future… draws together a number of issues which the Canberra Group recognise have stillto be resolved and which require further work. Some have already been touched onin earlier chapters – for example, the importance of expenditure and wealth ascomplementary measures of economic well-being. There is also a range ofdevelopments in the world economy which provide conceptual and methodologicalchallenges to the ways in which household income is measured today.
This chapter sets out this future agenda, hoping that others will rise to thechallenges it presents.
THE CANBERRA GROUP RECOMMENDS THAT THESEGUIDELINES BE PERIODICALLY REVIEWED TO ENSURE THATTHE ADVICE IS KEPT UP-TO-DATE WITH DEVELOPMENTS IN THEPRACTICE OF INCOME DISTRIBUTION COMPILATION AND INTHE ECONOMIC AND SOCIAL CONTEXTS IN WHICH THESTATISTICS ARE USED.

Chapter 1
Introduction
The Canberra Group 1
1.1 Aim of these guidelinesThis document is a guide to compilers, and hence data analysts and other users, onhow to prepare harmonised and comparable statistics on income distribution. It is asynthesis of prevailing ideas which tries to reconcile the dual concerns to be faithfulto the conceptual nature of income and its theoretical definition, whilst taking intoaccount the practical difficulties of data collection and compilation including thecosts involved both to the agencies producing the statistics and the householdsproviding the raw material.
The aim is to lay down useful guidelines for understanding the complex natureof income data, set in the context of prevailing ideas and best practices. These reflecthow economic societies are organised and people conduct their lives. Over thepassage of time, with social and political transformation, changes in the role ofgovernment, globalisation and so on, economic issues and priorities will change. Itis thus essential to retain a certain degree of flexibility in developing general standardsfor statistics on this topic. Thus, acknowledging that there is no single concept orset of concepts that fit all circumstances, the guidelines do not attempt to propose adefinitive set of standards for the compilation of income distribution statistics. Ratherthe aim is to give a systematic presentation of all the issues, both conceptual andpractical, which should be considered by producers and users of income distributionstatistics. Where sufficient consensus exists about best practice, recommendationsare made, in the hope that this will contribute in due course to the availability ofmore accurate, complete, and internationally comparable income statistics compiledto common standards. This should in turn lead to greater transparency in theirpresentation, and better informed use of what are inevitably some of the most complexstatistics produced by national and international organisations.
The guide is designed to be pragmatic. It is aimed mainly at those who areresponsible for compiling income distribution statistics, whether primary producers(originators) who collect and analyse data from primary sources or secondaryproducers who take processed data (micro, meso, or summary level) and derive theirown estimates and datasets from them. However, it will be of equal use to researchersand analysts who make use of the outputs from primary and secondary producers,in leading them to a better understanding of the underlying principles of incomedistribution statistics and the pitfalls in their practical implementation.

Chapter 1: Introduction
2 The Canberra Group
1.2 Why is income distribution important?Economic analysts and policy makers identify three main purposes for compilinginformation on income distribution. The first is driven by a desire to understandhow the pattern of income distribution can be related to patterns of economic activityand the returns to labour, capital and land, and to the way in which societies areorganised – ie to theoretical and institutional considerations. The second reflectsthe concern of policy makers to determine the need for both universal and sociallytargeted actions on different socio-economic groups and to assess their impact. Thethird is an interest in how different patterns of income distribution influence householdwell-being and people’s ability to acquire the goods and services they need to satisfytheir needs. These guidelines are driven by the need to produce statistics which fulfilall these purposes.
Producers of income distribution statistics therefore have to address suchquestions as:
• How unequal is the distribution of income in a given country? How does this comparewith earlier years, or with other countries?
• How many ‘poor’ people are there in a given country? How does this compare withearlier years, or with other countries?
• Who are the ‘poor’? Has this changed over time?
• Have the rich become richer? The poor become poorer?
The audience for income distribution statistics is usually less conscious of theambiguities surrounding concepts such as ‘income,’ ‘poor’ and ‘rich’ than are theproducers of the statistics. ‘Income’ may often be thought of by the user in terms ofcash income; the ‘poor’ are those whose lack of income means they are restricted toa low standard of living – i.e. there is an implicit assumption that ‘income’ constraintsare binding on poor people’s consumption - and the ‘rich’ are those who can afforda luxurious lifestyle. Typically, the main focus of interest is on changes over time,with differences between countries coming a close second. Statisticians’ statementsabout incomes are interpreted as statements about the living standards experiencedby different sections of the population; those with the lowest incomes are assumedto have the lowest living standards.
Thus interest in income distribution may be justified either per se as a way tosee how the benefits of national product are distributed across people, or indirectlyas the best proxy for the distribution of economic well-being. In a strictly utilitarianframework, the ideal measure of well-being would be the lifetime utility of a person.A utility measure should reflect differences in leisure as well as all forms of potentialconsumption, including home production and publicly provided goods; it should takeaccount of differences in constraints faced both by people living in the same country,and differences in constraints faced by people in different countries; it should accountfor differences in the ability to smooth income across periods. It is therefore clearthat household income measured over a period of perhaps a year is, at best, a proxyfor this ideal concept. On the other hand, income remains a fundamental determinantof people’s well-being in non-utilitarian frameworks, such as Sen’s capabilityapproach (Sen, 1992).
However, income is not the only way in which the concept of economic well-being can be characterised, and it is therefore useful first to consider the broaderconceptual issues underlying its nature, such as consumption, savings and wealth.

Expert Group on Household Income Statistics
The Canberra Group 3
1.3 Economic well-beingA household’s economic well-being can be expressed in terms of its access to goodsand services. The more that can be consumed, the higher the level of economic well-being, though the relationship between the two is not a linear one. Measuringconsumption might therefore be a way of measuring economic well-being. However,a household may be able to choose not to consume the maximum amount it couldin any given period but to save at least some of the resources it has available. Bysaving, households can accumulate wealth through the purchase of assets which willboth generate income at a later date and serve as a ‘nest-egg’ for spending at a latertime when income levels may be lower, or needs higher, than now. In addition topotentially earning a return for the household, ownership of wealth also affects theirbroader economic power. For example, wealthy households may find it easier togain credit to finance their consumption. Thus to capture the full extent of ahousehold’s economic well-being it is desirable to look at a number of differentaspects of their economic situation including not only income but also levels of wealth(hereafter referred to as level of net worth - assets minus liabilities) and changes inthe value of that wealth.
Analysis of economic well-being is usually primarily concerned with thecomparison of the actual or potential living standards of different groups in society,and sometimes between groups in different societies, at a point in time and also overa period of time. Policies to address problems of living standards usually focus onincome in some form or other. In other words, income is normally the most objectiveproxy for economic well-being for policy purposes. Therefore the focus of this reportis on measuring household income. But to be able to define income, and as a reminderthat income is not the only element of economic well-being, the remainder of thissection provides an overview of the relationship between economic well-being andincome, change in the value of net worth, and value of stock of net worth.
The economist’s concept of economic well-being also often encompasses thevalue of leisure time (or the disutility of labour). However, these guidelines assumethat income distribution statistics do not attempt to capture this element.
1.3.1 IncomeIn broad terms, income refers to regular receipts such as wages and salaries, incomefrom self employment, interest and dividends from invested funds, pensions or otherbenefits from social insurance and other current transfers receivable. Large andirregular receipts from inheritances and the like are considered to be capital transfersbecause it is unlikely that they will be spent immediately on receipt and are ‘one-off’ in nature.
Income presents a partial view of economic well-being and represents the regularor recurring receipts side of household economic accounts. It provides a measure ofresources available to the household for consumption and saving. On thedisbursements side of household accounts, consumption expenditure represents theday-to-day purchases that may be financed not only by regular or recurring incomebut also by savings from previous years or by incurring debt. For some households,such as retired households, the running down of capital for consumption mayrepresent a deliberate attempt on their part to even out consumption over a life time.Other groups in the population, such as farmers, may also average out their

Chapter 1: Introduction
4 The Canberra Group
consumption over a number of years while their incomes may show quite widefluctuations over the same period. In such cases, consumption expenditure mayrepresent a better estimate of the household’s sustainable standard of living.
There are difficulties in collecting data on both income and consumptionexpenditure in household surveys. Income is a sensitive issue for many respondentsand non-response or misreporting of some income components may be significant.On the other hand, data on consumption expenditure are often onerous and costly tocollect. In fact, the choice between the income or the consumption expenditureapproach to measuring economic well-being is often made for the analyst by thefact that income data may be more frequently available than data on consumptionexpenditure.
Nevertheless, it should be acknowledged explicitly at the outset that the approachto defining income taken in these guidelines is essentially consumption-based. Apositive resource flow (in money, goods or services) is considered as contributingtowards economic well-being if it increases the recipient’s potential to consume orsave, and a negative flow reduces well-being if it reduces the capacity to consumeor save.
1.3.2 Change in value of net worthWhether data on income or on expenditure are used for measuring economic well-being, the data should ideally be accompanied by some assessment of the change inthe value of the household’s net worth during the accounting period. If the level ofnet worth has increased, the increase will have resulted from saving (the differencebetween income and consumption), from the receipt of capital transfers, or from otherchanges in the value of assets, including capital or holding gains. Such a householdis likely to be better off in the long term than a household with a similar level ofconsumption that has financed this consumption by dissaving, that is, running downassets or incurring a liability. The question of whether the dissaving has beeninvoluntary or has been planned by saving in earlier periods is important in thiscontext.
1.3.3 Value of stock of net worthThe value of the stock of net worth owned by a household is the value of accumulatedassets less liabilities. As already noted, as well as possibly earning a return for thehousehold in the form of income, those households with high levels of net worthmay find it easier to gain credit for consumption or investment or to maximise thechoice of timing for different types of consumption. High levels of net worth canalso affect living standards by the potential for dissaving for consumption either nowor at a later date. For these reasons, it is important to ascertain, if possible, the valueof the household’s net worth to give a complete picture of the household’s commandover economic resources or economic well-being.
At a practical level, the collection of microdata on the assets and liabilities ofhouseholds can often be problematic. Such information may be even more sensitiveto the respondent than that on income and, because transactions are relativelyinfrequent, misreporting may be more prevalent. There are also considerabledifficulties in using data on stocks of wealth and data on transactions or flows in acombined measure of economic well-being. One option is to annuitise the net worthheld by the household and add this (notional) annuity to the flow of income and

Expert Group on Household Income Statistics
The Canberra Group 5
other receipts (Australian Bureau of Statistics, 1995). However, annuitisation of networth requires that a large number of value judgements and assumptions be madein relation to, for example, the period over which the net worth should be annuitised(life of the householder or spouse) and the interest rates to be used. This is not asimple matter, and the complexity suggests that the issue of incorporation of the valueof stocks of household net worth into a broader measure of economic well-beingmight be best treated in a separate study. The measurement of these stocks is thereforenot considered any further in these guidelines. However, the last section of Chapter 2sets out a conceptual framework in which income, consumption and accumulationcan be related to each other.
Ideally, analysis of economic well-being would benefit greatly from theavailability of fully articulated survey or administrative data covering all aspects:income, expenditure, saving, and the value of wealth held. This would enableobservation of the size and nature of the economic resource generated by households,and how they then disposed of it. Many of the uncertainties which exist, for exampleabout how to treat lump sum income receipts which some households might regardas additions to saving but others would spend immediately, would be resolved at themicro level by reference to observed behaviour. No catch-all assumptions wouldhave to be made either across all households or across groups of households.
However, collection of such fully articulated data is highly problematic from apractical point of view. Integrated income and expenditure surveys are conductedin some countries, more often in the developing than in the developed world. Somealso collect data on savings and other capital transactions and on net worth. However,the respondent burden is very high and even when data are collected on all of thesevariables they are rarely fully articulated and can raise as many questions as theyanswer. For example, the accounting period which is optimal, say, for collectingincome information may not be optimal for expenditure or capital transactions,leading to potential inconsistency and error in estimates of saving that are derivedfrom those aggregates. The same may be true of the reporting unit. Compromisechoices have to be made which may increase the ease and accuracy with which datacan be collected but reduce consistency between them. Integrated surveys also imposea heavy burden on respondents particularly in complex economies where even aquestionnaire concentrating only on cash income can take an interview of two hoursor more to administer. They are therefore very costly not just to the commissioningorganisation but also in the opportunity cost to the respondent. They are not thereforeconsidered further in these guidelines as feasible sources of internationallycomparable data.
1.4 Household income as a microeconomic and amacroeconomic concept
One of the major issues to emerge during the discussions of the Canberra Groupwas the existence of two traditions of household income measurement:
• the macro approach, having its roots in national accounts and in particular thestandards laid out in the System of National Accounts (SNA) (Commission of theEuropean Communities et al, 1993);
• the micro approach, having its roots in microeconomics and particularly the studyof poverty and its effect on different socio-economic groups within society.

Chapter 1: Introduction
6 The Canberra Group
The two traditions have tended to develop different terminologies andconventions, and often use different data sources. The difference of approach mightbe characterised in the contrast between the rigorous accounting framework of theSNA and the inherent flexibility of income micro-data.
Notwithstanding the differences of approach, it is important to stress that bothmacro and micro analysts are trying to measure the same concept: household income.Many of the conceptual difficulties encountered in drawing together the guidelineson household income distribution statistics are the same or similar to those faced indeveloping related guidelines such as the SNA. While the decisions made about howor how not to treat specific situations might sometimes be relatively arbitrary, it issensible to adopt a consistent treatment across frameworks whenever possible.
Indeed, the social accounting matrix (SAM) approach to national accounts asset out in the SNA, Chapter XX, typically focuses on the role of people within theeconomy. A SAM will invariably disaggregate the household sector in order to analysethe interrelationship between structural features of an economy and the distributionof income and expenditure among different socio-economic groups. In most SAMstherefore it is necessary to reconcile the macro aggregate of household income withthe micro income statistics on which the disaggregation is based. However, althoughthe intention of the SNA was in fact to include a disaggregation of household incomeby socio-economic group as a standard part of national accounts output, in practicethere are few if any countries who do so on a regular basis.
It can also be argued that most users of household income statistics would expectthe producers to have carried out a reconciliation between the macro aggregate ofhousehold income and the micro income statistics suitably grossed up to populationtotals. Even if this is not possible, at least one should expect to see clear explanationswhen discrepancies are known to exist. It is undoubtedly a considerable dis-serviceto users when two sets of statistics both labeled ‘household income’ appear to producequite different results and, possibly, different implications for social policy.Nevertheless such a reconciliation is rarely carried out by national statistics offices.
There are other practical reasons to try to maximise comparability betweenincome distribution statistics and household income as defined for the nationalaccounts. First, there is a greater likelihood that any datasets collected can be usedfor multiple purposes. Second, statistics compiled under the different frameworkscan be compared as part of a mutual checking process, and users can be confidentthat different sets of statistics can be brought together if so required for analyticpurposes.
Although these guidelines have been produced with the needs of the micro-analyst uppermost, they also draw attention to areas of difference between therecommendations and those of the SNA and how the two may be reconciled. Theintention is to aid understanding amongst micro-analysts of the concerns andconventions of the macroanalysts and thus to build bridges between the two.
1.5 Historical backgroundIncome distribution statistics were first on the agenda of the United Nations StatisticalCommission at its Fourteenth Session in 1966. Subsequently, a system of distributionstatistics was gradually developed by the United Nations Statistical Office, which

Expert Group on Household Income Statistics
The Canberra Group 7
covered income, consumption and accumulation of households and was tied in withboth earlier versions of the United Nations System of National Accounts and thenow obsolete System of Balances of the National Economy (MPS).
The United Nations Statistical Commission adopted a final version of the fullsystem at its Seventeenth Session in 1972. However, the Commission requested thatamendments and simplifications be made in the light of its discussions. A draft ofthe simplified system was presented to the Commission at its Eighteenth Session in1974 and was adopted with a number of reservations. In particular, the Commissionfelt that further simplification was desirable.
After careful consideration, the United Nations Statistical Office concluded thatit would be desirable to combine the full and the simplified versions of the Guidelinesand present them in a single publication. So, the Provisional Guidelines on Statisticsof the Distribution of Income, Consumption and Accumulation of Households werepublished by the Statistical Office of the United Nations in 1977 (M71, UnitedNations, 1977). Their aim was to assist developed and developing countries to collectand disseminate income distribution statistics and to provide for internationalreporting and publication of comparable data. The guidelines emphasised the needto link micro-level income distribution statistics with macro-level national accountingstandards. Surveys of national practices of income distribution statistics werepublished by the United Nations Statistical Office in 1981 and 1985 (United Nations,1981 and 1985).
The 1977 Provisional Guidelines were to be revised concurrently with therevision of the 1968 SNA (eg Norrlof ,1985). The United Nations EconomicCommission for Europe (UNECE) in particular began work on revising the 1977Provisional Guidelines and organised a number of Work Sessions and Seminars onstatistics of household income with this in mind. Special attention was paid to therelevance of the revision of the SNA (eg United Nations, 1989), given that the revisionprocess of the 1968 SNA had led to advances in conceptual thinking about thehousehold sector and about the concept of income in particular. However, due tolimited resources progress in the revision of the 1977 Provisional Guidelines wasslow.
In 1994, with the agreement of the UNECE and the Organisation for EconomicCo-operation and Development (OECD), EUROSTAT, the Statistical Office of theEuropean Communities, undertook to play a major role in the revision of the 1977Provisional Guidelines. The key objective was to update the Guidelines in the lightof the revised SNA and European System of Accounts (ESA) and new developmentssince 1977 relating to household income statistics (eg hidden and informal activities)and to extend and adapt them where appropriate to serve the analytic needs ofeconomic and social policies. However, the geographical scope of the revisedguidelines would initially be the countries of the European Economic Area.
In addition, as a result of the 15th International Conference of LabourStatisticians in October 1993 the Bureau of Statistics of the International LabourOrganization (ILO) took the initiative to improve the measurement of income fromemployment (eg Dupré, 1997). In October 1998, the 16th International Conferenceof Labour Statisticians (ICLS) adopted a Resolution concerning the measurementof employment-related income (ILO, 1998b).

Chapter 1: Introduction
8 The Canberra Group
A general feature of most of these approaches to create international guidelineson income distribution statistics is that they principally started from a macro view,proceeding from the SNA. However, the top-down macro-to-micro approach toconceptual issues provides a very different, and not immediately obvious, perspectivefor most micro-data users. Emphasis on a framework tends to lead to a rigorous andtheoretical approach where flexibility may look like inconsistency. Emphasis onthe practical issues arising from micro-datasets sets great store on the virtues offlexibility at the possible cost of losing sight of an underlying framework.Consequently, framework-based guidelines tend to lack practical advice to theproducers and users of micro-data. This is perhaps the main reason why the 1977Provisional Guidelines were seldom adopted by producers of income distributionstatistics and remained provisional.
In what was thus a virtual vacuum of international consensus on how incomedistribution could and should be measured, concern grew in many countries to developbetter measures of the economic well-being of their populations for national policypurposes. The range of survey and other information expanded, and technologicaladvances considerably improved the possibilities for sophisticated treatment ofcomplex micro-data. At the same time, there was an increasing desire to makeinternational comparisons of such statistics which exposed the lack of consistencyof the available data. At the inter-country level, the Luxembourg Income Study (LIS)was set up in 1983 to address the lack of comparability of household income datafrom different countries. Located in the Centre for Population, Poverty and Socio-Economic Policy Studies in Luxembourg, LIS draws together unit record data froma wide range of countries and attempts to reorganise them to a common set ofconcepts and definitions. However, organisations such as World Bank, United Nationsand OECD all published inter-country comparisons during the 1990s in which thesame country might have very different relative rankings depending on the conceptsand data sources used. Partly in response, the OECD commissioned a cross-nationalstudy of income distribution based on LIS data (Atkinson et al, 1995).
The 24th General Conference of the International Association for Research inIncome and Wealth (IARIW) in August 1996 included a session on InternationalStandards on Income and Wealth Distribution (Smeeding, 1996). This session mainlyfocussed on efforts to revise the 1977 Provisional Guidelines on Statistics of theDistribution of Income, Consumption and Accumulation of Households (UnitedNations, 1977). The session had two keynote papers:
• ‘Towards a Revision of the UN Guidelines on Statistics of the Distribution of Income,Consumption and Accumulation of Households’, actually consisting of three separatecontributions by Lidia Barreiros and Deo Ramprakash (Barreiros and Ramprakash1996), Alfred Franz (Franz, 1996a) and John Walton (Walton, 1996) respectively;
• ‘A Provisional Framework for Household Income, Consumption, Saving and Wealth’,published in June 1995 by the Australian Bureau of Statistics and presented by HarryKroon and Maureen McDonald (Australian Bureau of Statistics, 1995).
The first paper contained the early results of the work of the EUROSTATconsultants (the conclusion of their work may be found in Franz et al, 1998). Thesecond paper was the result of the work of the Australian Bureau of Statistics aimedat defining a conceptual ‘map’ as a basis for further development of statistics relatingto the economic well-being of households and at facilitating better dialogue betweenusers and producers of such statistics, both nationally and internationally.

Expert Group on Household Income Statistics
The Canberra Group 9
Once again, one of the main conclusions from the discussions during this sessionwas that the top down macro-to-micro approach was not sufficient from theperspective of micro-data users. Both macro-to-micro and micro-to-macro viewpointsare valuable and the new international guidelines needed to address these issues.So, a clear challenge emerged from the 1996 IARIW Session. Integration of theoryand application would be difficult but not impossible: any revision of the UNProvisional Guidelines on income distribution statistics should serve both purposes.However, a wider constituency of interest needed to be engaged in the discussions,particularly from national statistical offices, but also from a range of other nationaland international organisations. Hence the birth of the Canberra Group.


Chapter 2
The IncomeConcept
The Canberra Group 11
2.1 IntroductionThis chapter seeks to establish conceptual ground-rules for the production ofhousehold income statistics. At this stage the practical difficulties of data availabilityare generally not addressed. The aim rather is to determine what in an ideal world itwould be desirable to define and measure as ‘income’.
However, it is important to recognise at the outset that different measures ofincome may be the most appropriate or the best available for different analyticalpurposes. Different uses may include analysis of the extent of income inequalitiesbetween groups within a population, the extent of poverty in absolute or relativeterms, and the impact which government intervention has through social assistanceand taxation on income distribution and poverty. Changes in distribution over timemay be of interest, as may differences between countries. Alternatively, the impactof alternative government policy actions may be the focus of attention. The practicalissues of choosing appropriate definitions in the light of the use to which the statisticsare to be put, the particular national economic circumstances, and the availability ofdata will be discussed in Chapter 4.
2.2 Towards a definition of income
2.2.1 Historical backgroundThere has been a long history of debate on the boundaries to be set for the definitionof income. Much of the debate has centred on whether:
• income should include only receipts that are recurrent (that is, exclude large andunexpected, typically one-time, receipts);
• income should only include those components which contribute to currenteconomic well-being, or extend also to those which contribute to future well-being;and
• whether the measure of income should allow for the maintenance of the value ofnet worth.
The debate has benefited from theoretical insights from a number of prominenteconomists. J R Hicks proposed that ‘...it would seem that we ought to define a man’s

Chapter 2: The Income Concept
12 The Canberra Group
income as the maximum value which he can consume during a week, and still expectto be as well off at the end of the week as he was at the beginning.’ (Hicks 1946,p. 172.) The Haig-Simons definition of personal income is that it comprises the sumof consumption and change in net worth in a period, therefore making no distinctionbetween regular and irregular receipts. (For a discussion on the differences in theHicks and Haig-Simons approaches, see Goode, 1977.)
However, whilst these definitions can give general guidance they are open tomore than one interpretation. Typically, the choices to be made in constructinghousehold income have been approached by macro and micro analysts from ratherdifferent perspectives, which has resulted in different definitions for measuring whatis essentially the same concept.
The macro-analyst is interested in the aggregate of household income as it fitsinto the macroeconomy as a whole, and approaches its construction in a top-downmanner. Previous attempts to update the existing international guidelines on incomedistribution (UN, 1977) to bring them into line with the 1993 SNA have categorisedincome according to the type of transaction which gives rise to the flow withoutregard to the medium in which payment is made. The sequence is basically to measurefirst income generated in the course of production, then to allow for distribution ofproperty income thus arriving at a concept called “primary income”. The next stageis to account for current transfers, widely interpreted, and thus arrive at “disposableincome”. This is either spent on consumption or saved. Saving is used either to financeinvestment or leads to net borrowing or lending.
Exhaustiveness of the definition is also very important to the macro-analyst, asis its consistency with the definitions of income of the other institutional sectors: notheoretical gaps can be left unfilled, even if in practical terms imputations andestimations have to be widely employed when actually compiling the statistics.
The micro-analyst on the other hand is primarily interested in the measurementof income distribution. Conceptually, this means that the definitions are driven mainlyby what the individual perceives to be an income receipt of direct benefit to him orherself, which results in a bottom-up approach to the construction of a definition.The means of payment is a major discriminatory factor and the rationale behind thepayment is subsidiary. Practically, definitions have also to be constrained by what itis feasible to collect in household surveys or what is available at the household levelin relevant administrative sources. In fact these two considerations – the conceptualand the practical – will usually result in the same choices, since if individuals perceivea receipt to be of direct benefit to them they are much more likely to be able toprovide reliable data on it.
2.2.2 The micro approachThe approach of the micro analyst begins by addressing the question: “Is the incomereceiving unit better off today as a result of this receipt (able to consume more goodsand services)?”. Such an approach implies that it is current economic well-beingwhich is of interest. Components which contribute to future economic well-beinginclude employer contributions to pension funds and other forms of social insurance,interest earned on retirement-based assets and capital gains. The recipient may bescarcely aware of these, certainly at the time they are ‘received’, even though theindividual usually benefits from them in some way, if not at the time of paymentthen in the future. This means that in addition to the conceptual difficulties the micro-

Expert Group on Household Income Statistics
The Canberra Group 13
analyst may have in accepting their inclusion, there are undoubtedly severe problemsin collecting micro level data of the value of these benefits.
Having chosen current economic well-being as the organising principle, thereare three other dimensions along which further choices of income components haveto be made. These are: cash (ie monetary) versus non-cash income; regular versusirregular income; and maintenance of the value of net worth. Decisions on what toinclude and exclude along these dimensions are governed by the extent to which thecomponent may be ‘spent today’. The microanalyst will also want to be sure thatthe resulting income distribution statistics will represent a true and fair picture ofthe actual distribution of income, and therefore be as free from statistical artifice aspossible.
2.2.2.1 Cash incomeThe most basic component of income is cash earnings. This is the income componentmost familiar to income analysts and perhaps the most easily and accurately measuredin household surveys. They include payments for overtime, bonuses and similaradditions to basic wages and salaries. Cash earnings may arise from paid employmentor self-employment. In the case of self-employment, earnings are measured as receiptsfrom the business less operating expenses.
Although cash earnings are often the largest component of income, the microanalyst would normally consider the following categories as essential to theconstruction of reasonably complete income distribution statistics:
• property income
• cash transfers
These are considered in turn below.
Property incomePeople receive income in return for providing land and capital for someone else touse in production, just as they do for providing their labour. Examples which themicro-analyst would include in their income definition include:
• interest
• dividends
• royalties, and income from estates and trusts
• rent from land.
Cash transfersPeople may receive cash transfers from a variety of sources, for example government,private social insurance funds, non-profit making bodies and from other households,and some of these may be the Rest of the World – eg from households in othercountries or from overseas governments. In general, the largest category is likely tobe from government.
There are two main types of transfer known collectively as social benefits. Thefirst are those to which entitlement has been secured by previous contributions madeby individuals, or by employers on their behalf. Schemes of this sort controlled andfinanced by government are known as social security schemes, and together withprivate schemes run by employers are collectively known as social insurance schemes.

Chapter 2: The Income Concept
14 The Canberra Group
The second type of transfer is that for which no previous contributions are requiredto acquire eligibility. These are referred to as social assistance benefits. Socialassistance benefits may be means and/or assets tested – that is, eligibility may dependon the recipient having less than a certain level of income or assets - or they may beuniversally available to all or to a particular type of citizen (for example, childbenefits). Social assistance benefits and social insurance benefits are collectivelyreferred to as social benefits.
Some non-profit making organisations may make transfers to households whichare akin to social benefits; for example, strike pay and sickness benefits paid by tradeunions to their members; relief payments from the Red Cross in times of naturaldisaster.
People may in addition receive transfers from other households. This is one ofthe most difficult areas in which to decide what should and should not be includedin the definition of income. Examples include cash gifts, payments of alimony orchild maintenance, and cash inheritances. In trying to remain true to the startingquestion – can the receipt be spent today? – the microanalyst may wish to excludereceipts which are irregular, infrequent and/or ‘large’, regarding these as ‘windfall’income more likely to be saved than spent. One distinction that some find useful iswhether these transfers are mandatory (eg as a result of a legally binding agreement)or voluntary, though determining such a distinction accurately is difficult and willalso be affected by institutional differences between countries.
Whatever decisions are taken about which, if any, inter-household transfers areto be included, any which are included must not only be added to the income ofrecipients but also be deducted from the income of donors, otherwise double-countingwill take place at the aggregate level. Double-counting should be avoided if at allpossible. However, if it is not possible, the micro-analyst must judge what treatmentcomes closest to giving a true and fair picture of the income distribution within theconstraints of the data available.
DeductionsThe sum of the elements described above may be referred to variously as gross cashincome or total cash income. However, there is an issue as to whether to expressincome before or after the deduction of direct taxes such as income tax and socialinsurance payments to government and employer based social insurance funds. Theindividual may not regard such involuntary deductions as part of their income becausethey reduce their capacity to consume, and if tax is deducted at source they mayhave little idea of the amount paid. It is therefore common to present incomedistributions both gross and net of direct taxes, even though in some countries dataare only collected on a net basis and grossed up to pretax levels using simulationmodels.
An individual might also regard some of the costs associated with working ascompulsory and therefore not part of their disposable income – for exampleexpenditure on travel to work and childcare. The problem here is that it is difficultto distinguish ‘compulsory’ expenses connected with working from the less essentialwhich are close to mainstream consumption. However, in some analyses it is usualto deduct such costs so that the economic well-being of those in work may becompared more accurately with those not working.
Expert Group on Household Income Statistics
The Canberra Group 15
2.2.2.2 Beyond cash incomeAs one moves beyond the elements of cash income briefly described above, theinclusion of further income components becomes more controversial.
Income in kindThere can be in-kind counterparts to most of the elements of cash income listed above.For example, an employer-provided car may form part of a total remunerationpackage; in many countries households produce goods for their own consumptionas well as for sale or for barter; some social assistance payments may be non-cashsuch as food stamps or payment of rent; gifts between households may be in theform of goods rather than cash.
In addition, there is a class of components known collectively as social transfersin kind. These are government-provided goods and services which benefit theindividual but are free, or mainly free, at the point of use. Examples include healthcare and education.
The main conceptual difficulty in including in-kind income is that the beneficiarymay have no idea of the value of the benefit and if offered a comparable cash summight spend it very differently. Further, beneficiaries may have difficulty inappreciating that they experience increased well-being as the result of some benefits:they do not ‘feel better off today’.
There are also considerable difficulties in valuation: imputations have to be madeand the greater extent of the imputation the more risk there is of the resulting statisticsbeing vulnerable to statistical artifice. It may only be possible to make imputationsless frequently than cash-based estimates are available. They may also be producedwith less timeliness, if the modeling can only be done after cash-based estimateshave been compiled.
On the other hand, some items such as food stamps have a clear cash value andthere is some discretion in how they are spent. Some analysts may decide to includesuch items in a broader measure of income. In developing countries, incomes of manyhouseholds would be seriously understated if a valuation were not to be made of thegoods which they produce for their own consumption: in this case the issue is notwhether to value this income, but how.
Changes in net worthMany households receive capital transfers and benefit from capital gains which theymay or may not realise. Decisions have to be made as to whether any or all of theseshould be included in a definition of household income. Selling assets or realisingcapital gains can sometimes enable a household to meet its everyday needs for food,clothing and shelter which would argue for their inclusion. Section 2.5 addressesthese issues.
2.2.3 Reconciling the micro and macro approachesThe main framework developed for analysis of income at the macro level is theSystem of National Accounts (SNA). The SNA has been evolving over decades andis a comprehensive system for expressing in statistical terms most elements of acountry’s economy in a way which articulates the roles of, and interrelationshipsbetween, the various sectors of the economy. The household sector is one such sector.

Chapter 2: The Income Concept
16 The Canberra Group
Clear definitions based on economic theory have been set out most recently in the1993 System of National Accounts (SNA93) and the 1995 European System ofAccounts. Some components of the conceptual definition are more straightforwardto define and measure than others, and there continues to be discussion about thetreatment of some components. Nevertheless the SNA represents an internationalstandard which is widely accepted and applied.
The concept of income set out in SNA93 is closely aligned with that describedin Hicks. In SNA93, the theoretical view of disposable income is defined as:
“.. the maximum amount that a household or other unit can affordto spend on consumption goods or services during the accountingperiod without having to finance its expenditure by reducing itscash, by disposing of other financial or non-financial assets or byincreasing its liabilities.” (SNA93 para 8.15).
Within the SNA, the difference between current and capital transactions isbasically that current transactions are complete within the period in question. Bythe end of the period, they disappear like ripples on water and they have no effecton balance sheets. Capital transactions are precisely those that do have an effect inanother period and thus impact balance sheets, the measures of wealth.
It can be seen that the definition of income developed in the previous section isvery similar to this. Thus the Canberra group felt that the SNA93 definition couldform a basis for household income distribution analysis also.
Nevertheless, there are good reasons in some areas for departing from therecommendations embodied in SNA93, reflecting the different purposes of thestatistics to be compiled. The definitions developed below therefore differ fromSNA93 in several respects. Income distribution statistics are primarily concerned witha particular set of micro-economic issues and require the construction of statisticswhich reflect the circumstances of individual households. The SNA is concernedwith macro-economic issues and the household sector is but one sector of interest.It follows, for example, that some recommendations in SNA93 that are targeted atnon-household sectors but impact on the household sector in aggregate may have tobe treated differently in compiling household income distribution statistics.
2.3 Income versus capital accumulation
2.3.1 Current and capital transfersCapital transfers usually refer to the acquisition of, or disposal of, assets or net worth.Current transfers, on the other hand, are available for consumption during theaccounting period. If a transfer is treated as current rather than capital, it will ofcourse increase the receipts available for consumption and saving.
SNA93 notes that ‘a prudent household will not treat a capital transfer thathappens to be received during a particular period as being wholly available for finalconsumption within the same accounting period’. (SNA93 8.31)

Expert Group on Household Income Statistics
The Canberra Group 17
In practice, it is not always simple to differentiate between current and capitaltransfers received by households. Micro-analysts usually make the assumption thatcapital transfers tend to be large, unexpected and one-time, whereas current transferstend to be comparatively small, are often made regularly and can be relied on, whichis in fact much the same as the SNA advice. However, this of course begs the questionof what constitutes ‘large’, ‘unexpected’ and ‘one-time’. A receipt which onehousehold may regard as large enough that to consume it all within the accountingperiod would be profligate may be regarded by another as small enough in relationto their other income that it would be quite natural to make it all available forconsumption. In an ideal world, information on how households actually disposedof transfer payments received would resolve this problem. However, in the absenceof such information rules of thumb have to be devised which can be applied to allhouseholds alike.
An example adopted in these guidelines is in relation to termination andredundancy payments made by employers to employees. These payments have beenincluded in the measure of employee income, as they are in the SNA. However, theywill vary in size for different households and also vary in the manner in whichhouseholds regard them. For some households, they may represent a means offinancing consumption expenditure for a period while the recipient looks for anotherjob. For other recipients, they may be large enough to be viewed as a worthwhileaddition to the household’s assets.
A second example in which the opposite treatment has been adopted isinheritances. These are classified as capital transfers, regardless of size. They canbe regarded as transfers of assets from the deceased to the beneficiary, most likelyrepresenting a movement from one person’s balance sheet to that of another.
2.3.2 Capital/holding gainsThe theoretical argument for including capital gains in an extended measure ofincome is that this would be in line with the definition of income leaving a householdas well off at the end of the accounting period as at the beginning. Capital gains orlosses do have an effect on the economic behaviour of households and may affecttheir decisions on consumption.
There are several possible different measures of capital gains/losses andarguments can be made for the inclusion or exclusion of most of them. The detailsof the measures and the rationale for the suggested solution is discussed in section 5.In brief, though, the recommendation is that capital gains/losses should be treatedas a memorandum item which may, optionally, be added to income measures forcertain analyses.
2.4 The components of income and its aggregates
2.4.1 IntroductionThis section provides an overview of the components to be included in variousmeasures of income. Table 2.1 is a tabular summary and Appendix 1 provides moredetailed information. Appendix 2 discusses in more depth the areas in which thisframework departs from the SNA recommendations and shows how the macro andmicro approaches may be reconciled. Appendix 1 may be regarded as a glossary of

Chapter 2: The Income Concept
18 The Canberra Group
the concepts and terms used below whilst Appendix 2 is aimed primarily at themicroanalyst who wishes to gain a more detailed understanding of how theseguidelines relate to national accounts conventions and practices. Since each isintended to be free-standing there is inevitably some overlap and duplication.
Note that the lower level of detail shown in Table 2.1 is not exhaustive and thata more detailed disaggregation is used in Appendix 4: Availability of income data.
Table 2.1 Definitions of income
Section ref
1 Employee income 2.4.2.1Cash or near cash
1.1 Cash wages and salaries1.2 Tips and bonuses1.3 Profit sharing including stock options1.4 Severance and termination pay1.5 Allowances payable for working in remote locations etc, where part of conditions of
employmentCash value of ‘fringe benefits’
1.6 Employers’ social insurance contributions1.7 Goods and services provided to employee as part of employment package
2 Income from self-employment 2.4.2.2Cash or near cash
2.1 Profit/loss from unincorporated enterprise2.2 Royalties
In-kind, imputed2.3 Goods and services produced for barter, less cost of inputs2.4 Goods produced for home consumption, less cost of inputs2.5 Income less expenses from owner-occupied dwellings
3 Rentals 2.4.2.33.1 Income less expenses from rentals, except rent of land
4 Property income 2.4.2.44.1 Interest received less interest paid4.2 Dividends4.3 Rent from land
5 Current transfers received 2.4.2.55.1 Social insurance benefits from employers’ schemes5.2 Social insurance benefits in cash from government schemes5.3 Universal social assistance benefits in cash from government5.4 Means-tested social assistance benefits in cash from government5.5 Regular inter-household cash transfers received5.6 Regular support received from non-profit making institutions such as charities
6 Total income (sum of 1 to 5)7 Current transfers paid 2.4.3.17.1 Employers’ social insurance contributions7.2 Employees’ social insurance contributions7.3 Taxes on income7.4 Regular taxes on wealth7.5 Regular inter-household cash transfers7.6 Regular cash transfers to charities
8 Disposable income (6 less 7)9 Social transfers in kind (STIK) received 2.4.4.110 Adjusted disposable income (8 plus 9)

Expert Group on Household Income Statistics
The Canberra Group 19
WE RECOMMEND THAT TABLE 2.1 BE ADOPTED AS THECONCEPTUAL FRAMEWORK FOR INCOME DISTRIBUTIONANALYSIS, RECOGNISING THAT NOT ALL OF IT CAN BEIMPLEMENTED FOR PRACTICAL PURPOSES.
2.4.2 Total income and its componentsThe first measure of aggregate income to be built up is ‘total income’. It is called‘total’ because it is the gross measure assembled before deducting the componentsrequired to derive ‘disposable income’. Total income includes a number of sub-aggregates.
2.4.2.1 Employee incomeEmployee income is the sum of remuneration received from an employer in bothcash and non-cash form. It includes payments made by the employer on theemployee’s behalf, for example into a private or government pension fund.
2.4.2.2 Income from self-employmentThe profit that a self-employed person makes out of his or her unincorporatedenterprise includes an element which rewards the labour expended and also anelement covering the return to the capital employed. (For this reason, the SNA refersto the receipts as mixed income.) The business of a self-employed person may makea loss, which is regarded as negative income.
Households not only consume goods and services which they purchase or receivefrom others, but also goods which they produce themselves. It is important thathousehold production for own consumption is included in measures of income whenit is a significant element of economic well-being. If it is omitted, comparisonsbetween countries, over time or between income groups are likely to be deficient.
Imputed income thus includes goods produced for home consumption, less thecost of inputs other than the imputed value of own labour. When the goods are actuallysold, placing a value on them is relatively straightforward. Sometimes, though, thegoods will be intended solely for use by the household, or for exchange with anotherhousehold through bartering. This is especially the case for subsistence agriculturein many developing countries but is conceptually true even for kitchen gardens orallotments in developed countries.
The services which are produced and consumed by the members of thehousehold itself, such as cooking, housekeeping and child-rearing, also have a bearingon household well-being. There are great difficulties in putting a value on them, asdiscussed further in Chapter 9. At present there are no widely accepted methods formaking such valuations and so they are not included in Table 2.1.
As explained in more detail in Appendix 1, imputed income less expenses fromowner-occupied dwellings is also included here.
2.4.2.3 Income from rentalsHouseholds may receive income from renting out dwellings, other buildings, vehicles,and so on. In the macro accounts, such receipts are regarded as part of self-

Chapter 2: The Income Concept
20 The Canberra Group
employment income, since the household is regarded as operating as anunincorporated enterprise by renting out their possessions. However, in manycountries such income is classified in the micro income distribution statistics asproperty income because it is viewed as the result of ‘lending’ an in-kind asset tosomeone else. Thus in Table 2.1, this type of income is shown as a separate categoryto enable either treatment to be applied.
2.4.2.4 Property incomeProperty income is the receipts less expenses which arise from lending some typesof assets to another user for which there is a usually a monetary return.
In the macro-data on household income, interest and dividends should berecorded on an accruals basis, that is when they are due to be received (ie receivable)rather than when they are actually received. This difference can sometimes besignificant. However, it is very unlikely that such information will be available atthe micro level, and so property income here is shown on the basis of actual receipts.
There are three main forms of interest payment:
• Interest paid on business loans by the owners of unincorporated enterprises,including those loans on assets rented out (such as dwellings, machinery, vehicles)
• Interest paid on loans associated with home ownership (ie mortgage interest)
• Interest paid on borrowing to finance consumption (eg loans to purchase consumerdurables or interest paid on credit card balances).
The first two are always deducted from income. This can be done by offsettingthem against interest received in property income. The recommendation here is thatthe interest paid on consumer debt should also be offset against income receipts.This procedure has the advantage that it is not necessary to try to separate total interestpayments into the three components if it is not easily available in that form. A secondadvantage is that this treatment is consistent with the SNA. However, for someanalyses it may be useful to identify interest on consumer debt explicitly and to deductit not from disposable income but at the same stage as consumption expenditure isdeducted from disposable income to reach saving. In this case consistency with theSNA would be restored only with the calculation of saving rather than being preservedmore generally.
2.4.2.5 Current transfers receivedTransfers are payments and receipts made without a ‘quid pro quo’. They are a majorway in which income is redistributed and therefore a good classification of transfersis particularly important for income distribution studies. Transfers may be madebetween one household and another, between households and government, or betweenhouseholds and charities. They may also cross national boundaries: in Table 2.1 nodistinction is made according to whether a transfer is received from within a countryor outside, so that for example pensions received from governments in other countriesare not distinguished from those received from the national government.
Having established that a transfer should be classified as current in nature asdescribed above, there are additional concerns. Does the receipt of a transfer reallyrepresent income? Does the payment of a transfer represent a reduction in incomeor is it rather a decision on how to spend disposable income? Chapter 1 establishedthat ‘income’ is the concept of choice to act as a proxy for economic well-being

Expert Group on Household Income Statistics
The Canberra Group 21
because it provides a guide to the level of material living standards that people cansustain, given their current economic and social circumstances, without increasing/decreasing their net worth. Thus deciding which current transfers should be takeninto account in defining income has to refer back to this basic rationale. (Note thatthis represents a significant difference between the perspective of the micro-statistician and the macro-counterpart. From the macro point of view, all currenttransfers are recorded before the derivation of disposable income and the only issueof principle to decide is whether a transfer should be classified as current or capitalin nature. Of course, for the macro accounts which do not disaggregate the householdsector the issue does not arise anyway.)
It is desirable therefore to separate transfers into two groups. The first grouprelates to transactions that clearly affect disposable income. Many of the transferspaid which fall into this group are compulsory in nature, such as payment of incometax, making contributions to compulsory pension schemes and paying alimony andchild support. Their counterparts amongst transfers received include social insuranceand social assistance benefits, and receipts of alimony and child support where theseare compulsory. All of these tend to be regular and predictable in certaincircumstances. The Canberra Group concluded that all such receipts should beincluded in a definition of income and corresponding payments should be deducted.
The second group of transfers includes gifts between households, donations tocharities and other transactions of a more voluntary and possibly more sporadicnature – for example child support not made under legal obligation. A furtherdistinction may be made between such transfers made in cash and those made inkind. The latter might include presents exchanged between households, and clothingetc donated to charities and then distributed to beneficiaries. The Canberra Groupagreed that transfers in kind should not be included in an income definition. Oneway of viewing them is as transfers of expenditure rather than of income and thisissue is discussed further in section 2.5.2.1.
Thus we are left with voluntary transfer transactions made in cash. Althoughthe recipient may be another household, it may not be sensible for this household toregard such transfer receipts as a reliable source of income, even if they may beused for consumption as and when received. Similarly, the donor household maynot regard such payments as a reduction in their income but as an expense like anyother which contributes, at the margin, to the donor’s welfare (by fulfilling a moralobligation for example).
The decision on how to divide these transactions into those to be included inincome and those to be excluded is a fine one, and one which may differ betweencountries of different cultures. Here the recommendation is to include those paymentswhich are regular, and/or expected and relied on by the recipient. All other currenttransfers, usually relatively insignificant, are treated in these guidelines not astransfers of income but as transfers of expenditure and are discussed further belowin section 5.
A further question is whether to show receipts and payments separatelyor consolidated. While ultimately it is essential to exclude double counting, theapproach taken here is to record transfers in two stages, first the receipts and thenthe payments.

Chapter 2: The Income Concept
22 The Canberra Group
2.4.2.6 Total incomeIs the sum of all the above
2.4.3 Disposable income
2.4.3.1 Current transfers paidMany of the items included here are the counterparts of current transfers receivedabove such as social insurance contributions and regular inter-household cashtransfers. Also included are taxes paid on income and regular taxes paid on wealth.
There are two types of taxes on wealth, those levied relatively infrequently suchas taxes on capital gains and those levied on the ownership of assets such as housingand consumer durables. The latter are levied regularly and predictably every taxperiod, can be assumed to be paid from income and so are deducted alongside incometax. The former are assumed to be paid from capital and are therefore deducted fromwealth.
2.4.3.2 Disposable income ‘Disposable income’ is derived from total income by deducting current transfers paid.Note that work expenses such as travel and childcare payments are considered partof consumption expenditure in this framework. However, such unavoidable andunreimbursed expenditures related to undertaking paid unemployment might bededucted at this point if the aim is to compare economic well-being of those workingwith those not working.
2.4.4 Adjusted disposable income and socialtransfers in kind
Disposable income can be augmented to include social transfers in kind (STIK)received, thereby creating the measure ‘adjusted disposable income’.
2.4.4.1 Social transfers in kindIn most countries, government provides some services to individual households,usually targeted towards meeting specific needs such as education, health and socialwelfare. These services are referred to as individual services since they are identifiableas being consumed by individual households. In general the extent to which onehousehold benefits affects the extent of the benefit which can be offered to otherhouseholds. In addition, government provides services such as public administration,and defence services. These are available to all households collectively and noallocation process is involved. Such services are referred to in the national accountsas collective services and often by economists as pure public goods. The level ofwell-being of households is affected by the level of collective services provided bygovernment. Since the range and level of services provided differs between countries,it could be argued that in cross-country comparisons some allowance should be madefor the extent of collective services provided. However, it is difficult to find a metricby which it would be possible to say by how much greater expenditure on defenceor on road-building increased the well-being of the inhabitants. Because of thisdifficulty, it is not usual to include the level of government collective services inincome comparisons.

Expert Group on Household Income Statistics
The Canberra Group 23
By contrast, the level and distribution of individual services does affectcomparisons across different groups of households, where levels of entitlement mayvary from one to another and across countries where the extent of state provisiondiffers markedly. STIK therefore may be included to allow for a fuller allocation ofindividual consumption expenditure to households.
The Canberra Group concluded that in principle, social transfers should beincluded in a complete definition of income, and they are thus included in Table 2.1.However, the Group recognised that the statistical community is some way from beingable to agree on a definitive method of valuation and allocation to individualhouseholds. More research and experimentation are needed.
STIK are defined as benefits provided by government and non-profit institutionsserving households (NPISHs) to individual households. There are a variety of waysin which such benefits are provided. Goods and services such as education, housing,cultural and recreational services may be provided either free or at greatly reducedcost at the point of use. These are known as transfers of individual non-market goodsand services. In addition, in some countries households receive reimbursement fromgovernment social insurance schemes for specified types of expenditure, typicallyfor medical or dental goods and services. Other social security benefits in kind aretypically also medical or dental in nature, but involve the provision of goods andservices direct to the recipient and thus do not require reimbursement. Socialassistance benefits in kind are also similar but are not provided through a socialinsurance scheme, for example food vouchers for low income families.
There are a number of ways in which the value of social transfers in kind canbe estimated for individual households. One basis is that of entitlement to the benefit;depending on household characteristics, the value of the entitlement is calculatedsuch that the total of all entitlements across all households is equal to the value ofthe services provided. This method begs two rather important questions. The first isthat it is commonly observed that actual take-up of social benefits falls below thelevel which would be observed if everyone took up their full entitlement. However,since the amount of services distributed reflects the extent of non-take-up, we simplyassume that the global level of entitlement is scaled back to the total value of take-up. The second and very vexed question refers to the value to be placed on the servicesprovided without direct cost to the beneficiaries. Here we follow the national accountsconvention that the value of the service is equal to the cost of providing it. Underthis assumption, all households with equal entitlement are assumed to be equallybetter off by the provision of the state of the services in question, regardless ofwhether they actually avail themselves of the entitlement or not. One could regardthe entitlement as equivalent to an insurance premium guaranteeing that the servicewould be provided if needed.
Conceptually it would also be possible to allocate the services on the basis ofactual take-up. For some purposes, as discussed further below, this may give veryuseful information but it is not necessarily appropriate when thinking of the incomeequivalent of services provided. It may seem acceptable when considering a parentopting out of the government provided education system and choosing instead tosend children to fee-paying schools, but it is less acceptable in the case of healthservices. It is difficult to see when it would be desirable to reclassify a poor householdto a rich category simply because they had the misfortune to require extensive medicalservices.
Chapter 2: The Income Concept
24 The Canberra Group
There is a third alternative for allocating social transfers in kind, frequentlyreferred to as the insurance basis of allocation. Under this, there is no specificallocation to individual households but instead an allocation is made to a group ofhouseholds depending on the average take-up for the group as a whole. Normally,this means of allocation will give a distribution fairly close to an allocation byentitlement but may show some drift if the level of take-up is strongly correlatedwith the groups of households being considered – for example, in the case of healthservices the distribution may be skewed towards the elderly. Note also that if thegrouping of households is changed, the allocation by insurance principle would haveto be redone. As a result, the implicit allocation for an individual household willchange if the previous and new groups of households with which it is associatedhave different patterns of take-up of the service in question.
However, the difficulty still remains under any of these methodologies that therecipient may place a lower value on the benefit than the cost of providing it – forexample, they may be willing to accept a lower cash payment in lieu of the in-kindbenefit. A fourth alternative would thus be to record the cash payment which ahousehold would be willing to accept in lieu of the service as the value of the in-kind benefit to them – ie what they would have been prepared to spend to receivethe service. The difference between this and the cost to government of providingthe service would be treated as a pure public good.
Measuring the value of social transfers in kind received by individual households,or even groups of households, will generally only be possible indirectly via simulationmodels. This whole issue is returned to in Chapter 4.
2.4.5 Choosing between income measures
2.4.5.1 Total, disposable and adjusted disposable incomeOf the aggregates set out in the conceptual framework shown in Table 2.1, totalincome is the broadest measure of income. Because it is measured after the receiptof property and transfer receipts but before any payments are made, at the aggregatehousehold level there is a degree of double counting. The extent of this will varyfrom country to country depending on institutional arrangements. The more extensiveare the social insurance schemes, for example, the higher total income will be relativeto, say, income from employment. On the other hand, total income may be easier tomeasure than some of the other aggregates and thus be felt to be more reliable.
Disposable income is usually the preferred measure for income distributionanalysis. It is freer of the impact of institutional arrangements than total income andprovides a closer approximation to the receipts that are available for consumptionduring the accounting period. Given that most income tax regimes are intended tobe progressive, measurement of income after tax is likely to be more equallydistributed than income before tax.
Adjusted disposable income takes this “income levelling” one stage further sincea major objective of government in making essential services available via socialtransfers in kind is normally to effect a more equal access to those services. Adjusteddisposable income is therefore the preferred measure for analysing the totalredistributive effect of government intervention in the form of benefits and taxes onincome distribution. In such studies it may also be desirable to impute the value ofindirect taxes embodied in consumption expenditure to complete the picture (seesection 2.5.2 below).

Expert Group on Household Income Statistics
The Canberra Group 25
2.4.5.2 Cash only or cash and non-cash incomeWhen an individual receives income in cash they have a choice between spendingand saving it. They can also decide how that money will be spent and the type ofconsumption items to be purchased or investments to be made.
However, despite the attraction of the convenience of using cash income dataonly, this measure falls short of valuing the economic resources enjoyed by thehousehold. Of particular concern is the fact that the relative mix of cash and non-cash income may differ significantly across population groups.
The relationship between cash and non-cash income may also differ betweencountries and within a country over time. While the majority of income receipts indeveloped countries may be in cash, for people in developing countries, a very largeproportion of income may be received in a non-cash form. The most important formof non-cash income in developing countries is subsistence agriculture.
Similarly, within a country, there may be changes over time in the cash andnon-cash mix of remuneration of employees. This may occur, for example, when“salary sacrifice” is used to gain fringe benefits or employer contributions to pensionfunds. Changes to tax regimes within a country may make either cash or non-cashreceipts more attractive and result in distortions in time trends if the measure of cashincome only is used.
2.5 Extension to consumption and accumulation
2.5.1 IntroductionIn previous sections, there has been discussion about the boundaries between incomeflows and capital flows, and about household consumption and saving. Table 2.1presents the flows which are regarded as part of the income concept recommendedin these Guidelines. Although the extension to concepts of consumption, saving andwealth was outside the scope of the Canberra Group, for completeness Table 2.2shows how the various concepts can be brought together in an integrated way, buildingup to a measure of the change in net worth due to saving and net capital transferswhich is called ‘Net accumulation of capital’. These issues require further discussionand work, and the Group recommends that they be taken up by others. Furtherdiscussion of this research agenda may be found in Chapter 9.
Most of the items included in Table 2.2 have been discussed in earlier sectionsof this chapter, especially Section 3, Income versus capital accumulation, and soonly household consumption expenditure and holding gains and losses are discussedfurther here.
2.5.2 Household consumption expenditureHousehold consumption includes the value of all goods and services provided inkind from employers or as a result of home production (including the value of imputedrent for owner-occupied dwellings) which have already been included in total income,otherwise household savings will be over-stated. However, it should not include costsincurred in generating income from self-employment. Nor should it include costsincurred in generating imputed rent from owner-occupied dwellings or other homeproduction if those items have been included in the measure of income as advocated

Chapter 2: The Income Concept
26 The Canberra Group
above. However, if in practice it is not possible to include them, then the input costsshould be included in household consumption expenditure so that the appropriatevalue of household saving can still be derived.
Aggregate expenditure may be disaggregated in different ways to supportdifferent types of analysis.
First, it may be desirable to identify the indirect taxes included in the value ofconsumption expenditure if the full redistributive effect of government interventionin the form of benefits and taxes on income distribution is to be analysed. It is thenpossible to contrast the value of social transfers in cash and in kind with the totalvalue of taxes paid, both direct taxes which are included in transfers paid and indirecttaxes which form part of consumption expenditure.
Second, consumption expenditure is sometimes broken down by type ofexpenditure. For some analyses it is of interest to know the size of unavoidableexpenditure related to undertaking paid employment, and it may sometimes bedesirable to show disposable income after the deduction of such expenditure asexplained in section 2.4.3.2. For other analyses it is useful to have housing costsseparately available so that a measure of income minus housing costs can be derived.This measure can be especially important if the implemented version of total incomedoes not include income less expenses from owner-occupied dwellings. Morecomparable proxies for income can then be produced by taking total income lesshousing costs, where housing costs include the input costs of owner-occupied dwellings.
One of the useful distinctions that can be made concerning consumption isbetween the unit which pays for it and the unit which uses it. The total financed bya unit is termed consumption expenditure; the total used is called actual consumption.Most household goods and services are bought and consumed by the same householdso fall into both categories. However, the social transfers in kind discussed aboveare financed by government but consumed by households. Thus they form part ofgovernment consumption expenditure and household actual consumption. Todemonstrate this we may set up the following table:
Consumption expenditure
less social transfers in kind paid to another unit
plus social transfers in kind received from another unit
equals actual consumption.
For the purposes of income distribution statistics this conceptual distinctionbetween expenditure and actual consumption can be applied to deal with some inter-household transfers in a similar way. Compulsory transfers and regular inter-household cash transfers were dealt with under the discussion of income above. Thisleaves some other transfers which affect the distribution of consumption if not income.First among these are inter-household transfers.
2.5.2.1 Inter-household transfersOnce compulsory transfers and regular inter-household cash transfers are removed,two classes of inter-household current transfers remain. The first of these coversirregular transfers in cash. These are most likely to be between family members indifferent households – though not exclusively so. This reinforces the need for clarityand precision about what constitutes a regular cash transfer. In any case, though, itis necessary to allow for irregular cash transfers received and paid.

Expert Group on Household Income Statistics
The Canberra Group 27
Other transfers are irregular gifts such as presents exchanged between familymembers and non-family. Often they will take place by someone in household Abuying a good and giving it to someone in household B. A uses part of its disposableincome to undertake expenditure on behalf of B by buying the gift. B has neitherincome nor recorded expenditure but benefits by the acquisition and consumptionof the gift from A. The gift is included in the consumption expenditure of A and theactual consumption of B, and recorded as a transfer in kind between households.Another way of viewing this is to say that voluntary inter-household transfers aretreated as transfers of expenditure rather than of income. That is, the actualconsumption of the recipient is increased and that of the donor is decreased butdisposable income, consumption expenditure and saving for both are unaffected.
Resolving a satisfactory analytical treatment is somewhat easier than solvingthe practical problems of data collection. Inevitably these transfers are going to beextremely hard to capture well in the basic data. Such errors, though, may not mattertoo much in the aggregate since on the average gifts in and gifts out will tend to beabout the same order of magnitude though on balance maybe rich households givemore and poorer ones receive more. Note also that some of these transfers may bebetween domestic and foreign households, though the sum will usually be smallrelative to domestic transactions.
2.5.2.2 Voluntary transfers between households and other unitsThere are a number of transfers which take place between households and othersectors of the economy which need to be considered. These are payments to andfrom charities, lotteries, and insurance, both life and non-life (accident) insurance.They are discussed in turn below.
Transfers to charitiesDonations to charities may be tiny or very considerable; they may be regular or quiteirregular. For income distribution statistics, there are two options for dealing withtransfers to charities. The first is to regard them as “impersonal” family support andinclude them with compulsory transfers. This recognises that many households doin fact make regular contributions to organisations who rely on these as part of theirnormal income, for example dues paid to trade unions and professional bodies. Itwould also be consistent with the SNA treatment. The second option is to treat themas transfers of expenditure as described above. This would preserve symmetry forthe payments by households to charities and for transfers by charities to households.The first option has already been recommended above for regular cash paymentsbut the second option is adopted here for irregular cash payments and all paymentsmade in kind. However individual countries may wish to take different approaches.
Lotteries and gamblingIt is reasonable to assume that there is no net redistribution between income groupsoverall because of lottery or gambling winnings. However, in household budgetsurveys gambling expenditure is systematically under-recorded, and big winners arelikely to be under-represented. The proposal is therefore to show the total stakes aspart of household consumption and to show the winnings (where known) as negativeexpenditure off-setting these.
Chapter 2: The Income Concept
28 The Canberra Group
The main objection that can be raised is that for big winners, the win may seemlike a capital rather than current flow. Against this there are two counter-arguments.By number, most wins are small. Even if for an individual household the win is large,for the income group as a whole it may not be so significant. By excluding thewinnings from disposable income, the size of the winning cannot influence theincome class of the winning household. On balance, it may be analytically defensible,even preferable, to include even large winnings as “negative expenditure” so thatsaving includes the balance of the winnings less any immediate correspondingspending from them rather than have possibly negative saving offset by this unusualcapital transfer receipt. This is how lottery flows are shown in the accompanyingtables but again countries may choose to adopt another presentation.
Non-life insuranceNon-life insurance is taken to be synonymous with accident insurance and to includeterm life insurance. (Whole life insurance is treated as a form of saving in theseguidelines.)
The treatment advocated here is to include actual premiums paid in householdconsumption and again show claims as negative consumption for the sorts of reasonsadvanced above concerning lotteries. This differs from the SNA treatment, whichrecords the premiums and claims as transfers payable and receivable - see Appendix 2.Even with the simplified presentation proposed in these guidelines, the question ariseswhether some of the claims should be regarded as capital transfers rather than current.For an individual household, the payment to compensate a burglary or the write-offof a car may seem like a capital transaction. However, it is likely that even for largeclaims, the money would be spent immediately to replace whatever had been lostrather than saved. For the insurance company, payouts are predictable statisticallyand this calculation is used in determining rates. Across a large enough group ofhouseholds the number of occurrences will be such that the smaller and more commonthe risk, the more the insurance payments will seem like a regular and recurrent event.For the insurance company, these are sufficiently common to be treated as currentrather than capital payments. In order not to distort national saving, the SNA treatmentis to treat all non-life insurance claims as current. However there is discussion bynational accountants about whether some non-life insurance should be treated ascapital and not current transfers, such as those relating to natural disasters.
There are some types of non-life insurance taken out by individuals which payout a series of regular amounts rather like social insurance payments - for exampleprivate unemployment or disability insurance. If these are a common means ofcovering such risks in a particular country it may be useful to identify the paymentsinto such schemes and the receipts from them separately, since the receipts may bea significant part of the beneficiary’s income.
2.5.3 Holdings gains and lossesAs described briefly in Section 2.4.2, Capital/holding gains, holdings gains and lossesare not regarded as income, and the following paragraphs elaborate on thatexplanation.

Expert Group on Household Income Statistics
The Canberra Group 29
For a start, there is a language problem with the terms “holding gains” or “capitalgains”, stemming from the number of complicated ways of reckoning capital gains.(These are described as holding gains in the SNA to make clear that they refer notonly to gains on fixed capital but also, and more importantly, to gains on financialand other assets also.) It is easiest to explain with a simple example.
Suppose an asset is bought for 100 and five years later it is worth 500. Overfive years there has been a nominal holding gain of 400. If the asset is sold, therealised holding gain is 400. If it is not sold, the asset there is an unrealised gain of400. This gain, however, relates to the five year period and for income calculations,one would only want the gain within the relevant accounting period, say a year.Suppose at the end of the previous year the asset was worth 450. During this year,the nominal holding gain is 50. Suppose the rate of inflation in the year is 10 percent. Then 45 of this 50 is needed simply to maintain the real value of the asset.This 45 is called the neutral holding gain. The real holding gain is the remaining 5.
What should be included in income? The SNA says none of them becauseincome must be measured on the same basis as production where holding gains arerigorously excluded. It can be argued that for some analyses one might want toinclude the real holding gain of 5. This accords with the income definition of beingas well off at the end of the period as at the beginning. For some purposes one mightconceivably want to include the whole of the 50 (though never the 400), but thismay also represent a form of double counting. For example, if the value of a shareincreases because of the increased performance of the company concerned, theincrease in the share will be related to the increase in dividends expected in thecoming years. To count both as income would be to count the same income flow intwo periods.
The treatment adopted in these guidelines is to exclude all holding gains andlosses from income and the measure described here as ‘net accumulation of capital’.They should be recorded them as a separate memo item because they need to betaken into account in the compilation of balance sheets. The Canberra Grouprecommends (Chapter 4) that ideally data should be collected on holding gains andlosses, but recognises the practical difficulties of doing so.

Chapter 2: The Income Concept
30 The Canberra Group
Table 2.2 Extension of definition of income to consumption andaccumulation
11 Household consumption expenditure (incl. consumption in kind except STIK)11.1 Unreimbursed unavoidable work related expenses (travel, childcare, etc), excluding
indirect taxes11.2 Indirect taxes on work related expenses (travel, childcare, etc)11.3 Housing consumption expenditure (actual rent, housing subsidies, imputed rent of
owner-occupiers (equals 2.5)), excluding indirect taxes11.4 Indirect taxes on housing consumption expenditure11.5 Other household consumption expenditure, excluding indirect taxes11.6 Indirect taxes on other household consumption expenditure11.7 Goods and services provided to employee as part of employment package (equals 1.7)11.8 Goods received through bartering (equals 2.3)11.9 Goods produced for home consumption, less cost of inputs (equals 2.4)
12 Irregular transfers of expenditure in cash and in kind12.1 Irregular cash transfers and in-kind gifts received from other households and charities
less those given12.2 Lottery and gambling stakes less winnings12.3 Non-life insurance premiums less claims
13 Total consumption expenditure (11 plus 12)
14 Social transfers in kind received (equals 9)
15 Household actual consumption (13 plus 14)
16 Household saving (10 less 15)
17 Capital transfers received
17.1 Inheritances17.2 Lump sum retirement payouts17.3 Life insurance claims less premiums17.4 Other windfall gains
18 Capital transfers paid18.1 Tax on inheritances18.2 Periodic taxes on wealth (including taxes on holding gains and losses)
19 Net accumulation of capital (16 plus 17 less 18)
20 Memo item: Holding gains and losses

Chapter 3
Other ConceptualIssues
The Canberra Group 31
3.1 IntroductionIn addition to defining the income concept, a number of other conceptual issues haveto resolved before income statistics can be compiled. It is necessary to decide whichstatistical units are to be used and the length of the accounting period to which thestatistics refer. And if comparisons are to be made between countries or over time itis necessary to take account of price differences in some way. Sections 3.2 and 3.3of this chapter discuss length of accounting period and choice of statistical unitsrespectively. Section 3.4 addresses the use of price indices to remove the effect ofinflation from time series comparisons, and Section 3.5 discusses the use ofpurchasing power parities to adjust comparisons between countries for pricedifferences between them.
3.2 Accounting periodA twelve-month reference period is also the common period for which owners ofsmall enterprises derive a measure of profit or loss for their business if they areoperating within the formal sector. If income statistics are compiled fromadministrative records such as income tax data, the data for wage and salary earnersare also likely to be only available with a twelve-month reference period.
There are some types of receipt such as interest, dividends, and income fromseasonal activities such as agriculture and tourism, which tend to be received on anannual cycle. As they are essentially ‘regular’ receipts and should contribute to themeasure of income, a year is the minimum accounting period that should be usedfor them.
While a one-year reference period is both the desirable and practical accountingperiod in many situations, there are other circumstances where this may not be so.If income data are collected by means of household surveys, wage and salary incomeand any regular transfers received will normally be reported more easily and moreaccurately if information is only sought with respect to the previous week or month.For practical purposes it may therefore be best to collect different types of data withdifferent accounting periods and standardise them for analytical purposes, even thoughan element of non-comparability is thereby introduced. Also, the shorter period usedfor some components will not always be typical of the full period and so

Chapter 3: Other Conceptual issues
32 The Canberra Group
complementary information on whether there were any special factors during thatperiod which made the receipts atypical should be sought if possible.
It should also be noted that different accounting periods may suit different typesof analysis. For example, studies of income distribution within the population producelarger measures of inequality when income is measured for a twelve month periodthan if income were measured as an average across a person’s lifetime. Students,for example, may be poor this year, but be building up skills to provide for an aboveaverage income across their working life. (Further discussion of longitudinal dataissues is provided in Chapter 8, Income dynamics.) On the other hand, life-timeaverage income will not be a very useful measure for governments and otherorganisations concerned with assisting those in poverty today.
WE RECOMMEND THAT THE ACCOUNTING PERIOD TO BE USEDFOR INCOME DISTRIBUTION ANALYSIS SHOULD BE ONE YEAR
3.3 Statistical units
3.3.1 IntroductionA choice of statistical unit has to be made both for collecting income data and foranalysing them. For data collection, the choice will depend on the design of the survey(or the nature of the system through which administrative data are available) and onthe element of income for which data are sought. For example, wages and salariesare best collected at the individual level whereas data to enable imputed rent to becalculated will have to be collected at the household level. In general it is advisableto collect information at the lowest level of disaggregation possible to give maximumflexibility in choice of analysis unit. The remainder of this section concentrates onchoice of analysis unit.
One of the key requisites in making progress in the area of meaningfulinternational data comparisons is the establishment of the capacity to harmonise andstandardise the units of analysis used in the development of income estimates fromhousehold surveys.
In principle, economic well-being is an individual rather than a collectiveexperience. However, the use of the individual as the primary unit for incomedistribution analysis, even if it were practically possible, would be to ignore the factthat individuals often share income with others with whom they live. To use theindividual as the statistical unit would mean that economically dependent spouses,for example, would be seen as living in poverty when they may in fact sharesubstantial income received by their partner and children. Thus to attempt to makean accurate estimate of individual income would require data on transfers made withinthe living unit, a virtual impossibility.
The statistical unit for analysis of economic well-being therefore has to be onewhere assumptions of sharing of economic resources are most plausible. Ideally, theunit should be one where an assumption can be made that the well-being of anyindividual in the unit can be assessed on the basis of the combined economicresources of all members.

Expert Group on Household Income Statistics
The Canberra Group 33
Statistical units become increasingly important in the assessment of the socialand demographic implications of economic well being – especially when the yardstick is income distribution. Thus the choice of the statistical unit of analysis willdepend to a high degree on the analysis framework intended for the information.This idea is well articulated in A Provisional Framework for Household Income,Consumption, Saving and Wealth (Australian Bureau of Statistics, 1995). In shortthat Australian work suggests that an individual may be the preferred statistical unitwhen analysing, for example, the relationship between earnings and educationalattainment. However, for the analysis of the distribution of income it is usually moreappropriate and meaningful to group people according to the way income ispotentially shared within, say families, to form a single spending unit.
Income, expenditure and wealth statistics are of necessity collected anddisseminated using a limited range of statistical units such as households, varioustypes of families and individuals. Practices in the choice of statistical units, and thedefinitions of those units varies from country to country, and may even vary withina given country’s income and related statistics programs (see Chapter 8: RobustnessAssessment). The picture of the economic well being of individuals may varyconsiderably depending which statistical units are chosen and indeed on the legitimatestatistical comparability of the unit of analysis. As already noted however, the choiceof reporting unit may not be the same as the choice of analysis unit. It will often beappropriate to collect data from units at a lower level of aggregation and thenaggregate to the level at which the income sharing assumption is thought to hold.
The following sections discuss various statistical units for use in the analysis ofincome. The approach is to explore the statistical units at a conceptual level andthen recommend some specific, operationally feasible definitions. In this waycompromises which need to be made for practical reasons in choosing definitionsfor statistical units can be assessed against a theoretical ideal.
3.3.2 Definitions of statistical unitsTraditionally, groupings used for the measurement of income are households, broadlydefined families (called “economic families”) and nuclear families (smaller units -mother, father, sister, brother).
3.3.2.1 Unattached individuals - Persons not in families:One of the implications of the choice of families as statistical units is that each familydefinition creates a somewhat different group of individuals who we can refer to as“persons not in families.” These can be divided into those who live by themselves,and those who reside with other persons. For those who are living by themselves, inmany countries (though not all) these individuals will all be classified as personsnot in families regardless of the definition of the family used. The impact of thechoice of family definitions is, therefore, found among those who share a dwellingwith others. In the case of nuclear families, these people may be related to otherpeople in the dwelling but they are considered to be persons not in families sincethe kinship ties are other than parent-child. In the case of broadly defined or economicfamilies, the persons not in families are those who share only the same roof andhave no kinship ties.

Chapter 3: Other Conceptual issues
34 The Canberra Group
If the household is the chosen statistical unit, there are no analogues to “personsnot in families” since households are defined to include persons living alone in adwelling i.e., households of size one. Standard practice is to include all householdsin calculations regardless of household size. This raises one of the peculiarities ofcalculations performed using the households as statistical unit. For families, onlygroups of two or more individuals are included in calculations. The result is thatwhile households are the more inclusive unit, average household income will besmaller, often substantially smaller, than average family income simply because theinclusion of households of size one in the calculations.
The impact of the choice of family definitions on persons not in families is mostevident with calculations based on thresholds such as low-income cut-offs or povertylines. In the case of nuclear families, for example, the economic well-being of personsliving with relatives (but not in a parent-child relationship) will be calculated asthough they were living alone. Their individual incomes may be quite low (whichis frequently the case with the elderly) with the result that they will be erroneouslycounted among the “poor” even when they benefit considerably from income sharingwith the nuclear family with which they reside. This can also occur in the case ofeconomic families. However, in the case of economic families, persons not in familiesbut living with others have no kinship ties with those with whom they live and sothe likelihood of income sharing is presumed to be lower as is, therefore, thelikelihood that their individual incomes misrepresent their economic well-being.
3.3.2.2 Households
DefinitionThe definition of a household is usually deceptively simple. There are two main typesof definition in use: people who share a dwelling, and the rather more restrictivedefinition of those who share a dwelling and who usually eat together. The latter iscommonly used for household budget surveys.
Impact on the income sharing assumptionHouseholds may include persons who are not related by blood, marriage or adoptionto all of the other household members. What does this do to the sharing assumption?In the extreme, some household members such as roomers and boarders may payother household members for the services that they receive. The other householdmembers may share in this income (the payments of the roomers and boarders) butthey do not share in all of the income of the roomers and boarders. It is evident thatat the household level, the income sharing assumption is not always valid.
On the other hand, there are instances of income sharing which cross householdboundaries. There are many developing countries where the extended family is ofgreat importance, even to the extent that family members living abroad makesubstantial transfers to those in the home country. In developed countries, high incomeelderly families often transfer income to adult children (or grand children) living inseparate dwellings. (In some cases, this serves to reduce their long-term income taxliability.) Between-household sharing of income also occurs when families breakup and one spouse (usually the one without custody of the children) makes paymentsto the former spouse either for the support of the spouse or for the support of thechildren or for both.
Expert Group on Household Income Statistics
The Canberra Group 35
In other words, if we were to define statistical units as those groupings ofindividuals who shared income, then the “same dwelling” limitation in the definitionmight be both erroneous and unacceptable.
In order to capture all of the income sharing so that it includes betweenhousehold transfers, it is necessary either:
• to adopt statistical unit definitions which are not subject to the “same dwelling”constraint.
or• to include as income all such inter-household transfers.
However, the first option gets very complicated from a practical point of viewsince surveys would have to ask questions about inter-household income transfersjust to identify statistical units, and all households within the ‘sharing unit’ wouldhave to be included in the survey sample, which is impractical when using areasamples. The second option is the one implied by the conceptual frameworkrecommended in Chapter 2, with the proviso that the payment of such inter-householdtransfers must also be deducted from the donor household’s income.
Practical measurement implicationsSince a household is generally defined as all persons sharing a dwelling, the twoprincipal issues are: how do you associate people with dwellings, and even moreimportantly, what is a dwelling?
Associating persons with dwellings:The standard practice is to say that persons are associated with the dwelling that istheir usual place of residence. That is easy to say but much more difficult to putinto practice. Failure to associate everyone with a dwelling is believed to be a majorsource of undercoverage in censuses of population and in household surveys usingarea samples. (Age-specific undercoverage rates of 10 per cent or more are notunheard of in household sample surveys.) It might be dismissed as a problem fordemographers but it also has serious implications in the assessment and analysis ofincome distributions. When a household member is away from the dwelling wherehis or her immediate family resides in order to get work, failure to associate thatperson with the family residence has obvious and serious implications for incomedistributions. The household or family income may be reduced, possibly erroneouslyputting the family or household income near the very bottom of the incomedistribution. In a one person household (that of the person away working) the incomemay be shown as being far higher than it really is in the scale of economic well-being.
Students away from the parental dwelling can create similar problems. A studentnot associated with their parental dwelling will show up as a very low income, one-person, household and the parental household’s economic well-being may be overestimated. Of a somewhat different nature, but still problematic, are joint custodyarrangements for children following separation or divorce. These also pose problemsfor household definitions based on usual place of residence.
In general then, the use of the household as a unit to describe incomedistributions is perhaps necessary as a building block to other more useful analyticalunits. The reasons for this would include the fact that the household is a rather looselydefined set of individuals who share a common dwelling. The assumption of pooling

Chapter 3: Other Conceptual issues
36 The Canberra Group
or sharing of income and expenditure decisions is far less clear in the case ofhouseholds than is the case for families.
Definition of a dwelling:The conventional definition is that a dwelling is a structurally separate set of livingquarters with an entrance from outside of the structure which does not pass throughsome other dwelling. Generally the application of this definition poses few problems,at least in the well-housed populations of developed countries. Nevertheless, thereare situations where on site suites or cottages occupied by other family members ordomestic staff may be problematic as may low-cost housing for individuals (e.g.,rooming houses) with shared cooking and washing facilities.
3.3.2.3 Broadly defined families
DefinitionA broadly defined family usually includes all persons sharing a dwelling who arerelated by blood, marriage or adoption, often referred to as an economic family. Sucha definition relies on the relationships (blood, marriage, and adoption) to substantiatethe income sharing assumption. In the most generic of terms a family should exhibitthe following characteristics. It should be comprised of two or more persons, one ofwhom should be of a minimum age (some countries use 15 years, others use 16)who are related by blood, marriage or adoption. The persons identified in the familyshould be usual members of the same dwelling. Both registered and de facto/commonlaw marriages are usually given equal status. All other persons living in a dwellingwho do not meet the generic characteristics described above would be characterisedas unattached individuals.
Impact on the income sharing assumptionWhile seldom explicitly articulated, members of an economic family are assumedto share income because they are related to each other and choose to share a commondwelling. Being related alone is not sufficient to ensure income sharing since parentsand adult children living in different dwellings, brothers and sisters living in differentdwellings, and so forth, are not assumed to share income. As pointed out earlier, inthe context of households merely sharing a dwelling may not be sufficient groundsfor assuming income sharing.
However, when both kinship and shared dwellings are operative, as is the casewith economic families, the assumption seems to stands on firmer ground.
3.3.2.4 Nuclear families
DefinitionNuclear families are defined as parent(s) and unmarried children sharing a dwelling.Sometimes an age limit for children (e.g. 18 years) is added to the definition.
Impact on the income sharing assumptionAgain, kinship and the sharing of a dwelling substantiate the income sharingassumption. In the case of the nuclear family, the influence of kinship is buttressed

Expert Group on Household Income Statistics
The Canberra Group 37
by the nature of the kinship ties. Specifically, the children in these families, especiallythose under a certain age, have little or no income of their own and so all of theirconsumption is derived from parental income.
3.3.3 Choice of unit and the measurement of incomeThe choice of statistical unit over which the income sharing assumption holds maybe more straightforward for some types of income than for others. In particular, thereare difficulties for certain types of imputed income. The following provides a fewsituations to illustrate the point that within the income framework the complexity ofsome income or benefits and the subsequent allocation to a dwelling, household,family or individual may be too complicated to cover with a household surveymethodology. Whatever the merits and challenges of extending the income to includeimputed income the issue here is what are the implications vis-à-vis the statisticalunits? These may be quite considerable.
3.3.3.1 Owner-occupied housingA “family” occupying a mortgage-free house clearly has a higher level of living thanan otherwise demographically and financially identical family renting theiraccommodation. (Also note that those who live in state-owned housing, and whopay less than market rents, should also have the difference between the rent paidand market value imputed to them as income in the form of social transfers in kind.Most of the following arguments regarding owner-occupied housing apply here as well.)
One might argue that all of housing related imputed income should be attributedto those holding legal title to the dwelling. However, this is a classic case of incomesharing. Everyone in the dwelling consumes the housing services provided by thedwelling and so everyone in the dwelling should be included among those receivingthe imputed income.
In terms of statistical units the implication is that the household is probably themost suitable unit for measuring the income from owner occupied housing.
3.3.3.2 Goods and services provided to employee as part of employ-ment package
Often referred to as ‘fringe benefits’, these may extend to more than the employeewhose employment package generates them. For example, medical insurance benefitsand dental plans generally provide benefits to both the employee and his/her family.However, almost all of these plans cover only the so-called nuclear family, i.e.,parent(s) and “dependent children”.
In terms of the choice of statistical units, it is clear that no one definition offamily or spending unit will be appropriate when adding to income the imputed valueof these fringe benefits. In fact no single analytical unit will provide a comprehensivesolution and compromises will have to be made.
That having been said, the following section provides a proposal for a set ofhierarchical units of analysis for the purposes of collecting and presenting incomedata.

Chapter 3: Other Conceptual issues
38 The Canberra Group
3.3.4 Recommendations for harmonised statistical unitsThe diagram below sets out a hierarchy of units of analysis which the Canberra Grouprecommends be adopted as the standard for collecting and presenting householdincome data. This reflects the position which has already been adopted by mostcountries.
Table 3.1 Canberra Group recommendations for harmonised statistical units
A structurally separate set of living premises with a private entrancefrom outside the building or from a common hallway or stairway inside1
A person or group of people who reside together in the same dwelling2
Two or more people sharing a common dwelling unit and related by blood,marriage (including same sex couples and de facto or Common Lawrelationships) or adoption. The proposal here is that all relatives livingtogether at time of the data collection should be considered to comprisea single family regardless of the nature of kinship.
An unattached individual is a person living alone or in a householdwhere he/she is not related to other household members.
One person or group of related persons, within
a household, whose command over income is shared. 3
Dwelling
Household
Family
IncomeUnits
UnattachedIndividuals
1. Eurostat definition is: a structurally separate set of living premises and the principle usual residenceof at least one person
2. This is virtually identical to the Eurostat definition of a private household - household dwellingconcept
3. This is virtually identical to the Eurostat definition of a private household – housekeeping concept

Expert Group on Household Income Statistics
The Canberra Group 39
Taking into account the relationship between these “building” blocks for unitsof analysis and the actual production of income estimates, the Canberra Groupconsidered the household to be the preferred basic unit of analysis. The preferencewas driven by to a high degree by the relationship of households to both micro(survey) and macro (SNA) data uses.
The 1993 System of National Accounts (SNA) definition of the institutionalsectors of the economy (page 3 Section C) indicates the main sectors of the economyfor which it is possible to compile the full sequence of accounts. Two main kinds ofinstitutional units or transactions are distinguished in the system: households andlegal entities. In the SNA, institutional units that are resident in the economy aregrouped together into five broad mutually exclusive sectors composed of the followingtypes of units:
i) Non-Financial Corporations
ii) Financial Corporations
iii) Government Units
iv) Non-Profit Institutions (NPI’s)
v) Households
Clearly the use of the household as a unit in the macro sense relies on the notionof the income associated with that unit. However the definition of household in theSNA is very loose and is one of several subsets of the institutional units and sectors.Households are defined as (Commission of the European Communities et al, 1993,page 19-20):
Households: all physical persons in the economy, with the institutional unitin the household sector consisting of one individual or a group of individuals.According to the criteria given for defining the institutional unit, the householdof the owner of an unincorporated enterprise in general includes thisenterprise, which is not considered an institutional unit (except under certainconditions). The principal functions of households are the supply of labour,final consumption and, as entrepreneurs, the production of market goods andnon-financial (possibly financial) services.
Non-profit institutions serving households (NPISHs): legal entities which areprincipally engaged in the production of non-market services for householdsand whose main resources are voluntary contributions by households.
Generally speaking, the SNA is not especially particular about the methodologyof how the “household’ is defined and constructed, but rather how it functions as aproduction or consumption unit. It is worth noting that “Australian” household unitsare treated in the SNA frameworks the same as “Canadian” or “USA (American)”household units despite the fact each is defined quite differently for microdata.
The basic definition of “household” as proposed in this paper is recommendedfor comparison and data analysis activities since the only major difference in mostcountries microdata collection definition of households relates to “the eatingtogether”. This slight variant would not seem to create large differences in eitherthe number or size of households for most microdata survey based estimates for mostcountries.
Chapter 3: Other Conceptual issues
40 The Canberra Group
WE RECOMMEND THAT THE HOUSEHOLD, AS DEFINED INTABLE 3.1, BE ADOPTED AS THE BASIC STATISTICAL UNIT FORINCOME DISTRIBUTION ANALYSIS, WITH THE OTHER UNITS INTABLE 3.1 AS ALTERNATIVES FOR PARTICULAR PURPOSES
3.3.5 Equivalence scalesOne complication posed by use of the household as the statistical unit is thathouseholds vary in size and composition and such differences between householdsmean that their relative needs will be different. For example, a large household willhave a lower standard of living from the same income as that received by a smallhousehold, all other things being equal. Costs of household members also differaccording to their age, student status, labour force status and so on.
When the focus is on international comparisons of income distribution, evenwhen countries have adopted the definition of household as the unit of analysis theirdifferent demographic structures may have an impact on the validity of comparisonsbetween them.
Equivalence scales are designed to adjust income to account for differences inneed due to differences in household size and composition. The most basic of suchadjustments is to calculate household income per member to adjust total incomesaccording to the number of people in the household. But such an adjustment ignoreseconomies of scale in household consumption relating to size and other differencesin needs among household members, in particular differing needs according to theage of both adults and children.
There is a wide range of equivalence scales in use in different countries and bydifferent organisations. All take account of household or family size: in many scalesthis is the only factor, whilst in those taking into account other considerations it isthe factor with greatest weight.
Equivalence scales are usually presented as income amounts, or ratios ofamounts, needed by households of different size and structure. Thus if a one personhousehold needs one unit of income to maintain a given level of living, a two-personhousehold may need 1.7 units, and a three-person household 2.2 units. There aretwo basic approaches to construction of scales: those which use the expert knowledgeof social scientists and others, and those which are developed empirically based onanalysis of survey data.
Equivalence scales are generally assumed to be invariant with income – i.e. therelative needs of different household types are assumed to be the same for those onlow incomes as for those on high incomes. This is not necessarily correct. But amore sophisticated assumption would be more difficult to implement. The simpleapproach appears reasonable as long as results are tested against a wide range ofequivalence scales: Chapter 4 provides guidance.
A simple adjustment for differences in need according to household size isrecommended for most international comparisons. Hence, measuring adjustedhousehold income as income divided by the square root of household size is a goodstarting place. Moreover, choice of equivalence scale may vary according to theincome concept being measured. If it includes social benefits in-kind, e.g., education

Expert Group on Household Income Statistics
The Canberra Group 41
expenditures per pupil or health care benefits, the equivalence scale used to adjustthis income measure may be different than one which is applied to cash income alone(Smeeding et al. 1993). Finally, note that choice of “no equivalence” adjustment isin effect choosing a particular equivalence scale. It means that the producer implicitlyassumes complete economies of scale, such that a given cash income level producesthe same level of utility if it is shared by 1, 2, or 6 different persons in the household.
WE RECOMMEND THAT FOR DISTRIBUTIONAL ANALYSIS,INCOME SHOULD BE ADJUSTED TO TAKE ACCOUNT OFHOUSEHOLD SIZE USING EQUIVALENCE SCALES
3.3.6 Population weightingA final issue in relation to the choice of statistical units is the choice of populationweights. The households interviewed in income surveys are drawn to be representativeof a defined population. Each household is weighted inversely to their probabilityof selection. Household incomes are then multiplied by this household weight toproduce representative estimates for all households in the target population. Thussample household incomes are ‘weighted’ to estimate total household income.
However, it has already been established at the beginning of this section thatthe users of income statistics are most often concerned with the economic well-beingof individuals and not with the well-being of households per se. Once equivalencescale adjustments have been applied to household income so that household incomeno longer directly reflects the size of the household, household income weights canbe multiplied by the number of people in each unit to derive ‘person weights’. Bythe application of these derived ‘person weights’ to equivalised household income,estimates of the distribution of income amongst all persons can be made. Thus a sixperson unit ‘counts’ six times as much as a one person unit. Person weightingproduces an estimate of the overall distribution of income among individuals in thepopulation, assuming that all household incomes are pooled. This distribution reflectsthe assumption that household income is shared equally between all members ofthe household, and does not reflect the direct receipt of income by individuals.Because many household members receive no money income, eg younger children,such an assumption is hard to avoid in practice.
In some countries, complete income data are available for each individual withina household, except for children. In these cases, individual person weights aredetermined by the sample design used to produce income distribution estimates ofthe income earning population. Such design-based weights are distinct from the‘person weights’ used in income distribution analysis as described above. In thismethod different household members have different income values, and incomes areassumed not to be pooled. However, in order to estimate the distribution of incomesamongst all persons within a household unit, including children, the person weightingmethod first described above is recommended .
Chapter 3: Other Conceptual issues
42 The Canberra Group
3.4 Use of price indicesWhen the data compilers produce household income statistics that form time series,it may be desirable to adjust them to remove the effects of inflation so that ‘real’comparisons may be made of income levels.
Such adjustments can be seen as the extension of the concept of equivalencescales already discussed. Equivalence scales provide estimations, or assumptions,about the level of disposable income that a household with one set of characteristicsneeds, so that its members can attain the same standard of living as a referencehousehold that has different characteristics. They can be thought of as price indicesfor different household types.
However, even for households of a given type, prices are unlikely to remainunchanged over time. To provide valid comparisons over time – or between differentgeographic areas or different groups within a population - income distributionstatistics need to be adjusted by an appropriate price index, consistent with the incomedefinition. The requirement is for a transformation such that, when people are rankedby their incomes deflated by the chosen price index, they are correctly ranked bythe living standards which those incomes allow.
When the income definition chosen is disposable income, the index shouldcapture those consumption items which can be purchased out of ‘disposable income,’however this is defined. For example, if income is measured net of local government/property taxes, then local government/property taxes should not appear in the priceindex. Normally it will be possible to use the consumer price index or one of itssub-indices, which will be widely available.
If a broad definition of income, beyond cash income, is employed, the priceindex needs to be widened. If, for example, imputed rent on owner-occupied propertyis included in income, such ‘rents’ would need to be captured and appropriatelyweighted in the price index. If ‘income’ is broadened to include social transfers inkind, then these need to be included in the price index.
Another possibility is that price changes vary across the income distribution.This could arise because of different availability of expenditure items combined withdifferent inflation rates for different items. Or differential changes in the cost of livingcould arise from differential changes in access to discount stores. There would beattractions in making complex adjustments to price indices to capture suchdifferences. However, in practice they would bring major problems. If three typesof price indices are available, one reflecting family circumstance, one average incomeand one geographical location, which of the three should be applied to a givenhousehold? If different adjustments are made for different sorts of analyses, thesituation is reached where even the average income for all households can differbetween analyses, just as it can be different if different equivalence scales are used.Thus in most situations data producers have to be content with the application of asingle-dimensional (eg location only; family composition only) price index to adjusta given income definition for differences in across time in the same country.
Expert Group on Household Income Statistics
The Canberra Group 43
3.5 Use of Purchasing Power ParitiesMost cross-country studies of income distribution present income data in relativeterms, that is, poverty studies will describe the fraction of the population with incomeless than some fraction of the median (see Chapter 7: Data Presentation). Suchpresentations are not made in money terms and thus the question of convertingdifferent currencies to a common standard does not arise. However, analysts andpolicy makers are also interested in the relative standards of living in differentcountries in real terms. They are interested, for example, in the ‘real’ living standardsof the poor in one country compared to the ‘real’ living standards of the poor inanother country. In order to make such comparisons, researchers need to transformrelative incomes into real incomes in a way that takes into account differences inthe purchasing power of income.
Macroeconomists have for some time used purchasing power parities (PPPs) totransform relative incomes expressed in different countries’ currencies onto a commonbase. PPPs have been developed from National Accounts data coupled with cross-country surveys of ‘average’ prices of baskets of goods and services relevant to thewhole economy. PPPs are regularly produced by OECD for their member countries,by Eurostat for EU member countries, and are produced less frequently by the WorldBank for a wider range of countries.
A PPP calculates the ratio of the cost of one country’s basket of goods to thatof the same basket at the prices of another country. The baskets of goods in differentcountries may differ because of national characteristics; it may be technically possibleto price comparable goods in two countries but if the goods are not equallyrepresentative for both countries, the resulting price ratio may not give an unbiasedestimate of purchasing power. One factor affecting such comparisons may begeographical. A temperate climate may mean that neither air-conditioning nor centralheating is in common use and so comparing the cost of running these units issomewhat artificial. Basic foodstuffs are another case where comparisons are difficultsince what is a staple in one country may be a somewhat exotic article elsewhere.
PPPs have primarily been developed to generate ‘real GDP per capita’, andtherefore cover a wide range of goods and services over and above householdconsumption. Sub-indices are also produced of ‘Individual Consumption byHouseholds’ which exclude capital goods and collective expenditures by governmentand are therefore more suitable for use in adjusting household income data. Sub-indices are also available which exclude those goods and services such as healthcare, education and housing which may or not be purchased by households ratherthan provided by government in different countries. Thus PPPs exist which areappropriate for use in income distribution analysis. However, for many countries PPPsare not calculated annually but less frequently: thus one has to be careful to use thosewhich are as close as possible to the years for which the household income microdataare to be compared.

Chapter 3: Other Conceptual issues
44 The Canberra Group
Nevertheless, whatever their technical difficulties, PPPs are much preferred toexchange rates for making cross-national comparisons. If the cost of a given basketof goods can be put in common currency, the conversion of one to another gives areal purchasing power measure of the local currency, a measure which can deviateconsiderably from the exchange rate since the latter is affected not only by thedomestic cost of living but also by the relative demand for a country’s products,capital market and currency trading, and international trade. Further information aboutthe concepts and methodology of PPPs may be found in Appendix 3.
WE RECOMMEND THAT WHEN CROSS-COUNTRY COMPARISONSOF REAL INCOMES ARE TO BE MADE, PURCHASING POWERPARITIES SHOULD BE USED IN PREFERENCE TO EXCHANGERATES.

Chapter 4
From Conceptsto Practice
The Canberra Group 45
4.1 IntroductionChapters 2 and 3 sought to establish the concepts which should underlie productionof household income statistics. However, there have already been hints that when itcomes to putting these concepts into practice compromises have to be made becauseof various constraints encountered, which may move the implemented definition someway from the ideal. This chapter explores these constraints and their impact, andtries to draw from them some criteria for choice of practical definition.
The two main constraints faced in turning a conceptual definition of incomeinto a working definition which can be implemented in practice are:
• availability of data
• quality of data
In addition, the purposes for which the data are required will also influence thechoice of definition.
Most income distribution statistics rely on data collected in household surveys,although there are administrative sources in some countries which can be used: forexample, tax and/or social benefit records, or personal income registers. However,it is highly unlikely that either type of source can provide the level of detail of datawhich the concepts developed in Chapters 2 and 3 demand.
Household surveys are constrained by the information it is feasible to expectpeople to be able to provide with reasonable accuracy during the course of aninterview. This means that:
• people have to have knowledge of the income they are being asked to report – forexample they may have little idea of the social insurance contributions made ontheir behalf by their employer;
• they have to be able to recall the information with a reasonable degree of accuracy,which may influence the accounting period used as well as the questions it isfeasible to ask;
• the questions must appear relevant to the respondent – it may be difficult to getinformation which might seem to them to have little connection with theircircumstances, such as the value of goods produced at home for barter transactionsin many OECD countries.
Chapter 4: From Concepts to Practice
46 The Canberra Group
Some of these difficulties may be overcome by collecting proxy informationfrom which estimates of some income components can be made. This is particularlythe case for social transfers in kind, but is also the preferred method in some countriesfor the estimation of other items such as income tax.
At first sight it might appear that recourse to administrative records couldcircumvent most of these problems. Income tax records are the most important ofsuch sources and have historically provided long-run time series of continuous data.However, they also have their drawbacks:
• incomplete coverage of those with incomes below the tax threshold, a problemwhich varies over time with the tax base and which will be particularly acute incountries where the tax base is very small in relation to the total population;
• the definition of taxable income may not correspond to that chosen in studyingincome distribution;
• the definition of the tax unit may not be appropriate; and
• there may be difficulties in treating part-year units.
For these reasons, tax records are typically used in conjunction with othersources: for example, social security information for non-taxpayers, and informationon total incomes from national accounts. Appropriate use of these files almost alwaysinvolves direct matching of individual files by a personal identifier and, hence, runsup against privacy and confidentiality concerns. In most nations, the individualrespondent is required to give his/her “informed consent” before the match takesplace.
The issue of data availability is linked to those of quality and fitness for purpose.Often, when data are not collected on a particular income component this is becauseit is supposed – or indeed has been established in previous studies – that it is notpossible to do so with sufficient accuracy for the purpose for which they are required.Quality may be sufficient to provide accurate estimates for some purposes but notfor others.
These issues are explored further in the rest of this chapter. Section 4.2 discussesdata availability through reference to a metasurvey carried out by the Canberra Groupof the income data collected in a range of countries from different regions of theworld and at different stages of development. However, availability of data items isnot sufficient to ensure that reliable and internationally comparable incomedistribution statistics can be constructed from them. Quality of data is also ofparamount importance. Section 4.3 draws attention to the factors which can affectdata quality and identifies the pitfalls of which data producers and users alike mustbe aware, drawing on the experiences of countries participating in the CanberraGroup. Section 4.4 brings all this material together to suggest options for choice ofa practical income definition in the context of making cross country comparisons,drawing on the experience of the Luxembourg Income Study. Priorities are suggestedfor the development of a more complete income definition.

Expert Group on Household Income Statistics
The Canberra Group 47
4.2 Data availability
4.2.1 IntroductionThis section reports on the income components collected in a wide variety ofcountries. An examination of this information may illuminate the differences incurrent practice and enable general conclusions to be drawn about which componentsit is and is not feasible to include in a working definition of income.
One important issue is whether any existing household survey collects all (ormost) of the income components needed to construct a complete income definitionas developed in Chapter 2. A corollary issue is whether omissions can be compensatedfor by other means.
4.2.2 The metasurveyAppendix 4 provides the results of the results of a “metasurvey” (survey aboutsurveys) of 106 income components that are actually collected on household incomesurveys across the world. Good data collection practice requires asking the mostdetailed questions about those components most difficult to collect and moresummary questions about easier-to-collect concepts. Accordingly, the data collectioninstrument was organised into nine sections, each oriented toward a different classof components of income and the aim was to be as exhaustive as possible. The ninetypes of income were: (A) income from employment, (B) fringe benefits, (C) incomefrom property, (D) income from universal government programs, (E) income fromgovernment and private social insurance, (F) income from government means-testedtransfer programs, (G) private transfers, (H) deductions from income, and (K) incomefrom other sources.
Respondents were asked to note the following about each component:• whether it was collected at all;
• if not, indicate whether it was imputed (allocated) by the statistical agencyconducting the survey;
• if so, then whether it was collected as a separate income component or jointly withanother component; and
• if jointly, which components were collected together.
If a component was collected only by inference in some sort of summarycatch-all question, then the respondent was asked to note this fact. Respondents werealso asked to indicate if an income component was not applicable to their country.Four countries—Finland, the Netherlands, Norway, and Sweden—reported on thedata available to them from the administrative records they use to report incomedistribution statistics. Appendix 4 Table 1 lists the 106 income components. For thepurposes of this chapter, the income components have been re-arranged to followthe income classification laid out in Chapter 2 Table 2.1(and in Appendix 1), andthey have been assigned codes which are consistent with but expand on those inTable 2.1.
Responses were received from individuals providing information on 30 incomesurveys in 25 countries on all 5 continents. Note that as in all surveys, there aresources of error in the data presented. Not all respondents always understood whatincome component was being described in the short description provided on the

Chapter 4: From Concepts to Practice
48 The Canberra Group
questionnaire and it was not always possible to understand how to describe the newincome components contributed by the respondents. Besides language differences,there are substantial institutional differences among countries – for example in theavailability of administrative records.
Appendix 4 Table 2 summarises the results of the investigation and Table 3presents the complete answers to the questionnaire. Details of each reply and anyupdates to them are held on the Luxembourg Income Study website (www.lis.ceps.lu/canberra.htm). A component is considered collected if at least one survey in thatcountry collects it. When counting the number of countries responding “yes”,responses of “not applicable” are added as well (if a country does not have a programor income component, it implicitly collects its value - zero). However, it is notpossible to tell whether a component is not collected because its value is assumedto be negligible – ie applicable but insufficiently important to be included in a survey.
4.2.3 The resultsThere were nine income components collected in 23 or more of the countries - wagesand salaries from the main and other jobs (1.1A, 1.1B), bonuses (1.2B), nonfarmand farm self-employment income (2.1A, 2.1B), rental income (3), interest anddividends (4.1A, 4.2A), and employer-based pensions (5.1A). Other items are lesswell covered, and are discussed under each component of income below.
4.2.3.1 Employee income
As well as wages and salaries from the main and other jobs and bonuses, for whichdata were available in virtually all countries, a further five components of employeecash income were available for at least half the countries. Employer reimbursementsfor work expenses (1.1E, 1.1F), which should be deducted if they are paid with wagesand salaries, are collected by virtually no countries, but this is unlikely to be animportant omission.
Data availability on ‘fringe benefits’ is much more sparse. Only three arecollected by at least half the countries reporting - company cars (1.7A) and subsidisedmeals (1.7B) in 13 countries, and subsidised housing (1.7D) in 14. Employers’ socialinsurance contributions (1.6A-E) are even less well covered – data are collected bysix or fewer countries.
4.2.3.2 Income from self-employment
Non-farm and farm self-employment income (2.1A, 2.1B) are collected by 24 and23 countries respectively and royalties are collected by 15. However, imputed incomefrom self-employment is much less well covered. Worth particular note is the relativedearth of information collected on home production for barter transactions (2.3).Whereas 14 countries did collect information on home production for own use (2.4),only six — China, Gambia, Mauritius, Mexico, the Netherlands and Switzerland —collected home production for barter. This income component is therefore key tocreating an international income measure that would be comparable across countriesat various stages of development.
Imputed income from owner occupation (2.5) is also available in less than halfthe countries: estimates are made by only 12.

Expert Group on Household Income Statistics
The Canberra Group 49
4.2.3.3 Income from rentals
Income from rentals is available in all 25 countries.
4.2.3.4 Property income
Income from property is also widely collected. Interest received (4.1A) and dividends(4.2A) are collected in 24 countries; interest and dividends from estates and trusts(4.1B plus 4.2B) are collected in 15. Interest paid on mortgage and non-mortgageloans (11.7A and 11.7B) is collected by 13 and 12 countries respectively. Note thatwhile in theory a distinction should be made between rent income received on landand rentals on non-land assets, with only the former being part of property income,it is doubtful that any household survey can make that distinction, especially sincethe rental of buildings almost always implicitly includes the rent of the land underthe buildings. Only two countries, Mauritius and Switzerland, were able to identifyrent from land.
4.2.3.5 Current transfers received
The first category of transfers is government and private social insurance benefits(5.1 and 5.2). Virtually all countries collected information on employer-basedpensions (5.1A). Pensions paid from abroad (5.1B) are also collected by mostcountries (19 out of 25).
Of the government social security benefits, 15 or more countries collectedinformation on retirement and survivors benefits (5.2A), on disability or disablementinsurance (5.2B), on unemployment benefits (5.2C), on workers’ compensation foron-the-job injuries (5.2D), and on veterans’ benefits (5.2F).
Determining the full coverage of data collection on government social assistanceprograms is more difficult as some programs listed may not be offered in all countries,and the questionnaire has not yet been fully completed for Latin American countriesin particular in this regard. By counting the failure to offer a program as collection(amount zero), note that information on universal family and child benefits (5.3A)is collected by 17 of the 25 countries surveyed, 13 collect data on maternity benefits(5.3B), 14 collect data on government scholarships and educational assistance (5.3C)and 17 on reductions in interest on student loans (5.3D). Means-tested benefits,including tax credits were collected by a reasonable number of countries (or theydid not exist); all 10 components were collected by nine or more countries and allbut one were collected by 11 or more countries.
Three private transfers are broadly collected - alimony received (5.5A) by 21countries, and child support received (5.5B) and regular cash gifts (5.5C) by 19 and20 of the 25 respectively.
4.2.3.6 Deductions of current transfers paid
Chapter 2 set out the importance of deducting transfers paid in a manner symmetricalto the inclusion of transfers received. However, only six were collected (or imputed)by ten or more countries - employee contributions to government-mandated insurancepremiums (7.2B and 7.2C), income and property (real estate) taxes (7.3A, 7.4), andalimony and child support paid (7.5A, 7.5B). Between one-quarter and one-half thecountries collected a number of other deductions. (Compulsory fees and fines issubdivided into those for hunting, shooting, and fishing (7.3B) and those for other

Chapter 4: From Concepts to Practice
50 The Canberra Group
purposes (11.6A), because of SNA conventions - the former are considered taxesand the latter are considered expenditures; data collection is not complete for theseparate components.)
4.2.3.7 Social transfers in kind
If adjusted disposable income is to be calculated, data on the value of social transfersin kind are required. Data availability is relatively sparse in this area. Informationon rental allowances and food subsidies/vouchers is available for 15 and 14 countriesrespectively out of 25. However, most striking was that only one country (Australia)collects information on public education (9.1) programs, and only three – Australia,Germany, and the United States – collect information on government-subsidisedhealth care services (9.2).
4.2.3.8 Other items
The survey collected information on a range of items which for some purposes mightbe added to or deducted from disposable income, though they are not included inthe definition set out in Chapter 2. One-time gifts received (12.1C) were collectedby 17 countries. In-kind inter-household transfers (12.1A) are collected by only sixcountries – Argentina, China, Gambia, Malaysia, Mexico, and Switzerland.
4.2.4 ConclusionsIt is clear from this metasurvey that the majority of countries are some way frombeing able to construct the ideal measure of household income developed inChapter 2. The income elements collected in most (around 75 per cent) countriesare:
• Cash wages and salaries
• Bonuses
• Profit/loss from self-employment (unincorporated enterprise)
• Rental income
• Interest and dividends received
• Employer based private pensions (including foreign pensions)
• Government social insurance (ie social security) benefits
• Government social assistance benefits
• Regular inter-household cash transfers
• Other regular payments from outside the household
Perhaps one of the most surprising omissions from this list is income tax andemployees’ social insurance contributions. However, even if data are not collectedor imputed by the data originator, it should be possible to impute these items with areasonable degree of accuracy if total income is relatively complete.
It is clear that any income definition which includes imputed income of anykind will be extremely difficult to produce on a consistent basis across countriesgiven the state of data availability on these elements.

Expert Group on Household Income Statistics
The Canberra Group 51
4.3 Assessing the Validity of Income DistributionResults
4.3.1 IntroductionPrevious chapters have identified a guiding principle that income distribution statisticsshould give a true and fair picture of the distribution of income. For the incomecomponents identified in the previous section as being relatively rarely collected,this may be because it is supposed - or has been established - that data could onlybe collected of an accuracy which would prejudice the provision of such a true andfair picture. The corollary of this is that the mere availability of data on an incomecomponent does not necessarily improve the accuracy of the resulting incomedistribution statistics. This section discusses the obstacles to providing a true andfair picture.
Income distribution statistics have 3 main components:• data on incomes, usually at household level;
• ‘equivalence scales’ that adjust for different types of household needing differentlevels of income to achieve a given standard of living;
• price indices.
Income data in this context commonly refers to household ‘disposable income’i.e. total income net of deductions such as direct taxes - though as the previous sectionhas established, the term ‘disposable income’ is likely to refer to an income definitionwhich differs at a detailed level from country to country. For example, in somecontexts disposable, cash and near-cash, income is enhanced by adding income-in-kind which accrues, or is considered by analysts to accrue, to households.Occasionally, if the focus of interest is on the impact of taxes and transfers, theconcept of adjusted disposable income may be examined together with disposableincome.
The requirement for adjustments to the raw income data by the use ofequivalence scales and price indices has already been discussed in Chapter 3.
Sections 3.2 to 3.4 discuss each of these sources of error or uncertainty in turn.The discussion focuses mainly on income distribution statistics related to distributionsof disposable, cash and near-cash, income, but also considers broader concepts ofincome. Examples are drawn from Robustness Assessment Reports (RARs), aCanberra Group initiative in which national statistical institutes and other bodies havesought to assess the impact which deficiencies in income data may have on incomedistribution results. RARs have been produced for about 15 countries in Europe, 5in Latin America and for Australia, Canada and USA. The study was therefore rathersmaller in coverage than that on data availability reported on in Section 4.2. Animportant aim of RARs is that they report not just on data imperfections, but alsoon the practical implications of these for income distribution results.
4.3.2 Imperfections and ambiguities in income dataIncome distribution statistics may fail to give valid answers to the questions notedin section 2, due to a number of possible imperfections in the raw income data fromwhich they have been constructed:
• incomplete coverage of the population;

Chapter 4: From Concepts to Practice
52 The Canberra Group
• some groups being over-represented in the income dataset, others under-represented;
• inaccurate income data on those who are represented in the dataset;
• other imperfections in income data as a guide to living standards, including amismatch between the concept of income captured in the income data and theconcept needed to provide valid answers to the questions of interest.
4.3.2.1 Incomplete coverage of the population
Income distribution statistics require income data from a representative sample ofthe population. In many countries, this is obtained from survey interviews. Suchsurveys often are restricted to people living in private households; people living in‘institutional’ accommodation are therefore excluded. Institutional accommodationmay include, for example, barracks for armed forces, hostels for students or nursesor migrant workers, jails, hospitals and care/nursing homes for frail elderly or disabledpeople.
4.3.2.2 Other groups who may be excluded from surveys are:
residents of remote areas, or in some countries all those outside major conurbations;people who are not citizens, including illegal immigrants; or people in largehouseholds. Such exclusions are less common. But they may be important wherethey occur, given the likelihood of some correlation between incomes and thecharacteristic which leads to their exclusion.
Assessment of the robustness of income distribution statistics requires:• identification and quantification of excluded groups; and, unless these are a very
small proportion of the total population,
• estimates of the incomes and living standards of the excluded groups; and
• an assessment of the implications for particular results.
The first of these is best carried out by those who commission or produce theincome micro-dataset. They have the best knowledge of the sampling frame and itsshortcomings and are therefore best placed to make estimates of the impact of thoseshortcomings, drawing on all relevant sources of information on the size and othercharacteristics of excluded groups.
The second is likely to be difficult: income data may not be available, from anysource, for people living in institutions. If they are available, they may be difficultto interpret, because accommodation, heating, food and other consumption items maybe provided or paid for by the institution. Nevertheless, the primary producers ofincome distribution statistics from the dataset should attempt to assess whether thegroups are distributed widely across the income distribution or are thought to bemore concentrated in a particular income range.
The third component of the assessment needs to be done separately for eachincome distribution report, drawing on the first two components. Some exclusionsmay be unimportant for answering some questions, e.g. the overall shape of theincome distribution, but important for some other analyses. For example, theexclusion of people in jail may not have a large impact on estimates of the Ginicoefficient in the USA. But for studies focussing on young people, and estimates ofthe proportion of people not in employment, the same exclusion may be important.
Groups at greatest risk of social exclusion may be least likely to be captured inincome distribution statistics. Social exclusion is a major focus of interest, in some

Expert Group on Household Income Statistics
The Canberra Group 53
countries, for social policy analysts who use income distribution statistics. So carefulevaluation is needed of whether exclusions from the database will bias results.
Evidence from the RARs indicates that incomplete population coverage isgenerally not a threat to providing an accurate picture of the broad distribution ofincome.
4.3.2.3 Representativeness of sample
Where income microdata come from a sample survey, rather than from administrative(e.g. tax register) data, there is usually a significant problem of non-response. Theproportion, of those selected for interview, who fail to respond can vary from about10 per cent to over 50 per cent. There is clearly the possibility of income distributionstatistics being distorted by differences between the incomes of respondents and non-respondents.
Assessment of the robustness of income distribution statistics requires:• an assessment of the nature and size of response biases;
• an assessment of the implications for particular results.
The first of these is best done by those who produce the income micro-dataset,together with the primary producers of income distribution statistics from the dataset.This is often a difficult task. Various techniques can be employed. A non-responsemodule, with 3 or 4 questions, may elicit some useful information from householdswho refuse a full interview. The geographical location of non-respondents is knownto the survey organisation; it may be possible to match this with government orcommercial databases on the prosperity of residents of particular streets or blocks,to estimate non-response biases. Comparisons with tax or benefit data, or otheradministrative data counts, or censuses, may indicate whether groups with atypicallyhigh or atypically low incomes are under- or over-represented.
The RARs indicate that for a number of countries, response rates are thoughtto be lower at the top and bottom of the income distribution. Inequality may thus beunderestimated.
4.3.2.4 Inaccurate income data on those who are representedin the dataset
Inaccurate data for those who respond to surveys can result from:• questions which fail to capture some income components;
• inaccurate responses to questions;
• inaccurate editing of data or transformation from one format to another;
• deliberate replacement of some data by other data, to preserve confidentiality orfor other reasons.
The organisation that produces the income micro-dataset should report on editingrules that deliberately alter a household’s recorded total and/or disposable income.It should also report on the extent of imputation of individual income components,so that dataset users can judge the potential size of imputation errors. Imputationregimes which are not consistently biased may nevertheless have an impact on resultsat the extremes of the income distribution. For example, the imputation regime for acomponent which is deducted to produce ‘disposable income’ may not adequatelyreproduce the true relationship between total income and the component in question.

Chapter 4: From Concepts to Practice
54 The Canberra Group
The status of tax data should be reported: whether they have been imputed ortaken from reported data. Comparisons between countries may be affected by differentpractices, with some countries having most confidence in total income data andimputing taxes according to the tax regime for the year in question, even if the taxeswill be paid after the end of the year; while other countries may rely on reported taxpayments. Other things being equal, the dispersion of disposable income is likely toappear higher in the latter case since, particularly for the self-employed, tax paymentsin one year may relate to taxable income in an earlier year.
Some of the procedures which help with assessing response biases may alsohelp with identifying inaccurate responses. For example, it may be possible tocompare the numbers reporting high earnings in the survey with results from taxrecords; and to use those records to assess the accuracy of the reported investmentincome of those with high earnings.
Comparisons of grossed up microdata with national accounts aggregates canprovide an indication of the accuracy of income micro-data. These need to allow fordifferences in coverage, definitions and time periods. And national accounts datahave their own shortcomings: Appendix 5 discusses the quality of the three NationalAccounts estimates of GDP – output, income and expenditure – and implicationsfor the robustness of national accounts estimates in the present context.
Evidence from the RARs indicates that in many of the participating countries,microdata on incomes appear to capture too little property/investment income andthat this may lead to underestimation of inequality. For example, Canada noted that“investment income is subject to non-response bias. Recipients of large amounts ofinvestment income, representing a substantial proportion of the total for investmentincome, tend to be a small group of individuals concentrated in the upper end of thedistribution. Not only is their representation in the distribution underestimated dueto under-representation in the sample, there is the possibility that they may tend tobe more likely not to respond when sampled for the survey. For middle and lowerincome individuals, there is a likelihood that small amounts of investment income(eg. Small amounts of interest from bank accounts) go unreported.”
Income data for the self-employed are also generally regarded as unreliable asa guide to living standards, so statements about poverty among the workingpopulation need to be tested for sensitivity to inclusion of the self-employed. TheUK noted that recorded income of the self-employed appeared to be a very poorguide to the level of consumption they could sustain: median expenditure by incomequantile varied little between the bottom and middle of the distribution, andexpenditure variation between the middle and top of the income distribution wasless than for other groups. This resulted in distortions to the income of the bottom10 per cent (decile) of the distribution after deduction of housing costs, and in theincome share of the bottom quintile and the representation of non-pensioner couplesin that group
The RARs also indicate that results for students, and hence for young adults asa whole, are vulnerable to incomplete population coverage and/or incomplete data.This may have a considerable impact on total low-income counts, where studentslive independently or are treated as a separate household when living with theirparents. If transfers from parents and study loans are not included in student incomes,as Netherlands reported, then the measure of income will not reflect their potentialconsumption.

Expert Group on Household Income Statistics
The Canberra Group 55
4.3.2.5 Other imperfections in income data
Income data may be strictly ‘accurate’, in the sense that they yield correct numbersfor the concepts employed in the dataset, and yet fail to give a true and fair pictureof how rich or poor some groups are, in the sense of the level of economic well-being that they can enjoy. There are several reasons why this can occur.
First, some groups may depend disproportionately on means of support notcaptured by a particular income definition. Students may depend on irregular lump-sum contributions from their parents – difficult to capture in a survey even if thesurvey attempts to include them. Welfare recipients (in the American sense) mayreceive significant assistance via food stamps and receipts of such support may nothave been recorded. In some countries subsidised housing may be an important sourceof support for some groups.
The treatment of items deducted to arrive at disposable income may give amisleading picture in some instances. Failure to deduct travel-to-work expenses mayoverstate the achievable living standards of working people relative to their non-working counterparts. A similar issue arises with childcare costs. As discussed inChapter 2, it is often difficult to distinguish ‘essential’ expenses of working frominessential expenses which are close to mainstream consumption and should not bededucted. Therefore there is no single treatment of such expenses which will givevalid comparisons between all households.
For some groups, patterns of debt and debt repayment may alter the short-termcost of living and therefore the standard of living that can be supported with a givencash income. For example, people who have recently returned to employment maybe required to pay off debts which creditors had previously allowed to continue, sothe gains in terms of economic well-being from returning to work may be overstatedif debt repayment is not taken into account.
Evidence from the RARs confirms the sensitivity of results to choice of incomedefinition. US Census Bureau reports in recent years have shown how:
• median and mean income
• income quintiles; and, for some results, quintile group income shares
• distributions of households by dollar income bands
• the Gini coefficient
vary as the income definition is varied in its inclusion or exclusion of capitalgains, government transfers, health insurance supplements to wage or salary income,social security payroll taxes, income taxes, medicare, medicaid, imputed rent (returnto equity) for homeowners and other items.
The choice of other parameters of the income distribution statistics such asaccounting period or statistical unit may also prove inappropriate for some groups.For example, the choice of an annual reporting period may not fit the circumstancesof some self-employed people who may, as their normal practice, draw down oncapital in some periods and build it up in others.
For households consisting of several unrelated people, eg students or youngsingle adults, the assumption that all household members share a common standardof living may be false. So the dispersion of living standards may be underestimated.Conversely, when young people living with their parents are treated as a separateunit, then – if they are students or unemployed – their living standards are likely to

Chapter 4: From Concepts to Practice
56 The Canberra Group
be underestimated; and the country’s overall distribution of income among personsmay be overestimated.
For all of these obstacles to valid income distribution results, producers of resultsshould examine and report on the extent to which they may jeopardise the validityof the findings reported. Evidence from several countries (France, New Zealand, UK)indicates that, at the very bottom of the reported income distribution, householdexpenditure is typically not lower than for all other households. Particular care shouldtherefore be taken, before those at the very bottom of the income distribution aredescribed as the poorest or materially worst off members of society.
Some particular issues arise in relation to time series results. If there are changesin the way in which some goods or services are funded – e.g. a change fromgovernment’s providing in-kind benefits to providing cash benefits – then a consistentcash income definition may give a misleading impression of how particular groupshave fared over time. Where it is not possible to adjust the data to yield a trulyconsistent comparison over time, the implications for bias in results should beassessed and reported. Chapter 5 explores these issues in more detail.
As discussed in Chapter 2, in all countries some personal services are providedby the state, most frequently in the area of health and education. The extent of thisprovision varies across country and over time. The concept of adjusted disposableincome was introduced which includes estimates for these services but there areconsiderable conceptual and practical difficulties in finding a sound basis for theirvaluation. (It was noted in Section 2 above that only one country collects data onboth public education and government-subsidised health services.) Where adjustmentscannot be made, or where their validity is imperfect or uncertain, the implicationsfor the robustness of reported results should be explained. Where income distributionresults do not encompass consumption or enjoyment of goods and services financedfrom sources other than the household’s income, this limitation should be made clear,if there is thought to be any risk that the audience for a particular report will assumethat the results reported relate to a broader concept.
4.3.3 Results sensitive to equivalence scalesEquivalence scales are designed to adjust incomes to account for differences inhousehold size and composition. The rationale for their use is set out in Chapter 3.This pointed out that there is no demonstrably correct set of scale values, even for asingle country at a particular time. Thus application of a particular equivalence scaleprovides another source of possible error in income distribution statistics.
There are several techniques which have been used to estimate scales (Buhmannet al, 1988; Whiteford, 1985). However, one cannot observe directly whether twodifferent households have the same standard of living, and this prevents any of theavailable techniques yielding demonstrably robust results. The evidence may besufficient to rule out some sets of scale values as implausible. But in the eyes ofmost informed observers, there remains a wide range of values which cannot beregarded as beyond the bounds of plausibility. Income distribution statistics thereforeneed to be tested for robustness to the choice of equivalence scales (ES for short).Results should be tested against four or more sets of ES, not just two sets of extremevalues.
Expert Group on Household Income Statistics
The Canberra Group 57
Producers of income distribution statistics should take particular care in reportingresults for:
• groups where there are strong reasons to expect atypical costs of attaining a givenliving standard, e.g. people with disabilities that require extra householdexpenditure; this will depend in part on whether there is free in-kind assistancewith e.g. transport or personal care;
• single-person households and large households; as these are furthest from the‘average’ household size, they are more likely to be sensitive to the degree ofeconomies of scale embodied in the choice of ES.
Experience suggests that results for changes over time (e.g. over a 10 year period)are not very sensitive to the choice of ES. However, some point-in-time results canbe very sensitive. One study for the UK found that the percentage of single pensionersestimated to be below half average income in 1979 varied between about 5 per centand 50 per cent, when ES were varied within a plausible range.
ES are generally assumed to be invariant with income – i.e. the relative needsof different household types are assumed to be the same for those on low incomesas for those on high incomes. This is not necessarily correct. But a more sophisticatedassumption would be more difficult to implement. The simple approach appearsreasonable as long as results are tested against a wide range of ES.
Sensitivity to choice of ES needs to be considered afresh for each set of incomedistribution results. Reports should identify those results that are very sensitive tothe choice of ES.
4.3.4 Price indicesAs discussed in Chapter 3, it may be appropriate to adjust income data by relevantprice indices if comparisons are to be made between different time periods, differentgeographic areas or different groups within a population. The validity of incomedistribution results may therefore be undermined by:
• an inappropriate price index;
• an inaccurate price index; or
• no suitable index being available.
As noted in Chapter 3, a price index needs to be matched to the income conceptbeing reported. If a perfect match between the components of the price index andthe income definition is not possible, then producers of statistics should examinewhether the mismatch may introduce significant bias into results.
The appropriate price index may nevertheless be inaccurate. This could arisefrom miscalculation of ‘true’ price indices e.g. the well-rehearsed debate about theextent to which the Consumer Price Index underestimates the effect of productimprovements and thereby overestimates inflation. It could, alternatively, arise fromthe price index being calculated from an unrepresentative ‘basket’ of commodities,if the expenditure patterns reflected in the basket’s weights are not those of thepopulation whose income is being reported. An assessment of this can best be madeby those who produce whatever price index is used in adjusting income distributionresults.
Another possibility is that price changes vary across the income distribution butthat indices are not available for different population groups. It may be that the bestone can do is to identify and record results where the use of a single price index or

Chapter 4: From Concepts to Practice
58 The Canberra Group
none at all may give a misleading impression. Again, this can best be consideredand reported by the primary producers of income distribution statistics.
For comparisons which seek to compare numbers, in different countries - ordifferent geographic areas more generally - below/above given absolute levels ofincome, some version of purchasing power parities (PPPs) may be employed. Theseare subject to the same difficulties as price indices - ie they may be ill-matched tothe income definition being used or they may have been miscalculated. Again theextent of the bias introduced should be considered and reported by the producers ofincome distribution statistics.
Summarising, we may say that in comparing income distributions over time oracross countries or between different population groups, in principle account shouldbe taken of differences in the purchasing power of income. A CPI is a reasonablemeans of making comparisons over time, and PPPs across countries; but each ofthese types of index is subject to conceptual assumptions which will never be exactlyvalid.
4.4 Options for choice of a practical definition
4.4.1 Producing comparable estimatesMany of the questions which income distribution statistics are called upon toilluminate are comparative in nature – comparing one group with another andcomparing the situation at one time period with that at another. From sections 4.2and 4.3 we can conclude that a – perhaps the – major issue in making comparisons,whether spatial or temporal, between one income distribution and another is thecomparability of the income definition used and of the data from which the statisticshave been derived. Data availability differs from country to country, and may indeedoften differ for the same country over time as survey questionnaires are altered eitherto increase the range of income components collected or cut back to encourageincreased response rates. Quality of data may also differ, in respect of populationcoverage and non-response bias for example, and once again differences may occurnot just between countries but over time as well. Even estimates that appear on thesurface to use the same definitions and to be of the same quality can very soon beshown to be divergent once the ‘fine print’ is examined. There are thereforeformidable obstacles to producing estimates which truly compare apples with applesrather present a series of ‘fruit salads’.
Given this situation, it is of paramount importance that when producers ofincome distribution present their results, they should be accompanied by the mostcomprehensive documentation possible so that users can judge the relative qualityof the datasets and derived estimates being compared. Chapter 8 is devoted todiscussion of the issue of documentation – ie the provision of metadata.
In this section, the options for choice of a practical definition are discussed inthe context of making cross-country comparisons. Indeed the main aim of theCanberra Group’s work has been to develop guidelines which will result in greatercomparability of data internationally, though of course it is to be hoped that theywill also assist countries in making choices for national purposes. There are particularissues connected with cross-time and cross-country comparisons which are exploredin Chapter 5.
Expert Group on Household Income Statistics
The Canberra Group 59
4.4.2 Experiences from the Luxembourg Income Study (LIS)The current ‘state-of-the-art’ in making cross-country comparisons of incomedistribution statistics is well illustrated by reference to the experience of theLuxembourg Income Study (LIS). Founded in 1983, LIS is committed to the opensharing of harmonised household income survey microdata at zero user cost whilestill preserving the confidentiality and privacy of survey respondents. Insummer 2000, the LIS project contained more than 100 datasets, covering 28 nationsover the 1970-1997 period, including the transition economies of Central and EasternEurope, and was about to extend to the rapidly growing countries of the Pacific Rim.
Analyses of income distribution using the LIS datasets (for example, Atkinson,Rainwater and Smeeding 1995 – herafter referred to as ARS) have a valuable roleto play in moving towards to improved income distribution estimates, in that theyexpose areas where comparability is lacking, particularly when this is not obviousfrom published summary statistics.
The LIS modus operandi is to obtain existing national household income surveydata and to do the best it can to harmonise and make these data comparable. Dataharmonisation improves comparability and therefore, the ratio of signal (true values)to noise (statistical or other differences) in datasets. With LIS, and with any otherset of household income data, measure, choices must be made when creating incomedistribution statistics. The consistency of these choices will be absolutely essentialto producing comparable outcomes across countries. We have already seen that thesechoices include:
• Income measure chosen and constraints imposed by data creator (e.g., top, bottomcodes; imputations, etc.). Comparability may be affected by imputations, simulations(e.g., for income tax paid if total income only is collected ), or other statisticaltechniques used to derive the selected income concept from survey income reported(section 3 above).
• Unit of account: household or other income sharing unit (Chapter 3).• Unit of observation (or weighting of observations): person weights (counting each
person’s income as one observation) or household (other unit) weights (countingeach unit as one observation). Most analysts choose the person weight, but not all,e.g., U.S. Bureau of the Census (1998) (Chapter 3).
• Time period: annual income (though this may need to be constructed in the caseof some nations, e.g., from panel datasets or from surveys covering less than amonth) (Chapter 3)
• Measure of inequality: alternative summary measures, presentation techniques, etc.(Chapter 7).
• Equivalence scale issue: adjustment for differences in household size and all theissues therein addressed are important (Chapter 3).
• Population coverage: most household surveys on which inequality estimates includethe civilian non-institutionalised population. However, other groups such as themilitary, homeless, those living in foster homes, and particularly legal (and illegal)immigrants (foreign-born) may or may not be included, according to the samplingframe (household address list or national register) and national practices (section 4.3above)
Cross-national comparisons of inequality and income distribution can thus varyenormously according to the definitions and choices made by the data analyst andthe data collector. All of the above elements are open to choices made by data analystsand should be subject to sensitivity tests.

Chapter 4: From Concepts to Practice
60 The Canberra Group
A cross-country, cross-time dataset such as LIS faces the additional problemthat income aggregates may be missing for a country or time period because one ormore components are not measured completely. Best practice differentiates “true”zero incomes (or negative incomes) from missing incomes which are coded or treatedas zeros. A choice must be made to include or exclude incomplete reporters. Counting“zero” incomes is not the same as omitting these cases altogether.
LIS aims to continue to update the technical and institutional documentationavailable so that survey quality can be ascertained and so that the numerical valueswhich LIS contains can be put into a social, legal, and political context. Comparisonsof the income micro-data with corresponding macro aggregates are included as partof the technical documentation whenever possible.
4.4.3 A practical definition of income for internationalcomparisons
Given the long experience of LIS in trying to construct internationally comparabledefinitions of income which can be implemented in practice, it was logical to drawon this in the Canberra Group’s work. The recommended practical measure of incomefor making international comparisons is set out in Table 4.1, using the classificationof income components adopted in Chapter 2 and Appendix 1. This is based on themeasure of current income which LIS provides, disposable personal income (DPI).DPI includes only cash and near-cash components, in order to get as close as possibleto an apples-to-apples comparison. The definition in Table 4.1 includes own accountproduction as well because of its importance to developing countries in particular.In all other respects the definitions are the same.
WE RECOMMEND THAT TABLE 4.1 BE ADOPTEDAS THE INCOME DEFINITION TO BE USED FORINTERNATIONAL COMPARISONS OF INCOME
DISTRIBUTION
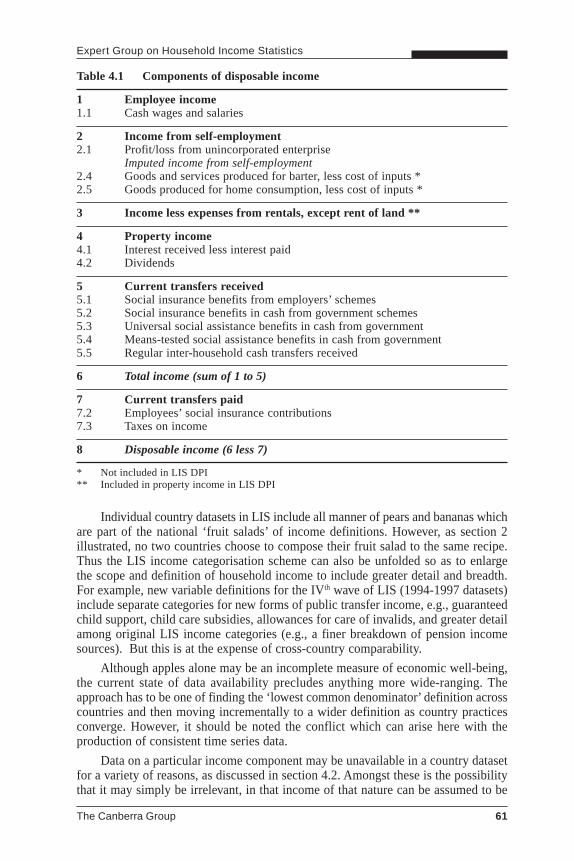
Expert Group on Household Income Statistics
The Canberra Group 61
Table 4.1 Components of disposable income
1 Employee income1.1 Cash wages and salaries
2 Income from self-employment2.1 Profit/loss from unincorporated enterprise
Imputed income from self-employment2.4 Goods and services produced for barter, less cost of inputs *2.5 Goods produced for home consumption, less cost of inputs *
3 Income less expenses from rentals, except rent of land **
4 Property income4.1 Interest received less interest paid4.2 Dividends
5 Current transfers received5.1 Social insurance benefits from employers’ schemes5.2 Social insurance benefits in cash from government schemes5.3 Universal social assistance benefits in cash from government5.4 Means-tested social assistance benefits in cash from government5.5 Regular inter-household cash transfers received
6 Total income (sum of 1 to 5)
7 Current transfers paid7.2 Employees’ social insurance contributions7.3 Taxes on income
8 Disposable income (6 less 7)
* Not included in LIS DPI** Included in property income in LIS DPI
Individual country datasets in LIS include all manner of pears and bananas whichare part of the national ‘fruit salads’ of income definitions. However, as section 2illustrated, no two countries choose to compose their fruit salad to the same recipe.Thus the LIS income categorisation scheme can also be unfolded so as to enlargethe scope and definition of household income to include greater detail and breadth.For example, new variable definitions for the IVth wave of LIS (1994-1997 datasets)include separate categories for new forms of public transfer income, e.g., guaranteedchild support, child care subsidies, allowances for care of invalids, and greater detailamong original LIS income categories (e.g., a finer breakdown of pension incomesources). But this is at the expense of cross-country comparability.
Although apples alone may be an incomplete measure of economic well-being,the current state of data availability precludes anything more wide-ranging. Theapproach has to be one of finding the ‘lowest common denominator’ definition acrosscountries and then moving incrementally to a wider definition as country practicesconverge. However, it should be noted the conflict which can arise here with theproduction of consistent time series data.
Data on a particular income component may be unavailable in a country datasetfor a variety of reasons, as discussed in section 4.2. Amongst these is the possibilitythat it may simply be irrelevant, in that income of that nature can be assumed to be

Chapter 4: From Concepts to Practice
62 The Canberra Group
nil or neglible. To the extent that this is so, the absence of item from country A’sdataset may not in fact affect the quality of the comparison with country B wherethe item is included.
Since the publication of the ARS volume, numerous national and internationalstudies have begun to use the “LIS-DPI” definition. For instance, OECD has produceda series of studies on income and poverty which were compiled by national statisticaloffices based on the ARS disposable income definition using the definitions discussedbelow (eg OECD, 2000). Similarly, the InterAmerican Development Bank (IDB) hasbegun to harmonise Latin American datasets based on the LIS model (e.g., Szekelyand Hilgert 1999), but with considerable attention to production of goods for homeconsumption.
The main differences between disposable income set out in Table 4.1 comparedwith the measure of disposable income set out in Chapter 2 and Appendix 1 are:
Elements of total income
• Goods and services provided to an employee as part of the employment package(‘fringe benefits’)
• Imputed income from owner occupied dwellings (imputed rent)
Deductions from income
• Regular cash inter-household transfers paid
In addition, construction of total income would require data on employers’ socialinsurance contributions and adjusted disposable income would require data on socialtransfers in kind. Extension of the definition set out in Table 4.1 to cover any ofthese elements would be a step towards a more complete definition of income.
At the same time, sight should not be lost of the need to improve the quality ofexisting data used to make comparisons, for example, property income.
4.4.4 Towards a more complete income definitionThe Canberra Group identified four areas as the most fruitful to pursue in view ofwhat is achievable in practice as well as what is likely to contribute most to producinga fairer and more accurate picture of income distribution. These are:
(a) Better estimates of property income, self-employment income and own accountproduction
(b) Imputed rent for owner occupied housing,
(a) Social transfers in kind (STIK) or non-cash government benefits,
(b) Capital gains
Each is discussed in turn below. Note that these issues are also at the forefrontof others’ discussions of more complete and more comparable income distributions,for example Eurostat (Eurostat 1998, 2000a).
4.4.4.1 Property Income, Self-Employment Income and Own AccountProduction
Although all three of these items are included in Table 4.1, they are areas whereimprovement of the quality of existing data could make a substantial contribution toimproving completeness. Household surveys are notoriously bad at measuring incomefrom capital and self-employment income, as section 4.3 noted. The quality of

Expert Group on Household Income Statistics
The Canberra Group 63
property income reporting is poor because of inaccurate recall, infrequent receipt,absence of the rich in the achieved sample, or any combination of these reasons.Some improvements may be effected by use of secondary data sources as a basisfor imputation or simulation, though these bring their own errors and are no realsubstitute for fully articulated survey data, difficult as these are to collect.
The value of goods produced for home consumption, or the value of own accountproduction, is of great importance to the economies of developing countries andthough it is much less so in developed countries to exclude it is to decrease theinternational comparability of income statistics. The difficulties encountered inproducing good estimates of own account production are discussed in section 9.2.3.
4.4.4.2 Net Imputed Rent for Owner-Occupied Dwellings.
The issue of imputed rent is one of great importance to income distribution studies.First, imputed rent is very important in many nations. For instance, in Spain,86 per cent of households are homeowners (Eurostat 2000), while in other richernorthern European nations (e.g., Germany) the fraction of homeowners is muchsmaller, around 50 per cent (Smeeding et al. 1993). Second, home ownership (andowner occupation) confers an annual flow of consumption services which may offsetother costs. Third, rental housing is often subsidised as well. If renters pay belowmarket rents, with market rents made up by governments, there is an implicit rentalsubsidy in non-owned units as well. All three forms of imputed rent may be importantin nations where “public ownership” of housing is widespread.
The main problem is the accurate measurement of imputed rent. In theory,imputed rent is the difference between the cost of renting one’s living arrangements(in a competitive market) minus the cost actually incurred in owning the home (orrenting it at a below market price). Thus one needs estimates of the gross rental valueof the unit, minus owner’s costs such as taxes, depreciation, repair and upkeep, interestcharges, property taxes, and other shelter costs. Proper estimation of imputed renttherefore requires a great deal of additional information about the unit itself (quality,size, location, unit features such as bathrooms, space, etc., are all required) if weare to estimate market rent. Further, the owner’s actual costs (taxes, upkeep, utilitycharges, etc.) must also be assessed since true imputed rent is the difference betweenthese two items. (See also Eurostat 1998 and 2000a on their approach to this issue.)
Net imputed return on the equity in one’s own home could also be estimated asthe annual benefit from converting one’s net home equity into an annuity. If includedin income, one must be careful that it is measured in a way that leads to greaterinternational standardisation instead of nation-specific measures of its value. Onesuggestion is to use a low government interest rate multiplied by the net value ofhome equity (Smeeding et al, 1993). Yet one must still be wary of unreasonably highland values in certain large cities (eg Tokyo, Hong Kong, New York) that would distortthe valuation of housing services for residents there. This method, while producing“comparable” estimates may yield unreasonably high estimates of imputed rent. Forinstance, low income elderly homeowners in the United States who own their homesoutright (no mortgage) still spend 30 to 40 per cent of their incomes on shelter costsdue to property taxes, repairs, utilities, upkeep, etc. (Johnson and Smeeding, 2000).Thus the more complicated method of estimating market rental value net of costsmight be required if the easier but “comparable” method fails to provide accurateestimates (Smeeding, 1982).

Chapter 4: From Concepts to Practice
64 The Canberra Group
Finally, the service-yielding asset can be bought and sold on real estate markets.Hence, the value to the consumer is close to the market value of the service flow,since the owner could presumably sell the housing unit and rent it back from thenew owner were it more profitable to do so. While imputed rent can therefore bevalued to consumers at its market price; this is not always the case with non marketedin-kind benefits such as social transfers in-kind, including publicly-subsidised orpublicly-owned housing which is rented at below-market value.
Estimates of net imputed rent at the macro level are made by most countriesfor their national accounts. Producers of income micro data may therefore wish toinvestigate the methodology and data sources used to make these estimates with aview to drawing on them in producing micro level estimates.
4.4.4.3 Social Transfers In-Kind.
Producing estimates of adjusted disposable income requires the inclusion of the valueof some services provided to households by government, such as health care andeducation, including early schooling (pre-school) when provided as a right ofcitizenship (eg école maternal in France) or when publicly subsidised. Mostgovernments also provide other types of in-kind social security benefits for theircitizens. The most popular are government social and health care services for theelderly, disabled and benefits for public education tied to previous governmentemployment (e.g., educational support for veterans in the United States). Health carebenefits may be in the form of reimbursements.
Many countries also provide in-kind social assistance to their low-incomepopulations. Some may be in near-cash form, such as food (food stamps in the UnitedStates) and cash housing allowances (United Kingdom, Sweden) and these are alreadyincluded Table 4.1. Beyond these near-cash benefits, some other social assistancebenefits in kind are also aimed at the poor. Heating (cooling) subsidies and foodsubsidies are also found in some nations. These also include public housing unitsand related benefits in-kind, such as free health care for the poor where others haveto make some contribution. These benefits also differ from near-cash benefits in thatthey have a value to the recipient that is sometimes very hard to estimate.
The absence of any estimates of STIK in a measure of income used to comparecountries presents difficulties when the provision of such services differs greatlybetween them. In a country where STIK are relatively sparse, a higher income willbe required to support a particular standard of living than in a country where a widerange of benefits are provided, all things being equal. Within country comparisonsare also affected when the benefits from STIK are spread unevenly across the incomedistribution. Thus in principle the development of estimates on a comparable basisshould have high priority if the general accuracy as well as the internationalcomparability of income distribution statistics is to be improved.
However, a serious concern for cross-national comparisons is developing aconsistent set of benefits to include, and then a consistent methodology to value theseprograms for recipients. All health care systems are not alike, nor are all educationsystems. Those who are sick should not be considered as ‘better off’ as a result ofbenefiting from subsidised health programs than those who are not. Furthermore,the quality of programs, particularly education, is likely to vary within countries.Measuring the quality of universal in-kind benefits and then valuing them in moneyterms is quite difficult for estimates required for purely national purposes. To produce

Expert Group on Household Income Statistics
The Canberra Group 65
estimates on a cross-national basis is even more problematic. The conceptual issuesinvolved have been set out in Chapter 2.
One major concern in measuring the value of all in-kind benefits is thatrecipients—particularly low income recipients—may be willing to accept smalleramounts of cash income instead of non-cash benefits. In theory, one could convertthese benefits to cash using their Hicksian cash equivalent value, not their marketvalue or cost to governments (Smeeding 1977). However, estimating this valuecorrectly is problematic because counterfactual behaviour, ie unsubsidisedexpenditure on government-provided goods and services such as basic education orhealth care, is not observed. In many circumstances, legislators have chosen to providedirect assistance for particular needs rather than providing cash that the recipientcould spend how he or she wanted to. Valuation issues arise and are magnified dueto the lower cash incomes of recipients, underlining the fact that the recipient maybe willing to trade the rights to his or her benefits for a lower amount of scarce cashincome than the cost of those benefits. On the other side, the accounting transparencyof national accounts and income distribution statistics warrants valuing in-kindbenefits at their cost to government. (It is of course possible that in some cases marketcosts might exceed government costs for such goods as health insurance due toreduction of sales and marketing costs. Hence, these two concepts may also differsubstantially.)
United Kingdom, Denmark, and Australia all publish annual estimates of theeffects of government benefits and taxes on household incomes, including healthbenefits, education, and housing benefits. In the United Kingdom these benefitsamount to a full one-third of public spending and to a roughly equal amount inAustralia. The effect on inequality of including imputed values for these benefits inincome is very large. In Australia, the ratios of the income share of the top 20 per centto the bottom 20 per cent falls from a range of 5.5 to 5.7 for disposable income to3.0 to 3.5 for disposable income plus in-kind benefits. In the United Kingdom thefinal figure is four to one (Harris, 1999). Hence, these benefits are likely to haveimportant effects on income distribution measures, depending on how they are valued.
In general the studies of Denmark, Australia, and the United Kingdom valuein-kind or social benefits at their cost to the government as did an earlier LIS studyof six nations (Smeeding et al, 1993). All show that, in general, households withchildren (who have a large imputed education benefit) and retired households (whoreceive a high imputed benefit from health-care services due to their lower averagehealth status and greater needs for care) benefit at the expense of younger, singlepersons and childless couple units. Because social benefits such as health care andeducation tend to be of relatively equal value to parties which receive them, andsince their imputed value is a higher fraction of income for low income householdsthese benefits can dramatically reduce income inequality. In particular single parents,larger low income families with children, the disabled, and the low income elderlybenefit the most.
Adding the imputed value of these benefits to the income of low incomehouseholds creates a situation where many units receive more in social transferincome in-kind than in cash income. This creates a dilemma because most suchhouseholds, if given an equivalent cash benefit, might spend it very differently. Thewelfare implications of a $30,000 “total income” household with $15,000 worth ofeducation benefits, $5000 worth of health benefits, and $10,000 in cash income for

Chapter 4: From Concepts to Practice
66 The Canberra Group
a single mother with three children (one of whom is disabled), compared to the samehousehold with a completely flexible $30,000 cash disposable income, forces us toface the question directly.
Over and above the issues laid out above, a series of methodological issues needalso be addressed. If we are to add benefits of in-kind transfers to households, thelarge majority of this work needs to be carried out by imputation to individualhouseholds within an income micro-dataset. Because receipt of benefits by onehousehold or another will change their ranking in the distribution, it is not possibleto rank by cash disposable income (for instance) and then just add in some “averages”for social transfers in kind while maintaining the same household ranking. Eachincome addition or substitution requires another ranking. Smeeding (1977a) estimatesthat failure to re-rank reduced measured inequality by about 25 per cent. That is,the 1972 share of the bottom quintile with all benefits counted in “total” incomeand without re-ranking, produced a share of 8.0 per cent of total income. Re-rankingreduced the share of total income to 6.0 percent. Similarly, the appropriateness ofthe equivalence scale adjustment may have to be re-assessed. The relative needs ofhouseholds with and without children may be very different when education isincluded in income, and the relative needs of different age groups will differ whenhealth care is included.
In the area of housing benefits, the value should be determined using a methodconsistent with the imputed rental value methods described in 4.4.4.2 above. Forinstance, the cost to government of a rent subsidy can be estimated analogously toimputed rent, ie by the difference between the market value of a rental unit and theamount which the tenant actually pays for that unit (Smeeding, 1982). Hence, marketrental values need be assigned to tenants to be used in conjunction with their rentactually paid (often some fraction of income). In the area of elementary and secondaryeducation, one must be careful to include the variance in expenditure per pupil acrossgeographic areas while also including some estimate of the value of school buildings,computers, and other capital inputs.
Finally, in order that the addition of STIK to income results in greatercomparability, researchers have to reach agreement on such methodological andpractical issues after experimentation with different methods. And then all mustimplement whatever guidelines and formulae have been agreed to measure the valueof the in-kind benefits to the recipients.
4.4.4.4 Capital gains
There are two types of receipt which are excluded not only from Table 4.1 but alsofrom the ideal measure of disposable income set out in Chapter 2, but which mayhave a significant impact on economic well-being. These are interest paid onconsumer debt, classified as part of consumption expenditure, and realised holdinggains, classified as a memorandum item.
Because of recent changes in asset ownership and unsecured consumer debt innations such as the United States, both payments and receipts of interest haveincreased in recent years. For many low income households in the United States andin other nations, interest paid on credit card and other consumer debts exceeds theircurrent income from capital giving them negative net receipts of interest (e.g., seeLupton and Stafford 2000).

Expert Group on Household Income Statistics
The Canberra Group 67
One specific source of household economic resource, which is increasinglyimportant in OECD countries, is realised holding, or capital, gains. Selling off assetsthat have risen in value can sometimes enable a household to meet its everyday needsfor food, clothing, shelter, and the like. This is particularly the case among the agedwho may have intentionally built up assets during their working lives in order todraw them down after retirement – in other words they are smoothing their incomesover their lifetimes.
The typical treatment of unrealised capital gains is to ignore them. One couldin principle impute an income stream for those assets that do not pay interest ordividends. Such a general approach may be considered the more theoretically correctas it measures unrealised but available command over resources. But if one is mainlyinterested in whether a household can meet its everyday needs the relevant approachis to count only realised capital gains and losses. While counting realised capitalgains and losses may produce large changes in income that should be prorated overa longer period with appropriate price deflators, it would be useful to both improvereporting on income from capital and to include realised capital gains and losses inour income measures, perhaps via a satellite account. Among the nations involvedin the Canberra Group, Sweden is one of the few which currently counts realisedcapital gains as part of its official income definition. However, it is also importantto note that Sweden derives its estimates of capital gains directly from income taxregisters. If we were to use surveys to ask base price and selling price, the respondentburden, high income under-sampling, and refusal issues would most certainly loomlarge.
One final note of caution is that if capital gains and losses are included in theannual income measure, the pattern of change in income inequality may becomevery uneven and pro-cyclical. The addition of this income item clearly results inmore instability and cyclical sensitivity in the resulting estimates of cross-nationalincome inequality than is found in the line below it (which excludes this incomecomponent).


Chapter 5
ComparingIncome Distributions
Over Time
The Canberra Group 69
5.1 IntroductionIncreasingly economists and social policy analysts are focusing attention on the long-run trends in income distribution. The availability of 20 to 40 years or more ofestimates in many nations are making it possible for analysts to study the determinantsand consequences of long periods of distributional change, for example therelationship between inequality and growth, trends in world income inequality andrelated issues. The future will bring more, not fewer, uses of such data, and policydiscussions of national governments and international bodies may be heavilyinfluenced by such trends and analyses of trends. For this debate to be a well-informed one, high standards must be set for time series data on income distribution.
This chapter discusses the compilation and analysis of time series data on incomedistribution. Conceptually, cross-time comparisons within a country are not reallydifferent from cross-country comparisons at a point in time. The general consistencyrequirements are exactly the same. However, trend data need a separate treatmentfor at least two reasons.
First, cross-time comparisons within a country appear to be based - and veryoften are based - on more consistent definitions and source data than are cross-countrycomparisons, mainly because they tend to come from the same producer. This is the“originator” of the estimate; the party with the broadest knowledge of the data.However, this assumption may be unwarranted if the producer changes definitions,survey practices, or experiences a host of other non-random sampling or non-samplingerrors which change over time. There are, in fact, many cases where published timeseries are not internally consistent. A good general rule is that the longer the timeframe, the more likely are non-random differences to occur. A major task is thereforeto make the producer and the user aware of these problems, and for the producer tobe as consistent as possible, to provide overlapping observations when changes areimplemented, and to provide historical data on changes in time series.
The second reason is that the story gets much more complicated when wecompare trends across countries, because we have to impose - in principle - a double(spatial and temporal) consistency constraint. Double international harmonisationacross nations and over time is the ideal outcome. However, such a project is dauntingat this time. Even when complete harmonisation across nations is a clear objectivefrom the outset, experience has shown how difficult this is to achieve in practice.
Chapter 5: Comparing Income Distributions Over Time
70 The Canberra Group
Longitudinal panel data have a number of advantages over repeated cross-sectional surveys for the study of how particular types of household move withinthe income distribution over time, as set out in Chapter 6. However, they are notalways the best vehicle for time series estimates because samples may be small andattrition bias may affect the results. Moreover, panel data sets are only representativeof the national population beyond the base year if they are cross-sectionally refreshedin each wave of interviewing. That is, due to their basic nature, panels follow a setof persons sampled in a base year, thereby excluding immigrants and emigrantsbeyond that year unless a conscious effort is made to include them.
The Luxembourg Income Study (LIS) has made considerable progress towardspoint-in-time cross-national consistency. However, both LIS harmonisation techniquesand differences in national surveys made available to LIS at different points in timehamper it from achieving double consistency over time. Hence, one must ask froma practical point of view, what can be accomplished with existing national time series.Even when continuous time series are available for different countries, is a fixed-effects correction enough to account for the methodological and/or definitionaldifferences that are found in these time series?
This chapter will be of interest to three groups of statisticians and researchers:• Time series data originators (producers). The national statistics offices (NSOs)
and other survey organisations which collect and process national estimates onincome distribution from primary sources (surveys, administrative records, tax data,and other sources), including the World Bank and other international organisationswhich collect their own survey data.
• Secondary time series data producers. Organisations who use published orcomputed time series data to make large multi-period and multi-nation databasesand who assure some degree of comparability over time (and sometimes acrossnations). Such producers include Tabatabai (1996), Deininger and Squire (1998),WIDER (1999) and others. These data need to be made available to users with acomplete discussion of their strengths and weaknesses.
• Time series data users. Those researchers and policy analysts who use these timeseries and may make sweeping assumptions about comparability over time andacross nations. Here the enormous effort which goes into model specification andeconometric estimation needs to be balanced with equally serious efforts to identifyand make use of the best time series datasets, and to understand the biases inmany existing data series.
The aim of this chapter is to set out guidelines which will result in the provisionof better time series data in the future. Section 5.2 identifies the important sourcesof measurement errors across nations and over time. Sections 5.3 to 5.5 makerecommendations to data producers, to secondary data series producers (those whoprovide an intermediary product which is used by others), and to end users of trenddata respectively.
5.2 Impact of measurement errorThe problem of measurement error is endemic to all income distribution studies,whether they focus on a single country or many countries, and has already beenanalysed in Chapter 4. The question considered in this section is whether the biasintroduced by measurement error is aggravated in inter-temporal studies.Measurement error may be reduced by taking differences across years, and the signal

Expert Group on Household Income Statistics
The Canberra Group 71
to noise ratio may be thereby increased. The distinction between measurement errorthat does and does not affect inter-temporal comparisons is, therefore, not meant tominimise the importance of measurement error but to focus attention on the relevantsource of error.
The key measurement of concern to inter-temporal studies is measurement errorthat differs both across the income distribution and across years. So for example,estimates of differences in inequality between two years may be biased inasmuch asincome underreporting is greater at the bottom than at the top of the distributionand this degree of differential underreporting also differs across years. If thedifferential underreporting does not vary over time, no bias is introduced to timeseries comparisons of relative income distribution measures.
Comparisons of trends between countries will be biased by errors which aretime specific with common effects across countries but differential effects acrossthe distribution, and by those which are time and country specific as well as havingdifferential effects across the distribution. However, measurement error that differsacross time and country but not across the distribution will not affect differences intrends across countries. Again, taking inter-temporal differences reduces the absolutelevel of noise but has an ambiguous effect on the signal-to-noise ratio.
Thus some but not all sources of measurement error affect inter-temporalinequality comparisons, within a country or across countries. The followinggeneralisations emerge:
• Measurement error that is independent of ranking in the distribution affects neitherlevel nor trend in inequality in a single country, nor does it affect cross-nationalcomparisons. For example, if the institutional population omitted from survey datais equally spread across the distribution, their omission will have no effect onmeasured trends in income distribution.
• Measurement error that does not vary between years does not affect inter-temporalcomparisons, but does affect income distribution measures each year. For example,underreporting of property income at the top of the distribution which does notvary over time will produce biased measures each year but comparisons betweenyears will not be biased.
• Cross-national comparisons of trends in income dispersion measures are notaffected by measurement error that is either time invariant, or time varying butcommon across countries.
The difficult issue that is faced by these comparisons is therefore the comparativeerror structure of data within countries, across countries, and over time. If biasesremain constant, errors are liable to be reduced. As Chapter 4 has already stressed,it is vital that both primary and secondary data producers are aware of these errorsand their impact, and make available information about them to the end users of thedata.
5.3 Issues for the data originatorMany NSOs and other public sector organisations have produced time series estimatesof income distribution – or annual estimates from which time series could beconstructed - for national audiences for many years. Although many of these seriesare published and sometimes microdata are also made publicly available, there arecases where the publication is relatively low-key and even where estimates are only

Chapter 5: Comparing Income Distributions Over Time
72 The Canberra Group
available internally in the producing organisation. Wide dissemination of results andassociated documentation is obviously important to inform public debate about issuesof income distribution and economic well-being. It also ensures that they are opento peer group review, and this can be very beneficial in terms of improving estimatesin the future.
However, as with all complex statistical series, care must be taken indisseminating income distribution time series and making information available abouttheir statistical properties. Users should be able to find easily all the metadata theyneed to interpret the statistics correctly. All this is simply good statistical practice,which applies to income distribution statistics as much as any other statistical output.
Chapter 8 sets out general requirements on Robustness Assessment Reports(RAR’s) for the documentation of survey practices, measurement techniques, dataquality (sampling and non-sampling errors, imputations, simulations, etc.), incomemeasures, inequality measures, top- or bottom-coding of data and so on. Productionof RAR’s – and their careful study by users - is the first step toward accurateassessment of data comparability. Trend analyses demand that this documentationbe produced each time a new set of estimates are published.
Data originators have particular responsibilities when they are aware of changeswhich could have substantial effects on the validity of time series comparisons.Survey practices may change (for example, introduction of computer assistedinterviewing); the questionnaire may be expanded to capture a wider set of incomecomponents; or it may be reduced to try to combat falling response rates. Acompletely different survey source may be adopted as the basis for the statistics. Ofcourse many changes of this sort will have the aim of improving the quality of dataproduced, but there will be the unwelcome side-effect of reducing inter-temporalcomparability. In such cases, it is the data originator’s responsibility to draw attentionto the developments, to make estimates of their impact, and if at all possible to makeavailable an overlapping series so that long-running time series are not broken.
5.4 Issues for secondary dataset producersThe first problem for the producer of a “secondary” dataset - a collection of summarymeasures of income distribution drawn from a number of heterogeneous sources - isto set internal standards for accepting or rejecting estimates. Selection criteria mustbe based on consistency of definition and quality, and the temptation must be resistedto include estimates just because they will extend the range of countries or yearscovered. For instance, Deininger and Squire (1996) chose the statistics to be includedin their dataset by requiring that they be from national household surveys forexpenditure or for income, that they be representative of the national population,and that all sources of income or expenditure be accounted for, including goodsproduced for own consumption. As with primary data producers, the main duty of aresearcher or organisation assembling a secondary dataset is to document the originand characteristics of all estimates included, according to their selection criteria andthe information made available by the primary data producer.
The role of secondary datasets is to make accessible and enlarge the range of“ready made” income distribution statistics. This process can take several forms, andit may be helpful to bear in mind the different origin of the “ready made” incomedistribution statistics contained in secondary sources:

Expert Group on Household Income Statistics
The Canberra Group 73
• calculated from individual national micro datasets, where there may be differencesbetween “original” and “public use” datasets;
• calculated from collections of harmonised micro datasets such as LIS; as againthese may differ from those available in the original source;
• calculated from tabulations published by (or supplied by) national sources; hereit should be noted that national sources may give differing degrees of detail (egthe data published in Statistical Yearbooks may have fewer ranges than in aspecialised publication on income distribution), and that the published sourcesmay be revised or published in alternative forms (eg based on different definitions);
• calculated from tabulations in another secondary dataset;
• summary statistics published by (or supplied by) national sources;
• summary statistics obtained directly from another secondary dataset producer orthe publication of another analyst.
In all cases, the calculations involve decisions about how to treat the ‘raw’ dataavailable. There is for example the application of procedures of top-coding. Thismay happen in the course of the collection of the data, or as a decision of theresearcher to reduce the noise that is typically concentrated in the tails of thedistribution. Changes in these procedures may significantly affect the comparabilityof results. At the bottom of the distribution, there is the issue how to treat zero ornegative incomes. These may be bottom-coded, be set to zero or a small positivenumber, or may be omitted. All of this needs to be documented.
A second example is the procedure for estimating quantile shares and inequalityindices when the original data are only available in grouped form from primarysources, or are available only in grouped form to researchers. For example, if thedisposable income of each household within a microdataset is not available to thesecondary data producer, but only, say, median income for each decile group, anyattempt to fit a Lorenz curve (see Chapter 7 for definition) will be subject to errorand the result is bound to differ from what would have been obtained had the fulldataset been available. It would be advisable, and relatively inexpensive, to includein secondary datasets not only the recalculated series but also the original statistics.Equally, the upper and lower bounds with grouped data (obtained with differentassumptions about the within-class distribution) are readily calculated and shouldbe included.
In general, the procedures applied in processing the data should be fullydocumented, and the user allowed as wide a range of choice as possible. It shouldbe noted that choices such as those regarding interpolation method or treatment ofzero incomes may be implicit within the statistical package adopted, or the formulaeapplied in the calculations, and that this may affect the conclusions drawn.
There is a long tradition, in the field of income distribution, of creating secondarydatasets. A comparison of such compilations suggests some desirable features for asecondary dataset:
• Consolidation. In principle, multiple observations for the same country and thesame date are justified where there are differences in definition (for example,household weights vs. person weights), or where different methods of calculationhave been used. When there is no apparent reason for a difference, multipleobservations need to be traced back to their original sources in order to identifythe cause. It is important that data originators provide sufficient information forthis to be possible. In view of their use in the past, keeping duplicate figures
Chapter 5: Comparing Income Distributions Over Time
74 The Canberra Group
contained in earlier secondary datasets is valuable because it facilitatescomparisons, but it should be clear that their status is that of memorandum items.
• Comprehensiveness. When other secondary sources are used, the coverage of suchsources should be exhaustive. Omitting observations that fail to meet some pre-specified criteria may be convenient, but it may be preferable to include theseunsatisfactory observations with a proper cautionary note.
• Full documentation. Precise references and table numbers of the source data anda full account of all adjustments made should be given, so that observations inthe dataset can be reproduced and their genealogy reconstructed.
• Replication. As secondary datasets become available on-line, their producers arelikely to update and revise them, occasionally or on a regular basis. To addressreplication problems, there should be a numbering of different releases of thedatasets, and all versions should be conserved and remain available.
The burden assumed by secondary dataset producers is a huge one. They attemptto overcome all of the theoretical (Chapters 2 and 3) and practical (Chapter 4) biasesfound in “original” datasets. Moreover, they attempt to make these series comparableover time and sometimes across countries. Their task is a most difficult andcomplicated one, and since the devil is always in the details it is important that thesedetails are always made readily available.
5.5 Issues for the end userThis section discusses issues relevant to users and presenters of trend data:researchers, social statisticians, policy analysts, and others.
5.5.1 Detecting TrendsThe problems that may arise include:
• Two point trends. Comparable household income microdata may only be availablefor two periods. Having two periods permits the user to estimate the changebetween them, but it may convey a misleading impression of the underlying trend.There is considerable danger in taking a very small number of years (two as aminimum) to extrapolate long-run trends.
• Business cycle effects. Because of cyclical variations in inequality, trends basedon an arbitrary time period (e.g., 1980 to 1995) might produce misleadingcomparisons if its fit with the business cycle differs between nations. If trends ininequality is pro-cyclical - as is the case in the United States - peak (year) totrough (year) trend estimates are biased downwards; trough to peak trends arebiased upwards. The opposite holds if inequality trends are counter-cyclical.Comparing peak-to-peak or trough-to-trough provides the least biased estimatesand this requires a lengthy time series of estimates (e.g., see Burkhauser, Crews,and Jenkins 1998).
• Mixing datasets and definitions. The only ‘time series’ available may have beenconstructed using several income definitions and/or several datasets over time. Ingeneral, mixing cursorily different datasets to form a single trend is notrecommended as the trend will reflect both the “real” inequality change anddifferences across datasets.

Expert Group on Household Income Statistics
The Canberra Group 75
Figure 5.1 illustrates all three of these issues. There are three data points forcountry X, those for 1980 and 1990 drawn from one survey source and that for 1993from another survey, whilst the curved line represents a hypothetical business cycle.The 1980 and 1990 data indicate a downward trend in inequality, but when the thirddata point is added, inequality increases and the “trend” line through all three pointsis moderately upwards. The “true trend” line and the “actual” curved inequality trendline are both hypothetical, but illustrate the fact that peak-to-peak or trough-to-troughlines are consistent with the observed trend across the three (mixed) datasets.
Figure 5.1Inequality in country X: an illustration of three pitfalls
(a) The Danger of Making a Trend Estimate from Only Two Points(b) Peak to Peak; Trough to Trough(c) Mixing Datasets
Ineq
ualit
y
Time1960 1970 1980 1990 1995
(Survey A)(Survey B)
(Survey A)
"FalseTrend"
"TrueTrend"
Figure 5.2 provides an example of the potential impact of differences in incomedefinitions and reference unit over time and across datasets. Here three sets of dataare used for the same country. The trend in dataset C shows a modest increase ininequality since 1980, but a decline from 1991 to 1995. This dataset biases inequalityupwards at any point in time by ignoring the fact that young adults living with others(e.g., parents) share in household economies of scale. This difference should not biastrend estimates of inequality unless living arrangements or numbers of young adultschange drastically over the period in question.

Chapter 5: Comparing Income Distributions Over Time
76 The Canberra Group
Figure 5.2Trends in Income Inequality: Gini Coefficients in country Y
The income definition used in data set A includes realised capital gains (highestline in figure). Capital gains are sensitive to both business cycles and tax laws. In1990 there was an abrupt upward shift of the Gini coefficient due to changes in taxlaws. This shift produced a discontinuity in the time series which is “overcome” inFigure 5.2 by assuming a one-time “fixed effect” and shifting the new trenddownwards to equate with the old in 1990. Therefore the 1990-1997 trend connectswith the pre-1990 line in 1990. (The definition in data set C (the dotted line) is notaffected because the definition of disposable income excludes capital gains.)
The trend line for data set B (middle line in Figure 5.2) keeps the same tax unitdefinition and other definitions, except it excludes capital gains. Estimates using datasets A and B still indicate an upward trend in inequality. However, the increase ininequality with capital gains (top line) is more drastic and less regular than that foundin the series without capital gains (middle line). Hence, when multiple estimates areselected trends may not be very clear. Inequality has risen modestly or rapidly inthe 1990s depending on which income definition and data series is selected.
If one has detailed knowledge of the different time series available, one caninterpolate among the various estimates to produce as “clean” a series as possible-see for example the bold line in Figure 5.2. Clearly some judgements were made increating this series, for example capital gains treatment, starting and ending point,choice of unit, etc. These should be made clear by the researcher with alternativeestimates or series made available to the reader.
Another example is provided in Figure 5.3. During the 1980s and until mid 1990schanges in income inequality appear significantly different according to whether theyare measured on data from Survey I, or from Survey II, both from the same country.The discrepancy emerges both for changes over shorter periods, and for the overallchange over the entire period, with Survey II showing a tendency toward greater
0.80
0.85
0.90
0.95
1.00
1.05
1.10
1.15
1.20
1.25
1.30
1.35
1.40
1.45
1.50
1970 1975 1980 1985 1990 1995 2000
Statistics
Statistics
LIS
Smeeding
Dataset A
Dataset B
Dataset C
Best estimate
Year

Expert Group on Household Income Statistics
The Canberra Group 77
inequality and the Survey I the opposite tendency. Of the three measures derivedfrom Survey I, series C is similar to series A and B , but with a greater rise ininequality during the 1990s.
Figure 5.3Trends in Income Inequality: Gini Coefficients (1986=1) in country Z
The situation illustrated in Figure 5.3 is not unusual, with several different setsof income distribution data available for a single country all of which can be usedto make trend comparisons: tax records; cross-sectional household surveys coveringincome; and longitudinal income surveys, each with their own biases. Comparisonof alternative time series estimates may help reinforce one another, or they may not.But in any case, the analyst should use all of the available evidence in making theirjudgments about which series, sets of series, or combinations of series produce themost reliable estimates.
5.5.2 Significance of ChangesThere are no generally accepted statistical standards for judging the significance ofchanges over time in measures of income dispersion. In the literature, some authorshave used clear cut standards, e.g., a “1.0 point change in the Gini” (Atkinson et al,1995, p. 39), or some fixed changes, e.g., “a 5 to 10 percentage point change”(OECD,2000), or a “3 to 7 percentage point change” (Gottschalk and Smeeding,2000; Smeeding, 2000). But these have not been based on formal tests of significanceor on standard errors of the estimated summary statistic. Such estimates could onlybe made from information made available by dataset providers or from the raw dataitself. In the absence of raw data authors must fall back on their own standards, orthose imposed by the data providers.
Nor is statistical significance the only yardstick by which the importance of achange over time in income distribution should be judged. The end user ultimatelyhas to use their own judgment about the policy significance of any observed changes.
0.800.850.900.951.001.051.101.151.201.251.301.351.401.451.50
1965 1970 1975 1980 1985 1990 1995 2000
SHIW -
SHIW -
SHIW
SHB -
Year
Survey I- series A
Survey I- series B
Survey I- series C
Survey II

Chapter 5: Comparing Income Distributions Over Time
78 The Canberra Group
5.5.3 Trends versus episodesA further issue in the analysis of inter-temporal changes of income distribution isthe distinction which may be made between “trends” and “episodes.” So far, the term“trend” has been used as the intuitive notion of “average” long-run change. However,to the extent that measures of income dispersion alternate periods of small andirregular changes with sudden accelerations—be they in the direction of higher orlower inequality—the search for a long-run single trend may be misleading. It mayinstead be better to think in terms of “episodes” when inequality fell or increased(Atkinson, 2000). As the analysis of long-run movements of income inequality isstill a relatively unexplored field of research, opinions differ whether the focus shouldbe on sequences of episodes rather than trends. However, two points are relevanthere.
First, conclusions drawn about trends depend crucially on the choice of the startand end points. For example, in Figure 5.2 the pattern is one of falling inequalityuntil 1980 and then rising inequality since then, faster in the 1980s than in the 1990s.Hence, beginning a time series of inequality in country Y in 1975 produces a verydifferent pattern than from 1980 or 1990. The long-run movement of inequality canbe obscured by different presentations of data time series.
Second, an apparently common trend across nations may disguise very differentpatterns of shorter period changes. As an example, consider the “summary bar chart”in Figure 5.4. The method is to calculate the annual percentage change in the GiniCoefficient (from the first to the last data year) and to also calculate the absolutechange year-to-year (from the first to the last year) for each country. This techniqueovercomes the problem of comparisons based on different length time series (longseries for some countries, shorter for others). It also allows comparisons of percentagepoint change (absolute change) and percentage change (relative change). These arequite different because the base Gini coefficients vary by a factor of roughly two-to-one across nations at any point in time.
Figure 5.4Trends in Income Inequality (Gini coefficients)Percentage Change per Year and Absolute Change per Year: 1979-97
0.0
0.5
1.0
1.5
2.0
2.5
A1979-95
B1980-97
C1979-97
D1979-96
E1981-94
F1979-97
G1981-97
H1979-96
Z1979-95
Percentage Change
Absolute Change
Average Change per Year

Expert Group on Household Income Statistics
The Canberra Group 79
The shortcoming of this method is that the bar chart smoothes over periods ofchange where inequality first falls then rises. For instance, Figure 5.4 indicates smallbut very similar changes in inequality in country Z(1979-1995), and in country H(1979-1996). In fact, the pattern in country H is just that—very little change since1969 (Figure 5.5). Conversely, in country Z inequality fluctuated considerablybetween 1979 and 1995, and distinct episodes of falling and rising inequality weresubmerged within one summary trend number (Figure 5.3). Thus both assessingpercentage changes and showing the actual pattern of change add to our knowledgebecause trends and episodes of inequality are not always the same. Moreover, it needsto be noted that difference between beginning and end points is meaningful onlywhen a trend exists, as it may be impossible to reduce a complex time series to U orinverse U shapes alone.
Figure 5.5.Trend in Income Inequality: Gini Coefficients (1983=1) in country H
WE RECOMMEND THAT PRIMARY AND SECONDARY PRODUCERSOF INCOME DISTRIBUTION STATISTICS BE MORE AWARE OFTHE NEEDS OF USERS FOR TIME SERIES DATA AND THATIMPROVEMENTS IN AVAILABILITY OF BOTH DATA AND METADATABE GIVEN PRIORITY
0.800.850.900.951.001.051.101.151.201.251.301.351.401.451.50
1965 1970 1975 1980 1985 1990 1995 2000Year


Chapter 6
IncomeDynamics
The Canberra Group 81
6.1 IntroductionThe use of cross sectional data is extensive in most income research and policyanalysis, while the use of longitudinal data is not as common. This is mainly due tothe extra cost and complexity of longitudinal surveys. However, there is much to begained from the use of longitudinal data. Cross-sectional data give excellentinformation about “net effects” and “net change” of income at given points in time,but longitudinal data allow for the exploration of changes experienced by individualsthrough time. The analytical power of longitudinal data has numerous advantages,such as exploring potential relationships between various socio-economic variablesof interest and guiding the development of public policy. The focus of this chapterwill be on the relative advantages and disadvantages, uses and policy implicationsthat are associated with longitudinal data. The first section focuses on the advantagesand disadvantages of longitudinal data relative to cross-sectional data. Then someexamples of longitudinal surveys are provided as well as potential research areasfor which they are well-suited.
This chapter does not explore the complex technical methodological issuesassociated with a good longitudinal panel. Issues such as estimation (design oflongitudinal weights) and adjustments for attrition have been documented in detail inother literature. This portion of the Guidelines looks rather at the analytical opportunitiesavailable from longitudinal approaches to measuring household income distribution.
6.2 The relative advantages and disadvantagesof longitudinal surveys
A central feature of longitudinal data is the measurement of change at the individuallevel. To understand the processes involved in life histories, one needs to collect dataat key transition points from the same cohort of individuals across time and over anextended period of time. Cross-sectional data collected on repeated occasions enableone to monitor the effects of societal change on the prevalence of populationcharacteristics - “net effects” - while longitudinal data are essential to investigatechanges in individuals within the population as well - “gross effects”.

Chapter 6: Income Dynamics
82 The Canberra Group
Longitudinal income studies can unravel how particular life events develop, anddraw inferences and conclusions about their long term impact. Although cross-sectional data provide a representative sample of the population, they cannot capture,on a cohort basis, such changes such as fluctuations in income, family characteristicsor what events tend to coincide in the life cycle at the individual or micro level. Forexample, poor educational attainment in children may be attributed in part to lowparental aspirations if changes in the former precede changes in the latter. A crosssectional survey could establish only a correlation between parents’ aspirations andchildren’s educational attainment, with no basis on which to establish either causeor effect. Longitudinal data would give some broader insight as to the nature of someof the ‘cause and effect’ relationships with children’s educational attainment.
However, the value of longitudinal studies has to be judged against both thecost and the complexities of collecting the data. The most serious of these are dataquality issues associated with ‘attrition’, the loss of sample members over time.Subjects may disappear from the study because they have moved, changed theirnames (through marriage) or are simply no longer interested in taking part; othersmove in and out of the study depending on their availability at the time a particularsurvey wave is to be carried out. This can seriously weaken the research. Sampleloss reduces the number of units (people or households) available for data analysis -a particular problem in longitudinal analysis, which demands complete records acrossthe time span of the research.
Attrition is also a potential source of bias in the data. If those who leave thestudy are not typical of those who started it, the longitudinal data will become biasedto this extent. On the other hand, unlike cross-sectional data, longitudinal datacontains full information about the characteristics of the sample when the studybegan. Accordingly, if loss to the sample through attrition occurs differentially acrossgroups, e.g. groups say defined by social class of parents, then the sample can bere-weighted at any point in time to re-construct the key distributions of such variablesand compensate for this loss to some degree by this weighting. Unless a longitudinalpanel is regularly replenished, it will also gradually become less representative ofthe population as a whole to the extent that immigrants will not be captured withinthe sample.
Other possible data quality issues are those that relate to external sources ofvariation. Three sources of external individual variation that longitudinal data maycontain are: age, period and cohort effects. All three need ideally to be accommodatedfor in the research design. Data collected at a particular point in time in a longitudinalstudy may be a product of the age of the individual concerned (age effect), the timewhen the individual was born (cohort effect) and the period at which data werecollected (period or secular effect). To assess the size of the cohort effect and controlit, one needs to collect data from individuals of the same age but born at differentpoints in time (cohorts). To assess and control the age effect, we need to collect datafrom individuals of different ages in the same period. To assess and control the periodeffect, we need to collect data from individuals of the same age at different periods.
As longitudinal surveys are far more complex than cross sectional surveys, thecosts of conducting a longitudinal survey are also higher. Large scale longitudinalstudies tend to be expensive to carry out, and if they last a long time, requireconsiderable commitment from a dedicated team to keep the study going. Continuingfunding in between waves is always a problem. This is why, rather in the nature of a
Expert Group on Household Income Statistics
The Canberra Group 83
small business, effective longitudinal studies need a well-funded infrastructure toensure their continuation.
Longitudinal data are not only complex to collect, they also present additionaldifficulties to analyse and to present in a way which is user-friendly. Each wave ofdata can be regarded as adding another dimension to each sample unit, and thelongitudinal linking of data presents formidable problems both of processing andinterpretation. However, with modern information technology such problems arereducing in importance.
6.3 International examples of longitudinal incomesurveys
Four current and extensive longitudinal surveys from various nations are outlinedbelow. Each measures a wide array of socio-economic variables that may be used toexplore the many complex socio-economic relationships. The surveys that will bediscussed include the Canadian Survey of Labour and Income Dynamics, theAmerican Panel Study of Income Dynamics and The Survey of Income and ProgramParticipation and the European Community Household Panel Survey which coversmost EU member states. Other relatively long-standing longitudinal surveys includethe German Socio-economic Panel Survey, the British Household Panel Survey andthe United States National Longitudinal Surveys of Labor Market Experience.
6.3.1 Survey of Labour and Income DynamicsThe Survey of Labour and Income Dynamics (SLID) is one of several longitudinalhousehold surveys being mounted by Statistics Canada. SLID is a multi-purposesurvey designed to track the experiences of individuals in the labour market, theirlevel and sources of income and changes in family life. The sample consists ofoverlapping panels, each one lasting six years. Each panel starts with about 15,000households. All members are followed through time and new people with whom theylive during the six year period are also covered. In addition to extensive historicalinformation, covering marital history, fertility, work experience and educationalattainment, persons 16 and over are interviewed every January about their labourmarket activities throughout the previous year. Detailed income information isobtained from their tax records, unless they do not file a tax return or would preferto provide this information by interview. Income interviews are conducted in May.SLID’s panel first started in 1993, and ended in 1999 (the launch of the third panel).
Major SLID research areas range from employment and unemploymentdynamics and labour market transitions linked to the life cycle, to job quality,workplace inequality issues, family economic mobility (dealing in shifts in incomelevel), low income dynamics (or flows into or out of poverty), demographic eventsand the relationship between work and education. SLID is the first household surveyever to provide Canadian data on the fluctuations in income that a typical family orindividual experiences through time, which will give greater insight on the natureand extent of low income in Canada.

Chapter 6: Income Dynamics
84 The Canberra Group
6.3.2 Panel Study of Income DynamicsThe Panel Study of Income Dynamics (PSID), begun in 1968, is a longitudinal studyof a representative sample of U.S. individuals (men, women, and children) and thefamily units in which they reside. It emphasises the dynamic aspects of economicand demographic behaviour, but its content is broad, including sociological andpsychological measures. As a consequence of low attrition rates and the success infollowing young adults as they form their own families and re-contact efforts (ofthose declining in one interview in prior years), the sample size has grown from4,800 families in 1968 to 6,434 in 1999. As of 1997, the PSID had collectedinformation about more than 60,000 individuals spanning as much as 30 years oftheir lives. It now collects information on the original families and their spin-offsonce every other year.
6.3.3 Survey of Income and Program ParticipationA second American major longitudinal survey is the Survey of Income and ProgramParticipation (SIPP) which provides a major expansion in the kind and amount ofinformation available to analyse the economic situation of households and personsin the United States. The information supplied by this survey provides a betterunderstanding of the level, and changes in the level, of well-being of the populationand of how economic situations are related to the demographic and socialcharacteristics of individuals. The data collected in SIPP are especially useful instudying Federal transfer programs, estimating program cost and effectiveness, andassessing the effect of proposed changes in program regulations and benefit levels.Analysis of other important national issues such as tax reform, Social Securityprogram costs, and national health insurance can be expanded and refined, based onthe information from this survey. It collects information from around 37,000households once every four months for three years. It was begun in 1983.
6.3.4 European Community Household Panel SurveyThe European Community Household Panel Survey (ECHP) aims to collectcomparable micro-level (persons/households) data on income, living conditions,housing, health and work in the EU. This is a completely new European survey,though in some countries it has utilised existing panels, and is the most closely co-ordinated component of the EU system of social surveys. The survey follows thesame private households and persons over consecutive years from 1994. In 1995 over60,000 households were surveyed. Indicators include: income from work, privateincome, income distribution, social exclusion, poverty, housing, health, medical care,education, retirement, unemployment and divorce.
6.4 Some applications of longitudinal surveysLongitudinal data sources may take several years to pay dividends in terms ofanalytical results, but these results can be extremely useful to the development ofsocial and labour market policy. Several longitudinal research themes can contributeto the formation to public policy, in particular: labour market dynamics, economicmobility and low income dynamics.
Expert Group on Household Income Statistics
The Canberra Group 85
6.4.1 Labour Market DynamicsThe term employment and unemployment dynamics refers to movements in thelabour market experienced at the level of the individual such as shifts betweenemployment, unemployment and inactivity. Studies in recent years based on crosssectional data indicate very large movements in the labour market over the periodof a year or even a month. Such studies can improve our understanding of how thelabour market functions, and are thus useful supplements to “snapshot” labour marketdata that measure “net” change over some fixed time period. However, longitudinaldata can provide insight into such issues as to what extent is unemploymentexperienced repeatedly by the same individuals, and how does the duration ofunemployment spells vary over the business cycle? The longitudinal design allowsstudies of this type using completed spells, which can yield superior results to thoseobtained using truncated spells.
Other topics studied include using the longitudinal design to determine flowsinto employment and unemployment and the events that trigger such movements.For example, what are the major determinants of labour market withdrawal? Whatfamily events act as triggers for labour market transitions? What precedes a transitioninto self-employment? Do family income (both its level and stability) and wealthappear to have an impact on a worker’s decision to become self-employed?
Along the same theme, life cycle related labour market transitions is a group ofstudies that puts more emphasis on the individual’s family circumstances or livingarrangements and deals with major labour market transitions that dominate particularstages of the life cycle. Three main life cycle transitions of particular interest are:school-to-work transitions, transitions from work to retirement and work absences/temporary labour market withdrawal associated with childbirth or child-rearing.
School-to-work transitions can include long periods of inactivity andunemployment following school-leaving and are a labour market policy concern, notonly because of lost productivity in the short-term, but also because of theconcomitant use of social assistance, the onset of discouragement and so on. Thesedynamic movements have a direct impact on income flows over time. Issues ofinterest in this area include labour market integration of high school dropouts, timerequired for school leavers to find their first full-time job, stability of the first full-time job, wage and occupation in relation to education and major field of study, andback-to-school transitions following early ventures into the labour market.
Issues around transitions from work to retirement and impacts on income includethe distribution of wealth among seniors and the pre-retirement group, and how wealthconditions retirement decisions. The potential exists for studying the labour marketphasing-out process, for example, self-employment following retirement from a paidjob, or shifts to part-time or lower-wage pre-retirement jobs.
Work absences/temporary labour market withdrawal associated with childbirthor child-rearing are the third major area of life-cycle transitions. It is possible tostudy reintegration patterns, for example, wages before and after the absence, workarrangements and hours worked on returning to work. There may be some interestin the patterns associated with various family types, in particular, lone-parent families.Another possible research area will be the labour market impacts of family dissolutionas they relate to working mothers.

Chapter 6: Income Dynamics
86 The Canberra Group
6.4.2 Family Economic MobilityThe increase in earnings inequality in some nations has manifested itself through agrowing gap between older and younger workers, particularly among men. Theavailability of longitudinal data offers some prospect of understanding the individualtrajectories underlying changes in inequality. Longitudinal data can be used to assessthe long-term impact of the drop in real earnings in families and whether earnersspend more time in lower income levels that did previous generations.
This group of studies deals mainly with the measurement of stability versuschange in the economic well-being of families. An important research topic in thisarea is family formation and dissolution.
When a major family event occurs, it often can trigger significant change inincome. Cross-sectional data show that family dissolution and re-formation is aneveryday reality in many countries. Longitudinal sources of data hold some promisefor understanding the financial origins and outcomes of these family changes. If sucha change involves the gain or loss of a breadwinner, it can have major repercussionson the family’s financial picture.
Longitudinal sources of data can also be used to investigate how family events,particularly marriage and separation, are related to children entering or leaving lowincome and poverty. For example does parental separation increase the risk that achild falls below a given poverty line compared to a child whose parents did notseparate that year. Or, conversely, how does marriage or a new common-law unionincrease the probability that a child will move out of a low income situation.
6.4.3 Low Income DynamicsDynamics of low income is related to the previous theme, but the emphasis is moreclearly on low income. Studies of low income and poverty, such as the flows betweentwo years, which use cross sectional data look at a short period, can give anexaggerated impression of the amount of turnover that occurs in the low incomepopulation or the persistence of low income spells. In the longer term longitudinaldata may be used to estimate “turnover” in the low-income population, from year toyear and over a longer period, which may provide a more accurate picture of thenature of poverty.
Associated questions concern the determinants of flows into and out of lowincome. What are the demographic and labour market events that tend to trigger amovement into or out of low income? What role do government transfer paymentsplay in flows out of low income? Longitudinal data are of potential use in studyingthe degree of economic dependency on these social programs over time, and the partplayed by each in bolstering family income.
Families that are economically disadvantaged in spite of their labour marketinvolvement - “the working poor” - are a particular concern, in that their precariousposition may trigger labour market withdrawal. The data may be of interest in incomesecurity policy research, especially given the move towards building work incentivesinto income support programs.
The uses of longitudinal data are extensive and varied, and can provide manyinsights into the nature of socio-economic relationships that may be of interest toresearchers and policy makers alike. Unlike cross-sectional data, which give a very

Expert Group on Household Income Statistics
The Canberra Group 87
accurate representation of net change at any given point in time of what is happeningto the population as a whole, longitudinal data provide insight into the impact thatparticular events have on an individuals outcomes and transitions. The Survey ofLabour and Income Dynamics, Panel Study of Income Dynamics, Survey of Incomeand Program Participation and European Community Household Panel Survey areexamples of longitudinal surveys that are providing and will continue to providevaluable information on such research topics ranging from the dynamics of povertyto tracking life cycle transitions in the labour market to examining family economicwell being. The knowledge garnered form these areas of research are paramount tounderstanding the complex socio-economic relationships of today’s societies and tohelp guide governmental programs and polices to achieve their goals.


The Canberra Group 89
Chapter 7
DataPresentation
7.1 IntroductionAll the usual ‘best practice’ rules for presenting statistics apply equally to incomedistribution analysis. Charts can provide very valuable insights, but the informationcontent they can bear without becoming cluttered is limited, otherwise it becomesdifficult to draw clear inferences. Three dimensional charts are not recommendedfor the presentation of two dimensional data, despite their aesthetic appeal, becauseof the distortion which the addition of a third dimension may bring. It may sometimesbe illuminating to present three dimensional data in chart form, but generally speakingmore detailed data require a tabular format. In any case, the data underlying a chartshould always be available to the user. Income statistics represent some of the mostcomplicated data produced by statistics offices and a major challenge for theirproducers is how to present them in a user-friendly way. The aim of this chapter isto discuss various ways of presenting data on household income, and the pitfallswhich should be avoided.
Section 7.2 follows the recommendations provided in chapter 3 on different unitsof classification and provides examples of how to present income data for differentunits of analysis. Section 7.3 discusses the use of the mean and the median asmeasures of central tendency. In section 7.4 income dispersion measures are explored.Examples are provided of different ways of presenting inequality and discuss someof the problems related to the use of different inequality measures. Section 7.5 focuseson the presentation of different components of income.
7.2 Units of analysis and classificationChapter 3 recommended the household as the preferred unit for income distributionanalysis, because this is the level of aggregation of individual incomes at which anassumption of income sharing is most valid. However, even if the unit of analysis isthe household, one may wish to present the data in different ways; for example,reweighting household income so that it represents the number of individuals insteadof the number of households (see section 3.3.6).
Thus in presenting income distribution results, producers should make it clearwhat assumption is inherent in the units of analysis, for example that all membersof a household share equally in the household’s income, and how people are counted.

Chapter 7: Data Presentation
90 The Canberra Group
Users need to know whether a statement that ‘ the bottom 20 per cent of the incomedistribution receive 8 per cent of total income’ means that the bottom 20 per cent ofindividuals receive 8 per cent of total income or that the bottom 20 per cent ofhousehold – who might be more or less than 20 per cent of the population – receive8 per cent of total income.
In presenting income distribution statistics, it is often useful to categorisehouseholds according to characteristics which are thought to correlate with income.For example, one frequently used way of classifying households is to take intoaccount factors such as the age and number of children in the household or howmany economically active adults there are in the household. Needless to say thereare substantial differences in economic well-being between households where thenumber of economically active adults differs but all other characteristics are the same.Again, the data producer must make clear the basis on which households are assignedto categories: is a ‘single parent’ a single person with children, or a single personwith children and with no other adult in the household. Similarly, the definition ofterms such as ‘child’ and ‘economically active’ must be readily available to the user.For example, a ‘child’ may be defined by their age, or by their educational status(whether or not still in full-time education), their kinship to other members of thehousehold, or any combination of these factors.
Often it is personal characteristics such as gender and age, education, seniorityor type of activity which are considered important, but these cannot be used as aclassification of households. For example, the income of individuals and householdsmay vary substantially at different stages in their lives. Households with youngchildren will in general have a lower economic well-being compared to older coupleswhere there are no children residing at home, and old-age pensioners will usuallyhave lower income compared to working age households. In such cases a commonmethod is to classify households according to the personal characteristics of thehousehold head (or the reference person) and the number of adults and children inthe household. Figure 7.1 gives a hypothetical example of how households can beclassified into different types and of the text which should accompany such a chartto clarify the classification. Households types are here constructed both on the basisof household size (singles, single parents and couples with and without children)and according to age.
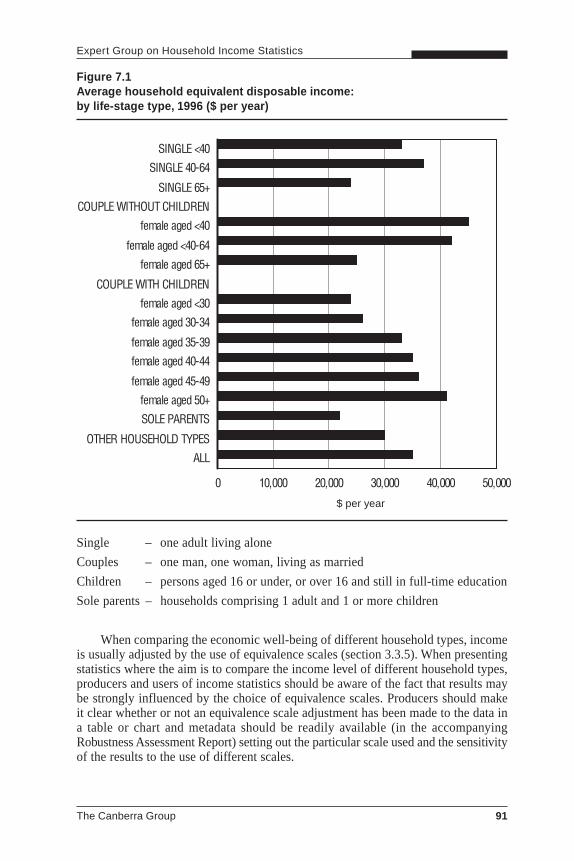
Expert Group on Household Income Statistics
The Canberra Group 91
0 10,000 20,000 30,000 40,000 50,000
ALL
OTHER HOUSEHOLD TYPES
SOLE PARENTS
female aged 50+
female aged 45-49
female aged 40-44
female aged 35-39
female aged 30-34
female aged <30
COUPLE WITH CHILDREN
female aged 65+
female aged <40-64
female aged <40
COUPLE WITHOUT CHILDREN
SINGLE 65+
SINGLE 40-64
SINGLE <40
Figure 7.1Average household equivalent disposable income:by life-stage type, 1996 ($ per year)
Single – one adult living alone
Couples – one man, one woman, living as married
Children – persons aged 16 or under, or over 16 and still in full-time education
Sole parents – households comprising 1 adult and 1 or more children
When comparing the economic well-being of different household types, incomeis usually adjusted by the use of equivalence scales (section 3.3.5). When presentingstatistics where the aim is to compare the income level of different household types,producers and users of income statistics should be aware of the fact that results maybe strongly influenced by the choice of equivalence scales. Producers should makeit clear whether or not an equivalence scale adjustment has been made to the data ina table or chart and metadata should be readily available (in the accompanyingRobustness Assessment Report) setting out the particular scale used and the sensitivityof the results to the use of different scales.
$ per year

Chapter 7: Data Presentation
92 The Canberra Group
7.3 Summary measures of income level:the mean and the median
The most frequently used measure to describe income levels is the arithmetic mean,ie the sum of all income divided by the number of observations. One advantage ofthe mean is that it is easy to measure and interpret. However, one of its drawbacksis its vulnerability in respect to extreme values and to asymmetry of the distribution.
An alternative measure of central tendency is the median, ie the middleobservation of the distribution. Compared to the mean, the median is a more stableand robust measure and less affected by extreme values and sample fluctuations.This can be illustrated in the following example. Figure 7.2 presents changes inaverage and median household equivalent income. As can be seen from the graphthe median shows a gradual decline in income from 1992 to 1995 and a modest risefrom 1995 to 1997. However, the trend in average income is quite different frommedian income. We note for instance a sharp increase in average income from 1993to 1994, followed by a huge drop from 1994 to 1995. From 1995 to 1997 there isonce more a strong increase in income.
In this hypothetical example, the reason for the difference between the twomeasures can be explained by a sharp increase in investment income in 1994 and in1997. This component of income is heavily concentrated at the top of the distributionand its magnitude has a strong impact on the mean, but not on the median.
Figure 7.2Changes in mean and median household equivalent disposable income
80
85
90
95
100
105
110
1991 1992 1993 1994 1995 1996 1997
Mean
Median
Despite its weakness as a measure of central tendency, the mean remains themost frequently used measure of income level by most producers of income statistics.It is also the obvious choice when presenting data on the composition of householdincome. For the lay user it is more satisfactory if the different income componentssum to total income, which will be the case when the mean is used. It is not howevertrue of the median except in exceptional cases. On the other hand, the median is
Currency units
Mean
Median

Expert Group on Household Income Statistics
The Canberra Group 93
0
0.002
0.004
0.006
0.008
0 100 200 300 400 500
often the preferred measure when a threshold for ‘low’ or ‘high’ income is required.The reason for this is that many define poverty in terms of the relative distance tothe “general” level of income. The median is often considered superior to the meanas an indicator of the general or standard level of income for the whole populationfor the reason already mentioned, ie less vulnerability to changes taking place at thetails of the distribution.
7.4 Measures of income dispersionThe difference between the mean and the median can be regarded as one measureof income dispersion. In most countries average household income will be higherthan the median household income. The reason for this is that the distribution ofincome is usually skewed towards the lower end of the distribution. The higher theratio between the mean and the median, the greater the inequality. However, this isa relatively crude measure and a number of other possible measures of incomeinequality have been developed.
The frequency diagramThe most basic presentation of income dispersion is the frequency diagram, whichplots the chosen measure of income (total income, disposable income, adjusteddisposable income) for each sample unit. Figure 7.3 show a typical incomedistribution. Although hypothetical, this illustrates the fact that the income is notdistributed as a normal distribution but is positively skewed towards the upper endof the distribution.
Figure 7.3Frequency distribution of income
Population frequency
Weekly equivalent net income
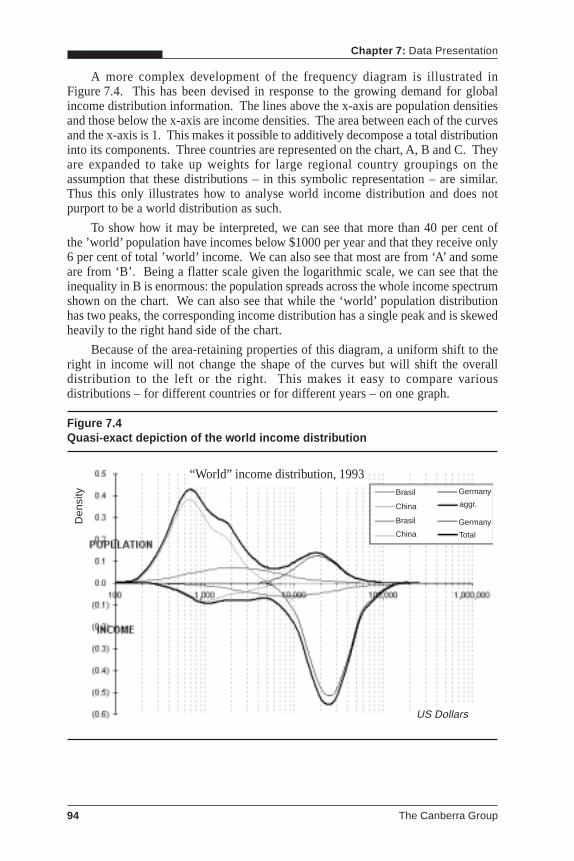
Chapter 7: Data Presentation
94 The Canberra Group
A more complex development of the frequency diagram is illustrated inFigure 7.4. This has been devised in response to the growing demand for globalincome distribution information. The lines above the x-axis are population densitiesand those below the x-axis are income densities. The area between each of the curvesand the x-axis is 1. This makes it possible to additively decompose a total distributioninto its components. Three countries are represented on the chart, A, B and C. Theyare expanded to take up weights for large regional country groupings on theassumption that these distributions – in this symbolic representation – are similar.Thus this only illustrates how to analyse world income distribution and does notpurport to be a world distribution as such.
To show how it may be interpreted, we can see that more than 40 per cent ofthe ’world’ population have incomes below $1000 per year and that they receive only6 per cent of total ’world’ income. We can also see that most are from ‘A’ and someare from ‘B’. Being a flatter scale given the logarithmic scale, we can see that theinequality in B is enormous: the population spreads across the whole income spectrumshown on the chart. We can also see that while the ‘world’ population distributionhas two peaks, the corresponding income distribution has a single peak and is skewedheavily to the right hand side of the chart.
Because of the area-retaining properties of this diagram, a uniform shift to theright in income will not change the shape of the curves but will shift the overalldistribution to the left or the right. This makes it easy to compare variousdistributions – for different countries or for different years – on one graph.
Figure 7.4Quasi-exact depiction of the world income distribution
“World” income distribution, 1993
Den
sity
US Dollars
Brasil
Brasil
China
China
Germany
Germany
Total
aggr.

Expert Group on Household Income Statistics
The Canberra Group 95
7.4.1 The Lorenz curveThe frequency diagram presents a ranking of units according to their income, andthis basic procedure is at the foundation of most measures of income dispersion.The Lorenz curve is closely related. Units of analysis (persons or households) areplaced on the horizontal axis according to ascending income, and the vertical axispresents the cumulative proportion of total income accruing to them. The closer tothe diagonal the curve lies, the more equal is the distribution.
The Lorenz curve is frequently used to compare income distributions. If thecurves of two distributions do not intersect this can be interpreted as if one distribution‘Lorenz-dominates’ the other, i.e. one distribution is unambiguously more equal thanthe other. This is illustrated in Figure 7.5. This figure shows the distribution ofequivalent household income for two countries for the income year 1999. The Lorenzcurve for country A is much closer to the diagonal indicating a more equal incomedistribution than for country B, and at no point do the two curves intersect. Figure 7.6compares the income distribution of country B with that of country C. Because thecurves now intersect we cannot conclude that country C has a more equal distributionof income compared to country B, or vice versa.
Figure 7.5Lorenz curves for the distribution of equivalent household disposable income
0
10
20
30
40
50
60
70
80
90
100
0 1 2 3 4 5 6 7 8 9 10
Denmark PortugalCountry A Country B

Chapter 7: Data Presentation
96 The Canberra Group
0
10
20
30
40
50
60
70
80
90
100
0 1 2 3 4 5 6 7 8 9 10
Ireland Portugal
Figure 7.6Lorenz curves for the distribution of equivalent household disposable income
7.4.2 The Gini coefficientAs has been illustrated above, one weakness of the Lorenz curve is the problem ofinterpretation when two curves intersect. However, the Lorenz curve provides thetheoretical basis for several important inequality indexes or summary measures. Oneof the most widely used summary measures of income dispersion is the Ginicoefficient. The Gini coefficient measures the Lorenz area, the area between the curveand the diagonal, as a proportion of the total area of the lower triangle. The Ginicoefficient may vary from 0 (all units have equal income) to 1 (maximum inequality).It is expressed either as a fraction or as a percentage.
One advantage of the Gini coefficient is that it provides a simple summarymeasure of inequality that is fairly easy to interpret for both producers andprofessional users of income statistics. The higher the coefficient, the greater theinequality. However, despite its simplicity and popularity the Gini coefficient alsosuffers from some weaknesses. It has for instance been criticised for being toosensitive to changes taking place around the mean of the distribution, and to be lesssensitive to changes that occur at both tails of the distribution. One consequence ofthis is that one distribution that includes one observation with extremely high income,can report the same coefficient as another distribution that has several observationswith very low income. For this reason producers of results should be careful not topresent inequality figures based on the Gini alone. Instead the Gini estimates shouldbe presented in combination with, for example, decile distributions or other summarymeasures that are more sensitive to other parts of the distribution. Some of thesewill be discussed below.
Country C Country D

Expert Group on Household Income Statistics
The Canberra Group 97
One other drawback of the Gini coefficient and other mathematical measuresof dispersion is that they often are difficult to understand for the public andpolicymakers.
One particular issue that analysts of income distribution should be concernedabout when presenting Gini coefficients is sampling error. Most countries produceincome statistics that are based on representative sample surveys. In sample surveysthere will also be sampling errors which will also affect the Gini coefficient. Estimatesof sampling variance may be essential for judging the significance of inequalityrankings, for instance in respect to trends in income distribution or cross-countrycomparisons (see also section 5.5.2). (Small) changes in the Gini coefficient maybe within the bounds of sampling error and so no inferences about changes in incomedistribution may be drawn from them.
It might be argued that non-sampling errors may be quantitatively moreimportant than sampling errors in respect to cross-country comparisons of inequality(Atkinson et al. 1995). Measures of sampling errors should, nevertheless, alwaysbe presented alongside the Gini coefficients in order to avoid drawing falseconclusions on (small) changes in inequality.
7.4.3 Quantile groupsAnother common approach also based on a ranking of units of analysis (eg householdsor individuals) according to ascending income involves calculating shares of totalincome accruing to a given proportion of the units, for example decile (10 per cent)or quintile (20 per cent) groups. If income were distributed equally among the unitseach decile (quintile) would have a 10 (20) per cent share of total income. Decileand quintile groups are particular examples of quantile groups. In the followingdiscussion, decile groups are referred to throughout, but the comments are equallyapplicable to any other quantile groups chosen.
When presenting summary data on decile groups either the mean or the medianmay be taken to represent the relative position of that decile group. As discussed insection 7.4.1 above, the median is generally to be preferred particularly at the tailsof the distribution. An alternative approach is to present decile points (often simplyreferred to as deciles). The decile point is the exact value that separates two decilegroups. The person with the highest income within decile group 1 will, for instance,be the first decile in the distribution (or the 10th percentile), whereas the person withthe lowest income among the richest 10 per cent will be the 9th decile (or the 90th
percentile).
Dividing the population into quantile groups and then comparing the share ofincome of each group is a very useful way of analysing trends in income inequalitywithin a country or to study cross-country differences. By comparing, say, deciledistributions one gets information not just on whether one distribution is more unequalthan another, but also information on where within the distribution differences occur,without recourse to a full frequency diagram. This point is illustrated Figure 7.7.The figure shows the distribution of equivalent household disposable income in 12hypothetical countries across different income classes, where the income classes areconstructed on the basis of decile groups. For the purposes of this diagram, lower-income units are defined as those in the three bottom decile groups, middle-incomeunits are those in the four middle decile groups while high-income units are thosein the top three decile groups.
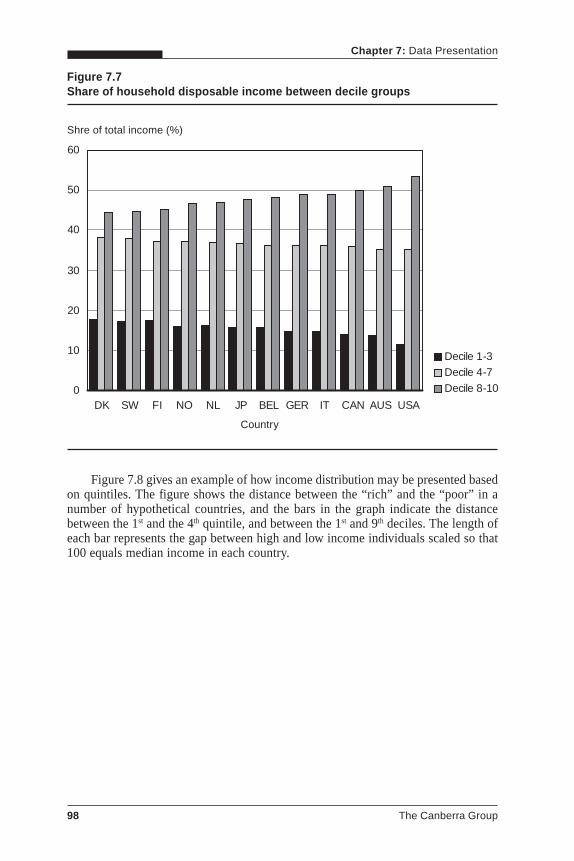
Chapter 7: Data Presentation
98 The Canberra Group
Figure 7.7Share of household disposable income between decile groups
Figure 7.8 gives an example of how income distribution may be presented basedon quintiles. The figure shows the distance between the “rich” and the “poor” in anumber of hypothetical countries, and the bars in the graph indicate the distancebetween the 1st and the 4th quintile, and between the 1st and 9th deciles. The length ofeach bar represents the gap between high and low income individuals scaled so that100 equals median income in each country.
0
10
20
30
40
50
60
DK SW FI NO NL JP BEL GER IT CAN AUS USA
Decile 1-3
Decile 4-7
Decile 8-10
Shre of total income (%)
Country

Expert Group on Household Income Statistics
The Canberra Group 99
0 50 100 150 200 250
Figure 7.8The distance1 between the 1st and the 4th quintiles and the 1st and 9th deciles
Distance between 10th and 90th percentile
Distance between 20th and 80th percentile
Notes:1 Social distance is measured by percentile position relative to adjusted median income (100) and
by the decile and quintile ratios.2 Incomes are adjusted by E=0.5 where adjusted DPI=actual DPI divided by household size (S) to
the power E: Adjusted DPI=DPI/SE.3 Countries are ranked by decile ratio.
0 50 100 150 200 250
Percentile of Median Adjusted Income
Country3/Year
Country A
Country B
Country C
Country D
Country E
Country F
Country G
Country H
Country J
Country K
Country L
Country M
Country N
Country P

Chapter 7: Data Presentation
100 The Canberra Group
0
1
2
3
4
5
6
1986 1987 1988 1989 1990 1991 1992 1993 1994 1995 1996 1997
D90/D10
P90/P10
However, as was the case for the mean and the median, presentations based ondecile group shares and decile points may sometimes give contradictory results. Wheninequality is measured on the basis of differences in decile points, rather than decilegroup shares, the influence of extreme values at both tails of the distribution will bemuch less pronounced. This is illustrated in Figure 7.9, which shows the ratio betweenthe income share of decile group 10 to that of decile group 1 together with the ratioof the 9th decile to that of the 1st decile. Note, however, that the ratio of the 1st and9th deciles does not reflect the distribution of income amongst 20 per cent of thepopulation. These groups at the tails of the distribution are also those which oftenare of particular interest to policymakers and in public debate, but are also those forwhich incomes may be the least reliable indication of economic well-being (seeChapter 8 – Robustness Assessment Reporting).
As can be seen from the figure, the ratio of the decile group shares increasedsubstantially in the period indicating an increase in income inequality. The share ofincome of the richest tenth of the population increased from 4.5 times the share ofthe poorest tenth in 1986 to 6 times higher in 1997. However, the figure also showsthat the ratio between the decile cut-offs remained virtually unchanged in thesame period.
Figure 7.9
Ratios between decile group shares of income (A) and between decile points (B)
A
B
Ideally producers of income statistics should present statistics of decile points,decile group shares and decile group averages. However, it may not always bepossible to do so because of data imperfections. For example, it would be problematicto present cross-country comparisons based on decile shares, eg the share of totalincome that the richest or poorest 10 per cent of all households receive, when somenational datasets have been bottom or top coded while others have not. In addition
Expert Group on Household Income Statistics
The Canberra Group 101
countries differ in respect to the coverage of certain income components that areparticularly unevenly distributed, for example investment income (Atkinson et al,1995). For these reasons it is recommended that when presenting internationalcomparisons of decile ratios - and where there are known to be such dataimperfections like those mentioned above - then these figures should primarily bebased on decile points rather than decile shares. On the other hand, when presentingtrends in income distribution within the same country and provided that there hasbeen no substantial change in respect to income definitions etc., the presentation ofdecile shares is a very useful way of monitoring changes in income distribution.
7.4.4 Other summary measuresAmong producers of income statistics and analysts of income distribution the Ginicoefficient is the most frequently used summary measure of inequality. There exist,however, a number of other summary measures of inequality. An exhaustive listwill not presented here but readers are advised to consult one of the manymethodological handbooks on the measurement of income inequality for more detail,for example Nygård & Sandström (1981) or Cowell (1995). Instead this sectionfocuses on a few summary measures that are frequently presented as a complementto the Gini coefficient, because they are more sensitive to changes taking place atdifferent parts of the income distribution.
The distinguishing feature of the Atkinson index is its ability to reflectmovements in different segments of the income distribution. The user can placegreater weight on changes in a given portion of the income distribution by settingthe e parameter (referred to as the level of “inequality aversion”). This parametercan be set between 0 and 1. The index becomes more sensitive to changes at thelower end of the income distribution as e approaches 1. Conversely, as the level ofinequality aversion falls (that is, as e approaches 0) the Atkinson index becomes moresensitive to changes at the upper end of the distribution.
Two measures that are frequently used to measure changes taking place at theupper tail of the distribution are the Squared Coefficient of Variation (SCV) and theTheil’s entropy. The Coefficient of Variation is the standard deviation divided by themean. When squared it is additively decomposable. Like the Gini coefficient, theSCV measure has a minimum value of 0, but the maximum value depends of thenumber of units. The second measure, the Theil’s entropy, also has no fixed maximumvalue, but the more unequal the distribution is the more the entropy deviates fromzero.
In most cases the broad picture of how income dispersion differs either overtime, between countries, or between groups within a country, will be unaffected bythe choice of summary measure. However, the different indices do have differingproperties and so this is not always so: the message conveyed by alternative summarymeasures may sometimes be contradictory. It is therefore important that more thanone measure should be calculated and presented, and that the measures should bechosen with the particular aspect the user wishes to portray in mind.

Chapter 7: Data Presentation
102 The Canberra Group
7.5 Income compositionWhen analysing income both within and between countries one also sometimeswishes to compare income composition. In interpreting differences between incomecomposition between countries, the user has to be aware of institutional differenceswhich may have a bearing. For example, countries differ in the extent to which thewelfare state supports households. Also, support to households may be organised indifferent ways, for example child allowances may be provided as cash support inone country and as tax reductions in another.
One way to compare income composition between countries or betweenpopulation groups is to calculate those different income components which sum todisposable income. Since there may be differences between population groups withincountries and between countries it is desirable to compare income composition netof negative transfers such as income tax. However, information on these transfers,for example income tax, is usually only available in total and cannot be directlyrelated to each component of gross income. Thus an imputation may have to bemade to obtain disposable income by apportioning and then deducting taxes inproportion to those income components which are liable to tax, and deducting othernegative transfers in proportion to all income components.
The basis for this type of calculation is mean values for all income components.One has to adopt the mean in order to have all the components to sum to total income.However, as mentioned earlier one of the drawbacks of the mean is that outliers mayoverly influence the upper and lower tails of the distribution.
Income composition is probably most successfully presented in table form,unless very few (no more than three) income categories are to be shown. Althoughlayer charts and stacked bar charts are sometimes used, it is difficult to draw acomplete picture covering all categories of income from them.

Chapter 8
RobustnessAssessment Reporting
The Canberra Group 103
8.1 IntroductionGood practice dictates that any set of statistics should be accompanied by sufficientinformation about the sources and methods used for their compilation that allowsthem to be used appropriately and for correct inferences to be drawn from them. Inrecognition of this, many national statistical institutes have developed generalisedquality frameworks to be completed for each of their statistical series. Examplesinclude Statistics Canada’s Data Quality Framework and the US Bureau of theCensus’s Quality Profile. These ensure that comparable and consistent informationis available on each statistical output from which the user can judge their fitness forpurpose.
Given the complexity of income distribution statistics, the wide range ofdefinitions that can be used and the level of error or uncertainty to which the resultsare prone, ready availability of such information – metadata – is doubly essential.The user must be able to judge the fitness for purpose of a set of income distributionin the particular context in which they wish to use them. Without full documentation,misinterpretations and misuse can all too easily take place.
The Canberra Group developed a Robustness Assessment Report (RAR) whichshould encapsulate the information needed to assess fitness for purpose. This drewon Luxembourg Income Study (LIS) Technical Documentation and on workcommissioned by Eurostat. The RAR template is reproduced in Appendix 6 anddiscussed in this chapter, as are the different types of reporting that may beappropriate at different stages in producing and using income distribution statistics.Examples of completed templates for a variety of countries may be found on theLIS website (www.lis.ceps.lu/canberra.htm).
8.2 Guiding principlesAny person or institution who publishes income distribution statistics has aresponsibility to assess whether their results give a true and fair picture of thoseaspects of income distribution which they are reporting on. However, any individualperson or institution would find this too large and difficult a task, if they had to workalone. Assessments in publications which provide results need to be able to draw on‘primary’ assessments for each country/database. Chapters 4 and 5 suggested that

Chapter 8: Robustness Assessment Reporting
104 The Canberra Group
some assessments can best be made by those who produce the income distributiondatabase or the primary income distribution statistics in a country.It is therefore recommended that these database/primary statistics producers:
• identify and quantify the groups excluded from the database; and, if possible, reporton their estimated incomes and living standards;
• describe in detail the data source from which the estimates are derived, the datacollection methodology, and any features which may mean that estimates are biased;
• assess the nature and size of response biases;
• report on data editing and imputation: the rules applied; the impact on reportedincomes at the extremes of the income distribution; any potentially significantdifferences between the pre- and post-editing and imputation income distributionfor specific groups; whether direct taxes have been imputed, in calculating netincomes; and any uncertainties about the validity of any imputations which aresubstantial in extent;
• define the terms used – for example, the term ‘disposable income’ may represent awide variety of income definitions;
• report on the sensitivity of results to different assumptions, for example differentequivalence scales;
• include comparisons with other sources of similar estimates, highlighting any wherealternative sources provide substantially different results and if possible identifyingwhy this should be so;
• reference relevant previously published methodological work;
• report on how/if data have been grossed, and on comparisons between the grossedincome micro-data and National Accounts income estimates, allowing as far aspossible for differences in coverage, definitions and time periods.
Additionally, the primary producers of income distribution statistics in a countryshould identify:
• any changes, either in the coverage of income components in the data whichunderpin the statistics, or in the extent to which particular goods and services havebeen financed from disposable income;
• any groups for which income data are known or thought to be a poor guide to theircontemporary living standards; this should include statements on the self-employedand those at the very bottom of the reported income distribution: either statementsreflecting assessments made for the country in question, or - if no assessment isavailable – a caution that evidence from other countries suggests that, for thesegroups, income data may be a poor guide to living standards;
• any substantial price or price-index differentials which are sufficiently large toundermine the validity of income comparisons for some groups;
• any other factors (besides those listed above), either in the dataset or in the socialpolicy environment, which producers of income distribution analyses need to beaware of.
All these factors are covered in the RAR template. They are very similar to therecommendations on robustness reporting made in the 1998 report of Eurostat’s TaskForce on Social Exclusion and Poverty.
For each dataset, as well as a detailed Robustness Assessment Report on theseissues it is suggested that a one page summary be prepared, highlighting the mostimportant problems with income distribution statistics from that dataset. The examplebelow is a summary prepared for a hypothetical household income survey.
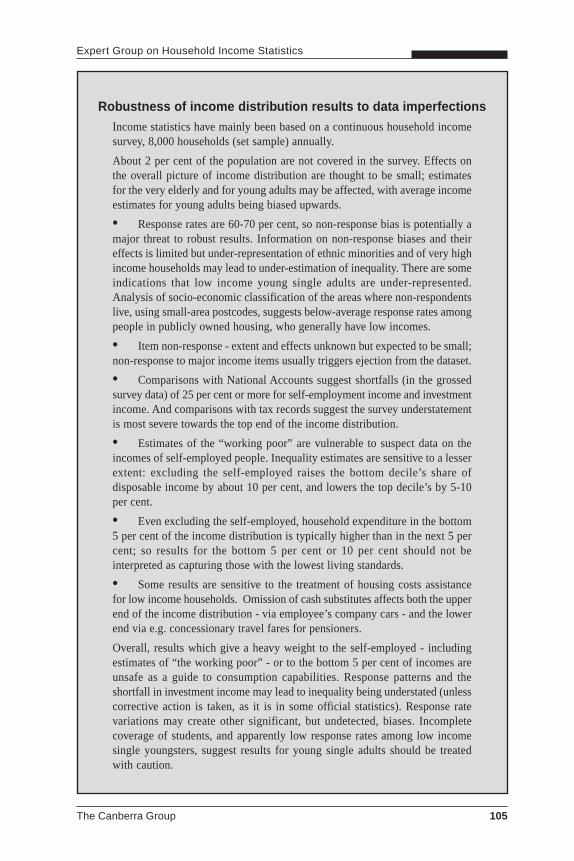
Expert Group on Household Income Statistics
The Canberra Group 105
Robustness of income distribution results to data imperfectionsIncome statistics have mainly been based on a continuous household incomesurvey, 8,000 households (set sample) annually.
About 2 per cent of the population are not covered in the survey. Effects onthe overall picture of income distribution are thought to be small; estimatesfor the very elderly and for young adults may be affected, with average incomeestimates for young adults being biased upwards.
• Response rates are 60-70 per cent, so non-response bias is potentially amajor threat to robust results. Information on non-response biases and theireffects is limited but under-representation of ethnic minorities and of very highincome households may lead to under-estimation of inequality. There are someindications that low income young single adults are under-represented.Analysis of socio-economic classification of the areas where non-respondentslive, using small-area postcodes, suggests below-average response rates amongpeople in publicly owned housing, who generally have low incomes.
• Item non-response - extent and effects unknown but expected to be small;non-response to major income items usually triggers ejection from the dataset.
• Comparisons with National Accounts suggest shortfalls (in the grossedsurvey data) of 25 per cent or more for self-employment income and investmentincome. And comparisons with tax records suggest the survey understatementis most severe towards the top end of the income distribution.
• Estimates of the “working poor” are vulnerable to suspect data on theincomes of self-employed people. Inequality estimates are sensitive to a lesserextent: excluding the self-employed raises the bottom decile’s share ofdisposable income by about 10 per cent, and lowers the top decile’s by 5-10per cent.
• Even excluding the self-employed, household expenditure in the bottom5 per cent of the income distribution is typically higher than in the next 5 percent; so results for the bottom 5 per cent or 10 per cent should not beinterpreted as capturing those with the lowest living standards.
• Some results are sensitive to the treatment of housing costs assistancefor low income households. Omission of cash substitutes affects both the upperend of the income distribution - via employee’s company cars - and the lowerend via e.g. concessionary travel fares for pensioners.
Overall, results which give a heavy weight to the self-employed - includingestimates of “the working poor” - or to the bottom 5 per cent of incomes areunsafe as a guide to consumption capabilities. Response patterns and theshortfall in investment income may lead to inequality being understated (unlesscorrective action is taken, as it is in some official statistics). Response ratevariations may create other significant, but undetected, biases. Incompletecoverage of students, and apparently low response rates among low incomesingle youngsters, suggest results for young single adults should be treatedwith caution.

Chapter 8: Robustness Assessment Reporting
106 The Canberra Group
Primary producers have particular responsibilities when reporting on incomedistribution estimates which form – or could be used to form – a time series fromwhich inferences about trends may be drawn. In this case there is a responsibilityto draw special attention to changes in any of the characteristics listed above whichmay affect the appropriateness of making comparisons with estimates alreadypublished for previous years. Primary producers should:
• assess the robustness of results each time a new set of estimates is published;
• draw attention to changes in definitions, survey coverage, imputation practices,survey practices (eg introduction of computer-assisted interviewing), etc, which mayaffect the comparability of the new estimates with those for previous periods
• make available an assessment of the impact of these changes on comparability.
Producers of secondary analyses of income distribution should:• assess the robustness of their results, given the general findings made available from
the primary producers;
• consider whether their audience will interpret ‘income’ in the way that matchesthe income definition employed; and if necessary, assess the robustness of theirresults in relation to the choice of definition;
• test their results against a range of alternative equivalence scales (and, if relevant,price indices);
• and then report, alongside their income distribution results, whether those resultscan confidently be said to give a true and fair picture of the answers to the questionsaddressed in the publication.
It is helpful if both primary and secondary producers of income distributionstatistics make available to the analyst a summary bibliography of any importantstudies that they are aware of which analyse sources of error affecting incomedistribution statistics or that present research having a bearing on their interpretation.
Different forms of reporting are likely to be appropriate for different types ofpublication. For example, the 1998 Eurostat Task Force report distinguished between:
• press releases and other brief publications which present ‘headline’ results only
• more detailed reports
• Compendium, anthology or omnibus publications
and made recommendations on how, in each context, to report on the reliabilityof results. These are reproduced in Appendix 7.
For short summary reports, if the findings reported are restricted to those knownto be robust, then it may not be necessary to discuss robustness. If most of the resultsin a table are robust, it may be appropriate just to mark those results that are not.
WE RECOMMEND THAT INCOME DISTRIBUTION DATASETS BEALWAYS ACCOMPANIED BY ROBUSTNESS ASSESSMENTREPORTS AS SET OUT IN THE TEMPLATE CONTAINED INAPPENDIX 6, SO THAT USERS MAY JUDGE THEIR FITNESS FORPURPOSE

Chapter 9
Issues forthe Future
The Canberra Group 107
9.1 IntroductionThese guidelines have been based on current best practice and have been formulatedin the context of current economic and social conditions. The Canberra Grouprecognised that neither of these is static, and that guidelines such as these have tobe subjected to periodic review and update, in the best traditions of similar guidelinessuch as the System of National Accounts and other international standards. It is thehope of the Canberra Group that the international statistical community will not onlyadopt these guidelines but that they will also ensure that they are kept up-to-datewith developments in both the practice of income distribution compilation and inthe economic and social realities that they are called upon to illuminate.
WE RECOMMEND THAT THESE GUIDELINES ARE PERIODICALLYREVIEWED TO ENSURE THAT THE ADVICE IS KEPT UP-TO-DATEWITH DEVELOPMENTS IN THE PRACTICE OF INCOMEDISTRIBUTION COMPILATION AND IN THE ECONOMIC ANDSOCIAL CONTEXT IN WHICH THE STATISTICS ARE USED
However, some of the issues which will have to be confronted in the future inthe field of income distribution were raised in the Canberra Group. It was not anobjective of the Group to resolve them. They are set out in this chapter as a sort ofaide memoire in the hope that they might be taken up by similar groups or in otherfora in the future. However, this is not an exhaustive exposition of all the challengeswhich are facing or in the future will face those who try to measure household incomeand its distribution. They are those which emerged in the course of discussion asbeing of qualitative and quantitative importance, but up to now countries have notfound a satisfactory empirical solution to their measurement, or at least not one whichhas been widely accepted.
The issues fall into two groups:• those which are already affecting the way in which the concept of household
economic well-being is interpreted but for which generally acceptable measureshave not yet been developed;
Chapter 9: issues for the Future
108 The Canberra Group
• external developments in economic and social conditions which are likely in duecourse to require statisticians to revise their concepts and therefore also theirmeasures of household economic well-being.
These two groups of issues are discussed in sections 9.2 and 9.3.
9.2 Where next for household economicwell-being?
Three particular topics emerged as needing resolution if measured household incomeis to continue to capture what contemporary society views as ‘economic well-being’.They are:
• transfers between and within households
• relationships between income, expenditure and wealth
• non-monetary income produced and distributed through the production of goodsand services within the household economy.
All three have already been discussed in these guidelines but they have generallybeen viewed as out-of-scope at the present time. This is not because they are notseen as important, but because more research and discussion by the internationalstatistical community are needed before it would be possible to extend practicaldefinitions in these directions.
9.2.1 Transfers within and between householdsThe transfer of resources within the household is an issue of growing importance tothose concerned with social welfare. Chapter 3 recommends that the household shouldbe the preferred unit of analysis for the study of income distribution, and indeedthis accords with current best practice: the vast majority of income distribution studiesassume that all resources are shared equally between family or household membersfor good theoretical and practical reasons. However, this is to some extent a ‘secondbest’ solution. It implies that there are no inequalities resulting from unequaldistribution between members of households. Evidence from a limited number ofsurveys suggests that this assumption does not accord with the reality of householddynamics in a significant number of situations. Factors such as economic power,source of income (eg own earnings, own receipt of government transfers), and anindividual’s own needs, influence intra-household distribution. As a result, individualhousehold members often fare better or worse than the average member. However,we have very little understanding of how households distribute aggregate incomeamong their members to maximise household welfare, a process that is certainlyhighly culture-specific.
What is certain is that the measurement of intra-household transfers is verydifficult indeed at the present time, and much more research is needed beforeestimates could be made with any confidence. However, such research is increasingin priority in order to understand better the relationship between gender roles, childwelfare and poverty. And the distribution of intra-household transfers can providevaluable information on how social assistance programmes for poor families mightbest be designed in the future.

Expert Group on Household Income Statistics
The Canberra Group 109
It is worthwhile noting that the fact of unequal sharing between members of ahousehold is implicitly recognised by the government social assistance systems insome countries, when child assistance is paid to the child’s mother rather than theirfather.
In these guidelines, irregular inter-household transfers have been excluded fromthe income definition constructed in chapter 2, and even for regular transfers wehave seen that in practice countries usually record those received but rarely thosepaid. However, in many societies remittances given to and received from familymembers outside the household have an equal status to transfers within the household.These may even include cross-border flows where there is a tradition of migrantworking. In some developing countries these remittances can account for sizeablefractions of household income and to ignore them is to produce inaccurate estimatesof the individual welfare of both giver and receiver.
9.2.2 Relationships between income, expenditureand wealth
As established at the outset of these guidelines, income is most often considered tobe the best (or least worst) measure of individual welfare or utility. However, bothconsumption and wealth are important complementary measures of economic well-being. Whereas income data indicate the living standard that the recipient couldprudently afford, consumption data can give a more direct picture of how they actuallylive. Ownership of wealth not only provides the potential for future consumptionbut assets – or lack of them – may restrict the owner’s access to credit and thereforeaffect their current consumption as well. Very little is known about the way in whichwealth is shared within households. The issue of intergenerational transfers of wealththrough inheritance and their effect on wealth distribution is also of growingimportance.
Thus income is inextricably linked with consumption and wealth. Chapter 2developed a conceptual framework in which income, consumption and accumulationcan be related to each other, but this framework has not been developed towardspractical implementation in these guidelines. It is rare to have available fullyarticulated survey data covering all three aspects. Integrated income, expenditureand wealth surveys are conducted in some countries and some also collect data onsavings, other capital transactions and on net worth. However, even when a full setof such data are available for a single household it may often be difficult to reconcilethem in a balance sheet sense, because of different recall periods, reporting unitsand so on. Where countries have tried to do this, their experiences could be instructivein finding a practical way forward towards more consistent data across all threeconcepts.
For some purposes, one might want to include in the estimation of consumptiona measure of the flow of services from durable goods purchased in an earlier period.The inclusion of an imputation for the flow of services from an owner-occupieddwelling has already been extensively discussed from the income perspective, butthere remain questions about how much further this treatment should be extendedto other goods such as cars and other consumer durable goods.
Chapter 9: issues for the Future
110 The Canberra Group
The treatment of irregular inter-household transfers in kind – gifts – is anotherissue raised but not resolved in Chapter 2. The suggestion there is to treat suchitems as transfers of expenditure in that they are part of the recipient’s consumptionbut the donor’s expenditure. However, this is a novel idea and has still to be fullytested both practically and conceptually.
There is therefore a considerable research agenda here, complementary to thatpursued by the Canberra Group in respect of income.
9.2.3 Non-monetary income from household productionIn Chapter 2, the imputed value of the goods and services produced and consumedwithin the household was included in the definition of income, as part of imputedself-employment income. The value of consumption of own production of goods iswithin the production boundary as defined in the SNA and most countries – certainlyin the developing world - make estimates of this item in aggregate, though as wehave seen in Chapter 4 data may not be available at the micro level. The value ofthe production of paid domestic services is also within the SNA production boundaryand should also appear in the micro-data in the form of income in kind and in cash.The third type of household production consists of formal and informal unpaidvolunteer services and those other domestic and personal services that are consumedwithin the household, which are explicitly excluded from the SNA productionboundary. In Chapter 2, they were excluded from the definition of income.
Among the services produced and consumed within the household, a furtherdistinction can be made between ‘personal services’ (mainly physiological andrecreational such as eating, sleeping, exercising etc) and the rest. ‘Personal services’are defined as those services consumed by an individual that cannot be performedby anyone else for them. The remaining domestic and personal services, such asdoing laundry, cooking meals, caring for adults and children, household upkeep andmanagement, as well as unpaid volunteer services could be delegated to someoneelse while achieving the desired result, if circumstances such as income, marketconditions and personal inclinations permitted. These have been termed productiveunpaid household services, but are outside the SNA production boundary.
Although work to assess the importance of this production began as long agoas the 1920s in academic circles, it has only recently been gaining wide acceptance,with the integration of relevant data collection activities, particularly time use surveys,into national statistical programmes. It has been recognised in many fora that thereis a need to take account of non-SNA production in national policies as well as ofits implications for development planning and programming. It is particularlyimportant in making visible the unpaid work of women especially, but also of men,and their contribution to economic and social well-being. Two basic approaches havebeen put forward for valuing this production: the direct assessment of the labourinput (the input-based approach), or the valuation of the outputs produced (the output-based approach).
In the input-based approach, the amount of labour time expended on non-SNAproduction is assessed – usually through a time use survey – and then multiplied bysome wage rate to impute an income to this production. However, there is as yetno generally accepted method for determining appropriate wage rates. For example,one could use the opportunity cost of the time of the person performing theservice – ie the wage rate they could command in the labour market based in their

Expert Group on Household Income Statistics
The Canberra Group 111
personal characteristics. The difficulties in this approach can be easily seen whenone realises that the same service – say cooking a meal – would be valued verydifferently according to who performed it. Alternatively, one could use the marketwage rate of a specialist who provides a similar service in the market – for examplea domestic cleaner or a cook. However this ignores the differing skill levels of aspecialist and the domestic amateur. The third option, most widely accepted, is touse the wage rate of a general purposes domestic employee whose level ofproductivity and range of tasks matches most closely the unpaid worker, though evenhere there are difficulties of applicability and of obtaining suitable wage rate data.Further variations on these three methods exist. In addition there is the difficulty ofwhether wage rates net or gross of income tax and social contributions should beused.
For the output-based measure, the outputs of the service provided – the meal,the clean house etc – are valued at equivalent market prices and then the value ofintermediate inputs (foodstuffs, cleaning materials, electricity etc), of capitalconsumption and, in theory, of any indirect taxes, are subtracted to obtain the incomefrom the service element only. This method requires the identification andquantification of the outputs and then their valuation at the prices at which thehousehold sold part of the output or at the prices at which they can buy an equivalentproduct in the market. This valuation can be problematic, for example because ofthe difficulty of matching some of the household outputs with market counterpartswhen exact or even approximate equivalents do not exist in the market.
One of the major uses to which statistics on household production may be putis in the construction and analysis of household satellite accounts. To construct suchaccounts, the principal functions of households in the household economy are takenas: providing housing, clothing, meals and care. These functions lead to theproduction of goods and services that are consumed by the household itself. Volunteerwork is also included though its output is consumed outside the household. Thevalue of the goods and services produced is computed in one of the ways suggestedabove. A number of countries have begun to produce such accounts, at least on anexperimental basis.
Given that, at least in principle, monetary estimates of the imputed value ofincome from household production can be derived, the issue is then how might onedeal with this large volume of non-market income in the preparation of statistics ofincome distribution. It seems highly likely that its distribution across householdsand individuals will be different from that of money income and that consequentlymeasures of income distribution and inequality may change substantially. How couldsuch results be interpreted in terms of analysing household economic well-being?
The international statistical community has yet to reach a shared understandingon definitions and methods in this area. However, it is a topic which has grown greatlyin prominence over the recent years and international collaboration and discussionwill be required if the result in a few years time is not to be similar to the currentsituation for the distribution of market income – ie divergence of national andinternational practices and hence lack of internationally comparable statistics.

Chapter 9: issues for the Future
112 The Canberra Group
9.3 Challenges for income measurement fromeconomic transformation
There are many changes taking place today in economies and societies across theworld which challenge current concepts and methods for the measurement ofhousehold income and wealth. This section presents a very small subset of thesechanges, identified by the Canberra Group as of quantitative and qualitativeimportance but for which, as yet, no empirical solutions have been found. As insection 9.2, there is no attempt to be exhaustive. However, it is hoped that this smallselection will give some indication of the challenges that lie ahead for practitionersin this field.
Two changes have been selected:• Changes in the role of the public and private sectors
• The fundamental role that micro-enterprises and self-employed play in the labourmarket
In the future, the quality of income distribution measurement will depend onfinding satisfactory solutions to the theoretical and operational problems they pose.
9.3.1 Changing role of the public and private sectorsAcross the world, the public sector is gradually withdrawing from activities relateddirectly to the production of goods and services but instead playing an increasedregulatory role. In the area of social public expenditure, the principle of solidarityhas lost ground to the principle of individual accountability and the private sector isplaying an increasingly important role. In many countries, there is a tendency toreplace in-kind public services (eg health, education) by monetary transfers to beused to purchase a similar service in the market. The belief is that efficiency willimprove and the recipient will also gain through being able to choose their servicesupplier.
The changing roles of the public and private sectors in relation to pensionprovision will have an important impact on the way in which social insurance andnon-employee pensions schemes are dealt with in the future. Whenever an individualfinancial fund is established, and when the value of that fund is related to that offunds with variable value and interest, many problems of statistical measurementarise. Furthermore, it is not always easy for the owner of the fund to have a clearpicture of its financial state at any point in time.
The difficulty of valuing the benefits of social transfers in kind has already beendiscussed at length in Chapter 2 and again in Chapter 4. If the present trend towardsprivate provision of these services continues and if the financing of these serviceschanges from present patterns, a different set of challenges will emerge. At present,private health insurance is common in some countries and private education isincreasing in importance. The valuation and distribution of individually purchasedservices of this kind are certainly easier to measure at the micro level. However,where there is a quality difference between the publicly and privately providedservice, this also will need to be reflected in some way.

Expert Group on Household Income Statistics
The Canberra Group 113
Thus if the importance of the private sector involvement in the provision of socialbenefits increases, the system of accounting of the private sector will also increasein relevance. In many ways this is a quite different financing system and statisticalmeasures will have to evolve accordingly.
9.3.2 Informal sectorEmployment in micro-enterprises, especially in the informal sector, has increased athigh rates in many countries in the last twenty years. Although total income frominformal sector enterprises may be small compared with income from other sourcesin the economy as a whole, it nevertheless represents a very large percentage of thetotal income of those households engaged in the sector. When this is taken inconjunction with the high proportion of the population employed in the sector, it isplain that the accurate measurement of informal sector income is of importance inthe evaluation of household income especially at the lower end of the distribution.Better measurement of informal sector activity is one of the keys to betterunderstanding of the size and nature of illegal activity in an economy.
Due to the nature of informal sector enterprises, this measurement has howeverposed difficulties which have proved intractable, and so remains a major challengein the assessment of income distribution. OECD is about to publish a manual onthe informal sector.
These challenges have also been taken up by another City Group, the DelhiGroup on Informal Sector statistics, as they affect developing countries. Thequestions studied by the Delhi Group include:
• How to identify the informal sector – in terms of the work arrangements of thoseemployed? the ‘informal’ characteristics of the enterprise (for example lack ofseparate accounts)? its relationship with the concept of ‘unregistered’ ,‘unrecorded’, ‘unobserved’ (the latter including enterprises engaged in illegalactivity for example)?
• Difficulties of direct measurement through surveys, because of the heterogeneityof the sector, short lifetimes of individual enterprises, mobility of location,seasonality of operation, and so on.
By its very nature, informal sector activity is difficult to capture throughconventional data collection methods. The owner of such a business is unlikely tofile tax records so may have no need to produce conventional accounts and may thusfind it difficult to provide estimates of their profit or loss. Record-keeping of anykind may not exist. This will affect the reference period over which it is practical toask survey respondents to recall their incomings and outgoings in respect of theirbusiness activity. Their expenditure for business purposes may in any case be difficultto distinguish from household expenditure.
Clearly there is a need for further development and testing of possiblemethodologies for estimation of income from informal sector activity. Unless asignificant effort is made, data on this type of income will not be available and,therefore, income distribution estimates will lack a very important component.


Appendix 1
Definitions ofthe Components
of Income
The Canberra Group 115
1. EMPLOYEE INCOMEEmployee income is the sum of remuneration received from an employer inboth cash and non-cash form.
Cash or near cash
1.1 Cash wages and salaries
Includes:Wages and salaries paid in cash for time worked or work done in all jobsRemuneration for time not worked (such as annual holidays)OvertimeFees paid to directors of incorporated enterprisesPiece rate paymentsSums paid for fostering children, even though the payments may be madeout of a government assistance programme (regarded as payment for labour)
Additional commentsPayment for fostering children is included because it is viewed as being moreakin to a payment for services provided by the household, rather than a socialtransfer.Any reimbursements for work expenses from an employer should be deductedif paid with wages and salaries (eg business travel and accommodation costs)
1.2 Tips and bonuses
Includes:Tips and gratuitiesThirteenth month paymentBonuses paid in cash
Appendix 1
116 The Canberra Group
1.3 Profit sharing including stock options
Includes:Benefits based on profit sharing, excluding cash bonuses
Additional commentsStock options are included here, even though in some cases they cannot beconverted into cash income until sometime after they have been transferredto the employee. There is ongoing debate about the correct value to be givento stock options.
1.4 Severance and termination pay
Includes:Payments designed to compensate for employment ending before theemployee has reached the normal retirement point for that job.Redundancy payments
Excludes:Lump sum payments paid at the normal retirement date, which are regardedas capital transfers.
Additional commentsThe normal retirement point is likely to vary between jobs. For example, it iscommon for members of the armed forces and police forces to be entitled toretirement pensions and other benefits at a relatively early age. Severance/redundancy pay is typically payable when an employee leaves an employerbefore the normal retirement age depending on contractual arrangements.
1.5 Allowances payable for working in remote locationsetc, where part of conditions of employment
Includes:Allowances paid to cover expenses such as living in special quarters or in aspecial when relocation is part of the conditions of service of the job.
Excludes:Allowances for purely work-related expenses such as those for travel andprotective clothing (regarded as a cost to the employer)
Additional commentsThis item covers allowances made to military and other employees on specialpostings. If the income estimates are being compared to expenditure estimates,the expenditure estimates should exclude the corresponding purely work-related expenses.

Expert Group on Household Income Statistics
The Canberra Group 117
Cash value of ‘fringe benefits’
1.6 Employers’ social insurance contributions
Includes:Employers’ contributions to private retirement (pension) plansEmployers’ contributions to private health insuranceEmployers’ contributions to life insuranceEmployers’ contributions to other employer insurance schemes (e.g. Disability)Employers’ contributions to government insurance (social security) schemes(including payroll taxes levied for social insurance purposes)
Additional commentsSome employers, especially government employers, operate unfunded socialinsurance schemes, that is, they pay out pensions and other benefits on anas-required basis without explicitly setting aside appropriate funds at the timethe liability arises. The potential economic well-being of employees for whomsocial insurance contributions are made is clearly greater than for those forwhom contributions are not made, but whose income is identical in all otherrespects. In such cases, this item requires a notional liability to be estimated.The item is included in the definition of total income, but a correspondingamount is subtracted as a transfer paid when deriving disposable income.
Practical implementationEmployees for whom employers are making social insurance contributionsoften do not know the size of the contributions, and so cannot provide theinformation in household surveys. This is certainly the case where theemployer operates an unfunded scheme. Therefore this item will often haveto be estimated by simulation modelling and/or by obtaining data from thesocial insurance funds directly. For successful modelling to be undertaken, itmay be necessary to collect certain indicative data items from respondents.Given the difficulties of estimating this item, it may not be possible to do sowith the same frequency with which some other income components areestimated. However, it is an important item when analysing incomedistributions. Firstly, it is likely that including this item will increase the spreadof the income distribution because it is a form of remuneration likely to befavoured by those who already have relatively high cash incomes. Secondly,it is likely that this item is becoming more important over time as so-called‘remuneration packaging’ increases. Thirdly, the extent of this form ofremuneration packaging is likely to differ between countries because ofdiffering taxation and other institutional factors.

Appendix 1
118 The Canberra Group
1.7 Goods and services provided to employee as part ofemployment package
Includes:Value of transport, telephone bills, housing, medical expenses, low interestsubsidy on finance, child care, subsidised vacations, etc enjoyed by theemployee but paid for by the employer. (Where employee expenditure issubsidised, rather than paid for in full by the employer, only the employer’scontribution is included here.)
Excludes:Employer’s social insurance contributions, which are included as a separateitemPurely work-related expenses (regarded as a cost to the employer)
Additional commentsIn some cases, the employee may receive cash payments under this item, butit will normally be as reimbursement or part-reimbursement for expenditureon a specific form of good or service, and therefore the benefit can be seenas the provision of goods and services by the employer. Thus the item coversall the items which may be given to an employee as part of the employmentpackage but which cannot be translated into money that is freely availablefor any purpose of the employee’s choice.
2. INCOME FROM SELF-EMPLOYMENTIncome from self-employment is income which is in part a return to labour,but is not employee income. It also often includes a significant proportion ofincome that is a return to capital invested in unincorporated enterprises (andhence is called ‘mixed income’ in the SNA).
Cash or near cash
2.1 Profit/loss from unincorporated enterprise
Includes:Net operating profit or loss accruing to working owners of, or partners in,unincorporated enterprises
Excludes:Directors fees earned by owners of incorporated enterprises, which are treatedas employee incomeDividends earned by owners of incorporated enterprises, which are includedin property incomeProfits from capital investment in unincorporated businesses (by ‘sleepingpartners’), which are included in property income

Expert Group on Household Income Statistics
The Canberra Group 119
Rental and royalty income, which are included as separate items
Additional commentsNet operating profit or loss is gross revenue minus operating costs, wagesand salaries paid to employees, including social contributions, taxes paid onproduction and imports, interest paid on business loans, and depreciation offixed assets. Net operating profit includes in kind goods and services takenout of the enterprise by the owners or partners. Gross revenue includessubsidies received.A loss is treated as negative income.Some countries will find it useful to distinguish the income of farmers fromother self-employed income.
Practical implementationInterest payments should always be recorded as a separate item if at allpossible to maximise the scope for editing and reconciling data internally andreconciling at an aggregate level with national accounting data and the like –see discussion under 4.1.
2.2 Royalties
Includes:Royalties earned on writings, inventions and so on not included in profit/lossof unincorporated enterprises
Additional commentsRoyalties are regarded as income from self-employment because they are areturn to the royalty-holder for effort expended.
In kind, imputedHouseholds not only consume goods and services which they purchase fromothers, but also goods and services which they produce themselves or obtainthrough bartering. Valuation of those goods and services is inherently difficultbecause there is no market place transaction to which reference can be made.However, it is important that household production for own consumption orbarter is included in measures of income where they are a significant elementof economic well-being, as discussed below for the individual items. If theyare omitted, comparisons between countries, over time or between incomegroups are likely to be impacted.
The items included in imputed income are goods or services produced forbarter, goods produced for home consumption, and income less expenses fromowner-occupied houses.
Appendix 1
120 The Canberra Group
2.3 Income from goods and services produced for barter
Includes:Value of goods and services produced for exchange with another household,less expenses incurred in production.
Additional commentsInclusion of this item is particularly important in countries where the non-cash economy is significant.
Practical implementationThere should be a corresponding item in any household expenditure estimatesthat are compared with household income estimates.In practice, bartered production may not be easily distinguished from ownaccount consumption and the bartering process may be recorded as giftsbetween households. Further practical difficulties may arise if barteringinvolves a mix of final consumption and intermediate consumption, forexample, if milk is bartered for seeds for planting.
2.4 Goods produced for home consumption
Includes:Value of goods produced and consumed within the household less expensesincurred in production.
Additional commentsInclusion of this item is particularly important in countries where subsistenceagriculture is significant.
Practical implementationThere should be a corresponding item in any household expenditure estimatesthat are compared with household income estimates.
2.5 Income less expenses from owner-occupied dwellings
Includes:The imputed value of the services of the services provided by a household’sresidence after deduction of expenses, depreciation and property taxes.
Additional commentsThe treatment of housing presents difficulties in compiling data for comparisoneither over time or across countries. Some people own a house outright andthus have no regular outgoings for housing. Others live in subsidised housingand have comparatively small outgoings. Often it is some of the pooresthouseholds who live in rented accommodation and have to face the highestrental costs.In order to even the treatment of housing, the SNA treats every house owneras an unincorporated enterprise which leases the house back to household.

Expert Group on Household Income Statistics
The Canberra Group 121
The value of the lease is set at the market rent for a similar house and theimputed income is equal to this value less the costs incurred by the householdin their role as landlord.
Practical implementationThe value of the rent of owner occupied dwellings should in principle be themarket rental value of an exactly similar house. As the rental values of housesdepends critically on location and the rental market may be very shallow inmany areas because few houses of the same type or in a particular region arerented, it can be difficult to determine appropriate market rents to be used inestimating this item. Particular problems can be expected in remote ruralareas and also in shanty dwellings around the large urban areas of developingcountries.The value of the income from the rent is estimated as the imputed rental valueless input costs, including maintenance. As with the costs of material forown-account production, the input costs of expenses, depreciation and propertytaxes should be excluded from consumption expenditure. While it is not likelythat estimates of consumption expenditure would include depreciation, carehas to be taken that they do not include expenses incurred by owner occupierssuch as the purchase of repair materials from hardware stores.If interest paid on loans used to purchase owner-occupied dwellings cannotbe estimated separately from other forms of interest paid such as that onconsumer debt, the combined item should be included as negative propertyincome, thereby offsetting interest earned in the property income aggregate.
3. INCOME LESS EXPENSES FROM RENTALS,EXCEPT RENT OF LAND
Includes:Rentals from dwellings, business buildings, vehicles, equipment, etc notincluded in profit/loss of unincorporated enterprisesReceipts from boarders or lodgers
Excludes:Rent from land
Additional commentsIn the macro accounts, rental income other than for land is regarded as incomefrom self-employment because of the significant entrepreneurial effort usuallyrequired to acquire or create and then to maintain the rented items. In contrast,rent from land is regarded as property income. However, current practice inthe micro statistics in many countries is to treat rental income as propertyincome. Thus in the framework set out in Table 2.1, it is shown as a separatecategory to allow either treatment.

Appendix 1
122 The Canberra Group
Practical implementationIn practice, the rent of land that has buildings on it cannot usually be separatedfrom the rental value of the buildings themselves. Therefore this item willnormally include all rental income except rent for agricultural land.In practice, it may not be possible to obtain estimates of rental income forsome unincorporated enterprises separately from aggregate profit or loss. Ifthis occurs, then the income will be aggregated to income from self-employment.
4. PROPERTY INCOME RECEIVEDProperty income represents the receipts less expenses accruing as a result ofputting assets at the disposal of another, for which there is a monetary return.However, see the discussion of imputed return accruing to owners of owner-occupied dwellings, under 2.5 above.
4.1 Interest received less interest paid
Includes:Interest received not included in profit/loss of unincorporated enterprisesInterest received from assets including bank accounts, certificates of deposit,bonds and the likePension or annuity income received in the form of interest from privateinsurance schemes where contributions to the scheme are not mandated bygovernment or associated with employer contributions to the scheme, that is,the contributions are entirely at the discretion of the contributor
Additional commentsIn principle, interest should be recorded on an accruals basis, that is when itis due to be received and not when it is actually received. This difference cansometimes be significant, but at a household level it is likely that only interestreceived can be estimated.In these Guidelines, the recommendation is to express income net of all interestpayments. It may not always be possible to obtain estimates of interest paidthat distinguish between interest relating to business loans (which is to beregarded as an operating cost in deriving profit or loss), interest relating tomortgages on owner-occupied housing, and interest relating to consumercredit. If interest paid on business loans cannot be estimated separately fromother forms of interest paid, the combined item should be included here asnegative property income, thereby offsetting interest earned in the propertyincome aggregate. Separate estimates of interest receivable and interest paidshould be made if at all possible, however.For some analyses it may be useful to identify interest on consumer debtseparately and deduct it not from income but at the same stage thatconsumption expenditure is deducted from disposable income to reach saving.In this case consistency with the SNA would be restored only with thecalculation of saving rather than being preserved more generally.
Expert Group on Household Income Statistics
The Canberra Group 123
4.2 Dividends receivedDividends represent the return to someone who has invested in an enterprisebut does not work in it themselves. For incorporated enterprises they willsimply be called dividends. For other enterprises they are referred to bynational accountants as withdrawals from non-corporate enterprises. This latterterm should include payments to sleeping partners.
Includes:Dividends paid by incorporated enterprisesIncome received from stock holdings and mutual fund sharesWithdrawals from non-corporate enterprises that are not included in incomefrom self-employment, such as payments to ‘sleeping partners’Pension or annuity income received in the form of dividends from privateinsurance schemes where contributions to the scheme are not mandated bygovernment or associated with employer contributions to the scheme, that is,the contributions are entirely at the discretion of the contributor
Practical implementationIn principle, dividends should be recorded on an accruals basis, that is whenthey are due to be received and not when they are actually received. Thisdifference can sometimes be significant, but at a household level it is likelythat only dividends received can be estimated.
4.3 Rent from land
Includes:Rent from land not included in profit/loss of unincorporated enterprises
Excludes:Rental income from buildings on land
Practical implementationSee discussion under 3 - Income less expenses from rentals, except rent ofland
5. CURRENT TRANSFERS RECEIVEDTransfers are payments and receipts which are made without a matching “quidpro quo” in the period in which they are paid/received – for example retirementpensions. They tend to be regular or predictable in certain circumstances, andoften are compulsory under law or some similar obligation. Both socialinsurance contributions and benefits are transfers. From the household’s pointof view, benefits are received (and contributions paid) whereas for the socialinsurance fund the direction of flows is reversed.
Appendix 1
124 The Canberra Group
Social insurance benefits – cash or near-cash
5.1 Social insurance benefits from employers’ schemesSocial insurance benefits are paid in return for contributions paid by, or onbehalf of, the recipient or their beneficiaries. With unfunded employmentrelated benefit schemes, the contributions may be notional but the maincriterion is that there is an obligation to pay an employment related benefit.
Includes:Employment related pensions and other insurance benefits paid from privateemployers’ schemes and government schemes run entirely for benefit ofgovernment employeesPensions and other benefits from overseas governmentsMilitary pensionsUnemployment, sickness, disability, medical, etc benefits paid from privateinsurance schemes that qualify as social insurancePayments for education of employees’ families that are part of theremuneration package
Excludes:Lump sum retirement payoutsBenefits from private insurance schemes where contributions to the schemeare not mandated by government or by an employer, that is, participation inthe scheme is entirely at the discretion of the contributor
Additional commentsSome social insurance schemes allow (or force) a participant to take someretirement benefits in the form of a lump sum payment, often at the date ofretirement. In such cases, subsequent regular payments are lower than theyotherwise would have been if no lump sum had been paid. The SNAprescribes that all retirement benefits be treated as social insurance benefitsand thus as current transfers. This avoids the need to obtain information onthe amount of lump sum and regular payments separately, and keeps allcontributions and benefits in the same account. However, for incomedistribution analysis it is preferable to treat lump sum payments as capitaltransfers because they are one-time, and thus this item appears in Table 2.2rather than Table 2.1.The benefits paid here correspond to the social insurance contributions coveredby that part of 7.1, Employers’ social insurance contributions, and 7.2,Employees’ social insurance contributions, which are paid into private socialinsurance schemes.Benefits from private insurance schemes where contributions are entirely atthe discretion of the contributor may either be non-life insurance and thereforeoutside the scope of income as defined in Table 2.1, or they may be akin topayments from an annuity or similar investment instrument. The latter shouldbe treated as property income and are included in either 4.1 or 4.2 above.

Expert Group on Household Income Statistics
The Canberra Group 125
Practical implementationWhen collecting data on social benefits in household surveys, it is advisableto have a comprehensive list of possible social benefit payments as a checklist.
5.2 Social insurance benefits in cash from governmentSocial insurance benefits are paid in return for contributions paid by, or onbehalf of, the recipient or their beneficiaries. With unfunded employmentrelated benefit schemes, the contributions may be notional but the maincriterion is that there is an obligation to pay an employment related benefit.
Includes:Employment related pensions and other insurance benefits paid fromgovernment schemes
Excludes:Payments from government schemes run entirely for benefit of governmentemployees. They are treated as employers’ schemes (see 4.1).Lump sum retirement payoutsMedical expenses reimbursed by government, which are treated as socialtransfers in kind.
Additional commentsThe benefits paid here correspond to the social insurance contributions coveredby that part of 7.1, Employers’ social insurance contributions, and 7.2,Employees’ social insurance contributions which are paid into governmentsocial security schemes. See also comment on lump sum retirement payoutsunder 5.1 above.
Practical implementationWhen collecting data on social benefits in household surveys, it is advisableto have a comprehensive list of possible social benefit payments as a checklist.
Social assistance benefits from government schemes –cash or near-cash
5.3 Universal (ie not means-tested) social assistancebenefits in cash from government
Includes:Age, widows, unemployment, sickness, disability, etc pensions and allowancesthat are not employment related or dependent on direct contributions to aninsurance scheme by the beneficiaryMaternity, family and child benefitsScholarships and other educational assistance from governmentReduction in interest on student loans where not means-testedTax credits (see discussion under 7.3, Taxes on income)

Appendix 1
126 The Canberra Group
Excludes:Rental allowances (housing subsidies)Medical expenses reimbursedOther social benefits in kind
Practical implementationWhen collecting data on social benefits in household surveys, it is advisableto have a comprehensive list of possible social benefit payments as a checklist.
5.4 Means-tested social assistance benefits in cashfrom governmentThis item covers those benefits paid by government to individuals, familiesor households whose income from other sources (and/or their savings) fallbelow certain levels.
Includes:Age, widows, unemployment, sickness, disability, etc pensions and allowancesMaternity, family and child benefitsScholarships and other educational assistance from governmentReduction in interest on student loans where means-testedTax credits (see discussion under 7.3, Taxes on income)
Excludes:Rental allowances (housing subsidies)Medical expenses reimbursedOther social benefits in kind
Practical implementationWhen collecting data on social benefits in household surveys, it is advisableto have a comprehensive list of possible social benefit payments as a checklist.
Private transfers in cash
5.5 Regular inter-household cash transfers received
Includes:Compulsory alimony and child support receivedVoluntary alimony and child support received on a regular basisRegular payments from households in other countriesOther regular income support payments from people living in otherhouseholds, such as received by children studying away from home or elderlyrelatives living in another household

Expert Group on Household Income Statistics
The Canberra Group 127
Excludes:Payments from relatives that are not for income support, for example,repayment of a loan
Additional commentsWhile there will be an element of arbitrariness in determining whethervoluntary support is provided on a regular basis or not, it is important toinclude the notion of regular voluntary payments because there are differentinstitutional factors between countries governing what is likely to be courtimposed and what is not. It would seem logical that payments should becovered even if not paid under a court order as long as they are regular andrecognised by the donor as exclusions from his/her regular disposable incomeand by the recipient as included in his/hers.In principle it may be desirable to include also regular payments to childrenstudying away from home and elderly relatives on the same basis, especiallysince different countries treat children studying away from home differentlywhen defining households.The counter-entry to this item is 7.5, Regular inter-household transfers paid.
Practical implementationWhatever practical implementation there is for this item, it is essential thatthe same implementation be used to collect data for item 7.5. If not, therewill be double counting or undercounting of disposable income.
5.6 Regular support received from non-profit institutionsincluding charities
Includes:Regular assistance provided by non-profit institutions serving householdsStrike pay from unions received on a regular basisScholarships from charitable trusts
Excludes:All lump sum and one-time payments
6. TOTAL INCOME
(sum of 1 to 5)Total income is the addition of all cash and non-cash receipts from entitiesoutside the household, including government, enterprises, non-profitorganisations and other households. It comprises income from employment,property income and transfers received. Total income also includes the imputedvalue of goods produced by the household for its own consumption andimputed rent of owner-occupied dwellings.

Appendix 1
128 The Canberra Group
Practical implementationSome elements of total income are much harder to estimate than others. Thefirst aim should be to include all the elements that represent cash flowsreceived by households. Priority should then be given to estimating the non-cash elements that are likely to have the biggest impact on income distributionanalysis in the country concerned. These issues are discussed in Chapter 4.
7. DEDUCTIONS FROM INCOME OF CURRENTTRANSFERS PAIDThis category of compulsory payments comprises mainly taxes on incomeand compulsory social contributions. These items (along with inter-householdfamily support paid) are deducted from total income to provide a measure ofdisposable income.
7.1 Employers’ social insurance contributionsThis item is identical to 1.6. These contributions are paid by employers onbehalf of employees and are treated as income from employment in the totalincome measure. They are deemed to be transferred immediately back todesignated social insurance schemes whether run by the employer or not. Theyare not therefore available for consumption during the accounting period.
Practical implementationHowever item 1.6 is implemented, the same treatment should be used here.
7.2 Employees’ social insurance contributions
Includes:Employees’ contributions to government and private social insurance schemes(pension, health, etc.) mandated by government or the employer
Excludes:Contributions to private social insurance schemes which are entirelydiscretionary on the part of the contributor
Additional commentsTotal contributions to social insurance schemes consist of that part paid byemployers (7.1) as well as that paid by employees (7.2).In some social insurance schemes, it is possible for employees to make highercontributions, complementary to those which are mandatory, as a form ofinvestment, in order to obtain higher benefits. In such cases it may not bepossible to differentiate between the mandatory and voluntary contributionsand both may have to be included here.
Expert Group on Household Income Statistics
The Canberra Group 129
7.3 Taxes on income
Includes:Income taxes less refundsCompulsory fees and fines for hunting, shooting and fishing
Additional commentsTo reconcile exactly with national accounts figures, income taxes should berecorded on an accruals basis. The most significant accruals adjustment isthe tax refund many households receive at the end of a fiscal year to rectifyoverpayment during the year. Other households may receive an additionaltax liability statement if there has been an underpayment during the year. Suchrefunds and additional liability statements should be deducted from or addedto tax payments. For self-employed persons, tax is sometimes payable onearnings in the previous year. In these cases it is the tax due in the currentyear which should be recorded, not the tax which would be due in thesubsequent year on the current year’s earnings.Although tax credits are sometimes set against tax receipts, this is not alwaysso and conceptually, and sometimes in practice, they should be treatedseparately from tax refunds. Tax credits, or tax allowances, serve to reducethe amount of tax payable. In macro data the amount of tax payable is givenonly after taking tax credits into account. For income distribution work, itmay sometimes be desirable to calculate what tax would have been payablein the absence of tax credits and show total tax credits as an off-setting itemin order to see the redistributional effects of different tax credit regimes.There may be cases for some households where tax credits exceed taxliabilities. In some countries this remaining credit is simply lost to thebeneficiary. In other countries, the remaining credit may be payable in cashto the beneficiary. In this case, the payments are shown as social assistanceand included in item 5.4, Means tested social assistance benefits in cash. Itis possible that in such cases, the macro data may not show these credits aspayable by the tax authorities who may net them against other tax receivable.Some fines and fees charged by government may be called taxes or commonlyreferred to as such. Because these vary so much from country to countryand the extent of service which may be received in return for paying the feevary so much, it has proved impossible to determine a persuasive criterionby which to determine what should be regarded as taxes and what as fees fora service. The convention adopted in the SNA is that fines and fees paid forhunting, shooting and fishing licences should be regarded as taxes and allother fines and fees paid to government should be regarded as payments fora service. These latter will then form part of the consumption expenditure ofthe household concerned. In practice, if a distinction between these fees andother fines and fees cannot be made in household survey data sources, it isunlikely that major errors will result.

Appendix 1
130 The Canberra Group
Practical implementationThe value of a household’s income tax liability may not be directly availablefrom the data used to compile income statistics, especially if annual data isnot being collected. Estimates of income tax payable will then have to besimulated. There are also difficulties in estimating tax payable by a householdwhen it is levied on individual income.In some countries it is easier to collect post-tax earnings, in which case incometax liability has to be calculated and added to the earnings figures in order toestimate total income.
7.4 Regular taxes on wealth
Includes:Land taxes (excluding those on agricultural land which are taxes onproduction)Taxes based on assets which are paid regularlyProperty taxes paid by tenants
Additional commentsTaxes on property paid by owner-occupiers or by land-lords out of rentalreceipts are classified as taxes on production and are one of the costs deductedin reaching a figure of income from imputed rent of owner-occupiers or ofrentals. If a tenant is responsible for paying property taxes directly and inaddition to rent, they are included in this item.Only those taxes on assets which are paid regularly are included here – forexample, taxes on ownership of assets such as cars and boats. Intermittenttaxes such as inheritance taxes are paid out of wealth and are thereforeincluded in Table 2.2 as wealth taxes.
Practical implementationFor tenants who are not liable to pay property tax separately, it is desirableto separate out the tax element from the rent but data limitations may preventthis – although the tax payments will be known by the landlord, they may beunknown to the tenant and therefore difficult to collect in a household survey.
7.5 Regular inter-household cash transfers
Includes:Compulsory alimony and child support paidVoluntary alimony and child support provided on a regular basisOther regular income support payments to people living in other householdsincluding those in other countries, such as children studying away from homeor elderly relatives

Expert Group on Household Income Statistics
The Canberra Group 131
Excludes:Payments to relatives that are not for income support, for example, repaymentof a loan
Additional commentsThis item is the counter-entry to 5.5, Regular inter-household transfersreceived.
Practical implementationWhatever practical implementation there is for 5.5, it is essential that the sameimplementation be used to collect data for the corresponding item undertransfers paid. If not, there will be double counting or undercounting ofdisposable income
7.6 Regular transfers to non-profit institutions includingcharities
Includes:Union dues, membership payments to charitable bodies (eg professionalsocieties)
8. DISPOSABLE INCOME
(6 less 7)When aggregated across households, total income includes a considerableamount of double counting. It includes both social insurance contributionsand benefits, and regular family support appears in the income of both thehousehold paying and the household receiving this support.Disposable income is defined as total income minus direct taxes andcompulsory transfers and inter-household family support payments. This totalacross all households eliminates double-counting for both individualhouseholds and for the economy as a whole. This concept of income providesa measure of those resources available for consumption and for discretionarysaving.
9. SOCIAL TRANSFERS IN KIND (STIK)RECEIVABLEThe items covered by social transfers in kind include individual services ofgovernment such as public health and education; provision of social securityand social assistance benefits in kind (some of these are also sometimesreferred to as consumer subsidies) and medical expenses which are initiallymet by individual households but are subsequently reimbursed by government.(This last is a very common means of financing medical services in somecountries, particularly in continental Europe.)

Appendix 1
132 The Canberra Group
Includes:Medical expenses reimbursed under government social insurance schemesMedical services provided under government social insurance schemesRental allowances (housing subsidies)Food subsidies or vouchersSubsidy element of publicly owned housingPublic educationMedical services (where not provided under a social insurance scheme)Cultural and recreational servicesTransport subsidies for particular categories of households (eg free or reducedprice travel for the elderly)
Excludes:The value of any nominal payments made by households for the services
Additional commentThe subsidy element of public housing should be estimated in a way analogousto the derivation of the rental value of owner-occupied dwellings.
10. ADJUSTED DISPOSABLE INCOME
(8 plus 9)Although the recipients of social transfers in kind have no choice about howto use the income equivalent of the transfers, by including the value of thetransfers adjusted disposable income relates to actual consumption in the sameway as disposable income relates to consumption expenditure.

Appendix 2
Reconciliation ofmicro-macro concepts
and terminology
The Canberra Group 133
1. IntroductionThe aim of this Appendix is to try to establish bridges between the micro and macroapproaches to categorising income and to establishing distribution of income acrosshousehold groups. First, the different categories of income and different ways ofbuilding income aggregates as set out in Table 2.1 are examined. The aim is to identifya series of “boxes” into which agreed types of income can be put so that they maybe assembled in different orders to meet the needs of different types of analysescoming from the two traditions. Then the different aggregates are examined to seehow far they can be harmonised either by determining a common basis or, wherethis is not suitable, at least be linked clearly. Lastly the reconciliation is extendedbeyond income to cover the consumption and accumulation of households, withreference to Table 2.2.
1.1 Type of income or means of paymentThe macro approach to household income statistics categorises income accordingto the type of transaction which gives rise to the flow without regard to the mediumin which the payment is made. The micro approach, based on the way householdsurvey data is collected, has the opposite orientation. The means of payment is themain discriminatory factor and the rationale for the payment is subsidiary. Thus thefirst step in trying to harmonise these two approaches is clearly to look at a two-dimensional categorisation where both source of income and means of payment aretaken into account. The four types of income are as follows:
i. flows coming from involvement in economic activity (production), for whichwage and salary earnings are prototypical;
ii. flows coming from the ownership of financial and other assets, such as interest,
iii. transfers of a compulsory nature such as taxes, and
iv voluntary transfers such as inter-household gifts and other receipts.
The seven means of payment areA. payments received, typically in cash, where the recipient is free to use them for
any purpose without restriction of any kind. They form the largest part of mosthouseholds’ income. For simplicity these will be referred to as receipts in cash;

Appendix 2
134 The Canberra Group
B. payments received as part of the employment contract but in such a way that therecipient has no choice about how they are spent. They include fringe benefitssuch as the provision of a company car and reduced cost travel or utilities. Thecar is typically provided without payment, the low-cost travel or electricity maybe first paid by the household then any excess reimbursed. For simplicity, thesepayments are referred to as receipts in kind;
C. there are other payments some of which are made to some employees as part ofthe employment contract, some from other sources, where the recipient has nochoice but to save the receipts. For simplicity these are referred to as receipts offorced saving;
D. some increases in welfare come from the production of goods for use by thehousehold. For these an imputation is made of an income equal to the value ofthe corresponding goods in the market-place less any direct costs involved inproducing the goods. The imputed rent of owner occupied dwellings(OOD) istreated in a similar way. These items are referred to as income from own accountproduction of goods and OOD;
E. for some measures of welfare, it may be interesting to include estimates of thevalue of services produced and used within the household. These are referred toas income from own account production of services;
F. another extension to the concept of welfare includes including in consumptionthe services provided free or at reduced cost by government to households,notably health, education, welfare and cultural services. These are called socialtransfers in kind. In order to have an income concept equivalent to this extendedvalue of consumption, imputed receipts of social transfers in kind are recorded;
G. lastly it is occasionally necessary to record some receipts net of the correspondingpayments so a further column is added where the corresponding outgoing isrecorded.
The groups of rows for four types of income cross-classified by seven columnsfor the seven means of payment are presented in annex table 1. In the text whichfollows, each of the non-empty cells is examined to see how the detailed incomeitems specified in Chapter 2 and Appendix 1 fit into this two-way table. Thenumbering scheme used for individual income elements is that set out in Table 2.1(ie 1.1, 1.2 etc), but where a finer disaggregation is used in Appendix 4 where theitems commonly available in income surveys are detailed this is also used below(ie 1.1A, 1.1B etc). Where no code is given, information on that item was notcollected in the metasurvey reported on in Appendix 4.
2. Receipts in cash (Column A)Recall that this is the shorthand expression used for payments received, typically incash, where the recipient is free to use them for any purpose without restriction ofany kind. The column also includes some ‘negative receipts’ where counterparts arerecorded separately.
2.1 Income from involvement in productionThere are two entries for cash receipts coming from production. The first concernswages and salaries earned by employees and the second the earnings of the self-employed

The Canberra Group 135
Expert Group on Household Income Statistics
EmployeesItem 1A below shows the items which would appear in the first cell of annex table1, the row relates to wages and salaries, the column to payments received in cash.
Item 1A: Wages and salaries received in cash
1.1A Wages and salaries (main job)
1.1B Wages and salaries (other jobs)
1.1C Payments for fostering children
1.1D Parenting payment
1.1E Employer reimbursements for non-discretionary work expenses (deduct if includedin wages and salaries)
1.1F Employer reimbursements for discretionary work expenses (deduct if included inwages and salaries)
1.2A Tips
1.2B Bonuses
1.3 Profit-sharing including stock options
1.4 Severance pay
1.5 Allowances payable to military families, to expatriate workers, workers in remotelocations etc as part of conditions of employment
Business expenses such as items 1.1E, employer reimbursements for non-discretionary work expenses, and 1.1F for the discretionary counterpart are taken tobe part of the production expenses of the employer. They thus only feature in annextable 1 or 2 if they are included in wages and salaries, when they should be deductedfrom 1.1A or 1.1B as shown above.
Self-employedThe remuneration a self-employed person takes out of his or her unincorporatedenterprise includes an element which rewards the labour expended and also anelement covering the return to the capital employed. For this reason, the SNA refersto the receipts as mixed income. Some countries will find it useful to distinguishthe income of farmers from other self-employed income but it should be noted thatlarge scale agricultural enterprises, or even smaller ones which are incorporated,would be treated differently in the SNA with those farmers being treated as employeesof the enterprises and their income included with other employees in the sectionsabove.
Two special activities should be included with other self-employment. Theseare the (net) income from renting property, vehicles or equipment and the royaltiesearned by individuals on writings, inventions and so on. As for farmers, this is onlyso if the individuals have not formed themselves into corporate entities in whichcase these earnings would be included under income from employment. Recallhowever that income from rentals has been shown as a separate category in Table 2.1because of the differing treatments between countries – some include rentalswith self-employment income as in the SNA but others include them with propertyincome.

Appendix 2
136 The Canberra Group
Item 2A: Mixed income received in cash
2.1A (Net) nonfarm self-employment
2.1B (Net) farm self-employment
3 Rental income other than on land earned by households as unincorporatedenterprises
2.2 Royalties earned by households as unincorporated enterprises
2.3 Net income(after expenses) of home production for barter transactions
2.2 Property incomeProperty income is the name given to income which arises from lending some sortsof assets to another user. There are three main categories of such income, interestfrom financial capital, dividends on shares and rent from land.
A distinction is made in the SNA between renting buildings and equipmentwhere the owner is responsible for the upkeep of the asset and provides a service tothe lessor and renting assets where there is no such upkeep. Renting housing orequipment is regarded as a production activity and the income received is treated aspart of mixed income and included in Item 2A above. (Technically this was thetreatment recommended in the 1968 SNA also though a number of countries did notfollow the recommendations and the UN Provisional Guidelines on Statistics of theDistribution of Income, Consumption and Accumulation of Households (M61, UnitedNations, 1977) also followed the practice of treating house rentals as propertyincome.)
Whether rentals on housing is treated as income from employment or propertyincome only matters if there is analytical interest in the distinction between thesetwo forms of income. Both are included in the total of the two, primary income,which is the usual focus of attention.
InterestThe SNA proposes recording interest in a rather complex manner. Interest as observedshould be separated into an element representing a payment for a service and a “pure”interest element. If interest is so split, interest receivable by households is higher,and interest payable is lower, than otherwise. The difference between these valuesof calculated interest and interest as observed is to be recorded as consumptionexpenditure on bank services. In consequence, disposable income and consumptionwill be higher than otherwise but saving will be the same as if no split is made.There is still controversy about how far this is practicable for households in total,still less for a disaggregation of households. This distinction is not followed throughin the tables here.
The Canberra Group 137
Expert Group on Household Income Statistics
The table shows the following entry in the column for cash receipts;
Item 5A: Interest received:
4.1A Interest received
4.1B Interest from estates and trusts
Note that in Table 2.1, payments of interest are deducted from interest receiptsas part of item 4.1. This ensures that income is always expressed net of interestpayments on loans of any kind – business loans, mortgage loans for owner occupiersor landlords, or for consumption – which is consistent with SNA advice. However,in order to allow the possibility for measuring the flows of interest received andinterest paid separately, Table 1 is structured so that payments are shown in a separatecolumn G – see 5G and 6G below.
DividendsDividends represent the return to someone who has invested in an enterprise but doesnot work in it themselves. For incorporated enterprises they will simply be calleddividends. For other enterprises they are referred to by national accountants aswithdrawals from non-corporate enterprises. This latter term includes payments tosleeping partners.
Item 7A: Dividends received
4.2A Dividends received
4.2B Dividends from estates and trusts
4.2D Profits from capital investment in unincorporated businesses
Rent on landAs explained above, only rent on land appears as property income. Other rentalpayments are included in mixed income.
Item 9A: Rent on land received
4.3 Rent on land received by households as unincorporated enterprises
2.3 TransfersThe third main set of flows concerning the measurement of income are transfers.From the macro point of view, all current transfers are recorded before the derivationof disposable income. The only issue of principle to decide is whether a transfershould be classified as current or capital in nature. However, from a micro point ofview there are two additional concerns. The first is whether some current transfersare properly classified as part of income or whether some are more akin toexpenditure. The second is whether the SNA division between current and capitaltransfers can be followed exactly in micro analyses. Chapter 2 recommends howtransfers may be divided between those which should be regarded as part of income

Appendix 2
138 The Canberra Group
and those which may be treated as transfers of expenditure rather than income. Thefirst group includes compulsory transfers and other regular, quasi-compulsory,transfers between households, and between households and non-profit makinginstitutions serving households (NPISHs). The second includes more voluntary andirregular transfers. In this section both the receipts and payments of the first groupof transfers is discussed. The treatment of voluntary transfers is described below underthe section looking at the extension of the accounts to consumption and capitalaccumulation.
Compulsory transfers and regular interhousehold transfersThese include taxes on income, payments related to pensions and other socialinsurance generally and family support payments. Taxes on income are compulsorytransfers paid by households to government. The other categories listed are both paidand received by households though not always by the same household.
Social insurance, social security and social assistanceA comprehensive recording of social insurance payments and receipts requires a fairlycomplex recording. Here there are three items referring to pensions. The first is thecontribution made by employers on behalf of active employees. This is recorded aspart of employee compensation. The employees then make a transfer to their employer(or a designated pension scheme) of a contribution which includes the whole of thiscontribution from the employer plus, frequently, a contribution by the employee. Thisis the second element relating to pensions. The third is the social insurance benefitpaid to retirees or other beneficiaries. Both employer and employee contributions topension schemes are recorded at the time they are made (thus deducting fromdisposable income of contributors) and benefits from schemes are recorded whenactually paid (thus adding to disposable income of beneficiaries). This is reflectedin differences in patterns of income and expenditure as between households still inthe labour force and those retired. The process of recording the benefits andcontributions in these three stages means that it is possible to see exactly how theexistence of such schemes affect the redistribution of income from those in work tothose not in work.
Criticism is made of the SNA because not all pensions are handled this waybut only those qualifying as a social insurance scheme. This is one where theemployer or government obliges participation. Note that this includes many schemesdescribed as private pensions schemes if belonging to such a scheme is a conditionof employment. It is only schemes undertaken voluntarily, without employer orgovernment compulsion, which are excluded. A large proportion of them will relateto self-employed or even non-employed individuals. Even these people may becovered in some social insurance schemes, however, notably social security. Toemphasise that most private pension schemes are included in social insurance,excluded schemes are referred to as non-employee pension schemes. These schemesare treated as use of saving to acquire financial assets which then yield a return.The evolution of these financial assets is tracked by the accumulation of interest,dividends etc. The rationale for treating non-employee pension provision in this wayis (i) the practical difficulty of determining when a private individual is providingfor a pension rather than simply deploying his/her saving effectively, (ii) policyinterest in schemes with a “third party” involvement.
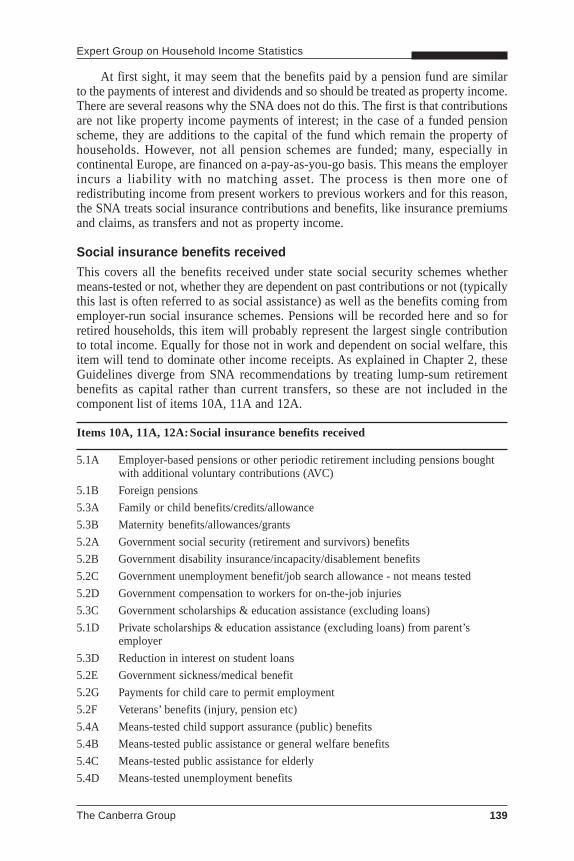
The Canberra Group 139
Expert Group on Household Income Statistics
At first sight, it may seem that the benefits paid by a pension fund are similarto the payments of interest and dividends and so should be treated as property income.There are several reasons why the SNA does not do this. The first is that contributionsare not like property income payments of interest; in the case of a funded pensionscheme, they are additions to the capital of the fund which remain the property ofhouseholds. However, not all pension schemes are funded; many, especially incontinental Europe, are financed on a-pay-as-you-go basis. This means the employerincurs a liability with no matching asset. The process is then more one ofredistributing income from present workers to previous workers and for this reason,the SNA treats social insurance contributions and benefits, like insurance premiumsand claims, as transfers and not as property income.
Social insurance benefits receivedThis covers all the benefits received under state social security schemes whethermeans-tested or not, whether they are dependent on past contributions or not (typicallythis last is often referred to as social assistance) as well as the benefits coming fromemployer-run social insurance schemes. Pensions will be recorded here and so forretired households, this item will probably represent the largest single contributionto total income. Equally for those not in work and dependent on social welfare, thisitem will tend to dominate other income receipts. As explained in Chapter 2, theseGuidelines diverge from SNA recommendations by treating lump-sum retirementbenefits as capital rather than current transfers, so these are not included in thecomponent list of items 10A, 11A and 12A.
Items 10A, 11A, 12A:Social insurance benefits received
5.1A Employer-based pensions or other periodic retirement including pensions boughtwith additional voluntary contributions (AVC)
5.1B Foreign pensions
5.3A Family or child benefits/credits/allowance
5.3B Maternity benefits/allowances/grants
5.2A Government social security (retirement and survivors) benefits
5.2B Government disability insurance/incapacity/disablement benefits
5.2C Government unemployment benefit/job search allowance - not means tested
5.2D Government compensation to workers for on-the-job injuries
5.3C Government scholarships & education assistance (excluding loans)
5.1D Private scholarships & education assistance (excluding loans) from parent’semployer
5.3D Reduction in interest on student loans
5.2E Government sickness/medical benefit
5.2G Payments for child care to permit employment
5.2F Veterans’ benefits (injury, pension etc)
5.4A Means-tested child support assurance (public) benefits
5.4B Means-tested public assistance or general welfare benefits
5.4C Means-tested public assistance for elderly
5.4D Means-tested unemployment benefits

Appendix 2
140 The Canberra Group
Items 10A, 11A, 12A:Social insurance benefits received (concluded)
5.4E Means-tested disability support - means tested
5.4F Means tested age pension
5.4G Other means-tested transfer programs ( catchall items where greater precisionnot possible)
5.4H Child tax credit
5.4I Earned income tax credit
5.4J Other tax credits
For some income components collected in the metasurvey reported on inAppendix 4, it was not clear whether the payment of a benefit from a private insurancescheme was from a mandatory employer-based scheme or from a private scheme inwhich the beneficiary took part voluntarily. In this Appendix, the latter has beenassumed and so these items are shown as claims on non-life insurance policies andincluded in item 24A below.
For a discussion of the entries relating to tax credits, see the discussion of taxeson income below.
Social insurance contributions paidThis cell in column A covers only the contributions made by employees to thisscheme. Contributions by the employers are considered below when column C isdiscussed.
Item 17A: Social insurance contributions paid by the employee
7.2A Employees’ contributions to mandatory private social insurance schemes(pension,health, etc.)
7.2B Employees’ contributions to government social insurance schemes
7.2C Employees’ contributions to government-mandated unemployment insurance
Regular interhousehold transfersInitially it seems that the SNA does not include transfers between households. Thisis only because in almost all applications so far, households are treated in aggregateand thus inter-household transfers net out. As soon as the sector is sub-divided,though, it is necessary to include these transfers just as it is necessary to includetransfers between different levels of government when that sector is disaggregated.
Item 13A: Regular inter-household transfers received
5.5A Alimony received from another household
5.5B Child support received from another household
Payments covered by receipts from another household
5.5C Regular cash transfers received (gifts) from another household

The Canberra Group 141
Expert Group on Household Income Statistics
Item 19A: Regular inter-household transfers paid
7.5A Alimony paid to another household
7.5B Child support paid to another household
7.5C Payments made on behalf of another household
7.5D Regular cash transfers paid (gifts)to another household
Payments on behalf of another household may be regular or irregular. It isassumed that most which would be recorded in household microdata would be regularand therefore included here. If they are known and appear to be mainly irregular,they would appear in item 21A below.
2.4 Taxes on income, wealth etc.For many households, these constitute the only current transfers which is strictlyspeaking compulsory. They include taxes on income, recurrent taxes on wealth andsome items such as vehicle licence duties when the vehicle is not used for business.To reconcile exactly with national accounts figures, they should be recorded on anaccruals basis. The most significant accruals adjustment is the tax refund manyhouseholds receive at the end of a fiscal year to rectify overpayment during the year.Such refunds should be deducted from tax payments.
Although tax refunds and tax credits are both sometimes set against tax receipts,this is not always true for tax credits and conceptually and sometimes in practice,they should be treated separately from tax refunds. Tax credits, or tax allowances,serve to reduce the amount of tax payable. In macro data the amount of tax payableis given only after taking tax credits into account. For income distribution work, itmay sometimes be desirable to calculate what tax would have been payable in theabsence of tax credits and show total tax credits as an off-setting item in order tosee the redistributional effects of different tax credit regimes.
There may be cases for some households where tax credits exceed tax liabilities.In some countries this remaining credit is simply lost to the beneficiary. In othercountries, the remaining credit may be payable in cash to the beneficiary. In thiscase, the payments are shown as social assistance and included in item 12A. It ispossible that in such cases, the macro data may not show these credits as payableby the tax authorities who may net them against other tax receivable.
The need to include imputed rent of owner-occupied dwelling in order to removedistortions from income (and more particularly expenditure) comparisons is describedbelow in connection with item 3D. It should be noted that it is important not todouble-count property taxes. Property taxes paid by owner-occupiers or by land-lordsout of rental receipts are classified as taxes on production and are one of the costsdeducted in reaching a figure of income from imputed rent of owner occupiers or ofrentals. The normal assumption is that most tenants are responsible for payingproperty tax as well as the agreed rent. If a tenant is responsible for paying propertytaxes directly in addition to their rent, they are included here.

Appendix 2
142 The Canberra Group
Item 18A: Taxes on income, wealth etc.
7.3A Income taxes net of refunds
7.4 Property (real estate) taxes
7.3B Compulsory fees and fines for hunting, shooting, fishing
3. Receipts in kind (Column B)Column B in table 1 contains only one cell. This entry covers all the benefits providedby an employer to an employee which are described as being “in kind” excludingcontributions to social insurance schemes.
Item 1B covers all the items which may be given to an employee as part of theemployment package but which cannot be translated into money that is freelyavailable for any purpose of the employee’s choice. The list used in Appendix 4 andreproduced below is typical but may not be exhaustive. The amount included foritems 1.7A to 1.7F is difference between the invoiced amount and the part theemployee is responsible to pay.
Item 1B: Wages and salaries received in kind
1.7A Company cars
1.7B Subsidised meals
1.7C Subsidised (low-interest) loans
1.7D Subsidised housing, electricity
1.7E Subsidised child care
1.7F Subsidised vacations
4. Receipts of forced saving (Column C)
4.1 Employers’ social insurance contributionsThe rather complicated way in which contributions to and benefits from socialinsurance schemes are recorded has been explained above. The relevant item incolumn C concerns only the contributions paid by employers into such schemes onbehalf of their employees. Like the receipts in kind just considered, thesecontributions form part of the employment contract and are sometimes also describedas “fringe benefits”. The employee is better off having the employer contribute to apension scheme on his/her behalf but these contributions must be saved and cannotbe spent immediately.

The Canberra Group 143
Expert Group on Household Income Statistics
Item 1C: Employers’ social contributions
1.6A Employers’ contributions to private retirement (pension) plans
1.6B Employers’ contributions to private health insurance
1.6C Employers’ contributions to life insurance
1.6D Employers’ contributions to other employer insurance schemes(e.g. disability)
1.6E Employers’ contributions to government insurance (social security) schemes(including payroll taxes)
The schemes covered include both government mandated schemes applicableto all employees and those run by employers for the benefit of their employees only.They may cover pension provision only or other forms of social insurance for exampleinsurance against disability and unemployment as well as health generally.
This item appears a second time in column C, this time as a deduction from incomein cell 16C.
Item 16C: Employers’ social contributions
1.6A Employers’ contributions to private retirement (pension) plans
1.6B Employers’ contributions to private health insurance
1.6C Employers’ contributions to life insurance
1.6D Employers’ contributions to other employer insurance schemes (e.g. disability)
1.6E Employers’ contributions to government insurance (social security) schemes(including payroll taxes)
4.2 Property incomeItems 5A and 7A show the receipts of interest and dividends. In principle, bothinterest and dividends should be recorded in the macro-data on an accruals basis,that is when it is due to be paid and not when it is actually paid. This difference cansometimes be significant. Although it is unlikely that such information will beavailable for use in household distribution statistics, table 1 contains cells for theseadjustments for the purpose of allowing a full reconciliation at macro level.
Item 5C: Interest due less paid.
Forced saving - interest due less interest paid
Item 7C: Dividends due less paid.
Forced saving- dividends due less dividends paid
4.3 Pension fund adjustmentThere is in fact a fourth SNA item concerning pensions. Households pay contributionsinto social insurance schemes and receive benefits from them. Over a year, therewill be a disparity between the two which shows up as a change in the net equity of

Appendix 2
144 The Canberra Group
pension funds. The funds are regarded as belonging to households and thus shouldbe included in household saving. The SNA places this adjustment to saving in theuse of income account on order to exclude it from disposable income but still includeit in saving
The item belongs in the category of receipts of forced saving and like the accrualsadjustments above, it may not be possible to incorporate this in household distributionstatistics at present. If it could be disaggregated, it would be a step towards recordingthe evolution of the distribution of wealth.
Item 8C: property income attributed to insurance policy holders.
17.3 Increase in the value of life insurance policies
4.4 Capital gainsSection 2.5.3 recommends that all holding gains should be excluded from measuresof income. However, real holding gains within the accounting period should be anoptional item for inclusion in aggregate measures of income. Neutral holding gainsshould be confined to explaining changes between opening and closing balancesheets.
Item 15C: Real holding gains or losses
This item is related to but not identical with:17.4 Realised capital gains
20 Unrealised capital gains
5. Own account production of goods and owneroccupied dwellings (Column D)
5.1 Own account productionThe imputed value of this item is put into a separate column as part of mixed incomefrom self-employment.
Item 2D: Own-account production
2.4 Income element of home production for home use (i.e. excludes value of itemsbought for use in production process)
5.2 Owner occupied housingIn principle, the national accounts for all countries should include estimates for thisitem, though it may be difficult to break them down for groups of households.
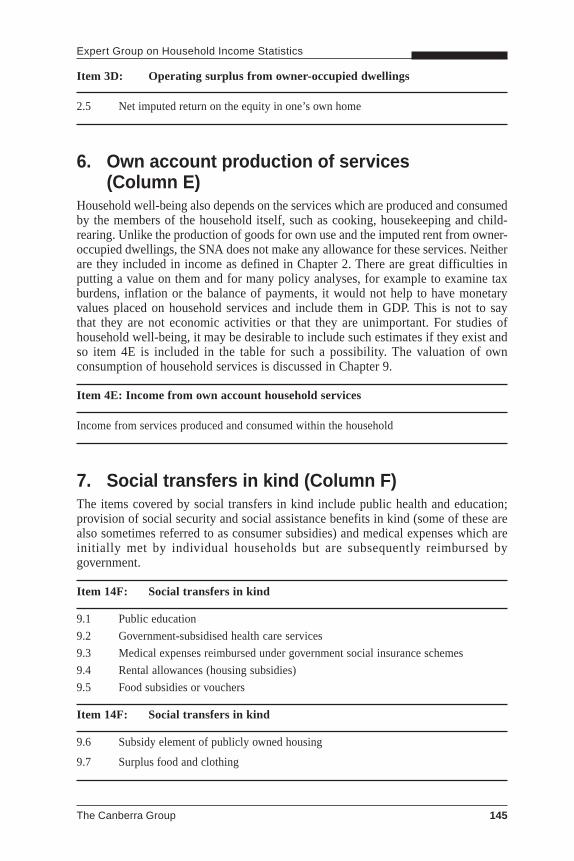
The Canberra Group 145
Expert Group on Household Income Statistics
Item 3D: Operating surplus from owner-occupied dwellings
2.5 Net imputed return on the equity in one’s own home
6. Own account production of services(Column E)
Household well-being also depends on the services which are produced and consumedby the members of the household itself, such as cooking, housekeeping and child-rearing. Unlike the production of goods for own use and the imputed rent from owner-occupied dwellings, the SNA does not make any allowance for these services. Neitherare they included in income as defined in Chapter 2. There are great difficulties inputting a value on them and for many policy analyses, for example to examine taxburdens, inflation or the balance of payments, it would not help to have monetaryvalues placed on household services and include them in GDP. This is not to saythat they are not economic activities or that they are unimportant. For studies ofhousehold well-being, it may be desirable to include such estimates if they exist andso item 4E is included in the table for such a possibility. The valuation of ownconsumption of household services is discussed in Chapter 9.
Item 4E: Income from own account household services
Income from services produced and consumed within the household
7. Social transfers in kind (Column F)The items covered by social transfers in kind include public health and education;provision of social security and social assistance benefits in kind (some of these arealso sometimes referred to as consumer subsidies) and medical expenses which areinitially met by individual households but are subsequently reimbursed bygovernment.
Item 14F: Social transfers in kind
9.1 Public education
9.2 Government-subsidised health care services
9.3 Medical expenses reimbursed under government social insurance schemes
9.4 Rental allowances (housing subsidies)
9.5 Food subsidies or vouchers
Item 14F: Social transfers in kind
9.6 Subsidy element of publicly owned housing
9.7 Surplus food and clothing

Appendix 2
146 The Canberra Group
8. Corresponding outgoings (Column G)Each of the columns A to F are measured to show total flows. Where appropriate,some ‘negative receipts’ are shown in the section of Table 1 where counterpart entriesare deducted in moving from total income to disposable income. In the case ofinterest, a decision has to be made whether to measure the flows of interest receivedand interest paid separately or netted one against the other. These Guidelinesrecommend a net measurement. However, the table is structured to allow bothpossibilities by including the outgoings in a new column, column G.
It was noted above that mixed income from self-employment should be recordedbefore deducting interest payments. Rather, the possibility is allowed of showingseparately interest paid in respect of production activities (which would includeinterest on mortgage payments for owner-occupied dwellings) and interest paymentsrelated to consumption. If such a separation can be made, then interest paid in respectof production can be deducted from mixed income to derive an income term theSNA calls entrepreneurial income. However, experience suggests that it is seldompossible to make this separation on income and entrepreneurial income is seldomcalculated. Thus it may only be possible to have data for items 5G and 6G jointly.
Item 5G: Interest payments related to production.
4.1D Interest paid on mortgage loans
4.1E (part) Interest on non-mortgage loans related to business activities
Item 6G: Interest payments related to consumption.
4.1E (rest) Interest on non-mortgage loans other than loans related to businessactivities
The entry in column C for forced saving was referred to above. This relates tothe difference between interest payments when they are due to be paid and whenthey are actually paid. If the outgoing interest payment is recorded when paid ratherthan when due, part of item 5C will relate to interest payments and part to receipts.
Item 9A showed receipts of rent on land. Item 9G shows the counterpart itemof payments of rent on land. Since not all land is rented by and to households, theseitems will not necessarily balance.
Item 9G: Rent on land paid.
Rent on land paid by households
9. Introducing income aggregatesTable 1 consists of 20 rows showing different sorts of income flows and sevencolumns showing different means of payment. By making aggregates from successiverows and examining them for different combinations of columns we obtain a highdegree of flexibility in defining income aggregates as well as a means of reconcilingmicro and macro data sources.

The Canberra Group 147
Expert Group on Household Income Statistics
Income from productionThe sum of rows 1 to 4 give income from production. Receipts in cash come fromwages and salaries (item 1A) and mixed income from self-employment (item 2A).These two items will always typically be available from micro data sets. Item 1Brelates to wages and salaries received in kind and item 2D relates to mixed incomefrom the production of own-account production of goods. For many OECD countriesthese items may be small though they will have much greater importance in adeveloping country context. Where they are important, micro data sets are more likelyto cover them.
Item 1C relates to employers’ contributions to both state and private socialinsurance schemes. This item may often not be available from micro data sets but itis of significant size in most countries. Together, the three items in row 1 give themacro aggregate of “compensation of employees”. Since the size of item 1C is knownin total, it may be excluded from the macro aggregate when comparing how closelythe data on wages and salaries from the micro and macro sources match.
Item 3A relates to operating surplus from the rent of owner-occupied dwellings.Inclusion of this item in micro data is theoretically desirable since the different statusof home ownership can distort income distribution statistics which ignore it. Inaggregate, a figure is available from macro data sets but distribution by type ofhousehold may provide serious practical problems.
Item 4E is the optional element allowing for an estimate of the value of servicesproduced and consumed within the household. These data are seldom available fromregular macro-economic data sets and will most often exist if at all as a result of aspecial exercise which may or may not be otherwise related to income distributiondata sets. If it is included, then the sum of all elements in rows 1 to 4 will exceedthe macro-economic estimate of income from employment and self-employment bythis amount.
Property incomeThere are three types of property income received in cash; interest, dividends andland rent. These are shown in column A. Corresponding outgoing payments of interestand land rent are shown in column G. The items which conceptually reconcile microand macro data for interest and dividends are the forced saving items shown in columnC. In practice, however, problems of recording the flows in both micro and macrodata sets may mean that full reconciliation is a more complex process.
The other element entering property income is the amount accruing to insurancepolicy holders, especially holders of life policies. This element should be wellestablished in macro data sets but is very probably not to be found in micro data.
Total property income is the sum of all entries in rows 5 to 9 for columns A to Eless column G. (Column F is empty for these rows.)
9.1 Primary incomeThis is the total of income from production and property income. The total for columnA only may sometimes be all that is available from micro data sets. The total acrosscolumns A, B, C, D and G should be exactly that total shown as primary income forhouseholds coming from national accounts and macro data sets. The existence ofthe different columns means that different totals may be determined at will. Total
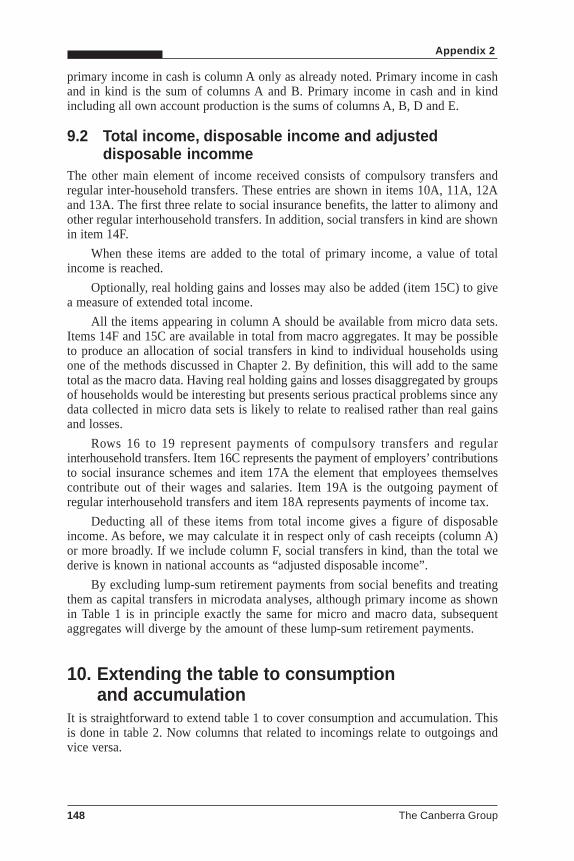
Appendix 2
148 The Canberra Group
primary income in cash is column A only as already noted. Primary income in cashand in kind is the sum of columns A and B. Primary income in cash and in kindincluding all own account production is the sums of columns A, B, D and E.
9.2 Total income, disposable income and adjusteddisposable incomme
The other main element of income received consists of compulsory transfers andregular inter-household transfers. These entries are shown in items 10A, 11A, 12Aand 13A. The first three relate to social insurance benefits, the latter to alimony andother regular interhousehold transfers. In addition, social transfers in kind are shownin item 14F.
When these items are added to the total of primary income, a value of totalincome is reached.
Optionally, real holding gains and losses may also be added (item 15C) to givea measure of extended total income.
All the items appearing in column A should be available from micro data sets.Items 14F and 15C are available in total from macro aggregates. It may be possibleto produce an allocation of social transfers in kind to individual households usingone of the methods discussed in Chapter 2. By definition, this will add to the sametotal as the macro data. Having real holding gains and losses disaggregated by groupsof households would be interesting but presents serious practical problems since anydata collected in micro data sets is likely to relate to realised rather than real gainsand losses.
Rows 16 to 19 represent payments of compulsory transfers and regularinterhousehold transfers. Item 16C represents the payment of employers’ contributionsto social insurance schemes and item 17A the element that employees themselvescontribute out of their wages and salaries. Item 19A is the outgoing payment ofregular interhousehold transfers and item 18A represents payments of income tax.
Deducting all of these items from total income gives a figure of disposableincome. As before, we may calculate it in respect only of cash receipts (column A)or more broadly. If we include column F, social transfers in kind, than the total wederive is known in national accounts as “adjusted disposable income”.
By excluding lump-sum retirement payments from social benefits and treatingthem as capital transfers in microdata analyses, although primary income as shownin Table 1 is in principle exactly the same for micro and macro data, subsequentaggregates will diverge by the amount of these lump-sum retirement payments.
10. Extending the table to consumptionand accumulation
It is straightforward to extend table 1 to cover consumption and accumulation. Thisis done in table 2. Now columns that related to incomings relate to outgoings andvice versa.

The Canberra Group 149
Expert Group on Household Income Statistics
10.1 Consumption expenditureMost disposable income is used to finance consumption. A number of items ofconsumption expenditure are listed separately in Table 2.2 of Chapter 2 because forsome purposes it may be desirable to analyse them alongside elements of income.
The first set of items cover costs associated with work but which are not paidfor explicitly by the employer. These are the costs of getting to work and back, andthe costs of caring for dependants while absent.
11.1A Transportation costs
11.1B Child care costs
Medical expenses covered by social insurance schemes have been covered initems 10A, 11A and 12A but there will be some elements of medical care not coveredin this way. These form part of consumption expenditure and it may be of interest toidentify them separately in order to reach total medical costs.
11.5A Medical expenses other than those reimbursed under socialinsurance schemes
Under item 18A, the convention on miscellaneous government fees and taxeswas described whereby only licences for hunting, shooting and fishing are regardedas taxes. The remainder of this item falls also under consumption expenditure inmacro-data as it is regarded as a fee for services provided by government. Datalimitations may preclude the separation of entries H22a and H22b in which case ajudgement should be made as to which is the predominant part.
11.6B Compulsory fines and fees other than for hunting,shooting and fishing
For some purposes, it may be desirable to separate from the cost of goods andservices purchased the value of the tax attaching at the point of sale. For mostcountries this can only be derived synthetically and then deducted from the recordedvalue of consumption expenditure.
11.6A Sales or value-added taxes
Voluntary interhousehold transfersChapter 2 discusses those interhousehold transfers which may be considered transfersof expenditure. These are collected together in Item 21A, expressed as outgoingsnet of incomings.
Item 21A: Interhousehold transfers
12.1A In-kind interhousehold transfers
12.1B Interhousehold transfers paid (gifts)
12.1C One-time cash interhousehold transfers received (gifts)

Appendix 2
150 The Canberra Group
Voluntary transfers between households and other unitsThere are a number of transfers which take place between households and othersectors of the economy which need to be considered. These are payments to andfrom charities, lotteries and insurance, both life and non-life (accident insurance).In each case a treatment has been proposed in Chapter 2 which is not in strictaccordance with the SNA and which will induce a slight difference in some but notall aggregates. This is done in part because the SNA does not consider explicitly theimpact of disaggregating flows between groups of households and in part to providea basis for income distribution studies which pays attention both to desirableanalytical properties and practical difficulties.
Items 22A and 22G: Transfers to and from NPISHs
5.6A Union sick or disability pay
5.6B Union strike pay
5.6C Support from charitable organisations
7.6A Union and professional dues
7.6B Donations to charitable organisations
Lotteries and gamblingLotteries and gambling are regarded in national accounts terms as relating solely toredistribution. The difference between total stakes placed and winnings paid isdeemed to be a “service” provided by the lottery/gambling enterprise. This differenceis shown as expenditure by households. Since the (remaining value of the) stakesand winnings are equal and represent inter-household transfers, they are not shownexplicitly in the SNA, indeed are explicitly omitted.
The assumption that stakes and winnings balance between households assumesgovernment and enterprises do not gamble (which we may accept as reasonable)but also that all gambling involves only local households. This is not strictly so. Insome countries (e.g. Monaco) the net inflow may be significant; for some Caribbeanislands where UK football pools are much followed, there may be a net outflow.Probably for most countries this concern is more theoretical than practical.
If there were perfect data on stakes and winnings across income classes, it wouldin principle be possible to separate the stakes into the service part and the part thatwas the “pure” gamble. This is not a very transparent process, though. The proposalis therefore to show the total stakes as part of household consumption and to showthe winnings (where known) as negative expenditure off-setting these.
Item 23A: Lotteries and gaming stakes less winnings
12.2B Lottery or gambling winnings
Lottery or gaming stakes
Non-life insuranceNon-life insurance is taken to be synonymous with accident insurance and to includeterm life insurance. Whole life insurance is discussed below.

The Canberra Group 151
Expert Group on Household Income Statistics
The recording of insurance flows is rather complicated in the SNA because ofthe need to present insurance companies and policy holders consistently. A simplerpresentation should probably be sought for household micro datasets and analysis.Here is the SNA story in brief. Insurance companies actually pay out bigger claimsthan they receive in premiums. They do this by investing premiums paid at the startof the year and keeping the investment income earned. The SNA says in principlethose investment earnings should accrue to the policy holders who then pay themback as “premium supplements”. Then we take the difference between actualpremiums and premium supplements on the one hand and claims payable on theother and call this the service charge of the insurance company. The relevant part ofthis is included in household consumption. The remaining part of the compositepremium is a transfer paid by households and claims are transfers received byhouseholds. For the insurance company, these transfer payments in and out are equal(at least in the long term) but it is not certain that for the household sector they do;there may be some cross-subsidisation between households and enterprises, forexample.
Micro-data for premiums and claims may be more complete and more reliablethan for lotteries and gambling. At first sight, therefore, it looks as if we could followthe SNA procedure if we wished. This means allocating the premiums supplementsacross income classes, though and so involving one of the columns which we maywant simply to leave as a “reconciliation to SNA” item. A more transparent solutionwould leave actual premiums in household consumption and again show claims asnegative consumption for the sorts of reasons advanced above concerning lotteries.The premium supplements would appear in total only as a reconciliation item indisposable income and a matching expenditure. Thus the recording of premiumsupplements does not affect saving.
For some income components collected in the metasurvey reported on inAppendix 4, it was not clear whether the payment of a benefit from a private insurancescheme was from a mandatory employer-based scheme or from a private scheme inwhich the beneficiary took part voluntarily. In this Appendix, the latter has beenassumed and so these items are shown as claims on non-life insurance policies andincluded in item 24A below. Benefits from employer-based schemes would beincluded in item 10A above.
Item 24A: Non-life insurance premiums less claims
12.3A Premiums on non-employee health insurance
12.3F Premiums on non-employee unemployment insurance
12.3D Private disability insurance/incapacity/disablement
12.3G Private unemployment benefit/job search allowance
12.3E Private compensation to workers for on-the-job injuries
12.3B Medical expenses reimbursed by private sickness, accident or medical insuranceschemes
12.3C Private sickness/medical benefits
Premiums on other accident (non-life) insurance
Claims paid under other non-life insurance
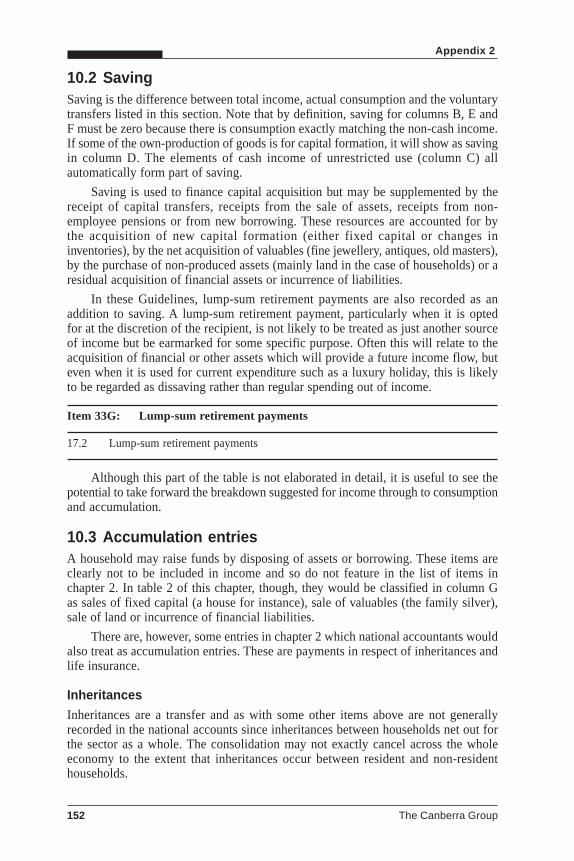
Appendix 2
152 The Canberra Group
10.2 SavingSaving is the difference between total income, actual consumption and the voluntarytransfers listed in this section. Note that by definition, saving for columns B, E andF must be zero because there is consumption exactly matching the non-cash income.If some of the own-production of goods is for capital formation, it will show as savingin column D. The elements of cash income of unrestricted use (column C) allautomatically form part of saving.
Saving is used to finance capital acquisition but may be supplemented by thereceipt of capital transfers, receipts from the sale of assets, receipts from non-employee pensions or from new borrowing. These resources are accounted for bythe acquisition of new capital formation (either fixed capital or changes ininventories), by the net acquisition of valuables (fine jewellery, antiques, old masters),by the purchase of non-produced assets (mainly land in the case of households) or aresidual acquisition of financial assets or incurrence of liabilities.
In these Guidelines, lump-sum retirement payments are also recorded as anaddition to saving. A lump-sum retirement payment, particularly when it is optedfor at the discretion of the recipient, is not likely to be treated as just another sourceof income but be earmarked for some specific purpose. Often this will relate to theacquisition of financial or other assets which will provide a future income flow, buteven when it is used for current expenditure such as a luxury holiday, this is likelyto be regarded as dissaving rather than regular spending out of income.
Item 33G: Lump-sum retirement payments
17.2 Lump-sum retirement payments
Although this part of the table is not elaborated in detail, it is useful to see thepotential to take forward the breakdown suggested for income through to consumptionand accumulation.
10.3 Accumulation entriesA household may raise funds by disposing of assets or borrowing. These items areclearly not to be included in income and so do not feature in the list of items inchapter 2. In table 2 of this chapter, though, they would be classified in column Gas sales of fixed capital (a house for instance), sale of valuables (the family silver),sale of land or incurrence of financial liabilities.
There are, however, some entries in chapter 2 which national accountants wouldalso treat as accumulation entries. These are payments in respect of inheritances andlife insurance.
InheritancesInheritances are a transfer and as with some other items above are not generallyrecorded in the national accounts since inheritances between households net out forthe sector as a whole. The consolidation may not exactly cancel across the wholeeconomy to the extent that inheritances occur between resident and non-residenthouseholds.

The Canberra Group 153
Expert Group on Household Income Statistics
With disaggregation inheritances should be recorded explicitly as capitaltransfers. Although the receipt of an inheritance can be captured in microdata, thepayment cannot since by definition the donor will no longer be part of the householdpopulation at the time the payment is made. This will introduce an asymmetry intothe microdata. This topic is not pursued here.
Items 32A and G: Capital transfers
17.1 Inheritances received
Inheritances paid
Life insuranceLife insurance policies are treated in the SNA as a form of saving. (The reasonsbehind this are discussed above in connection with describing social insuranceschemes.) Payments of premiums and receipts of claims are treated as financialtransactions and thus appear as part of the entries in row 25.
The two items from chapter 2 which appear here are items 4.1C and 4.2C whichrelate to annuity income from a self-financed scheme and 5.1C which covers thepossibility of withdrawing money from a pension scheme prematurely as may bepossible on changing jobs for instance.
Items 34A and G: Transactions in financial assets and liabilities
4.1C plus 4.2C Pension or annuity income from self-financed investments
5.1C Withdrawal from pension schemes
11. Reconciliation with SNA/macro aggregatesIn terms of the columns of table 1, the sum of A, B, C and D less G gives a figurefor primary income of households conceptually identical with the SNA. Variousmicro-studies may optionally exclude some or all of B,C and D; they may include Eand G.
The figure for disposable income of households summed across columns A, B,C and D less G will be less than the SNA definition to the extent that:
Lump-sum retirement payments (to the extent that they can be identified) aretreated as capital transfers and not as current social benefits;
net irregular transfers of expenditures between household in cash and in kindpayable by domestic households to foreign households are less than thecorresponding inflow from households;
lottery and gambling winnings exceed the “pure” stakes (this will be equivalentin theory to transactions with the rest of the world, in practice it will reflect alsodata deficiencies);
insurance claims by households exceed actual premiums and premiumsupplements paid by them;
transfers paid to NPISHs exceed payments from NPISHs to households .

Appendix 2
154 The Canberra Group
It is worth summarising again briefly why this divergence from the macro-standards is proposed.
From the household rather than the national point of view, decisions on the typesof expenditure quoted are closely related to decisions on consumption expenditure.Nor is it rational for a household to consider incomings from these sources as regularincome. Neither is it clear that such receipts should determine the group within ahousehold distribution analysis into which the recipient household falls. In practicalterms, the macro-level differences will generally be small. The micro-data sourcesare likely to poor in regard to each of these and attempts to include them may distortthe results rather than enhance them
By including column F in disposable income, the SNA concept of adjusteddisposable income of households is reached, subject to the five reservations above.
The total of consumption from columns A, B and D is identical with householdconsumption expenditure in the SNA. If column F is included, actual householdconsumption is obtained; identical with the SNA/macro concept.
The total of saving across columns A, C and D is identical with the SNA macrofigure for household saving, except for lump-sum retirement payments.
12. ConclusionThis Appendix has developed a possible theoretical concordance in terms ofdefinitions and presentation between income concepts in the micro and macrotraditions. As far as possible, the practices of both traditions have been respectedand flexibility allowed to derive aggregates familiar to both sets of practitioners.
Transfers within households are not treated explicitly within the SNA so newprocedures are suggested here, guided by analytical usefulness from the point of viewof disaggregation household studies. This involves most importantly a distinctionbetween compulsory transfers and regular family support on one hand and voluntarytransfers on the other. It also extends the distinction between consumption expenditureand actual consumption to cover non-compulsory household transfers which are thentreated rather as a transfer of expenditure than a transfer of income.
Both primary income and saving are fully reconciled between micro and macroaggregates. Five items remain where the suggestions here would produce minordiscrepancies with the SNA but the options to preserve strict consistency remainavailable.

The Canberra Group 155
Expert Group on Household Income Statistics
Tabl
e 1:
Inco
me
dist
ribu
tion
fro
m b
oth
a m
icro
and
mac
ro p
ersp
ecti
ve
A:B:
C:D:
E:F:
G:
Rece
ipts
Rece
ipts
Rece
ipts
of
Own-
acco
unt
Own-
Soci
alCo
rres
pond
ing
in c
ash
in k
ind
forc
ed s
avin
gpr
oduc
tion–
acco
unt
trans
fers
outg
oing
good
spr
oduc
tion
-in
kin
dan
d OO
Dse
rvic
es
1W
ages
and
Wag
es a
ndEm
ploy
ers’
sala
ries
sala
ries
soci
al in
sura
nce
cont
ribut
ions
- priv
ate
sche
mes
- gov
t sch
emes
2M
ixed
inco
me
Mix
ed in
com
efro
m s
elf-
from
ow
n-ac
coun
tem
ploy
men
tpr
oduc
tion
- goo
ds
3Op
erat
ing
surp
lus
from
ow
ner-
occu
pied
dw
ellin
gs
4In
com
e fro
mow
n ac
coun
tho
useh
old
serv
ices
Sub-
tota
lI
Inco
me
from
pro
duct
ion
Income from production
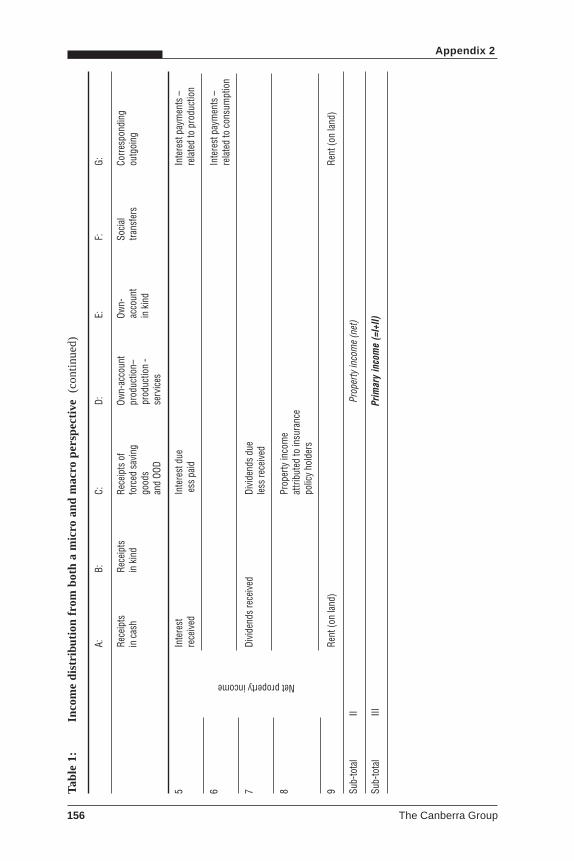
Appendix 2
156 The Canberra Group
5In
tere
stIn
tere
st d
ueIn
tere
st p
aym
ents
–re
ceiv
ed e
ss p
aid
rela
ted
to p
rodu
ctio
n
6In
tere
st p
aym
ents
–re
late
d to
con
sum
ptio
n
7Di
vide
nds
rece
ived
Divi
dend
s du
ele
ss re
ceiv
ed
8Pr
oper
ty in
com
eat
tribu
ted
to in
sura
nce
polic
y ho
lder
s
9Re
nt (o
n la
nd)
Rent
(on
land
)
Sub-
tota
lII
Prop
erty
inco
me
(net
)
Sub-
tota
lIII
Prim
ary
inco
me
(=I+
II)
Tab
le 1
:In
com
e di
stri
buti
on f
rom
bot
h a
mic
ro a
nd m
acro
per
spec
tive
(co
ntin
ued)
A:B:
C:D:
E:F:
G:
Rece
ipts
Rece
ipts
Rece
ipts
of
Own-
acco
unt
Own-
Soci
alCo
rres
pond
ing
in c
ash
in k
ind
forc
ed s
avin
gpr
oduc
tion–
acco
unt
trans
fers
outg
oing
good
spr
oduc
tion
-in
kin
dan
d OO
Dse
rvic
es
Net property income

The Canberra Group 157
Expert Group on Household Income Statistics
Tab
le 1
:In
com
e di
stri
buti
on f
rom
bot
h a
mic
ro a
nd m
acro
per
spec
tive
(co
ntin
ued)
A:B:
C:D:
E:F:
G:
Rece
ipts
Rece
ipts
Rece
ipts
of
Own-
acco
unt
Own-
Soci
alCo
rres
pond
ing
in c
ash
in k
ind
forc
ed s
avin
gpr
oduc
tion–
acco
unt
trans
fers
outg
oing
good
spr
oduc
tion
-in
kin
dan
d OO
Dse
rvic
es
10So
cial
insu
ranc
ebe
nefit
s- p
rivat
e sc
hem
es- g
ovt s
chem
esle
ss lu
mp-
sum
retir
emen
t pay
outs
11So
cial
sec
urity
bene
fits
12So
cial
ass
ista
nce
bene
fits
13Re
gula
r fam
ilysu
ppor
t
14In
divi
dual
cons
umpt
ion
ofgo
vern
men
t and
NPIS
Hs
Sub-
tota
lIV
12.1
Tot
al in
com
e (=
III+
com
puls
ory
trans
fers
and
regu
lar f
amily
sup
port
rece
ived
)
15Op
tiona
lRe
al h
oldi
ng g
ains
item
12.2
1.3
or lo
sses
12.4
12.5
Sub-
tota
lV
12.6
Ext
ende
d to
tal i
ncom
e (=
IV+
optio
nal i
tem
)
Compulsory transfers andregular family support paid

Appendix 2
158 The Canberra Group
16So
cial
insu
ranc
eco
ntrib
utio
nsby
em
ploy
ers
- priv
ate
sche
mes
- gov
t sch
emes
17So
cial
insu
ranc
eco
ntrib
utio
ns b
yem
ploy
ees
- priv
ate
sche
mes
- go
vt s
chem
es
18Ta
xes
on in
com
e ,
wea
lth e
tc.
19Fa
mily
sup
port
paym
ents
Sub-
tota
lVI
12.7
Dis
posa
ble
inco
me
(=IV
or V
–co
mpu
lsor
y tra
nsfe
rs p
lus
regu
lar f
amily
sup
port
paid
)
Tab
le 1
:In
com
e di
stri
buti
on f
rom
bot
h a
mic
ro a
nd m
acro
per
spec
tive
(co
nclu
ded)
A:B:
C:D:
E:F:
G:
Rece
ipts
Rece
ipts
Rece
ipts
of
Own-
acco
unt
Own-
Soci
alCo
rres
pond
ing
in c
ash
in k
ind
forc
ed s
avin
gpr
oduc
tion–
acco
unt
trans
fers
outg
oing
good
spr
oduc
tion
-in
kin
dan
d OO
Dse
rvic
esCompulsory transfers and
regular family received

The Canberra Group 159
Expert Group on Household Income Statistics
Tab
le 2
:E
xten
sion
to
cons
umpt
ion
and
accu
mul
atio
n
A:B:
C:D:
E:F:
G:
Rece
ipts
Rece
ipts
Rece
ipts
of
Own-
acco
unt
Own-
acco
unt
Soci
alCo
rres
pond
ing
in c
ash
in k
ind
forc
ed s
avin
gpr
oduc
tion
–pr
oduc
tion
-tra
nsfe
rsin
com
ing
good
s an
d OO
Dse
rvic
esin
kin
d
20Co
nsum
ptio
nW
ages
and
Cons
umpt
ion
Cons
umpt
ion
Indi
vidu
al c
onsu
m-
expe
nditu
resa
larie
s,of
ow
n ac
coun
tof
ow
npt
ion
of g
over
nmen
tle
ss s
ocia
lm
ixed
inco
me
prod
uctio
nac
coun
tan
d NP
ISHs
1 p
lus
trans
fers
in k
ind
rece
ived
of g
oods
hous
ehol
dtra
nsfe
rs in
kin
dto
oth
er h
ouse
hold
sin
kin
dan
d OO
Dse
rvic
esfro
m o
ther
hou
seho
lds
21Irr
egul
ar tr
ansf
ers
in c
ash
to o
ther
hous
ehol
dsdo
mes
tical
ly a
ndin
the
rest
of t
hew
orld
less
pond
ing
inco
min
gs
22Tr
ansf
ers
Tran
sfer
sto
NPI
SHs
from
NPI
SHs
23Lo
tterie
s an
d ga
min
g s
take
s le
ss w
inni
ngs
24No
n-lif
e in
sura
nce
Prop
erty
inco
me
prem
ium
sat
tribu
ted
to in
sura
nce
less
cla
ims
polic
y ho
lder
s
25Ad
just
men
t for
the
chan
ge in
net
equi
ties
of h
ouse
hold
sin
pen
sion
fund
s
Savi
ngSa
ving
Savi
ng
Irregular transfersof expenditure in cash and in kind

Appendix 2
160 The Canberra Group
26Fi
xed
capi
tal
Fixe
d ca
pita
lSa
les
offo
rmat
ion
form
atio
nfix
ed c
apita
l
27Ch
ange
s in
Chan
ges
inin
vent
orie
sin
vent
orie
s
28Ac
quis
ition
of v
alua
bles
Sale
s of
val
uabl
es
29Ac
quis
ition
of l
and
Sale
of l
and
30Pr
ivat
e pe
nsio
nPr
ivat
e pe
nsio
nsco
ntrib
utio
ns b
enef
its
31Ca
pita
l tax
es p
aid
Capi
tal t
rans
fers
(inhe
ritan
ce ta
xes)
rece
ived
(inh
erita
nces
)
32Lu
mp-
sum
retir
emen
tpa
yout
s
33Ac
quis
ition
Inte
rest
due
less
pai
d;In
curr
ence
of o
ther
divi
dend
s du
e le
ss p
aid;
of o
ther
finan
cial
adju
stm
ent f
or th
e ch
ange
finan
cial
asse
tsin
net
equ
ities
of h
ouse
hold
slia
bilit
ies
in p
ensi
on fu
nds
Net a
ccum
ulat
ion
Net a
ccum
ulat
ion
1.W
hen
the
corr
espo
ndin
g in
com
e el
emen
t is
on
an e
ntitl
emen
t ba
sis,
the
exp
endi
ture
ite
m s
houl
d sh
ow t
he t
ake-
up b
asis
plu
s an
adj
ustm
ent
show
ing
the
impl
icit
tran
sfer
ite
m (
entit
lem
ent l
ess
take
-up)
. W
hen
the
inco
me
elem
ent i
s on
an
insu
ranc
e ba
sis,
the
expe
nditu
re it
em s
houl
d be
iden
tical
.Sa
ving
equ
als
disp
osab
le in
com
e le
ss c
onsu
mpt
ion
less
irre
gula
r tr
ansf
ers
of e
xpen
ditu
re in
cas
h an
d in
kin
d. T
his
can
only
app
ear
for
the
two
cash
col
umns
plu
s th
eow
n ac
coun
t col
umn
whe
re s
avin
g is
exa
ctly
equ
al to
fix
ed c
apita
l for
mat
ion
and
chan
ges
in in
vent
orie
s of
ow
n pr
oduc
ed g
oods
.N
et a
ccum
ulat
ion
in c
olum
n A
= s
avin
g co
lum
n A
less
acc
umul
atio
n en
trie
s in
col
umn
A le
ss a
ccum
ulat
ion
entr
ies
colu
mn
GN
et a
ccum
ulat
ion
in c
olum
n D
= s
avin
g co
lum
n D
.
Tab
le 2
:E
xten
sion
to
cons
umpt
ion
and
accu
mul
atio
n
A:B:
C:D:
E:F:
G:
Rece
ipts
Rece
ipts
Rece
ipts
of
Own-
acco
unt
Own-
acco
unt
Soci
alCo
rres
pond
ing
in c
ash
in k
ind
forc
ed s
avin
gpr
oduc
tion
–pr
oduc
tion
-tra
nsfe
rsin
com
ing
good
s an
d OO
Dse
rvic
esin
kin
d
Accumulation

Appendix 3
PurchasingPower Parities
The Canberra Group 161
1. What is a Purchasing Power Parity?A purchasing power parity (PPP) is an index which attempts to show how manyunits of country A’s currency are needed to buy the same basket of goods and servicesthat one unit of country B’s currency does. PPPs are thus commensurate withexchange rates but whereas exchange rates for most countries are mainly determinedby the basket of goods and services which are traded internationally, PPPs aredetermined by all goods and services consumed within the country including goodsproduced for own consumption which do not reach a market. The more the patternof exports and imports of a country resemble the pattern of all goods and servicescirculating in the economy, the closer the exchange rate and PPP are likely to be butthey will only be exactly the same by coincidence. In all countries there are servicesprovided by government which are not imported and exported and there are manygoods, including construction and usually construction materials that are generallynot traded internationally because of logistic difficulties for the former and the factthat the value to weight ratio for the latter means that it is not economic to movethese over very large distances. In addition, flows of long-term and short -term capitalmay influence the exchange rate, a factor which also invalidates the use of exchangerates to measure the purchasing power of a currency in terms of the goods andservices in circulation there.
In comparing income levels across countries, it is necessary to work either interms of ratios which are scale free or to use a means of conversion from one currencyto another. In this context a PPP is indisputably better than an exchange rate since itis related to the relevant basket of goods and services that income earners are likelyto want to buy rather than those which are imported and exported. This is importantfor all countries but especially so for developing countries whose basket of exportsmay be dominated by very few primary products.
2. How is a PPP calculated?In making price comparisons over time, the starting point is usually to think ofPaasche and Laspeyres indices. Both are weighted averages of price relatives, thatis the ratios of the price of various goods and services in the current period (t) withthose in the base period (0). The Laspeyres index weights these price relatives together

Appendix 3
162 The Canberra Group
using the volumes of the base period and the Paasche index uses the volumes of thecurrent period.
A simple two-country PPP is exactly analogous to this. Price relatives are formedfor goods and services available in each country at a point in time, each price beingexpressed in local currency. These are then weighted together using either the weightsof country A or of country B. With intertemporal comparisons, a Fisher index canbe formed by taking the square root of the product of the Paasche and Laspeyresindices and the same can be done for PPPs also.
For time series there is no question of the order in which comparisons betweenvarious points in time should be made – they should be chronological. For a groupof countries there is no a priori ordering available so comparisons are made betweenall pairs of countries and then geometric averages made of all direct and indirectcomparisons. (An indirect comparison is to compare country i with country k andthen country k with country j, thus giving an indirect comparison between i and j.)
3. PeriodicityIntertemporal price indices relate the prices of two points in time and cannot beapplied to a different point in time; the price index for period t should not be appliedto period t+k. Similarly, all PPPs refer to a single reference year and should not beapplied to a different year. It is sometimes thought that if exchange rates stay fixed,then PPPs will also stay fixed, maintaining the same relation to them. This is notcorrect as can be seen by considering the case of floating exchange rates. Thesechange as the baskets of goods and services imported and exported change. PPPschange as their baskets of goods and services change, whether the exchange rate isfixed or floating. Usually the changes will be fairly small from year to year just asyear to year inflation rates are fairly small but if there is a radical restructuring ofprices (say from the introduction of a VAT type tax) then the changes will be moresignificant.
4. Updating PPPsCalculating PPPs is a fairly major undertaking and thus it is not done routinely forall countries for every year. The OECD and Eurostat make comparisons for all OECDmember countries (which include all EU member countries) plus a few others. Forthe EU countries, price relatives are collected every year and one third of the weightsare updated every year (a rolling benchmark). For other countries both price relativesand all weights are updated every three years. The results for 1999 will be publishedearly in 2001. For other countries, less frequent comparisons are undertaken, usuallyon a regional basis, and brought together by the World Bank.
Because it is necessary to have a time series of PPPs, a method for interpolatingyears between the reference or benchmark years is used. This depends on the factthat movements in PPPs tend to be fairly gradual. The method used is the following.
Take the PPP of country A relative to B for year t.
Take local inflation from year t to t+1 in both country A and countryB (pA, pB)
Then PPP (t+1) = PPP (t) times pA divided by pB

Expert Group on Household Income Statistics
The Canberra Group 163
For example, if the PPP for year t is 2, it needs 2 units of A’s currency to buysame as 1 unit of B’s in year t. By year t+1, the same basket of goods and serviceswill cost pA.2 local currency units in country A and pB.1 local currency units incountry B. So PPP(t+1)= PPP(t) *pA/pB.
This methodology can also be used to make forward projections of PPPs whilewaiting for the next benchmark results.
The OECD web site contains a table of PPPs for each year from 1970 to 1999 forall member countries (currently //www.oecd.org/std/nadata.htm).
5. Which PPP?A PPP can be calculated for a single product or a group of products at various levelsof aggregation. The higher the level of aggregation, the less the results are influencedby seeming outliers, “seeming” because it not always being possible to determinewhether such figures represent a real difference in price structures between twocountries or whether there has been some error in pricing. The key results coverGDP and about ten main components of expenditure. The results for GDP are theones most often quoted and used but for income distribution work, this is not thebest choice.
Because of the institutional differences across countries concerning the extentof government provision of health, education and other individual services, two setsof consumption figures are calculated. One of these relates to consumptionexpenditure and relates to a measure of expenditure excluding social transfers in kind.That is the only health and education expenditure attributed to households is whatthey actually pay for. The other consumption measure is actual consumption andrelates to a measure of expenditure including social transfers in kind. This is closerto a welfare measure than consumption expenditure and is more comparable acrosscountries in that all health and education is included whether provided by the stateor privately.
PPPs are built up from expenditure data but in that they show the purchasingpower of money, they can be applied to income measures also. Which PPP to usewill depend also on the exact measure of income of interest. To convert incomemeasures excluding social transfers in kind, PPPs for consumption expenditure shouldbe used; for income measures including social transfers in kind, the PPPs for actualconsumption should be used.
In principle it would be possible also to calculate a PPP for householdconsumption excluding all rent. Unfortunately, though, PPPs are not additive becausethey are derived from Fisher indices and thus it is not possible for the reader of thepublished reports to make these sort of calculations exactly. However for mostcountries information on the PPPs relating to housing are available so somejudgement can be made about when these could have a significant effect on theresults.
It is interesting to note in passing that it was the PPP work on the alternativeaggregates for household consumption including and excluding social transfers inkind which lead to this approach being incorporated in the revised national accountsmanual published in 1993.

Appendix 3
164 The Canberra Group
6. Representativity and comparabilityNo statistics are perfect and it is useful to consider one of the most problematic areasfor PPPs. In deriving price relatives for two different points, whether points in timeor different geographical points, in principle one wants the two prices to refer toexactly the same product. This is a problem for inter-temporal indices where thespecification of goods changes over time but is even more acute in the cross-countrycase. Not only are the goods likely to have different specifications, but the degree ofrepresentativity of a given product will be different from country to country. Takingrepresentative goods may distort the price relatives because some quality differenceswill be included in prices. Taking exactly comparable goods may equally distort theresults because they are not representative of the basket of goods actually bought.
In order to address this problem, PPPs are now calculated on regional baseswhereby countries which are more or less similar in terms of the types and quantityof products purchased are compared together. Regional groupings are then linkedby means of link countries which participate in more than one group. For each groupseveral hundred prices are collected with some overlapping items, such as staple foodproducts, in order to minimise the risk of error from non-representativity and non-comparability.
A more difficult problem concerns services. While it is possible to determinethe physical characteristics of goods and ensure their consistency or allow fordifferences, it is virtually impossible to do this satisfactorily for services. The servicesprovided in a street market and in an ultra-hygienic air-conditioned supermarket aredifferent but quantifying the difference is near impossible when the choice betweenwhich is preferable is so subjective. There is no ready answer to this problem. ThePPP exercise relies on the assumption that the same good in all outlets carriesequivalent service margins and that each professional person is equally productivein all countries so that wage rates can be used as measures of the services theyprovide. It is easy to criticise these assumptions but so far no better alternatives whichhave general acceptance have been put forward.
7. PPPs for different income groups?The question of representativeness applies also to different income groups within asingle country. Pensioners benefit from hip replacements; young families buy babyclothes and so on. Some of the differences may also be income related. Even if ajumbo size of frozen vegetables is cheaper than a smaller size, poorer families maynot be able to afford the greater absolute cost or, perhaps, do not have a freezer inwhich to store it. Alternative price indices are sometimes calculated for differenthousehold groups depending on family circumstance; they are seldom calculated fordecile groups although this is how income distribution is most often presented.
In order to compare income levels in absolute levels at two points in time withina country, an adjustment must be made for the increase in inflation. Lacking groupspecific price indices, a general measure of inflation such as a CPI is often used forthis adjustment. This may be justified in terms of explaining how the command overgoods and services has changed over time. Because it is applied to all groups,measures of distribution within the year will be unaffected by what is in effect asimple, universal scaling. Thus it is a much less good measure of how welfare has

Expert Group on Household Income Statistics
The Canberra Group 165
changed if prices have been changed in such a way that they affect different groupsdifferently and this comes back to the question of representativity. If governmentalters the rates of income tax, the consequences for income distribution are apparentin post-tax income. If there is a change from direct to indirect taxation, there will bean apparent increase in post tax income negated by a change in the purchasing powerof this income due to the increase in prices due to the increase in indirect tax rates.If all groups are equally affected by these changes, there would be a self-correctingeffect but this is most unlikely since often a change in taxation policy is specificallyintended to affect income distribution.
The use of a general CPI to adjust for inflation can be seen to be problematicalfor certain elements of income included in the recommended definition of disposableincome. Income in kind should be deflated by a price index relating to the goodsand services in question, imputed rent of owner occupied dwellings by a housingprice index and so on.
These problems become even more difficult when applied in the internationalcontext. In part this is because of the different institutional arrangements concerningtax liability from country to country as well as the provision of government services.There is another aspect even less tractable, however. If we compare the baskets ofgoods and services bought by income groups in two countries, one richer and onepoorer, it may be that the basket bought by the middle quintile in the richer counteris more like the basket bought by the richest quintile in the poorer country than thatof the middle quintile. Thus matching similarly labelled groups may not necessarilyimprove the comparison in the manner expected.
In practice, PPPs are not available for income groups. As for inter-temporalcomparisons it would be necessary to collect not only price information but alsoquantity detail (jumbo versus small packaging) for specific income groups. This issuch a data demanding exercise, it is difficult to see a full implementation on anythingother than an experimental basis for the immediate future. Using a single PPP forall housheold groups is simply a scalar effect like using a single price index to convertfrom prices of one year to prices of another. It may be better than nothing (possiblyquite a lot better, especially in times of high inflation) but does not take into accountthat inflation typically hits different household groups differentially (especially intimes of high inflation) because inflation is usually associated with strong shifts inrelative prices and not just an across the board increase nor the fact that pricedifferentials in different countries may be influenced by government behaviour toaffect different household groups separately. Using a PPP instead of an exchangerate (which would also have to be applied universally) is still to be unequivocallyrecommended but it should be noted that gives a measure of the average (not median)command over a basket of goods and services standard for the two countriesconcerned and can say nothing about the relative dispersion of prices within a country.

Appendix 3
166 The Canberra Group
8. ConclusionFour general recommendations can be made on the use of PPPs.
1. A PPP is a better way to convert a measure of the command over goods andservices from one currency to another than an exchange rate.
2. PPPs relate to particular years and it is important to use the PPP for the year inquestion (or approximate it using the formula above).
3. PPPs exist at different levels of aggregation and for income distribution work, itwill generally be desirable to use an aggregate other than GDP, the exact choicedepending on the definition of income in use. For example, a measure of incomeexcluding subsistence agriculture and housing costs should in principle use aPPP which is calculated excluding these items also.
4. No single conversion factor applied to all aspects of income distribution can takeaccount of differences in welfare brought about by the pattern of pricedifferentials as they apply to different household groups within a country.

Appendix 4
Availability ofincome data
The Canberra Group 167
T his Appendix presents the detailed results of a metasurvey of availability of data on the components of household income, carried out by the Canberra Group.
Responses were received from individuals providing information on 30 incomesurveys in 25 countries on all 5 continents. Note that not all respondents alwaysunderstood what income component was being described in the short descriptionprovided on the questionnaire and that it was not always easy to understand how todescribe the new income components contributed by the respondents. Besideslanguage differences, there are substantial institutional differences among countries.Consequently, errors may be present and further revisions are possible. During thecourse of analysing the survey results, the list of income components was reconciledwith that presented in Chapter 2 and Appendix 1 and income components were addedand eliminated, so revisions for that reason can be expected as well. The classificationsystem which is used in Chapter 2 (Tables 2.1 and 2.2) and in Appendix 1 has beenextended in order to cover the greater level of detail of income components used forthe metasurvey. This is set out in Table 1. The last column of this table gives theoriginal codes used in the questionnaire.
Respondents were asked to note the following about each component:
(1) whether it was collected at all;
(2) if not, indicate that by “N” unless it was imputed (allocated) by the statisticalagency conducting the survey (denoted “I”);
(3) if so, then whether it was collected as a separate income component (denoted “S”)or jointly with another component (denoted “J”); and
(4) if jointly, which components were collected together.
If a component was collected only by inference in some sort of summarycatch-all question, then the respondent was asked to mark the component “N”. Inthe follow-up, respondents were also asked to mark “O” if an income componentwas not applicable to their country. Four countries—Finland, the Netherlands,Norway, and Sweden—reported on the data available to them from the administrativerecords they use to report income distribution statistics.

Appendix 4
168 The Canberra Group
Table 2 summarises the results of the investigation. “Not collected” responses(N) are distinguished from blanks; the latter indicate that no usable response wasreceived or no inquiry was made (new components). When counting the number ofcountries responding “yes”, responses of “O” are added as well (if a country doesnot have a program or income component, it implicitly collects its value -- zero).Also, a component is considered collected if at least one survey in that countrycollects that component. For example, both components 1.6A and 1.6B areconsidered collected by the United States even though their Current PopulationSurvey (USA 1) collects 1.6B and not 1.6A while their Survey of Income andProgram Participation (USA 2) collects 1.6A and not 1.6B.
The complete answers to the questionnaire, as edited by the authors, may befound on the Luxembourg Income Study web site, //lis.ceps.lu/links/canbaccess.
Table 1Income Component code list
Code INCOME COMPONENT1 EMPLOYEE INCOME
Cash or near cash
1.1 Cash wages and salaries1.1A Wages and salaries (main job) A11.1B Wages and salaries (other jobs) A21.1C Payments for fostering children A61.1D Parenting payment A81.1E Employer reimbursements for non-discretionary work
expenses (deduct if included in wages and salaries) H101.1F Employer reimbursements for discretionary work expenses
(deduct if included in wages and salaries) H11
1.2 Tips and bonuses1.2A Tips A31.2B Bonuses A4
1.3 Profit-sharing including stock options A51.4 Severance pay A71.5 Allowances payable to military families, expatriate
workers, those in remote locations, etc. K1
Cash value of fringe benefits
1.6 Employers’ social insurance contributions1.6A Employer contribution to private retirement (pension) plans B11.6B Employer contributions to private health insurance B21.6C Employer contributions to life insurance B31.6D Employer contributions to employer other insurance schemes (e.g. disability) B41.6E Employer contributions to government insurance schemes (including payroll taxes) B5
1.7 Goods and services provided to employee as part of employment package1.7A Company cars B61.7B Subsidised meals B71.7C Subsidised (low-interest) loans B81.7D Subsidised housing, electricity B91.7E Subsidised child care B101.7F Subsidised vacations B11

Expert Group on Household Income Statistics
The Canberra Group 169
2 INCOME FROM SELF-EMPLOYMENTCash or near cash
2.1 Profit/loss from unincorporated enterprise2.1A (Net) non-farm self-employment income A92.1B (Net) farm self-employment income A102.2 Royalties earned by households as unincorporated enterprises C2
In kind income, imputed2.3 Net income (ie after expenses) from home production for barter transactions A122.4 Net income (ie after expenses) from home production of goods for home use A112.5 Net imputed return on the equity in one’s own home K6
3 INCOME LESS EXPENSES FROM RENTALS OTHER THAN LANDEARNED BY HOUSEHOLDS AS UNINCORPORATED ENTERPRISES C4b
4 PROPERTY INCOME4.1 Interest received less interest paid4.1A Interest received C14.1B Interest from estates and trusts C5 (part)4.1C Pension or annuity income in the form of interest from self-financed
investments K8(part)4.1D Interest paid on mortgage loans H14.1E Interest paid on non-mortgage loans H2
4.2 Dividends4.2A Dividends received C34.2B Dividends from estates and trusts C5(part)4.2C Pension or annuity income in the form of dividends from self-financed
investments K8(part)4.2D Profits from unincorporated business capital investment C8
4.3 Rent from land earned by households as unincorporated enterprises(net of expenses) C4a
5 CURRENT TRANSFERS RECEIVEDSocial insurance benefits, cash or near-cash
5.1 Social insurance benefits from employer’s schemes5.1A Employer-based pensions or other periodic retirement including pensions
bought with additional employee voluntary contributions A135.1B Foreign pensions A145.1C Withdrawal from pension scheme (non-periodic draw from retirement account) A165.1D Private scholarships & educational assistance (excluding loans) E11
5.2 Social security benefits from government schemes5.2A Government social security (retirement and survivors) benefits E15.2B Government disability insurance/incapacity/disablement benefits E25.2C Government unemployment benefit/job search allowance E45.2D Government workers’ compensation (on-the-job injuries) E65.2E Government sickness/medical benefits E135.2F Veterans’ benefits (injury, pension, etc.) E165.2G Payments for child care to permit employment E15
Social assistance from government schemes – cash or near-cash
Table 1 (continued)Income Component code list

Appendix 4
170 The Canberra Group
5.3 Income from universal government schemes5.3A Family or child benefits/credits/allowance D15.3B Maternity benefits/allowances/grants D45.3C Government scholarships & educational assistance (excluding loans) E105.3D Reduction in interest on student loans E12
5.4 Income from means-tested government schemes5.4A Child support assurance (public) benefits F15.4B Public assistance or general welfare benefits F25.4C Public assistance for elderly F35.4D Means-tested unemployment F85.4E Means-tested disability support F95.4F Means-tested age pension F105.4G Other transfer programs (catch-all item) F115.4H Child tax credit F125.4I Earned income tax credit F135.4J Other tax credits F14
Private transfers in cash
5.5 Regular inter-household cash transfers received5.5A Alimony received from another household G15.5B Child support received from another household G25.5C Regular cash inter-household transfers received G5
5.6 Regular support received from non-profit making institutions such as charities5.6A Union sick or disability pay K35.6B Union strike pay K45.6C Support from charitable organisations (regularly received) K75.6D Other regular payments from outside household G7
7 DEDUCTIONS FROM INCOME OF CURRENT TRANSFERS PAID7.1 Employers’ social insurance contributions (equals 1.6 above)
7.2 Employees’ social insurance contributions7.2A Employee contributions to private mandatory social insurance
(pensions, health, etc.) H87.2B Employee contributions to government-mandated insurance premiums
(including payroll taxes) H97.2C Government-mandated employee contributions to unemployment insurance H19
7.3 Income taxes net of refunds and compulsory fees and fines for hunting,shooting and fishing
7.3A Income tax net of refunds H157.3B Compulsory fees and fines for hunting, shooting, and fishing H22a
7.4 Property (real estate) taxes (paid regularly) H16
7.5 Regular inter-household transfers paid in cash7.5A Alimony paid to another household H37.5B Child support paid to another household H47.5C Payments on behalf of another household H57.5D Regular inter-household transfers paid (gifts) H7
Table 1 (continued)Income Component code list

Expert Group on Household Income Statistics
The Canberra Group 171
7.6 Regular cash transfers to non-profit-making institutions including charities7.6A Union and professional dues H147.6B Regular cash contributions to charities (not collected)
9 SOCIAL TRANSFERS IN KIND9.1 Public education D3
9.2 Government-subsidised health care services D2
9.3 Medical expenses reimbursed by government sickness, accident,or hospital insurance E8
9.4 Rental allowances (housing subsidies) F4
9.5 Food subsidies or vouchers F5
9.6 Publicly owned housing subsidy F6
9.7 Surplus food and clothing F7
OTHER ITEMS NOT CONSIDERED AS PART OF INCOME IN THESE GUIDELINESHousehold consumption expenditure
11.1A Unreimbursed unavoidable work-related transportation costs H1211.1B Unreimbursed unavoidable work-related child care costs H1311.5A Medical expenses not reimbursed by insurance H1811.6 Indirect taxes on household expenditure11.6A Sales or value-added taxes H1711.6B Compulsory fees and fines other than for hunting, shooting, and fishing H22b
12 Irregular transfers of expenditure in cash and kind, net12.1 Irregular cash transfers and in-kind gifts received from other households and from
charities less those received12.1A In-kind inter-household transfers paid G312.1B One-time inter-household transfers paid (gifts) less H612.1C One-time cash inter-household transfers received (gifts) G4
12.2 Lottery and gambling stakes less winnings12.2A Lottery or gambling stakes less (not collected)12.2B Lottery or gambling winnings K5
12.3 Non-life insurance premiums less claims12.3A Privately purchased health insurance premiums less H2012.3B Medical expenses reimbursed by private sickness, accident, or hospital insurance and E912.3C Private sickness/medical benefits and E1412.3D Private disability insurance/incapacity/disablement benefits and E312.3E Private worker’s compensation (on-the-job injuries) E712.3F Privately purchased unemployment/redundancy insurance premiums less H2112.3G Private unemployment/job search allowance E5
Capital transfers received
17.1 Inheritances G617.2 Lump sum retirement payouts A1517.3 Increase in value from life insurance K217.4 Realised capital gains C6
20 Memorandum item: Unrealised capital gains C7
Table 1 (concluded)Income Component code list

Appendix 4
172 The Canberra Group
19-N
ov-0
0
Com
pone
ntAr
gAu
s Br
aCa
nCh
lCh
nCo
lCR
ESFin
Gam
Ger
ItlKo
rM
lyM
auM
exNt
hNZ
Nor
Per
Swd
SwUK
US#
co
llect
ing1.
Em
ploye
e inc
ome
1.1A
XX
XX
XX
XX
XX
XX
XX
XX
XX
XX
XX
XX
X25
1.1B
XX
XX
XX
XX
XX
XX
XX
XX
XX
XX
XX
XX
241.
1CX
XX
XX
XX
XX
XX
XX
X14
1.1D
XX
XX
XX
XX
XX
XX
X13
1.1E
XX
X3
1.1F
XX
21.
2AX
XX
XX
XX
XX
XX
XX
XX
XX
XX
XX
X22
1.2B
XX
XX
XX
XX
XX
XX
XX
XX
XX
XX
XX
XX
241.
3X
XX
XX
XX
XX
XX
XX
131.
4X
XX
XX
XX
XX
XX
XX
XX
151.
5X
XX
XX
XX
XX
X10
1.6A
XX
XX
41.
6BX
XX
XX
X6
1.6C
XX
X3
1.6D
XX
XX
41.
6EX
XX
XX
X6
1.7A
XX
XX
XX
XX
XX
XX
X13
1.7B
XX
XX
XX
XX
XX
XX
X13
1.7C
XX
XX
X5
1.7D
XX
XX
XX
XX
XX
XX
XX
141.
7EX
XX
XX
XX
X8
1.7F
XX
XX
XX
X7
Coun
tr y
Tab
le 2
Sum
mar
y of
Inc
ome
Com
pone
nt D
ata
Col
lect
ion

Expert Group on Household Income Statistics
The Canberra Group 173
19-N
ov-0
0
Com
pone
ntAr
gAu
s Br
aCa
nCh
lCh
nCo
lCR
ESFin
Gam
Ger
ItlKo
rM
lyM
auM
exNt
hNZ
Nor
Per
Swd
SwUK
US#
co
llect
ing2.
Inc
ome
from
self-
emplo
ymen
t2.
1AX
XX
XX
XX
XX
XX
XX
XX
XX
XX
XX
XX
X24
2.1B
XX
XX
XX
XX
XX
XX
XX
XX
XX
XX
XX
X23
2.2
XX
XX
XX
XX
XX
XX
XX
XX
162.
3X
XX
XX
X6
2.4
XX
XX
XX
XX
XX
XX
XX
142.
5X
XX
XX
XX
XX
XX
X12
3. I
ncom
e
fro
m r
enta
ls X
XX
XX
XX
XX
XX
XX
XX
XX
XX
XX
XX
XX
25
4. P
rope
rty in
com
e4.
1AX
XX
XX
XX
XX
XX
XX
XX
XX
XX
XX
XX
X24
4.1B
plus
4.2
BX
XX
XX
XX
XX
XX
XX
XX
154.
1C p
lus 4
.2C
XX
XX
XX
XX
XX
XX
XX
XX
XX
184.
1DX
XX
XX
XX
XX
XX
XX
134.
1EX
XX
XX
XX
XX
XX
X12
4.2A
XX
XX
XX
XX
XX
XX
XX
XX
XX
XX
XX
XX
244.
2DX
XX
XX
XX
XX
94.
3X
XX
3
Coun
tr y
Tab
le 2
Sum
mar
y of
Inc
ome
Com
pone
nt D
ata
Col
lect
ion
(co
ntin
ued)

Appendix 4
174 The Canberra Group
Tab
le 2
Sum
mar
y of
Inc
ome
Com
pone
nt D
ata
Col
lect
ion
(co
ntin
ued)
19-N
ov-0
0
Com
pone
ntAr
gAu
s Br
aCa
nCh
lCh
nCo
lCR
ESFin
Gam
Ger
ItlKo
rM
lyM
auM
exNt
hNZ
Nor
Per
Swd
SwUK
US#
co
llect
ing5.
Cur
rent
tra
nsfe
rs re
ceive
d5.
1AX
XX
XX
XX
XX
XX
XX
XX
XX
XX
XX
XX
X24
5.1B
XX
XX
XX
XX
XX
XX
XX
XX
XX
X19
5.1C
XX
XX
XX
XX
XX
X11
5.1D
XX
XX
45.
2AX
XX
XX
XX
XX
XX
XX
XX
XX
XX
195.
2BX
XX
XX
XX
XX
XX
XX
XX
XX
X17
5.2C
XX
XX
XX
XX
XX
XX
XX
XX
XX
X19
5.2D
XX
XX
XX
XX
XX
XX
XX
X15
5.2E
XX
X3
5.2F
XX
XX
XX
XX
XX
XX
XX
XX
X17
5.2G
XX
XX
XX
XX
X9
5.3A
XX
XX
XX
XX
XX
XX
XX
XX
X17
5.3B
XX
XX
XX
XX
XX
XX
X13
5.3C
XX
XX
XX
XX
XX
XX
XX
145.
3DX
XX
XX
XX
XX
XX
XX
XX
X17
5.4A
XX
XX
XX
XX
XX
XX
X13
5.4B
XX
XX
XX
XX
XX
XX
XX
XX
XX
185.
4CX
XX
XX
XX
XX
XX
XX
XX
XX
175.
4DX
XX
XX
XX
XX
XX
XX
XX
XX
X18
5.4E
XX
XX
XX
XX
XX
XX
XX
X15
5.4F
XX
XX
XX
XX
XX
XX
XX
XX
XX
185.
4GX
XX
XX
XX
XX
XX
XX
XX
XX
X18
5.4H
XX
XX
XX
XX
XX
X11
5.4I
XX
XX
XX
XX
XX
X11
5.4J
XX
XX
XX
XX
X9
Coun
tr y

Expert Group on Household Income Statistics
The Canberra Group 175
19-N
ov-0
0
Com
pone
ntAr
gAu
s Br
aCa
nCh
lCh
nCo
lCR
ESFi
nG
amG
erItl
Kor
Mly
Mau
Mex
Nth
NZ
Nor
Per
Swd
SwU
KU
S#
co
llect
ing
5.5A
XX
XX
XX
XX
XX
XX
XX
XX
XX
XX
X21
5.5B
XX
XX
XX
XX
XX
XX
XX
XX
XX
X19
5.5C
XX
XX
XX
XX
XX
XX
XX
XX
XX
XX
205.
6AX
XX
XX
XX
XX
95.
6BX
XX
XX
XX
X8
5.6C
XX
XX
45.
6DX
XX
XX
XX
XX
XX
XX
XX
XX
177.
Ded
uctio
ns fr
om
inco
me
of c
urre
nt
tran
sfer
s pa
id7.
2AX
XX
XX
XX
77.
2BX
XX
XX
XX
XX
X10
7.2C
XX
XX
XX
XX
XX
107.
3AX
XX
XX
XX
XX
XX
XX
XX
157.
3B0
7.4
XX
XX
XX
XX
XX
XX
127.
5AX
XX
XX
XX
XX
XX
XX
XX
157.
5BX
XX
XX
XX
XX
XX
XX
XX
157.
5CX
XX
XX
XX
X8
7.5D
XX
XX
47.
6AX
XX
XX
XX
X8
7.6B
Coun
try
Tab
le 2
Sum
mar
y of
Inc
ome
Com
pone
nt D
ata
Col
lect
ion
(co
ntin
ued)

Appendix 4
176 The Canberra Group
Tab
le 2
Sum
mar
y of
Inc
ome
Com
pone
nt D
ata
Col
lect
ion
(co
ntin
ued)
19-N
ov-0
0
Com
pone
ntAr
gAu
s Br
aCa
nCh
lCh
nCo
lCR
ESFi
nG
amG
erItl
Kor
Mly
Mau
Mex
Nth
NZ
Nor
Per
Swd
SwU
KU
S#
co
llect
ing
9. S
ocia
l
tra
nsfe
rs in
kin
d9.
1X
19.
2X
XX
39.
3X
XX
39.
4X
XX
XX
XX
XX
XX
XX
XX
159.
5X
XX
XX
XX
XX
XX
XX
X14
9.6
XX
XX
XX
XX
X9
9.7
XX
XX
XX
XX
XX
XX
12
side
red
as p
art
11.1
AX
XX
XX
XX
X8
11.1
BX
XX
XX
XX
XX
X10
11.5
AX
XX
XX
XX
X8
11.6
AX
XX
X4
11.6
B X
XX
XX
X6
12.1
AX
XX
XX
X6
12.1
BX
XX
XX
XX
X8
12.1
CX
XX
XX
XX
XX
XX
XX
XX
XX
1712
.2B
XX
XX
XX
XX
XX
1012
.3A
XX
XX
XX
XX
X9
12.3
BX
XX
XX
XX
XX
XX
X12
12.3
CX
XX
312
.3D
XX
XX
XX
XX
XX
XX
1212
.3E
X1
12.3
FX
XX
X4
Coun
try

Expert Group on Household Income Statistics
The Canberra Group 177
Tab
le 2
Sum
mar
y of
Inc
ome
Com
pone
nt D
ata
Col
lect
ion
(co
nclu
ded)
19-N
ov-0
0
Com
pone
ntAr
gAu
s Br
aCa
nCh
lCh
nCo
lCR
ESFi
nG
amG
erItl
Kor
Mly
Mau
Mex
Nth
NZ
Nor
Per
Swd
SwU
KU
S#
co
llect
ing
12.3
GX
XX
XX
517
.1X
XX
XX
XX
XX
X10
17.2
XX
XX
XX
XX
XX
XX
X13
17.3
XX
XX
XX
XX
XX
1017
.4X
XX
XX
XX
XX
XX
1120
XX
2
Coun
try
CO
UN
TR
Y/S
UR
VE
Y:
Arg
Arg
enti
naP
erm
anen
t H
ouse
hold
Sur
vey
Aus
Aus
tral
iaS
urve
y of
Inc
ome
and
Hou
sing
Cos
ts;
Hou
seho
ld E
xpen
ditu
reS
urve
yB
raB
razi
lN
atio
nal
Hou
seho
ld S
urve
yC
anC
anad
aS
urve
y of
Lab
our
and
Inco
me
Dyn
amic
sC
hlC
hile
Nat
iona
l S
ocio
econ
omic
Sur
vey
Chn
Chi
naU
rban
Hou
seho
ld S
urve
y; R
ural
Hou
seho
ld S
urve
yC
olC
olom
bia
Nat
iona
l H
ouse
hold
Lab
or F
orce
Sur
vey
CR
Cos
ta R
ica
Mul
tipu
rpos
e H
ouse
hold
Sur
vey
ES
El
Sal
vado
rM
ulti
purp
ose
Hou
seho
ld S
urve
yF
inF
inla
ndIn
com
e D
istr
ibut
ion
Sur
vey
(adm
inis
trat
ive
reco
rds)
Gam
The
Gam
bia
Hou
seho
ld P
over
ty S
urve
yG
erG
erm
any
Inco
me
and
Con
sum
ptio
n S
urve
y; S
ocio
econ
omic
Pan
el S
tudy
Itl
Ital
yB
ank
of I
taly
Sur
vey
of H
ouse
hold
Inc
ome
and
Wea
lth
Kor
Rep
ubli
cN
atio
nal S
urve
y of
Fam
ily
Inco
me
of K
orea
and
Exp
endi
ture
1.O
nly
Gam
bia,
Mau
riti
us a
nd S
wit
zerl
and
wer
e ab
le to
iden
tify
sep
arat
ely
rent
als
othe
r th
an f
rom
land
. T
his
line
sho
ws
thos
e co
untr
ies
wit
h da
ta a
vail
able
for
rent
s in
tota
l.2.
The
sur
vey
did
not c
over
this
item
(re
gula
r ca
sh c
ontr
ibut
ions
to c
hari
ties
)3.
Onl
y C
hina
was
abl
e to
sep
arat
ely
iden
tify
tho
se c
ompu
lsor
y fe
es a
nd f
ines
oth
er t
han
for
hunt
ing,
sho
otin
g an
d fi
shin
g. T
his
line
sho
ws
thos
e co
untr
ies
wit
hda
ta a
vail
able
for
tota
l com
puls
ory
fees
and
fin
es.
Mly
Mal
aysi
aH
ouse
hold
Inc
ome
Sur
vey
Mau
Mau
riti
usH
ouse
hold
Bud
get
Sur
vey
Mex
Mex
ico
Nat
iona
l S
urve
y of
Inc
ome
and
Exp
endi
ture
in H
ouse
hold
sN
thT
he N
ethe
rlan
dsIn
com
e Pa
nel S
urve
y (a
dmin
istr
ativ
e re
cord
s)N
ZN
ew Z
eala
ndH
ouse
hold
Eco
nom
ic S
urve
yN
orN
orw
ayIn
com
e D
istr
ibut
ion
Sur
vey
(adm
inis
trat
ive
reco
rds)
Per
Per
uN
atio
nal
Hou
seho
ld S
urve
y of
Lif
e an
dP
over
ty C
ondi
tion
sS
wd
Sw
eden
Inco
me
Dis
trib
utio
n S
urve
y (a
dmin
istr
ativ
ere
cord
s)S
wS
wit
zerl
and
Inco
me
and
Con
sum
ptio
n S
urve
yU
KU
nite
d K
ingd
omF
amil
y E
xpen
ditu
re S
urve
y; F
amil
yR
esou
rces
Sur
vey
US
Uni
ted
Sta
tes
Cur
rent
Pop
ulat
ion
Sur
vey;
Sur
vey
of I
ncom
ean
d P
rogr
am P
arti
cipa
tion


Appendix 5
Robustness ofNational Accounts
Estimates
The Canberra Group 179
1. OverviewNational accounts are compiled by bringing together data from a range of statisticalsurveys and from administrative sources. Making a firm robustness assessment ofthe result is therefore a somewhat different task than the processes describedelsewhere in relation to microdata surveys. Nevertheless, since it is recommendedto compare data coming from household surveys with data from the national accounts,an attempt to assess the reliability of the latter is in order.
It is perhaps easiest to start by asking how reliable is gross domestic product(GDP), the aggregate from national accounts which is most often quoted and istherefore most easily recognised by those not familiar with the whole nationalaccounts system. There are three ways of measuring GDP: as the sum of value addedgenerated by all the enterprises in the economy (the output measure); as the sum ofall the incomes generated in the process (the income measure); or by measuring thegoods and services purchased with this income (the expenditure approach). Conceptuallyall three measures are identical; and the steps taken to ensure that this is also so statisticallyaffect the robustness assessment. It is therefore necessary to look briefly at the quality ofall three measures before making an overall assessment of quality.
2. The output measureAll enterprises in the economy are grouped by statisticians into industries accordingto a standard international classification and these industries are then surveyed withstandard survey techniques to asses the value added of each. The accuracy of theresults depends on a number of factors which differ from industry to industry.
In most countries up to eighty per cent of enterprises employ five or fewer peoplebut the remaining twenty percent of large firms account for up to ninety per cent ofvalue added. Large firms are not equally spread across all industries. Mining,shipbuilding and electricity generation are often only undertaken by large firms.Restaurants, window cleaning and shoe repairing are seldom the main business oflarge enterprises. Some industries such as agriculture, construction and transport arecharacterised by the presence both of some very large enterprises and a proliferationof many small one. Loosely speaking, we may say that survey results for industriesdominated by large firms tend to be better than for those where small scale activity
Appendix 5
180 The Canberra Group
is the norm. A particular difficulty is measuring the activity of self-employed peoplewho slip through the statistical net either accidentally or deliberately. Thisphenomenon is usually referred to as the “hidden” or “informal;” economy.Increasingly statistical offices are taking special measures to try to ensure a reasonableestimate of this type of activity.
The characteristics of an industry may vary from country to country. For examplemost bakeries in France are small scale; in the UK there are large-scale bakeries. InPoland most fishing is done by large-scale trawlers; in Greece artisanal fishing ispredominant. Thus the robustness of measures for the same industry may vary fromone country to another because of local traditions.
Another reason for variation concerns statistical development. In many OECDcountries, the pattern of industrial enquiries was laid down in the sixties and seventieswhen manufacturing industry was seen as the driving force of an economy, the sourceof most employment and of most value added. Since then the importance of serviceindustries has increased but the statistical coverage of them has seldom increasedcommensurately. Initially this may have been due to the perception that many serviceswere state provided (health, education and even cultural services). These and thefinancial services provided by the banking sector were always reasonably wellmeasured by administrative data. The growing importance of private services wasonly recognised at a time when statistical offices were going through a period ofbudget stringency which made survey expansion into this field exceptionally difficult.Nor was it helped by the fact that, since services can be provided by people on themove or operating from home, many fall into the “hidden” economy.
In almost all countries, developing as well as developed, agriculture tends to befairly well measured because of its political and cultural importance.
Summarising, then, we may say that in many countries agriculture and large scalemanufacturing industry are well measured as are publicly provided and financialservices. Private services tend to be much less well covered.
3. The income measureAll value added can be translated into income terms. Let us take as an example aslightly simplified account for a firm with employees. One element of value added,probably a significant proportion, represents payments to employees. Another element(probably small or maybe non-existent) represents taxes payable to government inrelation to productive activities for example rates on buildings and sometimes taxeson the labour force. What is left to the enterprise is distributed either as dividends toshare-holders (if any), interest on loans or is retained as pre-tax income. Informationon all these elements is available to the statistical office from the administrativerecords of the taxation departments - though usually only at such a degree ofaggregation that identification of individual enterprises is impossible.
A reconciliation with the components of the output estimates of value added,described in the previous section, is possible but needs to take into account differentdefinitions and time of recording of the two sources. Most importantly, the statisticiandoing the reconciliation must make judgements about the likely mis-reporting underboth systems. Are the tax authorities or the survey statisticians more likely to capturethe activities of those reluctant or unable to provide accurate information? This

Expert Group on Household Income Statistics
The Canberra Group 181
applies again and in particular to self-employed persons, many of whom fall in the“hidden” economy.
Cynicism or professional pride may prejudice us towards assuming that thestatistical measure is preferable to the administrative one. This is not necessarilyso; tax offices go to a great deal of effort to ensure the efficacy of the tax collectionsystem and make detailed estimates of any income which has escaped their system.
4. The expenditure measureThere are five main components of GDP when measured from the expenditure side.By far the largest is consumption. This can be divided in a number of ways but forthe present purpose, it is most useful to look at a two tier disaggregation. Servicessuch as administration and defence produced by government on behalf of the wholecommunity (public goods) typically constitute seven to eight per cent of GDP inmost OECD countries. These services are measured via the government budget andare thus fairly well measured. (As with most if not all administrative data there maybe a problem matching definitions of concepts and time of recording but these donot give rise to major errors.)
Consumption which benefits households accounted for about 65 to 75 per centof GDP in OECD countries in 1996. In the Scandinavian countries, more socialistthan the other countries at the time, about 70 per cent of the total (thus about half ofGDP) represented expenditure by households and the remaining 30 per cent was thevalue of public services such as health, education and social services provided bygovernment. For the US, in contrast, over 90 per cent of household consumptionrepresented expenditure by the households and less than 10 per cent governmentservices.
Household consumption expenditure is estimated using a wide range of sources.One of the most important sources is the household budget survey. Everythingdescribed under the RAR for such surveys is relevant in this context therefore. Inaddition, some other sources are used to augment budget surveys, especially wherethese are known to be deficient, for example expenditure on drink and tobacco whichis systematically underreported, expenditure on large, infrequent purchases such ascars and household appliances or expenditures affecting groups poorly representedin the budget survey - for example luxuries bought by those in the highest incomeranges.
Within the national accounts, estimates are also made for “institutionalhouseholds” such as boarding schools, hospitals and prisons. Sometimes some non-profit institutions are also included; though with the introduction of the 1993guidelines these should be shown separately.
Investment represents about one quarter of GDP and comes from surveys withvery similar characteristics to those described under the output estimate of GDP.
The remaining components of GDP are exports and imports. (Imports arededucted from the sum of other expenditures to reach GDP.) Exports and imports ofgoods are traditionally measured via the administrative controls of the customsservice. Data from this source is less reliable now than in the past because the declinein the applicability of customs duties means there is less incentive for a stringentcontrol on the information provided to the customs authorities; and the increasing
Appendix 5
182 The Canberra Group
use of containers makes verification more expensive and more difficult. In some cases,for example within the European Union, this administrative data source has driedup and statistical surveys must be instituted to make good the loss. Measuring importsand exports of services was always much less easy and much less accurate thanmeasuring goods and is becoming even more difficult with increased use of theinternet for international sales.
5. Reconciling the three measuresSome indication was given above of the possibility of reconciling the output andproduct measures of GDP. It is also possible to reconcile output and expendituremeasures. This is done product by product. Typically it will be assumed that theestimates of drink and tobacco coming from production is more reliable that theconsumption recorded in household budget surveys and so the household consumptionfigure will be altered accordingly. On the other hand, expenditure by households ontaxis is likely to be more reliable than information from a survey of taxi drivers andin this case a correction is made in the other direction. By working through a largenumber of products, the overall quality of the accounts is improved by ensuring thatthe data finally used make best use of all the various statistical and administrativesources available rather than relying on a single source. The theoretical structure ofthe inter-relationships between output, income and expenditure imposes a verypowerful constraint on the extent of error that can still persist in a balanced set ofaccounts. In addition, the fact that accounts are compiled regularly, at least annuallyand sometimes quarterly, gives another opportunity for plausibility checking sincethe time series evolution of the accounts at detailed level has also to be plausible.
A national accountant will defend his figures on the grounds that conceptuallythey are comprehensive, with estimates included even for difficult to measure areas,and they have been very comprehensively reviewed through these reconciliationmechanisms. Since they integrate data from a variety of sources, it is argued thattheir general level of quality is higher than any one source taken individually.
If we want a comprehensive account for household income, consumption andaccumulation, we may have no choice but to use some national accounting figures,especially in the area of imputed income to households, say in respect of pensioncontributions or provision of state services. In other areas, for example income fromwages and salaries or household consumption expenditure, we may use detailedfigures from a household budget survey but constrain these to the national accountsfigures because the coverage is more exhaustive (including institutional householdssay) and because it is assumed the reconciliation exercise has improved the qualityof the initial estimates.
One problem of reconciling household budget data with national accounts shouldbe noted. The national accounts time series are frequently revised retrospectivelybut it is seldom the case that reconciliation with alternative data sets is carried throughin detail. Thus a data set once reconciled may not remain so for all time.

Appendix 6
Robustness assessmentreport for incomedistribution data
The Canberra Group 183
[COUNTRY]This report is intended to identify known or suspected imperfections in micro-
data on incomes, which may affect the validity of income distribution results orrequire particular care in their interpretation; and to report estimates of the impactof these imperfections on results.
Reports for other countries/datasets may be found on the Canberra Group’s Internetsite: http://www.lisweb.ceps.lu/links/canbaccess.htm
Dataset and years covered by this report:
Compiled by:
Name:
Institution:
Address:
E-mail:
Phone:
Fax:
Date:
Status of this report (Final/provisional)
Any additional comments:
1. NAME, DESCRIPTION AND MAJOR FEATURES OF DATASET1.1 What is the name of the dataset?1.2 What is the sampling frame for the dataset?1.3 What are the main purposes of the survey/register from which the
dataset is drawn?1.4 How is the data obtained?
(E.g. face-to-face interview with head of household. Indicate how much ofthe data is obtained by proxy.)

Appendix 6
184 The Canberra Group
1.5 If data is drawn from more than 1 source, how is the data linked?1.6 What are the achieved sample size and response rates?
(Explain how response rate is calculated. Explain the rules for counting ahousehold as ‘responding’ e.g. whether all adult members of the householdhave to respond.)
1.7 What is the measurement period for income?(Annual? Weekly? Report separately for each income component ifdifferent.)
1.8 Is data collected throughout the year, or at 1 or more points in time?(Explain the arrangements (a) for the dataset as a whole, e.g. are differenthouseholds sampled at different times of the year; and (b) for individualhouseholds - is data collected only once, covering the whole of the incomemeasurement period, or is data collected for sub-periods and thenaggregated?)
1.9 Is income data “current” or retrospective?(Record (a) usual (b) maximum time lags between end of period covered bydata and date of collection.)
1.10 Where classifying variables may change within the incomemeasurement period (e.g. employment status or hours of work), howare values assigned for these variables?
1.11 Have any of these features changed during the past 10 years? Has thedefinition of income variables or derived variables changed over the past 10years? (If so, give details; and indicate the likely effects on incomedistribution results, if not reported below)
1.12 Is the data longitudinal?
2. COMPLETENESS OF COVERAGE OF THE POPULATION2.1 What is the total population of the country?
(Individuals; and households/families if these are recorded in 2.2. Indicatethe year.)
2.2 Which of the groups below are excluded, completely or in part, fromthe sampling frame or the dataset, and what are the likely effects onincome analyses?(Specify the relevant groups)

Expert Group on Household Income Statistics
The Canberra Group 185
Exclusion Size of group Likely effectsexcluded (individuals) on income analysis
2a Geographical areas
2b Groups defined byplace of birth, citizenship,immigration status,nationality or ethnic origin
2c Homeless people
2d People in hospital,care or nursing homes
2e People in hostels(students, nurses etc)
2f Children’s homes
2g Military, police, theirfamilies, civilians living inmilitary installations
2h Foreign armed forces,diplomats etc
2i Prisoners
2j Others(E.g defined by economic activity,age, income level, family size)
2.3 What are the likely effects of non-coverage on results for particulargroups?(E.g. the very elderly, or young males)
2.4 Have there been any non-trivial changes in coverage in the past 10years? If so, what are their likely effects on income distribution results?
2.5 Has the size of particular excluded groups changed significantly overtime? If so, what are the likely effects on results for changes in incomedistribution?
2.6 [Longitudinal datasets only] What are the arrangements for coveringpeople who ‘join’ the population via birth, immigration or movementout of an excluded group, or who leave it due to death, emigration ormovement into an excluded group?
3. SAMPLE DESIGN, NON-RESPONSE BIASSES, WEIGHTING3.1 What are the sampling fraction(s) and sample design?
(Was the sample stratified? If so, how?)
Appendix 6
186 The Canberra Group
3.2 What is known about the effects of sample design on sampling error?(Quote design factors for key income estimates, e.g. mean income fromemployment, if available. Identify any estimates known to have particularlylarge design factors.)
3.3 Is a standard set of weights available? If so, what is their purpose andhow are they derived?(Describe in detail the dimensions employed - e.g. age of individual adultsin 10-year age bands - and the reliability of any independent estimatesused; and the grossing regime, e.g. CALMAR with range of weightsconstrained to 1:2.5.)
3.4 What non-response biasses are known or strongly suspected?(Describe and quantify wherever possible. Indicate how far weighting, ifavailable, is thought to correct for these.)
3.5 What conclusions can be drawn - from comparisons with tax records,benefit records or other administrative records - about possible non-response biasses likely to affect income distribution estimates?(If not already recorded under 3.4. Indicate any weaknesses suspected inadministrative records. Indicate how far weighting, if available, is likely toaffect these potential biasses.)
3.6 What comparisons have been made (besides those reported above) withother data sources, to assess possible response biasses? What do thesecomparisons show?
3.7 Are there any groups (besides those identified above) where non-response problems are suspected (e.g. immigrants working without workpermits).
3.8 Overall, which income estimates are thought to be most at risk ofsubstantial non-response bias? (Report separately for point-in-timeestimates and estimates of income distribution changes over time)
3.9 Have their been any non-trivial changes, over the past 10 years, insample size, sample design, or apparent response biasses? If so, whatare their likely effects on income distribution results?
3.10 [Longitudinal datasets only] What are the extent and pattern ofattrition from the dataset? How is this handled? What are theimplications for the picture of (a) changes in cross-section incomedistribution (b) income mobility?
4. ITEM NON-RESPONSE, IMPUTATION AND EDITING4.1 Which 3 income components have the largest incidence of item non-
response? What is the incidence for these 3?(Measured as ratio of “don’t know plus refusals” to numbers reporting non-zero amounts. Exclude any cases where the entire individual, family orhousehold has been omitted from the dataset. Exclude any components forwhich >95% of respondents report zero income.)
4.2 Are any other income components significantly affected by item non-response?(Where “don’t know plus refusals” exceed 10% of numbers reporting non-zero amounts.)

Expert Group on Household Income Statistics
The Canberra Group 187
4.3 Are any important categorical variables - e.g. age, economic status -significantly affected by item non-response?
4.4 What imputation techniques have been used for the variables identifiedabove?(E.g. hot-decking, closest class mean, neural networks. Indicate the classesinto which data was divided for imputation purposes. Indicate whether anymissing income variables have not been imputed. )
4.5 What top- or bottom-coding has been employed? How manyobservations are affected? What is the estimated effect of top- orbottom-coding? (Report separately for point-in-time estimates andestimates of income distribution changes over time) How have negativeincomes after tax been treated?
4.6 Is the reporting of income net of direct taxes affected by imperfectdata on direct taxes?If so, what are the main practical effects onestimates of the distribution of net incomes? (Specify whether net incomeis obtained from reported net incomes, or gross incomes minus imputed tax.Explain how direct taxes are collected in practice by the tax authorities, e.g.via end-of-year assessment or via ‘pay-as-you earn’ with end-of -yearadjustments)
4.7 What other editing has been employed, affecting over 5% of thesample? How large an impact is this thought to have on measuredincomes? What editing and/or checking takes place at the data-collection stage (e.g. via CAPI checks built into computer programs)?
4.8 Which income results are thought to be most sensitive to anyimperfections (known or suspected) in imputation and editing?(Indicate whether statements are based on quantitative analysis, informedjudgement or just guesses.)
4.9 Is any income data collected using income bands rather than byseeking precise figures? If so, how are values assigned and what arethe likely effects on the accuracy of results?
4.10 Have their been any non-trivial changes, over the past 10 years, in theincidence of item non-response, or in imputation or editing? If so, whatare their likely effects on results for changes in income distribution?
4.11 [Longitudinal datasets only] To what extent is data from earlier timeperiods used to impute income data, or characteristics used in imputingincome data? What are the likely implications for the reliability ofincome distribution and income mobility results?
4.12 [Longitudinal datasets only] Are different grossing regimes providedor used for longitudinal analysis?
5. ACCURACY OF INCOME DATA5.1 How much of the income data was collected by proxy?5.2 How much of the data on earned income was (a) supplied by employer
(b) checked against employer’s statements? How much of the data forother income components is checked against documentation?

Appendix 6
188 The Canberra Group
5.3 How does grossed income data from the micro dataset compare withNational Accounts estimates? What are the implications for incomedistribution estimates?(It may be helpful to use the table below. If comparisons are available forseparate components of investment/property income, report these as well asan aggregate comparison. Comment on any weaknesses in NationalAccounts data, and difficulties with the comparison with micro-data; if aseparate assessment of these points is available, quote the main findingshere and give details of where the assessment can be obtained. Other datasources may be used if they are judged superior to National Accounts orprovide useful additional information.)
Income Grossed Comments ImplicationsComponent estimate from for distribution
micro-data as % estimatesof National Accounts
Wages and Salaries
Self-employment income
Occupational pensions
Investment income
Transfers
Other income
Direct taxes
5.4 Is the picture of employment patterns, in the incomes micro-dataset,consistent with information from Labour Force Survey or other datasources?(Relevant aspects of employment patterns are: percentage of adults inwork - or of adults under 65; percentage holding more than 1 job.)
5.5 How is self-employment income captured in the data source? (Statewhether from business accounts - if so, how the time period of the accountsrelates to the time period covered by the other income data, and how lossesare treated - or from drawings from the business, or some other concept.)How reliable is self-employment income data judged to be? Is self-employment income reported net or gross of taxes?
5.6 Have there been significant changes, over the past 10 years, indifferences between the income captured in the micro-data used forincome distribution statistics and other sources of income data?(If so, report the main changes) If so, what are their likely effects onresults for changes in income distribution?
5.7 Has the relative size of different income components changedsignificantly over time? If so, what are the likely effects on results forchanges in income distribution?

Expert Group on Household Income Statistics
The Canberra Group 189
5.8 Have there been significant changes, over the past 10 years, indifferences between the employment levels captured in the micro-dataused for income distribution statistics and other sources of employmentdata? (If so, report the main changes) If so, what are their likely effectson results for changes in income distribution?
5.9 Any other comments?
6. VALIDITY OF INCOME DATA AS GUIDE TO CONSUMPTIONCAPABILITIES
6.1 What comparisons have been made of median or mean net incomewith expenditure for (a) quantiles of the income distribution (b)particular groups e.g. the self-employed, farmers? What do theseshow? What are the implications for the validity of income data, as aguide to quantiles’/groups’ capacity to consume those goods andservices normally financed from household disposable income? (Reportseparately for point-in-time estimates and estimates of income distributionchanges over time)
6.2 In your country, do cash substitutes - e.g. food stamps, company cars -make significant additions to the incomes of particular groups orsegments of the income distribution? What are the implications for theinterpretation of income distribution results? (Report separately forpoint-in-time estimates and estimates of income distribution changes overtime) What information is available in the incomes micro-dataset?
6.3 What types of housing are subsidised, and to what extent? Are thebeneficiaries concentrated in one segment of the income distribution?What income distribution results are sensitive to this, and to thetreatment of imputed rents for owner-occupiers? (Report separatelyfor point-in-time estimates and estimates of income distribution changesover time)
6.4 Any other comments?
7. HOUSEHOLDS, FAMILIES, INDIVIDUALS, CHILDREN7.1 What are the units of observation for income data?
(E.g. is data collected for both “household” and “individuals”?7.2 How are “households” and/or “families” defined? How is ‘head of
household’ or ‘head of family’ defined?7.3 Which income components are not reported at the level of individuals?7.4 Is it possible to aggregate from “individuals” to “families” or
“households”? What are the smallest and largest units for whichincome can be calculated?
7.5 How accurate are estimates, from the incomes dataset, of the relativenumbers of households, families and individuals? Are reliable controltotals available?
7.6 How are “children” defined?7.7 Is income data collected for children? If so, is it assigned to them or
to other household members?

Appendix 6
190 The Canberra Group
7.8 How are individuals assigned to a “household” or “family”?(E.g. children away from home at educational institution; adults awayfrom home on military service, in hospital or on work.)
7.9 Are the family relationships between different members of thehousehold clearly identified? Is it possible to identify when membersdo not, in general, share incomes/budgets?
7.10 How are students and their income treated?7.11 Have any of these conventions (in 7.1 - 7.10) changed significantly in
the last 10 years? If so, what are the likely effects on the picture ofincome distribution changes?
7.12 Are any of these features particularly important for the analysis ofincome distribution data for your country?
8. GENERAL ASSESSMENT QUESTIONS
Relevance:8.1 Which are the main uses of this source of data?8.2 Who are the main users?8.3 When was the survey started?8.4 Are time series available? If yes, from when?8.5 Have there been any major breaks in series?
Timeliness:8.6 What is the time period required from the end of the data collection to
making the data available for use (processing time)?
Accessibility:8.7 Which forms of dissemination are used?8.8 Are the data released as an anonymised micro-data set for the public?8.9 Are there any meta data included in your publications?
Comparability:8.10 Are the concepts and definitions used in the survey compliant with any
international standard (as for example the 1977 UN Guidelines onIncome Distribution, Consumption and Accumulation of Wealth)?
Coherence:8.11 Is the income source harmonised with other income sources used
within the office?8.12 If not, which other sources do you use for income statistics?

Appendix 7
Extract from“Recommendations of
the task force on statisticson social exclusion andpoverty,” Eurostat, 1998
The Canberra Group 191
Requirements for a First Release or Press Noticeand for Statistics in FocusThe level of detail for background information will inevitably be affected by thetype of publication and the results presented. However, there is minimum levelof information which is necessary to adequately inform users. This information shouldnot only notify the user of any problems which may exist but should also indicatethe effect of any such problems on the data presented. For example, any statementsabout poverty among the working population should assess the effect of theself-employed, in relation to concerns about the reliability of self-employment incomedata.
The minimum requirement for first releases and for Statistics in Focus is as follows.
– For information to be presented in a way that does not tempt the reader to placemore interpretation on the figures than they can reasonably bear. This can be doneby appropriate presentation in graphs, tables and text.
– Terms as used in the text, such as income and social exclusion, should be defined.
– Where information is from sample surveys, an indication of sampling errors shouldbe given: the recommended indicator for measuring sampling error would be relativestandard error i.e. coefficient of variation: standard error divided by mean. Certainlimit(s) should be defined, and if relative standard error exceeds the limit(s) thefigure will not be published
Alternative diagrammatic representations can be extremely effective in presentinginformation of this nature.
– If some information is derived from administrative sources for any country, a clearindication of this will be required. Where known problems with the administrativesource exist these should also be documented. A typical example would be bias interms of coverage.

Appendix 7
192 The Canberra Group
The following warnings may be required according to different topics reported on:
– biases which affect results either due to non-response or from measurement error,for example, the poor quality of income information for self-employed individualsor the non-coverage of those not living in households
– figures which may be sensitive to the assumptions made in processing
– differences, between countries, in the importance of factors not captured in the datasources (e.g. non-cash support)
– any major conflicts with other sources
Reference should be made to any figures systematically pointed by NationalStatistical Institutes as being significantly different to those produced within thatcountry. In such instances the comparability of harmonised data across countries mayoutweigh but not ignore concerns over comparability with national sources
These notes might be incorporated into the body of the text, or might be includedin an information box.
Requirements for more detailed reportsIn more detailed reports which are generally aimed at a more informed audiencesuch warnings as described above should routinely appear in the text and tables, andbe elaborated upon as appropriate in the text or appendices. But in addition,appendices should include information on the following:
– Definitions of all terms and concepts used: net disposable equivalised income, socialexclusion, income cut-offs, reference person, child, and so on
– Source of information: the sampling methods used, sample sizes. The limitationsof the methods used should be indicated, in particular where these vary betweencountries.
– Any biases due to design of the collection method such as the increasingunrepresentative nature of panel surveys. Reference should also be made to anyfactors which vary between countries.
– Coverage of the source such as limitations of the sampling frame, in particular thenon-coverage of the population living in institutions and communal establishments,geographic limitations, and any specific exclusions.
– Levels of non-response or omission both overall, that is persons for whom entirerecords are unavailable, and item non-response, that is availability of a particularvariable. The use of proxy information should be detailed, with an assessment ofthe quality of such information. How non-responses or omissions are treated shouldalso be covered.
– Any available information comparing those included in the statistics with thosenot covered
– Editing, imputation, and classification errors when adjusting for item non-response
– Weighting and grossing systems when adjusting for person non-response
– The sensitivity of comparisons to treatment of subsidies for housing, transport etc.(e.g. reduced bus rail fares for elderly people)
– Equivalisation: the scales used in the report and sensitivity of results to alternativescales including those in national use

Expert Group on Household Income Statistics
The Canberra Group 193
– Specialised measures.
– Sampling errors: a description of sampling errors and their use, provision of designeffects, and guidance to users on the calculation of coefficient of variation.
– Comparability over time, in particular any changes which affect comparisons withfigures published for previous periods
– Comparability with other sources. Reference should be made to the alternativenational publications. In addition, any conflicts with national sources should behighlighted and if possible explained.
– Summary of implication of data imperfections on analytical statements
– Reference any occasional analyses contained in previous volumes in the series orspecial reports on technical issues
– Forms of dissemination and contact points
Compendium, anthology or omnibuspublicationsAn increasingly important statistical output, is the production of publications whichaim to paint pictures of society. Eurostat and many countries produce statisticalyearbooks which cover peoples’ lives in a variety of social and economic themes.
For these types of publication, which draw on a wide range of statistical sources,it becomes inappropriate and impractical to provide detailed quality assessments andmetadata for all the individual sources. Nonetheless the key principles of only usingrobust statements, and highlighting where the underlying statistics are problematicremain of paramount importance.
Moreover these publications, which would not normally include previouslyunreleased statistics, should take care to include references to original sources, aswell as explaining the concepts used, and the implications of using different sources.
For anthologies such as Eurostat’s Social Indicators pocket book, given that thedata are not therein released for the first time, it is not appropriate to provide detailedquality assessment or metadata. Nonetheless, items should be selected for inclusionin these publications on the basis that the key messages are robust. Where themessages are ambiguous or misleading without textual explanations these itemsshould be excluded.


Bibliography
The Canberra Group 195
Atkinson, A. B., L. Rainwater and T. M. Smeeding. 1995. Income Distribution in OECDCountries: Evidence from the Luxembourg Income Study. Social Policy StudiesNo. 18. Paris: OECD.
Atkinson, A.B. 1997. “Bringing Income Distribution in From the Cold,” Economic Journal,107: 297-321.
Atkinson, A.B. 2000. “Is Rising Income Inequality Inevitable? A Critique of theTransatlantic Consensus,” WIDER Annual lecture #3. Helsinki, Finland: UnitedNations World Institute for Development Economics Research.
Atkinson, A.B. and A. Brandolini. 1999. “Promise and Pitfalls in the Use of ‘Secondary’Data-sets: Income Inequality in OECD Countries,” mimeo. Oxford, UK: NuffieldCollege, Oxford University.
Australian Bureau of Statistics (ABS). 1995. A Provisional Framework for HouseholdIncome, Consumption, Saving and Wealth. Canberra, ACT: ABS. June 1995.
Barreiros, L. and D. Ramprakash. 1996. ‘Revision of the UN Guidelines on Statistics ofthe Distribution of Income, Consumption and Accumulation of Households’. Paperprepared for the Twenty-fourth General Conference of the International Associationfor Research in Income and Wealth. Lillehammer, Norway, 19-23 August 1996.
Brandolini, A. 1998. “A Bird’s-Eye View of Long-Run Changes in Income Inequality,”mimeo, Research Department. Rome, Italy: Bank of Italy.
Brandolini, A. 1999. “The Distribution of Personal Income in Post-War Italy: SourceDescription, Data Quality, and the Time Pattern of Income Inequality,” Giornaledegli Economisti e Annali di Economia, 58: 183-239.
Buhman, B., Rainwater, L., Schmaus, G. and Smeeding, T. 1988. Equivalence scales,well-being, inequality and poverty: sensitivity estimates across ten countries usingthe Luxembourg Income Study database, Review of Income and Wealth, Series 33(2): 1115-42.
Burkhauser,R., A. C. Crews, and S.P. Jenkins. 1999. “Testing the significance of incomedistribution changes over the 1980’s business cycle: an international comparison”.Journal of Applies Econometrics 14(3), May-June, 253-272.
Burniaux, J-M, Dang, T-T, Fore, D., Förster, M., d’Ercole, M.M. and Oxley, H. (1998):Income Distribution and Poverty in Selected Countries, Economics Department,Working Papers No. 189, OECD, Paris.
Central Statistical Office. 1981. “The Distribution of Income in the United Kingdom,1978/79,” Economic Trends, 327: 82-91.

Bibliography
196 The Canberra Group
Commission of the European Communities, International Monetary Fund, Organisationfor Economic Co-operation and Development, United Nations, and The World Bank(International Bank for Reconstruction and Development). 1993. System of NationalAccounts 1993. Brussels/Luxembourg: Eurostat; Washington, DC: IMF and TheWorld Bank; Paris: OECD; New York, NY: United Nations. ST/ESA/STAT/SER.F/2/Rev.4.
Cowell, F. 1995. Measuring income inequality. Harvester Wheatsheaf, New York.
Cowell, F. 2000. “Measurement of Inequality.” In A.B. Atkinson and F. Bourgignon (eds.),Handbook of Income Distribution. New York: Elsevier-North Holland Publishers,pp. 87-166.
Deininger, K. and L. Squire. 1996. “A New Data Set Measuring Income Inequality,”World Bank Economic Review, 10: 565-591.
de Vos, Klaas & M. Asghar Zaidi (1997): Equivalence Scale Sensitivity of PovertyStatistics for the Member States of the European Community. Review of Income andWealth, Series 43, No. 3.
Dupré, Marie-Thérèse. 1997. ‘The Current Status of the Concept of Income fromEmployment and Its Relationship with Existing Income Concepts’. Paper preparedfor the Advisory Income Steering Group. Statistical Office of the EuropeanCommunities, Directorate of Social and Regional Statistics and Structural Plans.Luxembourg, 13–14 January 1997. Document AISG/5/1997.
Eurostat (Statistical Office of the European Communities). 1995. European System ofAccounts (ESA 1995). Luxembourg: Office for Official Publications of the EuropeanCommunities.
———. 1998a. ‘Recommendations of the Task Force on Social Exclusion and Poverty’.Luxembourg: Eurostat. Mimeographed.
———. 1998b. “Procedure for Calculating Imputed Rents.” Working Group: Statisticson Income, Social Exclusion and Poverty,” DOC.PAN103/99. Luxembourg, Eurostat,December.
———. 2000a. “Seminar on Income Methodology for Statistics on Households: DraftLong Conclusions.” Working Group: Statistics on Income, Social Exclusion andPoverty,” DOC.E2/SEP/10/2000. Luxembourg, Eurostat
———. 2000b. “Summary of Criticisms and Suggestions Concerning Methods ofCalculating Imputed Rents,” DOC.PAN144/2000. Luxembourg, Eurostat, February.
Flora, P. 1987. State, Economy and Society in Western Europe 1815-1975, Volume II.Frankfurt: Campus Verlag.
Förster, M. 1993. “Comparing Poverty in 13 OECD Countries: Traditional and SyntheticApproaches”. LIS Working Paper No. 100. Luxembourg.
Förster, M. 2000. “Trends and Driving Factors in Income Distribution and Poverty in theOECD Area,” Labour Market and Social Policy Occasional Paper no 42, Paris: OECD.
Franz, A., D. Ramprakash and J.W.S. Walton. 1998. ‘Statistics on the Distribution ofIncome, Consumption and Accumulation of Households (DICAH)’. Report toEUROSTAT. Vienna, London and Luxembourg. August 1998. Mimeographed.
Expert Group on Household Income Statistics
The Canberra Group 197
Franz, A. 1996a. ‘Revision of the UN Guidelines on Statistics of the Distribution ofIncome, Consumption and Accumulation of Households’. Paper prepared for theTwenty-fourth General Conference of the International Association for Research inIncome and Wealth. Lillehammer, Norway, 19-23 August 1996.
———. 1996b. ‘Manual on the Distribution of Income, Consumption and Accumulationof Households’. Report prepared for the Advisory Income Steering Group. StatisticalOffice of the European Communities, Directorate of Social and Regional Statisticsand Structural Plans. Luxembourg, 13-14 January 1997. Document AISG/3/1997.
Goode, R. 1977. ‘The Economic Definition of Income’. In Comprehensive IncomeTaxation, ed. J.A. Pechman, pp. 1-36. Washington, DC: The Brookings Institution.
Gottschalk, P. and T.M. Smeeding. 2000. “Empirical Evidence on Income Inequality inIndustrialized Countries.” In A. B. Atkinson and F. Bourgignon (eds.), Handbook ofIncome Distribution. New York: Elsevier-North Holland Publishers, pp. 261-308.
Gottschalk, P. and T.M. Smeeding. 1997. “Cross-National Comparisons of Earnings andIncome Inequality,” Journal of Economic Literature, XXXV (June): 633-687.
Harris, T. 1999. “The Effects of Taxes and Benefits on Household Income,” EconomicTrends, 545 (April): 27-63
Hicks, J.R. 1946. Value and Capital: An Inquiry into Some Fundamental Principles ofEconomic Theory. 2nd edition. Oxford: Clarendon Press.
ILO (International Labour Organization). 1979. An Integrated System of Wages Statistics:A Manual on Methods. Geneva: International Labour Office.
———. 1994. Household Income and Expenditure Surveys. Sources and Methods: LabourStatistics, Vol. 6. Geneva: International Labour Office.
———. 1998a. Measurement of Income from Employment. Report prepared for theSixteenth International Conference of Labour Statisticians. Geneva, Switzerland,6-15 October 1998. ICLS/16/1998/II.
———. 1998b. Final Report of the Sixteenth International Conference of LabourStatisticians, Geneva, Switzerland, 6-15 October 1998. Geneva: International LabourOffice.
International Expert Group on Household Income Statistics (‘Canberra Group’). 1997.Papers and Final Report of the First Meeting on Household Income Statistics,Canberra, Australia, 2–4 December 1996. Belconnen, ACT: Australian Bureau ofStatistics. February.
———. 1998. Papers and Final Report of the Second Meeting on Household IncomeStatistics, Voorburg, The Netherlands, 9-11 March 1998. Voorburg and Heerlen:Statistics Netherlands. May.
———. 1999. Papers and Final Report of the Third Meeting on Household IncomeStatistics, Ottawa, Ontario, Canada, 7-9 June 1999. Ottawa, Ontario: StatisticsCanada. November.
Jain, S. 1975. Size Distribution of Income. A Compilation of Data. Washington, DC: TheWorld Bank.
Jäntti, M. and S. Danziger. 1998. “Income Poverty in Advanced Countries”, LISWorking Paper No. 193, Luxembourg.

Bibliography
198 The Canberra Group
Johnson, D. and T.M. Smeeding. 2000. “Who are the Poor Elderly? An ExaminationUsing Alternative Poverty Measures,” mimeo, Center for Policy Research, TheMaxwell School, Syracuse, NY: Syracuse University, January.
Kravis, I.B. 1962. The Structure of Income. Some Quantitative Essays. Philadelphia:University of Pennsylvania Press.
Kuznets, S. 1963. “Quantitative Aspects of the Economic Growth of Nations: VIII.Distribution of Income by Size,” Economic Development and Cultural Change, 11(2):1-80.
Lupton, J. and F.Stafford. 2000. “Five years older: much richer or deeper in debt?” mimeo,Panel Study of Income dynamics, Institute for Social Research, Ann Arbor, MI.,University of Michigan
National Research Council. 1995. Measuring Poverty – A New Approach, NationalAcademy Press.
Norrlof, Claes. 1985. ‘Issues in the Revision of the International Income DistributionGuidelines’. Paper prepared for the Nineteenth General Conference of theInternational Association for Research in Income and Wealth. Noordwijkerhout,Netherlands, 25-31 August 1985.
Nygård, F. and A. Sandström 1981. Measuring Income Inequality. Stockholm: Almquist& Wiksell International.
Paukert, F. 1973. “Income Distribution at Different Levels of Development: A Survey ofEvidence,” International Labour Review, 108: 97-125.
Ramprakash, D. 1997. ‘Revision of the UN Guidelines on Statistics of the Distribution ofIncome, Consumption and Accumulation of Households: Framework Issues’. Reportprepared for the Advisory Income Steering Group. Statistical Office of the EuropeanCommunities, Directorate of Social and Regional Statistics and Structural Plans.Luxembourg, 13–14 January 1997. Document AISG/4/1997.
Ryscavage, P. 1995. “A Surge in Growing Income Inequality?” Monthly Labor Review,118(8): 51-61.
Sawyer, M. 1976. “Income Distribution in OECD Countries.” OECD Economic Outlook.Occasional Studies. Paris: Organisation for Economic Co-operation andDevelopment.
Sen, A. 1992. Inequality Reexamined. Cambridge, MA: Harvard University Press.
Simons, H.C. [1938] 1980. Personal Income Taxation: The Definition of Income as aProblem of Fiscal Policy. Midway Reprint. Chicago, IL: The University of ChicagoPress.
Smeeding, T.M. 1977a. “The Anti-Poverty Effectiveness of In-Kind Transfers,” Journalof Human Resources, XII (Summer): 360-378
Smeeding, T.M. 1977b. “The Economic Well-Being of Low Income Households:Implications for Income Inequality and Poverty.” In M. Moon and E. Smolensky(eds.), Improving Economic Measures of Well-being. New York: Academic Press,pp229-256
Smeeding, T.M. 1982. Alternative Methods for Valuing Selected In-Kind Transfers andMeasuring Their Impact on Poverty. U.S. Bureau of the Census Technical Report#50. Washington, DC: Government Printing Office, April.
Expert Group on Household Income Statistics
The Canberra Group 199
Smeeding, T.M. 1996. ‘The IARIW Session on International Standards on Income andWealth Distribution: A Summary’. Paper prepared for the First meeting of theInternational Expert Group on Household Income Statistics. Canberra, ACT,2-4 December 1996.
Smeeding, T.M. 2000. “Changing Income Inequality in OECD Countries: Updated Resultsfrom the Luxembourg Income Study (LIS).” In R. Hauser and I. Becker (eds.), TheChanging Distribution of Income. Berlin, Germany: Springer-Verlag, in press.
Smeeding, T.M., P. Saunders, J. Coder, S. Jenkins, J. Fontall, A. Hagenaars, R. Hauser,and M. Wolfson.. 1993. “Poverty, Inequality and Family Living Standards ImpactsAcross Seven Nations: The Effect of Noncash Subsidies for Health, Education andHousing,” Review of Income and Wealth, 39(3)(September): 229-256
Smeeding, T., M. Ward, I. Castles, and H. Lee. 2000. “Cross-Country Comparisons ofInequality,” mimeo, Canberra Group Meeting, LIS, Luxembourg, May.
Statistics Canada. 1995. Income Distribution by Size in Canada, Ottawa, Catalogue No.13-207-XPB.
Statistics Canada. 1997. Household Facilities and Equipment, Catalogue No. 64-202XPB.
Statistics Canada. 1980. Income of Spending Units and Economic Facilities: A Study ofConcepts and Relationship Catalogue No. 8-3301-518.
Szekely, M. and M. Hilgert. 1999. “What’s Behind the Inequality We Measure: AnInvestigation Using Latin American Data for the 1990s,” mimeo. Washington, DC:IDB, December 3.
Tabatabai, H. 1996. Statistics on Poverty and Income Distribution: An ILO Compendiumof Data. Geneva: International Labour Office.
United Nations Economic Commission for Asia and the Pacific. 1979. Economic andSocial Survey of Asia and the Pacific, 1978. Bangkok: United Nations.
United Nations Economic Commission for Europe. 1957. “Income Distribution in WesternEurope.” In Economic Survey of Europe, 1956, part III. Geneva: United Nations.
United Nations Economic Commission for Europe. 1967. Incomes in Post-War Europe:Study of Policies, Growth and Distribution. Geneva: United Nations.
United Nations, 1977. Provisional Guidelines on Statistics of the Distribution of Income,Consumption and Accumulation of Households. Studies in Methods, Series M, No. 61.New York, NY: United Nations. ST/ESA/STAT/SER.M/61.
———, 1981. A Survey of National Sources of Income Distribution Statistics. Studies inMethods, Series M, No. 72. New York, NY: United Nations. ST/ESA/STAT/SER.M/72.
———,1985. National Accounts Statistics: Compendium of Income Distribution Statistics.Statistical Papers, Series M, No. 79. New York, NY: United Nations. ST/ESA/STAT/SER.M/79.
———, and United Nations Economic Commission for Europe, Conference of EuropeanStatisticians. 1989. ‘Items in the Revision of the SNA which are Relevant from thePoint of View of Statistics of Income of Households: Note by the Secretariat’. WorkSession on Statistics of the Distribution of Income of Households, Working PaperNo. 3. Geneva, 25-27 September 1989.

Expert Group onHousehold Income
Statistics
The Canberra International ExpertGroup on Household IncomeStatistics met between December1996 and May 2000 to developstandards on conceptual andpractical issues related to theproduction of household incomedistribution statistics. The aimwas to improve national andinternational statistics in this field.These recommendations are theculmination of the Group’s work.They will be of interest both to datacompilers and to data analysts aswell as to a wide range of users ofthese important statistics.
ISBN 0-9688524-0-8
cover.p65 2/14/2001, 3:56 PM1

Bibliography
200 The Canberra Group
———, Department for Economic and Social Information and Policy Analysis, StatisticalDivision. 1998a. Household Accounting: Experiences in the Use of Concepts andTheir Compilation. Vol. 1, Household Sector Accounts. Studies in Methods,Handbook of National Accounting, Series F, No. 75. New York, NY: United Nations.ST/ESA/STAT/SER.F/75.
———, ———, ———. 1998b. Household Accounting: Experiences in the Use ofConcepts and Their Compilation. Vol. 2, Household Satellite Extensions. Studies inMethods, Handbook of National Accounting, Series F, No. 75. New York, NY: UnitedNations. ST/ESA/STAT/SER.F/75.
U.S. Bureau of the Census. 1998. “Money Income in the United States: 1997 (With SeparateData on Valuation of Noncash Benefits),” Current Population Reports, Series P-60,No. 200. Washington, DC: Government Printing Office.
Walton, J.W.S. 1996. ‘Towards a Revision of the UN Guidelines on Statistics of theDistribution of Income, Consumption and Accumulation of Households’. Paperprepared for the Twenty-fourth General Conference of the International Associationfor Research in Income and Wealth. Lillehammer, Norway, 19-23 August 1996.
———. 1997. ‘Links between Micro-Level Concepts of Income and the NationalAccounts’. Report prepared for the Advisory Income Steering Group. Statistical Officeof the European Communities, Directorate of Social and Regional Statistics andStructural Plans. Luxembourg, 13–14 January 1997. Document AISG/1/1997.
Whiteford, P. (1985) A Family’s Needs: Equivalence Scales, Poverty and Social Security,Research
Paper No. 27, Development Division, Canberra, Department of Social Security.
World Institute for Development Economics Research (WIDER). 1999. World IncomeInequality Database, Beta 3. Helsinki, Finland: WIDER, November 8.
Related Documents