http://jit.sagepub.com/ Journal of Industrial Textiles http://jit.sagepub.com/content/43/4/483 The online version of this article can be found at: DOI: 10.1177/1528083712463400 2014 43: 483 originally published online 30 October 2012 Journal of Industrial Textiles Roohollah Bagherzadeh, Masoud Latifi, Saeed Shaikhzadeh Najar and Lingxue Kong diameter and network porosity electrospun multilayer nano-microfibrous assemblies: Effect of fiber Experimental verification of theoretical prediction of fiber to fiber contacts in Published by: http://www.sagepublications.com can be found at: Journal of Industrial Textiles Additional services and information for http://jit.sagepub.com/cgi/alerts Email Alerts: http://jit.sagepub.com/subscriptions Subscriptions: http://www.sagepub.com/journalsReprints.nav Reprints: http://www.sagepub.com/journalsPermissions.nav Permissions: http://jit.sagepub.com/content/43/4/483.refs.html Citations: What is This? - Oct 30, 2012 OnlineFirst Version of Record - Mar 21, 2014 Version of Record >> at DEAKIN UNIV LIBRARY on May 19, 2014 jit.sagepub.com Downloaded from at DEAKIN UNIV LIBRARY on May 19, 2014 jit.sagepub.com Downloaded from

Welcome message from author
This document is posted to help you gain knowledge. Please leave a comment to let me know what you think about it! Share it to your friends and learn new things together.
Transcript

http://jit.sagepub.com/Journal of Industrial Textiles
http://jit.sagepub.com/content/43/4/483The online version of this article can be found at:
DOI: 10.1177/1528083712463400
2014 43: 483 originally published online 30 October 2012Journal of Industrial TextilesRoohollah Bagherzadeh, Masoud Latifi, Saeed Shaikhzadeh Najar and Lingxue Kong
diameter and network porosityelectrospun multilayer nano-microfibrous assemblies: Effect of fiber
Experimental verification of theoretical prediction of fiber to fiber contacts in
Published by:
http://www.sagepublications.com
can be found at:Journal of Industrial TextilesAdditional services and information for
http://jit.sagepub.com/cgi/alertsEmail Alerts:
http://jit.sagepub.com/subscriptionsSubscriptions:
http://www.sagepub.com/journalsReprints.navReprints:
http://www.sagepub.com/journalsPermissions.navPermissions:
http://jit.sagepub.com/content/43/4/483.refs.htmlCitations:
What is This?
- Oct 30, 2012OnlineFirst Version of Record
- Mar 21, 2014Version of Record >>
at DEAKIN UNIV LIBRARY on May 19, 2014jit.sagepub.comDownloaded from at DEAKIN UNIV LIBRARY on May 19, 2014jit.sagepub.comDownloaded from

2014, Vol. 43(4) 483–495
! The Author(s) 2012
Reprints and permissions:
sagepub.co.uk/journalsPermissions.nav
DOI: 10.1177/1528083712463400
jit.sagepub.com
Article
Experimental verificationof theoretical predictionof fiber to fiber contactsin electrospun multilayernano-microfibrousassemblies: Effect of fiberdiameter and networkporosity
Roohollah Bagherzadeh1, Masoud Latifi1,Saeed Shaikhzadeh Najar1 and Lingxue Kong2
Abstract
Average number of fiber-to-fiber contacts in a fibrous structure is a prerequisite to investigate
the mechanical, optical and transport properties of stochastic nano-microfibrous networks.
In this research work, based on theoretical analysis presented for the estimation of the
number of contacts between fibers in electrospun random multilayer nanofibrous assembles,
experimental verification for theoretical dependence of fiber diameter and network porosity
on the fiber to fiber contacts has been provided. The analytical model formulated is com-
pared with the existing theories to predict the average number of fiber contacts of nanofiber
structures. The effect of fiber diameters and network porosities on average number of fiber
contacts of nano-microfiber mats has been investigated. A comparison is also made between
the experimental and theoretical number of inter-fiber contacts of multilayer electrospun
random nano-microfibrous networks. It has been found that both the fiber diameter and the
network porosity have significant effects on the properties of fiber-to-fiber contacts.
Keywords
Nano-microfiber, fiber to fiber contact, nanofibrous structures, electrospinning
1Textile Engineering Department, Textile Excellence & Research Centers, Amirkabir University of Technology
Hafez Ave, Tehran, Islamic Republic of Iran2Institute for Frontier Materials, Deakin University Waurn Ponds Geelong, Australia
Corresponding author:
Roohollah Bagherzadeh, Amirkabir University of Technology Hafez Ave., Tehran, Islamic Republic of Iran.
Email: [email protected]
at DEAKIN UNIV LIBRARY on May 19, 2014jit.sagepub.comDownloaded from

Introduction
Electrospinning as an effective and promising technique for the production ofnanofibers provides a mat of extremely fine fibers with small pore sizes. Thesmall fiber diameter and porous structure of the nanofiber mats gives rise to alarge specific surface area. This is advantageous in a wide variety of applicationssuch as high-performance filters, scaffold in tissue engineering, separation mem-branes, reinforcement in composite materials, templates for the preparation offunctional nanotubes and many others [1–5]. In all of these applications, it is cru-cial to have an estimation of the average number of fiber-to-fiber contacts withinthe assembly.
The estimation of the fiber-to-fiber contacts in a fibrous material is one of themost important parameters for investigation of many properties and applicationsof a fibrous assembly such as mechanical properties, porosity and pore size dis-tribution, filtration performance, cell infiltration and so on. It is believed thatwhen a fibrous assembly is deformed by an external force, the resisting andrestoring forces thus produced within the structure are persisted and transmittedthrough the fiber contact points [6]. Also, one of the well-documented approachesfor predicting the pore structure of fibrous material is based on knowing thenumber of fiber contacts in fiber assembly [7–13]. Thus, the number of fibercontacts plays an important role for study of different aspects of fibrousassembly.
The statistical geometry of different fibrous materials [6–9,11,12,14–17] and alsopaper and line networks [13,16,18] have been studied by many researchers up tonow. In earlier studies of the fiber contact in fibrous materials, and more completework in this regard, have been carried out by Komori and Makishima [6,19], Pan[7,13,14] and Sampson et al. [10–12,16,17,20]. Sampson and his co-workers in theirworks extended the work of Corte and Lloyd by incorporating the influence of fibrewidth and introduced a variable that characterizes the fibrous network, meancoverage ( �c), which is defined as the expected number of fibers covering a pointin the plane of support of the network [11,12,20]. They proposed that the prob-ability that a point in the plane of the network has coverage c is given by thePoisson probability as following:
P cð Þ ¼e� �c �cc
c!for c ¼ 0, 1, 2, . . . ð1Þ
During the application of the previous theories to the nano-microfiber assem-blies, however, some problems have been revealed. First of all, all theories devel-oped by Pan and Komori and Makishima are adjusted for general fiber assembleswith definite fiber aspect ratio such as nonwoven materials. For these materialsconstituting staple fibers, one can easily determine average fiber length in theassembly and feed it to the geometrical model to determine the number of fibercontact in the fiber network. However, in the nanofiber assemblies like electrospun
484 Journal of Industrial Textiles 43(4)
at DEAKIN UNIV LIBRARY on May 19, 2014jit.sagepub.comDownloaded from

nanofiber mats, it is hard to determine the mean length of the fibers in the assem-blies owing to unstable electrostatic forces during making of nanofiber layers inelectrospinning process. Secondly, it can be proven, as we have theoretically shownelsewhere [21], that Sampson’s prediction of the number of crossing in the fiberassembly is too low, leading to a much lower average number of fiber contacts.Since these issues are critical to further studies, a modified theoretical analysis isdeveloped by the authors which is reported in details elsewhere [21]. In thatresearch work, they have developed a modified theoretical analysis for obtainingthe number of fiber-to-fiber contacts in multilayer nanofibrous materials. Intheir approach, they first considered the statistical geometry of single-layerrandom nanofiber mats and then derived its average contact numbers. Sinceactual multilayer nanofiber mats have an appreciable structural component inthe third dimension, they considered the superposition of single-layer mats toform a multilayer mat. They noted that in a nanofibrous network of a givenmean fiber diameter ! and mean coverage �c, the average contact probability offibers can be given by:
�PContact, iþ1 ¼8� �c
�!1�
!A
�
� ��ncont,x
� �ð2Þ
where � is the mean fiber length, �ncont, x is the average number of fiber contacts on afiber in the fibrous structure and A is a function of mean fiber diameter and themean ligament length in the fibrous networks (��) as follows:
A ¼ �Ln tansin�1 !��
2
!" #ð3Þ
The average number of contacts on a random network, �ncont, ;, can beobtained by:
�ncont,; ¼4� logð1="Þ�
�!þ 8! logð1="ÞAð4Þ
To obtain the average number of fiber-to-fiber contacts per unit fiberlength in the nanofiber assembly, they [21] simply divided equation (4) by �, andtherefore:
�ncont, ;, fib ¼4� logð1="Þ
�!þ 8!A logð1="Þð5Þ
So, the expected average number of fiber-to-fiber contacts per unit fiber lengthof a single-layer random nanofiber network is dependent only on the porosityof the fibrous network, the fiber diameter and a function of aspect ratio of
Bagherzadeh et al. 485
at DEAKIN UNIV LIBRARY on May 19, 2014jit.sagepub.comDownloaded from

constituent fibers. As they assumed each single layer has a thickness twice the fiberdiameter, by having the final thickness (t) of a multilayer nanofiber mats, theaverage number of contacts per unit length in a multilayered nanofibrous mats( �Ncont, ;, fib) can be obtained by equation (6).
�Ncont, ;, fib ¼ ð2n� 1Þ4� logð1="Þ
�!þ 8!A logð1="Þð6Þ
where n is the number of single layers in the multilayered nanofiber mats which canbe obtained by:
n ¼t
2!ð7Þ
Therefore, by having the structural and morphological parameters of a nanofi-ber structure including mean fiber diameter (!), porosity (") and thickness of multi-layer mats (t), one can determine the expected average number of fiber contacts in amultilayer nanofiber structure composed of n layers for different applications andfurther analysis such as analyze mechanical properties, pore size and pore sizedistribution and so on, which is reported in detail elsewhere [21].
Equation (6) is not easily verified because the extent of fiber-to-fiber contacts isdifficult to measure in multilayer networks. Experimental estimates of fractionalcontact area obtained from image analysis of cross-sections of paper embedded inresin is reported by Niskanen et al. [22] and Sampson et al. [23,24]. Because it isdifficult to obtain a section along the full length of any fiber in a nanofibrousstructure, these techniques are not readily applicable to the quantification of thenumber of fiber-to-fiber contacts per unit length. More recently, using ConfocalScanning Laser Microscopy (CLSM) to obtain three-dimensional (3D) stacks ofimages from fibrous [23] and nanofibrous assemblies [2] has been addressed bydifferent authors and we extend their analysis here for our experimental study.
Therefore, the objective of this research work is to investigate the effect of the-oretical dependence of fiber diameter and network porosity on average number offiber contacts in nano-microfiber mats by using CLSM images.
Materials and methods
Preparation of nano-microfiber mats
Polycaprolactone (PCL, 80000MW, Sigma-Aldrich, St. Louis, MO) was dissolvedin Chloroform/Methanol (3:1) (Sigma-Aldrich, St. Louis, MO) at a concentrationranged from 10 to 16%wt polymer in solvent. CdSe-CdZnSZnSZnSZnS colloidsquantum dot (QDs, Invitrogen Co., USA) with emission peak 578 nm and averageparticle diameter 5.72 nm were added to the polymer solution at 8%v/v to encap-sulate them inside the fibers and make them visual through CLSM. Polymer
486 Journal of Industrial Textiles 43(4)
at DEAKIN UNIV LIBRARY on May 19, 2014jit.sagepub.comDownloaded from

solution was fed by syringe pump (KD Scientific, USA) at a rate of 0.55ml/hthrough a 21G blunt tipped needle. A voltage of 16–20 KV was applied to theneedle tip with a high voltage power supply (Gamma High Voltage Research,Ormond Beach, FL, USA). A set of collectors was placed with needle-tip to col-lector distance 15 cm, as described elsewhere [1]. The fibrous scaffolds then weredried in a controlled atmosphere at ambient temperature for 1 day and in vacuumof less than 5mmHg for at least 12 h and then were stored in a dessicator beforetesting.
To facilitate visualization of the fibers in the scaffolds, colloids QDs wereblended with polymer solution for 2 h before electrospinning (Figure 1). Afterthat, aqueous QD–PCL blend solutions were electrospun to make the fibrous scaf-fold, in which QDs were confined. After a pre-study of the best volume percent ofQDs in the polymer solution, 8% v/v was chosen to make the fibers sufficientlybright and uniformly fluorescent.
Figure 1. A schematic mechanism for incorporating the quantum dots (QDs) into the nano-
microfiber structure [2].
Bagherzadeh et al. 487
at DEAKIN UNIV LIBRARY on May 19, 2014jit.sagepub.comDownloaded from

Surface morphology of nanofibrous scaffolds
The average diameter of the electrospun fibers was observed by a scanning electronmicroscope (SEM) (Zeiss, Supra550). Images were taken using a microscope oper-ated at an accelerating voltage of 2–10 kV, after sputter coating with gold (BAL-TECSCD 050 Sputter coater, UK). Diameters of the electrospun nanofibers wereanalyzed from the SEM images using image analysis software (ImageJ, NationalInstitutes of Health, USA). Typical SEM photographs of fibrous scaffolds withdifferent polymer concentrations are shown in Figures (2–5).
Figure 3. Scanning electron microscope (SEM) micrograph of 14% wt/v polycaprolactone (PCL)
in solvent.
Figure 2. Scanning electron microscope (SEM) micrograph of 16% wt/v polycaprolactone (PCL)
in solvent.
488 Journal of Industrial Textiles 43(4)
at DEAKIN UNIV LIBRARY on May 19, 2014jit.sagepub.comDownloaded from

Nanofibrous network porosity
The porosity of the nano-microfiber mats was measured using gravimetry method.The thicknesses of the scaffolds were measured using CLSM reconstructed images,the details of which can be found elsewhere [2]. The volume of the structures couldbe determined using the measurement of the thickness and knowing the diameter ofthe mats. The mass of the scaffold was also measured for determination of theapparent density of the mats, �mats. The porosity, ", was then calculated accordingto the equation (8) by having the density of PCL, 1.145 g/mL,
" ¼ 1��mats
�materialð8Þ
Figure 5. Scanning electron microscope (SEM) micrograph of 10% wt/v polycaprolactone (PCL)
in solvent.
Figure 4. Scanning electron microscope (SEM) micrograph of 12% wt/v polycaprolactone (PCL)
in solvent.
Bagherzadeh et al. 489
at DEAKIN UNIV LIBRARY on May 19, 2014jit.sagepub.comDownloaded from

Microscopic measurement of fiber-to-fiber contacts
The measured parameters associated with the fiber-to-fiber contacts included thenumber of fiber-to-fiber contacts and the length of free fiber (ligament length).These parameters were measured directly in stacks of images of nano-microfibermats obtained by using a Confocal laser scanning microscope and a� 60 oil-immersion lens. The inspection area of each image was 300� 300 mm2. All thecontacts in the images were counted and divided by the average fiber length ofthe fibers within the image to calculate the average number of fiber-to-fiber con-tacts per unit length of the fibers for each sample. Typical stacks of images of PCL10%, 12%, 14% and 16% are shown in Figure 6. To measure the mean ligamentlength of the fibers in each image, a line was drawn between the centers of twoneighboring contacts along each fiber axis in the image and the length of the linewas measured as the ligament length. Thickness of each sample was also
Figure 6. Confocal scanning laser microscopy (CLSM) stacks of images for polycaprolactone
(PCL) 10% (a), PCL 12% (b), PCL 14% (c), and PCL 16% (d).
490 Journal of Industrial Textiles 43(4)
at DEAKIN UNIV LIBRARY on May 19, 2014jit.sagepub.comDownloaded from

measured from the reconstructed images from the stacks of images by using ImageJsoftware.
Results and discussion
Average fiber diameter
To measure the average diameter of nano-microfiber mats, 100 fibers in the SEMmicrograph were selected randomly and the average value of them was consideredas the average fiber diameter. Figure 7 shows the histogram of fiber diameters fordifferent samples. The average diameter of fibers for different samples based on theabove procedure is also presented in Table 1.
It can be easily confirmed that with increasing concentration of polymer solution(keeping other parameters constant) the average fiber diameter increases. Thelarger fiber diameters at high concentrations are attributed to the viscosity of thesolution that was high enough to lower the bending instability of the jet and con-sequently, decreasing the drawing forces in the spinning zone [1].
Figure 7. Histogram of fiber diameters for different specimens.
Bagherzadeh et al. 491
at DEAKIN UNIV LIBRARY on May 19, 2014jit.sagepub.comDownloaded from

Average number of fiber to fiber contacts
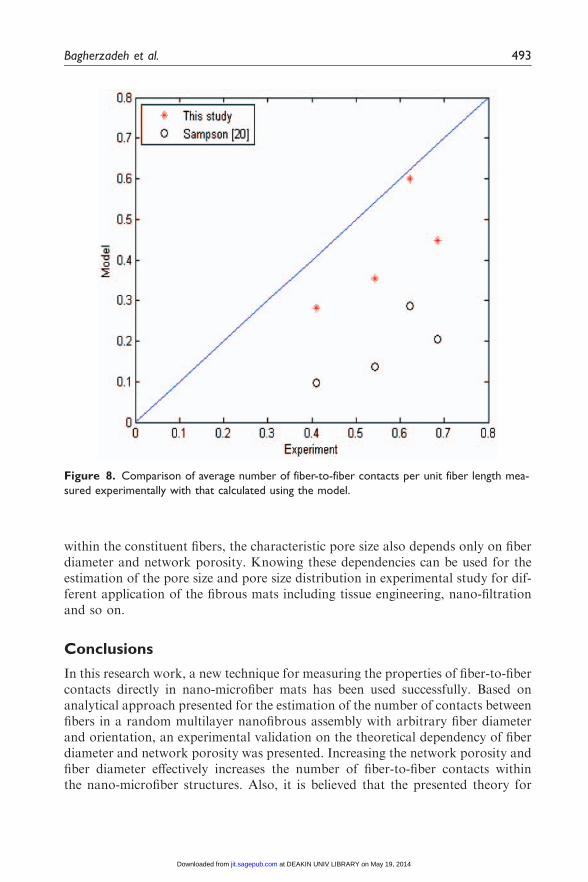
To investigate the influence of different parameters affecting the average number offiber-to-fiber contacts, as given by equation (5), the experimental data are summar-ized in Table 2. It can be seen from Table 2 that the total number of contacts fallslinearly with nano-microfiber mats porosity; this could be due to the fact thatincreasing porosity effectively increases the number of fiber-to-fiber contactswithin the nano-microfiber structures. The calculated and measured fiber contactsare also depicted in Figure 8. Clearly there is good agreement between theory andmeasurement for the results obtained by the presented model. Although the modelpresented by Sampson [20] can also predict the trend of the dependency of fiberdiameters and porosities in the samples, their theoretical values fall far short of theexperimental values.
The expected number of fiber contacts is an important property because thereciprocal of that gives the mean ligament length (mean length between contacts)[21]. Since ligament lengths in a fibrous structure forms the boundaries of pores
Table 1. Average nano-microfiber diameters for different specimens.
Samples
Mean
diameter (mm)
Standard
deviation (mm)
PCL 10% 0.5825 0.3070
PCL 12% 0.7625 0.4692
PCL 14% 0.8690 0.4028
PCL 16% 1.0062 0.4658
Table 2. Fiber and network properties.
Samples
Mean network
porosity (%)
No. of fiber-to-fiber contacts
per unit fiber length (mm�1)
Mean ligament
length (mm)
Experiment Model Experiment Model
This study PCL 10% 77.21� 1.21 0.6215� 0.033 0.5989 1.6090� 0.008 0.0017
PCL 12% 78.33� 3.12 0.6839� 0.043 0.4470 1.4622� 0.022 2.2371
PCL 14% 83.04� 2.12 0.5430� 0.019 0.3539 1.8416� 0.076 2.8257
PCL 16% 85.67� 0.87 0.4108� 0.052 0.2818 2.4343� 0.201 3.5486
Sampson [20] PCL 10% 77.21� 1.21 0.6215� 0.033 0.2856 1.6090� 0.008 0.0035
PCL 12% 78.33� 3.12 0.6839� 0.043 0.2039 1.4622� 0.022 4.9044
PCL 14% 83.04� 2.12 0.5430� 0.019 0.1365 1.8416� 0.076 7.3260
PCL 16% 85.67� 0.87 0.4108� 0.052 0.0978 2.4343� 0.201 10.2249
492 Journal of Industrial Textiles 43(4)
at DEAKIN UNIV LIBRARY on May 19, 2014jit.sagepub.comDownloaded from
within the constituent fibers, the characteristic pore size also depends only on fiberdiameter and network porosity. Knowing these dependencies can be used for theestimation of the pore size and pore size distribution in experimental study for dif-ferent application of the fibrous mats including tissue engineering, nano-filtrationand so on.
Conclusions
In this research work, a new technique for measuring the properties of fiber-to-fibercontacts directly in nano-microfiber mats has been used successfully. Based onanalytical approach presented for the estimation of the number of contacts betweenfibers in a random multilayer nanofibrous assembly with arbitrary fiber diameterand orientation, an experimental validation on the theoretical dependency of fiberdiameter and network porosity was presented. Increasing the network porosity andfiber diameter effectively increases the number of fiber-to-fiber contacts withinthe nano-microfiber structures. Also, it is believed that the presented theory for
Figure 8. Comparison of average number of fiber-to-fiber contacts per unit fiber length mea-
sured experimentally with that calculated using the model.
Bagherzadeh et al. 493
at DEAKIN UNIV LIBRARY on May 19, 2014jit.sagepub.comDownloaded from

fiber-to-fiber contacts is more realistic and useful for further studies of multilayernanofibrous assemblies.
Acknowledgements
The authors kindly thank Centre for Material and Fibre Innovation, Institute for Frontier
Materials (IFM), Deakin University, and Prof. Xungai Wang and Miss Helen Woodall, inparticular, for their invaluable help and support.
Funding
This research received no specific grant from any funding agency in the public, commercial,
or not-for-profit sectors.
References
[1] Bagherzadeh R, Latifi M, Shaikhzadeh Najar S, et al. Transport properties of multi-
layer fabric based on electrospun nanofiber mats as a breathable barrier textile mater-
ial. Text Res J 2012; 82: 70–76.[2] Bagherzadeh R, Latif M, Shaikhzadeh Najar S, et al. Three-dimensional pore structure
analysis of nano-microfibrous scaffolds using confocal laser scanning microscopy.
J Biomed Mater Res; Part A 2013; 101(3): 765–774.[3] Bhardwaj N and Kundu SC. Electrospinning: A fascinating fiber fabrication technique.
Biotech Adv 2010; 28: 325–347.[4] Bafekrpour E, Simon G, Yang C, et al. Effect of compositional gradient on thermal
behaviour of synthetic graphite-phenolic nanocomposites. J Thermal Anal Calor 2012.
DOI: 10.1007/s10973-012-2386-3.
[5] Bafekrpour E, Simon G, Habsuda J, et al. Fabrication and characterization of func-
tionally graded synthetic graphite/phenolic nanocomposites. Mater Sci Eng A 2012;
545: 123–131.[6] Komori T and Itoh M. A modified theory of fiber contact in general fiber assemblies.
Tex Res J 1994; 64: 519–528.
[7] Pan N. A modified analysis of the microstructural characteristics of general fiber
assemblies. Tex Res J 1993; 63: 336–345.[8] Johnston PR. Revisiting the most probable pore size distribution in filter media, the
gamma distribution. Filtr Separ 1998; 35: 287–292.[9] Peter RJ. Revisiting the most probable pore-size distribution in filter media: The
gamma distribution. Filtr Separ 1998; 35: 287–292.[10] Sampson WW. Comments on the pore radius distribution in near-planar stochastic
fibrous networks. J Mater Sci 2001; 36: 5131–5135.[11] Sampson WW. A multiplanar model for the pore radius distribution in isotropic near-
planar stochastic fibre networks. J Mater Sci 2003; 38: 1617–1622.
[12] Eichhorn SJ and Sampson WW. Statistical geometry of pores and statistics of porous
nanofibrous assemblies. J Royal Soc Interf 2005; 2: 309–318.[13] Pan N, He J-H and Yu J. Fibrous materials as soft matter. Text Res J 2007; 77:
205–213.[14] Pan N. Analytical characterization of the anisotropy and local heterogeneity of short
fiber composites: Fiber fraction as a variable. J Compos Mater 1994; 28: 1500–1531.
494 Journal of Industrial Textiles 43(4)
at DEAKIN UNIV LIBRARY on May 19, 2014jit.sagepub.comDownloaded from

[15] Schweers E and Loffler F. Realistic modelling of the behaviour of fibrous filters
through consideration of filter structure. Powder Technol 1994; 80: 191–206.[16] Dodson CTJ and Sampson WW. Spatial statistics of stochastic fiber networks.
J Statistical Phys 1999; 96: 447–458.
[17] Dodson CTJ, Oba Y and Sampson WW. Bivariate normal thickness-density structurein real near-planar stochastic fiber networks. J Statistical Phys 2001; 102: 345–352.
[18] Dodson CTJ and Sampson WW. The effect of paper formation and grammage on itspore size distribution. J Pulp Paper Sci 1996; 22: 165–169.
[19] Komori T and Makishima K. Number of fiber-to-fiber contacts in general fiber assem-blies. Text Res J 1977; 47: 13–17.
[20] SAMPSON WW. A model for fibre contact in planar random fibre networks. J Mater
Sci 2004; 39: 2775–2781.[21] Bagherzadeh R, Latif M, Shaikhzadeh Najar S, et al. A theoretical analysis for fiber
contacts in multilayer nanofibrous assemblies. Text Res J, 2012. DOI: 10.1177/
0040517512456763.[22] Niskanen K and Rajatora H. Statistical geometry of paper cross-sections. J Pulp Paper
Sci 2002; 28: 228–233.[23] Batchelor W, He J and Sampson WW. Inter-fibre contacts in random fibrous materials
experimental verification of theoretical dependence on porosity and fibre width.J Mater Sci 2006; 41: 8377–8381.
[24] Sampson WW and Sirvio J. The statistics of interfibre contact in random fibre networks
random fibre networks. J Pulp Paper Sci 2005; 31: 127–131.
Bagherzadeh et al. 495
at DEAKIN UNIV LIBRARY on May 19, 2014jit.sagepub.comDownloaded from
Related Documents


