ORIGINAL RESEARCH published: 12 May 2021 doi: 10.3389/feart.2021.652344 Frontiers in Earth Science | www.frontiersin.org 1 May 2021 | Volume 9 | Article 652344 Edited by: Pinbo Ding, China University of Petroleum, China Reviewed by: Lingyun Kong, University of North Dakota, United States Junxin Guo, Southern University of Science and Technology, China Zhiqi Guo, Jilin University, China *Correspondence: Jing Ba [email protected]; [email protected] Specialty section: This article was submitted to Solid Earth Geophysics, a section of the journal Frontiers in Earth Science Received: 12 January 2021 Accepted: 19 April 2021 Published: 12 May 2021 Citation: Ma R, Ba J, Carcione J, Lebedev M and Wang C (2021) Experimental Study on Petrophysical Properties as a Tool to Identify Pore Fluids in Tight-Rock Reservoirs. Front. Earth Sci. 9:652344. doi: 10.3389/feart.2021.652344 Experimental Study on Petrophysical Properties as a Tool to Identify Pore Fluids in Tight-Rock Reservoirs Rupeng Ma 1,2 , Jing Ba 1 *, José Carcione 3 , Maxim Lebedev 2 and Changsheng Wang 4 1 School of Earth Sciences and Engineering, Hohai University, Nanjing, China, 2 WA School of Mines: Minerals, Energy and Chemical Engineering, Curtin University, Perth, WA, Australia, 3 Department of Geophysics, Istituto Nazionale di Oceanografia e di Geofisica Sperimentale (OGS), Trieste, Italy, 4 Exploration and Development Research Institute of Changqing Oilfield, PetroChina, Xi’an, China The petrophysical properties can be proper indicators to identify oil and gas reservoirs, since the pore fluids have significant effects on the wave response. We have performed ultrasonic measurements on two sets of tight siltstones and dolomites at partial saturation. P- and S-wave velocities are obtained by the pulse transmission technique, while attenuation is calculated using the centroid-frequency shift and spectral-ratio methods. The fluid sensitivities of different properties (i.e., P- and S-wave velocities, impedances and attenuation, Poisson’s ratio, density, and their combinations) are quantitatively analyzed by considering the data distribution, based on the crossplot technique. The result shows that the properties (P- to S-wave velocity and attenuation ratios, Poisson’s ratio, and first to second Lamé constant ratio) with high fluid-sensitivity indicators successfully distinguish gas from oil and water, unlike oil from water. Moreover, siltstones and dolomites can be identified on the basis of data distribution areas. Ultrasonic rock-physics templates of the P- to S-wave velocity ratio vs. the product of first Lamé constant with density obtained with a poroelastic model, considering the structural heterogeneity and patchy saturation, are used to predict the saturation and porosity, which are in good agreement with the experimental data at different porosity ranges. Keywords: tight rocks, experimental observation, petrophysical properties, fluid sensitivity, rock physics template, attenuation INTRODUCTION The rock-physics properties are affected by the reservoir characteristics (i.e., lithology, porosity, permeability, and pattern) and the presence of pore fluids. Understanding the corresponding variations is essential for seismic exploration. Although these variations have been extensively investigated for intermediate- to high-porosity fluid-saturated rocks, the effects of partial saturation on low-porosity tight rocks are not well-understood and a fluid-sensitivity analysis can be useful to interpret the porosity-based saturation logs and related seismic data. A set of fluid-sensitive identification factors (rock-physics properties and their combinations) have been proposed to identify pore fluids (e.g., Fatti et al., 1994; Smith and Sutherland, 1996; Goodway, 2001; Dillon et al., 2003; Qiao and An, 2007; Qi et al., 2017; Zeng et al., 2017). For example, Ostrander (1984) and Carcione and Cavallini (2002) showed that Poisson’s ratio of gas- saturated rocks is lower than those of brine- and oil-saturated ones. Zhou and Hilterman (2010) used three seismic attributes to predict pore fluid and lithology and showed that their sensitivities are not significantly affected by the scale factors. Moreover, Pei et al. (2010) proposed a new fluid

Welcome message from author
This document is posted to help you gain knowledge. Please leave a comment to let me know what you think about it! Share it to your friends and learn new things together.
Transcript
ORIGINAL RESEARCHpublished: 12 May 2021
doi: 10.3389/feart.2021.652344
Frontiers in Earth Science | www.frontiersin.org 1 May 2021 | Volume 9 | Article 652344
Edited by:
Pinbo Ding,
China University of Petroleum, China
Reviewed by:
Lingyun Kong,
University of North Dakota,
United States
Junxin Guo,
Southern University of Science and
Technology, China
Zhiqi Guo,
Jilin University, China
*Correspondence:
Jing Ba
Specialty section:
This article was submitted to
Solid Earth Geophysics,
a section of the journal
Frontiers in Earth Science
Received: 12 January 2021
Accepted: 19 April 2021
Published: 12 May 2021
Citation:
Ma R, Ba J, Carcione J, Lebedev M
and Wang C (2021) Experimental
Study on Petrophysical Properties as
a Tool to Identify Pore Fluids in
Tight-Rock Reservoirs.
Front. Earth Sci. 9:652344.
doi: 10.3389/feart.2021.652344
Experimental Study on PetrophysicalProperties as a Tool to Identify PoreFluids in Tight-Rock Reservoirs
Rupeng Ma 1,2, Jing Ba 1*, José Carcione 3, Maxim Lebedev 2 and Changsheng Wang 4
1 School of Earth Sciences and Engineering, Hohai University, Nanjing, China, 2WA School of Mines: Minerals, Energy and
Chemical Engineering, Curtin University, Perth, WA, Australia, 3Department of Geophysics, Istituto Nazionale di Oceanografia
e di Geofisica Sperimentale (OGS), Trieste, Italy, 4 Exploration and Development Research Institute of Changqing Oilfield,
PetroChina, Xi’an, China
The petrophysical properties can be proper indicators to identify oil and gas reservoirs,
since the pore fluids have significant effects on the wave response. We have performed
ultrasonic measurements on two sets of tight siltstones and dolomites at partial
saturation. P- and S-wave velocities are obtained by the pulse transmission technique,
while attenuation is calculated using the centroid-frequency shift and spectral-ratio
methods. The fluid sensitivities of different properties (i.e., P- and S-wave velocities,
impedances and attenuation, Poisson’s ratio, density, and their combinations) are
quantitatively analyzed by considering the data distribution, based on the crossplot
technique. The result shows that the properties (P- to S-wave velocity and attenuation
ratios, Poisson’s ratio, and first to second Lamé constant ratio) with high fluid-sensitivity
indicators successfully distinguish gas from oil and water, unlike oil from water. Moreover,
siltstones and dolomites can be identified on the basis of data distribution areas.
Ultrasonic rock-physics templates of the P- to S-wave velocity ratio vs. the product of first
Lamé constant with density obtained with a poroelastic model, considering the structural
heterogeneity and patchy saturation, are used to predict the saturation and porosity,
which are in good agreement with the experimental data at different porosity ranges.
Keywords: tight rocks, experimental observation, petrophysical properties, fluid sensitivity, rock physics template,
attenuation
INTRODUCTION
The rock-physics properties are affected by the reservoir characteristics (i.e., lithology, porosity,permeability, and pattern) and the presence of pore fluids. Understanding the correspondingvariations is essential for seismic exploration. Although these variations have been extensivelyinvestigated for intermediate- to high-porosity fluid-saturated rocks, the effects of partial saturationon low-porosity tight rocks are not well-understood and a fluid-sensitivity analysis can be useful tointerpret the porosity-based saturation logs and related seismic data.
A set of fluid-sensitive identification factors (rock-physics properties and their combinations)have been proposed to identify pore fluids (e.g., Fatti et al., 1994; Smith and Sutherland, 1996;Goodway, 2001; Dillon et al., 2003; Qiao and An, 2007; Qi et al., 2017; Zeng et al., 2017). Forexample, Ostrander (1984) and Carcione and Cavallini (2002) showed that Poisson’s ratio of gas-saturated rocks is lower than those of brine- and oil-saturated ones. Zhou and Hilterman (2010)used three seismic attributes to predict pore fluid and lithology and showed that their sensitivitiesare not significantly affected by the scale factors. Moreover, Pei et al. (2010) proposed a new fluid
Ma et al. Petrophysical Properties for Fluid Identification
identification factor, which is more effective than the amplitudeversus offset (AVO) attributes in low-porosity reservoirs.However, these methods are incomplete due to the lack ofstatistical analysis of data distribution, and most of the methodshave been applied to detect gas reservoirs.
The problem is that a single physical property is insufficientto predict the reservoir features and fluid content, especiallyfor the tight rocks. A set of properties should be used,because P and S waves respond differently to variations in fluidsaturation. Previous studies show that P- and S-wave velocityand attenuation ratios (and Q−1
P /Q−1S ) are more sensitive to
partial gas–water saturation (Murphy, 1982; Winkler and Nur,1982; Klimentos, 1995; Chichinina et al., 2009; Qi et al., 2017).For example, Murphy (1982) showed that P-wave attenuationis more robust than S-wave attenuation in partially saturatedMassillon sandstone, but the difference is small at full watersaturation. Winkler and Nur (1982) found that the ratio ofP- to S-wave attenuation is more sensitive to gas saturationthan the P- to S-wave velocity ratio, showing that Q−1
P /Q−1S ≤
1 for water-saturated rocks and Q−1P /Q−1
S > 1 for gas-saturated rocks. These relations can be useful, but they havebeen applied to intermediate- and high-porosity rocks. Onlya few studies deal with tight-rock reservoirs (e.g., Pei et al.,2010; Xue et al., 2013; Han et al., 2017; Qi et al., 2017;Pang et al., 2019). They mainly distinguish gas from liquid-saturated rocks for sandstone and shale reservoirs. However,the relations were hardly analyzed for tight siltstone anddolomite reservoirs.
The challenge is to propose a suitable theoretical modelthat can predict the elastic properties and wave responsecharacteristics in partially saturated rocks. Seismic wave velocitydispersion and attenuation are considered to be caused by thewave-induced fluid flow mechanism (Mavko and Nur, 1979;Murphy, 1982; Winkler and Nur, 1982; Müller et al., 2010).Different poroelastic models have been developed to predictthe velocity and attenuation observed in the laboratory andin the field data (Biot, 1956; White, 1975; Pride et al., 2004;Gurevich et al., 2010; Ba et al., 2017; Guo and Gurevich, 2020).Based on these models, rock-physics templates (RPTs) can beused to estimate porosity and saturation (Liu et al., 2015; Panget al., 2019, 2020). Studies showed that RPTs, built with acousticimpedance and P- to S-wave velocity ratio, serve as tools forlithology and fluid identification (Chi and Han, 2009; DattaGupta et al., 2012; Ba et al., 2013). RPTs based on seismicattenuation also describe the effect of partial saturation, porosity,and permeability (Dvorkin and Mavko, 2006; Picotti et al.,2018). The Gassmann’s equation is mainly used to conduct fluidsubstitution in generating RPTs and obtain the elastic modulus ofthe saturated rock, but neglecting the effect of patchy saturation.The tight-rock reservoirs usually have complex structures andhighly variable saturation due to the complex rock patterns, andwe used a double double-porosity (DDP) model, considering thestructural heterogeneity and the uneven patchy saturation, forfluid substitution in the RPTs.
The rock-physics properties and ultrasonic waveforms canbe obtained at different fluid-saturated conditions from thelaboratory measurements. In this study, we performed ultrasonic
measurements on tight siltstones and dolomites, where the P-and S-wave velocities and attenuation are obtained at in situconfining pressure. These properties and their combinations arethen evaluated by means of fluid-sensitive indicators (FSIs) andcrossplots are shown to validate their effectiveness. Finally, RPTsare built by using the DDP model of Ba et al. (2017) to match theexperimental data.
EXPERIMENTS
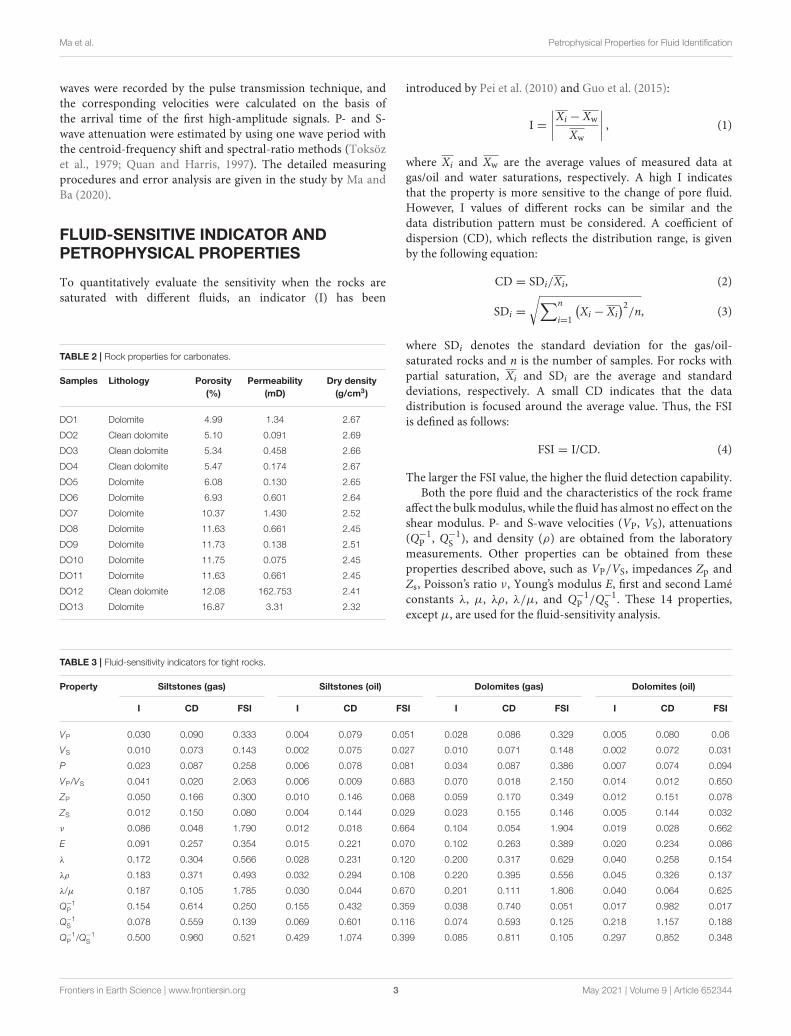
Two sets of tight rocks are collected from the reservoirs. Oneset of 12 siltstones are collected from the oil reservoirs of theQingshankou Formation, Northeast China, whereas another setof 13 dolomites are collected from Ordovician and CambrianFormations, West China. The porosities and permeabilities ofsiltstones range from 2.88 to 13.97% and 0.0045 to 0.39 mD andthose of dolomites from 4.99 to 16.87% and 0.075 to 162.753 mD,respectively. The corresponding parameters are listed inTables 1,2, sorted from smallest to largest based on porosity. The lowpermeability in siltstones is due to the high clay content andfine texture, while the highly variable permeability in dolomitesindicates the presence of fractures. More details on the rockproperties can be found in the study by Ba et al. (2019).
The systematic ultrasonicmeasurements have been performedon the two sets of rocks at different saturations and in situconfining pressure. Siltstones were measured at a confiningpressure of 50 MPa and a pore pressure of 25 MPa, whereasdolomites at 80 and 10MPa, respectively. The adopted saturationmethod is described in the studies by Ba et al. (2017) and Maand Ba (2020). The partially gas–water and oil–water saturationtests were performed on the dolomites, but we conducted thesetests only in five siltstones, and we set full saturation in others(gas, water, and oil, respectively). The waveforms of P and S
TABLE 1 | Rock properties for tight siltstones.
Samples Lithology Porosity
(%)
Permeability
(mD)
Dry
density
(g/cm3)
Clay
volume
content (%)
A Muddy
siltstone
2.88 0.0045 2.61 2.8
B Muddy
siltstone
4.6 0.38 2.56 8.2
C Siltstone 5.2 0.019 2.58 1.9
D Silty
mudstone
5.56 0.011 2.53 12.5
E Siltstone 5.6 0.017 2.52 2.4
F Siltstone 5.79 0.035 2.41 3.9
G Siltstone 5.8 0.02 2.55 3.0
H Siltstone 6.45 0.097 2.38 5.5
I Siltstone 10.87 0.39 2.29 5.5
J Muddy
siltstone
12.75 0.17 2.3 4.4
K Siltstone 13.09 0.08 2.28 5.5
L Siltstone 13.97 0.084 2.26 5.5
Frontiers in Earth Science | www.frontiersin.org 2 May 2021 | Volume 9 | Article 652344
Ma et al. Petrophysical Properties for Fluid Identification
waves were recorded by the pulse transmission technique, andthe corresponding velocities were calculated on the basis ofthe arrival time of the first high-amplitude signals. P- and S-wave attenuation were estimated by using one wave period withthe centroid-frequency shift and spectral-ratio methods (Toksözet al., 1979; Quan and Harris, 1997). The detailed measuringprocedures and error analysis are given in the study by Ma andBa (2020).
FLUID-SENSITIVE INDICATOR ANDPETROPHYSICAL PROPERTIES
To quantitatively evaluate the sensitivity when the rocks aresaturated with different fluids, an indicator (I) has been
TABLE 2 | Rock properties for carbonates.
Samples Lithology Porosity
(%)
Permeability
(mD)
Dry density
(g/cm3)
DO1 Dolomite 4.99 1.34 2.67
DO2 Clean dolomite 5.10 0.091 2.69
DO3 Clean dolomite 5.34 0.458 2.66
DO4 Clean dolomite 5.47 0.174 2.67
DO5 Dolomite 6.08 0.130 2.65
DO6 Dolomite 6.93 0.601 2.64
DO7 Dolomite 10.37 1.430 2.52
DO8 Dolomite 11.63 0.661 2.45
DO9 Dolomite 11.73 0.138 2.51
DO10 Dolomite 11.75 0.075 2.45
DO11 Dolomite 11.63 0.661 2.45
DO12 Clean dolomite 12.08 162.753 2.41
DO13 Dolomite 16.87 3.31 2.32
introduced by Pei et al. (2010) and Guo et al. (2015):
I =
∣
∣
∣
∣
Xi − Xw
Xw
∣
∣
∣
∣
, (1)
where Xi and Xw are the average values of measured data atgas/oil and water saturations, respectively. A high I indicatesthat the property is more sensitive to the change of pore fluid.However, I values of different rocks can be similar and thedata distribution pattern must be considered. A coefficient ofdispersion (CD), which reflects the distribution range, is givenby the following equation:
CD = SDi/Xi, (2)
SDi =
√
∑n
i=1
(
Xi − Xi
)2/n, (3)
where SDi denotes the standard deviation for the gas/oil-saturated rocks and n is the number of samples. For rocks withpartial saturation, Xi and SDi are the average and standarddeviations, respectively. A small CD indicates that the datadistribution is focused around the average value. Thus, the FSIis defined as follows:
FSI = I/CD. (4)
The larger the FSI value, the higher the fluid detection capability.Both the pore fluid and the characteristics of the rock frame
affect the bulkmodulus, while the fluid has almost no effect on theshear modulus. P- and S-wave velocities (VP, VS), attenuations(Q−1
P , Q−1S ), and density (ρ) are obtained from the laboratory
measurements. Other properties can be obtained from theseproperties described above, such as VP/VS, impedances Zp andZs, Poisson’s ratio ν, Young’s modulus E, first and second Laméconstants λ, µ, λρ, λ/µ, and Q−1
P /Q−1S . These 14 properties,
except µ, are used for the fluid-sensitivity analysis.
TABLE 3 | Fluid-sensitivity indicators for tight rocks.
Property Siltstones (gas) Siltstones (oil) Dolomites (gas) Dolomites (oil)
I CD FSI I CD FSI I CD FSI I CD FSI
VP 0.030 0.090 0.333 0.004 0.079 0.051 0.028 0.086 0.329 0.005 0.080 0.06
VS 0.010 0.073 0.143 0.002 0.075 0.027 0.010 0.071 0.148 0.002 0.072 0.031
P 0.023 0.087 0.258 0.006 0.078 0.081 0.034 0.087 0.386 0.007 0.074 0.094
VP/VS 0.041 0.020 2.063 0.006 0.009 0.683 0.070 0.018 2.150 0.014 0.012 0.650
ZP 0.050 0.166 0.300 0.010 0.146 0.068 0.059 0.170 0.349 0.012 0.151 0.078
ZS 0.012 0.150 0.080 0.004 0.144 0.029 0.023 0.155 0.146 0.005 0.144 0.032
ν 0.086 0.048 1.790 0.012 0.018 0.664 0.104 0.054 1.904 0.019 0.028 0.662
E 0.091 0.257 0.354 0.015 0.221 0.070 0.102 0.263 0.389 0.020 0.234 0.086
λ 0.172 0.304 0.566 0.028 0.231 0.120 0.200 0.317 0.629 0.040 0.258 0.154
λρ 0.183 0.371 0.493 0.032 0.294 0.108 0.220 0.395 0.556 0.045 0.326 0.137
λ/µ 0.187 0.105 1.785 0.030 0.044 0.670 0.201 0.111 1.806 0.040 0.064 0.625
Q−1P 0.154 0.614 0.250 0.155 0.432 0.359 0.038 0.740 0.051 0.017 0.982 0.017
Q−1S 0.078 0.559 0.139 0.069 0.601 0.116 0.074 0.593 0.125 0.218 1.157 0.188
Q−1P /Q−1
S 0.500 0.960 0.521 0.429 1.074 0.399 0.085 0.811 0.105 0.297 0.852 0.348
Frontiers in Earth Science | www.frontiersin.org 3 May 2021 | Volume 9 | Article 652344
Ma et al. Petrophysical Properties for Fluid Identification
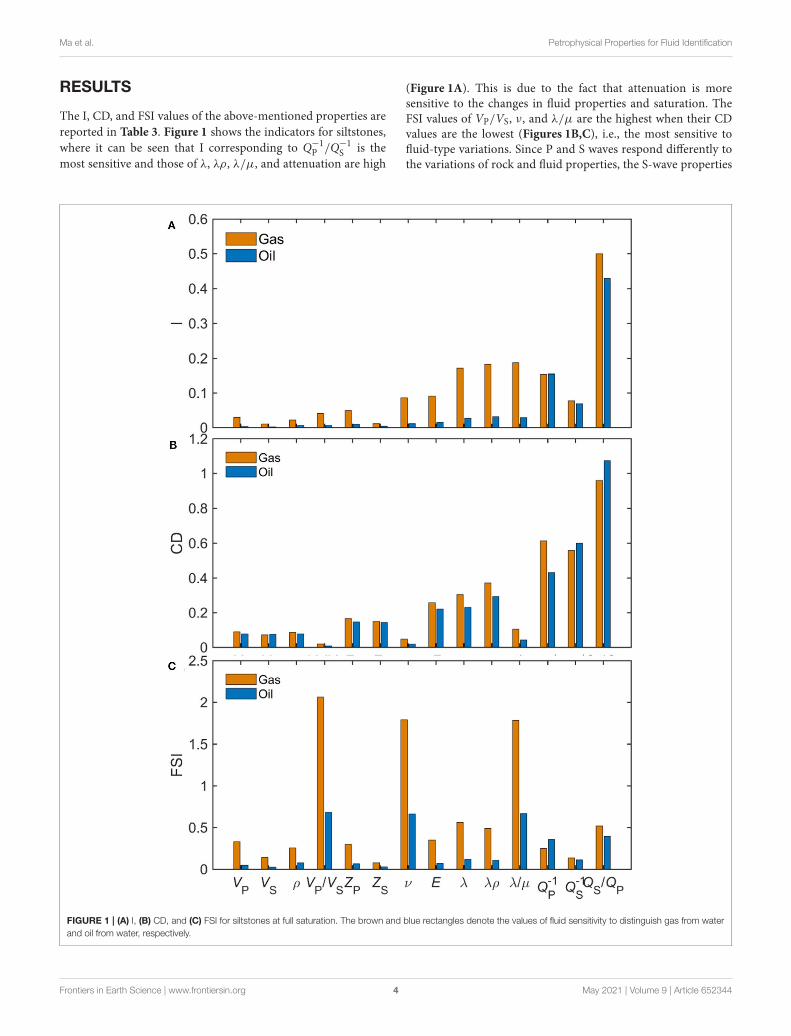
RESULTS
The I, CD, and FSI values of the above-mentioned properties are
reported in Table 3. Figure 1 shows the indicators for siltstones,
where it can be seen that I corresponding to Q−1P /Q−1
S is the
most sensitive and those of λ, λρ, λ/µ, and attenuation are high
(Figure 1A). This is due to the fact that attenuation is moresensitive to the changes in fluid properties and saturation. TheFSI values of VP/VS, ν, and λ/µ are the highest when their CDvalues are the lowest (Figures 1B,C), i.e., the most sensitive tofluid-type variations. Since P and S waves respond differently tothe variations of rock and fluid properties, the S-wave properties
FIGURE 1 | (A) I, (B) CD, and (C) FSI for siltstones at full saturation. The brown and blue rectangles denote the values of fluid sensitivity to distinguish gas from water
and oil from water, respectively.
Frontiers in Earth Science | www.frontiersin.org 4 May 2021 | Volume 9 | Article 652344
Ma et al. Petrophysical Properties for Fluid Identification
can be used as normalization quantities with which we comparedP-wave properties, to remove in part the effect of rock frame.Moreover, they can better distinguish gas from water than oilfrom water. Although the I values of Q−1
P /Q−1S are the highest,
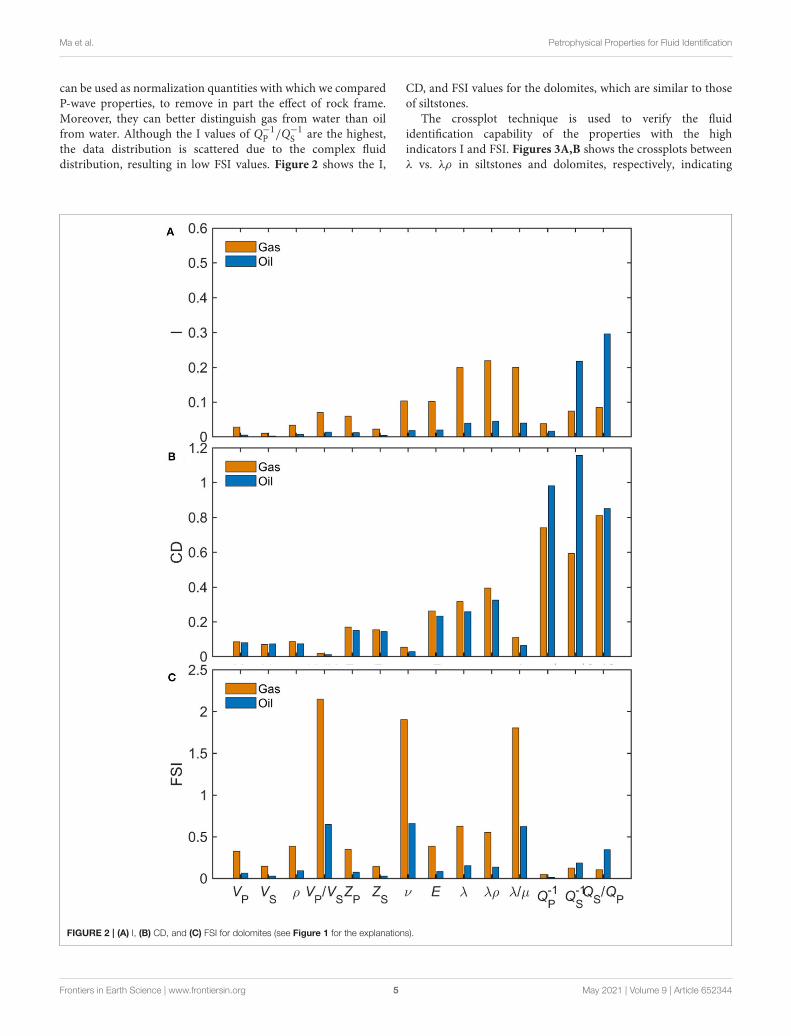
the data distribution is scattered due to the complex fluiddistribution, resulting in low FSI values. Figure 2 shows the I,
CD, and FSI values for the dolomites, which are similar to thoseof siltstones.
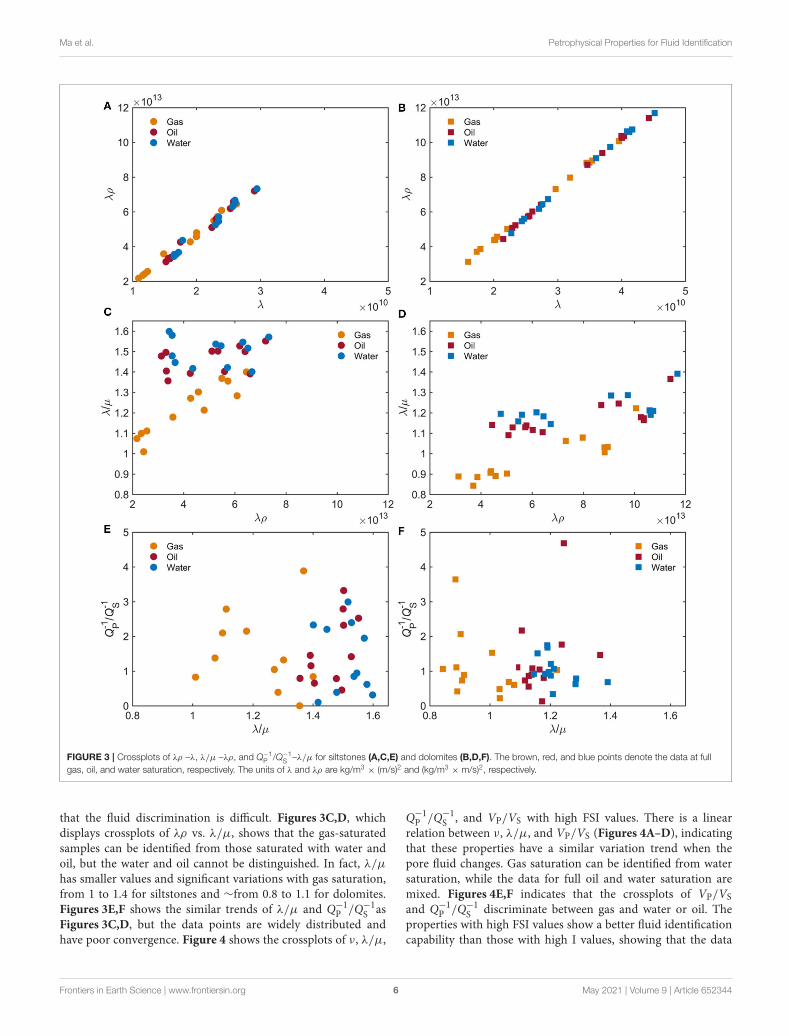
The crossplot technique is used to verify the fluididentification capability of the properties with the highindicators I and FSI. Figures 3A,B shows the crossplots betweenλ vs. λρ in siltstones and dolomites, respectively, indicating
FIGURE 2 | (A) I, (B) CD, and (C) FSI for dolomites (see Figure 1 for the explanations).
Frontiers in Earth Science | www.frontiersin.org 5 May 2021 | Volume 9 | Article 652344
Ma et al. Petrophysical Properties for Fluid Identification
FIGURE 3 | Crossplots of λρ –λ, λ/µ –λρ, and Q−1P /Q−1
S –λ/µ for siltstones (A,C,E) and dolomites (B,D,F). The brown, red, and blue points denote the data at full
gas, oil, and water saturation, respectively. The units of λ and λρ are kg/m3× (m/s)2 and (kg/m3
× m/s)2, respectively.
that the fluid discrimination is difficult. Figures 3C,D, whichdisplays crossplots of λρ vs. λ/µ, shows that the gas-saturatedsamples can be identified from those saturated with water andoil, but the water and oil cannot be distinguished. In fact, λ/µ
has smaller values and significant variations with gas saturation,from 1 to 1.4 for siltstones and ∼from 0.8 to 1.1 for dolomites.Figures 3E,F shows the similar trends of λ/µ and Q−1
P /Q−1S as
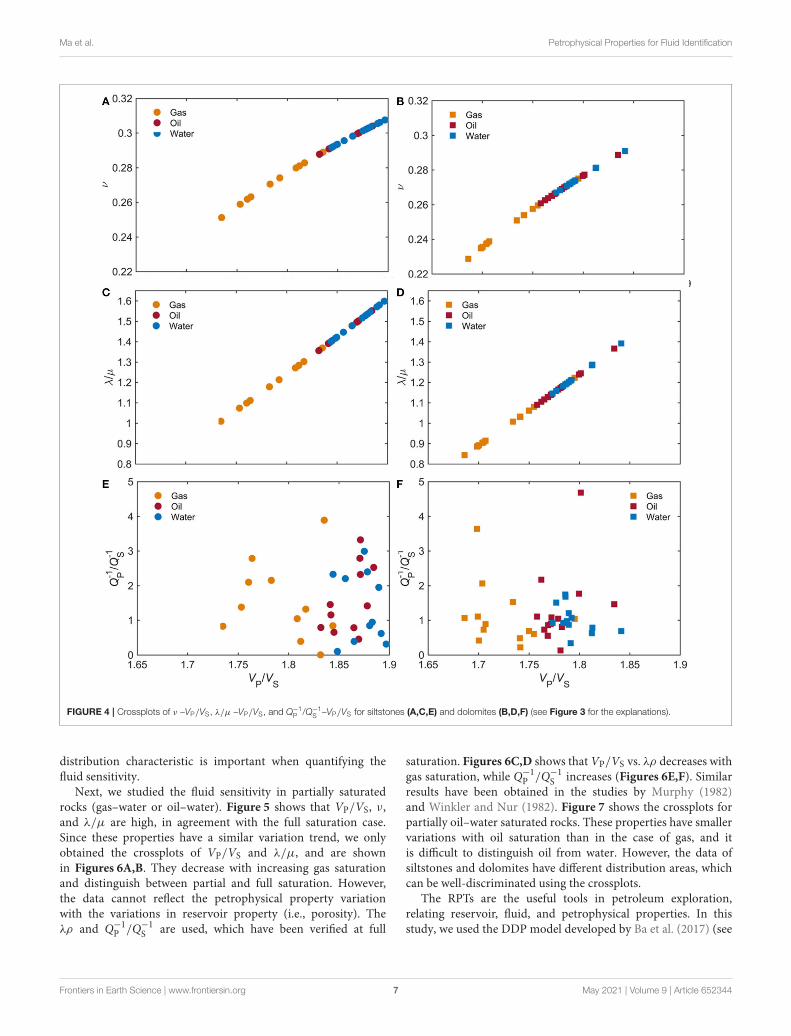
Figures 3C,D, but the data points are widely distributed andhave poor convergence. Figure 4 shows the crossplots of ν, λ/µ,
Q−1P /Q−1
S , and VP/VS with high FSI values. There is a linearrelation between ν, λ/µ, and VP/VS (Figures 4A–D), indicatingthat these properties have a similar variation trend when thepore fluid changes. Gas saturation can be identified from watersaturation, while the data for full oil and water saturation aremixed. Figures 4E,F indicates that the crossplots of VP/VS
and Q−1P /Q−1
S discriminate between gas and water or oil. Theproperties with high FSI values show a better fluid identificationcapability than those with high I values, showing that the data
Frontiers in Earth Science | www.frontiersin.org 6 May 2021 | Volume 9 | Article 652344
Ma et al. Petrophysical Properties for Fluid Identification
FIGURE 4 | Crossplots of ν –VP/VS, λ/µ –VP/VS, and Q−1P /Q−1
S –VP/VS for siltstones (A,C,E) and dolomites (B,D,F) (see Figure 3 for the explanations).
distribution characteristic is important when quantifying thefluid sensitivity.
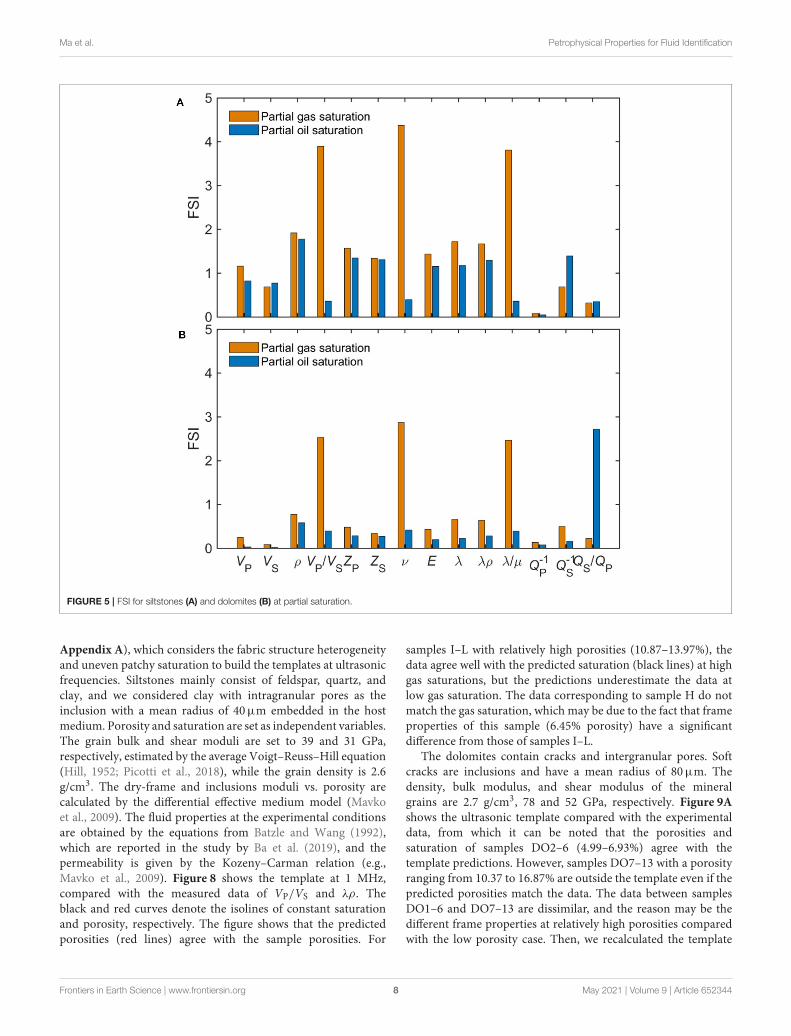
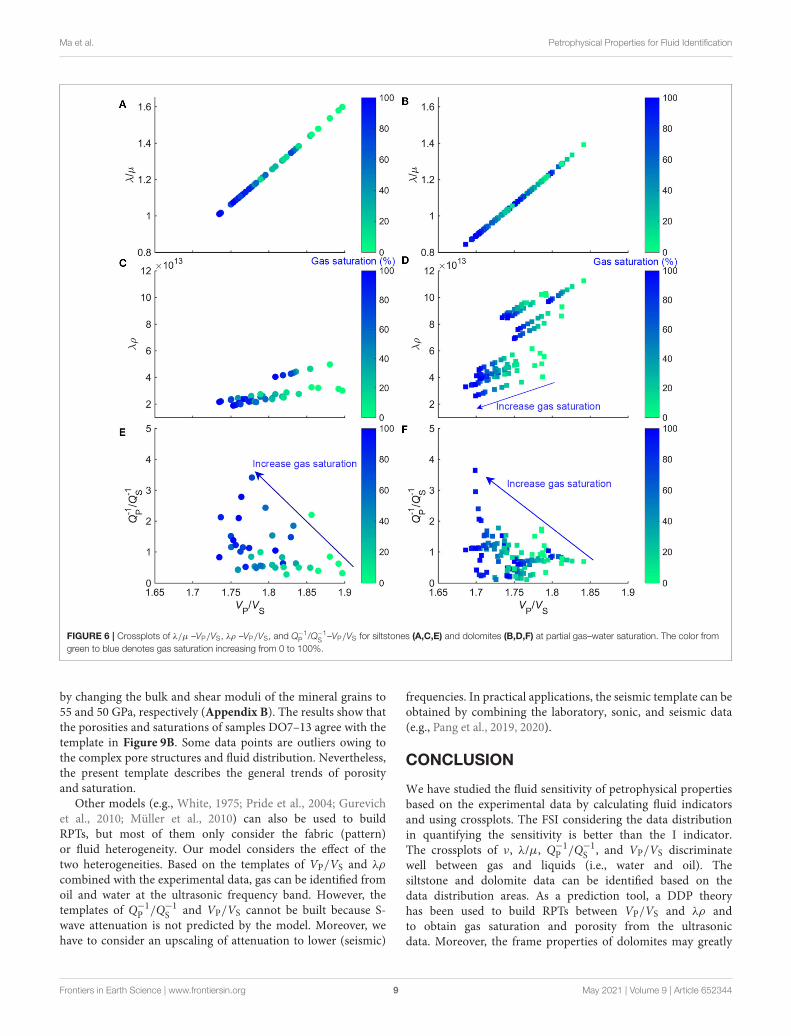
Next, we studied the fluid sensitivity in partially saturatedrocks (gas–water or oil–water). Figure 5 shows that VP/VS, ν,and λ/µ are high, in agreement with the full saturation case.Since these properties have a similar variation trend, we onlyobtained the crossplots of VP/VS and λ/µ, and are shownin Figures 6A,B. They decrease with increasing gas saturationand distinguish between partial and full saturation. However,the data cannot reflect the petrophysical property variationwith the variations in reservoir property (i.e., porosity). Theλρ and Q−1
P /Q−1S are used, which have been verified at full
saturation. Figures 6C,D shows thatVP/VS vs. λρ decreases withgas saturation, while Q−1
P /Q−1S increases (Figures 6E,F). Similar
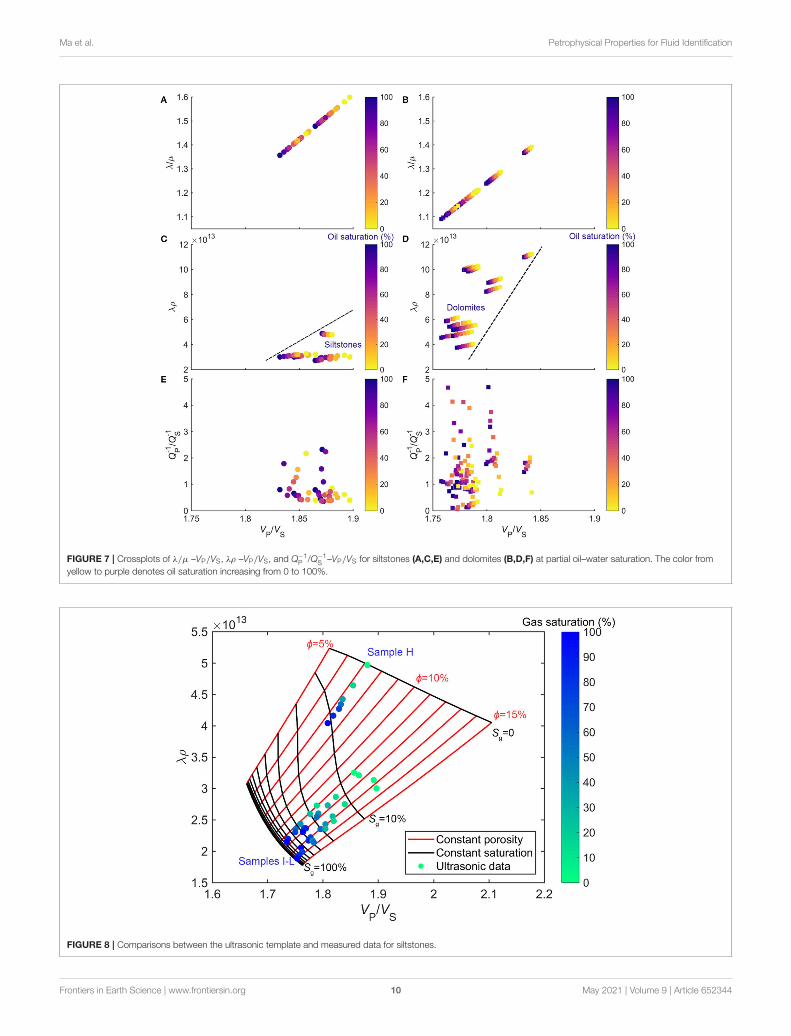
results have been obtained in the studies by Murphy (1982)and Winkler and Nur (1982). Figure 7 shows the crossplots forpartially oil–water saturated rocks. These properties have smallervariations with oil saturation than in the case of gas, and itis difficult to distinguish oil from water. However, the data ofsiltstones and dolomites have different distribution areas, whichcan be well-discriminated using the crossplots.
The RPTs are the useful tools in petroleum exploration,relating reservoir, fluid, and petrophysical properties. In thisstudy, we used the DDP model developed by Ba et al. (2017) (see
Frontiers in Earth Science | www.frontiersin.org 7 May 2021 | Volume 9 | Article 652344
Ma et al. Petrophysical Properties for Fluid Identification
FIGURE 5 | FSI for siltstones (A) and dolomites (B) at partial saturation.
Appendix A), which considers the fabric structure heterogeneityand uneven patchy saturation to build the templates at ultrasonicfrequencies. Siltstones mainly consist of feldspar, quartz, andclay, and we considered clay with intragranular pores as theinclusion with a mean radius of 40µm embedded in the hostmedium. Porosity and saturation are set as independent variables.The grain bulk and shear moduli are set to 39 and 31 GPa,respectively, estimated by the average Voigt–Reuss–Hill equation(Hill, 1952; Picotti et al., 2018), while the grain density is 2.6g/cm3. The dry-frame and inclusions moduli vs. porosity arecalculated by the differential effective medium model (Mavkoet al., 2009). The fluid properties at the experimental conditionsare obtained by the equations from Batzle and Wang (1992),which are reported in the study by Ba et al. (2019), and thepermeability is given by the Kozeny–Carman relation (e.g.,Mavko et al., 2009). Figure 8 shows the template at 1 MHz,compared with the measured data of VP/VS and λρ. Theblack and red curves denote the isolines of constant saturationand porosity, respectively. The figure shows that the predictedporosities (red lines) agree with the sample porosities. For
samples I–L with relatively high porosities (10.87–13.97%), thedata agree well with the predicted saturation (black lines) at highgas saturations, but the predictions underestimate the data atlow gas saturation. The data corresponding to sample H do notmatch the gas saturation, which may be due to the fact that frameproperties of this sample (6.45% porosity) have a significantdifference from those of samples I–L.
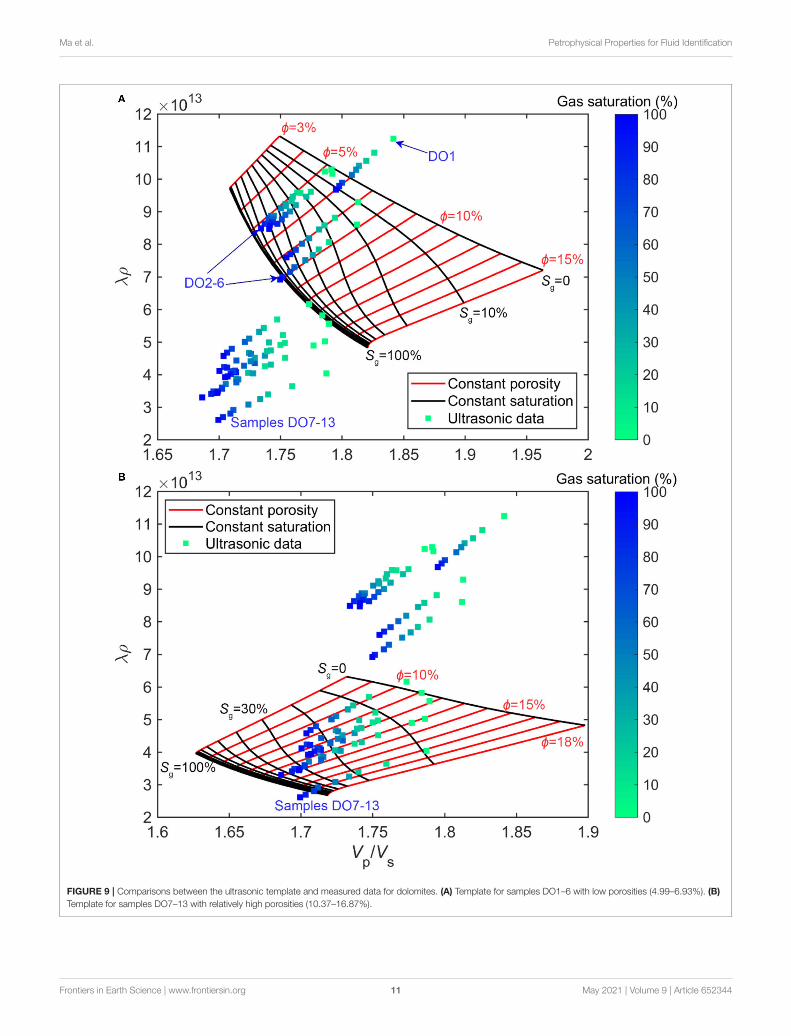
The dolomites contain cracks and intergranular pores. Softcracks are inclusions and have a mean radius of 80µm. Thedensity, bulk modulus, and shear modulus of the mineralgrains are 2.7 g/cm3, 78 and 52 GPa, respectively. Figure 9Ashows the ultrasonic template compared with the experimentaldata, from which it can be noted that the porosities andsaturation of samples DO2–6 (4.99–6.93%) agree with thetemplate predictions. However, samples DO7–13 with a porosityranging from 10.37 to 16.87% are outside the template even if thepredicted porosities match the data. The data between samplesDO1–6 and DO7–13 are dissimilar, and the reason may be thedifferent frame properties at relatively high porosities comparedwith the low porosity case. Then, we recalculated the template
Frontiers in Earth Science | www.frontiersin.org 8 May 2021 | Volume 9 | Article 652344
Ma et al. Petrophysical Properties for Fluid Identification
FIGURE 6 | Crossplots of λ/µ –VP/VS, λρ –VP/VS, and Q−1P /Q−1
S –VP/VS for siltstones (A,C,E) and dolomites (B,D,F) at partial gas–water saturation. The color from
green to blue denotes gas saturation increasing from 0 to 100%.
by changing the bulk and shear moduli of the mineral grains to55 and 50 GPa, respectively (Appendix B). The results show thatthe porosities and saturations of samples DO7–13 agree with thetemplate in Figure 9B. Some data points are outliers owing tothe complex pore structures and fluid distribution. Nevertheless,the present template describes the general trends of porosityand saturation.
Other models (e.g., White, 1975; Pride et al., 2004; Gurevichet al., 2010; Müller et al., 2010) can also be used to buildRPTs, but most of them only consider the fabric (pattern)or fluid heterogeneity. Our model considers the effect of thetwo heterogeneities. Based on the templates of VP/VS and λρ
combined with the experimental data, gas can be identified fromoil and water at the ultrasonic frequency band. However, thetemplates of Q−1
P /Q−1S and VP/VS cannot be built because S-
wave attenuation is not predicted by the model. Moreover, wehave to consider an upscaling of attenuation to lower (seismic)
frequencies. In practical applications, the seismic template can beobtained by combining the laboratory, sonic, and seismic data(e.g., Pang et al., 2019, 2020).
CONCLUSION
We have studied the fluid sensitivity of petrophysical propertiesbased on the experimental data by calculating fluid indicatorsand using crossplots. The FSI considering the data distributionin quantifying the sensitivity is better than the I indicator.The crossplots of ν, λ/µ, Q−1
P /Q−1S , and VP/VS discriminate
well between gas and liquids (i.e., water and oil). Thesiltstone and dolomite data can be identified based on thedata distribution areas. As a prediction tool, a DDP theoryhas been used to build RPTs between VP/VS and λρ andto obtain gas saturation and porosity from the ultrasonicdata. Moreover, the frame properties of dolomites may greatly
Frontiers in Earth Science | www.frontiersin.org 9 May 2021 | Volume 9 | Article 652344
Ma et al. Petrophysical Properties for Fluid Identification
FIGURE 7 | Crossplots of λ/µ –VP/VS, λρ –VP/VS, and Q−1P /Q−1
S –VP/VS for siltstones (A,C,E) and dolomites (B,D,F) at partial oil–water saturation. The color from
yellow to purple denotes oil saturation increasing from 0 to 100%.
FIGURE 8 | Comparisons between the ultrasonic template and measured data for siltstones.
Frontiers in Earth Science | www.frontiersin.org 10 May 2021 | Volume 9 | Article 652344
Ma et al. Petrophysical Properties for Fluid Identification
FIGURE 9 | Comparisons between the ultrasonic template and measured data for dolomites. (A) Template for samples DO1–6 with low porosities (4.99–6.93%). (B)
Template for samples DO7–13 with relatively high porosities (10.37–16.87%).
Frontiers in Earth Science | www.frontiersin.org 11 May 2021 | Volume 9 | Article 652344
Ma et al. Petrophysical Properties for Fluid Identification
vary at relatively high porosities compared with the lowporosity case.
DATA AVAILABILITY STATEMENT
The original contributions presented in the study are includedin the article/Supplementary Material. Further inquiries can bedirected to the corresponding author.
AUTHOR CONTRIBUTIONS
JB conceived and designed the experiments. RM analyzed theexperimental data. RM and JB wrote the manuscript. JB, JC,ML, and CW provided critical revisions of the manuscript.All authors contributed to the article and approved thesubmitted version.
FUNDING
This work was supported by the Jiangsu Province Science Fundfor Distinguished Young Scholars (BK20200021), the NationalScience and Technology Major Project of China (2017ZX05069-002), the research funds from SINOPEC Key Laboratory ofGeophysics, the Jiangsu Innovation and Entrepreneurship Plan,the National Natural Science Foundation of China (41974123,41704109), and the Fundamental Research Funds for the CentralUniversities, and the China Scholarship Council (201906710129).
SUPPLEMENTARY MATERIAL
The Supplementary Material for this article can be foundonline at: https://www.frontiersin.org/articles/10.3389/feart.2021.652344/full#supplementary-material
REFERENCES
Ba, J., Cao, H., Carcione, J. M., Tang, G., Yan, X.-F., Sun, W., et al. (2013).
Multiscale rock-physics templates for gas detection in carbonate reservoirs. J.
Appl. Geophys. 93, 77–82. doi: 10.1016/j.jappgeo.2013.03.011
Ba, J., Ma, R., Carcione, J. M., and Picotti, S. (2019). Ultrasonic wave attenuation
dependence on saturation in tight oil siltstones. J. Petrol Sci. Eng. 179,
1114–1122. doi: 10.1016/j.petrol.2019.04.099
Ba, J., Xu, W., Fu, L.-Y., Carcione, J. M., and Zhang, L. (2017). Rock anelasticity
due to patchy saturation and fabric heterogeneity: a double double-porosity
model of wave propagation. J. Geophys. Res. Solid Earth 122, 1949–1976.
doi: 10.1002/2016JB013882
Batzle, M., and Wang, Z. (1992). Seismic properties of pore fluids. Geophysics 57,
1396–1408. doi: 10.1190/1.1443207
Biot, M. A. (1956). Theory of propagation of elastic waves in a fluid-saturated
porous solid. II. Higher frequency range. J. Acoust. Soc. Am. 28, 179–191.
doi: 10.1121/1.1908241
Carcione, J. M., and Cavallini, F. (2002). Poisson’s ratio at high pore pressure.
Geophys. Prospect. 50, 97–106. doi: 10.1046/j.1365-2478.2002.00299.x
Chi, X., andHan, D. (2009). Lithology and fluid differentiation using a rock physics
template. Lead. Edge 28, 60–65. doi: 10.1190/1.3064147
Chichinina, T., Obolentseva, I., Gik, L., Bobrov, B., and Ronquillo-
Jarillo, G. (2009). Attenuation anisotropy in the linear-slip model:
interpretation of physical modeling data. Geophysics 74, WB165–WB176.
doi: 10.1190/1.3173806
Datta Gupta, S., Chatterjee, R., and Farooqui, M. Y. (2012). Rock physics
template (RPT) analysis of well logs and seismic data for lithology and
fluid classification in Cambay Basin. Int. J. Earth Sci. 101, 1407–1426.
doi: 10.1007/s00531-011-0736-1
Dillon, L., Schwedersky, G., Vásquez, G., Velloso, R., and Nunes, C. (2003).
A multiscale DHI elastic attributes evaluation. Lead. Edge 22, 1024–1029.
doi: 10.1190/1.1623644
Dvorkin, J. P., and Mavko, G. (2006). Modeling attenuation in reservoir and
nonreservoir rock. Lead. Edge 25, 194–197. doi: 10.1190/1.2172312
Fatti, J. L., Smith, G. C., Vail, P. J., Strauss, P. J., and Levitt, P. R. (1994). Detection of
gas in sandstone reservoirs using AVO analysis: a 3-D seismic case history using
the Geostack technique. Geophysics 59, 1362–1376. doi: 10.1190/1.1443695
Goodway, B. (2001). AVO and lamé constants for rock parameterization and fluid
detection. CSEG Rec. 6, 39–60.
Guo, J., and Gurevich, B. (2020). Frequency-dependent P wave anisotropy due
to wave-induced fluid flow and elastic scattering in a fluid-saturated porous
mediumwith aligned fractures. J. Geophys. Res. Solid Earth 125:e2020JB020320.
doi: 10.1029/2020JB020320
Guo, Y., Ma, H., Ba, J., Yu, H., and Long, C. (2015). Impact of data distribution
on fluid sensitivity analysis: a quantitative investigation. J. Appl. Geophys. 119,
1–15. doi: 10.1016/j.jappgeo.2015.05.003
Gurevich, B., Makarynska, D., de Paula, O. B., and Pervukhina, M.
(2010). A simple model for squirt-flow dispersion and attenuation in
fluid-saturated granular rocks. Geophysics 75, N109–N120. doi: 10.1190/1.35
09782
Han, X., Wu, E., Guo, J., Xu, D., Sun, Z., Luo, X., et al. (2017). Fluid
factor index for fluid saturation estimation. J. Nat. Gas Sci. Eng. 39, 72–81.
doi: 10.1016/j.jngse.2017.01.026
Hill, R. (1952). The elastic behaviour of a crystalline aggregate. Proc. Phys. Soc. A
65, 349–354. doi: 10.1088/0370-1298/65/5/307
Klimentos, T. (1995). Attenuation of P- and S-waves as a method of
distinguishing gas and condensate from oil and water. Geophysics 60, 447–458.
doi: 10.1190/1.1443782
Liu, Q., Yin, X., and Li, C. (2015). Fluid discrimination based on rock
physics templates. J. Geophys. Eng. 12, 830–838. doi: 10.1088/1742-2132/1
2/5/830
Ma, R., and Ba, J. (2020). Coda and intrinsic attenuations from
ultrasonic measurements in tight siltstones. J. Geophys. Res. Solid Earth
125:e2019JB018825. doi: 10.1029/2019JB018825
Mavko, G., Mukerji, T., and Dvorkin, J. (2009). The Rock Physics Handbook: Tools
for Seismic Analysis of Porous Media, 2nd Edn. Cambridge; New York, NY:
Cambridge University Press.
Mavko, G. M., and Nur, A. (1979). Wave attenuation in partially saturated rocks.
Geophysics 44, 161–178. doi: 10.1190/1.1440958
Müller, T. M., Gurevich, B., and Lebedev, M. (2010). Seismic wave attenuation
and dispersion resulting from wave-induced flow in porous rocks — a review.
Geophysics 75, 75A147–75A164. doi: 10.1190/1.3463417
Murphy, W. F. (1982). Effects of partial water saturation on attenuation in
Massilon sandstone and Vycor porous glass. J. Acoust. Soc. Am. 71, 1458–1468.
doi: 10.1121/1.387843
Ostrander, W. J. (1984). Plane-wave reflection coefficients for gas
sands at nonnormal angles of incidence. Geophysics 49, 1637–1648.
doi: 10.1190/1.1441571
Pang, M., Ba, J., Carcione, J. M., Picotti, S., Zhou, J., and Jiang, R.
(2019). Estimation of porosity and fluid saturation in carbonates from
rock-physics templates based on seismic Q. Geophys. 84, M25–M36.
doi: 10.1190/geo2019-0031.1
Pang, M., Ba, J., Fu, L.-Y., Carcione, J. M., Markus, U. I., and Zhang, L.
(2020). Estimation of microfracture porosity in deep carbonate reservoirs
based on 3D rock-physics templates. Interpretation 8, SP43–SP52.
doi: 10.1190/INT-2019-0258.1
Frontiers in Earth Science | www.frontiersin.org 12 May 2021 | Volume 9 | Article 652344
Ma et al. Petrophysical Properties for Fluid Identification
Pei, F.-G., Zou, C.-C., He, T., Shi, G., Qiu, G.-G., and Ren, K.-Y. (2010). Fluid
sensitivity study of elastic parameters in low-medium porosity and permeability
reservoir rocks. Appl. Geophys. 7, 1–9. doi: 10.1007/s11770-010-0005-2
Picotti, S., Carcione, J. M., and Ba, J. (2018). Rock-physics templates
based on seismic Q. Geophysics 84, MR13–MR23. doi: 10.1190/geo201
8-0017.1
Pride, S. R., Berryman, J. G., and Harris, J. M. (2004). Seismic attenuation
due to wave-induced flow. J. Geophys. Res. Solid Earth 109:B01201.
doi: 10.1029/2003JB002639
Qi, Q., Müller, T. M., and Pervukhina, M. (2017). Sonic QP/QS ratio as
diagnostic tool for shale gas saturation. Geophysics 82, MR97–MR103.
doi: 10.1190/geo2016-0499.1
Qiao, Y., and An, H. (2007). Study of petrophysical parameter sensitivity
from well log data. Appl. Geophys. 4, 282–287. doi: 10.1007/s11770-00
7-0038-3
Quan, Y., and Harris, J. M. (1997). Seismic attenuation tomography using
the frequency shift method. Geophysics 62, 895–905. doi: 10.1190/1.14
44197
Smith, G. C., and Sutherland, R. A. (1996). The fluid factor as an AVO indicator.
Geophysics 61, 1425–1428. doi: 10.1190/1.1444067
Toksöz, M. N., Johnston, D. H., and Timur, A. (1979). Attenuation of seismic
waves in dry and saturated rocks: I. Laboratory measurements. Geophysics 44,
681–690. doi: 10.1190/1.1440969
White, J. E. (1975). Computed seismic speeds and attenuation in rocks with partial
gas saturation. Geophysics 40, 224–232. doi: 10.1190/1.1440520
Winkler, K. W., and Nur, A. (1982). Seismic attenuation: effects of pore fluids and
frictional-sliding. Geophysics 47, 1–15. doi: 10.1190/1.1441276
Xue, Y., Cao, J., Wang, D., Tian, R., and Shu, Y. (2013). Detection of gas and
water using HHT by analyzing P- and S-wave attenuation in tight sandstone gas
reservoirs. J. Appl. Geophys. 98, 134–143. doi: 10.1016/j.jappgeo.2013.08.023
Zeng, Q., Guo, Y., Jiang, R., Ba, J., Ma, H., and Liu, J. (2017). Fluid sensitivity of
rock physics parameters in reservoirs: quantitative analysis. J. Seism. Explor.
26, 125–140.
Zhou, Z., and Hilterman, F. J. (2010). A comparison between methods that
discriminate fluid content in unconsolidated sandstone reservoirs. Geophysics
75, B47–B58. doi: 10.1190/1.3253153
Conflict of Interest: CW was employed by the company Petrochina.
The remaining authors declare that the research was conducted in the absence of
any commercial or financial relationships that could be construed as a potential
conflict of interest.
Copyright © 2021 Ma, Ba, Carcione, Lebedev and Wang. This is an open-access
article distributed under the terms of the Creative Commons Attribution License (CC
BY). The use, distribution or reproduction in other forums is permitted, provided
the original author(s) and the copyright owner(s) are credited and that the original
publication in this journal is cited, in accordance with accepted academic practice.
No use, distribution or reproduction is permitted which does not comply with these
terms.
Frontiers in Earth Science | www.frontiersin.org 13 May 2021 | Volume 9 | Article 652344
Related Documents