Experimental study on gas–liquid–liquid macro-mixing in a stirred tank Dang Cheng, Jingcai Cheng, Xiangyang Li, Xi Wang, Chao Yang n , Zai-Sha Mao Key Laboratory of Green Process and Engineering, National Engineering Laboratory for Hydrometallurgical Cleaner Production Technology, Institute of Process Engineering, Chinese Academy of Sciences, Beijing 100190, China article info Article history: Received 15 November 2011 Received in revised form 6 March 2012 Accepted 25 March 2012 Available online 1 April 2012 Keywords: Stirred tank Gas–liquid–liquid Mixing Dispersion Turbulence Aeration abstract In this paper, experimental data on the mixing time of the continuous phase and power consumption of gas–liquid–liquid dispersions in a mechanically agitated baffled tank are presented. The electrical conductivity method is taken for the measurement of mixing time and the shaft-torque method for power consumption measurement. Tap water is used as the continuous phase, and kerosene and air as the dispersed ones. The effects of probe/tracer injection position, agitation speed, type of impeller, clearance of impeller off tank bottom, oil volume fraction, gas holdup and physical properties of the dispersed liquids on the macro-mixing of the gas–liquid–liquid system have been investigated. The phenomenon of gas–liquid–liquid macro-mixing in a stirred tank is largely similar to that of liquid– liquid and gas–liquid stirred tanks. Our experiments indicate that the gas–liquid–liquid macro-mixing can be enhanced at higher gas holdups while damped at low gas holdups. Contrary to gas effect, the dispersed oil phase at low holdups increases the macro-mixing intensity but at higher holdups decreases the macro-mixing intensity of the continuous phase. The experimental results show that axial impellers are more energy efficient for gas–liquid–liquid macro-mixing than radial impellers. A simple correlation is developed for predicting the mixing time in gas–liquid–liquid three-phase systems and satisfactory agreement with experimental data is observed. & 2012 Elsevier Ltd. All rights reserved. 1. Introduction Gas–liquid–liquid dispersions in mechanically agitated vessels are very common industrial operations used in chemical industry. Typical applications include hydroformylation, hydrogenation, microorganism fermentation, liquid–liquid extraction, etc. Pre- vious investigations concerning the gas–liquid–liquid dispersions in stirred tanks were mainly focused on the minimum agitation speed for complete liquid–liquid dispersion (Armenante and Abu-Hekmeh, 1994; Kamil et al., 2001), the effect of a dispersed second inert liquid phase on gas–liquid interfacial area (Das et al., 1985; Mehta and Sharma, 1971), gas absorption rate (Bruining et al., 1986; Cents et al., 2001; Dumont and Delmas, 2003; Lekhal et al., 1997; Linek and Benes, 1976; Van der Meer et al., 1992; Van Ede et al., 1995) and homogeneous biphasic catalytic aspects (Purwanto and Delmas, 1995). The knowledge of macro-mixing time is essential when the rate of mixing is comparable with or slower than that of chemical reaction or mass transfer (Raghav Rao and Joshi, 1988). Under these conditions, the mixing effect is reflected in the correspond- ing reduction of selectivity in parallel and consecutive reactions. Consequently, liquid-mixing is of vital importance for the reliable design and scale-up of gas–liquid–liquid stirred reactors. In addition, the mixing time information is a very useful indicator for fluid dynamic behavior as the fluid dynamic characteristic of gas–liquid–liquid systems is difficult to be determined directly for its complexity. A considerable body of knowledge on single phase mixing (Brennan and Lehrer, 1976; Kramers et al., 1953; Nere et al., 2003; Grenville and Nienow, 2004) is available, and Nere et al. (2003) and Grenville and Nienow (2004) reviewed comprehensively the single phase mixing performance in stirred tanks. Various mea- surement techniques have been developed over the past years such as visual observation of decoloration, transient conductivity/ pH measurement, liquid-crystal thermography, electrical resis- tance tomography and planar laser-induced fluorescence (PLIF) techniques. Liquid phase mixing in the presence of another phase (solid, gas or another immiscible liquid) has attracted much attention. Paca et al. (1976), Einsele and Finn (1980), Joshi et al. (1982) and Pandit and Joshi (1983) investigated the liquid mixing time in the presence of gas using either conductivity method or pH measure- ment. It was observed that the presence of gas phase can either increase or decrease liquid phase mixing time, and the exact effect of gas phase on liquid mixing time depended on impeller design, gas phase holdup, impeller speed, etc. Raghav Rao and Contents lists available at SciVerse ScienceDirect journal homepage: www.elsevier.com/locate/ces Chemical Engineering Science 0009-2509/$ - see front matter & 2012 Elsevier Ltd. All rights reserved. http://dx.doi.org/10.1016/j.ces.2012.03.035 n Corresponding author. Tel.: þ86 10 62554558; fax: þ86 10 82544928. E-mail address: [email protected] (C. Yang). Chemical Engineering Science 75 (2012) 256–266

Welcome message from author
This document is posted to help you gain knowledge. Please leave a comment to let me know what you think about it! Share it to your friends and learn new things together.
Transcript

Chemical Engineering Science 75 (2012) 256–266
Contents lists available at SciVerse ScienceDirect
Chemical Engineering Science
0009-25
http://d
n Corr
E-m
journal homepage: www.elsevier.com/locate/ces
Experimental study on gas–liquid–liquid macro-mixing in a stirred tank
Dang Cheng, Jingcai Cheng, Xiangyang Li, Xi Wang, Chao Yang n, Zai-Sha Mao
Key Laboratory of Green Process and Engineering, National Engineering Laboratory for Hydrometallurgical Cleaner Production Technology, Institute of Process Engineering,
Chinese Academy of Sciences, Beijing 100190, China
a r t i c l e i n f o
Article history:
Received 15 November 2011
Received in revised form
6 March 2012
Accepted 25 March 2012Available online 1 April 2012
Keywords:
Stirred tank
Gas–liquid–liquid
Mixing
Dispersion
Turbulence
Aeration
09/$ - see front matter & 2012 Elsevier Ltd. A
x.doi.org/10.1016/j.ces.2012.03.035
esponding author. Tel.: þ86 10 62554558; fa
ail address: [email protected] (C. Yan
a b s t r a c t
In this paper, experimental data on the mixing time of the continuous phase and power consumption of
gas–liquid–liquid dispersions in a mechanically agitated baffled tank are presented. The electrical
conductivity method is taken for the measurement of mixing time and the shaft-torque method for
power consumption measurement. Tap water is used as the continuous phase, and kerosene and air as
the dispersed ones. The effects of probe/tracer injection position, agitation speed, type of impeller,
clearance of impeller off tank bottom, oil volume fraction, gas holdup and physical properties of the
dispersed liquids on the macro-mixing of the gas–liquid–liquid system have been investigated. The
phenomenon of gas–liquid–liquid macro-mixing in a stirred tank is largely similar to that of liquid–
liquid and gas–liquid stirred tanks. Our experiments indicate that the gas–liquid–liquid macro-mixing
can be enhanced at higher gas holdups while damped at low gas holdups. Contrary to gas effect, the
dispersed oil phase at low holdups increases the macro-mixing intensity but at higher holdups
decreases the macro-mixing intensity of the continuous phase. The experimental results show that
axial impellers are more energy efficient for gas–liquid–liquid macro-mixing than radial impellers.
A simple correlation is developed for predicting the mixing time in gas–liquid–liquid three-phase
systems and satisfactory agreement with experimental data is observed.
& 2012 Elsevier Ltd. All rights reserved.
1. Introduction
Gas–liquid–liquid dispersions in mechanically agitated vesselsare very common industrial operations used in chemical industry.Typical applications include hydroformylation, hydrogenation,microorganism fermentation, liquid–liquid extraction, etc. Pre-vious investigations concerning the gas–liquid–liquid dispersionsin stirred tanks were mainly focused on the minimum agitationspeed for complete liquid–liquid dispersion (Armenante andAbu-Hekmeh, 1994; Kamil et al., 2001), the effect of a dispersedsecond inert liquid phase on gas–liquid interfacial area (Das et al.,1985; Mehta and Sharma, 1971), gas absorption rate (Bruininget al., 1986; Cents et al., 2001; Dumont and Delmas, 2003; Lekhalet al., 1997; Linek and Benes, 1976; Van der Meer et al., 1992; VanEde et al., 1995) and homogeneous biphasic catalytic aspects(Purwanto and Delmas, 1995).
The knowledge of macro-mixing time is essential when therate of mixing is comparable with or slower than that of chemicalreaction or mass transfer (Raghav Rao and Joshi, 1988). Underthese conditions, the mixing effect is reflected in the correspond-ing reduction of selectivity in parallel and consecutive reactions.
ll rights reserved.
x: þ86 10 82544928.
g).
Consequently, liquid-mixing is of vital importance for the reliabledesign and scale-up of gas–liquid–liquid stirred reactors. Inaddition, the mixing time information is a very useful indicatorfor fluid dynamic behavior as the fluid dynamic characteristic ofgas–liquid–liquid systems is difficult to be determined directly forits complexity.
A considerable body of knowledge on single phase mixing(Brennan and Lehrer, 1976; Kramers et al., 1953; Nere et al., 2003;Grenville and Nienow, 2004) is available, and Nere et al. (2003)and Grenville and Nienow (2004) reviewed comprehensively thesingle phase mixing performance in stirred tanks. Various mea-surement techniques have been developed over the past yearssuch as visual observation of decoloration, transient conductivity/pH measurement, liquid-crystal thermography, electrical resis-tance tomography and planar laser-induced fluorescence (PLIF)techniques.
Liquid phase mixing in the presence of another phase (solid,gas or another immiscible liquid) has attracted much attention.Paca et al. (1976), Einsele and Finn (1980), Joshi et al. (1982) andPandit and Joshi (1983) investigated the liquid mixing time in thepresence of gas using either conductivity method or pH measure-ment. It was observed that the presence of gas phase can eitherincrease or decrease liquid phase mixing time, and the exacteffect of gas phase on liquid mixing time depended on impellerdesign, gas phase holdup, impeller speed, etc. Raghav Rao and

Fig. 1. Experimental setup. 1. conductivity electrode, 2. conductometer, 3. sparger,
4. rotary torque transducer, 5. amplifier, 6. data collector, 7. computer, 8. stirred
tank, 9. injector. A (Probe A): 0.192 m from bottom and 0.115 m from shaft axis;
B (Probe B): 0.03 m from bottom and 0.115 m from shaft axis; P1 (injector 1): at
the liquid surface and 0.115 m from shaft axis; P2 (injector 2): 0.08 m from
bottom and 0.115 m from shaft axis; P3 (injector 3): 0.03 m from bottom and
0.115 m from shaft axis.
D. Cheng et al. / Chemical Engineering Science 75 (2012) 256–266 257
Joshi (1988) measured the liquid-phase mixing time in solid–liquidsystems by a conductivity method, and revealed an increase inmixing time when particles were added. They explained theincrease was because the suspended solid–liquid interface con-sumed much energy from the rotating impeller. Kraume (1992)also reported that the presence of solid particles led to a pro-nounced lengthening of mixing time using the decolorationmethod. However, Bujalski et al. (1999) and Micheletti et al.(2003) found that, regardless of the state of suspension, solids ofrelatively low concentrations had little influence on the mixingtime as compared to water alone; but for relatively large solidsconcentrations, the dimensionless mixing time first increased untilit reached a maximum and then decreased again to approach thesingle-phase value with increasing impeller speeds. Recently, Zhaoet al. (2011) studied the liquid mixing time in the presence ofanother immiscible liquid using the conductivity method. Theincrease in the macro-mixing intensity of the continuous liquidphase was detected at low dispersed phase holdups while thedamped macro-mixing intensity of the continuous phase wasfound at higher dispersed phase volume percentages.
The liquid phase mixing is considerably complicated when twoother dispersed phases are present at the same time, such as thecases in gas–liquid–solid, liquid–liquid–solid and gas–liquid–liquid systems. Among three-phase systems in stirred tanks, thegas–liquid–solid system is the most investigated one. The criticalagitator speed and the corresponding power consumption forsolids suspension and gas dispersion are the popular subjects.Relatively limited work addressed the mixing time in three-phasestirred reactors. Rewatkar et al. (1991) measured the mixing timein a single-impeller gas–liquid–solid agitated contactor using theconductivity method, and reported that the mixing time behaviorwas different as compared to the solid–liquid system and muchsimilar to the gas–liquid system. Longer mixing time in the gas–liquid–solid system than that in the solid–liquid and gas–liquidsystems was observed in their measurements. They found thatthe variation of mixing time with impeller speed in the aeratedsolid–liquid suspension was a useful indication to determine thecritical solid suspension speed at the gassed condition (Njsg).Kawase et al. (1997) investigated liquid-phase mixing time bytransient pH measurements in a single-impeller gas–liquid–solidstirred tank with non-Newtonian fluids as the continuous phase.The presence of either gas or solids increased the mixing time innon-Newtonian fluids, and the gas made more substantial con-tribution to the increased mixing time compared with that inpure water at lower speeds. Multi-impeller gas–liquid–solidagitated tanks were more covered in the literature. Dohi et al.(1999) investigated the mixing in a three-impeller (four pitchedblade downflow-four pitched blade downflow-Pfaudler typeimpeller) gas–liquid–solid stirred tank, and found that the mixingtime increased with superficial gas velocity to 0.016 m/s, afterwhich the mixing time decreased in the case of melaminesuspension. Generally, solid particles have been found to extendliquid phase mixing time, but for small glass beads Dohi et al.(1999) drew no generalized and quantitative relationship for themixing time. Takenaka et al. (2001) observed that the mixing timein the solid–liquid case at higher solid concentrations (up to 40%w/w) was much greater when compared to the situation withoutsolids, but for the gas–liquid–solid three phase system theincrease was relatively small, especially with Scaba and 6MFUimpellers. Dutta and Pangarkar (1995) used the mixing timevariation method to determine Njsg in four-impeller gas–liquid–solid three phase systems.
The above-mentioned gas–liquid–solid systems are the casesof heavier particles (settling in liquid phase) suspended in liquids.The mixing of gas–liquid floating particles is another branchof three-phase systems and is also encountered in process
industries. However, little attention has been devoted to theliquid-phase mixing time in gas–liquid-floating particles three-phase systems. Xu et al. (2000) investigated the effects of impellertype, baffles, gas sparger, rotational speed, gas volumetric flowrate and particle fraction on mixing time in multi-impeller three-phase gas–liquid-floating particle systems by measuring tem-perature differences using thermocouples. Their work revealedthat the axial flow was the most important factor for the liquidphase mixing time. Liquid phase mixing time in other three-phasesystems is scarcely investigated, and practically no report on themixing time in gas–liquid–liquid agitated reactors has been foundin the open literature, in spite of its importance. The purpose ofthis paper is to contribute to the knowledge on the macro-mixingof the continuous phase in the simultaneous presence of both gasand oil as dispersed phases, particularly to explore the effect ofaeration and the dispersed oil phase on macro-mixing in thecontinuous phase. The mixing time and power consumption inboth liquid–liquid and gas–liquid–liquid systems are measured.The effects of various operation conditions on the macro-mixingof liquid phase are analyzed and the mixing time data arecorrelated.
2. Experimental
2.1. Experimental setup
The schematic diagram of experimental setup is shown inFig. 1. Experiments were carried out in a semi-batch manner (gas-continuous, liquid-batch-wise). The diameter of the stirred tank is0.24 m and the total height is 0.428 m. Four baffles with width of0.024 m are equipped equally-spaced at the wall. The liquidheight for all experiments is set at H¼T. The sparger withdiameter (Ds) of 0.08 m and 16 holes (diameter of 0.0015 m) isinstalled underneath the impeller. The off-bottom clearance of thesparger is T/10 in most experiments; and T/4 and T/6 are just usedto test the influence of sparger locations with respect to theimpeller. Different types of stirrers are used as shown in Fig. 2,namely, Rushton disk turbine (RDT), half circle blade disk turbine(HCDT), 451 pitched blade turbine downflow (PBTD) and 451pitched blade turbine upflow (PBTU). The four impellers have
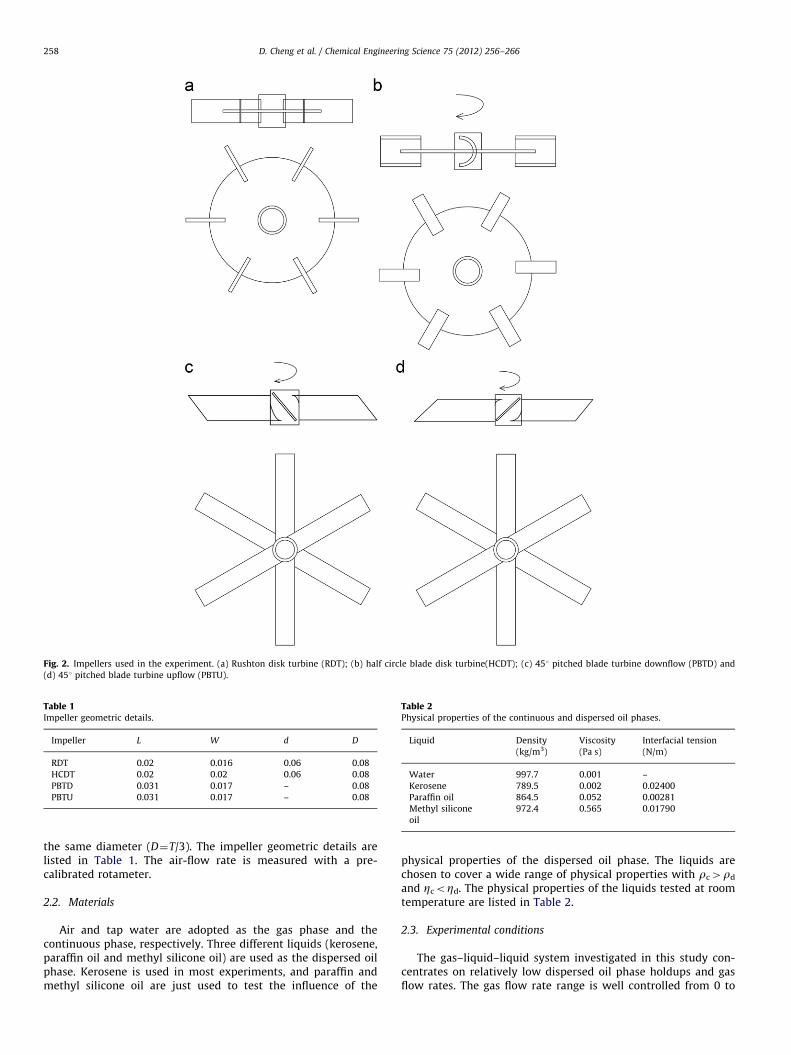
Fig. 2. Impellers used in the experiment. (a) Rushton disk turbine (RDT); (b) half circle blade disk turbine(HCDT); (c) 451 pitched blade turbine downflow (PBTD) and
(d) 451 pitched blade turbine upflow (PBTU).
Table 1Impeller geometric details.
Impeller L W d D
RDT 0.02 0.016 0.06 0.08
HCDT 0.02 0.02 0.06 0.08
PBTD 0.031 0.017 – 0.08
PBTU 0.031 0.017 – 0.08
Table 2Physical properties of the continuous and dispersed oil phases.
Liquid Density
(kg/m3)
Viscosity
(Pa s)
Interfacial tension
(N/m)
Water 997.7 0.001 –
Kerosene 789.5 0.002 0.02400
Paraffin oil 864.5 0.052 0.00281
Methyl silicone
oil
972.4 0.565 0.01790
D. Cheng et al. / Chemical Engineering Science 75 (2012) 256–266258
the same diameter (D¼T/3). The impeller geometric details arelisted in Table 1. The air-flow rate is measured with a pre-calibrated rotameter.
2.2. Materials
Air and tap water are adopted as the gas phase and thecontinuous phase, respectively. Three different liquids (kerosene,paraffin oil and methyl silicone oil) are used as the dispersed oilphase. Kerosene is used in most experiments, and paraffin andmethyl silicone oil are just used to test the influence of the
physical properties of the dispersed oil phase. The liquids arechosen to cover a wide range of physical properties with rc4rd
and ZcoZd. The physical properties of the liquids tested at roomtemperature are listed in Table 2.
2.3. Experimental conditions
The gas–liquid–liquid system investigated in this study con-centrates on relatively low dispersed oil phase holdups and gasflow rates. The gas flow rate range is well controlled from 0 to
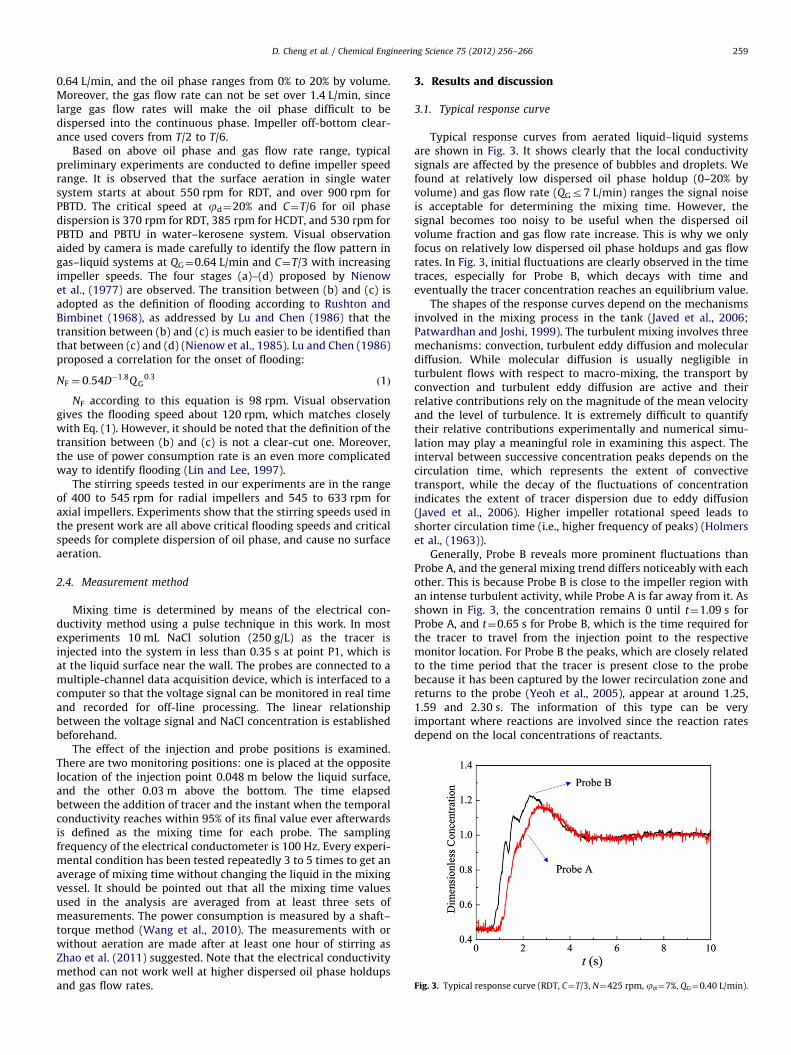
Fig. 3. Typical response curve (RDT, C¼T/3, N¼425 rpm, jd¼7%, QG¼0.40 L/min).
D. Cheng et al. / Chemical Engineering Science 75 (2012) 256–266 259
0.64 L/min, and the oil phase ranges from 0% to 20% by volume.Moreover, the gas flow rate can not be set over 1.4 L/min, sincelarge gas flow rates will make the oil phase difficult to bedispersed into the continuous phase. Impeller off-bottom clear-ance used covers from T/2 to T/6.
Based on above oil phase and gas flow rate range, typicalpreliminary experiments are conducted to define impeller speedrange. It is observed that the surface aeration in single watersystem starts at about 550 rpm for RDT, and over 900 rpm forPBTD. The critical speed at jd¼20% and C¼T/6 for oil phasedispersion is 370 rpm for RDT, 385 rpm for HCDT, and 530 rpm forPBTD and PBTU in water–kerosene system. Visual observationaided by camera is made carefully to identify the flow pattern ingas–liquid systems at QG¼0.64 L/min and C¼T/3 with increasingimpeller speeds. The four stages (a)–(d) proposed by Nienowet al., (1977) are observed. The transition between (b) and (c) isadopted as the definition of flooding according to Rushton andBimbinet (1968), as addressed by Lu and Chen (1986) that thetransition between (b) and (c) is much easier to be identified thanthat between (c) and (d) (Nienow et al., 1985). Lu and Chen (1986)proposed a correlation for the onset of flooding:
NF ¼ 0:54D�1:8QG0:3
ð1Þ
NF according to this equation is 98 rpm. Visual observationgives the flooding speed about 120 rpm, which matches closelywith Eq. (1). However, it should be noted that the definition of thetransition between (b) and (c) is not a clear-cut one. Moreover,the use of power consumption rate is an even more complicatedway to identify flooding (Lin and Lee, 1997).
The stirring speeds tested in our experiments are in the rangeof 400 to 545 rpm for radial impellers and 545 to 633 rpm foraxial impellers. Experiments show that the stirring speeds used inthe present work are all above critical flooding speeds and criticalspeeds for complete dispersion of oil phase, and cause no surfaceaeration.
2.4. Measurement method
Mixing time is determined by means of the electrical con-ductivity method using a pulse technique in this work. In mostexperiments 10 mL NaCl solution (250 g/L) as the tracer isinjected into the system in less than 0.35 s at point P1, which isat the liquid surface near the wall. The probes are connected to amultiple-channel data acquisition device, which is interfaced to acomputer so that the voltage signal can be monitored in real timeand recorded for off-line processing. The linear relationshipbetween the voltage signal and NaCl concentration is establishedbeforehand.
The effect of the injection and probe positions is examined.There are two monitoring positions: one is placed at the oppositelocation of the injection point 0.048 m below the liquid surface,and the other 0.03 m above the bottom. The time elapsedbetween the addition of tracer and the instant when the temporalconductivity reaches within 95% of its final value ever afterwardsis defined as the mixing time for each probe. The samplingfrequency of the electrical conductometer is 100 Hz. Every experi-mental condition has been tested repeatedly 3 to 5 times to get anaverage of mixing time without changing the liquid in the mixingvessel. It should be pointed out that all the mixing time valuesused in the analysis are averaged from at least three sets ofmeasurements. The power consumption is measured by a shaft–torque method (Wang et al., 2010). The measurements with orwithout aeration are made after at least one hour of stirring asZhao et al. (2011) suggested. Note that the electrical conductivitymethod can not work well at higher dispersed oil phase holdupsand gas flow rates.
3. Results and discussion
3.1. Typical response curve
Typical response curves from aerated liquid–liquid systemsare shown in Fig. 3. It shows clearly that the local conductivitysignals are affected by the presence of bubbles and droplets. Wefound at relatively low dispersed oil phase holdup (0–20% byvolume) and gas flow rate (QGr7 L/min) ranges the signal noiseis acceptable for determining the mixing time. However, thesignal becomes too noisy to be useful when the dispersed oilvolume fraction and gas flow rate increase. This is why we onlyfocus on relatively low dispersed oil phase holdups and gas flowrates. In Fig. 3, initial fluctuations are clearly observed in the timetraces, especially for Probe B, which decays with time andeventually the tracer concentration reaches an equilibrium value.
The shapes of the response curves depend on the mechanismsinvolved in the mixing process in the tank (Javed et al., 2006;Patwardhan and Joshi, 1999). The turbulent mixing involves threemechanisms: convection, turbulent eddy diffusion and moleculardiffusion. While molecular diffusion is usually negligible inturbulent flows with respect to macro-mixing, the transport byconvection and turbulent eddy diffusion are active and theirrelative contributions rely on the magnitude of the mean velocityand the level of turbulence. It is extremely difficult to quantifytheir relative contributions experimentally and numerical simu-lation may play a meaningful role in examining this aspect. Theinterval between successive concentration peaks depends on thecirculation time, which represents the extent of convectivetransport, while the decay of the fluctuations of concentrationindicates the extent of tracer dispersion due to eddy diffusion(Javed et al., 2006). Higher impeller rotational speed leads toshorter circulation time (i.e., higher frequency of peaks) (Holmerset al., (1963)).
Generally, Probe B reveals more prominent fluctuations thanProbe A, and the general mixing trend differs noticeably with eachother. This is because Probe B is close to the impeller region withan intense turbulent activity, while Probe A is far away from it. Asshown in Fig. 3, the concentration remains 0 until t¼1.09 s forProbe A, and t¼0.65 s for Probe B, which is the time required forthe tracer to travel from the injection point to the respectivemonitor location. For Probe B the peaks, which are closely relatedto the time period that the tracer is present close to the probebecause it has been captured by the lower recirculation zone andreturns to the probe (Yeoh et al., 2005), appear at around 1.25,1.59 and 2.30 s. The information of this type can be veryimportant where reactions are involved since the reaction ratesdepend on the local concentrations of reactants.
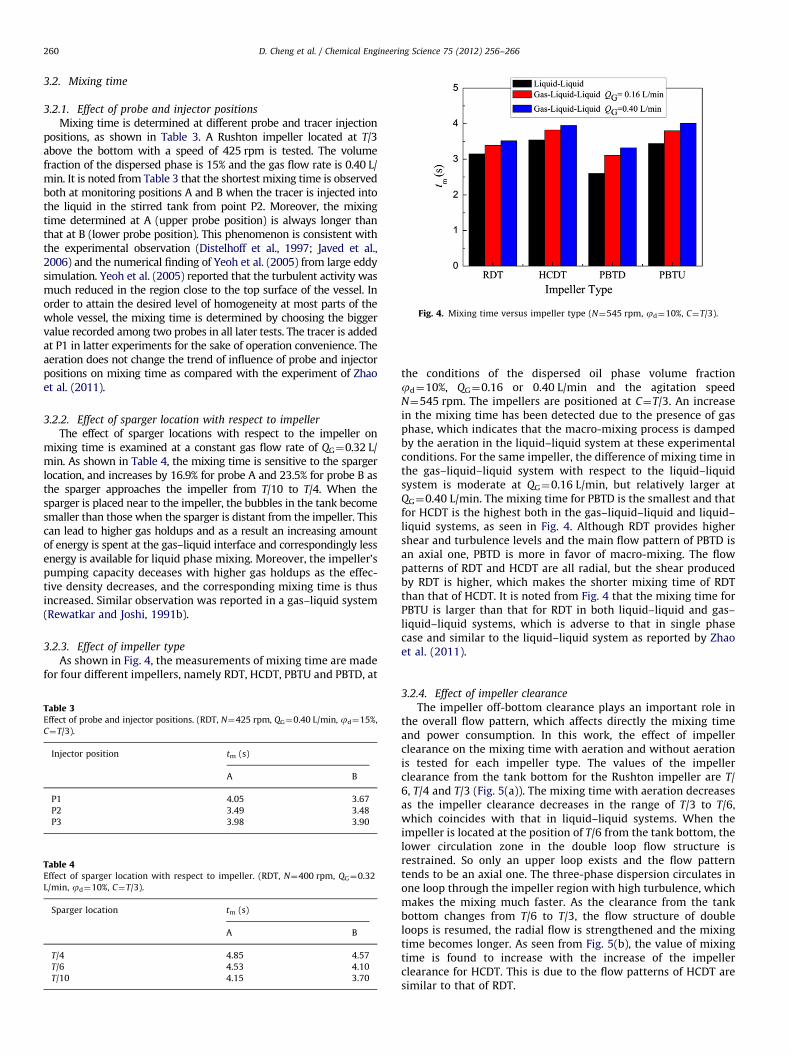
Fig. 4. Mixing time versus impeller type (N¼545 rpm, jd¼10%, C¼T/3).
D. Cheng et al. / Chemical Engineering Science 75 (2012) 256–266260
3.2. Mixing time
3.2.1. Effect of probe and injector positions
Mixing time is determined at different probe and tracer injectionpositions, as shown in Table 3. A Rushton impeller located at T/3above the bottom with a speed of 425 rpm is tested. The volumefraction of the dispersed phase is 15% and the gas flow rate is 0.40 L/min. It is noted from Table 3 that the shortest mixing time is observedboth at monitoring positions A and B when the tracer is injected intothe liquid in the stirred tank from point P2. Moreover, the mixingtime determined at A (upper probe position) is always longer thanthat at B (lower probe position). This phenomenon is consistent withthe experimental observation (Distelhoff et al., 1997; Javed et al.,2006) and the numerical finding of Yeoh et al. (2005) from large eddysimulation. Yeoh et al. (2005) reported that the turbulent activity wasmuch reduced in the region close to the top surface of the vessel. Inorder to attain the desired level of homogeneity at most parts of thewhole vessel, the mixing time is determined by choosing the biggervalue recorded among two probes in all later tests. The tracer is addedat P1 in latter experiments for the sake of operation convenience. Theaeration does not change the trend of influence of probe and injectorpositions on mixing time as compared with the experiment of Zhaoet al. (2011).
3.2.2. Effect of sparger location with respect to impeller
The effect of sparger locations with respect to the impeller onmixing time is examined at a constant gas flow rate of QG¼0.32 L/min. As shown in Table 4, the mixing time is sensitive to the spargerlocation, and increases by 16.9% for probe A and 23.5% for probe B asthe sparger approaches the impeller from T/10 to T/4. When thesparger is placed near to the impeller, the bubbles in the tank becomesmaller than those when the sparger is distant from the impeller. Thiscan lead to higher gas holdups and as a result an increasing amountof energy is spent at the gas–liquid interface and correspondingly lessenergy is available for liquid phase mixing. Moreover, the impeller’spumping capacity deceases with higher gas holdups as the effec-tive density decreases, and the corresponding mixing time is thusincreased. Similar observation was reported in a gas–liquid system(Rewatkar and Joshi, 1991b).
3.2.3. Effect of impeller type
As shown in Fig. 4, the measurements of mixing time are madefor four different impellers, namely RDT, HCDT, PBTU and PBTD, at
Table 3Effect of probe and injector positions. (RDT, N¼425 rpm, QG¼0.40 L/min, jd¼15%,
C¼T/3).
Injector position tm (s)
A B
P1 4.05 3.67
P2 3.49 3.48
P3 3.98 3.90
Table 4Effect of sparger location with respect to impeller. (RDT, N¼400 rpm, QG¼0.32
L/min, jd¼10%, C¼T/3).
Sparger location tm (s)
A B
T/4 4.85 4.57
T/6 4.53 4.10
T/10 4.15 3.70
the conditions of the dispersed oil phase volume fractionjd¼10%, QG¼0.16 or 0.40 L/min and the agitation speedN¼545 rpm. The impellers are positioned at C¼T/3. An increasein the mixing time has been detected due to the presence of gasphase, which indicates that the macro-mixing process is dampedby the aeration in the liquid–liquid system at these experimentalconditions. For the same impeller, the difference of mixing time inthe gas–liquid–liquid system with respect to the liquid–liquidsystem is moderate at QG¼0.16 L/min, but relatively larger atQG¼0.40 L/min. The mixing time for PBTD is the smallest and thatfor HCDT is the highest both in the gas–liquid–liquid and liquid–liquid systems, as seen in Fig. 4. Although RDT provides highershear and turbulence levels and the main flow pattern of PBTD isan axial one, PBTD is more in favor of macro-mixing. The flowpatterns of RDT and HCDT are all radial, but the shear producedby RDT is higher, which makes the shorter mixing time of RDTthan that of HCDT. It is noted from Fig. 4 that the mixing time forPBTU is larger than that for RDT in both liquid–liquid and gas–liquid–liquid systems, which is adverse to that in single phasecase and similar to the liquid–liquid system as reported by Zhaoet al. (2011).
3.2.4. Effect of impeller clearance
The impeller off-bottom clearance plays an important role inthe overall flow pattern, which affects directly the mixing timeand power consumption. In this work, the effect of impellerclearance on the mixing time with aeration and without aerationis tested for each impeller type. The values of the impellerclearance from the tank bottom for the Rushton impeller are T/6, T/4 and T/3 (Fig. 5(a)). The mixing time with aeration decreasesas the impeller clearance decreases in the range of T/3 to T/6,which coincides with that in liquid–liquid systems. When theimpeller is located at the position of T/6 from the tank bottom, thelower circulation zone in the double loop flow structure isrestrained. So only an upper loop exists and the flow patterntends to be an axial one. The three-phase dispersion circulates inone loop through the impeller region with high turbulence, whichmakes the mixing much faster. As the clearance from the tankbottom changes from T/6 to T/3, the flow structure of doubleloops is resumed, the radial flow is strengthened and the mixingtime becomes longer. As seen from Fig. 5(b), the value of mixingtime is found to increase with the increase of the impellerclearance for HCDT. This is due to the flow patterns of HCDT aresimilar to that of RDT.

Fig. 5. Mixing time versus impeller clearance (N¼545 rpm, QG¼0.16 L/min, jd¼10%, C¼T/3). (a) RDT (b) HCDT; (c) PBTD (d) PBTU.
Fig. 6. Mixing time versus impeller speed (QG¼0.32 L/min, jd¼10%, C¼T/3). (a) RDT and HCDT (b) PBTD.
D. Cheng et al. / Chemical Engineering Science 75 (2012) 256–266 261
In the case of PBTD, the mixing time decreases as the impellerclearance increases from T/6 to T/3, while it increases again with C upto T/2 (Fig. 5(c)). This trend of variation is similar to that in the singlephase (Rewatkar and Joshi, 1991a) and liquid–liquid systems. Whenthe impeller is located at a clearance of T/2 far from the tank bottom,the flow is not strong enough to turn round before reaching thebottom and a new loop is formed under the previous one. The tworelatively independent flow zones retard the fluid exchange betweenupper and lower loops and hence the transport of the tracer, andtherefore longer mixing time is observed. For the clearance of T/3,axial flow is predominant with short mixing time. When theclearance decreases from T/4 to T/6, blending is weaker on the uppertank and the overall mixing is slowed down. It can be seen that thePBTU with C¼T/4 performs the best in both liquid–liquid and gas–liquid–liquid systems. If the C/T ratio is either decreased or increasedfrom this value, the mixing time is found to increase (Fig. 5(d)). Fig. 5suggests that the aeration really exerts an influence on mixingtime, but has little effect on the flow patterns generated at differentimpeller clearances.
3.2.5. Effect of agitation speed
The agitation speed is varied to determine its effect on themixing time in the tank agitated by RDT, HCDT and PBTD. Theimpellers are all located at T/3 and the holdup of the dispersed oilphase is 10%. As shown in Fig. 6, the mixing time decreasesobviously with an increase in impeller speed as in the case ofliquid–liquid dispersion. In the presence of aeration, less energy isavailable for liquid phase mixing and circulation compared withthe ungassed situation at the same impeller speed, which leads tothe mixing time curves for the gas–liquid–liquid system lie abovethat for the liquid–liquid system.
3.2.6. Effect of oil volume fraction
To determine the effect of the dispersed oil phase volumefraction on mixing time under aeration conditions, the measure-ments are made at 0, 3, 5, 7, 10, 12, 15 and 20 vol.% kerosene.Zhao et al. (2011) found that the mixing time decreased with theoil volume fraction increased from 0% to 7% and then increased

Fig. 8. Gas holdup versus gas flow rate (RDT, jd¼10%, C¼T/3).
D. Cheng et al. / Chemical Engineering Science 75 (2012) 256–266262
further with the volume fraction from 7% to 20% in liquid–liquidsystems. This phenomenon is also observed in this work. How-ever, the turning point moves to 10% for the gassed dispersion asshown in Fig. 7. This might indicate that turbulence could also beenhanced by the dispersed oil phase at low volume fraction andbe damped at higher volume fraction in the gas–liquid–liquidsystem.
The conclusion was supported by several previous reports.Laurenzi et al. (2009) used a PIV technique to investigate the fluiddynamic characteristics in a liquid–liquid system at 1% dispersed-phase volume fraction and found that the action of the dispersedphase was generally to promote turbulence and the droplets werecharacterized by both radial and axial r.m.s (root mean square)velocity values greater than those of the continuous phase. Thepresence of the dispersed phase of low volume percentagesintensified the turbulence by vortex shedding which was causedby the motion of droplets relative to the continuous phase.Svensson and Rasmuson (2004) measured the velocity vectorfields by a laser Doppler anemometry (LDA) technique for 0%, 10%and 25% dispersed phase and considered that turbulence wasdampened when the amount of oil was increased. They furtherinvestigated (Svensson and Rasmuson, 2006) how the macro-scale flow structure and turbulence were influenced when thepercentage of the dispersed phase was increased using a PIVtechnique. The r.m.s values in a vertical plane through theimpeller shaft and the midway between two baffles focusing onthe lower part of the tank generally increased with increasingdispersed phase content from 0% to 7.0% by volume. The meanr.m.s values increased 16% for the 3 vol.% case and increased 43%for the 7 vol.% case compared to the single-phase case. Moreover,the mean r.m.s values at the impeller disk height for 0.0 vol.% and7.0 vol.% dispersed phases were 0.21 and 0.23 m/s, respectively.Das et al. (1985) measured the effect of an inert immiscibleorganic phase on gas–liquid interfacial area in a stirred vesselwith an optical method, and found that the gas–liquid interfacialarea per unit volume of the dispersion first increased, passedthrough a maximum and then decreased as the organic phasevolume fraction increased. A maximum interfacial area wasobserved at around jd¼10% in their work. Their further bubblesize experiments confirmed that the presence of the dispersedorganic phase tended to damp the turbulent fluctuations, whichresulted in the decrease of gas–liquid interfacial area per unitvolume of the dispersion.
It is noted from Fig. 7 that the curve of the gas–liquid–liquidsystem lies above that of the liquid–liquid system, which signifiesthat the aeration damps the macro-mixing efficiency from jd¼0vol.% to 20 vol.% at QG¼0.40 L/min. The increase of the percentage
Fig. 7. Mixing time versus oil volume fraction (RDT, N¼425 rpm, QG¼0.40 L/min,
C¼T/3).
of the more viscous dispersed phase leads to a higher effectiveviscosity. Beyond 10%, the increased drag force between thedroplets and the continuous phase because of the further increaseof effective viscosity modifies the velocities of droplets and leadsto weaker turbulence finally (Zhao et al., 2011), which results inan increase of mixing time.
3.2.7. Effect of gas holdup
Since gas is also a dispersed phase, the effect of gas on mixingtime is expressed in terms of gas holdup. The gas holdup ismeasured from the difference in height above the tank bottombetween the dispersion and the ungassed liquid. Fig. 8 shows thevariation of gas holdup with gas flow rate at different impellerspeeds.
As shown in Fig. 8, higher gas flow rate and impeller speedproduce larger gas holdup. We focus on low gas flow rates (0–0.64 L/min), so the gas holdup is relatively small. The effect of gasholdup on mixing time is shown in Fig. 9. The increase in gasholdup resulting from increasing gas flow rate would interruptthe liquid mixing to some extent, i.e., the mixing time increaseswith the gas holdup at a lower gas flow rate region to QG¼0.32 L/min and then the mixing time decreases with the further increasein gas holdup as shown in Fig. 9.
Similar effect of aeration on the micro-mixing process of liquidphase was observed by Lin and Lee (1997) in a gas–liquid stirredtank. At a lower gas holdup, an increasing amount of energy isspent at the gas–liquid interface with the increaseof jG andcorrespondingly less energy is available for the liquid-phasemixing. At a higher gas holdup, the intensity of liquid turbulence
Fig. 9. Mixing time versus gas holdup (RDT, N¼440 rpm, jd¼10%, C¼T/3).

D. Cheng et al. / Chemical Engineering Science 75 (2012) 256–266 263
might be strengthened. Lu and Ju (1987) measured quantitativelythe distribution of the mean velocity and turbulence intensity inthe impeller discharge stream region of an aerated stirred tankusing a conical hot-film probe CTA (constant temperature ane-mometry), and they found that the mean velocity at a constantimpeller speed was reduced against growing aeration number andthe turbulence intensity increased with increasing aeration rate.This means the gas phase affects the liquid flow in a complex way,which further illustrates that the gas phase can either increase ordecrease the liquid mixing depending on its magnitude.
Fig. 11. PV versus impeller clearance and type in a gas–liquid–liquid stirred tank
(N¼545 rpm, QG¼0.16 L/min, jd¼10%).
Fig. 12. Mixing time versus power consumption in a gas–liquid–liquid stirred
tank (QG¼0.32 L/min, jd¼10%, C¼T/3).
3.2.8. Effect of physical property of dispersed phase
Fig. 10 presents a set of experiments using the Rushton impellerwith various oils. The physical properties of three dispersed oilphases can be seen in Table 2. The mixing time increases slightlyby 7.9% with aeration and by 8.9% in the absence of gas when thedispersed oil is changed from kerosene (2.0 mPa.s) to methylsilicone oil (565 mPa.s). The increase in mixing time is mainlyattributed to higher effective viscosity as explained by Zhao et al.(2011). Einsele and Finn (1980) measured the liquid mixing time ingas–liquid systems, and revealed that the mixing time increasedwith higher liquid viscosity.
3.3. Power consumption
The power number of RDT in single water system has beenmeasured to be 4.88, which is in close agreement with 5.01calculated from the following correlation:
NP ¼ 6:405�55:673t
Dð2Þ
reported by Rutherford et al. (1996).Fig. 11 shows the effect of impeller clearance on power
consumption per unit volume (PV) with Reynolds number of5.8�104 for RDT, HCDT, PBTD and PBTU in a gas–liquid–liquidstirred tank. It can be observed that the power consumptiondeclines slightly from the standard configuration (C¼T/3) with C
decreased to T/4, and falls by about 23% and 10.5% when C reaches6/T and T/2, respectively. This is in consistent with the experi-mental findings of Ibrahim and Nienow (1995) where a similarsharp decrease (by around 25%) of Np can be observed with aRushton impeller at T/6 clearance from those at T/3 and T/4clearances. A similar behavior was also observed in the experi-mental data by Armenante and Nagamine (1998). The phenom-enon of less energy consumption occurring at T/2 clearance, asshown in Fig.11, was also previously reported by Kramers et al.(1953) and Zhao et al. (2011).
Fig. 10. Mixing time versus physical properties of the dispersed oil phases
(RDT, N¼475 rpm, jd¼10%, QG¼0.32 L/min, C¼T/3).
It is noted that the axial impeller reveals a generally reversetrend, and the power input of PBTD and PBTU located at T/3 is theleast. Clearly, the radial impeller (RDT and HCDT) has more powerconsumption than the axial impeller (PBTD and PBTU). In order tocompare the mixing time of different kinds of impellers on equalbasis, the data of the mixing time in a gas–liquid–liquid stirredtank are plotted against power consumption in Fig. 12. At equalpower consumption, the mixing time for PBTD is shorter than thatfor RDT, indicating that PBTD is more energy efficient.
As shown in Fig. 13, the power input decreases with theincreasing dispersed kerosene volume fraction with or withoutaeration. The increasing kerosene volume fraction reduces thegas–liquid–liquid and liquid–liquid dispersion system densities,but increases the effective viscosities. Although the increase ofviscosity makes the value of NP rise, the equation P¼NPrN3D5
suggests that the influence of the reduced density on the gas–liquid–liquid and liquid–liquid power consumption is more pro-nounced than the effect of higher viscosity. It is worth notingfrom Fig. 13 that the aeration reduces clearly the power con-sumption, and at a lower volume fraction of kerosene thereduction is relatively larger, while the reduction becomes lesspronounced with increasing volume fraction.
It is interesting to know the power consumption required forthe gas–liquid–liquid dispersion as a function of gas flow rate. Asshown in Fig. 14, the power consumption per unit volumedecreases with increasing gas flow rate. The sharp reduction ofpower consumption is observed at lower gas flow rates, and lesspronounced drop exists at higher gas flow rates.
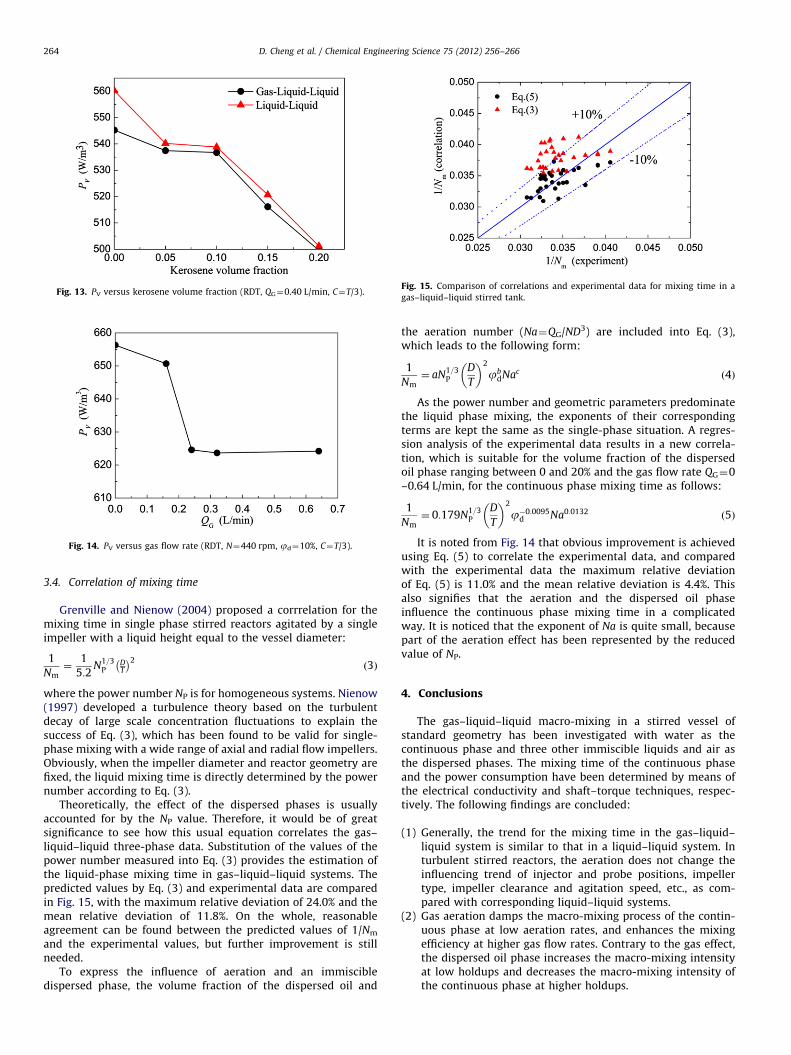
Fig. 14. PV versus gas flow rate (RDT, N¼440 rpm, jd¼10%, C¼T/3).
Fig. 15. Comparison of correlations and experimental data for mixing time in a
gas–liquid–liquid stirred tank.Fig. 13. PV versus kerosene volume fraction (RDT, QG¼0.40 L/min, C¼T/3).
D. Cheng et al. / Chemical Engineering Science 75 (2012) 256–266264
3.4. Correlation of mixing time
Grenville and Nienow (2004) proposed a corrrelation for themixing time in single phase stirred reactors agitated by a singleimpeller with a liquid height equal to the vessel diameter:
1
Nm¼
1
5:2N1=3
PDT
� �2ð3Þ
where the power number NP is for homogeneous systems. Nienow(1997) developed a turbulence theory based on the turbulentdecay of large scale concentration fluctuations to explain thesuccess of Eq. (3), which has been found to be valid for single-phase mixing with a wide range of axial and radial flow impellers.Obviously, when the impeller diameter and reactor geometry arefixed, the liquid mixing time is directly determined by the powernumber according to Eq. (3).
Theoretically, the effect of the dispersed phases is usuallyaccounted for by the NP value. Therefore, it would be of greatsignificance to see how this usual equation correlates the gas–liquid–liquid three-phase data. Substitution of the values of thepower number measured into Eq. (3) provides the estimation ofthe liquid-phase mixing time in gas–liquid–liquid systems. Thepredicted values by Eq. (3) and experimental data are comparedin Fig. 15, with the maximum relative deviation of 24.0% and themean relative deviation of 11.8%. On the whole, reasonableagreement can be found between the predicted values of 1/Nm
and the experimental values, but further improvement is stillneeded.
To express the influence of aeration and an immiscibledispersed phase, the volume fraction of the dispersed oil and
the aeration number (Na¼QG/ND3) are included into Eq. (3),which leads to the following form:
1
Nm¼ aN1=3
P
D
T
� �2
jbdNac ð4Þ
As the power number and geometric parameters predominatethe liquid phase mixing, the exponents of their correspondingterms are kept the same as the single-phase situation. A regres-sion analysis of the experimental data results in a new correla-tion, which is suitable for the volume fraction of the dispersedoil phase ranging between 0 and 20% and the gas flow rate QG¼0–0.64 L/min, for the continuous phase mixing time as follows:
1
Nm¼ 0:179N1=3
P
D
T
� �2
j�0:0095d Na0:0132 ð5Þ
It is noted from Fig. 14 that obvious improvement is achievedusing Eq. (5) to correlate the experimental data, and comparedwith the experimental data the maximum relative deviationof Eq. (5) is 11.0% and the mean relative deviation is 4.4%. Thisalso signifies that the aeration and the dispersed oil phaseinfluence the continuous phase mixing time in a complicatedway. It is noticed that the exponent of Na is quite small, becausepart of the aeration effect has been represented by the reducedvalue of NP.
4. Conclusions
The gas–liquid–liquid macro-mixing in a stirred vessel ofstandard geometry has been investigated with water as thecontinuous phase and three other immiscible liquids and air asthe dispersed phases. The mixing time of the continuous phaseand the power consumption have been determined by means ofthe electrical conductivity and shaft–torque techniques, respec-tively. The following findings are concluded:
(1)
Generally, the trend for the mixing time in the gas–liquid–liquid system is similar to that in a liquid–liquid system. Inturbulent stirred reactors, the aeration does not change theinfluencing trend of injector and probe positions, impellertype, impeller clearance and agitation speed, etc., as com-pared with corresponding liquid–liquid systems.(2)
Gas aeration damps the macro-mixing process of the contin-uous phase at low aeration rates, and enhances the mixingefficiency at higher gas flow rates. Contrary to the gas effect,the dispersed oil phase increases the macro-mixing intensityat low holdups and decreases the macro-mixing intensity ofthe continuous phase at higher holdups.
D. Cheng et al. / Chemical Engineering Science 75 (2012) 256–266 265
(3)
The combination of mixing time and power consumptionanalysis shows that the axial impeller is more energy efficientthan the radial impeller.(4)
For RDT and HCDT, the mixing time increases as the impellerclearance increases from T/6 to T/3. For PBTD, the mixing timedecreases first and then increases with a minimum value at T/3. For PBTU, the mixing time has a minimum value at T/4when the impeller clearance changes from T/6 to T/3.(5)
The power consumption decreases with the increasing dis-persed oil phase volume fraction both with and withoutaeration and also falls with the increase of gas flow rate.(6)
A new correlation for the liquid phase mixing time in gas–liquid–liquid three-phase stirred reactors is proposed basedon a widely-used single-phase model.This investigation is focused on the relatively low dispersed oilphase holdups and gas flow rates, and the systems with higherholdups and gas flow rates are also of great interest for industrialprocesses. Therefore, more suitable measurement techniques forhigher oil holdups and larger gas flow rates in gas–liquid–liquidstirred tanks are desired.
Nomenclature
a,b,c constantC impeller clearance off the tank bottom, md disk diameter of impeller, mD diameter of impeller, mDs diameter of sparger, mQG gas flow rate, m3/sH liquid height in the tank, mL impeller blade length, mN agitation speed, s�1
NF impeller speed at which impeller is flooded, s�1
Njsg critical solid suspension speed at the gassed condition,s�1
Nm non-dimensional mixing time, Nm¼Ntm
NP power number, P/rN3D5
np number of impeller bladesNa aeration number, QG/ND3
P power consumption, WPV power consumption per unit volume dispersion, W/m3
T diameter of the tank, mt impeller blade thickness, mtm mixing time, sW the impeller blade width, mZc, Zd dynamic viscosities of the continuous and dispersed oil
phases, Pa.src, rd densities of the continuous and dispersed phases, kg/m3
jd volume fraction of the dispersed oil phasejG gas holdup
Acknowledgments
Financial supports from 973 Program (2010CB630904), theNational Natural Science Foundation of China (Nos. 20990224,20906090), the National Science Fund for Distinguished YoungScholars (No. 21025627), 863 project (2011AA060704), BeijingNatural Science Foundation (2112038) and the Jiangsu ProvinceProject (BY2009133) are gratefully acknowledged.
References
Armenante, P.M., Abu-Hekmeh, E.A., 1994. A novel method for the experimentaldetermination of the minimum agitation speed for complete liquid–liquiddispersion in agitated liquid–liquid–gas systems. Chem. Eng. Res. Des. 72,677–685.
Armenante, P.M., Nagamine, E.U., 1998. Effect of low off-bottom impeller clear-ance on the minimum agitation speed for complete suspension of solids instirred tanks. Chem. Eng. Sci. 53 (9), 1757–1775.
Brennan, D.J., Lehrer, I.H., 1976. Impeller mixing in vessels experimental studies onthe influence of some parameters and formulation of a general mixing timeequation. Chem. Eng. Res. Des. 54, 139–152.
Bruining, W.J., Joosten, G.E.H., Beenackers, A., Hofman, H., 1986. Enhancement ofgas–liquid mass transfer by a dispersed second liquid phae. Chem. Eng. Sci. 41(7), 1873–1877.
Bujalski, W., Takenaka, K., Paolini, S., Jahoda, M., Paglianti, A., Takahashi, K.,Nienow, A.W., Etchells, A.W., 1999. Suspension and liquid homogenization inhigh solids concentration stirred chemical reactors. Trans. Inst. Chem. Eng. 77(A), 241–247.
Cents, A.H.G., Brilman, D.W.F., Versteeg, G.F., 2001. Gas absorption in an agitatedgas–liquid–liquid system. Chem. Eng. Sci. 56 (3), 1075–1083.
Das, T.R., Bandopadhyay, A., Parthasarathy, R., Kumar, R., 1985. Gas–liquidinterfacial area in stirred vessels: the effect of an immiscible liquid phase.Chem. Eng. Sci. 40 (2), 209–214.
Distelhoff, M.F.W., Marquis, A.J., Nouri, J.M., Whitelaw, J.H., 1997. Scalar mixingmeasurements in batch operated stirred tanks. Can. J. Chem. Eng. 75, 641–652.
Dohi, N., Matsuda, Y., Itano, N., Shimizu, K., Minekawa, K., Kawase, Y., 1999. Mixingcharacteristics in slurry stirred tank reactors with multiple impellers. Chem.Eng. Commun. 171 (1), 211–229.
Dumont, E., Delmas, H., 2003. Mass transfer enhancement of gas absorption in oil-in-water systems: a review. Chem. Eng. Process. 42 (6), 419–438.
Dutta, N.N., Pangarkar, V.G., 1995. Critical impeller speed for solid suspension inmulti-impeller three phase agitated contactors. Can. J. Chem. Eng. 73,273–283.
Einsele, A., Finn, R.K., 1980. Influence of gas flow rates and gas holdup on blendingefficiency in stirred tanks. Ind. Eng. Chem. Process Des. Dev. 19 (4), 600–603.
Grenville, R.K., Nienow, A.W., 2004. Blending of miscible liquid. In: Paul, E.L.,Atiemo-Obeng, V.A., Kresta, S.M. (Eds.), Handbook of Industrial Mixing:Science and Practice. John Wiley & Sons, New York, pp. 507–542. Chapter 9.
Holmers, D.B., Voncken, R.M., Dekker, J.A., 1963. Fluid flow in turbine-stirred,baffled tanks-circulation time. Chem. Eng. Sci. 19, 201–208.
Ibrahim, S., Nienow, A.W., 1995. Power curves and flow patterns for a range ofimpellers in Newtonian fluids: 40oReo5�105. Chem. Eng. Res. Des. 73,485–491.
Javed, K.H., Mahmud, T., Zhu, J.M., 2006. Numerical simulation of turbulent batchmixing in a vessel agitated by a Rushton turbine. Chem. Eng. Process. 45 (2),99–112.
Joshi, J.B., Pandit, A.B., Sharma, M.M., 1982. Mechanically agitated gas–liquidreactors. Chem. Eng. Sci. 37 (6), 813–844.
Kamil, M., Bushra, A., Ahmad, A., 2001. Minimum agitation speed for liquid–liquid–gas dispersion in mechanically agitated vessels. Chem. Eng. Process. 40(1), 49–57.
Kawase, Y., Shimizu, K., Araki, T., Shimodaira, T., 1997. Hydrodynamics in three-phase stirred tank reactors with non-Newtonian fluids. Ind. Eng. Chem. Res.36, 270–276.
Kramers, H., Baars, G.M., Knoll, W.H., 1953. A comparative study on the rate ofmixing in stirred tanks. Chem. Eng. Sci. 2 (1), 35–42.
Kraume, M., 1992. Mixing times in stirred suspensions. Chem. Eng. Technol. 15,313–318.
Laurenzi, F., Coroneo, M., Montante, G., Paglianti, A., Magelli, F., 2009. Experi-mental and computational analysis of immiscible liquid–liquid dispersions instirred vessels. Chem. Eng. Res. Des. 87 (4A), 507–514.
Lekhal, A., Chaudhari, R.V., Wilhelm, A.M., Delmas, H., 1997. Gas–liquid masstransfer in gas–liquid–liquid dispersions. Chem. Eng. Sci. 52 (21–22),4069–4077.
Lin, W.W., Lee, D.J., 1997. Micromixing effects in aerated stirred tank. Chem. Eng.Sci. 52 (21–22), 3837–3842.
Linek, V., Benes, P., 1976. A study of the mechanism of gas absorption into oil-water emulsions. Chem. Eng. Sci. 31 (11), 1037–1046.
Lu, W.M., Chen, H., 1986. Flooding and critical impeller speed for gas dispersion inaerated turbine-agitated vessels. Chem. Eng. J. 33 (2), 57–62.
Lu, W.M., Ju, S.J., 1987. Local gas holdup, mean liquid velocity and turbulence in anaerated stirred tank using hot-film anemometry. Chem. Eng. J. 35 (1), 9–17.
Mehta, V.D., Sharma, M.M., 1971. Mass transfer in mechanically agitated gas–liquid contactors. Chem. Eng. Sci. 26 (3), 461–479.
Micheletti, M., Nikiforaki, L., Lee, K.C., Yianneskis, M., 2003. Particle concentrationand mixing characteristics of moderate-to-dense solid–liquid suspensions.Ind. Eng. Chem. Res. 42, 6236–6249.
Nere, N.K., Patwardhan, A.W., Joshi, J.B., 2003. Liquid-phase mixing in stirredvessels: turbulent flow regime. Ind. Eng. Chem. Res. 42, 2661–2689.
Nienow, A.W., 1997. On impeller circulation and mixing effectivenss in theturbulent flow regime. Chem. Eng. Sci. 52 (15), 2557–2565.
Nienow, A.W., Wisdom, D.J., Middleton, J.C., 1977. The effect of scale and geometryon flooding, recirculation and power in gassed stirred vessels. Proceedings ofthe 2nd European Conference on Mixing, Paper F1.

D. Cheng et al. / Chemical Engineering Science 75 (2012) 256–266266
Nienow, A.W., Warmoeskerken, M.M.C.G., Smith, J.M., Konno, M., 1985. On theflooding/loading transition and the complete dispersal condition in aeratedvessels agitated by a Rushton turbine. Proceedings of the 5th EuropeanConference on Mixing, pp 143–154.
Paca, J., Ettler, P., Greger, V., 1976. Hydrodynamic behaviour and oxygen transferin a pilot plant fermentor. J. Appl. Chem. Biotechnol. 26, 309–317.
Pandit, A.B., Joshi, J.B., 1983. Mixing in mechanically agitated gas–liquid con-tactors, bubble bolumns and modified bubble columns. Chem. Eng. Sci. 38 (8),1189–1215.
Patwardhan, A.W., Joshi, J.B., 1999. Relation between flow pattern and blending instirred tanks. Ind. Eng. Chem. Res. 38 (8), 3131–3143.
Purwanto, P., Delmas, H., 1995. Gas–liquid–liquid reaction engineering: hydro-formylation of 1-octene using a water soluble rhodium complex catalyst.Catal. Today 24 (1–2), 135–140.
Raghav Rao, K.S.M.S., Joshi, J.B., 1988. Liquid-phase mixing and power consump-tion in mechanically agitated solid–liquid contactors. Chem. Eng. J. 39 (2),111–124.
Rewatkar, V.B., Joshi, J.B., 1991a. The effect of impeller design on liquid phasemixing in mechanically agitated reactors. Chem. Eng. Commun. 102, 1–33.
Rewatkar, V.B., Joshi, J.B., 1991b. Role of sparger design in mechanically agitated gas–liquid reactors. Part II: Liquid phase mixing. Chem. Eng. Technol. 14 (6), 386–393.
Rewatkar, V.B., Raghava Rao, K.S.M.S., Joshi, J.B., 1991. Critical impeller speed forsolid suspension in mechanically agitated three-phase reactors. 1. Exp. Part.Ind. Eng. Chem. Res. 30, 1770–1784.
Rushton, J.H., Bimbinet, J.J., 1968. Hold-up and flooding in air–water mixing. Can.J. Chem. Eng. 46, 16–21.
Rutherford, K., Mahmoudi, S.M.S., Lee, K.C., Yianneskis, M., 1996. The influence ofRushton on the mixing characteristics of stirred vessels. Chem. Eng. Res. Des.74 (3), 369–378.
Svensson, F.J.E., Rasmuson, A., 2004. LDA-measurements in a stirred tank with aliquid–liquid system at high volume percentage dispersed phase. Chem. Eng.Technol. 27 (3), 335–339.
Svensson, F.J.E., Rasmuson, A., 2006. PIV measurements in a liquid–liquid systemat volume percentages up to 10% dispersed phase. Exp. Fluids 41, 917–931.
Takenaka, K., Ciervo, G., Monti, D., Bujalski, W., Etchells, A.W., Nienow, A.W., 2001.Mixing of three-phase systems at high solids content (up to 40% w/w) using
radial and mixed flow impellers. J. Chem. Eng. Jpn. 34 (5), 606–612.Van der Meer, A.B., Beenackers, A., Burghard, R., Mulder, N.H., Fok, J.J., 1992. Gas/
liquid mass transfer in a four-phase stirred fermentor: effects of organic phase
hold-up and surfactant concentration. Chem. Eng. Sci. 47 (9–11), 2369–2374.Van Ede, C.J., Van Houten, R., Beenackers, A., 1995. Enhancement of gas to water
mass transfer rates by a dispersed organic phase. Chem. Eng. Sci. 50 (18),2911–2922.
Wang, T., YU, G.Z., Yong, Y.M., Yang, C., Mao, Z.-S., 2010. Hydrodynamic char-acteristics of dual-impeller configurations in a multiple-phase stirred tank.
Ind. Eng. Chem. Res. 49 (3), 1001–1009.Xu, S.I., Feng, L.F., Gu, X.P., Wang, K., 2000. Mixing time in stirred tank of three-
phase gas–liquid-floating particle systems. J. Chem. Eng. Chin. Univ. 14 (4),
328–333. in Chinese.Yeoh, S.L., Papadakis, G., Yianneskis, M., 2005. Determination of mixing time and
degree of homogeneity in stirred vessels with large eddy simulation. Chem.Eng. Sci. 60, 2293–2302.
Zhao, Y.C., Li, X.Y., Cheng, J.C., Yang, C., Mao, Z.-S., 2011. Experimental study onliquid–liquid macro-mixing in a stirred tank. Ind. Eng. Chem. Res. 50 (10),5952–5958.
Related Documents