Vol.:(0123456789) 1 3 Asian Journal of Civil Engineering (2021) 22:865–876 https://doi.org/10.1007/s42107-021-00351-6 ORIGINAL PAPER Experimental study on fatigue performance of Q420qD high‑performance steel cross joint in complex environment Haigen Cheng 1,2 · Cong Hu 1 · Yong Jiang 3 Received: 17 October 2020 / Accepted: 22 January 2021 / Published online: 4 February 2021 © The Author(s) 2021 Abstract The steel structure under the action of alternating load for a long time is prone to fatigue failure and affects the safety of the engineering structure. For steel structures in complex environments such as corrosive media and fires, the remaining fatigue life is more difficult to predict theoretically. To this end, the article carried out fatigue tests on Q420qD high-performance steel cross joints under three different working conditions, established a 95% survival rate S-N curves, and analyzed the effects of corrosive media and high fire temperatures on its fatigue performance. And refer to the current specifications to evaluate its fatigue performance. The results show that the fatigue performance of the cross joint connection is reduced under the influence of corrosive medium, and the fatigue performance of the cross joint connection is improved under the high temperature of fire. When the number of cycles is more than 200,000 times, the design curves of EN code, GBJ code, and GB code can better predict the fatigue life of cross joints without treatment, only corrosion treatment, and corrosion and fire treatment, and all have sufficient safety reserve. Keywords Q420qD high-performance steel · Cross joint · Corrosive medium · High temperature of fire · Fatigue performance Introduction With the development of steel structure bridges in terms of light weight, high load-bearing capacity and large span in recent years, traditional bridge steel can no longer meet the demand. Q420qD high-performance steel is a new type of steel that China’s independent innovation has the advantages of lower thickness, higher strength, and good ductility. It has been widely used in railway bridges across rivers and lakes and some large highway bridges (Liu et al. 2018). These structures have been exposed to high humidity or high salt spray environment for a long time (Bhandari et al. 2015). Although the steel structure has a paint protection layer on the surface of the steel structure in the early stage of operation, as the service time increases, it is unavoidable to suffer from the influence of corrosive media (Kim et al. 2013). According to reports, about 15% of road steel bridges and 50% of railway steel bridges in Japan are replaced by corrosion (Yamaguchi et al. (2014)). Corrosion will not only reduce the effective cross-sectional area of the steel structure, but also cause stress concentration (Tohidi and Sharifi 2016), affecting the mechanical properties of the steel structure, such as significantly reducing the ultimate stress and fatigue strength (Jia et al. 2019). As one of the most important connection methods of steel bridges, welded joints are more sensitive to defects such as corrosion pits and cracks during the service process after the strength level of the bridge steel is improved (Zhang et al. 2016). During the service period, steel bridges may even be eroded by fire caused by traffic accidents or natural factors (Song et al. 2016; Azhari et al. 2017). Although the exist- ing fire protection technology has been widely used in prac- tice, the heat generated by the fire will still be transferred to the steel. Under the action of high temperature of fire, steel structure is easy to lose strength, but in most cases, steel structure exposed to the outside after the action of high * Cong Hu [email protected] 1 School of Civil Engineering and Architecture, East China Jiaotong University, Nanchang 330013, China 2 National Experimental Teaching Demonstration Center of Civil Engineering, East China Jiaotong University, Nanchang 330013, China 3 China Railway Shanghai Design Institute Group Co., Ltd., Shanghai 200000, China

Welcome message from author
This document is posted to help you gain knowledge. Please leave a comment to let me know what you think about it! Share it to your friends and learn new things together.
Transcript
Vol.:(0123456789)1 3
Asian Journal of Civil Engineering (2021) 22:865–876 https://doi.org/10.1007/s42107-021-00351-6
ORIGINAL PAPER
Experimental study on fatigue performance of Q420qD high‑performance steel cross joint in complex environment
Haigen Cheng1,2 · Cong Hu1 · Yong Jiang3
Received: 17 October 2020 / Accepted: 22 January 2021 / Published online: 4 February 2021 © The Author(s) 2021
AbstractThe steel structure under the action of alternating load for a long time is prone to fatigue failure and affects the safety of the engineering structure. For steel structures in complex environments such as corrosive media and fires, the remaining fatigue life is more difficult to predict theoretically. To this end, the article carried out fatigue tests on Q420qD high-performance steel cross joints under three different working conditions, established a 95% survival rate S−N curves, and analyzed the effects of corrosive media and high fire temperatures on its fatigue performance. And refer to the current specifications to evaluate its fatigue performance. The results show that the fatigue performance of the cross joint connection is reduced under the influence of corrosive medium, and the fatigue performance of the cross joint connection is improved under the high temperature of fire. When the number of cycles is more than 200,000 times, the design curves of EN code, GBJ code, and GB code can better predict the fatigue life of cross joints without treatment, only corrosion treatment, and corrosion and fire treatment, and all have sufficient safety reserve.
Keywords Q420qD high-performance steel · Cross joint · Corrosive medium · High temperature of fire · Fatigue performance
Introduction
With the development of steel structure bridges in terms of light weight, high load-bearing capacity and large span in recent years, traditional bridge steel can no longer meet the demand. Q420qD high-performance steel is a new type of steel that China’s independent innovation has the advantages of lower thickness, higher strength, and good ductility. It has been widely used in railway bridges across rivers and lakes and some large highway bridges (Liu et al. 2018).
These structures have been exposed to high humidity or high salt spray environment for a long time (Bhandari et al. 2015). Although the steel structure has a paint protection
layer on the surface of the steel structure in the early stage of operation, as the service time increases, it is unavoidable to suffer from the influence of corrosive media (Kim et al. 2013). According to reports, about 15% of road steel bridges and 50% of railway steel bridges in Japan are replaced by corrosion (Yamaguchi et al. (2014)). Corrosion will not only reduce the effective cross-sectional area of the steel structure, but also cause stress concentration (Tohidi and Sharifi 2016), affecting the mechanical properties of the steel structure, such as significantly reducing the ultimate stress and fatigue strength (Jia et al. 2019). As one of the most important connection methods of steel bridges, welded joints are more sensitive to defects such as corrosion pits and cracks during the service process after the strength level of the bridge steel is improved (Zhang et al. 2016).
During the service period, steel bridges may even be eroded by fire caused by traffic accidents or natural factors (Song et al. 2016; Azhari et al. 2017). Although the exist-ing fire protection technology has been widely used in prac-tice, the heat generated by the fire will still be transferred to the steel. Under the action of high temperature of fire, steel structure is easy to lose strength, but in most cases, steel structure exposed to the outside after the action of high
* Cong Hu [email protected]
1 School of Civil Engineering and Architecture, East China Jiaotong University, Nanchang 330013, China
2 National Experimental Teaching Demonstration Center of Civil Engineering, East China Jiaotong University, Nanchang 330013, China
3 China Railway Shanghai Design Institute Group Co., Ltd., Shanghai 200000, China

866 Asian Journal of Civil Engineering (2021) 22:865–876
1 3
temperature of fire can still maintain most of its bearing capacity after cooling (Radu et al. 2018,2019; Zhu and Li 2017). Welding residual stress generated during the forma-tion of welded joints, tensile residual stress is harmful to the fatigue process, and compressive residual stress can prolong the fatigue life (Wang et al. 2018,2020a; Cui et al. 2018). Under the action of high temperature of fire, the welded joint of steel bridge is an extremely weak part, but after the high temperature of fire, part of the residual strain in the welded joint will be released due to the effect of plastic deformation, which reduces the residual welding stress and affects the fatigue performance of the structure. Make an impact (Jiang et al. 2017; Wang et al. 2020b).
In the past few decades, scholars have mostly focused their research on the effect of a single environmental fac-tor on the fatigue performance of welded structures, such as corrosion (corrosion time (Yang et al. 2016; Garbatov et al. 2014; Liu et al. 2021), corrosive medium (Thierry et al. 2016; Kang et al. 2011; Giorgetti et al. 2019; Klinesmith et al. 2007), corrosion conditions (Zhao et al. 2018; Gkat-zogiannis et al. 2019; Huang et al. 2014)); temperature (high temperature (Daryan and Yahyai 2009; Zhang et al. 2020; Langschwager et al. 2017; Azari-Dodaran and Ahmadi 2019), room temperature (Zong et al. 2017; Luo et al. 2019; Su et al. 2019), and low temperature (Li et al. 2018; Zhang et al. 2018; Walters et al. 2016)). In actual engineering, the service environment of steel bridges is extremely com-plex, and the influence of a single environmental factor on its structural fatigue performance can no longer meet the needs of engineering design and evaluation. Therefore, the research on the fatigue performance of welded joints after considering the coupling effect of the two environmental factors of corrosive medium and fire and high temperature is of great significance to the assessment of the remaining fatigue life of the entire steel bridge.
This paper reports the fatigue life results of Q420qD high-performance steel cross joints under three working conditions: no treatment, only corrosion treatment, and corrosion and fire treatment, and determines the effects of corrosive media and high temperature on the fatigue strength and fracture characteristics of cross joints.
Specimen design
The fatigue test object is the cross joint specimen of trans-verse fillet weld. The base metal is 16 mm Q420qD steel plate. The chemical composition, mechanical properties, and delivery status of the steel plate meet the relevant requirements of the Chinese high-strength low-alloy struc-tural steels (GB/T 1591-2018), and full thickness sampling is adopted. According to the Chinese metallic materi-als–fatigue testing–axial force-controlled method code
(GB/T 3075-2008) and the actual test conditions, the specific size of the specimen is determined, as shown in Fig. 1. The model of welding rod is E55, and its mechanical properties are shown in Table 1. Manual arc welding is adopted. The welding voltage is 24 V, the welding current is 150 A, and the welding speed is about 5 mm/s. The weld quality meets the relevant requirements in the Chinese code for welding of steel structures (GB 50661-2011). The weld leg size is 6 mm and the calculated weld length is 50 mm. The chemical com-position of steel and welding materials is shown in Table 2.
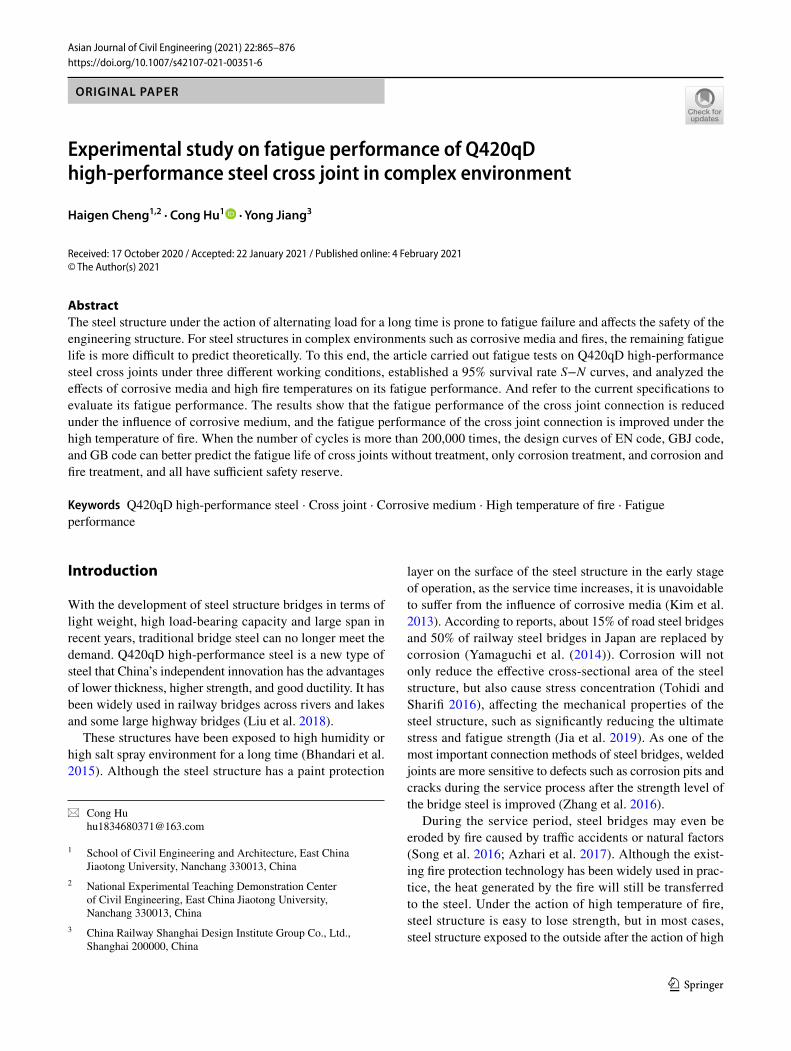
According to the Chinese metallic materials–tensile test-ing–Part 1: method of the test at room temperature code (GB/T 208.1–2010), three base metal specimens were made for axial tensile test (see Fig. 2 for dimensions), and the cor-responding mechanical property parameters of Q420qD are measured in Table 3.
Finite‑element analysis of fatigue performance of specimen
Based on ANSYS 15.0 finite-element software, a three-dimensional finite-element model of cross joints without corrosion pits and containing corrosion pits is established. SOLID45 solid elements are used, and the fillet weld area elements are all divided by 1 mm mesh. The weld zone has the same material parameters as Q420qD high-performance steel: elastic modulus E is 2.064 × 10⁵ Mpa and Poisson’s ratio ν is 0.3. Load and boundary conditions: one end is consolidated, and the other end is subjected to a tensile stress surface load of 30 MPa.
It can be seen from the stress distribution of the specimen in Fig. 3 that, when the stress distribution of the clamping part is not considered, the maximum equivalent stress of the cross joint specimens without corrosion pits and corrosion pits are located in the weld toe area. In the later fatigue test, most of the cross joint specimens were broken at the weld toe, indicating that the finite-element calculation results can be used as the basis for judging the weak position of
Fig. 1 Size of cross joint test piece (unit: mm)
867Asian Journal of Civil Engineering (2021) 22:865–876
1 3
the specimen, and the rationality of the specimen design is ensured.
Test piece fatigue performance test
Sample preparation
Corrosion test
The cross joint specimens with corrosion pits were obtained by accelerated corrosion test (Xu 2017). Test corrosive envi-ronment: 50 g/L ± 5 g/L NaCl solution was used to simulate the marine atmospheric environment, and NaOH solution was added to control the pH value of corrosion chamber in the range of 6.5–7.2. The connection and reaction principle of test equipment are shown in Fig. 4 and Table 4. Pretreatment of corrosion test: in addition to fillet weld area, other parts of the surface are coated with epoxy resin seal to prevent corrosion. In addition, due to the exothermic process and long electrolysis time in the corrosion test, the epoxy resin layer at the corner
Table 1 Mechanical properties of E55 electrode deposited metal
Electrode Tensile strength Rm
/
MPa
Yield strength Rel
/
MPa
Elongation after fracture A∕%
− 30 °C impact energyAKV
/
J
E55 ≥ 550 ≥ 460 ≥ 17 ≥ 27
Table 2 Q420qD steel and E55 electrode chemical composition
Material category Content of each component /%
C Si Mn P S Ni Cr Nb V
Q420qD 0.18 0.345 1.48 0.024 0.012 0.0085 0.022 0.005 0.07E55 ≤0.10 ≤0.80 ≤1.00 ≤0.025 ≤0.015 ≤0.50 ≤0.30 ≤0.20 ≤0.10
Fig. 2 Geometric dimension of cross joint specimen (unit: mm)
Table 3 Results of material property test
Specimen number Yield strength fy/
MPa
Ultimate strength fu/
MPa
Elastic modulus E∕MPa
Q420qD-1 425.803 636.446 2.069 × 10⁵
Q420qD-2 423.535 633.281 2.058 × 10⁵
Q420qD-3 425.172 635.567 2.064 × 10⁵
Average value 424.837 635.098 2.064 × 10⁵
Fig. 3 Stress distribution of specimens

868 Asian Journal of Civil Engineering (2021) 22:865–876
1 3
of the cross joint is easy to be hardened and damaged, result-ing in corrosion, which affects the accuracy of the corrosion results. Therefore, it is considered to wrap a layer of electrical tape outside the epoxy resin anti-corrosion coating to achieve the secondary sealing effect.
Pitting corrosion is easy to occur in steel bridges under marine atmospheric environment. Corrosion depth Da is used to evaluate pitting damage, which is expressed as:
In reference (Cao (2005)), the values of ocean atmospheric corrosion depth parameters of many countries in the world are given, and the mean value is taken as the parameter in the power function, i.e., � = 0.062, n = 0.862 . According to Eq. (1), the average corrosion pit depth of welded joint in marine atmospheric environment for 10 years is 0.45 mm. Then, the relationship between current and time (see Eq. (4)) is obtained using the formula for calculating the average cor-rosion pit depth (see Eq. (2)) and Faraday’s Law (see Eq. (3)). During the energized accelerated corrosion process, the current I = 3A is always controlled. When T = 1.92h , the cross joint specimen with the average corrosion pit depth D = 0.45mm can be obtained:
(1)Da = �tn.
D = Δm/
S0�
where D is the average depth of corrosion pit, mm ; m is the net loss of the test piece before and after the corrosion test, g(after the corrosion test, the corrosion product on the test piece surface is removed with baking soda and white vine-gar, wiped clean with absolute ethanol, dried, and weighed); S0 is the effective cross-sectional area of the butt weld joint, mm2 ; � is the weld material density, g
/
cm3 ; I is the corro-sion current, A ; T is the time required for corrosion, s ; M is the mole of matter, g∕mol ; F is the Faraday constant, F = 9.62 × 10⁴C∕mol ; and n is the number of electrons. Here, given that the anode is Fe , the electrons are lost to Fe2+ , so n = 2.
Fire high‑temperature test
Ten specimens are taken from the corrosion test and placed in the intelligent box-type high-temperature resistance fur-nace. After setting the target temperature, the temperature will be raised. In the heating section, the points are taken from the ISO-834 standard temperature rise curve (Swit-zerland. 2019) [see Eq. (5)] for segmented heating. Under the action of high temperature, the yield strength, elastic modulus, and other mechanical parameters of steel will be greatly reduced with the increase of temperature. When the temperature reaches 300 °C, the stress–strain curve of the steel without fireproof layer has no obvious yield step; when the temperature reaches 350 °C, the strength decreases to 2/3 of the original; when the temperature reaches 500 °C, the strength is 1/2 of the original (Li 2019), so when the temperature reaches 600 °C, continue to maintain the tem-perature for 1 h and then stop heating (Funderburk 1998). At this time, if the specimen is directly taken out to contact
Δm = MIT∕Fn
IT = DS0�Fn/
M,
Fig. 4 Equipment connection
Table 4 Reaction principle of electrified accelerated corrosion test
Note: Given that Fe(OH)2 is highly unstable, it is easily oxidized,
and the final precipitate turns from white to yellowish-green and then quickly turns into reddish-brown. The reaction formula as 4Fe(OH)
2+ O
2+ 2H
2O = 4Fe(OH)
3.
Classification Chemical equation
Anode Fe − 2e− = Fe2+
Cathode 2H2O + 2e− = H2 ↑ +2OH−
The total reaction of electrolysis Fe + 2H2O = H2 ↑ +Fe(OH)2
869Asian Journal of Civil Engineering (2021) 22:865–876
1 3
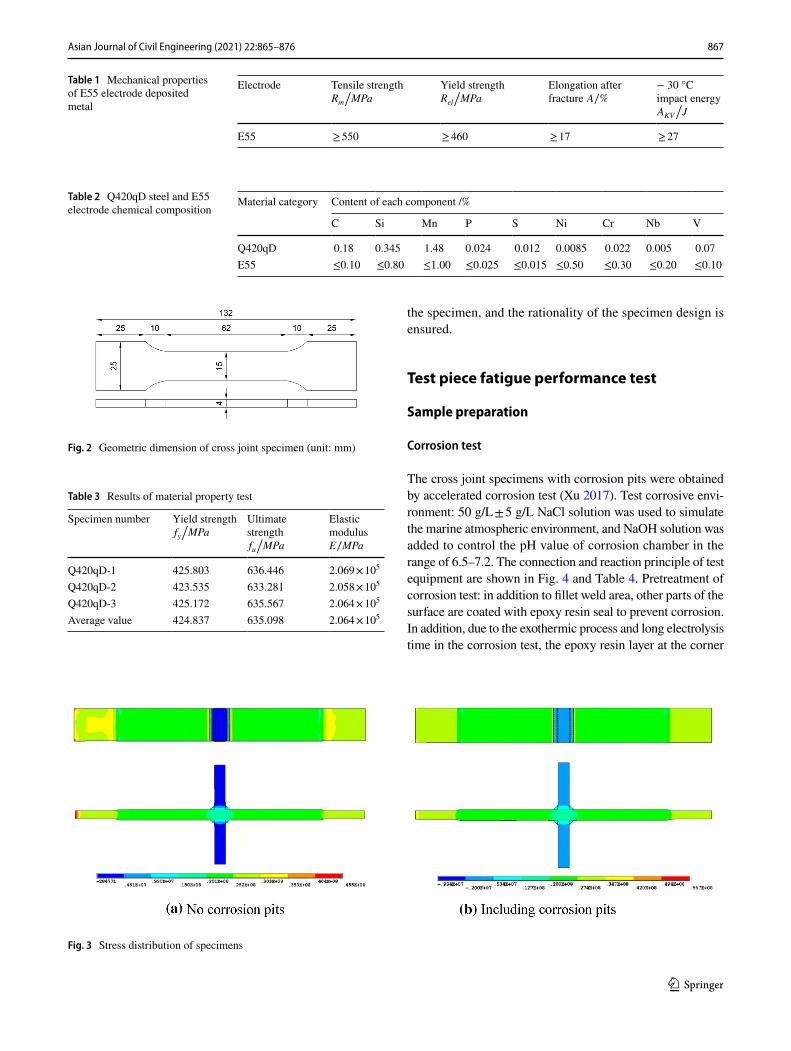
with the external environment for cooling, there will be a large temperature gradient inside the specimen and new additional stress will be generated. Therefore, the cooling process is naturally reduced to room temperature with the resistance furnace. After cooling, the appearance of cross joint is shown in Fig. 5:
where Tt is the ambient temperature at the time of fire devel-opment to t , °C; Tt0 is the ambient temperature at the time of fire occurrence, Tt0 = 20◦C is taken in this test; and t is the duration of the fire, min.
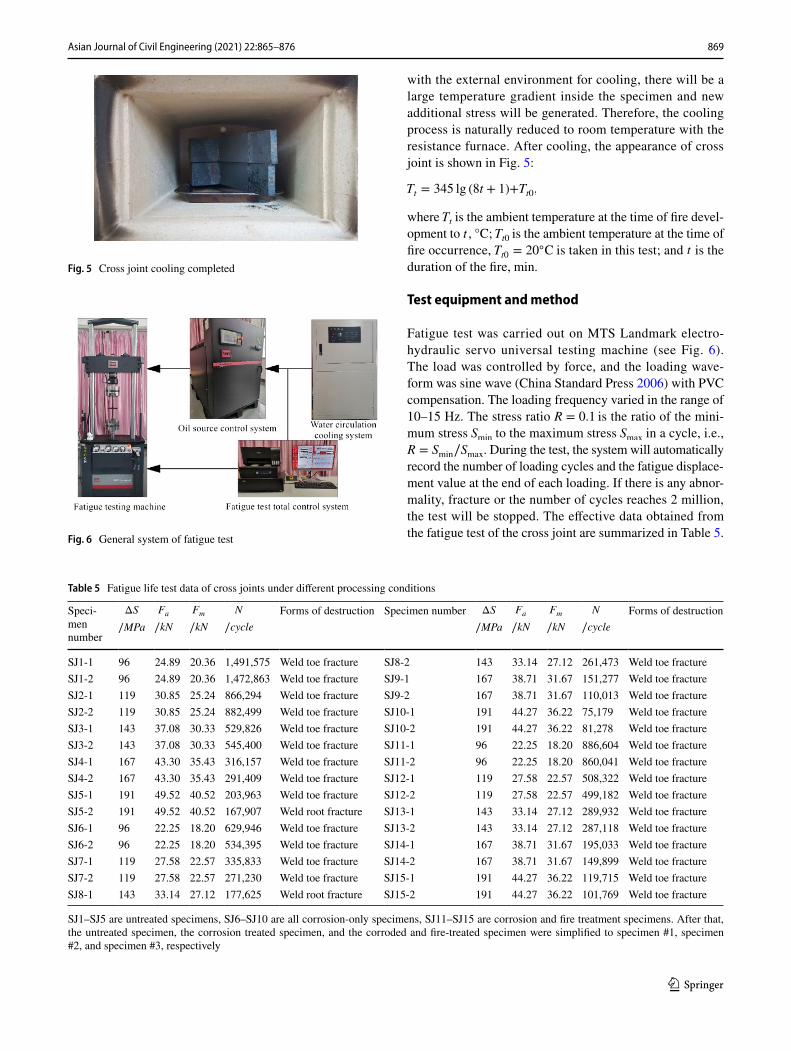
Test equipment and method
Fatigue test was carried out on MTS Landmark electro-hydraulic servo universal testing machine (see Fig. 6). The load was controlled by force, and the loading wave-form was sine wave (China Standard Press 2006) with PVC compensation. The loading frequency varied in the range of 10–15 Hz. The stress ratio R = 0.1 is the ratio of the mini-mum stress Smin to the maximum stress Smax in a cycle, i.e., R = Smin∕Smax . During the test, the system will automatically record the number of loading cycles and the fatigue displace-ment value at the end of each loading. If there is any abnor-mality, fracture or the number of cycles reaches 2 million, the test will be stopped. The effective data obtained from the fatigue test of the cross joint are summarized in Table 5.
Tt = 345 lg (8t + 1)+Tt0,
Fig. 5 Cross joint cooling completed
Fig. 6 General system of fatigue test
Table 5 Fatigue life test data of cross joints under different processing conditions
SJ1–SJ5 are untreated specimens, SJ6–SJ10 are all corrosion-only specimens, SJ11–SJ15 are corrosion and fire treatment specimens. After that, the untreated specimen, the corrosion treated specimen, and the corroded and fire-treated specimen were simplified to specimen #1, specimen #2, and specimen #3, respectively
Speci-men number
ΔS
∕MPa
Fa
∕kN
Fm
∕kN
N
∕cycle
Forms of destruction Specimen number ΔS
∕MPa
Fa
∕kN
Fm
∕kN
N
∕cycle
Forms of destruction
SJ1-1 96 24.89 20.36 1,491,575 Weld toe fracture SJ8-2 143 33.14 27.12 261,473 Weld toe fractureSJ1-2 96 24.89 20.36 1,472,863 Weld toe fracture SJ9-1 167 38.71 31.67 151,277 Weld toe fractureSJ2-1 119 30.85 25.24 866,294 Weld toe fracture SJ9-2 167 38.71 31.67 110,013 Weld toe fractureSJ2-2 119 30.85 25.24 882,499 Weld toe fracture SJ10-1 191 44.27 36.22 75,179 Weld toe fractureSJ3-1 143 37.08 30.33 529,826 Weld toe fracture SJ10-2 191 44.27 36.22 81,278 Weld toe fractureSJ3-2 143 37.08 30.33 545,400 Weld toe fracture SJ11-1 96 22.25 18.20 886,604 Weld toe fractureSJ4-1 167 43.30 35.43 316,157 Weld toe fracture SJ11-2 96 22.25 18.20 860,041 Weld toe fractureSJ4-2 167 43.30 35.43 291,409 Weld toe fracture SJ12-1 119 27.58 22.57 508,322 Weld toe fractureSJ5-1 191 49.52 40.52 203,963 Weld toe fracture SJ12-2 119 27.58 22.57 499,182 Weld toe fractureSJ5-2 191 49.52 40.52 167,907 Weld root fracture SJ13-1 143 33.14 27.12 289,932 Weld toe fractureSJ6-1 96 22.25 18.20 629,946 Weld toe fracture SJ13-2 143 33.14 27.12 287,118 Weld toe fractureSJ6-2 96 22.25 18.20 534,395 Weld toe fracture SJ14-1 167 38.71 31.67 195,033 Weld toe fractureSJ7-1 119 27.58 22.57 335,833 Weld toe fracture SJ14-2 167 38.71 31.67 149,899 Weld toe fractureSJ7-2 119 27.58 22.57 271,230 Weld toe fracture SJ15-1 191 44.27 36.22 119,715 Weld toe fractureSJ8-1 143 33.14 27.12 177,625 Weld root fracture SJ15-2 191 44.27 36.22 101,769 Weld toe fracture

870 Asian Journal of Civil Engineering (2021) 22:865–876
1 3
Test results and analysis
S−Ncurve
S−N curve is commonly used in engineering in the form of power function, namely:
where a and m are parameters to be determined by the fitting.According to the fatigue test data in Table 5, the least
square method is used to fit the fatigue life N and stress amplitude S of fillet weld under different treatment condi-tions. According to IIW specification (Hobbacher 2016), when N < 107 , the negative inverse slope of S−N curve is taken as m = 3 . Therefore, taking the fitting curve m = 3 , the logarithmic linear expression of cross joint S−N curve under different treatment conditions is obtained. In addition, the S−N curve with 50% survival rate is obtained from the experimental data, and the logarithmic linear expression of corresponding S−N curve with the 95% survival rate can be obtained by subtracting 2 times of standard deviation of lgN(0.339, 0.321, and 0.340) (Fricke 2012), see Table 6.
The S−N reference curve of welded joint in air is avail-able in steel structure codes of various countries, but the S−N reference curve of welded joint under sea water corro-sion or fire high temperature is not included. Although the S−N reference curve of free corrosion of welded joints in air or sea water is provided in the rules of classification socie-ties of various countries, the S−N reference curve of welded
(6)C = SmN.
(7)Take the logarithm of both sides to get ∶ m lg S + lgN = lgC.
(8)After finishing, the deformation is as follows ∶ lgN = a − m lg S.
joints after high-temperature fire is not specified. Therefore, the S−N curves of welded joints after corrosion and fire treatment are evaluated based on the steel structure design codes of various countries and classification societies. See Table 7 for S−N reference curve of cross joint in various specifications under different treatment types.
For the convenience of comparison, the S−N curve of specimen #1, specimen #2, and specimen #3, the fitting curve under the 95% survival rate, and the S−N fatigue curve of national codes are plotted in Fig. 7, and the 2 million cycle fatigue limit value of fillet weld under corresponding conditions is calculated, as shown in Table 8.
It can be seen from Fig. 7 and Table 8 that:
1. The test fatigue limit values of specimen #2 and speci-men #3 are 26.83% and 17.21% lower than that of speci-men #1, respectively. Corrosion will increase the stress concentration on the surface of the test piece, resulting in a decrease in the fatigue performance of the cross joint; when the fire temperature is about 600 °C, the high temperature of the fire will increase the fatigue perfor-mance of the cross joint (Wang et al. 2020c).
2. For specimen #1, the fatigue limit value under the 95% survival rate is 53.09 MPa, which is 11.38% lower than that calculated by ABS code and 6.18% higher than that calculated by DNV code. The fatigue limit value of specimen #1 is 25.47%, 11.58%, and 41.68% higher than the theoretical design value of GB code, EN code, and IIW code, which is equivalent to the theoretical design value of ANSI code. Comparatively speaking, IIW code obviously underestimates the fatigue of cross joint Working life. Compared with ANSI code, EN code design curve can better predict its fatigue life and has enough safety reserve. However, when the number of cycles is less than 200,000, more fatigue test data are needed.
3. For specimen #2, the fatigue limit value is higher than the theoretical value calculated by the classification soci-eties of various countries. The main reason is that the corrosion time of the welded joint in the environment is not considered in the calculation formula of the national codes. The fatigue limit value of specimen #2 is 11.35%
Table 6 Logarithmic linear expression of S−N curve
Type Regression of test data The 95% survival rate
Specimen #1 lgN = 12.153 − 3 lgΔS lgN = 11.476 − 3 lgΔS
Specimen #2 lgN = 11.746 − 3 lgΔS lgN = 11.104 − 3 lgΔS
Specimen #3 lgN = 11.907 − 3 lgΔS lgN = 11.227 − 3 lgΔS
Table 7 S−N reference curve of cross joint in national codes under different treatment types
Type Standard Formula Standard Formula
Atmospheric corrosion GB code (2017)[Δ�] =
(
0.72×10¹²
N
)1∕3 ANSI code (2010)FSR
=
(
14.4×10¹¹
nSR
)0.333
EN code (2005) lgN = 12.010 − 3 lgΔ� ABS code (2013) N= 4.30 × 10¹¹ × S−3
IIW code (2016) lgN = 11.699 − 3 lgΔ� DNV code (2014) lgN = 11.398 − 3 lgΔ�
Seawater corrosion ABS code N= 1.43 × 10¹¹ × S−3 DNV code lgN = 10.921 − 3 lgΔ�
CCS code (2013) lgN = 11.155 − 3 lgΔ� GJB code (1999) lgN = 11.261 − 3 lgΔ�

871Asian Journal of Civil Engineering (2021) 22:865–876
1 3
lower than the theoretical design value of GJB code and 15.09% higher than the theoretical design value of DNV code under the 95% survival rate, which is equivalent to the theoretical calculation value of ABS code and CCS code.
4. For specimen #3, the fatigue limit value is 73.90 MPa, which is not different from the theoretical calculation value of GB code, and the fatigue life of specimen #3 is predicted by the design curve of GB code, which has sufficient safety reserve. The fitting curve of specimen
#3 under the 95% survival rate is in good agreement with the design curve of GJB code.
Fatigue fracture analysis
Macro analysis
It can be seen from Fig. 8 that the fracture morphology has typical fatigue fracture characteristics, and the instantane-ous section is rough and tear like. Before instantaneous break, the section is smooth and flat. The fatigue fracture
(a) (b) (c)
Fig. 7 S−N curve comparison
Table 8 Comparison of fatigue limit values
Type Test fitting/specification Fatigue limit Test fitting/specification Fatigue limit
Specimen #1 Experimental fitting 89.26 MPa The 95% survival rate 53.09 MPaGB code 71.14 MPa ANSI code 89.63 MPaEN code 80.00 MPa ABS code 59.91 MPaIIW code 63.00 MPa DNV code 50.00 MPa
Specimen #2 Experimental fitting 65.31 MPa The 95% survival rate 39.90 MPaABS code 41.51 MPa DNV code 34.67 MPaCCS code 41.51 MPa GJB code 45.01 MPa
Specimen #3 Experimental fitting 73.90 MPa The 95% survival rate 43.85 MPa
Fig. 8 Macroscopic morphology of fatigue fracture surface of cross joint

872 Asian Journal of Civil Engineering (2021) 22:865–876
1 3
is divided into three parts: crack source area, crack growth area, and fracture area. As the initial point of fatigue fail-ure, the crack source area is smooth and fan-shaped, and radiates slowly to the surrounding area, which is relatively smooth. The fracture surface of crack propagation zone is smooth and smooth with convex wavy lines. According to the spacing of corrugated lines, it is obvious that the crack growth velocity near the crack source is faster than that far away from the crack source. The surface of the crack instantaneous fracture zone is rough and uneven, and there is a certain inclination angle with the main section. With the crack propagation, the effective section of the
member is weakened. When the stress reaches the ultimate strength, the cross joint will break instantaneously.
Micro analysis
To observe the micro-failure mode of the fatigue fracture, the fracture surface was scanned by HITACHI SU8010 cold field-emission scanning electron microscope. The micro-fracture morphology is shown in Fig. 9. After high magnifi-cation, it is found that the cross-section of the crack source area is relatively flat and smooth, and the crack extends from the core to the surrounding, and there may be multiple crack sources at the same time. There are many arc fatigue bands
Fig. 9 Fatigue fracture morphology of cross joint

873Asian Journal of Civil Engineering (2021) 22:865–876
1 3
protruding forward in the crack growth zone. Due to differ-ent crack sources or different crack growth rates, secondary cracks can be observed in some fractures, and the spacing of fatigue bands at the same fracture increases with the increase of crack growth rate. There are many round or ellipse dim-ples with different sizes in the instantaneous fracture zone, and some dimples also contain inclusions or particles, which indicates that the material fracture is ductile fracture. Moreo-ver, the existence of dimples indicates that the material is not easy to slip in the process of growth, and the rapid growth stage is not enough, which accounts for a small proportion of the fatigue life. Affected by corrosion, the fracture of the specimen contains multiple crack sources (Liu et al. 2021). After the high temperature of the fire, secondary cracks at a certain angle to the fracture can be seen at the fracture of the specimen. The number of dimples is reduced, but the size of the dimples is relatively larger (Zhang et al. 2020).
Fatigue damage analysis
Figure 10 shows the fatigue displacement curve of the spec-imen SJ4-2, where δ is the displacement variation of the specimen, and n and N represent the number of cycles and fatigue life of the specimen, respectively. It can be seen that the displacement change of the specimen can be divided into two stages. The first stage is the steady-state crack growth stage, and the overall displacement change is small in this stage, which is basically in a stable state, accounting for about 90% of the whole fatigue life. The second stage is the stage of unstable crack growth, and the displacement growth rate is obviously accelerated. With the gradual propagation of the crack, the effective bearing section of the specimen decreases rapidly. Finally, the cross-section stress under the
external cyclic load is greater than the ultimate strength of the material, resulting in instantaneous fracture. The propor-tion of the instantaneous fracture stage in the fatigue life is very small, indicating that the unstable propagation stage of the crack is not sufficient.
In damage mechanics, as an internal variable, damage is used to represent the deterioration of metal materials. The constitutive equation and evolution equation of metal materi-als are constituted by the internal variable and load param-eters to describe the deterioration process of metal materials (Li 1992). Therefore, the damage can be used to predict the residual life of metal materials, and to replace or disman-tle the metal structure with low life, so as to ensure that the metal structure can be used safely during the operation period. For high cycle fatigue, assuming that the damage variable remains constant in a stress cycle, i.e., incremental linear, the cumulative fatigue damage Df caused by fatigue fringes of fatigue fringes of dimple dimple secondary cracks in a stress cycle is (Lou 1991):
where B and � are material constants, which can be deter-mined by the fatigue test results;Nf is the fatigue life.
The fitting result of fatigue test shows that �= 2 . Accord-ing to Eq. (9), the change curve of cumulative damage with cycle ratio is drawn, as shown in Fig. 11. It can be seen that with the increase of N
/
Nf , the degree of fatigue damage
(9)Df = 1 −
(
1 −N
Nf
)1∕(�+2)
(10)Nf =
(� + 1)(
S�+1max − S
�+1
min
)
−1
2B(� + 2),
0.0 0.1 0.2 0.3 0.4 0.5 0.6 0.7 0.8 0.9 1.0 1.1-0.4
0.0
0.4
0.8
1.2
I II1.6
2.0
δ/mm
n/N
Fig. 10 Fracture morphology of cross joint
0.0 0.1 0.2 0.3 0.4 0.5 0.6 0.7 0.8 0.9 1.0 1.1-0.1
0.1
0.3
0.5
0.7
0.9
1.1
D
N/Nf
Fig. 11 Fatigue displacement curve
874 Asian Journal of Civil Engineering (2021) 22:865–876
1 3
is also increasing, and the increase rate of damage is also increasing continuously, which is consistent with the phe-nomenon that the fatigue band spacing of micro-fracture increases gradually under high-power microscope. When 0< N
/
Nf < 0.9 is the stage of crack propagation, the D value before fracture of cross joint is about 0.45, and the cumula-tive damage is large. When 0.9 ≤ N
/
Nf <1.0 , the increasing rate of D value of cross joint is obviously accelerated, which is the instantaneous breaking stage. This is consistent with the displacement change characteristics of fatigue displace-ment curve in Fig. 10 at the second stage, which shows that the theoretical results are consistent with the experimental results.
Conclusion
This paper conducted fatigue test research under three working conditions, deeply studied the influence of cor-rosive media and high temperature of fire on the fatigue performance of Q420qD high-performance steel cross joints, and reached the following conclusions:
1. The fatigue limit value of the cross joint is reduced after being affected by corrosion, and its fatigue limit value is increased after being subjected to the 600 ℃ high tem-perature of fire.
2. For the cross joint specimen, the fatigue life without treatment can be well predicted using the design curve of EN code, and there is enough safety reserve; The fit-ting curve of 95% survival rate in corrosion treatment is not different from that in ABS code and CCS code; The fatigue life of corrosion and fire treatment can be esti-mated by the design curves of GB code safely, and the fitting curve under 95% survival rate is in good agree-ment with the design curves of GJB code.
3. Corrosion will increase the source of fatigue cracks. After the 600 °C high temperature of fire, the relative size and number of dimples in the instantaneous failure zone are larger. The fatigue damage analysis results are basically consistent with the change law of the fatigue displacement curve, and conform to the microscopic morphology characteristics of the fatigue fracture.
Acknowledgements The authors are incredibly grateful to the Mechan-ics Laboratory of East China Jiaotong University for providing a fatigue testing machine.
Author contributions Conceptualization, HGC; investigation and stress test, CH; methodology, CH; data curation, YJ; writing-original draft preparation, CH; writing-review and editing, CH, HGC, and YJ.
Funding This research was funded by the National Natural Science Foundation of China (Grant No. 51368018, 51968024).
Compliance with ethical standards
Conflict of interest The authors declare no conflict of interest.
Open Access This article is licensed under a Creative Commons Attri-bution 4.0 International License, which permits use, sharing, adapta-tion, distribution and reproduction in any medium or format, as long as you give appropriate credit to the original author(s) and the source, provide a link to the Creative Commons licence, and indicate if changes were made. The images or other third party material in this article are included in the article’s Creative Commons licence, unless indicated otherwise in a credit line to the material. If material is not included in the article’s Creative Commons licence and your intended use is not permitted by statutory regulation or exceeds the permitted use, you will need to obtain permission directly from the copyright holder. To view a copy of this licence, visit http://creat iveco mmons .org/licen ses/by/4.0/.
References
ABS 115 NOTICE 1–2013. (2013). Commentary on the guide for the fatigue assessment of offshore structures. Houston: ABS Plaza.
ANSI, AISC 360–10. (2010). Specification for structural steel build-ings. Chicago: American Institute of Steel Constrction.
Azari-Dodaran, N., & Ahmadi, H. (2019). Structural behavior of right-angle two-planar tubular TT-joints subjected to axial loadings at fire-induced elevated temperatures. Fire Safety Journal, 108, 102841–102849.
Azhari, F., Heidarpour, A., Zhao, X. L., Hutchinsonbet, R., & C. . (2017). Post-fire mechanical response of ultra-high strength (Grade 1200) steel under high temperatures: Linking thermal sta-bility and microstructure. Thin-Walled Structures, 119, 114–125.
Bhandari, J., Khan, F., Abbassi, R., Garaniya, V., & Ojeda, R. (2015). Modelling of pitting corrosion in marine and offshore steel struc-tures—a technical review. Journal of Loss Prevention in the Pro-cess Industries, 37, 39–62.
Cao, C. N. (2005). Natural environmental corrosion of materials in China. Beijing: Chemical Industry Press.
China Classification Society. (2013). Guidelines for fatigue strength assessment of offshore engineering structures. Beijing: People’s Communications Press.
Cui, C., Zhang, Q. H., Bao, Y., Kang, J. P., & Bu, Y. Z. (2018). Fatigue performance and evaluation of welded joints in steel truss bridges. Journal of Constructional Steel Research, 148, 450–456.
Daryan, A. S., & Yahyai, M. (2009). Behaviour of welded top-seat angle connections exposed to fire. Fire Safety Journal, 44(4), 603–611.
DNVGL-RP-0005. (2014). Fatigue design of offshore steel structures. Norway: DNV.
EN 1993-1-9. (2005). Eurocode 3:design of steel structures part 1–9: fatigue. Brussels: European Committee for Standardization.
Fricke, W. (2012). IIW Recommendations for the fatigue assessment of welded structures by notch stress analysis. Cambridge: Woodhead Publishing.
Funderburk, R. S. (1998). Posted heat treatment. Welding. Innovation, 15(2), 1–2.
Garbatov, Y., Soares, C. G., & Parunov, J. (2014). Fatigue strength experiments of corroded small scale steel specimens[J]. Interna-tional Journal of Fatigue, 59(03), 137–144.

875Asian Journal of Civil Engineering (2021) 22:865–876
1 3
GB/T 20120.1-2006. (2006). Corrosion of metals and alloys-corrosion fatigue testing-Part 1: cycles to failure testing. Beijing: China Standard Press.
GB50017–2017. (2017). Code for design of steel structure. Beijing: China Planning Press.
Giorgetti, V., Santos, E. A., Marcomini, J. B., & Sordi, V. L. (2019). Stress corrosion cracking and fatigue crack growth of an API 5L X70 welded joint in an ethanol environment. International Jour-nal of Pressure Vessels & Piping, 169, 223–229.
GJB, Z 119–99. (1999). Method for structural design and strength calculation of naval surface ships. Beijing: General Equipment Department of PLA.
Gkatzogiannis, S., Weinert, J., Engelhardt, I., Knoedela, P., & Ummen-hofera, T. (2019). Correlation of laboratory and real marine cor-rosion for the investigation of corrosion fatigue behaviour of steel components. International Journal of Fatigue, 126, 90–102.
Hobbacher, A. (2016). Recommendations for Fatigue Design of Welded Joints and Components. New York: Welding Research Council New York,WRC-Bulletin 520.
Huang, W., Garbatov, Y., & Soares, C. G. (2014). Fatigue reliability of a web frame subjected to random non-uniform corrosion wastage. Structural Safety, 48, 51–62.
ISO 834-2-2019. (2019). Fire-resistance tests—elements of building construction. Switzerland: ISO.
Jia, Z. Y., Yang, Y., He, Z., Ma, H. B., & Ji, F. (2019). Mechanical test study on corroded marine high performance steel under cyclic loading. Applied Ocean Research, 93, 101942.
Jiang, J., Chiew, S. P., Lee, C. K., & Tiong, P. L. Y. (2017). A numeri-cal study on residual stress of high strength steel box column. Journal of constructional steel research, 128, 440–450.
Kang, D., Lee, J., & Kim, T. (2011). Corrosion fatigue crack propa-gation in a heat affected zone of high-performance steel in an underwater sea environment. Engineering Failure Analysis, 18(2), 557–563.
Kim, I., Lee, M., Ahn, J., & Kainuma, S. (2013). Experimental evalu-ation of shear buckling behaviors and strength of locally corroded web. Journal of constructional steel research, 83, 75–89.
Klinesmith, D. E., McCuen, R. H., & Albrecht, P. (2007). Effect of environmental conditions on corrosion rates. Journal of Materials in Civil Engineering, 19(2), 121–129.
Langschwager, K., Rudolph, J., Scholz, A., & Oechsner, M. (2017). High temperature fatigue of welded joints-experimental investi-gation and local analysis of butt welded flat and cruciform speci-mens. Journal of Pressure Vessel Technology, 139, 41408.
Li, B. Y. (2019). Similarity theory research for the fire testing of reduced scale steel structure. Beijing: China Academy of Build-ing Research.
Li, H. (1992). Fundamentals of damage mechanics. Jinan: Shandong science and Technology Press.
Li, Z., Zhang, D. C., Wu, H., Huang, F. H., Hong, W., & Zang, X. S. (2018). Fatigue properties of welded Q420 high strength steel at room and low temperatures. Construction and Building Materi-als, 189, 955–966.
Liu, B. X., Gao, C. R., Zheng, W. C., Gao, X. H., Zhu, C. L., & Li, S. J. (2018). Development of Q420qD bridge steel with high tough-ness. China Metallurgy, 28(2), 67–72.
Liu, X. H., Xiao, L. F., Cai, C. S., Zhang, J., & Wang, L. (2021). Fatigue properties investigation of corroded high-performance steel specimens. Journal of Materials in Civil Engineering, 33(1), 4020410.
Lou, Z. W. (1991). Fundamentals of damage mechanics. Chengdu: Xi’an Jiaotong University Press.
Luo, P. J., Zhang, Q. H., Bao, Y., & Bu, Y. Z. (2019). Fatigue perfor-mance of welded joint between thickened-edge U-rib and deck in orthotropic steel deck. Engineering Structures, 181, 699–710.
Radu, D., Glanu, T., & Sedmak, S. (2018). Structural integrity of butt welded connection after fire exposure. Procedia Structural Integ-rity, 13, 1082–1087.
Radu, D., Glanu, T., & Sedmak, S. (2019). Butt welded joints assess-ment after fire exposure. Engineering Failure Analysis, 106, 104144.
Song, Q. Y., Heidarpour, A., Zhao, X. L., & Han, L. H. (2016). Post-earthquake fire behavior of welded steel I-beam to hollow column connections: an experimental investigation. Thin-Walled Struc-tures, 98, 143–153.
Su, H., Wang, J., & Du, J. (2019). Experimental and numerical study of fatigue behavior of bridge weathering steel Q345qDNH. Journal of Constructional Steel Research, 161, 86–97.
Thierry, D., Vucko, F., Luckeneder, G., Weber, B., Dosdat, L., Bschorr, T., & Rother, K. (2016). Fatigue behavior of spot-welded joints in air and under corrosive environments. Welding in the World, 60(6), 1211–1229.
Tohidi, S., & Sharifi, Y. (2016). Load-carrying capacity of locally cor-roded steel plate girder ends using artificial neural network. Thin Walled Structures, 100, 48–61.
Walters, C. L., Alvaro, A., & Maljaars, J. (2016). The effect of low temperatures on the fatigue crack growth of S460 structural steel. International Journal of Fatigue, 82(1), 110–118.
Wang, D. P., Hu, D. J., Deng, C. Y., Wu, S. P., & Gao, Z. W. (2020a). Effect of heat treatment combined with ultrasonic impact on fatigue property of Q345B steel welded joint. Transactions of the China Welding Institution, 41(04), 6–11.
Wang, W. D., Jiang, Y., Hu, C., Cheng, H. G., & Xie, L. (2020b). Numerical analysis of butt weld fatigue performance in complex environment. Highway, 65(05), 155–159.
Wang, W. Y., Zhang, J., & Qin, S. Q. (2018). Analysis on residual stress in welded steel sections in fire //[C] The 16th academic exchange conference and teaching seminar of structural stability and fatigue branch of china steel structure association. Qingdao, China: Institute of Structural Stability and Fatigue, China Steel Construction Society.
Wang, W. Y., Zhang, J., & Yang, Z. L. (2020c). Experimental study on residual stress in high strength Q690 welded steel sections after high temperature exposure. Journal of Building Structure, 41(10), 86–93.
Xu, P. (2017). Meso experimental study on corrosion expansion of reinforced concrete under electrified, dry wet and salt spray con-ditions. Shenzhen: Shenzhen University.
Yamaguchi, E., Akagi, T., & Tsuji, H. (2014). Influence of corrosion on load-carrying capacities of steel I-section main-girder end and steel end cross-girder. International Journal of Steel Structures, 14(4), 831–841.
Yang, S., Yang, H. Q., Liu, G., Huang, Y., & Wang, L. D. (2016). Approach for fatigue damage assessment of welded structure considering coupling effect between stress and corrosion. Inter-national Journal of Fatigue, 88, 88–95.
Zhang, C. T., Jin, H. L., & Zhu, L. (2020). Experimental study on fatigue properties of Q345 steel after natural cooling at high tem-perature. Journal of Building Structure, 41(10), 78–85.
Zhang, D. C., Li, Z., Wu, H. Y., & Huang, F. H. (2018). Experimen-tal study on fatigue behavior of Q420 high-strength steel at low temperatures. Journal of Constructional Steel Research, 145, 116–127.
Zhang, X., Liu, H., Guo, Z. H., Wang, F. H., Yang, J. W., & Yong, Q. L. (2016). Performance control of Q420qE high strength bridge steel joint. Electric Welding Machine, 46(9), 1–6.
Zhao, T. L., Liu, Z. Y., Du, C. W., Sun, M. H., & Li, X. G. (2018). Effects of cathodic polarization on corrosion fatigue life of E690 steel in simulated seawater. International Journal of Fatigue, 110, 105–114.

876 Asian Journal of Civil Engineering (2021) 22:865–876
1 3
Zhu, M. C., & Li, G. Q. (2017). Behavior of beam-to-column welded connections in steel structures after fire. Procedia Engineering, 210, 551–556.
Zong, L., Shi, G., Wang, Y. Q., Li, Z. X., & Ding, Y. (2017). Experi-mental and numerical investigation on fatigue performance of non-load-carrying fillet welded joints. Journal of Constructional Steel Research, 130, 193–201.
Publisher’s Note Springer Nature remains neutral with regard to jurisdictional claims in published maps and institutional affiliations.
Related Documents