Experimental Study on Edmonton’s Storm Geyser Formation Mechanism and Mitigation Measures By Lujia Liu A thesis submitted in partial fulfillment of the requirements for the degree of Master of Science in Water Resources Engineering Department of Civil and Environmental Engineering University of Alberta © Lujia Liu, 2018

Welcome message from author
This document is posted to help you gain knowledge. Please leave a comment to let me know what you think about it! Share it to your friends and learn new things together.
Transcript
Experimental Study on Edmonton’s Storm Geyser Formation
Mechanism and Mitigation Measures
By
Lujia Liu
A thesis submitted in partial fulfillment of the requirements for the degree of
Master of Science
in
Water Resources Engineering
Department of Civil and Environmental Engineering
University of Alberta
© Lujia Liu, 2018
ii
Abstract
Uncontrolled air movement and release in drainage systems can lead to geyser events,
which are defined as the air-water mixture explosively jetting out of manholes. As geysers
are always explosive in nature, its occurrence can cause public safety concerns and
property damages. Due to the complexity of air-water two-phase flow, the understanding
of geyser occurrences is still inadequate, and retrofitting methods are still controversial for
field application. This study aims at revealing the mechanism of geyser events and
assessing potential geyser mitigation methods that are applicable in the field by conducting
laboratory experiments.
To address the geyser occurring in the manhole at the intersection of Gateway Boulevard
and 30th Ave., Edmonton, Alberta, a conceptual and simplified scale model of roughly
1:20 was constructed in the T. Blench Hydraulic Lab at the University of Alberta. Eight
series of experiments were designed based on the possible combinations of flow conditions
in the upstream and downstream pipes. Among them, three series focused on the
mechanism of geyser formation, and the other five focused on the potential geyser
mitigation methods.
The experiments on the geyser mechanism show that geyser can be triggered by two ways:
the rapidly filling flow and the air release from the entrapped air pocket. After a suddenly
iii
further opening of a ball valve, a rapidly filling surge occurs in the upstream pipe and
propagates downstream. If the water level in the downstream pipe is high, this rapidly
filling flow can fill the chamber quickly and then shoot out of riser to form a single-shoot
geyser. When the entire system is pressurized with an entrapped air pocket in the upstream
pipe with a stagnant water column in the riser, a suddenly further opening of a valve will
induces two phase of geyser events: the first phase is caused by the transient pressure, with
one to two geysers, and the second is caused by the air releasing from the air pocket and
the geyser event, which could include several independent geysers and last much longer
than the first phase.
For the possible geyser mitigation methods, a completely sealed riser top, an orifice plate
installed at the riser top, in the middle of riser span and at the riser bottom, a water
recirculation chamber (WRC) and an enlarged riser were tested and assessed. A much slow
opening of the ball valve was also investigated. The results show that the orifice plate (OP)
with a small orifice can greatly decrease the pressure peak in the system and the water
amount of water out of the riser, but it will cause most of the air being transported
downstream. Also, the water-hammer pressure is observed in cases with an orifice size of
0.2 times of the riser diameter. The water recirculation chamber (WRC) has a minor effect

iv
on the pressure in the system and either no geyser is observed or few drops of water come
out from the riser. The enlarged riser increases the water amount out of the riser.
Findings of this research could extend the knowledge from two aspects: (1) the details of
geyser occurrence, and (2) possible mitigation methods on geyser events.
v
Acknowledgments
First I would like to express my great appreciation to my supervisor Dr. David Z. Zhu, for
all the continuous support of my MSc study and research, and for his motivation and
guidance over the past two years. I wish to thank Epcor Utilities INC. and Natural Sciences
and Engineering Research Council of Canada (NSERC) for providing funding for this
research. I would like to express a special thanks to Perry Fedun, for technical support in
the lab. I would like to express special thanks to all the members in our group, especially
Jiachun Liu, Yu Qian and Dr. Weiyun Shao, for all your help throughout the research.
My deepest thanks go to my family, my boyfriend and all the friends, who listened and
offered help whenever I needed, it’s a pleasure to have all of you with me.
vi
Contents
Abstract .............................................................................................................................. ii
Acknowledgments ............................................................................................................. v
List of Tables ................................................................................................................... viii
List of Figures ................................................................................................................... ix
1. Introduction ................................................................................................................... 1
1.1 Research Background ........................................................................................ 1
1.2 Objective of the Study ....................................................................................... 2
1.3 Scope of the Study and the Structure of the Thesis ........................................ 2
2 Literature Review .......................................................................................................... 4
2.1 Geyser Formation .............................................................................................. 4
2.2 Geyser Mitigation ............................................................................................... 7
3. Experimental Setup and Methods ............................................................................. 10
3.1 Experimental Setup ......................................................................................... 10
3.2 Measurement Apparatus ................................................................................. 11
3.3 Experimental Program .................................................................................... 12
3.4 Experimental Procedure .................................................................................. 19
4. Testing Results for Geyser Mechanism ..................................................................... 21
4.1 Downstream Open Channel Flow (Series A) ................................................. 21
4.1.1 Observation of phenomena .......................................................................................... 21
4.1.2 Summary for Series A .................................................................................................. 24
4.2 Downstream Full Pipe Flow (Series B) .......................................................... 25
4.2.1 Observation of phenomena .......................................................................................... 26
4.2.2 Summary for Series B .................................................................................................. 29
vii
4.3 Downstream Full Pipe Flow with Submerged Chamber (Series C) ............ 31
4.3.1 Observation of phenomena .......................................................................................... 32
4.3.2 Summary for Series C .................................................................................................. 39
4.4 Discussion on Geyser Mechanism ................................................................... 41
4.5 Testing of the Impact of Valve Opening Time on Geyser Formation .......... 44
4.6 Spilled Water Volume ...................................................................................... 47
5. Experimental Results on Geyser Mitigation Measures ........................................... 49
5.1. Results and Discussions on Mitigation Methods Applied to Series B ........ 49
5.1.1 Orifice plate applied to Case B3 (Series D) ................................................................. 49
5.1.2 Adding WRC on top of the riser for Series B (H1) ...................................................... 70
5.1.3 Using enlarged riser for Series B (F1-F6) .................................................................... 72
5.2. Results and Discussions on Mitigation Methods Applied to Series C ........ 74
5.2.1. Orifice plate applied to Case C4 (Series E) ................................................................ 74
5.2.2 Adding WRC on top of the riser for Series C (H2) ...................................................... 96
5.2.3 Using enlarged riser for Series C (G1-G6) ................................................................ 100
5.3 Summary ......................................................................................................... 102
5.3.1 Summary on retrofitting for Series B ........................................................................ 102
5.3.2 Summary on retrofitting for series C ......................................................................... 104
6. Conclusions ................................................................................................................ 107
6.1 Summary of the Present Study ..................................................................... 107
6.2 Recommendations for Future Works ........................................................... 110
References ....................................................................................................................... 111
viii
List of Tables
Table 3.1 Experimental design for Series A ..................................................................... 13
Table 3.2 Experimental design for Series B ..................................................................... 14
Table 3.3 Experimental design for Series C ..................................................................... 15
Table 3.4 Experimental design for adding orifice plate to Case B3 ................................. 16
Table 3.5 Experimental design for adding orifice plates to Case C4 and C6 ................... 17
Table 3.6 Experimental design for using enlarged riser to cases chosen from Series B .. 17
Table 3.7 Experimental design for using enlarged riser to cases chosen from Series C .. 18
Table 3.8 Adding WRC on top of riser for Case B3 and C6 ............................................ 19
Table 4.1 Summary of maximum geyser heights and peak pressures for downstream full
pipe flow (Series B) .......................................................................................................... 43
Table 4.2 Summary of maximum geyser heights and peak pressures for downstream full
pipe flow with submerged chamber (Series C) ................................................................. 44
Table 4.3 Measured spilled water amounts ...................................................................... 48
Table 5.1 Geyser heights and peak pressures summary for Series B and Series F ........ 103
Table 5.2 Geyser heights and peak pressures summary for Series C and Series G ........ 106
ix
List of Figures
Figure 2.1 Schematic diagram of mitigation of geysers by adding a horizontal section to
the vertical riser (Wright et al., 2009) ................................................................................. 8
Figure 2.2 Schematic diagram of mitigation of geysers by adding a larger diameter section
to the vertical riser (Wright et al., 2009) ............................................................................. 8
Figure 3.1 Photos and sketch of the experimental setup ...................................................11
Figure 3.2 Initial flow conditions in the downstream and the chamber/riser for downstream
open channel flow (Series A) ............................................................................................ 13
Figure 3.3 Initial conditions in the downstream and chamber/riser for downstream full pipe
flow (Series B) .................................................................................................................. 14
Figure3.4 Initial conditions in the downstream and chamber/riser for downstream full pipe
flow with submerged chamber (Series C) ......................................................................... 15
Figure 3.5 The locations for OP: (a) on the top, (b) in the middle and (c) at the bottom of
riser. ................................................................................................................................... 16
Figure 3.6 Configuration of 100 mm diameter riser ........................................................ 18
Figure 3.7 Configuration of the WRC .............................................................................. 19
Figure 4.1 Process of water movement when the inflow rate was changed from 20 to 100
L/s with downstream open channel flow (Case A2) ......................................................... 22
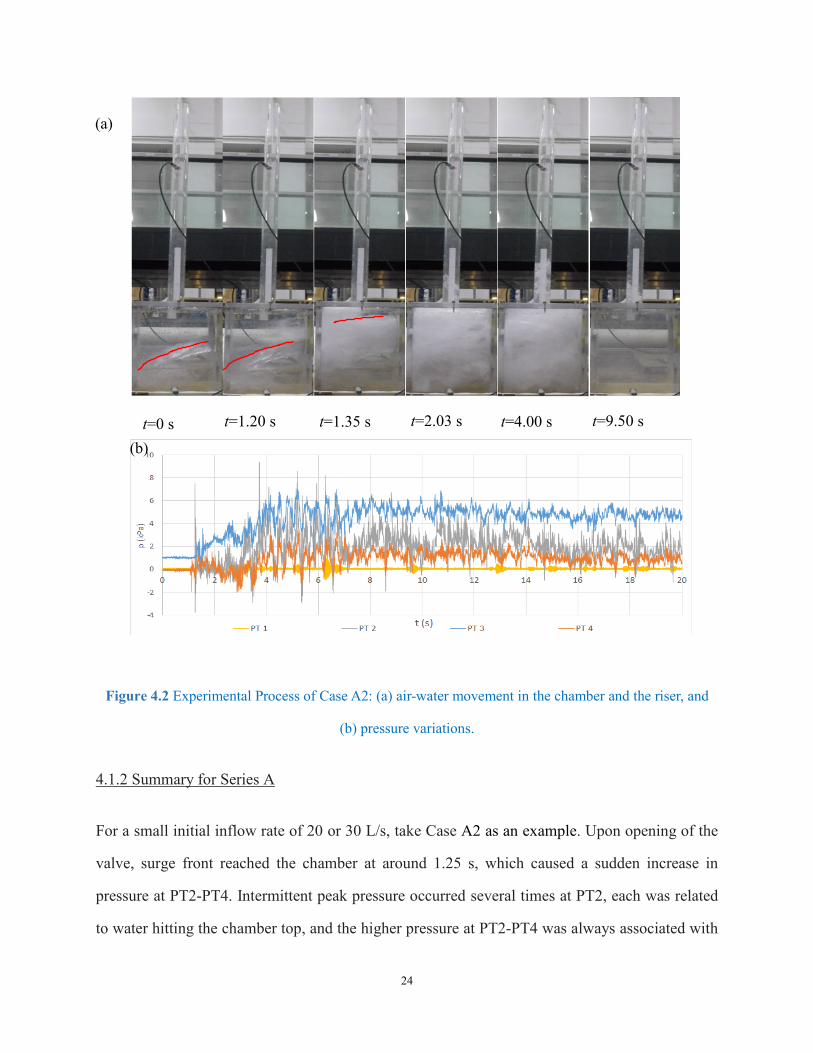
Figure 4.2 Experimental Process of Case A2: (a) air-water movement in the chamber and
the riser, and (b) pressure variations. ................................................................................ 24
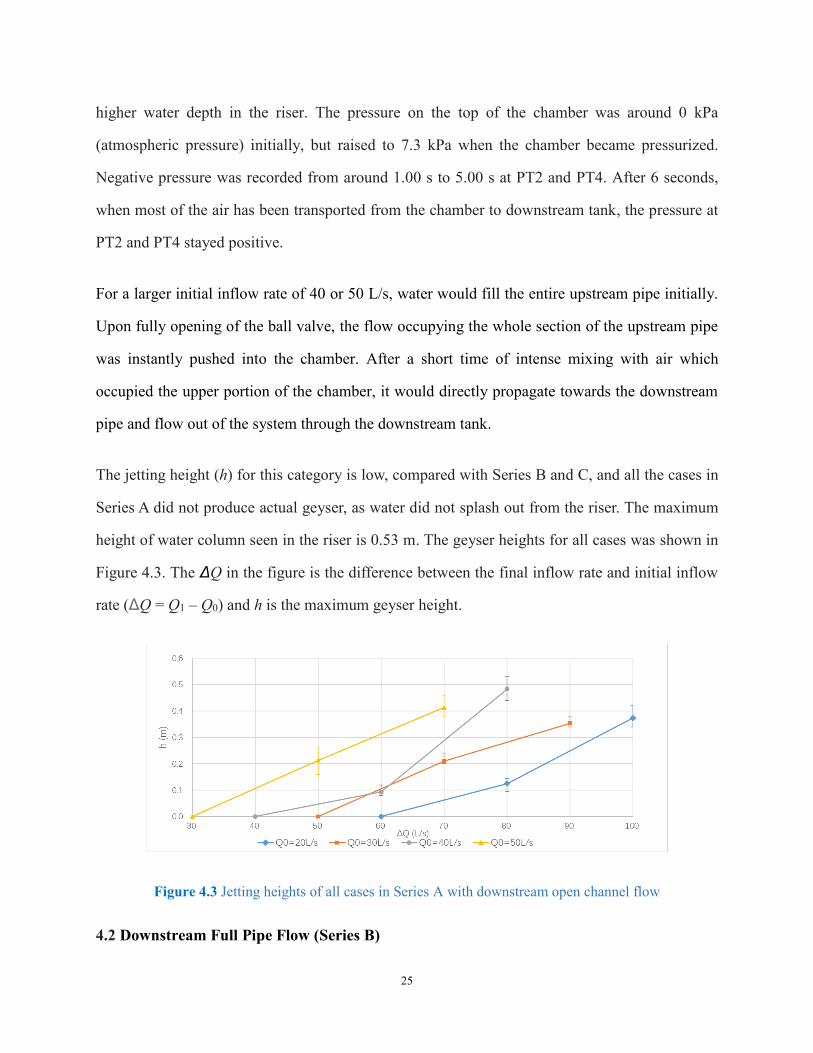
Figure 4.3 Jetting heights of all cases in Series A with downstream open channel flow . 25
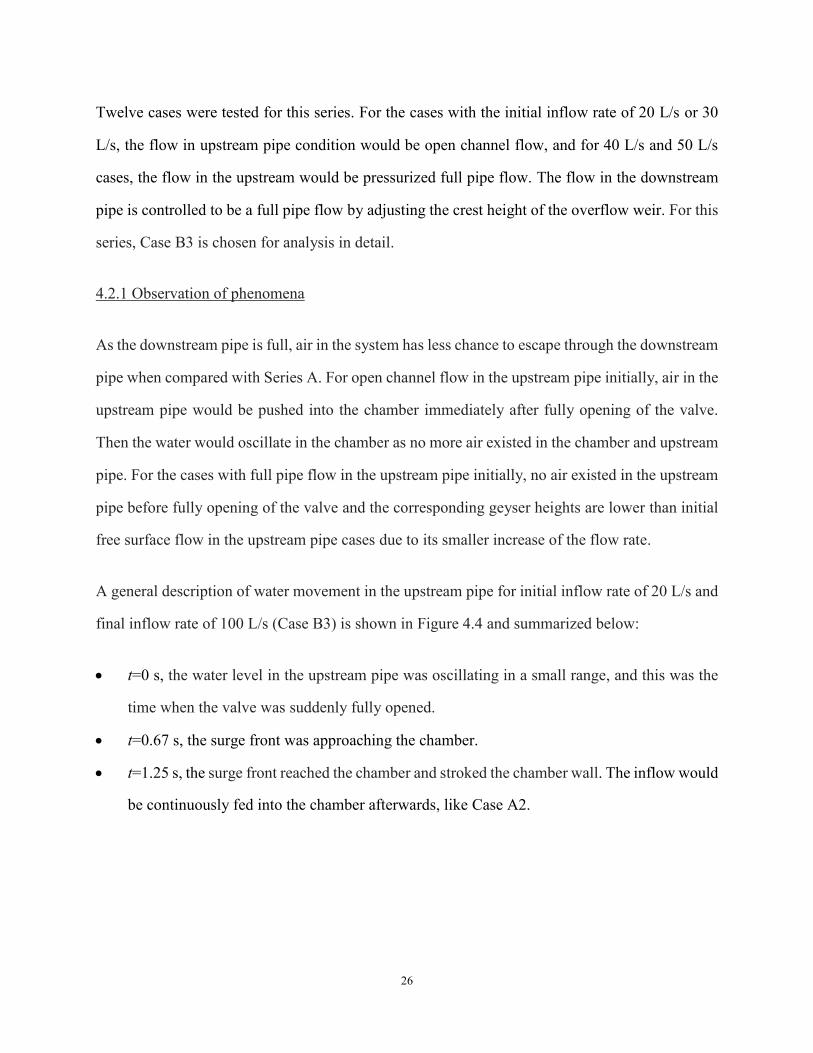
Figure 4.4 The surge front propagation in the upstream pipe when downstream was full
x
pipe flow and the flow rate is changed from 20 to 100 L/s (Case B3) ............................. 27
Figure 4.5 Experimental Process of Case B3: (a) air-water movement in the chamber and
the riser, and (b) pressure variation. .................................................................................. 29
Figure 4.6 Pressure process of Case B9 ........................................................................... 30
Figure 4.7 Jetting height vs. ΔQ for downstream full pipe flow ...................................... 31
Figure 4.8 Relationship between peak pressures and maximum geyser heights for
downstream full pipe flow (Series B). .............................................................................. 31
Figure 4.9 Air pocket propagation in the upstream pipe when Q0=20 L/s and Q1=40 L/s,
hr=0.1 m (Case C4) ........................................................................................................... 34
Figure 4.10 Experimental process of Case C4: (a) air-water movement in the chamber and
the riser, and (b) pressure variation. .................................................................................. 38
Figure 4.11 The relationship among water front speeds, heights of water surface and
pressure process for Case C4. ........................................................................................... 39
Figure 4.12 Normalized volume of the initial air pocket vs. normalized initial discharge.
........................................................................................................................................... 40
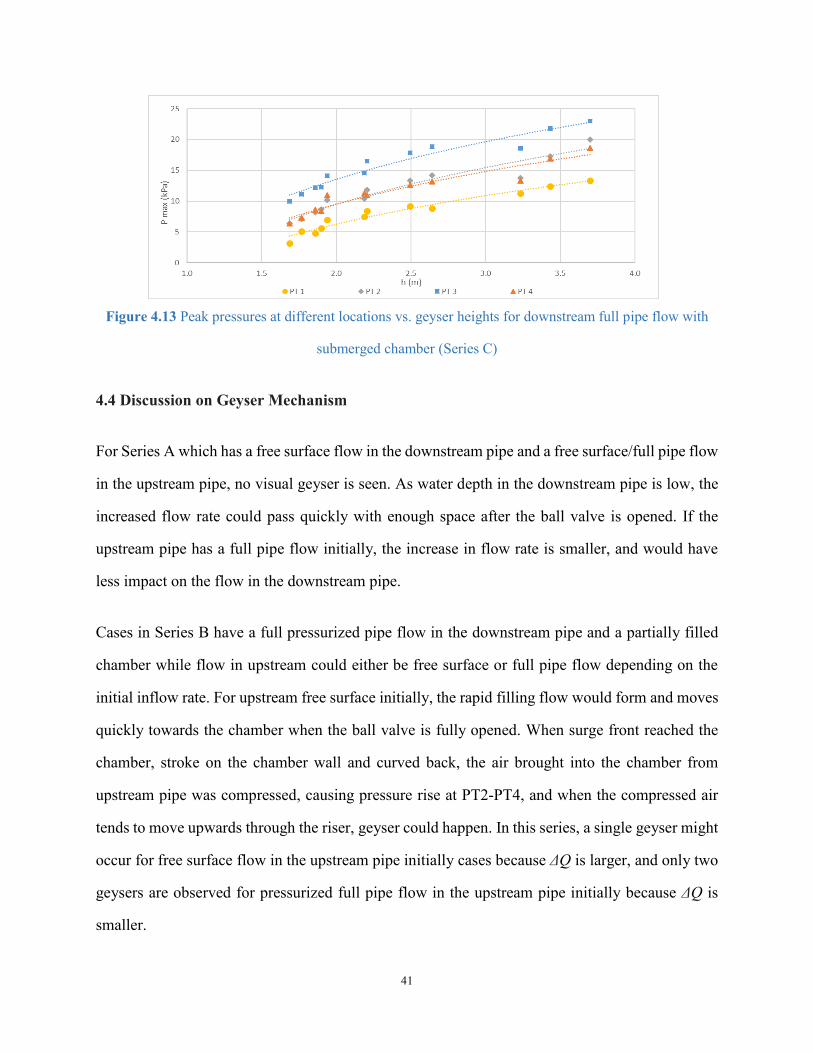
Figure 4.13 Peak pressures at different locations vs. geyser heights for downstream full
pipe flow with submerged chamber (Series C) ................................................................. 41
Figure 4.14 Pressure variations for Case B3 under different valve opening times: (a) t=0.2
s, (b) t=10 s, (c) t=20 s. ..................................................................................................... 45
Figure 4.15 Pressure variation for Case C6 under different valve opening times: (a) t=0.20
s, (b) t=20.00 s, (c) t=35.00 s. ........................................................................................... 47
Figure 5.1 Experimental process of Case D1-1: (a) air-water movement in the chamber
and riser, and ..................................................................................................................... 51
Figure 5.2 Experimental Process of Case D1-2: (a) air-water movement in the chamber
xi
and riser, and ..................................................................................................................... 53
Figure 5.3 Experimental process of Case D1-3: (a) air-water movement in the chamber
and riser, and ..................................................................................................................... 54
Figure 5.4 Experimental process of Case D1-4: (a) air-water movement in the chamber
and riser, and ..................................................................................................................... 56
Figure 5.5 Experimental process of Case D2-1: (a) air-water movement in the chamber
and riser, and ..................................................................................................................... 59
Figure 5.6 Experimental process of Case D2-2: (a) air-water movement in the chamber
and riser, and ..................................................................................................................... 60
Figure 5.7 Experimental process of Case D2-3: (a) air-water movement in the chamber
and riser, and ..................................................................................................................... 62
Figure 5.8 Experimental process of Case D3-1: (a) air-water movement in the chamber
and riser, and ..................................................................................................................... 65
Figure 5.9 Experimental process of D3-2: (a) air-water movement in the chamber and riser,
and ..................................................................................................................................... 66
Figure 5.10 Experimental process of Case D3-3: (a) air-water movement in the chamber
and riser, and ..................................................................................................................... 68
Figure 5.11 The impact of orifice plate on the geyser height for Case B3 and orifice plate
applied to B3 ..................................................................................................................... 69
Figure 5.12 The relationship between orifice plate size and peak pressure at different
locations for Case B3 and orifice plates applied to B3: (a) orifice on the top of the riser, (b)
orifice on the middle of the riser, (c) orifice at the bottom of the riser ............................. 70
Figure 5.13 Experimental process of Case H1: (a) air-water movement in the chamber and
riser, and ............................................................................................................................ 72
Figure 5.14 Experimental process of F3: (a) air-water movement in the chamber and riser,

xii
and ..................................................................................................................................... 73
Figure 5.15 Experimental process of E1-1: (a) air-water movement in the chamber and
riser, and ............................................................................................................................ 76
Figure 5.16 Experimental process of E1-3: (a) air-water movement in the chamber and
riser, and ............................................................................................................................ 78
Figure 5.17 Experimental process of Case E1-5: (a) air-water movement in the chamber
and riser, and ..................................................................................................................... 80
Figure 5.18 Experimental process of Case E1-7: (a) air-water movement in the chamber
and riser, and ..................................................................................................................... 83
Figure 5.19 Experimental process of Case E2-1: (a) air-water movement in the chamber
and riser, and ..................................................................................................................... 85
Figure 5.20 Experimental process of Case E2-3: (a) air-water movement in the chamber
and riser, and ..................................................................................................................... 87
Figure 5.21 Experimental process of Case E2-5: (a) air-water movement in the chamber
and riser, and ..................................................................................................................... 89
Figure 5.22 Experimental process of Case E3-1: (a) air-water movement in the chamber
and riser, and ..................................................................................................................... 91
Figure 5.23 Experimental process of Case E3-3: (a) air-water movement in the chamber
and riser, and ..................................................................................................................... 93
Figure 5.24 Experimental process of Case E3-5: (a) air-water movement in the chamber
and riser, and ..................................................................................................................... 94
Figure 5.25 The impact of orifice plate on the geyser height for Case B3 and orifice plate
applied to B3 ..................................................................................................................... 95
Figure 5.26 The relationship between orifice plate size and peak pressure at different
locations for Case C4 and orifice plates applied to C4: (a) orifice on the top of the riser, (b)
xiii
orifice on the middle of the riser, (c) orifice at the bottom of the riser ............................. 96
Figure 5.27 Experimental process of Case H2: (a) air-water movement in the chamber and
riser, and ............................................................................................................................ 99
Figure 5.28 Experimental process of Case G4: (a) air-water movement in the chamber and
riser, and .......................................................................................................................... 101
Figure 5.29 Peak pressures vs. maximum geyser heights with original and larger size riser
......................................................................................................................................... 106
1
1. Introduction
1.1 Research Background
As urbanization and land development progresses, pervious surfaces like grassland, forests and
wetlands have been changed to impervious surfaces like the concrete ground. Accompanied by
increasing extreme precipitation resulted from climate change (Climate Central, 2017), the surface
runoff increases, which requires a higher flow capacity of drainage systems. Therefore, with the
increasing of the storm runoffs and the same flow capacity of storm sewer system as before,
geysers, which are defined as explosive release of water or air-water mixture through vertical
shafts connected to a horizontal pipeline, are more likely to happen than before.
During the storm, stormwater enters into the sewer systems rapidly, which could induce a
transition from the initial free surface flow in pipe into the pressurized flow, and large air pocket
might be entrapped simultaneously. On the other hand, downstream sudden blockage, pump failure
or rapid filling of inflow, all are linked with sudden pressure increase within the system. When the
pressurized flow moves within the system along with air, it tends to find a way out of the pipe
system through the locations of geometry change such as shafts. When air-water mixture reaches
the bottom of the shaft, it would move upwards in the shaft due to buoyancy, thus causing geyser
event. To date, most of studies on geyser are done by experiments and few experimental study
have been used for validation of numerical simulation.
Geyser events have been reported around the world, which may cause human injuries and property
damages, and lead to safety concerns. Wright et al. (2011) reported one field observation on geyser
occurrence which happened at a manhole in a stormwater tunnel in Minneapolis in July 1997,
causing a geyser that is at least 20 m above the land surface. In July 2011, a geyser event occurred
in Montreal, Canada, during which a car was lifted up by the strong impact force of the rising
water (YouTube, 2011).
2
Edmonton, Alberta has also been suffering from geyser problem in recent years, one particular
geyser location is at the intersection of Gateway Boulevard and 30th Ave., where three geyser
events were recorded from 2013 to 2016 since the manhole was built in 2012. In order to
understand the mechanism of geyser occurrence in this particular manhole and come up with
retrofitting methods to tackle this issue in Edmonton, the experimental study becomes essential.
1.2 Objective of the Study
This thesis aims at understanding the mechanism of geyser occurrence, and the pressure process
that corresponds to it. Various series of experiments are designed with a focus on the air-water
movement in the upstream pipe, air-water interaction in the chamber and in the riser, and the
formation of the geyser. Based on the result analysis of the experimental on the geyser mechanism,
three potential mitigation methods have been proposed and tested to investigate the change of the
geyser process once the mitigation methods have been applied.
1.3 Scope of the Study and the Structure of the Thesis
This study contains eight series of physical experiments under different boundary conditions to
measure the process of pressure in the pipe, which would help to analyze the mechanism of the
geyser. The geyser can be caused by the rapid change of flow rate and the air-pocket release.
Therefore, two groups of experiments were designed for geyser mechanism. The first group
includes two series of experiments, where the inflow rate in the upstream pipe is changed rapidly
while the downstream pipe is non-full or full controlled by the downstream overflow weir. The
second group includes one series of experiments, where inflow rate in the upstream pipe is changed
rapidly while downstream outflow capacity is limited by a partially closed tailgate.
This thesis is divided into six chapters. A brief description of each chapter is summarized below:
Chapter one introduces the background, the objective and the scope of this study.
3
Chapter two reviews literatures on geyser formation and mitigation.
Chapter three describes the experimental setup and the experimental design.
Chapter four presents the experimental results on the mechanism of geyser occurrence.
Chapter five discusses the effectiveness of different mitigation methods on geyser.
Chapter six contains the conclusions and the suggested topics for future study.

4
2 Literature Review
2.1 Geyser Formation
An early study by Guo and Song (1991) on the hydrodynamics of a dropshaft-drift tube system
under transient conditions found out that water column oscillation and inflow disturbance could
cause the water in a dropshaft overshooting the ground surface, resulting in geysers. They also
concluded that the geyser was caused by the impact force of rising water in the dropshaft. Their
study was the earliest on the formation of geyser by the rapid filling regime, but only the water
phase was considered. Zhou et al. (2002 a) did lab experiments to test different air/water behavior
in a rapidly filling pipe and observed that the amount of air in the system is the key factor in
determine the pressure pattern, but this study only considered the effect of sudden pressure change
to the horizontal pipe. Meniconi (2012) did similar experiments to test the water hammer effect
pressure, and found that the viscoelasticity of the pipe material and friction can influence the
pressure pattern. Zhou et al. (2004) studied pressure transients in horizontal-vertical pipe system
experimentally to compare with horizontal pipe system result of Zhou et al. (2002 a), and found
the peak pressure variation and magnitude had a small difference, so that amount of air in the
system is still the key factor in determining the pressure pattern.
Ramezani et al. (2016) did experiments and found that the cause of air introduced into stormwater
distribution system include check towers and pipe bends, pump inlets and plunging jets. Huang et
al. (2017) confirmed that geysering may occur during transient process from free surface flow to
pressurized flow in ventilated sewer systems. Typically, two mechanisms can cause geyser, which
are transient surge or release of air. Both of them are related to air entering into the pipe system.
Although geysers can be triggered by different mechanisms, the severity of geyser events is all
related to inflow hydrograph and geometric characteristics of deep storage tunnel, as discussed by
Vasconcelos et al. (2017). From their study, the following conclusions are made: peak surge is
5
related to junction shaft plan area and time of flow pressurization, but no clear trend is found
between entrapped air volume and the inflow or geometry parameters.
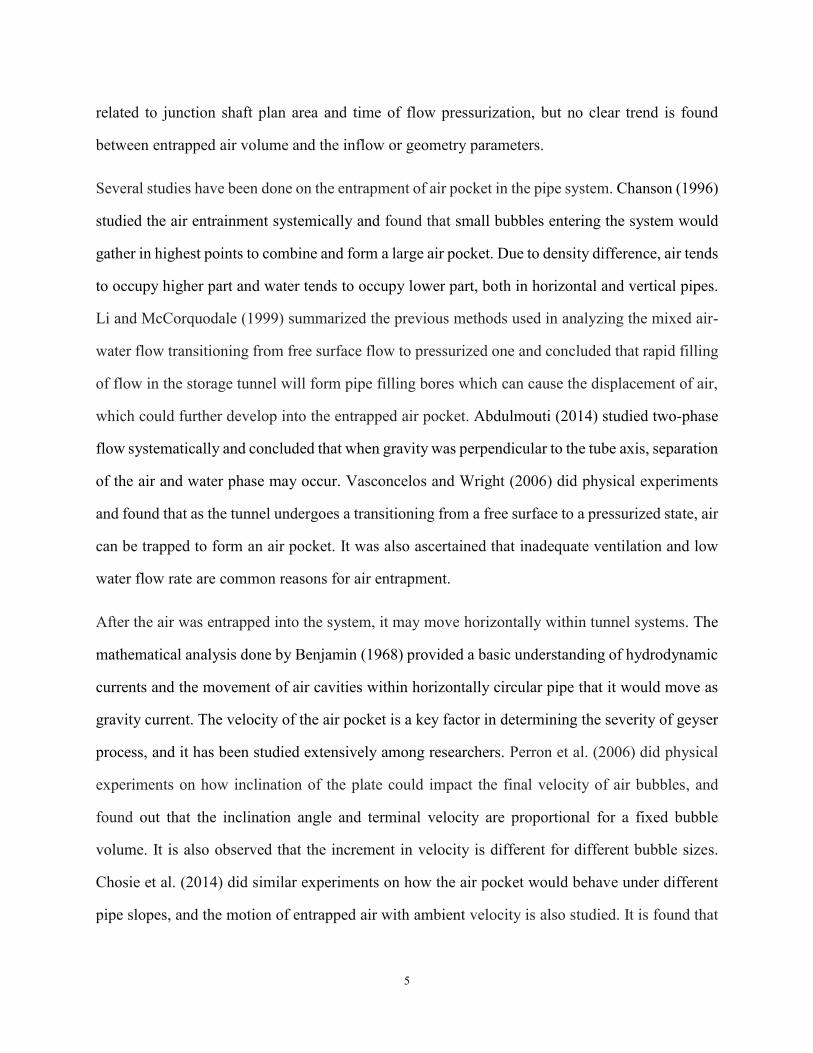
Several studies have been done on the entrapment of air pocket in the pipe system. Chanson (1996)
studied the air entrainment systemically and found that small bubbles entering the system would
gather in highest points to combine and form a large air pocket. Due to density difference, air tends
to occupy higher part and water tends to occupy lower part, both in horizontal and vertical pipes.
Li and McCorquodale (1999) summarized the previous methods used in analyzing the mixed air-
water flow transitioning from free surface flow to pressurized one and concluded that rapid filling
of flow in the storage tunnel will form pipe filling bores which can cause the displacement of air,
which could further develop into the entrapped air pocket. Abdulmouti (2014) studied two-phase
flow systematically and concluded that when gravity was perpendicular to the tube axis, separation
of the air and water phase may occur. Vasconcelos and Wright (2006) did physical experiments
and found that as the tunnel undergoes a transitioning from a free surface to a pressurized state, air
can be trapped to form an air pocket. It was also ascertained that inadequate ventilation and low
water flow rate are common reasons for air entrapment.
After the air was entrapped into the system, it may move horizontally within tunnel systems. The
mathematical analysis done by Benjamin (1968) provided a basic understanding of hydrodynamic
currents and the movement of air cavities within horizontally circular pipe that it would move as
gravity current. The velocity of the air pocket is a key factor in determining the severity of geyser
process, and it has been studied extensively among researchers. Perron et al. (2006) did physical
experiments on how inclination of the plate could impact the final velocity of air bubbles, and
found out that the inclination angle and terminal velocity are proportional for a fixed bubble
volume. It is also observed that the increment in velocity is different for different bubble sizes.
Chosie et al. (2014) did similar experiments on how the air pocket would behave under different
pipe slopes, and the motion of entrapped air with ambient velocity is also studied. It is found that
6
ambient flow can affect air pocket propagation, and the main leading edge could be sheared off
from the air pocket, but could rejoin the main air pocket after the drag is overcome. Zhou et al.
(2002 b) studied how the air volume would influence pressure with tail water, and concluded that
larger air pocket has a lower impact on the pressure. Muller (2016) did experiments on the
movement of air pocket with/without background flow, and found that background flow only has
little influence on air pocket velocity. Apart from air velocity, air pocket volume is also an
important factor in determining the geyser severity.
When air/water mixture enters the vertical shaft, the momentum of the rising air might lift water
up by some distance. These air pockets always entrain water and can carry them upward to form
geyser (Wright et al. 2011). Wright et al. (2011) did air capsule experiments with preserved
background pressure and confirmed that under system size and amount of ventilated air, the
vertical two-phase flow could lift water up beyond system pressure. Vasconcelos and Wright (2011)
did experiments on air-pocket induced geyser, and stated that larger scale experiments are needed
in order to assess the effect of turbulent film flows and the possible shear flow instabilities.
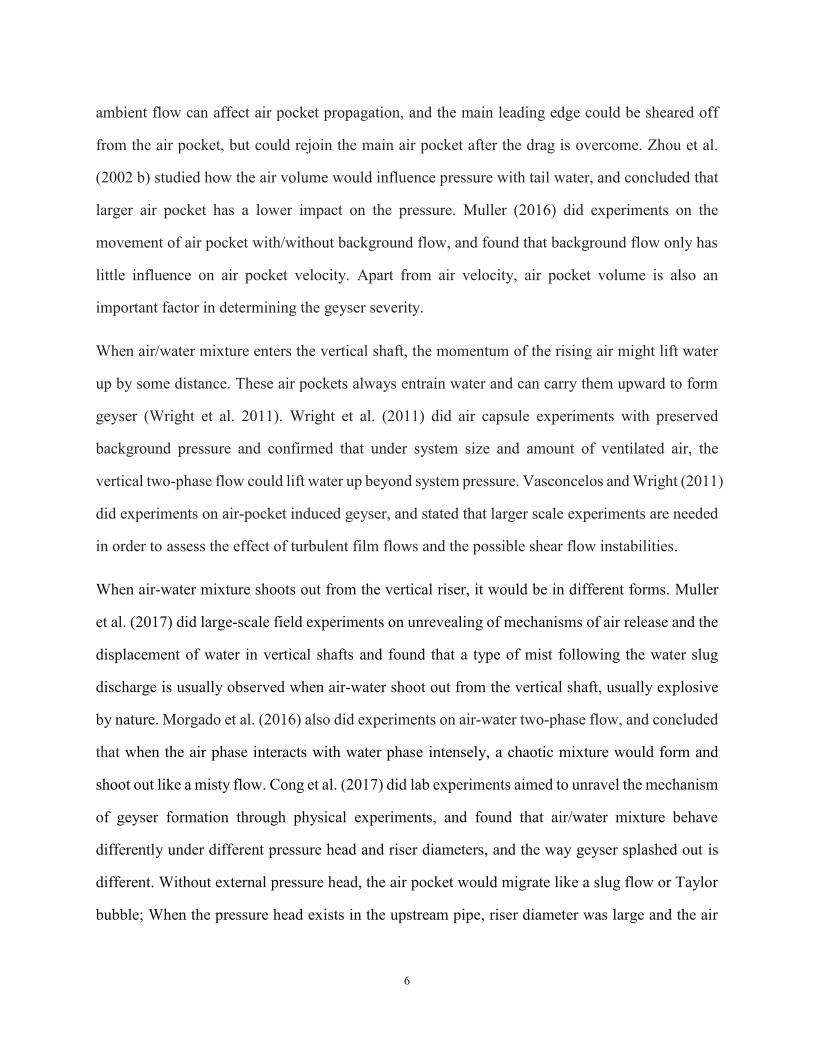
When air-water mixture shoots out from the vertical riser, it would be in different forms. Muller
et al. (2017) did large-scale field experiments on unrevealing of mechanisms of air release and the
displacement of water in vertical shafts and found that a type of mist following the water slug
discharge is usually observed when air-water shoot out from the vertical shaft, usually explosive
by nature. Morgado et al. (2016) also did experiments on air-water two-phase flow, and concluded
that when the air phase interacts with water phase intensely, a chaotic mixture would form and
shoot out like a misty flow. Cong et al. (2017) did lab experiments aimed to unravel the mechanism
of geyser formation through physical experiments, and found that air/water mixture behave
differently under different pressure head and riser diameters, and the way geyser splashed out is
different. Without external pressure head, the air pocket would migrate like a slug flow or Taylor
bubble; When the pressure head exists in the upstream pipe, riser diameter was large and the air
7
pocket volume was small, the air pocket would accelerate rapidly and jet out. However, all the
experiments were conducted without background flow, which is not practical in the real scenario.
Another problem with this research is that the scale is too small, with only a 0.05-m-diameter pipe
and riser diameter varied from 0.016 m to 0.04 m.
Numerical study on geyser related issues had been done by researchers. Chan et al. (2018) used
CFD to simulate geysers, and found that during a geyser event, compression of the air pocket in
the riser can lead to rapid acceleration of the overlying water column and its expulsion from the
riser. Based on the study of Zhou et al. (2002 b), Li and Zhu (2018) numerically simulated the
transient pressure caused by rapid filling flow with an end orifice in a horizontal pipe and effect
of air cushioning of an air pocket in a horizontal pipe with different diameter orifice on the pipe
end.
Although many studies have done on finding of the mechanism of geyser, most of them were based
on an idealized structure rather than a scale model of the prototype. As geysers are sensitive to
tunnel geometry, it is essential to investigate the matter base on prototype.
2.2 Geyser Mitigation
To date, there are only a few studies that focused on mitigation method of geyser events, the main
methods that have been tested experimentally include: adding a horizontal section to the vertical
riser, add a larger diameter section to replace a portion vertical riser and use orifice plates at
different locations along the vertical riser.
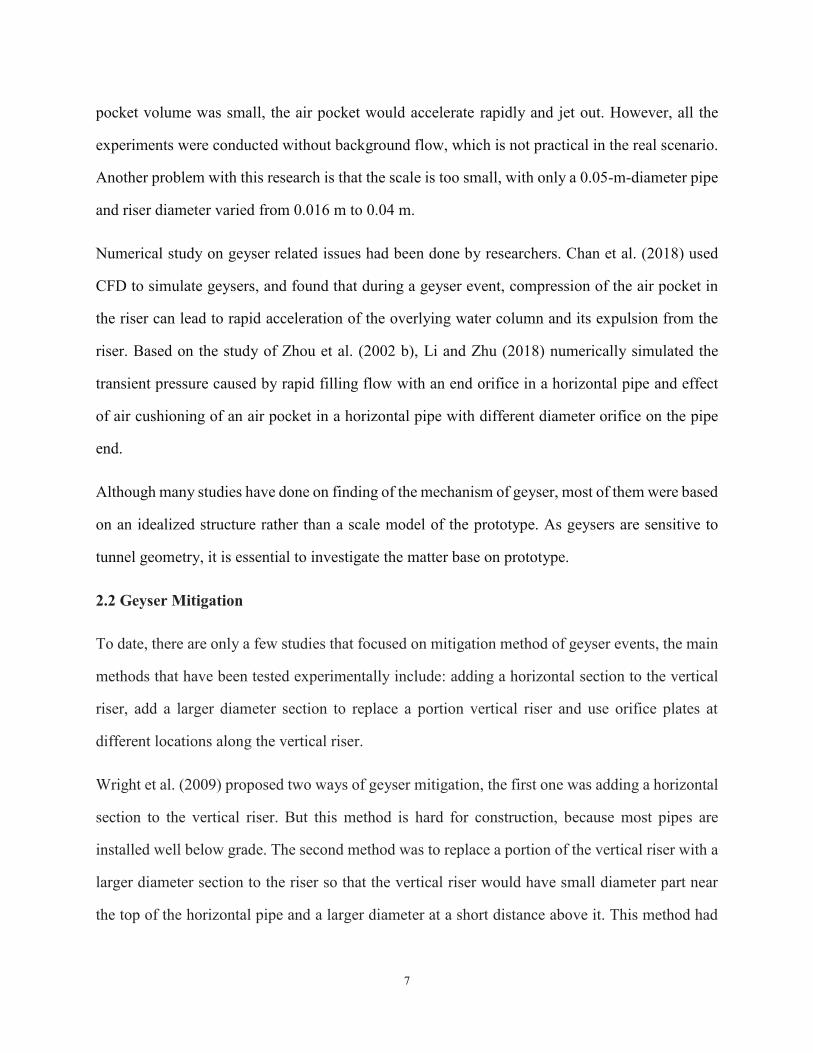
Wright et al. (2009) proposed two ways of geyser mitigation, the first one was adding a horizontal
section to the vertical riser. But this method is hard for construction, because most pipes are
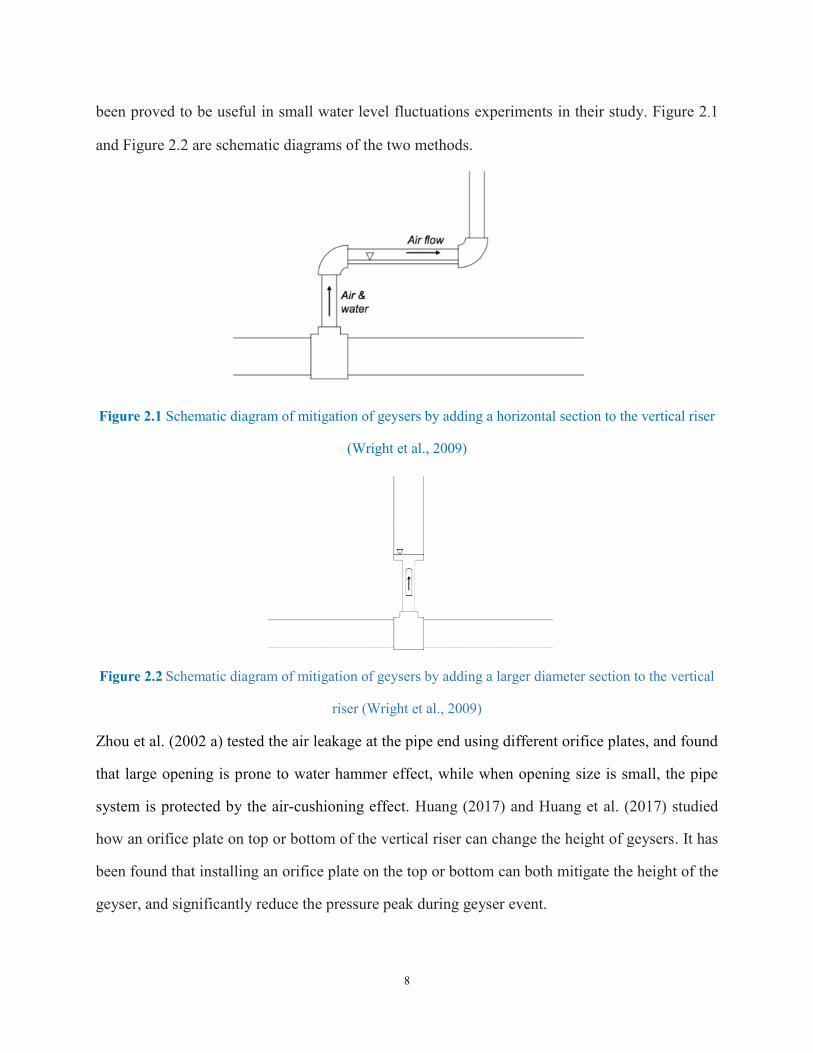
installed well below grade. The second method was to replace a portion of the vertical riser with a
larger diameter section to the riser so that the vertical riser would have small diameter part near
the top of the horizontal pipe and a larger diameter at a short distance above it. This method had
8
been proved to be useful in small water level fluctuations experiments in their study. Figure 2.1
and Figure 2.2 are schematic diagrams of the two methods.
Figure 2.1 Schematic diagram of mitigation of geysers by adding a horizontal section to the vertical riser
(Wright et al., 2009)
Figure 2.2 Schematic diagram of mitigation of geysers by adding a larger diameter section to the vertical
riser (Wright et al., 2009)
Zhou et al. (2002 a) tested the air leakage at the pipe end using different orifice plates, and found
that large opening is prone to water hammer effect, while when opening size is small, the pipe
system is protected by the air-cushioning effect. Huang (2017) and Huang et al. (2017) studied
how an orifice plate on top or bottom of the vertical riser can change the height of geysers. It has
been found that installing an orifice plate on the top or bottom can both mitigate the height of the
geyser, and significantly reduce the pressure peak during geyser event.

9
Although geyser mitigation methods were proposed in previous literatures, none of them did
detailed analysis on it, so that it is essential to test the effectiveness of mitigation methods explicitly,
especially base on the same system for revealing the geyser mechanism.
10
3. Experimental Setup and Methods
3.1 Experimental Setup
The experimental setup is a scaled model of a portion of stormwater tunnel at the intersection of
Gateway Boulevard and 30th Ave., Edmonton. The prototype tunnel includes two manholes: one
is an access shaft with a diameter of 1.5 m, and the other is a ventilation shaft with a diameter of
1.2 m. Both shafts were 27 m below grade and were connected to a 5.8m-diameter and 8.0 m-high
chamber, which serves as a T-junction connecting the existing southbound tunnel with the new
westbound tunnel. The existing storm tunnel is connected to the chamber from the south, with a
diameter of 3 m and a slope of 0.08%. The new tunnel is connected to the chamber from the east,
with a diameter of 3.5 m and a slope of 0.1%. The invert elevation difference between the existing
and the new tunnel is 4 m. Around 5 m downstream of the problematic manhole, the existing
southbound tunnel is connected to a temporary bypass drainage pipe with a diameter of 1.2 m.
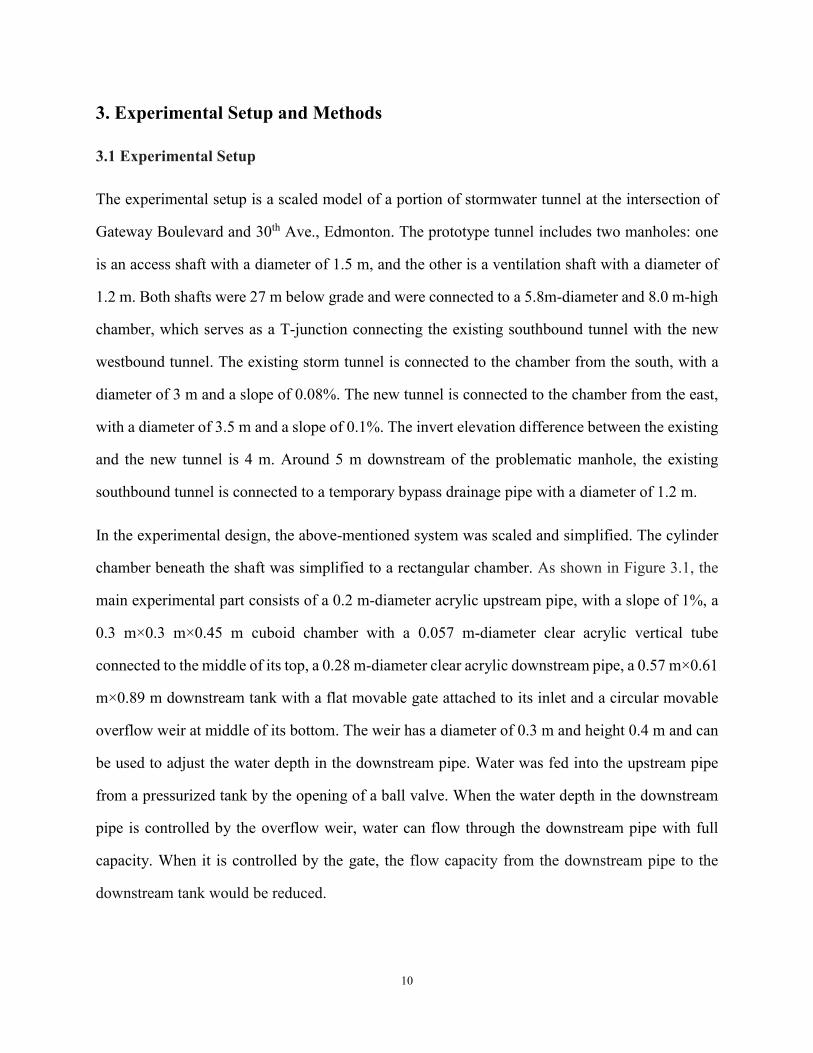
In the experimental design, the above-mentioned system was scaled and simplified. The cylinder
chamber beneath the shaft was simplified to a rectangular chamber. As shown in Figure 3.1, the
main experimental part consists of a 0.2 m-diameter acrylic upstream pipe, with a slope of 1%, a
0.3 m×0.3 m×0.45 m cuboid chamber with a 0.057 m-diameter clear acrylic vertical tube
connected to the middle of its top, a 0.28 m-diameter clear acrylic downstream pipe, a 0.57 m×0.61
m×0.89 m downstream tank with a flat movable gate attached to its inlet and a circular movable
overflow weir at middle of its bottom. The weir has a diameter of 0.3 m and height 0.4 m and can
be used to adjust the water depth in the downstream pipe. Water was fed into the upstream pipe
from a pressurized tank by the opening of a ball valve. When the water depth in the downstream
pipe is controlled by the overflow weir, water can flow through the downstream pipe with full
capacity. When it is controlled by the gate, the flow capacity from the downstream pipe to the
downstream tank would be reduced.
11
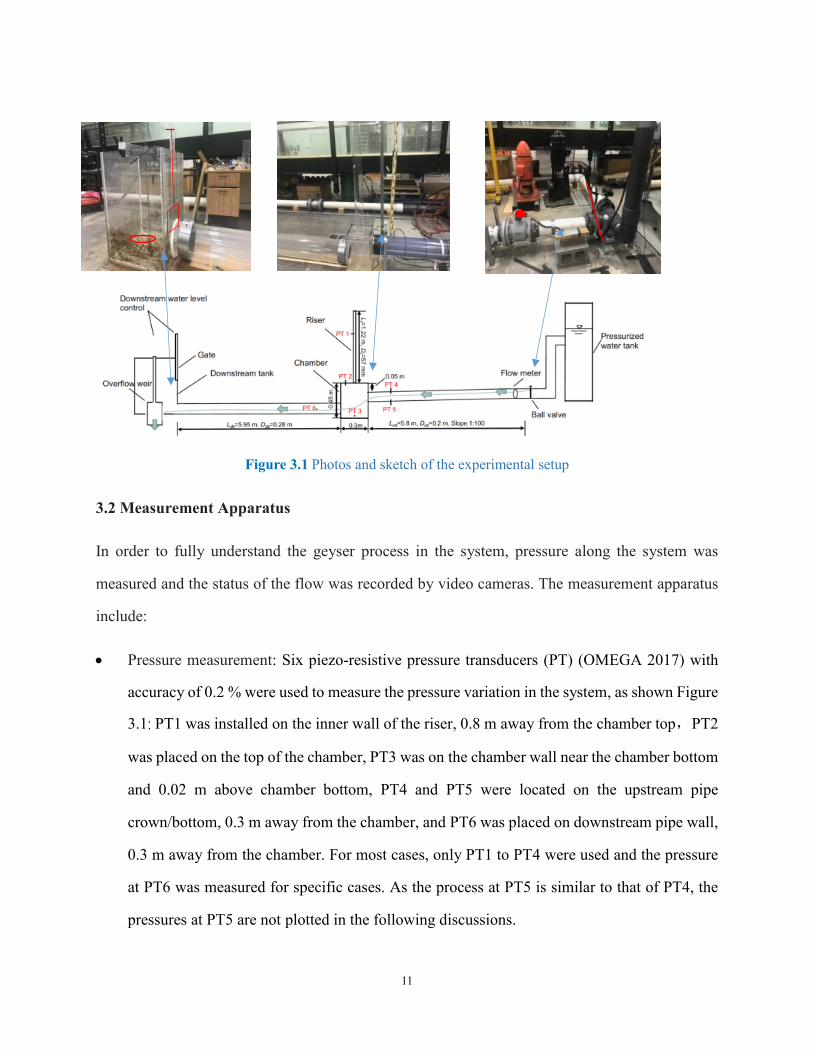
Figure 3.1 Photos and sketch of the experimental setup
3.2 Measurement Apparatus
In order to fully understand the geyser process in the system, pressure along the system was
measured and the status of the flow was recorded by video cameras. The measurement apparatus
include:
Pressure measurement: Six piezo-resistive pressure transducers (PT) (OMEGA 2017) with
accuracy of 0.2 % were used to measure the pressure variation in the system, as shown Figure
3.1: PT1 was installed on the inner wall of the riser, 0.8 m away from the chamber top,PT2
was placed on the top of the chamber, PT3 was on the chamber wall near the chamber bottom
and 0.02 m above chamber bottom, PT4 and PT5 were located on the upstream pipe
crown/bottom, 0.3 m away from the chamber, and PT6 was placed on downstream pipe wall,
0.3 m away from the chamber. For most cases, only PT1 to PT4 were used and the pressure
at PT6 was measured for specific cases. As the process at PT5 is similar to that of PT4, the
pressures at PT5 are not plotted in the following discussions.
12
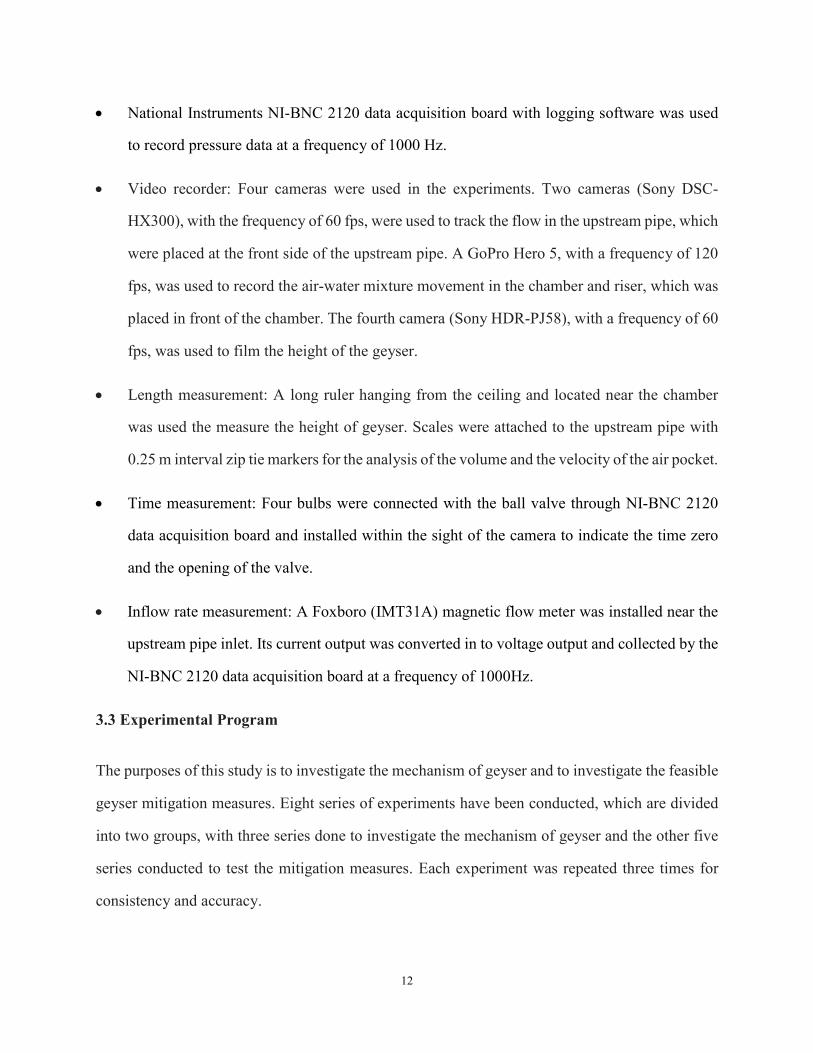
National Instruments NI-BNC 2120 data acquisition board with logging software was used
to record pressure data at a frequency of 1000 Hz.
Video recorder: Four cameras were used in the experiments. Two cameras (Sony DSC-
HX300), with the frequency of 60 fps, were used to track the flow in the upstream pipe, which
were placed at the front side of the upstream pipe. A GoPro Hero 5, with a frequency of 120
fps, was used to record the air-water mixture movement in the chamber and riser, which was
placed in front of the chamber. The fourth camera (Sony HDR-PJ58), with a frequency of 60
fps, was used to film the height of the geyser.
Length measurement: A long ruler hanging from the ceiling and located near the chamber
was used the measure the height of geyser. Scales were attached to the upstream pipe with
0.25 m interval zip tie markers for the analysis of the volume and the velocity of the air pocket.
Time measurement: Four bulbs were connected with the ball valve through NI-BNC 2120
data acquisition board and installed within the sight of the camera to indicate the time zero
and the opening of the valve.
Inflow rate measurement: A Foxboro (IMT31A) magnetic flow meter was installed near the
upstream pipe inlet. Its current output was converted in to voltage output and collected by the
NI-BNC 2120 data acquisition board at a frequency of 1000Hz.
3.3 Experimental Program
The purposes of this study is to investigate the mechanism of geyser and to investigate the feasible
geyser mitigation measures. Eight series of experiments have been conducted, which are divided
into two groups, with three series done to investigate the mechanism of geyser and the other five
series conducted to test the mitigation measures. Each experiment was repeated three times for
consistency and accuracy.
13
3.3.1 Series for geyser mechanism
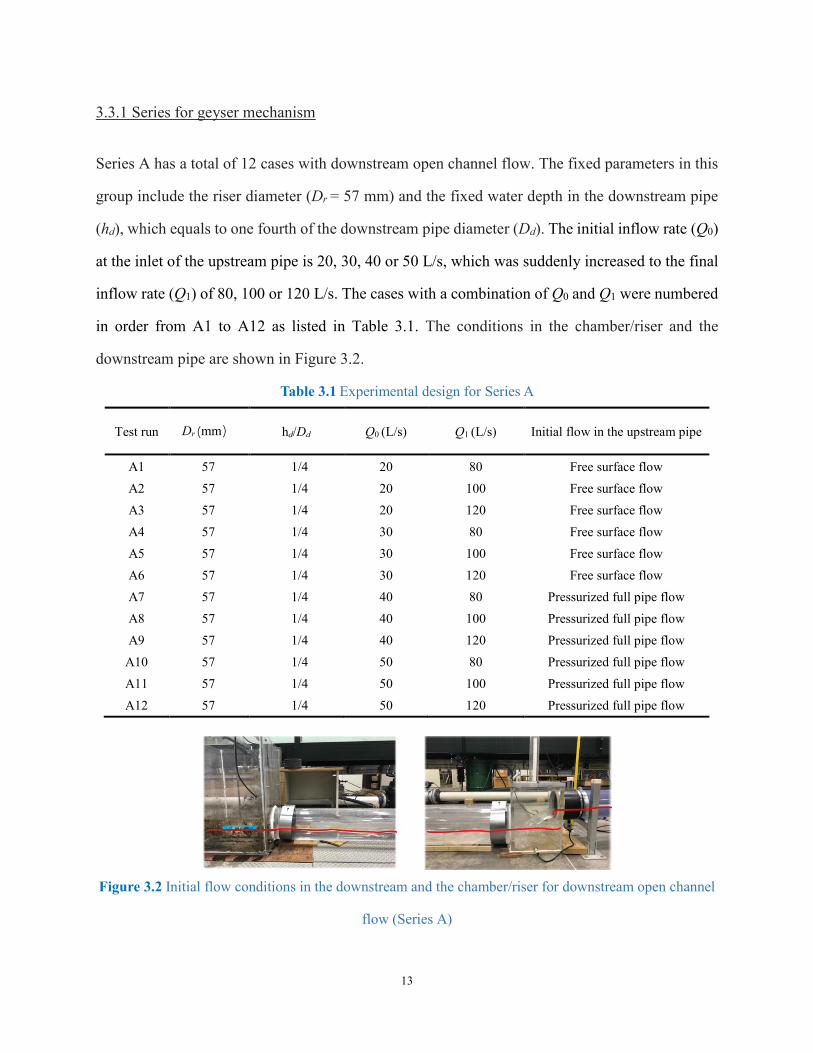
Series A has a total of 12 cases with downstream open channel flow. The fixed parameters in this
group include the riser diameter (Dr = 57 mm) and the fixed water depth in the downstream pipe
(hd), which equals to one fourth of the downstream pipe diameter (Dd). The initial inflow rate (Q0)
at the inlet of the upstream pipe is 20, 30, 40 or 50 L/s, which was suddenly increased to the final
inflow rate (Q1) of 80, 100 or 120 L/s. The cases with a combination of Q0 and Q1 were numbered
in order from A1 to A12 as listed in Table 3.1. The conditions in the chamber/riser and the
downstream pipe are shown in Figure 3.2.
Table 3.1 Experimental design for Series A
Test run Dr (mm) hd/Dd Q0 (L/s) Q1 (L/s) Initial flow in the upstream pipe
A1 57 1/4 20 80 Free surface flow
A2 57 1/4 20 100 Free surface flow
A3 57 1/4 20 120 Free surface flow
A4 57 1/4 30 80 Free surface flow
A5 57 1/4 30 100 Free surface flow
A6 57 1/4 30 120 Free surface flow
A7 57 1/4 40 80 Pressurized full pipe flow
A8 57 1/4 40 100 Pressurized full pipe flow
A9 57 1/4 40 120 Pressurized full pipe flow
A10 57 1/4 50 80 Pressurized full pipe flow
A11 57 1/4 50 100 Pressurized full pipe flow
A12 57 1/4 50 120 Pressurized full pipe flow
Figure 3.2 Initial flow conditions in the downstream and the chamber/riser for downstream open channel
flow (Series A)
14
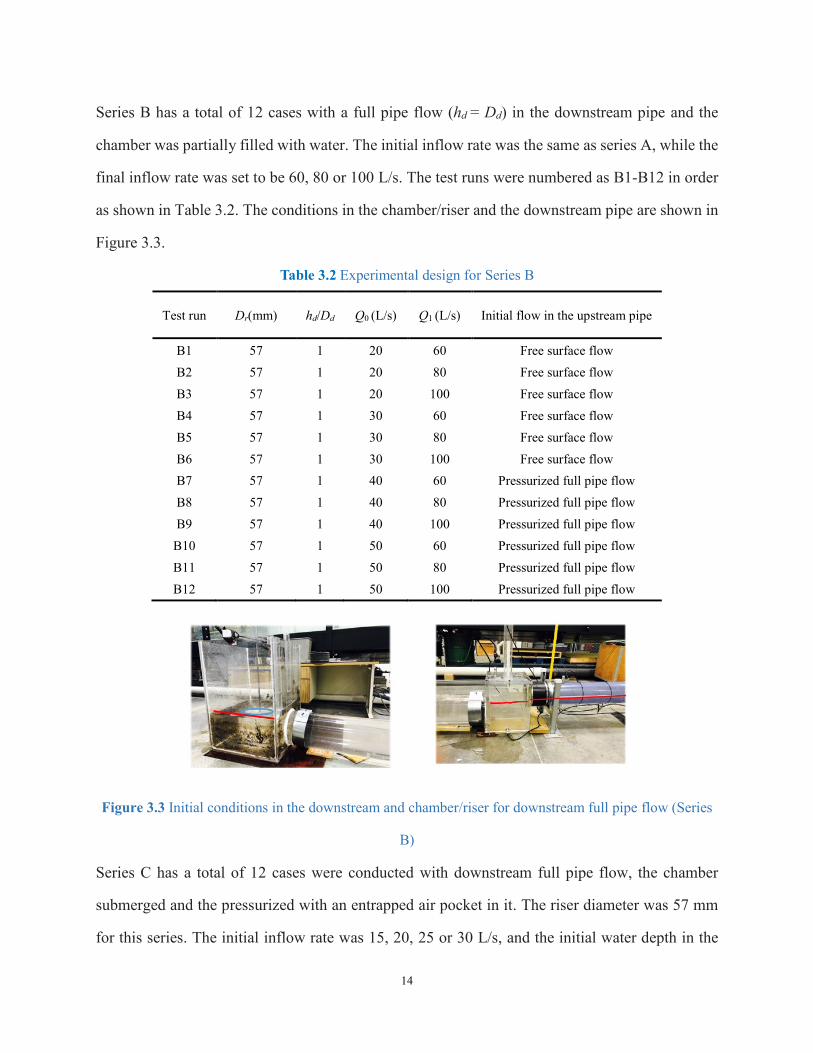
Series B has a total of 12 cases with a full pipe flow (hd = Dd) in the downstream pipe and the
chamber was partially filled with water. The initial inflow rate was the same as series A, while the
final inflow rate was set to be 60, 80 or 100 L/s. The test runs were numbered as B1-B12 in order
as shown in Table 3.2. The conditions in the chamber/riser and the downstream pipe are shown in
Figure 3.3.
Table 3.2 Experimental design for Series B
Test run Dr(mm) hd/Dd Q0 (L/s) Q1 (L/s) Initial flow in the upstream pipe
B1 57 1 20 60 Free surface flow
B2 57 1 20 80 Free surface flow
B3 57 1 20 100 Free surface flow
B4 57 1 30 60 Free surface flow
B5 57 1 30 80 Free surface flow
B6 57 1 30 100 Free surface flow
B7 57 1 40 60 Pressurized full pipe flow
B8 57 1 40 80 Pressurized full pipe flow
B9 57 1 40 100 Pressurized full pipe flow
B10 57 1 50 60 Pressurized full pipe flow
B11 57 1 50 80 Pressurized full pipe flow
B12 57 1 50 100 Pressurized full pipe flow
Figure 3.3 Initial conditions in the downstream and chamber/riser for downstream full pipe flow (Series
B)
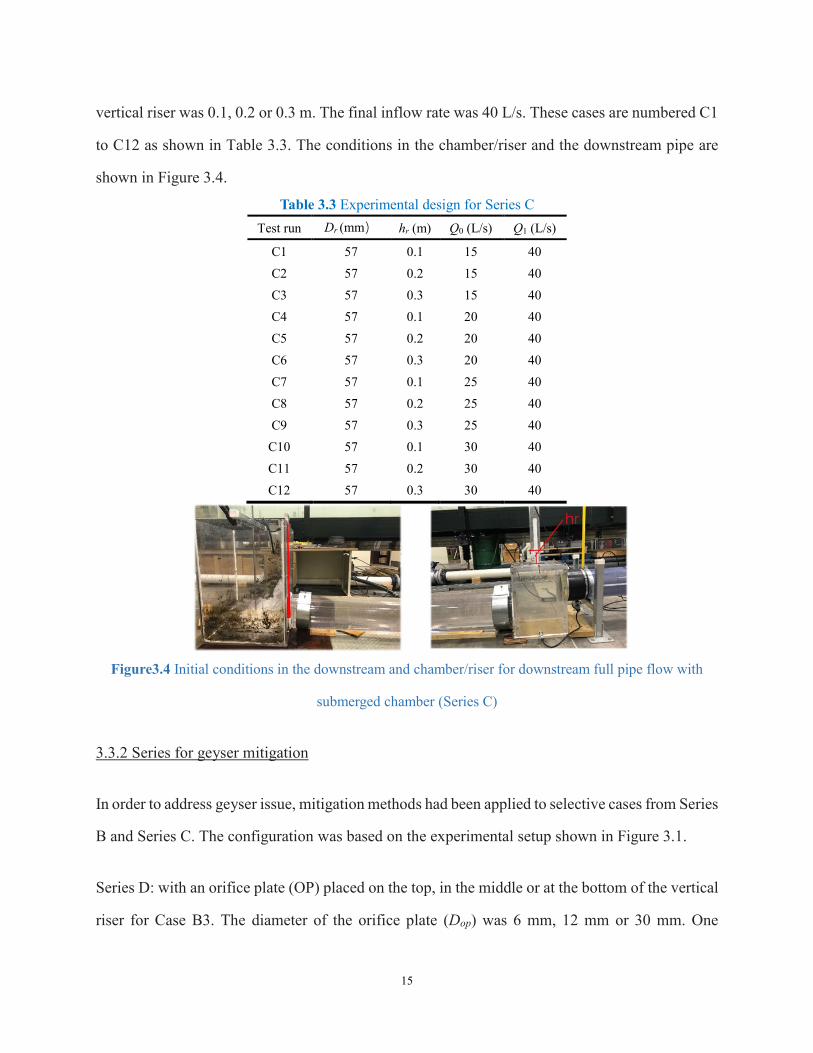
Series C has a total of 12 cases were conducted with downstream full pipe flow, the chamber
submerged and the pressurized with an entrapped air pocket in it. The riser diameter was 57 mm
for this series. The initial inflow rate was 15, 20, 25 or 30 L/s, and the initial water depth in the
15
vertical riser was 0.1, 0.2 or 0.3 m. The final inflow rate was 40 L/s. These cases are numbered C1
to C12 as shown in Table 3.3. The conditions in the chamber/riser and the downstream pipe are
shown in Figure 3.4.
Table 3.3 Experimental design for Series C
Test run Dr (mm) hr (m) Q0 (L/s) Q1 (L/s)
C1 57 0.1 15 40
C2 57 0.2 15 40
C3 57 0.3 15 40
C4 57 0.1 20 40
C5 57 0.2 20 40
C6 57 0.3 20 40
C7 57 0.1 25 40
C8 57 0.2 25 40
C9 57 0.3 25 40
C10 57 0.1 30 40
C11 57 0.2 30 40
C12 57 0.3 30 40
Figure3.4 Initial conditions in the downstream and chamber/riser for downstream full pipe flow with
submerged chamber (Series C)
3.3.2 Series for geyser mitigation
In order to address geyser issue, mitigation methods had been applied to selective cases from Series
B and Series C. The configuration was based on the experimental setup shown in Figure 3.1.
Series D: with an orifice plate (OP) placed on the top, in the middle or at the bottom of the vertical
riser for Case B3. The diameter of the orifice plate (Dop) was 6 mm, 12 mm or 30 mm. One
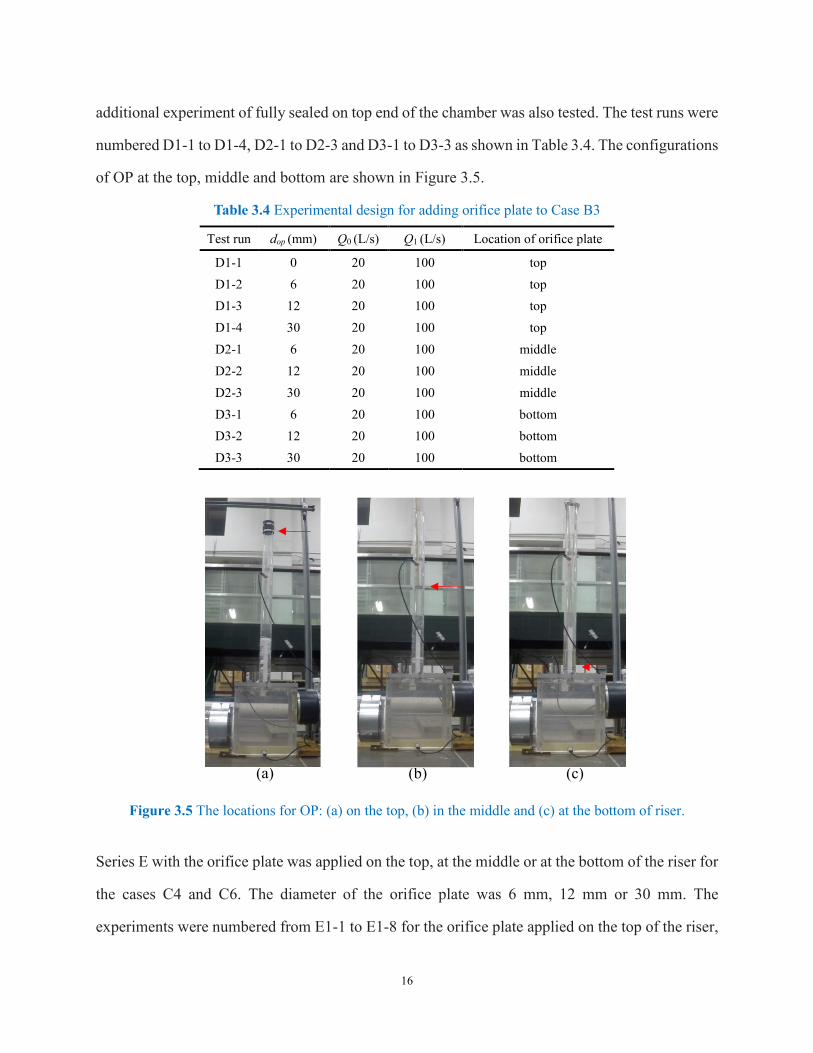
16
additional experiment of fully sealed on top end of the chamber was also tested. The test runs were
numbered D1-1 to D1-4, D2-1 to D2-3 and D3-1 to D3-3 as shown in Table 3.4. The configurations
of OP at the top, middle and bottom are shown in Figure 3.5.
Table 3.4 Experimental design for adding orifice plate to Case B3
Test run dop (mm) Q0 (L/s) Q1 (L/s) Location of orifice plate
D1-1 0 20 100 top
D1-2 6 20 100 top
D1-3 12 20 100 top
D1-4 30 20 100 top
D2-1 6 20 100 middle
D2-2 12 20 100 middle
D2-3 30 20 100 middle
D3-1 6 20 100 bottom
D3-2 12 20 100 bottom
D3-3 30 20 100 bottom
Figure 3.5 The locations for OP: (a) on the top, (b) in the middle and (c) at the bottom of riser.
Series E with the orifice plate was applied on the top, at the middle or at the bottom of the riser for
the cases C4 and C6. The diameter of the orifice plate was 6 mm, 12 mm or 30 mm. The
experiments were numbered from E1-1 to E1-8 for the orifice plate applied on the top of the riser,
(a) (b) (c)
17
E2-1 to E2-6 for orifice plate applied at the middle of the riser and E3-1 to E3-6 for orifice plate
applied at the bottom of the riser as shown in Table 3.5.
Table 3.5 Experimental design for adding orifice plates to Case C4 and C6
Test run dop (mm) hr (m) Q0 (L/s) Q1 (L/s) Location of orifice plate
E1-1 0 0.1 20 40 top
E1-2 0 0.3 20 40 top
E1-3 6 0.1 20 40 top
E1-4 6 0.3 20 40 top
E1-5 12 0.1 20 40 top
E1-6 12 0.3 20 40 top
E1-7 30 0.1 20 40 top
E1-8 30 0.3 20 40 top
E2-1 6 0.1 20 40 middle
E2-2 6 0.3 20 40 middle
E2-3 12 0.1 20 40 middle
E2-4 12 0.3 20 40 middle
E2-5 30 0.1 20 40 middle
E2-6 30 0.3 20 40 middle
E3-1 6 0.1 20 40 bottom
E3-2 6 0.3 20 40 bottom
E3-3 12 0.1 20 40 bottom
E3-4 12 0.3 20 40 bottom
E3-5 30 0.1 20 40 bottom
E3-6 30 0.3 20 40 bottom
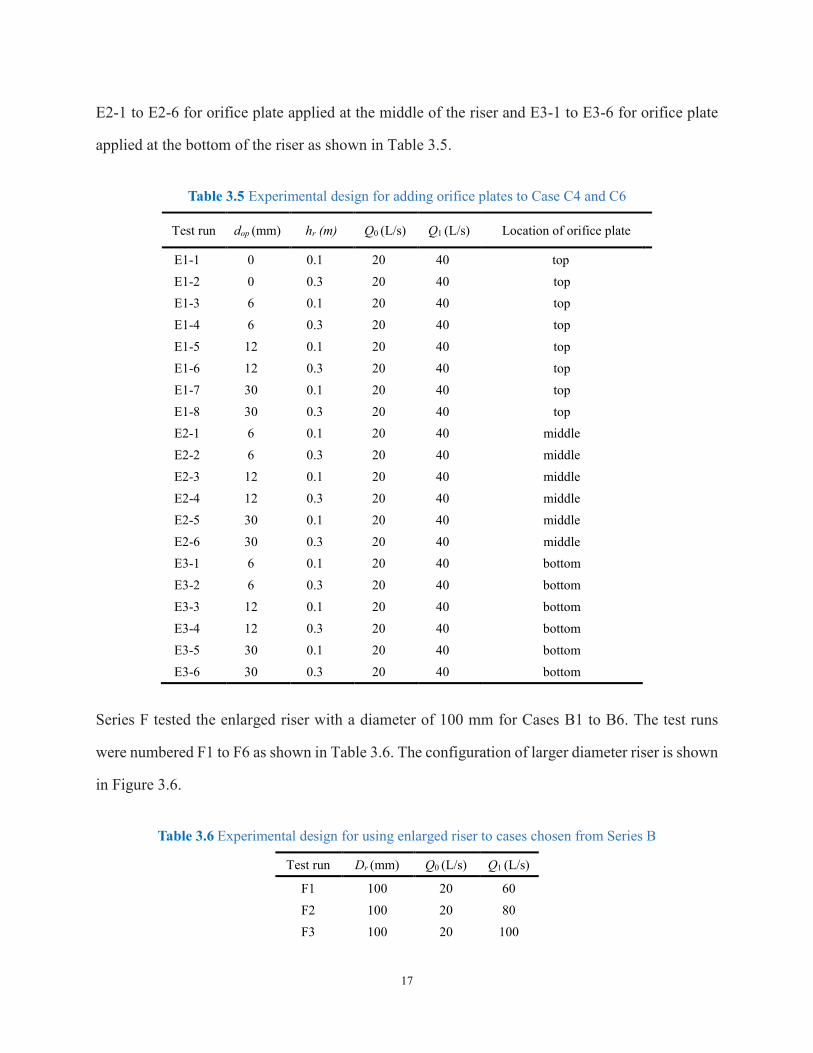
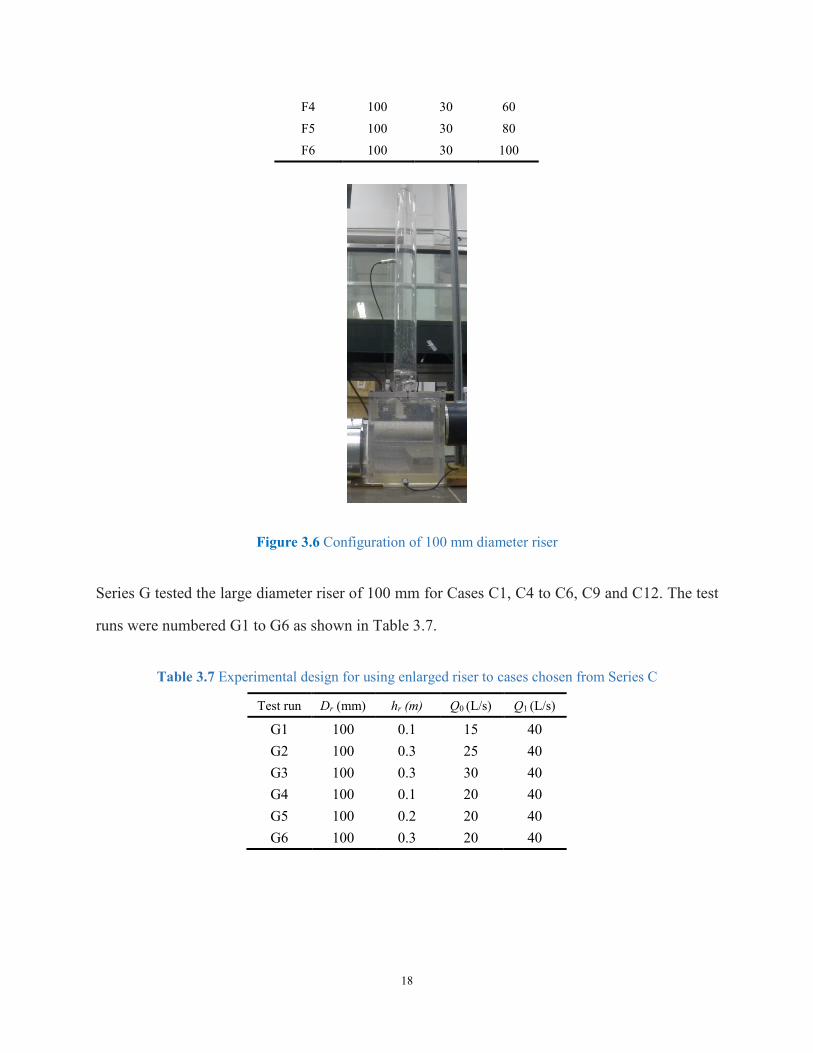
Series F tested the enlarged riser with a diameter of 100 mm for Cases B1 to B6. The test runs
were numbered F1 to F6 as shown in Table 3.6. The configuration of larger diameter riser is shown
in Figure 3.6.
Table 3.6 Experimental design for using enlarged riser to cases chosen from Series B
Test run Dr (mm) Q0 (L/s) Q1 (L/s)
F1 100 20 60
F2 100 20 80
F3 100 20 100
18
F4 100 30 60
F5 100 30 80
F6 100 30 100
Figure 3.6 Configuration of 100 mm diameter riser
Series G tested the large diameter riser of 100 mm for Cases C1, C4 to C6, C9 and C12. The test
runs were numbered G1 to G6 as shown in Table 3.7.
Table 3.7 Experimental design for using enlarged riser to cases chosen from Series C
Test run Dr (mm) hr (m) Q0 (L/s) Q1 (L/s)
G1 100 0.1 15 40
G2 100 0.3 25 40
G3 100 0.3 30 40
G4 100 0.1 20 40
G5 100 0.2 20 40
G6 100 0.3 20 40
19
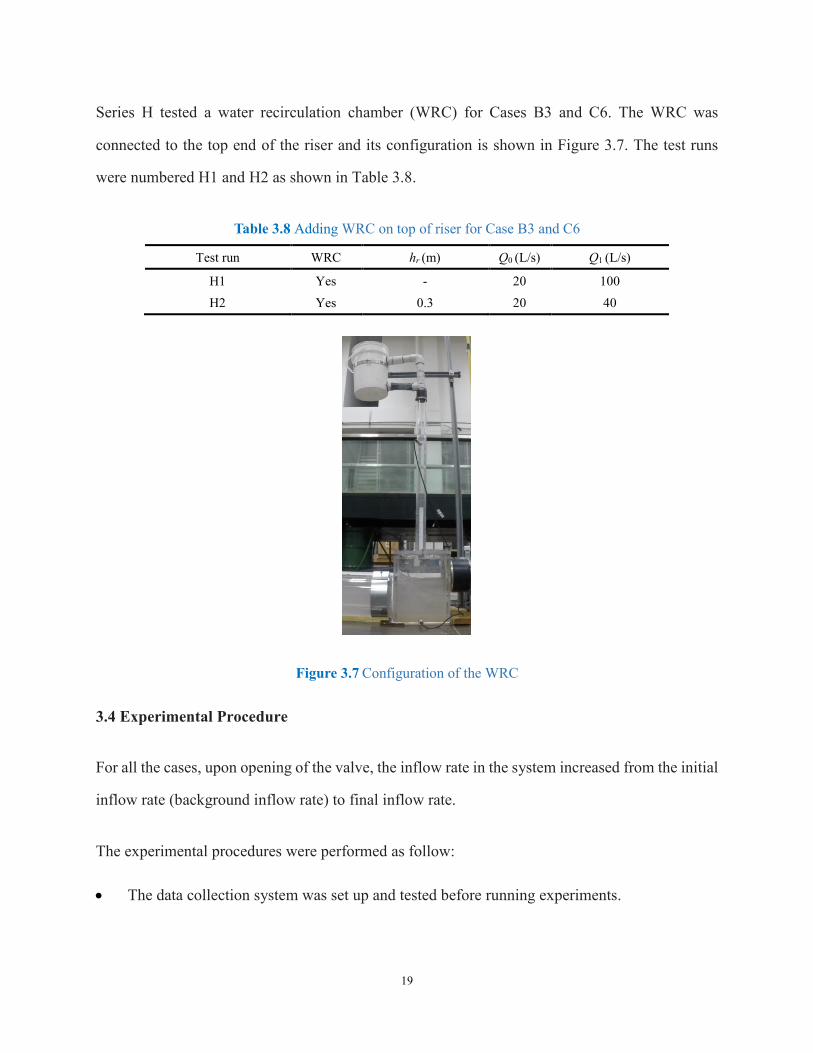
Series H tested a water recirculation chamber (WRC) for Cases B3 and C6. The WRC was
connected to the top end of the riser and its configuration is shown in Figure 3.7. The test runs
were numbered H1 and H2 as shown in Table 3.8.
Table 3.8 Adding WRC on top of riser for Case B3 and C6
Test run WRC hr (m) Q0 (L/s) Q1 (L/s)
H1 Yes - 20 100
H2 Yes 0.3 20 40
Figure 3.7 Configuration of the WRC
3.4 Experimental Procedure
For all the cases, upon opening of the valve, the inflow rate in the system increased from the initial
inflow rate (background inflow rate) to final inflow rate.
The experimental procedures were performed as follow:
The data collection system was set up and tested before running experiments.
20
With the flow running at the desired inflow rate (Q0), the downstream condition was
controlled by either tailgate or overflow weir as needed.
The ball valve was further manually opened as quickly as possible (about 0.2 s) so that a
sudden increase in inflow rate from the initial to the final value (Q1) was reached. For the test
of retrofitting methods, the additional setup of the orifice plate, WRC or larger diameter riser
was configured before further opening the valve.
The experiment process was recorded 10 seconds before further manually opening of the
valve.
All data recording devices were turned off 10 seconds after the system reached its new steady-
state.
21
4. Testing Results for Geyser Mechanism
For all the testing in this thesis, the geyser is defined as air-water mixture splashing out through
the riser, and the geyser height (hg) is indicated by jetting height (h), where the jetting height is
measured from the bottom of the riser. If h exceeded the riser height of 1.22 m, then water splashed
out from the riser top, and actual geyser happened.
4.1 Downstream Open Channel Flow (Series A)
Twelve cases were tested to in this series. The initial upstream pipe flow condition of free surface
flow or pressurized full pipe flow depends on the initial inflow rate. The water depth in the
downstream pipe is controlled as one-fourth of the downstream pipe diameter by adjusting the
crest height of the overflow weir. For this series, Case A2 was chosen for analysis in detail.
4.1.1 Observation of phenomena
For a smaller initial inflow rate of Q0=20 or 30 L/s, the initial flow condition in the upstream pipe
is open channel flow. Upon quickly fully opening of the valve, the surge front would start to
advance towards the chamber and the upstream pipe was quickly filled with water to become
pressurized pipe flow. After the surge front reached the chamber, it would stroke the chamber wall
which is attached to the downstream pipe, reflected back and mixed with the air which occupied
the upper portion of the chamber. As most of the air could directly escape from the downstream
pipe, geyser heights were low for this category. A general description of the process is summarized
below.
For Case A2, water propagation in the upstream pipe after a sudden flow rate increase is shown in
Figure 4.1:
t = 0 s: the water surface in the upstream pipe is oscillating in a small range, and this is the
time when the valve is abruptly opened.
22
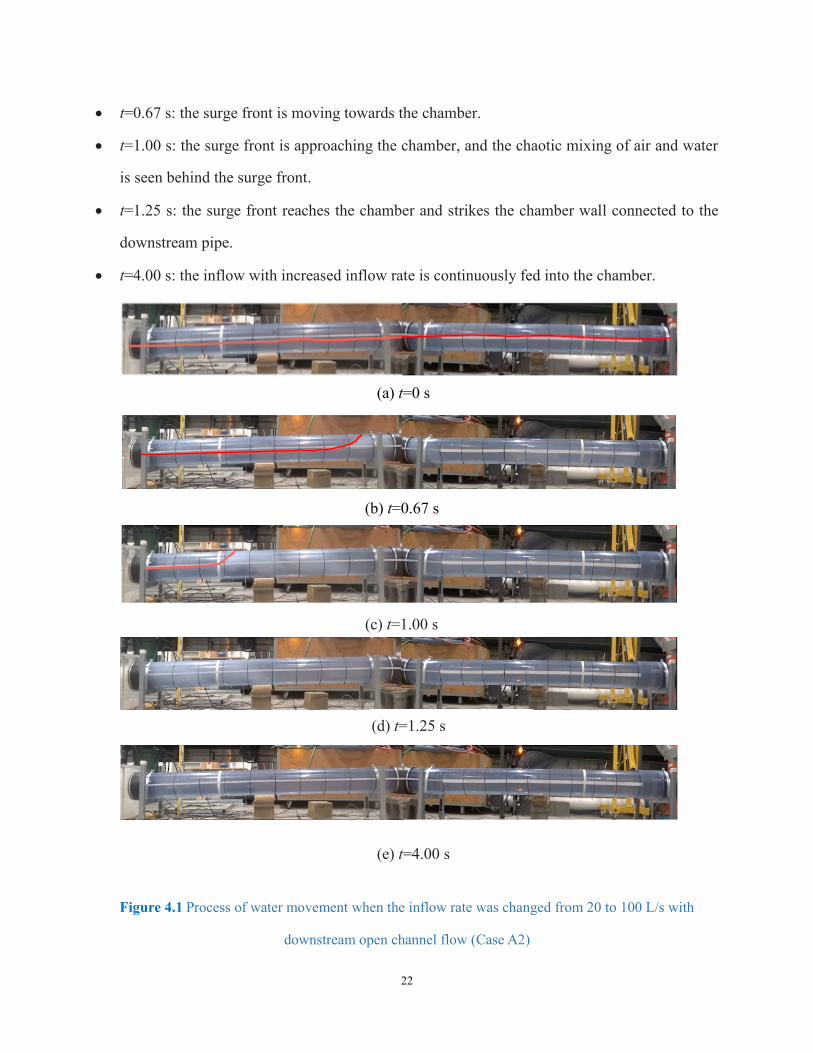
t=0.67 s: the surge front is moving towards the chamber.
t=1.00 s: the surge front is approaching the chamber, and the chaotic mixing of air and water
is seen behind the surge front.
t=1.25 s: the surge front reaches the chamber and strikes the chamber wall connected to the
downstream pipe.
t=4.00 s: the inflow with increased inflow rate is continuously fed into the chamber.
Figure 4.1 Process of water movement when the inflow rate was changed from 20 to 100 L/s with
downstream open channel flow (Case A2)
(a) t=0 s
(b) t=0.67 s
(c) t=1.00 s
(d) t=1.25 s
(e) t=4.00 s
23
The corresponding pressure process and the movement of the air-water mixture in the chamber
and riser are shown in Figure 4.2. Before fully opening of the valve, the pressures at PT1, PT2 and
PT4 are all zero (atmospheric pressure) due to the existence of free surface in the chamber and
upstream pipe. The pressure at PT3 indicates the water height in the chamber initially. When the
ball valve was quickly opened at t=0 s, water started to advance towards the chamber. At 1.20 s,
surge front arrived at the chamber in the form of chaotic air-water mixture, causing the
compression of air in the chamber, leading to the increase of pressure at PT4. The pressure at PT3
almost did not change at 1.25 s, which means that air that existed on the upper portion of the
chamber had no effect on the water at the lower portion of the chamber. Surge front reached the
chamber wall which is connected to the downstream pipe at approximately 1.35 s, and curved back
to fill the chamber, which caused a striking behavior and pressure rise at PT2. As the water depth
in the downstream tank was low, most of the water and air would directly went out from the system
through the downstream pipe, only small portion would strike the chamber wall and reflect back.
Water column started to appear in the riser after the chamber was filled with the air-water mixture
and became pressurized. Few sharp peaks were recorded at PT2 from around 1.30 s to 6.50 s,
before water in downstream pipe accelerated to adapt to the final inflow rate. From the pressure
data, it can be seen that pressure reached its final steady state at around 9.00 s, when the oscillation
of both positive and negative reading started to narrow down, that was the time when most of the
air in the chamber was transported into the downstream tank through the downstream pipe.
24
Figure 4.2 Experimental Process of Case A2: (a) air-water movement in the chamber and the riser, and
(b) pressure variations.
4.1.2 Summary for Series A
For a small initial inflow rate of 20 or 30 L/s, take Case A2 as an example. Upon opening of the
valve, surge front reached the chamber at around 1.25 s, which caused a sudden increase in
pressure at PT2-PT4. Intermittent peak pressure occurred several times at PT2, each was related
to water hitting the chamber top, and the higher pressure at PT2-PT4 was always associated with
t=0 s t=1.20 s t=1.35 s t=2.03 s t=4.00 s t=9.50 s
(b)
(a)
25
higher water depth in the riser. The pressure on the top of the chamber was around 0 kPa
(atmospheric pressure) initially, but raised to 7.3 kPa when the chamber became pressurized.
Negative pressure was recorded from around 1.00 s to 5.00 s at PT2 and PT4. After 6 seconds,
when most of the air has been transported from the chamber to downstream tank, the pressure at
PT2 and PT4 stayed positive.
For a larger initial inflow rate of 40 or 50 L/s, water would fill the entire upstream pipe initially.
Upon fully opening of the ball valve, the flow occupying the whole section of the upstream pipe
was instantly pushed into the chamber. After a short time of intense mixing with air which
occupied the upper portion of the chamber, it would directly propagate towards the downstream
pipe and flow out of the system through the downstream tank.
The jetting height (h) for this category is low, compared with Series B and C, and all the cases in
Series A did not produce actual geyser, as water did not splash out from the riser. The maximum
height of water column seen in the riser is 0.53 m. The geyser heights for all cases was shown in
Figure 4.3. The ΔQ in the figure is the difference between the final inflow rate and initial inflow
rate (ΔQ = Q1 – Q0) and h is the maximum geyser height.
Figure 4.3 Jetting heights of all cases in Series A with downstream open channel flow
4.2 Downstream Full Pipe Flow (Series B)
26
Twelve cases were tested for this series. For the cases with the initial inflow rate of 20 L/s or 30
L/s, the flow in upstream pipe condition would be open channel flow, and for 40 L/s and 50 L/s
cases, the flow in the upstream would be pressurized full pipe flow. The flow in the downstream
pipe is controlled to be a full pipe flow by adjusting the crest height of the overflow weir. For this
series, Case B3 is chosen for analysis in detail.
4.2.1 Observation of phenomena
As the downstream pipe is full, air in the system has less chance to escape through the downstream
pipe when compared with Series A. For open channel flow in the upstream pipe initially, air in the
upstream pipe would be pushed into the chamber immediately after fully opening of the valve.
Then the water would oscillate in the chamber as no more air existed in the chamber and upstream
pipe. For the cases with full pipe flow in the upstream pipe initially, no air existed in the upstream
pipe before fully opening of the valve and the corresponding geyser heights are lower than initial
free surface flow in the upstream pipe cases due to its smaller increase of the flow rate.
A general description of water movement in the upstream pipe for initial inflow rate of 20 L/s and
final inflow rate of 100 L/s (Case B3) is shown in Figure 4.4 and summarized below:
t=0 s, the water level in the upstream pipe was oscillating in a small range, and this was the
time when the valve was suddenly fully opened.
t=0.67 s, the surge front was approaching the chamber.
t=1.25 s, the surge front reached the chamber and stroked the chamber wall. The inflow would
be continuously fed into the chamber afterwards, like Case A2.
27
Figure 4.4 The surge front propagation in the upstream pipe when downstream was full pipe flow and the
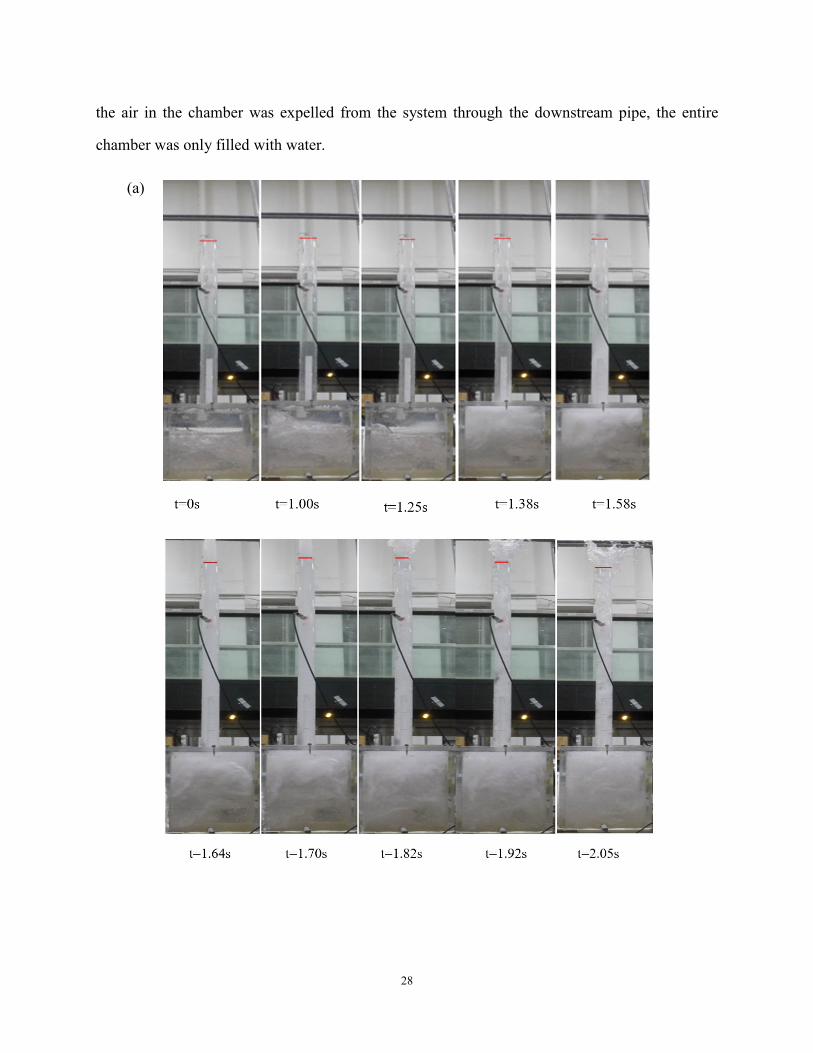
flow rate is changed from 20 to 100 L/s (Case B3)
The corresponding pressure and the air-water movement in the chamber and riser are shown in
Figure 4.5. When the valve was abruptly opened at t=0 s, the pressures at PT2 and PT3 were both
around zero (atmospheric pressure), same as Case A2. At t=1.25 s, the surge front reached the
chamber, stroke the chamber wall and curved back from 1.25 s to 1.38 s to fill the chamber. At
around 1.38 s, the chamber was fully filled, causing pressure rise at PT2-PT4. Water started to jet
out of the riser at t=1.58 s, which was around the time when peak pressures at PT2-PT4 were seen
with a reading of 47 kPa at PT2. When air-water mixture shootout, the pressure drop was seen at
PT1-PT4, which was caused by the air expansion in the chamber. As flow with increased inflow
rate was continuously fed into the chamber, two more periodical pressure oscillations were seen.
The geyser event ceased at around 2.10 s, when no more water was seen splashing out of the riser.
After the geyser event, only small amount of air existed in the chamber within the air-water mixture,
so that the pressure in the riser dropped to atmospheric pressure again. From 6.50 s on, after all
(c) t =1.25 s
(a) t=0s
(b) t=0.67 s
28
the air in the chamber was expelled from the system through the downstream pipe, the entire
chamber was only filled with water.
(a)

29
Figure 4.5 Experimental Process of Case B3: (a) air-water movement in the chamber and the riser, and
(b) pressure variation.
4.2.2 Summary for Series B
For a small initial inflow rate of 20 or 30 L/s, take Case B3 as an example. As upstream has a free
surface initially, a large amount of air was stored along the upper portion of the upstream pipe and
the chamber. Upon further opening of the valve, all the air in the upstream pipe was pushed into
the chamber rapidly, which was compressed in the chamber, and the pressure increase at PT2-PT4.
The air would expand when air-water mixture shoots up, causing the pressure drop at PT2-PT4.
After the geyser, oscillation of water surface can be seen in the riser.
(b)
30
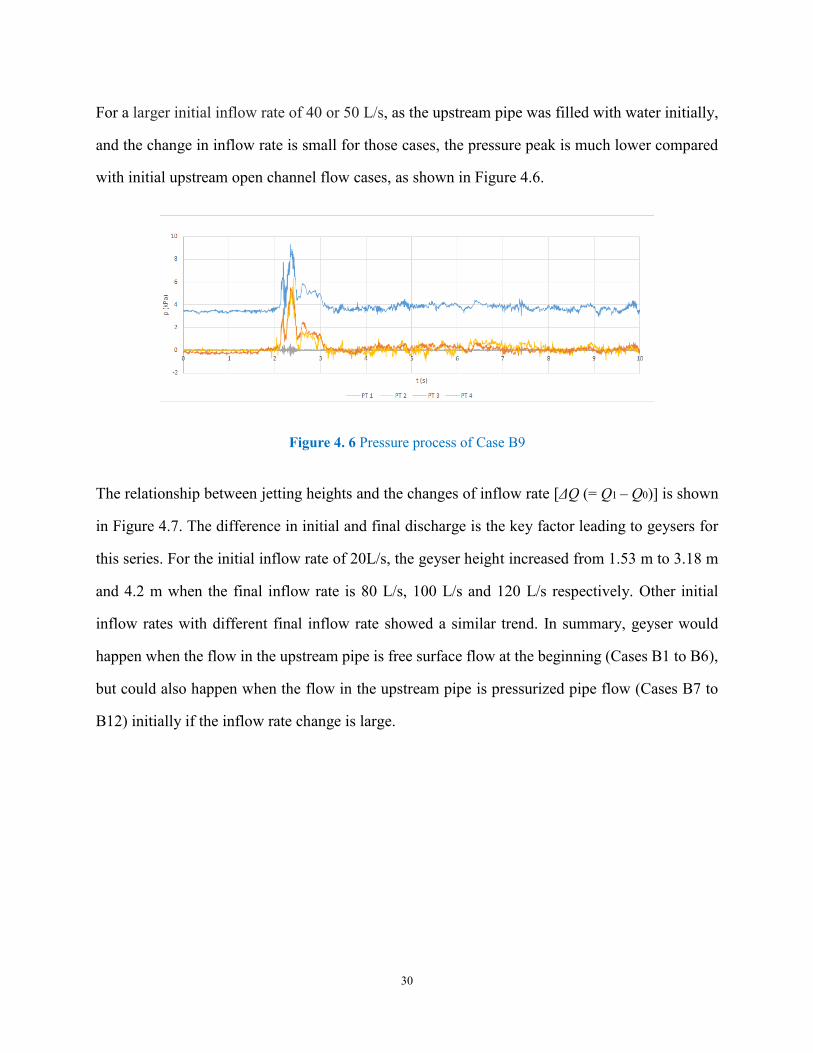
For a larger initial inflow rate of 40 or 50 L/s, as the upstream pipe was filled with water initially,
and the change in inflow rate is small for those cases, the pressure peak is much lower compared
with initial upstream open channel flow cases, as shown in Figure 4.6.
Figure 4. 6 Pressure process of Case B9
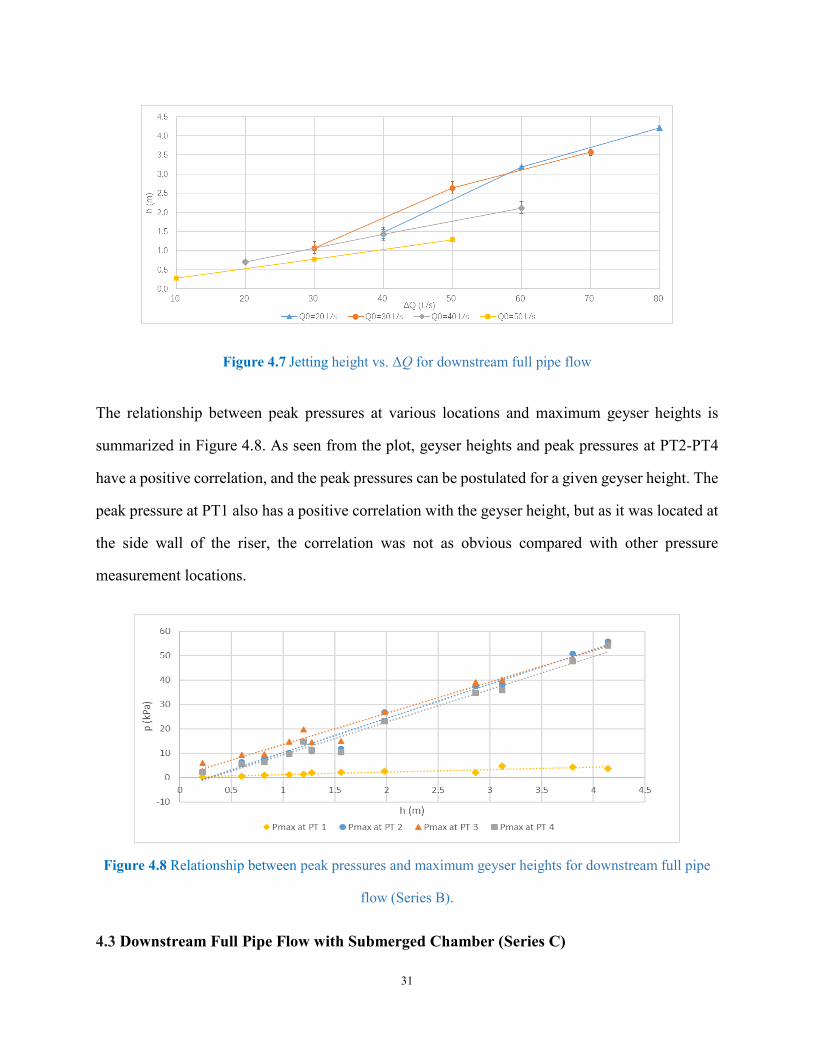
The relationship between jetting heights and the changes of inflow rate [ΔQ (= Q1 – Q0)] is shown
in Figure 4.7. The difference in initial and final discharge is the key factor leading to geysers for
this series. For the initial inflow rate of 20L/s, the geyser height increased from 1.53 m to 3.18 m
and 4.2 m when the final inflow rate is 80 L/s, 100 L/s and 120 L/s respectively. Other initial
inflow rates with different final inflow rate showed a similar trend. In summary, geyser would
happen when the flow in the upstream pipe is free surface flow at the beginning (Cases B1 to B6),
but could also happen when the flow in the upstream pipe is pressurized pipe flow (Cases B7 to
B12) initially if the inflow rate change is large.
31
Figure 4.7 Jetting height vs. ΔQ for downstream full pipe flow
The relationship between peak pressures at various locations and maximum geyser heights is
summarized in Figure 4.8. As seen from the plot, geyser heights and peak pressures at PT2-PT4
have a positive correlation, and the peak pressures can be postulated for a given geyser height. The
peak pressure at PT1 also has a positive correlation with the geyser height, but as it was located at
the side wall of the riser, the correlation was not as obvious compared with other pressure
measurement locations.
Figure 4.8 Relationship between peak pressures and maximum geyser heights for downstream full pipe
flow (Series B).
4.3 Downstream Full Pipe Flow with Submerged Chamber (Series C)
32
The air pocket in the upstream pipe is entrapped when the tailgate is lowered down to partially
block the outflow of the downstream pipe. When the tailgate is lowered down, water stroked on it
would form a hydraulic jump that propagates towards the chamber and against the flow direction.
When the water filled the downstream pipe and became pressurized, water would fill the chamber
and water column was seen in the riser which oscillated up and down in a small range. Afterward,
the hydraulic jump would go further toward the upstream and appear in the upstream pipe. As the
initial inflow rate was set to a certain value, an air pocket would be entrapped when the balance
was reached between the hydraulic jump and the flow. Different initial water depth in the riser can
be adjusted by the tailgate.
4.3.1 Observation of phenomena
For all the 12 runs, an air pocket was entrapped in the upstream pipe initially. Upon fully opening
of the valve, transient pressure could push the thin layer of air which existed on the pipe crown
near the chamber into the chamber, and cause the first type of geyser. When the thin layer of air
was pushed into the chamber, head of the air pocket was pushed back towards the upstream
direction against flow direction, causing the main body of the air pocket became compressed and
started to advance towards the chamber. After the head of the air pocket reached the chamber, the
main air pocket would release small and discrete air bubbles into the chamber, then they would
enter the vertical riser, move upwards along with water, and cause the second type of geyser.
Therefore, geysers in this series can be triggered by both the transient pressure and the air releasing
from the air pocket.
The process of air pocket movement along upstream pipe (Case C4) is shown in Figure 4.9 and
summarized below:
33
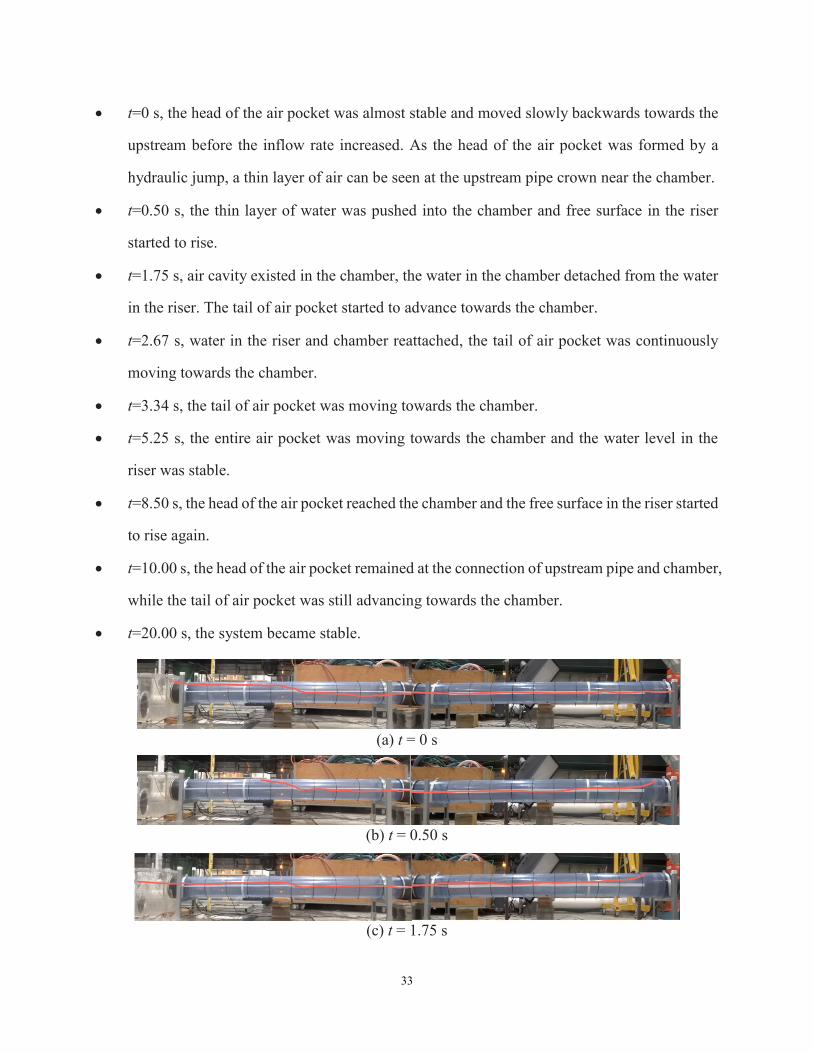
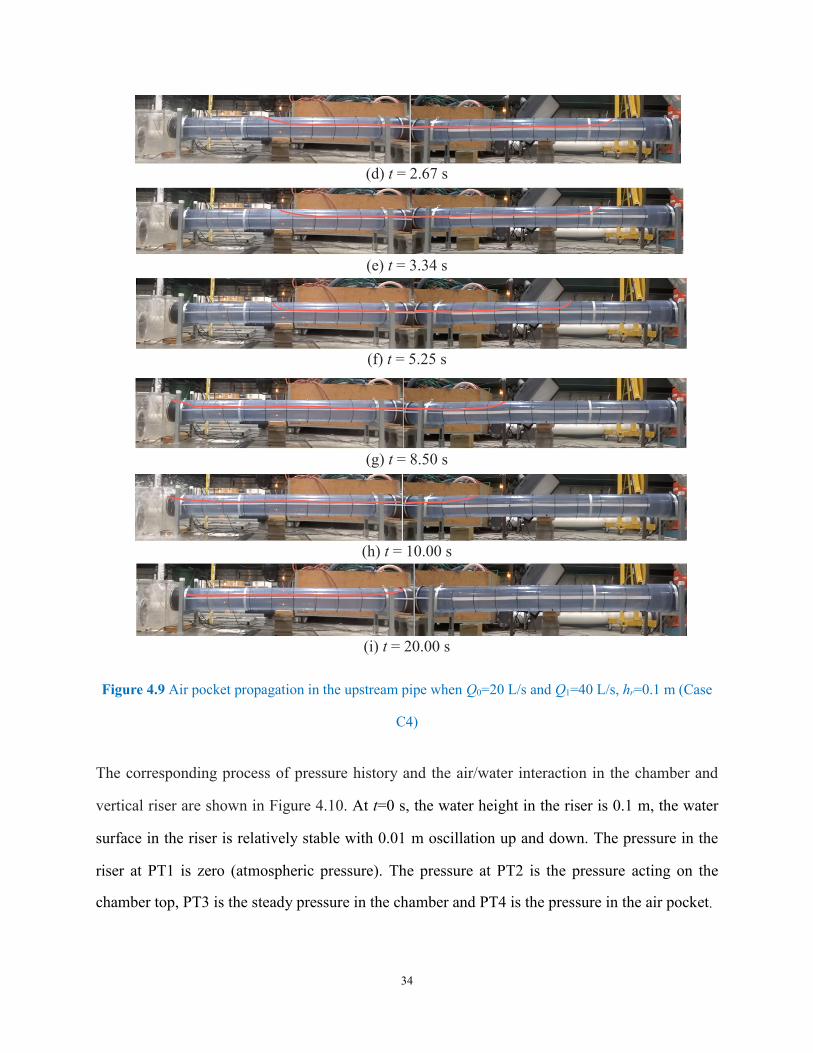
t=0 s, the head of the air pocket was almost stable and moved slowly backwards towards the
upstream before the inflow rate increased. As the head of the air pocket was formed by a
hydraulic jump, a thin layer of air can be seen at the upstream pipe crown near the chamber.
t=0.50 s, the thin layer of water was pushed into the chamber and free surface in the riser
started to rise.
t=1.75 s, air cavity existed in the chamber, the water in the chamber detached from the water
in the riser. The tail of air pocket started to advance towards the chamber.
t=2.67 s, water in the riser and chamber reattached, the tail of air pocket was continuously
moving towards the chamber.
t=3.34 s, the tail of air pocket was moving towards the chamber.
t=5.25 s, the entire air pocket was moving towards the chamber and the water level in the
riser was stable.
t=8.50 s, the head of the air pocket reached the chamber and the free surface in the riser started
to rise again.
t=10.00 s, the head of the air pocket remained at the connection of upstream pipe and chamber,
while the tail of air pocket was still advancing towards the chamber.
t=20.00 s, the system became stable.
(a) t = 0 s
(b) t = 0.50 s
(c) t = 1.75 s
34
(d) t = 2.67 s
(e) t = 3.34 s
(f) t = 5.25 s
(g) t = 8.50 s
(h) t = 10.00 s
(i) t = 20.00 s
Figure 4.9 Air pocket propagation in the upstream pipe when Q0=20 L/s and Q1=40 L/s, hr=0.1 m (Case
C4)
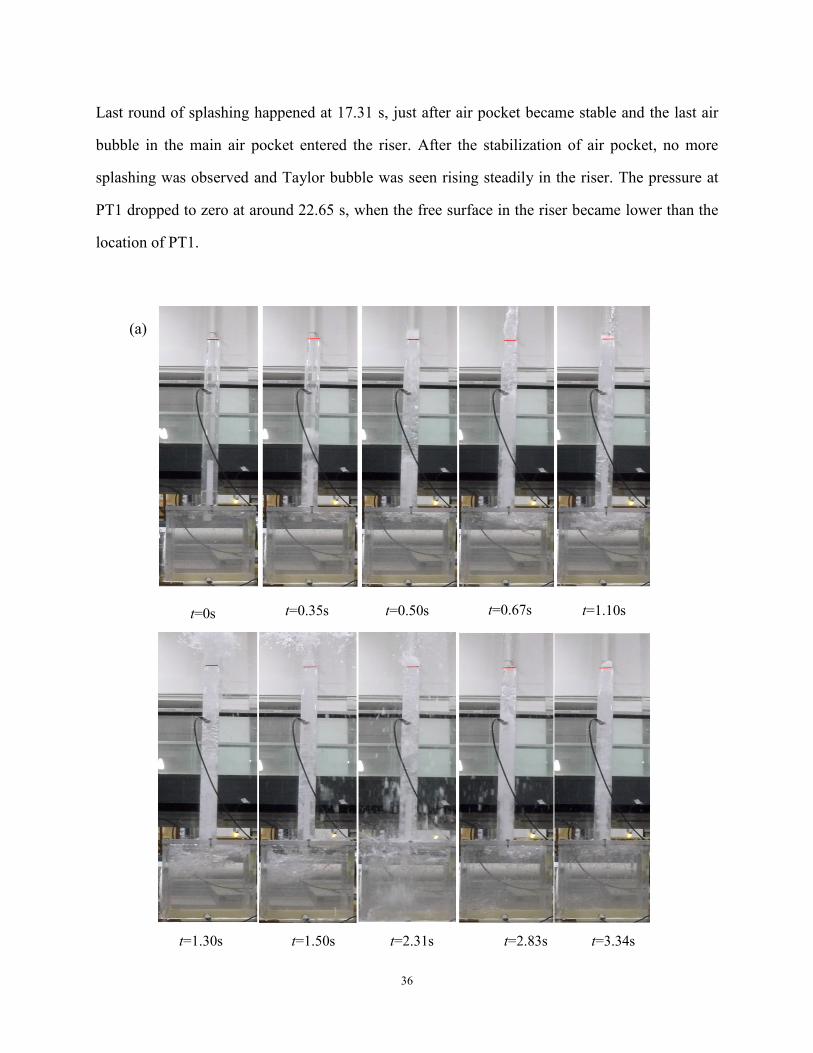
The corresponding process of pressure history and the air/water interaction in the chamber and
vertical riser are shown in Figure 4.10. At t=0 s, the water height in the riser is 0.1 m, the water
surface in the riser is relatively stable with 0.01 m oscillation up and down. The pressure in the
riser at PT1 is zero (atmospheric pressure). The pressure at PT2 is the pressure acting on the
chamber top, PT3 is the steady pressure in the chamber and PT4 is the pressure in the air pocket.
35
After the sudden fully opening of the valve, the pressure wave would propagate towards the
chamber. The first splashing of water happened at around 0.50 s, after the thin layer of air was
pushed into the chamber and release through the riser, and the surrounding water filled the air
space, which caused the first pressure peak in the chamber. The decreasing and increasing of
pressure was seen from 0.67 s to 2.67 s, with the decreasing of pressure caused by the air-water
mixture out of riser, while the increasing of pressure caused by water from the upstream pipe fed
into the chamber to fill the space of air cavity. When air cavity appeared, the junction of the thin
layer of air and the head of the air pocket is separated by water plug, which resulted in the entire
air pocket separated into two parts and the head of air pocket be pushed back towards the upstream.
After the air cavity was filled by water, the impact force of rising water forced the water in the rise
to move upwards, which resulted in the second splashing, which happened from 3.34 s to 4.19 s.
When head of air pocket that was advancing towards the far upstream encountered the increased
rate of flow that was flowing towards the chamber, the head of the air pocket changed its direction.
The pressure gradually increased at PT2-PT4 during this time, with a 0.20 s delay of pressure
increase was observed at PT1. The pressures at PT2-PT4 were steady from 4.00 s to 8.00 s, which
was when the entire air pocket was advancing towards the chamber, while the head of the air
pocket had not reached the chamber yet.
As the flow was continuously moving towards the chamber, the head of the air pocket reached the
chamber at around 8.69 s. When the head of the air pocket reached the chamber, it was separated
into smaller air bubbles due to the existence of the joint of chamber and upstream pipe, and would
accumulate on the top of the chamber. The third round of splashing happened from 8.88 s to 9.94
s, after first discrete air bubble was separated from main air pocket entered the chamber then riser
bottom and shoot out. The pressure pattern is typical for air pocket release process, with a decrease
in pressure at PT2-PT4 indicating that air was gradually released from the riser, followed by an
increase in pressure at PT2-PT4 indicating that water in the upstream was fed into the chamber.
The pressure increase was an indication of geyser height from 8.88 s to 15.21 s.
36
Last round of splashing happened at 17.31 s, just after air pocket became stable and the last air
bubble in the main air pocket entered the riser. After the stabilization of air pocket, no more
splashing was observed and Taylor bubble was seen rising steadily in the riser. The pressure at
PT1 dropped to zero at around 22.65 s, when the free surface in the riser became lower than the
location of PT1.
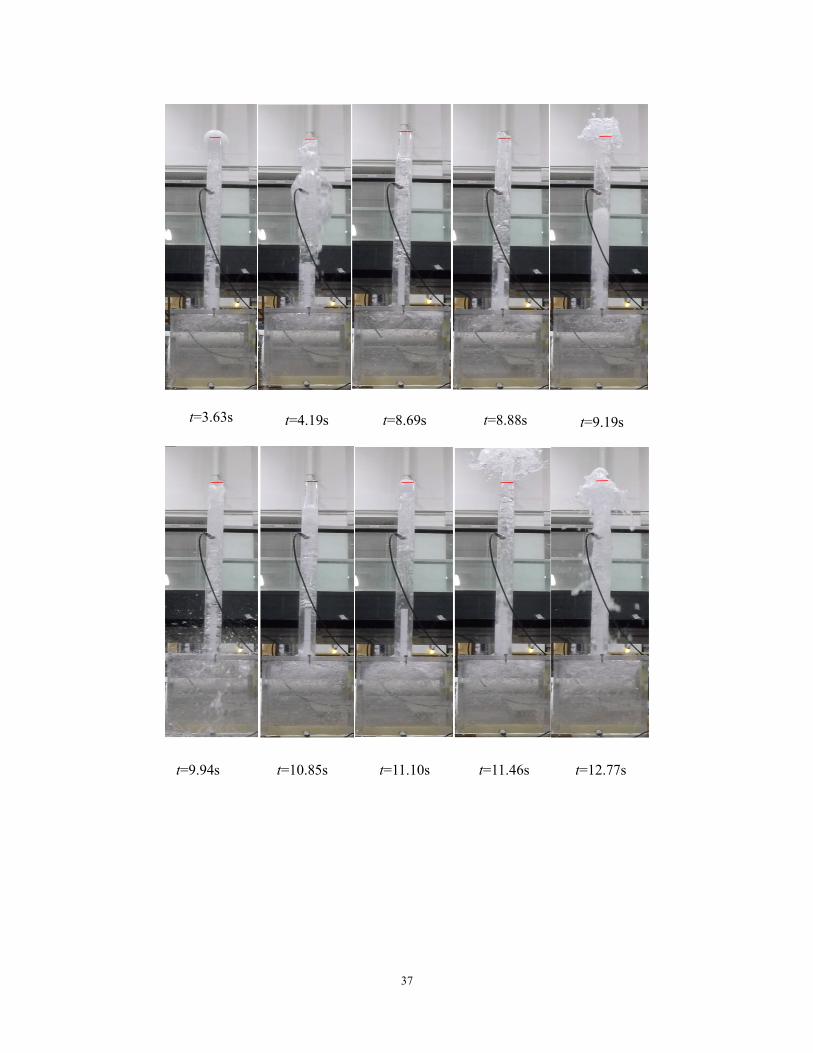
t=0s t=0.35s t=0.50s t=0.67s t=1.10s
(a)
t=1.30s t=1.50s t=2.31s t=2.83s t=3.34s
37
t=3.63s t=4.19s t=8.69s t=8.88s t=9.19s
t=9.94s t=10.85s t=11.10s t=11.46s t=12.77s
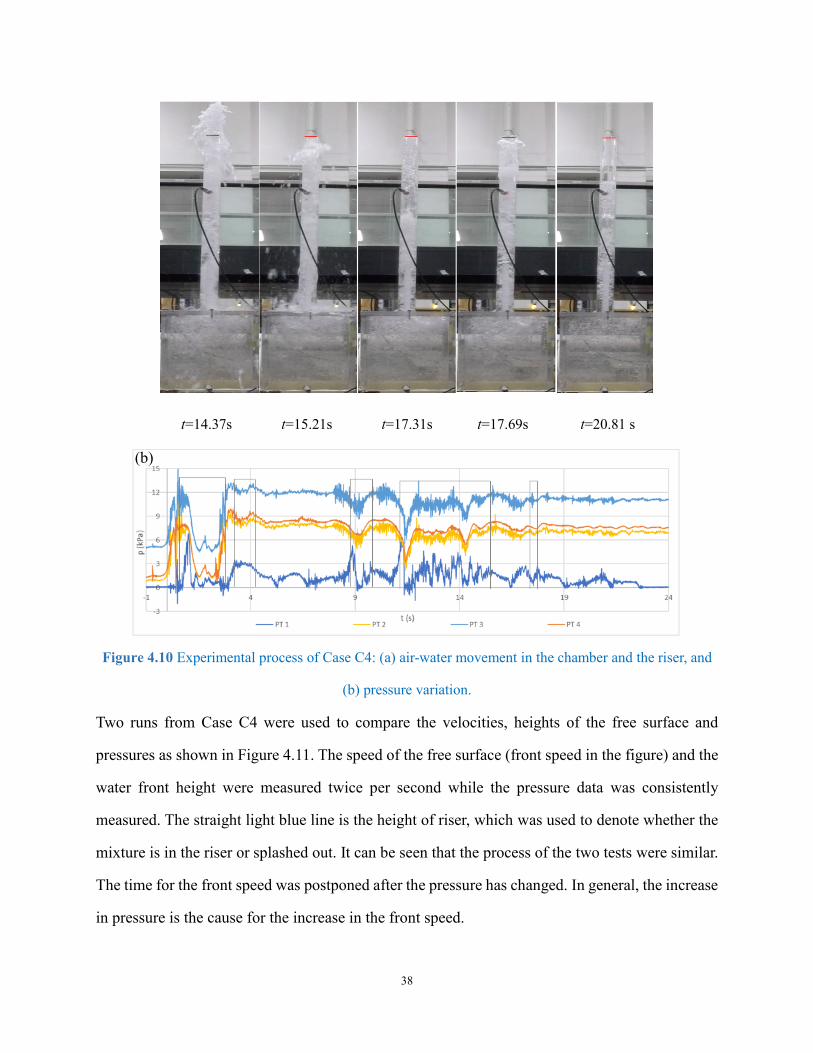
38
Figure 4.10 Experimental process of Case C4: (a) air-water movement in the chamber and the riser, and
(b) pressure variation.
Two runs from Case C4 were used to compare the velocities, heights of the free surface and
pressures as shown in Figure 4.11. The speed of the free surface (front speed in the figure) and the
water front height were measured twice per second while the pressure data was consistently
measured. The straight light blue line is the height of riser, which was used to denote whether the
mixture is in the riser or splashed out. It can be seen that the process of the two tests were similar.
The time for the front speed was postponed after the pressure has changed. In general, the increase
in pressure is the cause for the increase in the front speed.
t=14.37s t=15.21s t=17.31s t=17.69s t=20.81 s
(b)
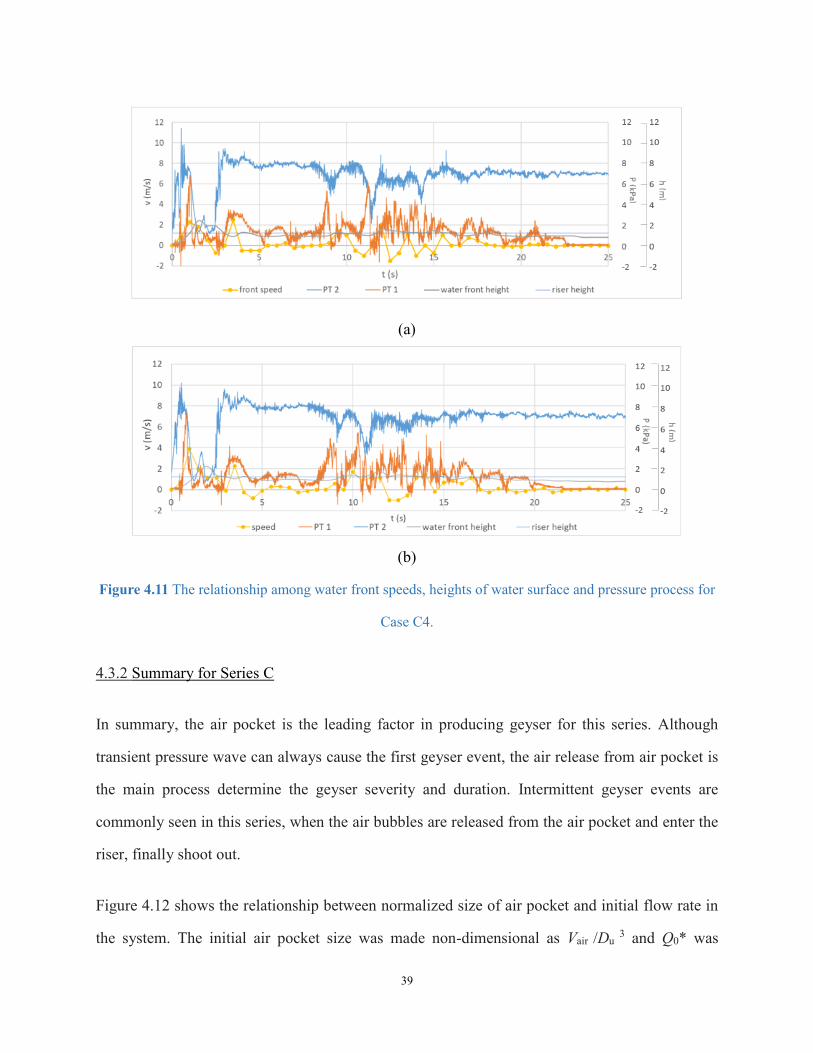
39
(a)
(b)
Figure 4.11 The relationship among water front speeds, heights of water surface and pressure process for
Case C4.
4.3.2 Summary for Series C
In summary, the air pocket is the leading factor in producing geyser for this series. Although
transient pressure wave can always cause the first geyser event, the air release from air pocket is
the main process determine the geyser severity and duration. Intermittent geyser events are
commonly seen in this series, when the air bubbles are released from the air pocket and enter the
riser, finally shoot out.
Figure 4.12 shows the relationship between normalized size of air pocket and initial flow rate in
the system. The initial air pocket size was made non-dimensional as Vair /Du 3 and Q0* was
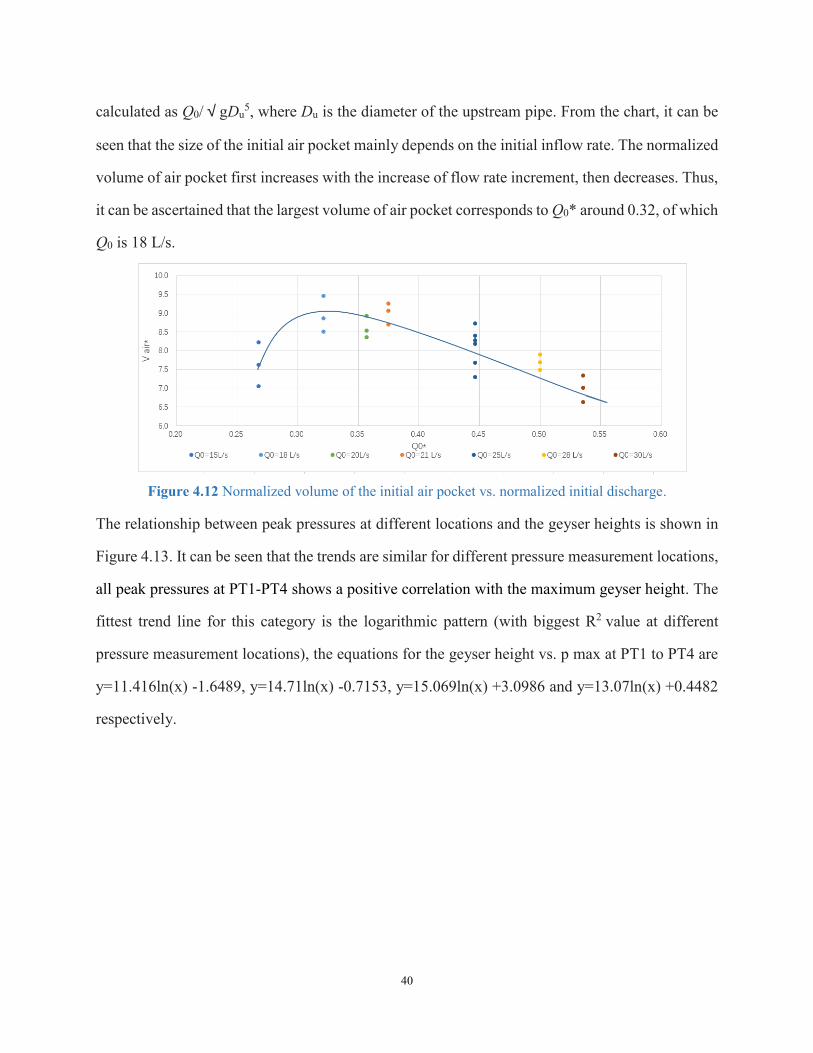
40
calculated as Q0/√gDu5, where Du is the diameter of the upstream pipe. From the chart, it can be
seen that the size of the initial air pocket mainly depends on the initial inflow rate. The normalized
volume of air pocket first increases with the increase of flow rate increment, then decreases. Thus,
it can be ascertained that the largest volume of air pocket corresponds to Q0* around 0.32, of which
Q0 is 18 L/s.
Figure 4.12 Normalized volume of the initial air pocket vs. normalized initial discharge.
The relationship between peak pressures at different locations and the geyser heights is shown in
Figure 4.13. It can be seen that the trends are similar for different pressure measurement locations,
all peak pressures at PT1-PT4 shows a positive correlation with the maximum geyser height. The
fittest trend line for this category is the logarithmic pattern (with biggest R2 value at different
pressure measurement locations), the equations for the geyser height vs. p max at PT1 to PT4 are
y=11.416ln(x) -1.6489, y=14.71ln(x) -0.7153, y=15.069ln(x) +3.0986 and y=13.07ln(x) +0.4482
respectively.
41
Figure 4.13 Peak pressures at different locations vs. geyser heights for downstream full pipe flow with
submerged chamber (Series C)
4.4 Discussion on Geyser Mechanism
For Series A which has a free surface flow in the downstream pipe and a free surface/full pipe flow
in the upstream pipe, no visual geyser is seen. As water depth in the downstream pipe is low, the
increased flow rate could pass quickly with enough space after the ball valve is opened. If the
upstream pipe has a full pipe flow initially, the increase in flow rate is smaller, and would have
less impact on the flow in the downstream pipe.
Cases in Series B have a full pressurized pipe flow in the downstream pipe and a partially filled
chamber while flow in upstream could either be free surface or full pipe flow depending on the
initial inflow rate. For upstream free surface initially, the rapid filling flow would form and moves
quickly towards the chamber when the ball valve is fully opened. When surge front reached the
chamber, stroke on the chamber wall and curved back, the air brought into the chamber from
upstream pipe was compressed, causing pressure rise at PT2-PT4, and when the compressed air
tends to move upwards through the riser, geyser could happen. In this series, a single geyser might
occur for free surface flow in the upstream pipe initially cases because ΔQ is larger, and only two
geysers are observed for pressurized full pipe flow in the upstream pipe initially because ΔQ is
smaller.
42
Cases in Series C has an air pocket entrapped in the upstream initially for all tests. Because tailgate
is used to limit the flow capacity in the system, the system would be pressurized throughout the
experiment. Two kinds of geyser can always happen for this series, the first is transient pressure
wave pushing the thin layer of air on the pipe crown into chamber and riser, and the second is the
air releasing from the air pocket. As air pocket is formed by the hydraulic jump, a thin layer of air
can be seen between the head of air pocket and chamber. When the thin layer of air encounters the
transient pressure change, it would be pushed into the chamber. Due to buoyancy, the thin layer of
air tends to occupy the upper portion of the chamber, along with water and then it would enter into
the riser and shoot out of the riser. Air cavity usually happens after the releasing of the thin layer
of air, which is caused by the pressure in the chamber not enough to lift mixture in the riser to go
up and shoot out through the riser. During this process, the head of the air pocket was pushed back
towards the valve. When the head of the air pocket encountered the flow with increased inflow
rate that is moving towards the chamber, the head of the air pocket would change its moving
direction as the moving flow with increased inflow rate has more momentum. When the entire air
pocket started to move towards the chamber, the second form of geyser may occur, which is caused
by air releasing from the air pocket. As a vertical corner existed at the connection of the upstream
pipe and the chamber, the air bubbles from the main air pocket would be released into chamber
one by one and it would occupy the top of the chamber, then it would move upwards in the riser
and intermittent geyser events would happen.
In summary, in terms of geyser severity, likelihood to happen and amount of water splashed out,
Series C would produce most severe geyser, while Series A has the lowest possibility of geyser
occurrence. As there is no visual geyser in Series A, this category is not considered for retrofitting.
Table 4.1 is a summary of geyser heights and peak pressures for Series B. For same inflow rate,
maximum geyser height and peak pressure would increase as final inflow rate become larger. For
the same final inflow rate, the peak pressure and maximum geyser height would decrease as the
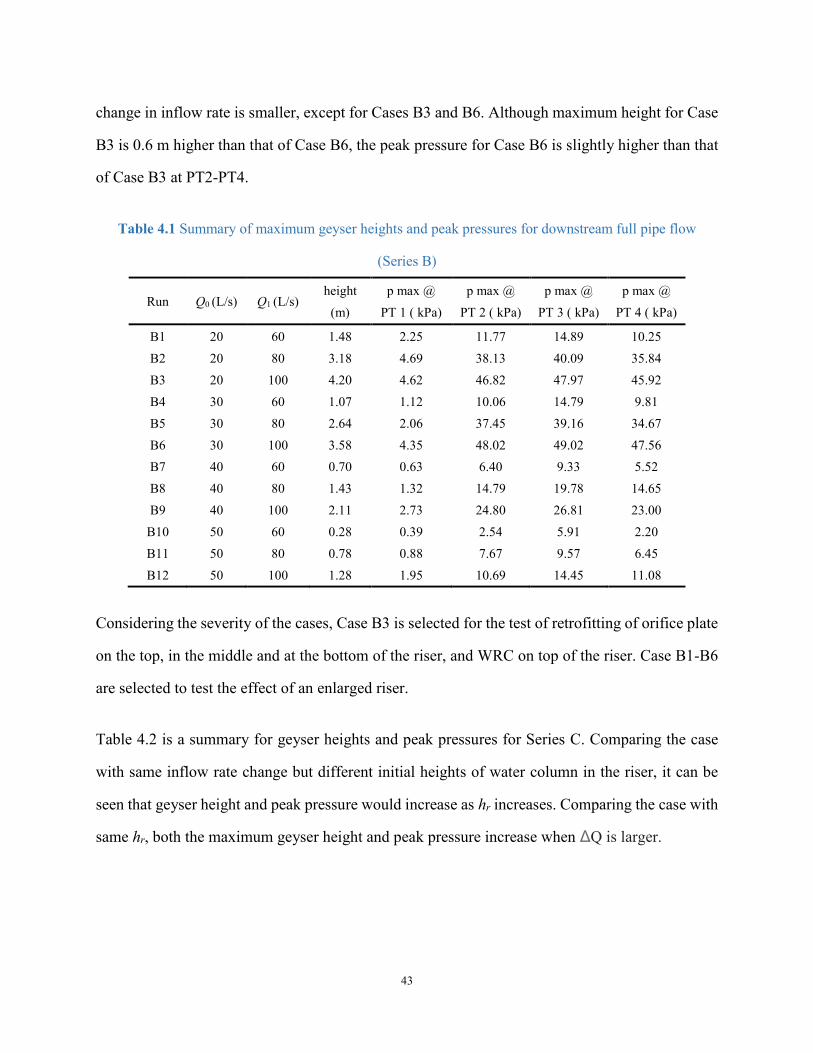
43
change in inflow rate is smaller, except for Cases B3 and B6. Although maximum height for Case
B3 is 0.6 m higher than that of Case B6, the peak pressure for Case B6 is slightly higher than that
of Case B3 at PT2-PT4.
Table 4.1 Summary of maximum geyser heights and peak pressures for downstream full pipe flow
(Series B)
Run Q0 (L/s) Q1 (L/s) height
(m)
p max @
PT 1 ( kPa)
p max @
PT 2 ( kPa)
p max @
PT 3 ( kPa)
p max @
PT 4 ( kPa)
B1 20 60 1.48 2.25 11.77 14.89 10.25
B2 20 80 3.18 4.69 38.13 40.09 35.84
B3 20 100 4.20 4.62 46.82 47.97 45.92
B4 30 60 1.07 1.12 10.06 14.79 9.81
B5 30 80 2.64 2.06 37.45 39.16 34.67
B6 30 100 3.58 4.35 48.02 49.02 47.56
B7 40 60 0.70 0.63 6.40 9.33 5.52
B8 40 80 1.43 1.32 14.79 19.78 14.65
B9 40 100 2.11 2.73 24.80 26.81 23.00
B10 50 60 0.28 0.39 2.54 5.91 2.20
B11 50 80 0.78 0.88 7.67 9.57 6.45
B12 50 100 1.28 1.95 10.69 14.45 11.08
Considering the severity of the cases, Case B3 is selected for the test of retrofitting of orifice plate
on the top, in the middle and at the bottom of the riser, and WRC on top of the riser. Case B1-B6
are selected to test the effect of an enlarged riser.
Table 4.2 is a summary for geyser heights and peak pressures for Series C. Comparing the case
with same inflow rate change but different initial heights of water column in the riser, it can be
seen that geyser height and peak pressure would increase as hr increases. Comparing the case with
same hr, both the maximum geyser height and peak pressure increase when ΔQ is larger.
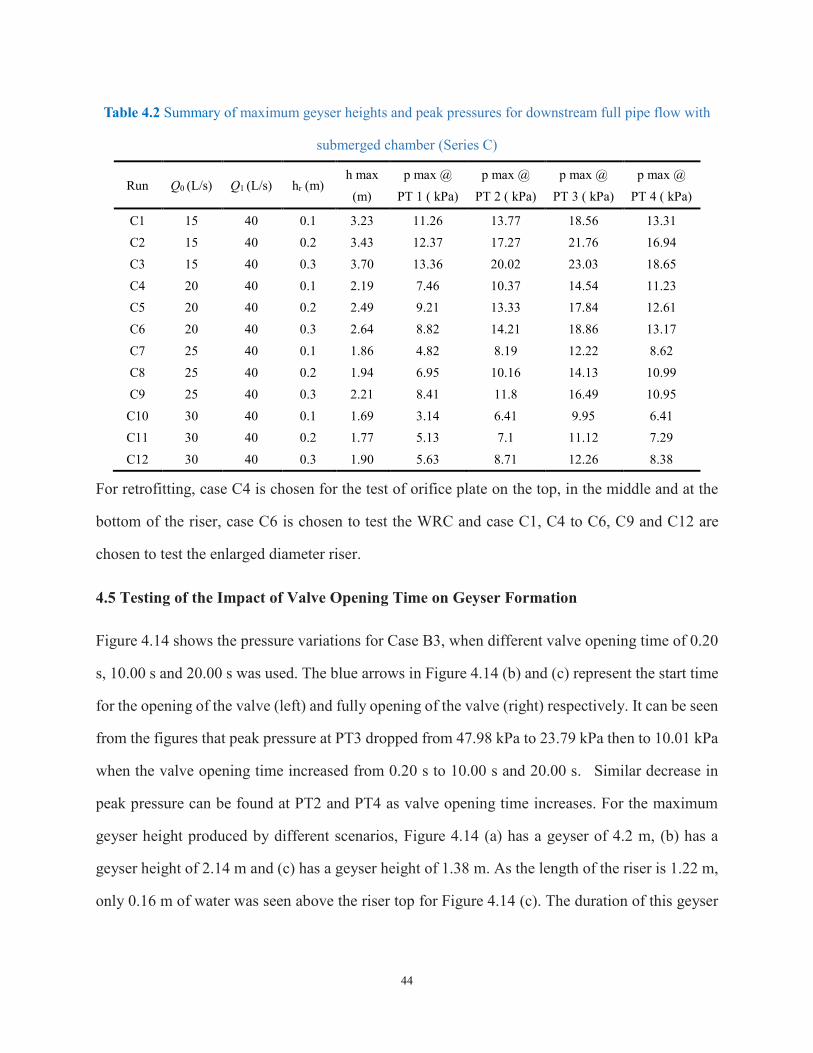
44
Table 4.2 Summary of maximum geyser heights and peak pressures for downstream full pipe flow with
submerged chamber (Series C)
Run Q0 (L/s) Q1 (L/s) hr (m) h max
(m)
p max @
PT 1 ( kPa)
p max @
PT 2 ( kPa)
p max @
PT 3 ( kPa)
p max @
PT 4 ( kPa)
C1 15 40 0.1 3.23 11.26 13.77 18.56 13.31
C2 15 40 0.2 3.43 12.37 17.27 21.76 16.94
C3 15 40 0.3 3.70 13.36 20.02 23.03 18.65
C4 20 40 0.1 2.19 7.46 10.37 14.54 11.23
C5 20 40 0.2 2.49 9.21 13.33 17.84 12.61
C6 20 40 0.3 2.64 8.82 14.21 18.86 13.17
C7 25 40 0.1 1.86 4.82 8.19 12.22 8.62
C8 25 40 0.2 1.94 6.95 10.16 14.13 10.99
C9 25 40 0.3 2.21 8.41 11.8 16.49 10.95
C10 30 40 0.1 1.69 3.14 6.41 9.95 6.41
C11 30 40 0.2 1.77 5.13 7.1 11.12 7.29
C12 30 40 0.3 1.90 5.63 8.71 12.26 8.38
For retrofitting, case C4 is chosen for the test of orifice plate on the top, in the middle and at the
bottom of the riser, case C6 is chosen to test the WRC and case C1, C4 to C6, C9 and C12 are
chosen to test the enlarged diameter riser.
4.5 Testing of the Impact of Valve Opening Time on Geyser Formation
Figure 4.14 shows the pressure variations for Case B3, when different valve opening time of 0.20
s, 10.00 s and 20.00 s was used. The blue arrows in Figure 4.14 (b) and (c) represent the start time
for the opening of the valve (left) and fully opening of the valve (right) respectively. It can be seen
from the figures that peak pressure at PT3 dropped from 47.98 kPa to 23.79 kPa then to 10.01 kPa
when the valve opening time increased from 0.20 s to 10.00 s and 20.00 s. Similar decrease in
peak pressure can be found at PT2 and PT4 as valve opening time increases. For the maximum
geyser height produced by different scenarios, Figure 4.14 (a) has a geyser of 4.2 m, (b) has a
geyser height of 2.14 m and (c) has a geyser height of 1.38 m. As the length of the riser is 1.22 m,
only 0.16 m of water was seen above the riser top for Figure 4.14 (c). The duration of this geyser

45
event is short and only small amount of water shoot out through the riser. So if the valve opening
time is further increased, it is anticipated that geyser event can be eliminated.
(a)
(b)
(c)
Figure 4.14 Pressure variations for Case B3 under different valve opening times: (a) t=0.2 s, (b) t=10 s,
(c) t=20 s.
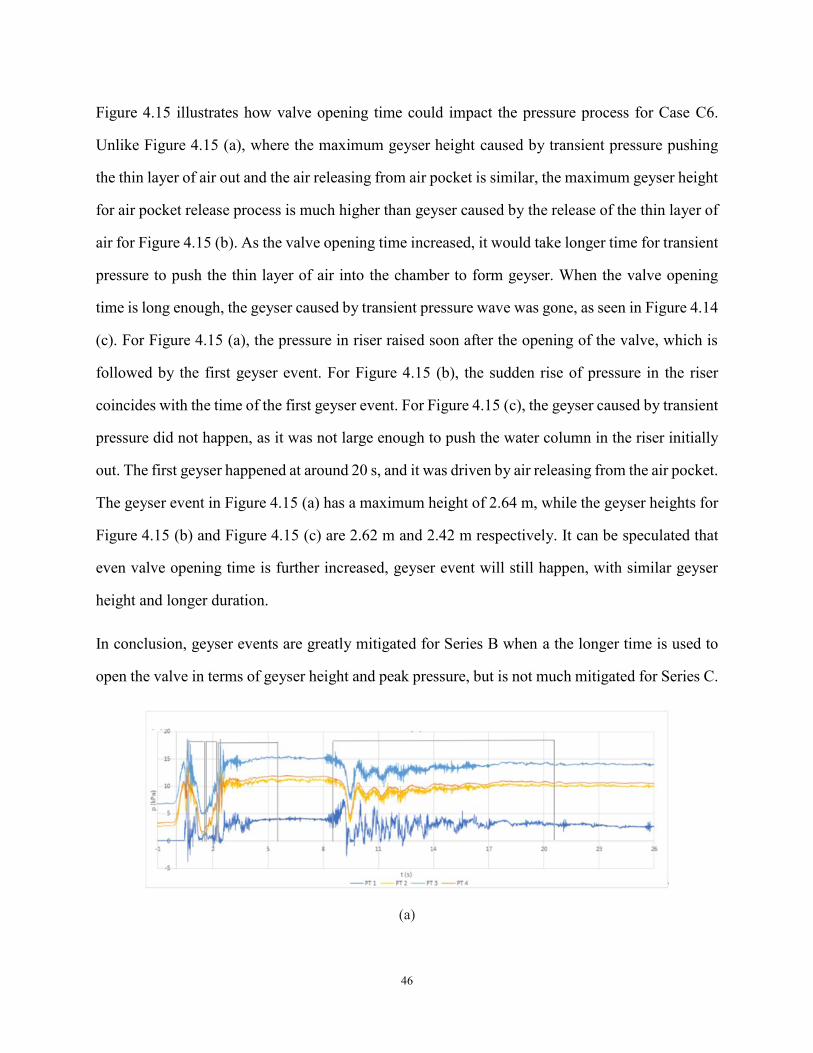
46
Figure 4.15 illustrates how valve opening time could impact the pressure process for Case C6.
Unlike Figure 4.15 (a), where the maximum geyser height caused by transient pressure pushing
the thin layer of air out and the air releasing from air pocket is similar, the maximum geyser height
for air pocket release process is much higher than geyser caused by the release of the thin layer of
air for Figure 4.15 (b). As the valve opening time increased, it would take longer time for transient
pressure to push the thin layer of air into the chamber to form geyser. When the valve opening
time is long enough, the geyser caused by transient pressure wave was gone, as seen in Figure 4.14
(c). For Figure 4.15 (a), the pressure in riser raised soon after the opening of the valve, which is
followed by the first geyser event. For Figure 4.15 (b), the sudden rise of pressure in the riser
coincides with the time of the first geyser event. For Figure 4.15 (c), the geyser caused by transient
pressure did not happen, as it was not large enough to push the water column in the riser initially
out. The first geyser happened at around 20 s, and it was driven by air releasing from the air pocket.
The geyser event in Figure 4.15 (a) has a maximum height of 2.64 m, while the geyser heights for
Figure 4.15 (b) and Figure 4.15 (c) are 2.62 m and 2.42 m respectively. It can be speculated that
even valve opening time is further increased, geyser event will still happen, with similar geyser
height and longer duration.
In conclusion, geyser events are greatly mitigated for Series B when a the longer time is used to
open the valve in terms of geyser height and peak pressure, but is not much mitigated for Series C.
(a)
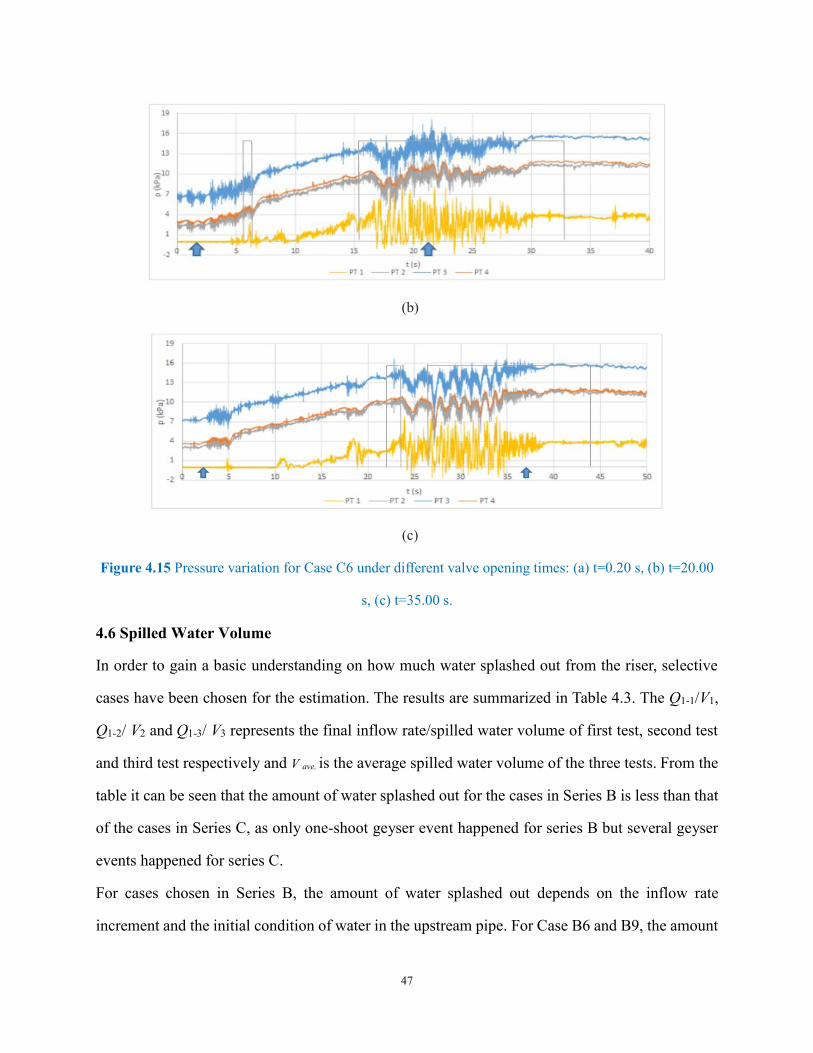
47
(b)
(c)
Figure 4.15 Pressure variation for Case C6 under different valve opening times: (a) t=0.20 s, (b) t=20.00
s, (c) t=35.00 s.
4.6 Spilled Water Volume
In order to gain a basic understanding on how much water splashed out from the riser, selective
cases have been chosen for the estimation. The results are summarized in Table 4.3. The Q1-1/V1,
Q1-2/ V2 and Q1-3/ V3 represents the final inflow rate/spilled water volume of first test, second test
and third test respectively and V ave. is the average spilled water volume of the three tests. From the
table it can be seen that the amount of water splashed out for the cases in Series B is less than that
of the cases in Series C, as only one-shoot geyser event happened for series B but several geyser
events happened for series C.
For cases chosen in Series B, the amount of water splashed out depends on the inflow rate
increment and the initial condition of water in the upstream pipe. For Case B6 and B9, the amount
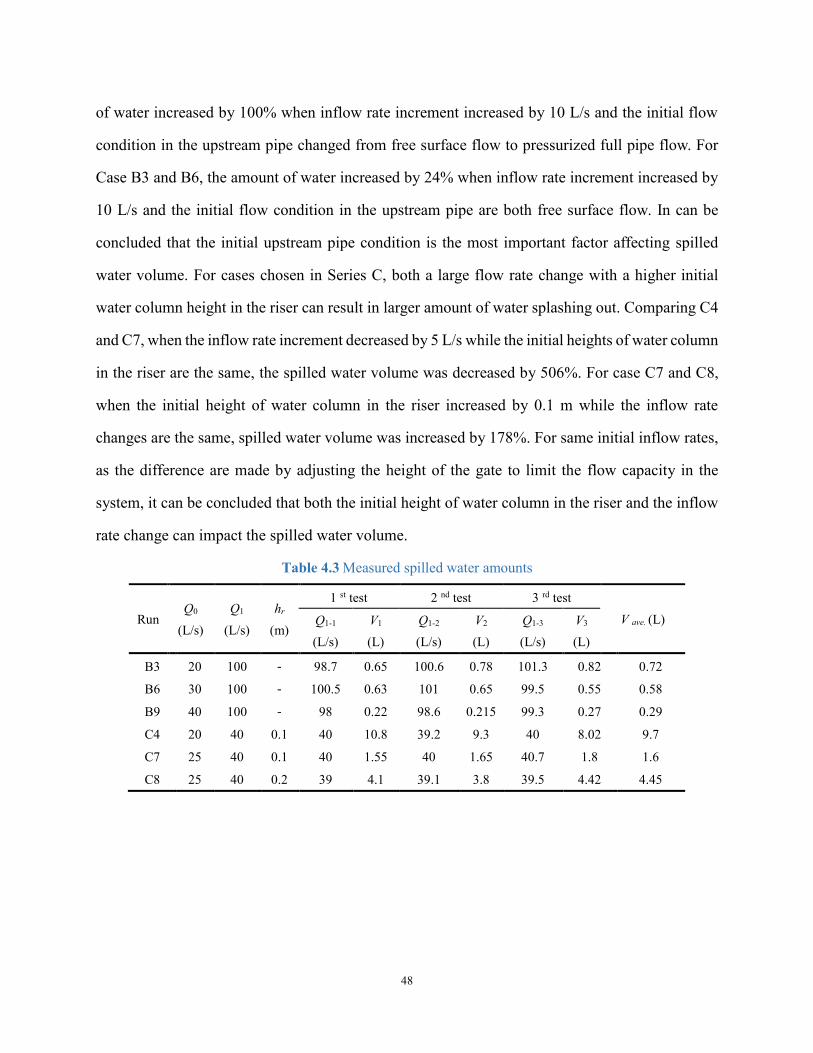
48
of water increased by 100% when inflow rate increment increased by 10 L/s and the initial flow
condition in the upstream pipe changed from free surface flow to pressurized full pipe flow. For
Case B3 and B6, the amount of water increased by 24% when inflow rate increment increased by
10 L/s and the initial flow condition in the upstream pipe are both free surface flow. In can be
concluded that the initial upstream pipe condition is the most important factor affecting spilled
water volume. For cases chosen in Series C, both a large flow rate change with a higher initial
water column height in the riser can result in larger amount of water splashing out. Comparing C4
and C7, when the inflow rate increment decreased by 5 L/s while the initial heights of water column
in the riser are the same, the spilled water volume was decreased by 506%. For case C7 and C8,
when the initial height of water column in the riser increased by 0.1 m while the inflow rate
changes are the same, spilled water volume was increased by 178%. For same initial inflow rates,
as the difference are made by adjusting the height of the gate to limit the flow capacity in the
system, it can be concluded that both the initial height of water column in the riser and the inflow
rate change can impact the spilled water volume.
Table 4.3 Measured spilled water amounts
Run Q0
(L/s)
Q1
(L/s)
hr
(m)
1 st test 2 nd test 3 rd test
V ave. (L) Q1-1
(L/s)
V1
(L)
Q1-2
(L/s)
V2
(L)
Q1-3
(L/s)
V3
(L)
B3 20 100 - 98.7 0.65 100.6 0.78 101.3 0.82 0.72
B6 30 100 - 100.5 0.63 101 0.65 99.5 0.55 0.58
B9 40 100 - 98 0.22 98.6 0.215 99.3 0.27 0.29
C4 20 40 0.1 40 10.8 39.2 9.3 40 8.02 9.7
C7 25 40 0.1 40 1.55 40 1.65 40.7 1.8 1.6
C8 25 40 0.2 39 4.1 39.1 3.8 39.5 4.42 4.45
49
5. Experimental Results on Geyser Mitigation Measures
5.1. Results and Discussions on Mitigation Methods Applied to Series B
5.1.1 Orifice plate applied to Case B3 (Series D)
For case B3, the orifice sizes of 6 mm, 12 mm and 30 mm have been applied to the top, middle
and bottom of the riser. The fully sealed case on the top end of the riser is also tested.
5.1.1.1 Adding orifice plate on top of the riser for Series B (Case D1-1 to D1-4)
Figure 5.1-Figure 5.4 show how orifice plate at the top of the riser could influence the pressure
variation for case B3.
For cases D1-1 to D1-4, one phenomenon worth noting is that the pressures at all pressure
measurement locations started to rise at around -0.15 s, which corresponds to the starting time of
opening valve. The reason behind that is the air in the riser, chamber and upstream pipe has already
been compressed before further turning up of the valve, as the air was constrained to escape from
the top of the riser.
Figure 5.1 is the pressure process and air-water movement in the chamber and riser for Cases D1-
1. As the top of the riser is fully sealed for this case, water could not shoot out through the riser. A
rise in water level in the chamber was seen at -0.11 s, which caused the compression of air, and
resulted in pressure rise at PT1-PT4. When the ball valve is fully opened, the rapidly filling front
would propagate towards the chamber, as the air in the chamber, riser and upstream pipe is
connected, the pressure variations at PT1, PT2 and PT4 are identical. At around 0.41 s, the
compressed air started to expand and pushed some of the air into the downstream pipe, resulted in
pressure decrease. The air was compressed for the second time from around 1.17 s to 1.52 s, when
the flow with increased inflow rate was continuously fed into the chamber, the pressure riser
caused by the compression of air was less than that in the first time due to the smaller upstream
transient pressure. More air was brought into the downstream pipe along with a chaotic mixture of
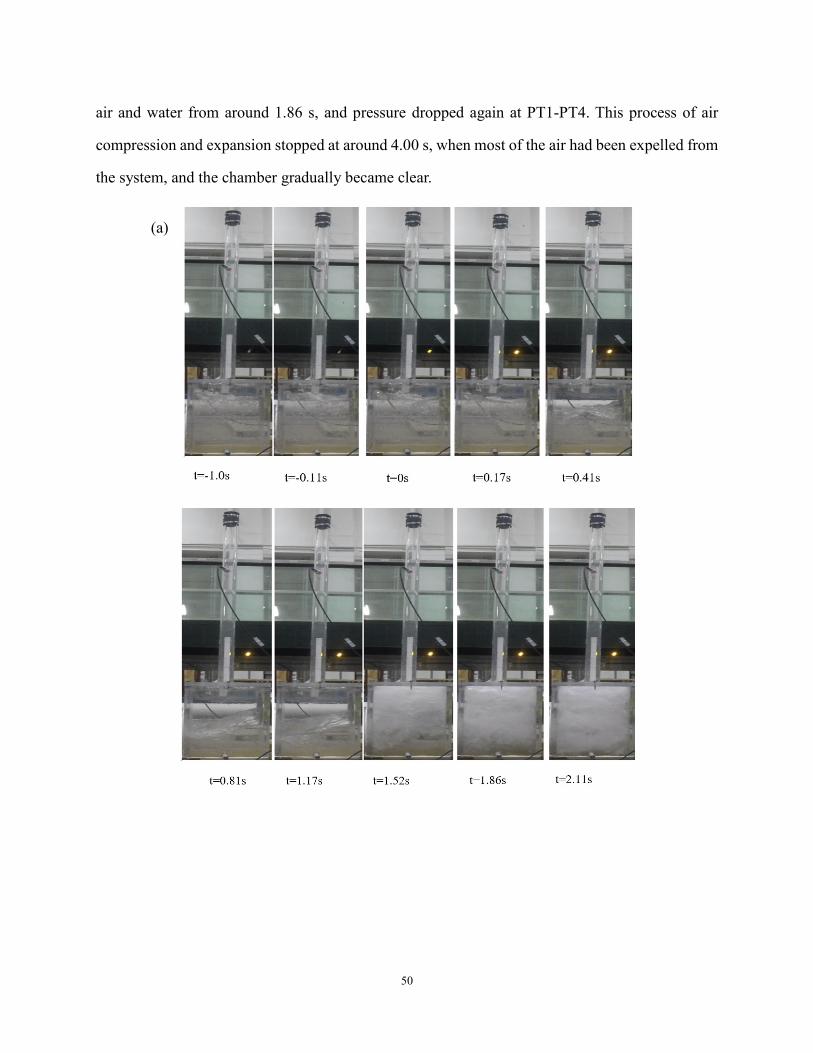
50
air and water from around 1.86 s, and pressure dropped again at PT1-PT4. This process of air
compression and expansion stopped at around 4.00 s, when most of the air had been expelled from
the system, and the chamber gradually became clear.
(a)
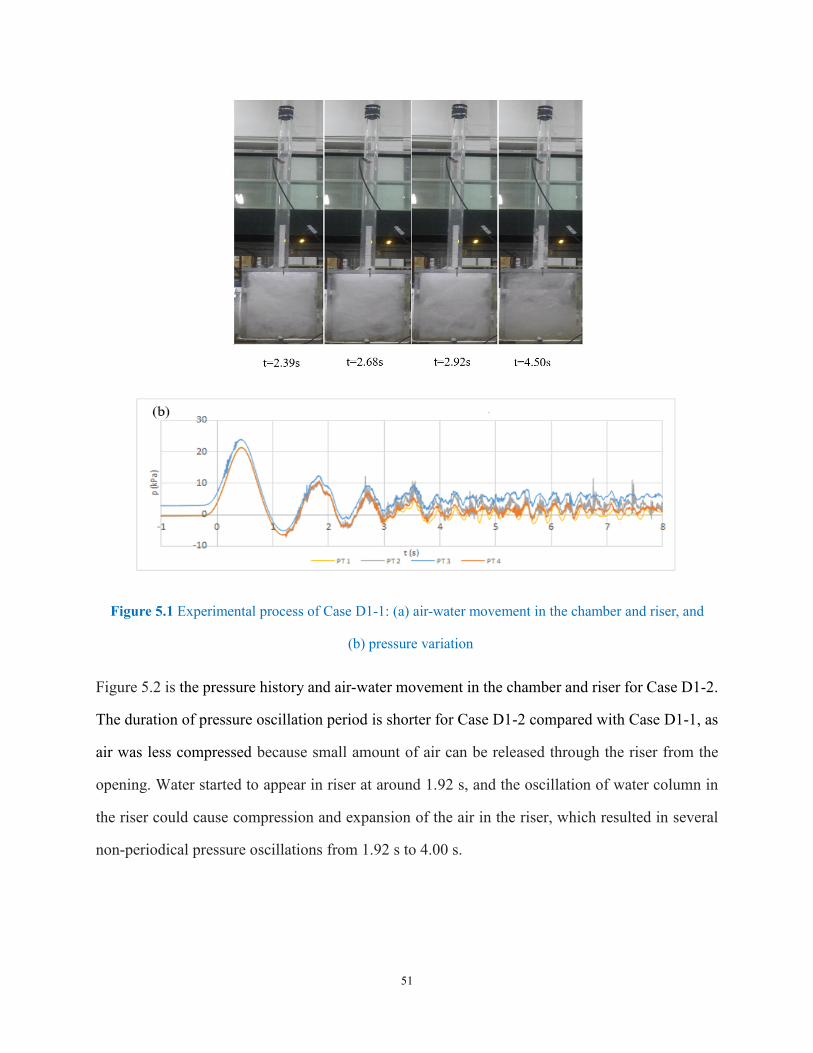
51
Figure 5.1 Experimental process of Case D1-1: (a) air-water movement in the chamber and riser, and
(b) pressure variation
Figure 5.2 is the pressure history and air-water movement in the chamber and riser for Case D1-2.
The duration of pressure oscillation period is shorter for Case D1-2 compared with Case D1-1, as
air was less compressed because small amount of air can be released through the riser from the
opening. Water started to appear in riser at around 1.92 s, and the oscillation of water column in
the riser could cause compression and expansion of the air in the riser, which resulted in several
non-periodical pressure oscillations from 1.92 s to 4.00 s.
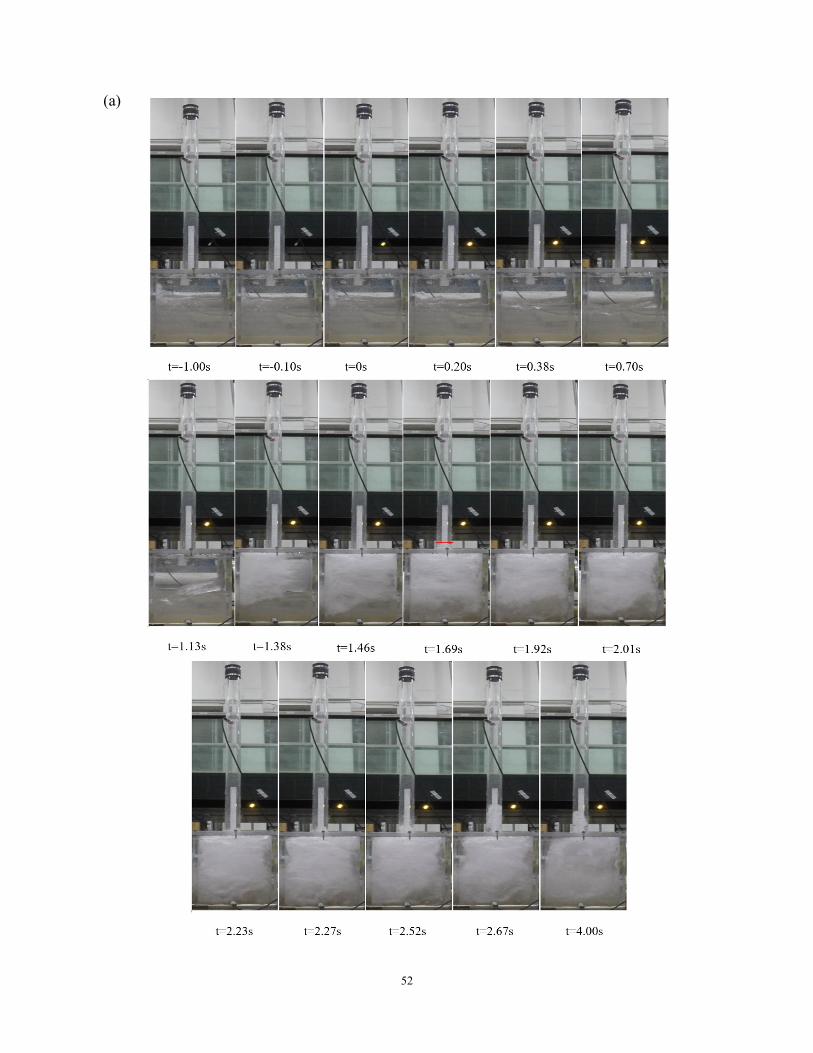
52
(a)
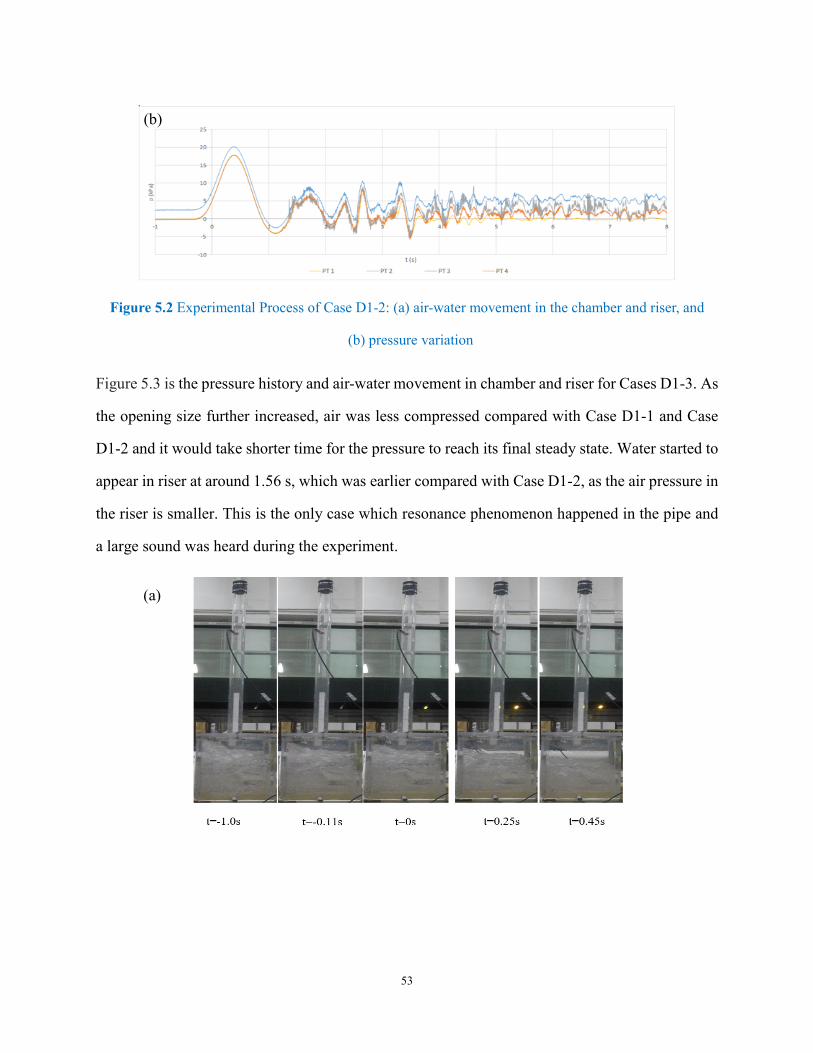
53
Figure 5.2 Experimental Process of Case D1-2: (a) air-water movement in the chamber and riser, and
(b) pressure variation
Figure 5.3 is the pressure history and air-water movement in chamber and riser for Cases D1-3. As
the opening size further increased, air was less compressed compared with Case D1-1 and Case
D1-2 and it would take shorter time for the pressure to reach its final steady state. Water started to
appear in riser at around 1.56 s, which was earlier compared with Case D1-2, as the air pressure in
the riser is smaller. This is the only case which resonance phenomenon happened in the pipe and
a large sound was heard during the experiment.
(a)
(b)
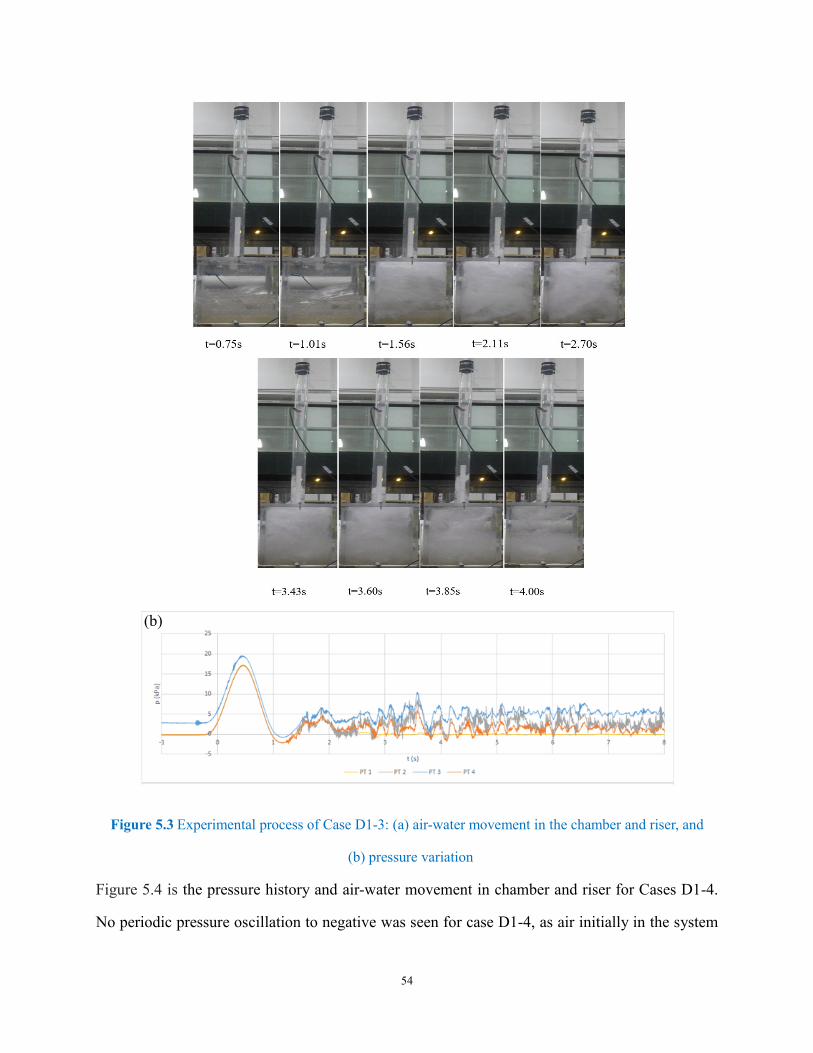
54
Figure 5.3 Experimental process of Case D1-3: (a) air-water movement in the chamber and riser, and
(b) pressure variation
Figure 5.4 is the pressure history and air-water movement in chamber and riser for Cases D1-4.
No periodic pressure oscillation to negative was seen for case D1-4, as air initially in the system
(b)
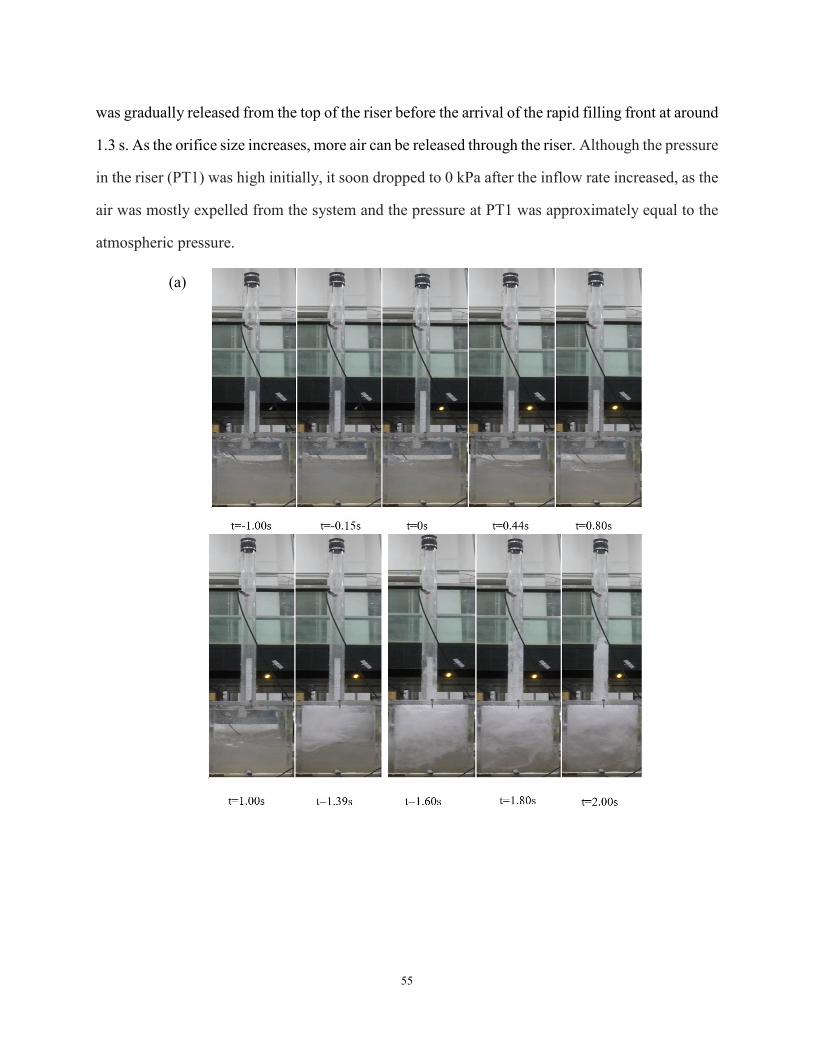
55
was gradually released from the top of the riser before the arrival of the rapid filling front at around
1.3 s. As the orifice size increases, more air can be released through the riser. Although the pressure
in the riser (PT1) was high initially, it soon dropped to 0 kPa after the inflow rate increased, as the
air was mostly expelled from the system and the pressure at PT1 was approximately equal to the
atmospheric pressure.
(a)

56
Figure 5.4 Experimental process of Case D1-4: (a) air-water movement in the chamber and riser, and
(b) pressure variation
In summary, geyser event did not happen for D1 cases. From Cases D1-1 to D1-4, it can be
concluded that the peak pressure in the riser decreases as the orifice size increases, as smaller
(b)
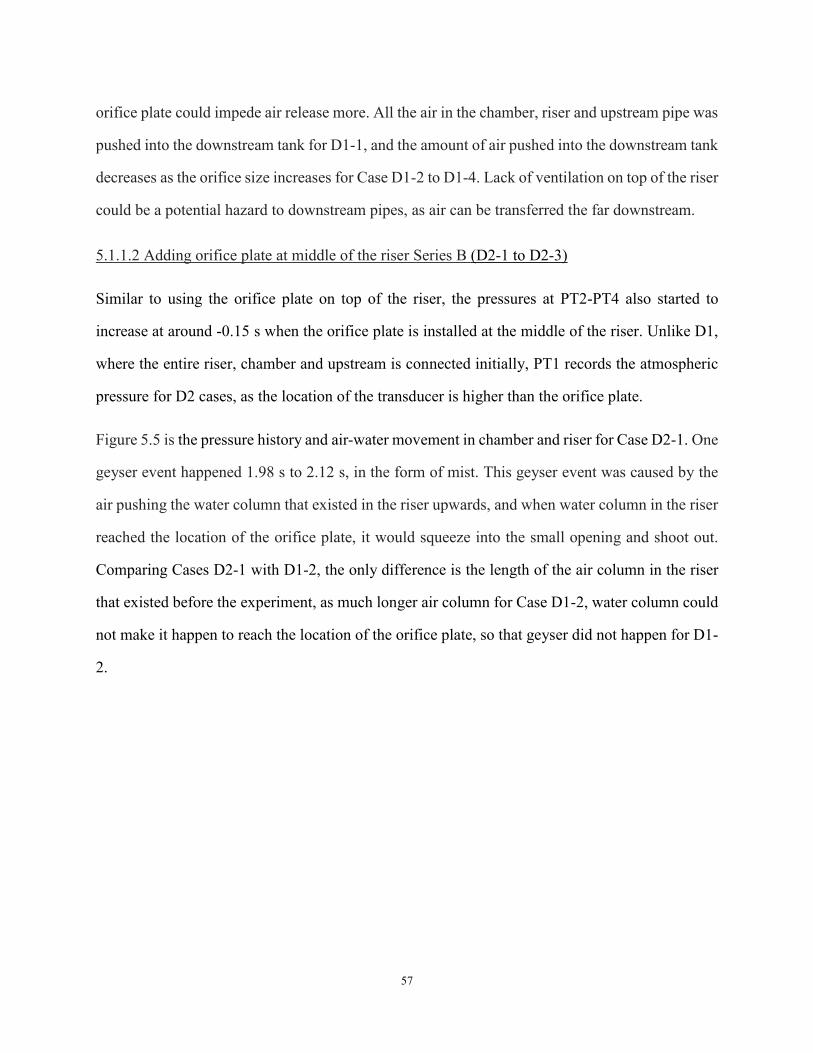
57
orifice plate could impede air release more. All the air in the chamber, riser and upstream pipe was
pushed into the downstream tank for D1-1, and the amount of air pushed into the downstream tank
decreases as the orifice size increases for Case D1-2 to D1-4. Lack of ventilation on top of the riser
could be a potential hazard to downstream pipes, as air can be transferred the far downstream.
5.1.1.2 Adding orifice plate at middle of the riser Series B (D2-1 to D2-3)
Similar to using the orifice plate on top of the riser, the pressures at PT2-PT4 also started to
increase at around -0.15 s when the orifice plate is installed at the middle of the riser. Unlike D1,
where the entire riser, chamber and upstream is connected initially, PT1 records the atmospheric
pressure for D2 cases, as the location of the transducer is higher than the orifice plate.
Figure 5.5 is the pressure history and air-water movement in chamber and riser for Case D2-1. One
geyser event happened 1.98 s to 2.12 s, in the form of mist. This geyser event was caused by the
air pushing the water column that existed in the riser upwards, and when water column in the riser
reached the location of the orifice plate, it would squeeze into the small opening and shoot out.
Comparing Cases D2-1 with D1-2, the only difference is the length of the air column in the riser
that existed before the experiment, as much longer air column for Case D1-2, water column could
not make it happen to reach the location of the orifice plate, so that geyser did not happen for D1-
2.
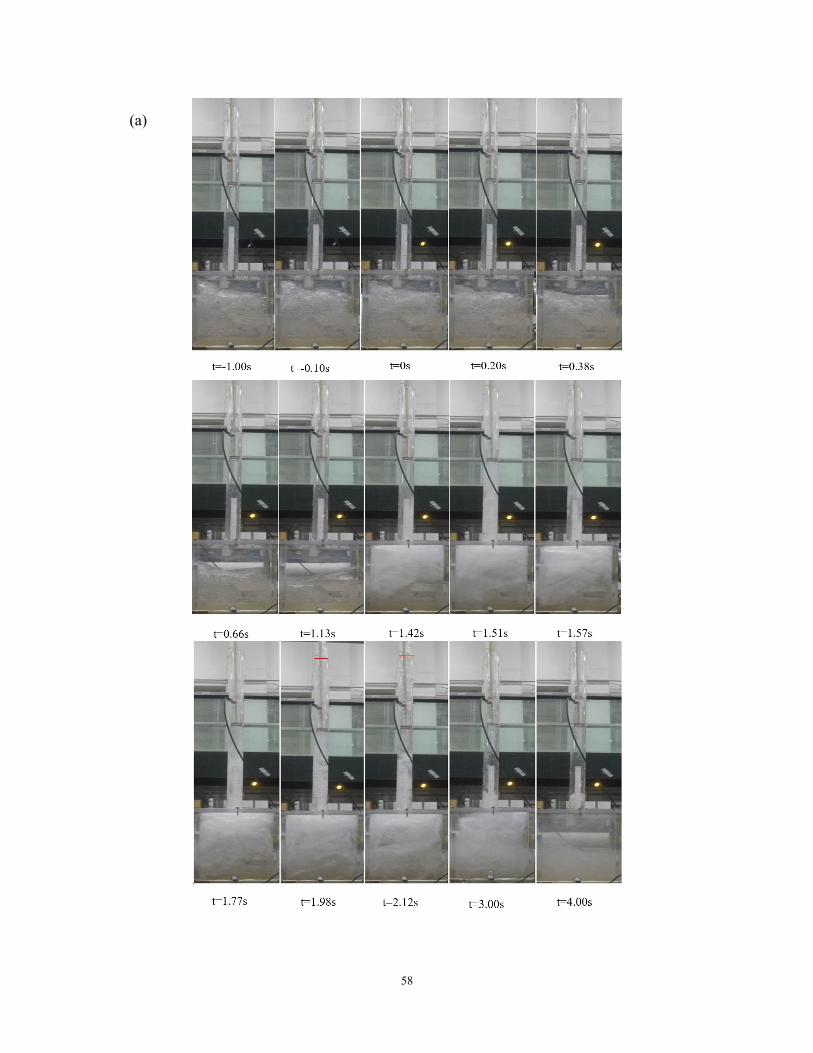
58
(a)
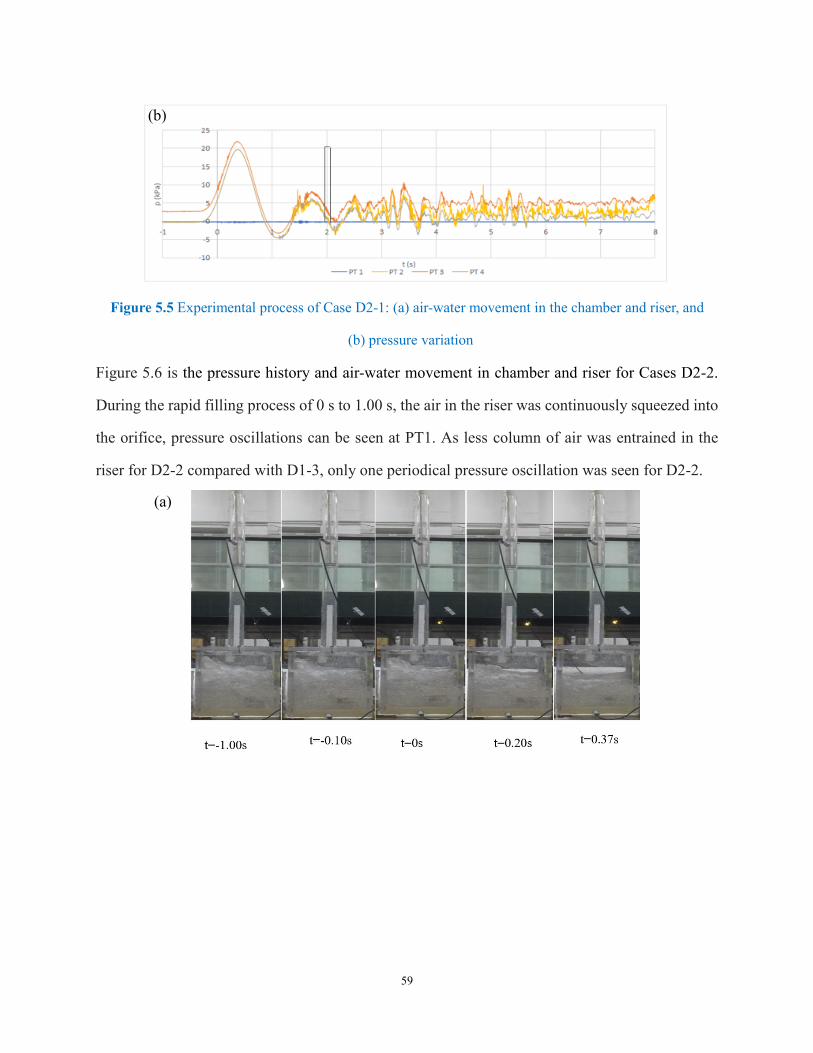
59
Figure 5.5 Experimental process of Case D2-1: (a) air-water movement in the chamber and riser, and
(b) pressure variation
Figure 5.6 is the pressure history and air-water movement in chamber and riser for Cases D2-2.
During the rapid filling process of 0 s to 1.00 s, the air in the riser was continuously squeezed into
the orifice, pressure oscillations can be seen at PT1. As less column of air was entrained in the
riser for D2-2 compared with D1-3, only one periodical pressure oscillation was seen for D2-2.
(b)
(a)
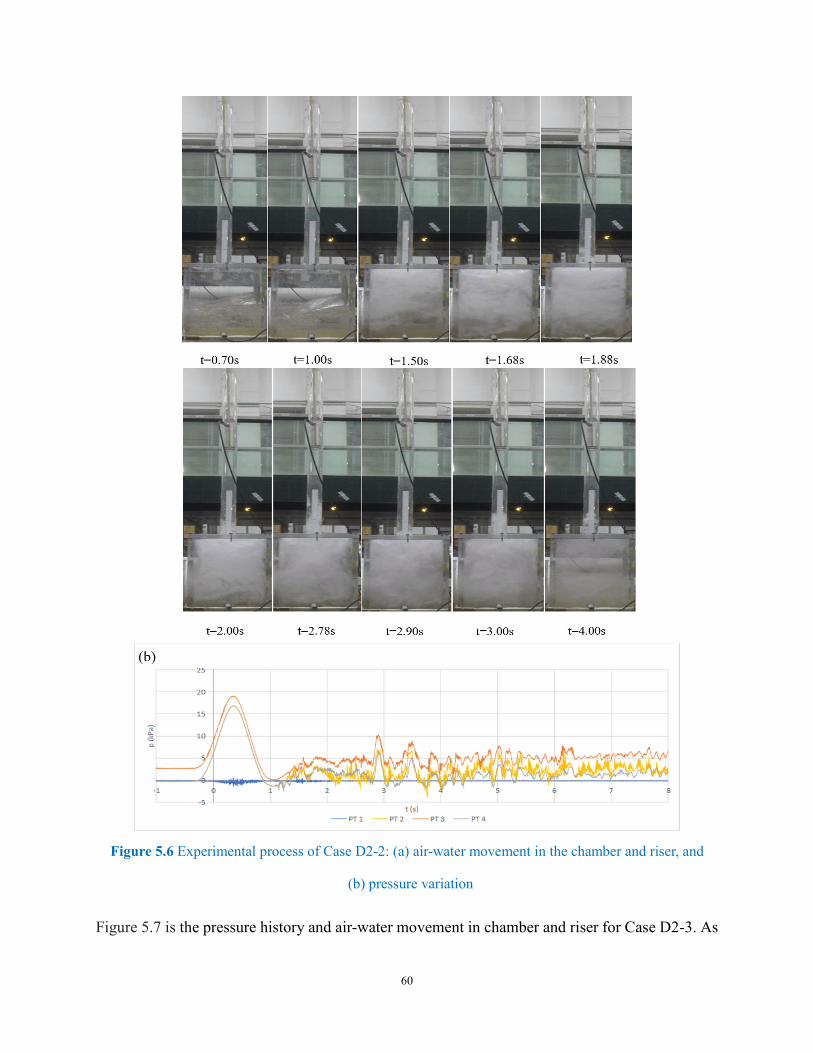
60
Figure 5.6 Experimental process of Case D2-2: (a) air-water movement in the chamber and riser, and
(b) pressure variation
Figure 5.7 is the pressure history and air-water movement in chamber and riser for Case D2-3. As
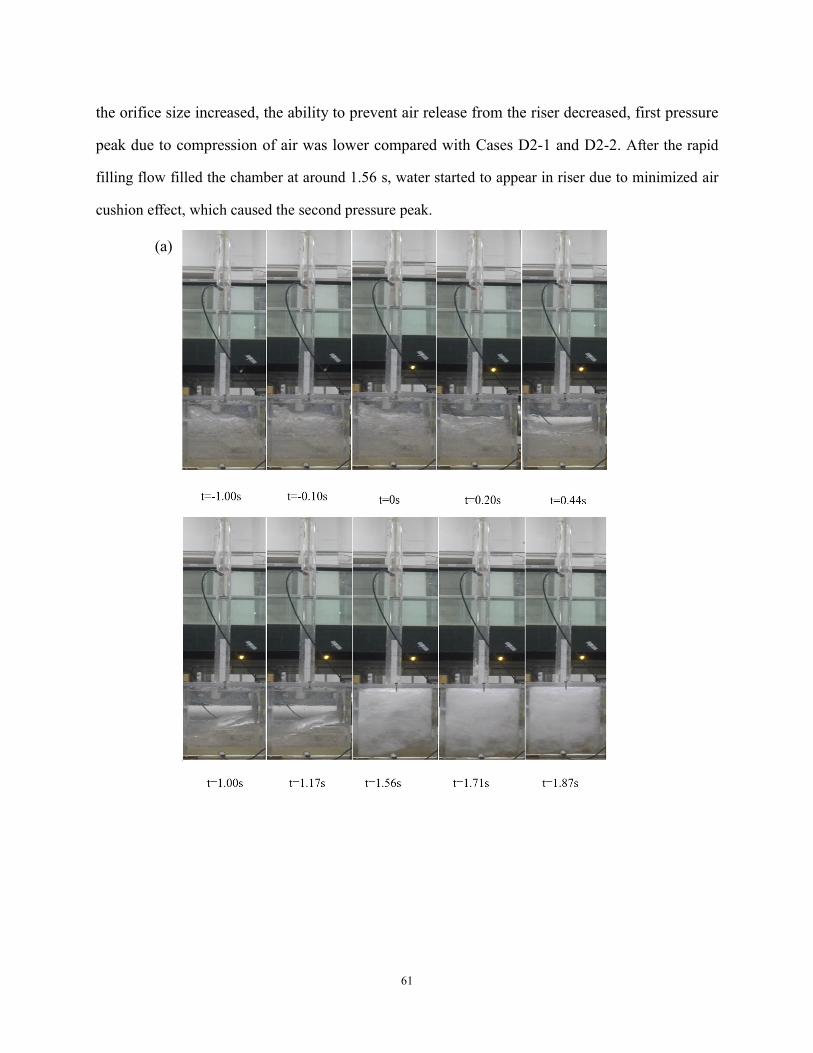
61
the orifice size increased, the ability to prevent air release from the riser decreased, first pressure
peak due to compression of air was lower compared with Cases D2-1 and D2-2. After the rapid
filling flow filled the chamber at around 1.56 s, water started to appear in riser due to minimized air
cushion effect, which caused the second pressure peak.
(a)
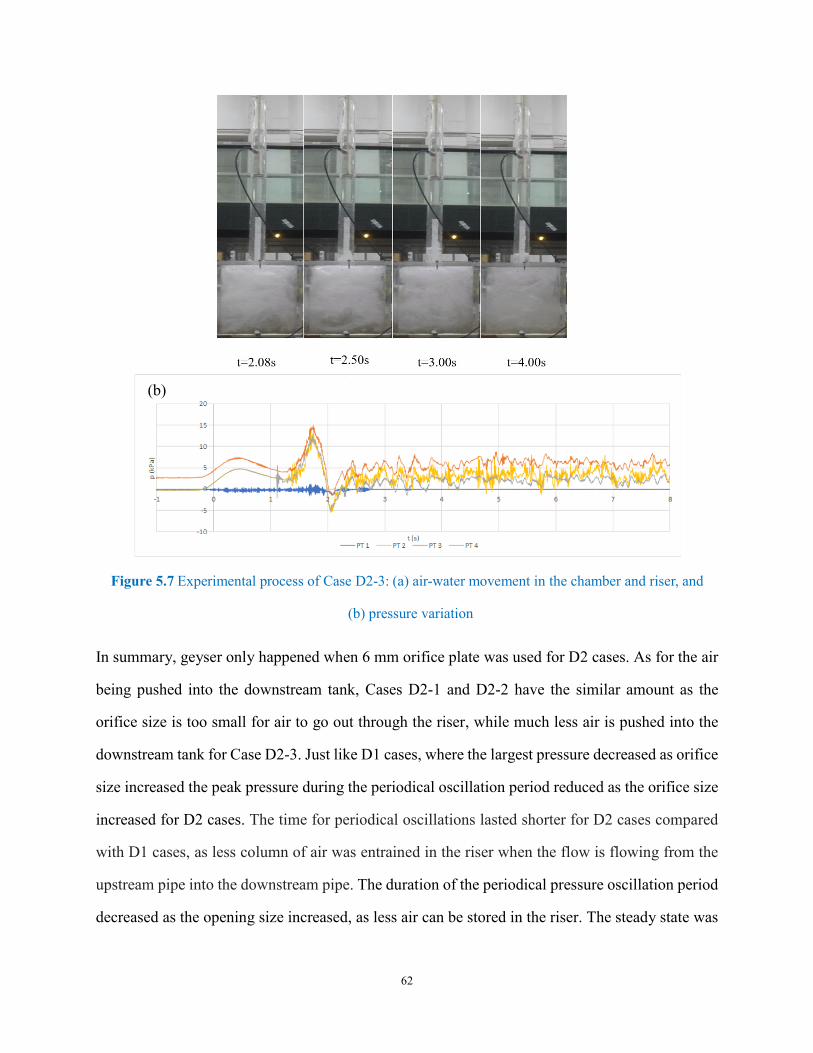
62
Figure 5.7 Experimental process of Case D2-3: (a) air-water movement in the chamber and riser, and
(b) pressure variation
In summary, geyser only happened when 6 mm orifice plate was used for D2 cases. As for the air
being pushed into the downstream tank, Cases D2-1 and D2-2 have the similar amount as the
orifice size is too small for air to go out through the riser, while much less air is pushed into the
downstream tank for Case D2-3. Just like D1 cases, where the largest pressure decreased as orifice
size increased the peak pressure during the periodical oscillation period reduced as the orifice size
increased for D2 cases. The time for periodical oscillations lasted shorter for D2 cases compared
with D1 cases, as less column of air was entrained in the riser when the flow is flowing from the
upstream pipe into the downstream pipe. The duration of the periodical pressure oscillation period
decreased as the opening size increased, as less air can be stored in the riser. The steady state was
(b)
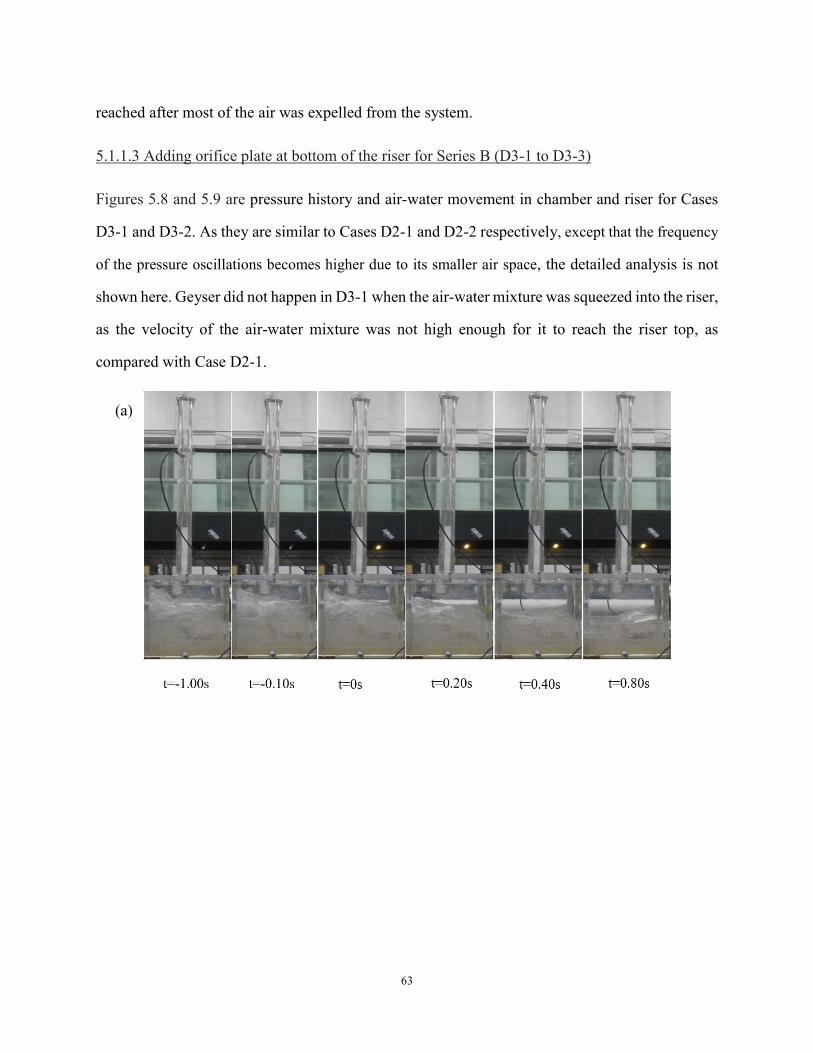
63
reached after most of the air was expelled from the system.
5.1.1.3 Adding orifice plate at bottom of the riser for Series B (D3-1 to D3-3)
Figures 5.8 and 5.9 are pressure history and air-water movement in chamber and riser for Cases
D3-1 and D3-2. As they are similar to Cases D2-1 and D2-2 respectively, except that the frequency
of the pressure oscillations becomes higher due to its smaller air space, the detailed analysis is not
shown here. Geyser did not happen in D3-1 when the air-water mixture was squeezed into the riser,
as the velocity of the air-water mixture was not high enough for it to reach the riser top, as
compared with Case D2-1.
(a)
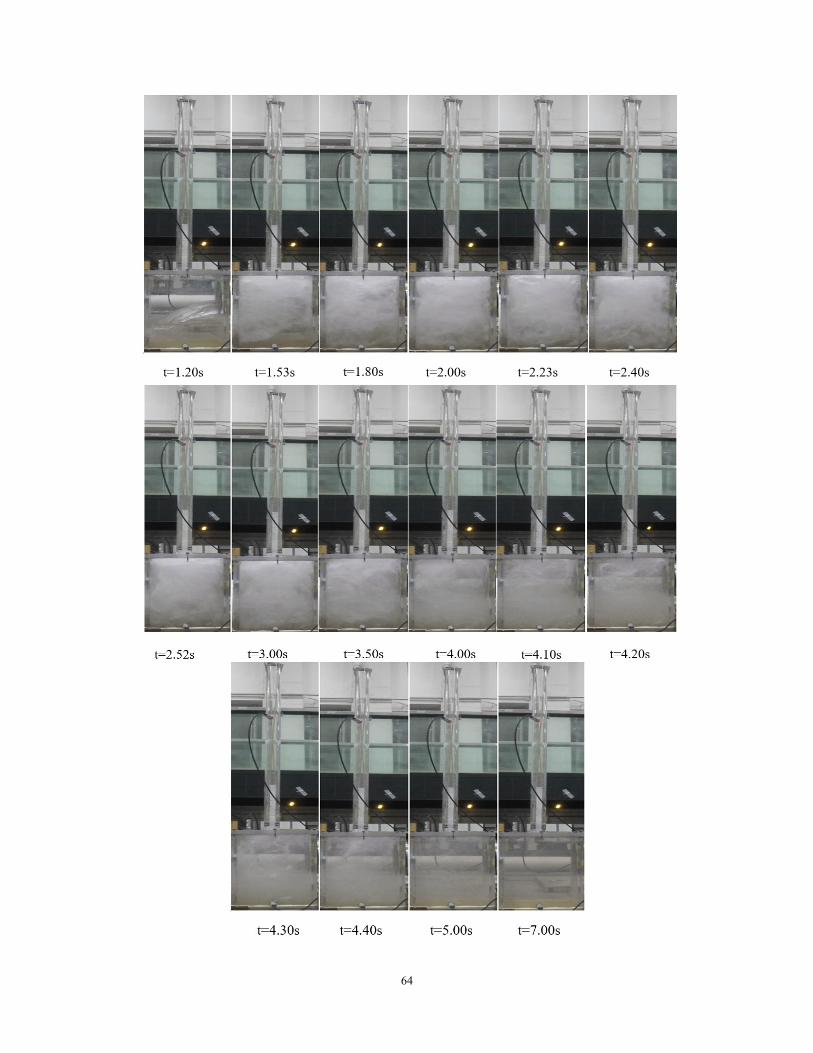
64

65
Figure 5.8 Experimental process of Case D3-1: (a) air-water movement in the chamber and riser, and
(b) pressure variation.
(a)
(b)
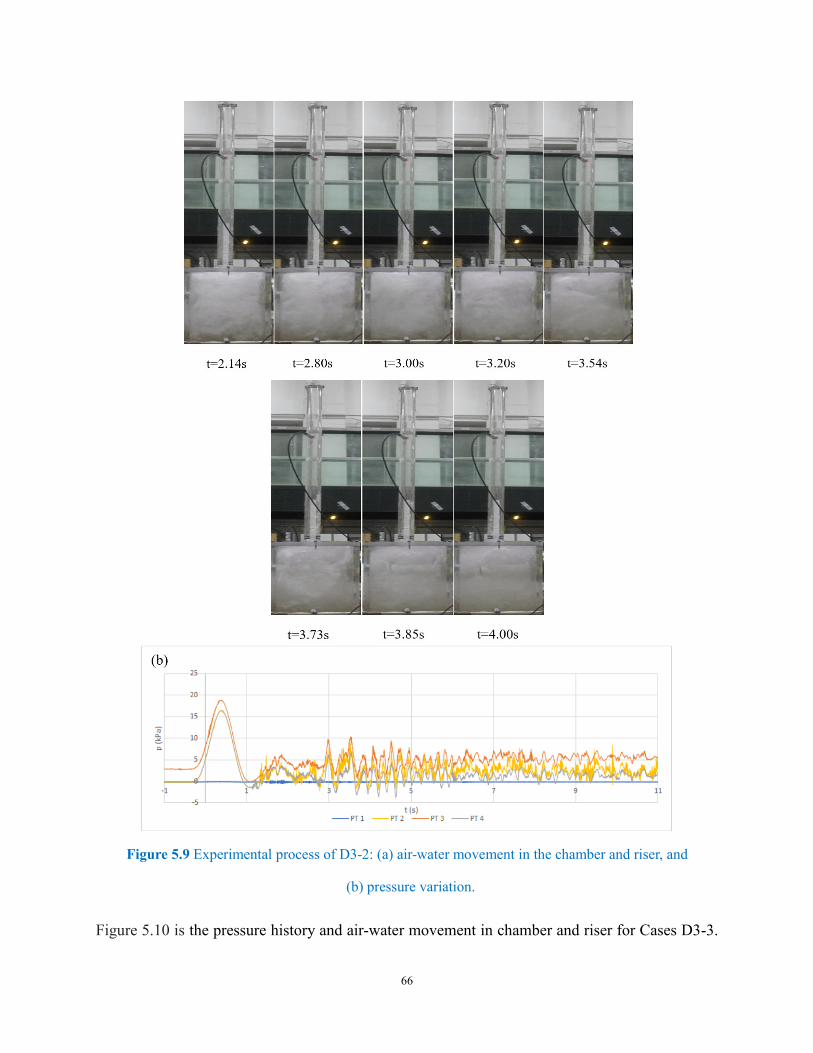
66
Figure 5.9 Experimental process of D3-2: (a) air-water movement in the chamber and riser, and
(b) pressure variation.
Figure 5.10 is the pressure history and air-water movement in chamber and riser for Cases D3-3.
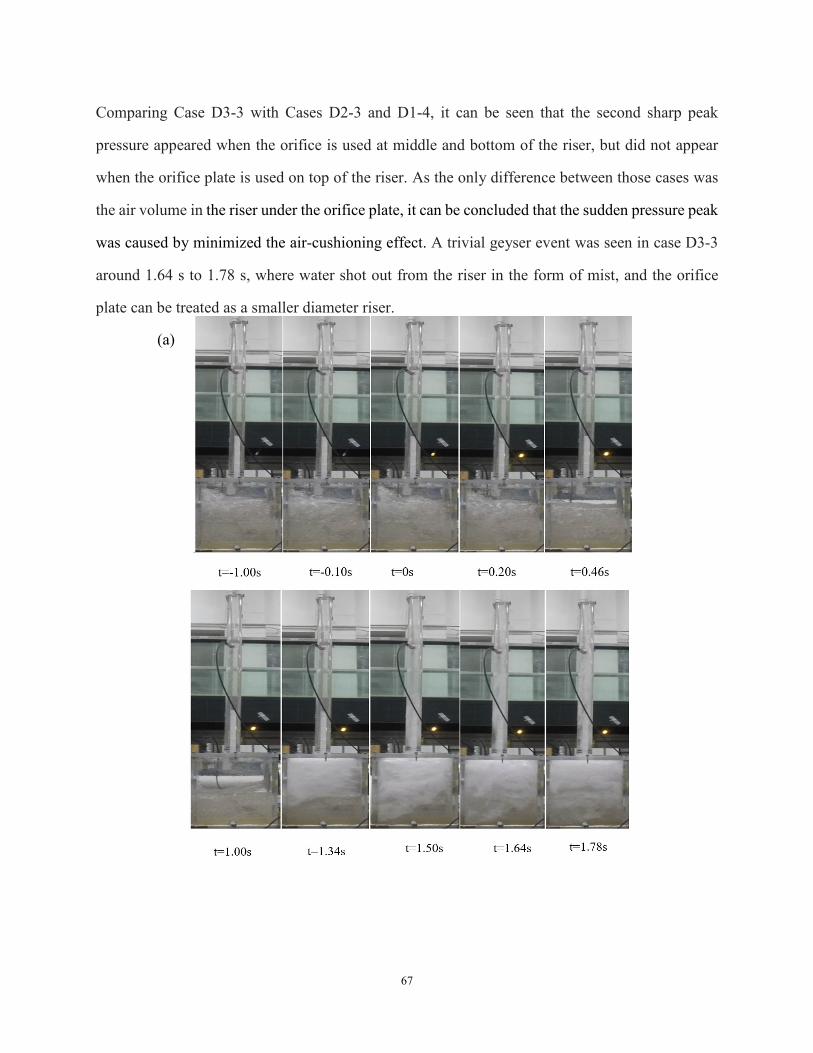
67
Comparing Case D3-3 with Cases D2-3 and D1-4, it can be seen that the second sharp peak
pressure appeared when the orifice is used at middle and bottom of the riser, but did not appear
when the orifice plate is used on top of the riser. As the only difference between those cases was
the air volume in the riser under the orifice plate, it can be concluded that the sudden pressure peak
was caused by minimized the air-cushioning effect. A trivial geyser event was seen in case D3-3
around 1.64 s to 1.78 s, where water shot out from the riser in the form of mist, and the orifice
plate can be treated as a smaller diameter riser.
(a)

68
Figure 5. 10 Experimental process of Case D3-3: (a) air-water movement in the chamber and riser, and
(b) pressure variation.
In conclusion, using orifice plate is effective in preventing geyser, as it decreased the geyser height
and narrowed down the magnitude of pressure oscillation. Seen from the pressure variation,
combined with height data, it can be concluded that smaller opening orifice plate at the bottom of
riser is most effective in preventing geyser. For all the cases, it takes 4.00 s-5.00 s for most the air
in the chamber be released into downstream pipe. The summary of jetting height and peak pressure
change for the original case and with orifice plate cases are shown in Figure 5.11 and Figure 5.12.
From Figure 5.11 and Figure 5.12, it can be concluded that both the pressure at different locations
and the geyser height decreased after the orifice plate was used, and the geyser event was beat
mitigated when 6 mm orifice plate was used at the bottom of the riser.
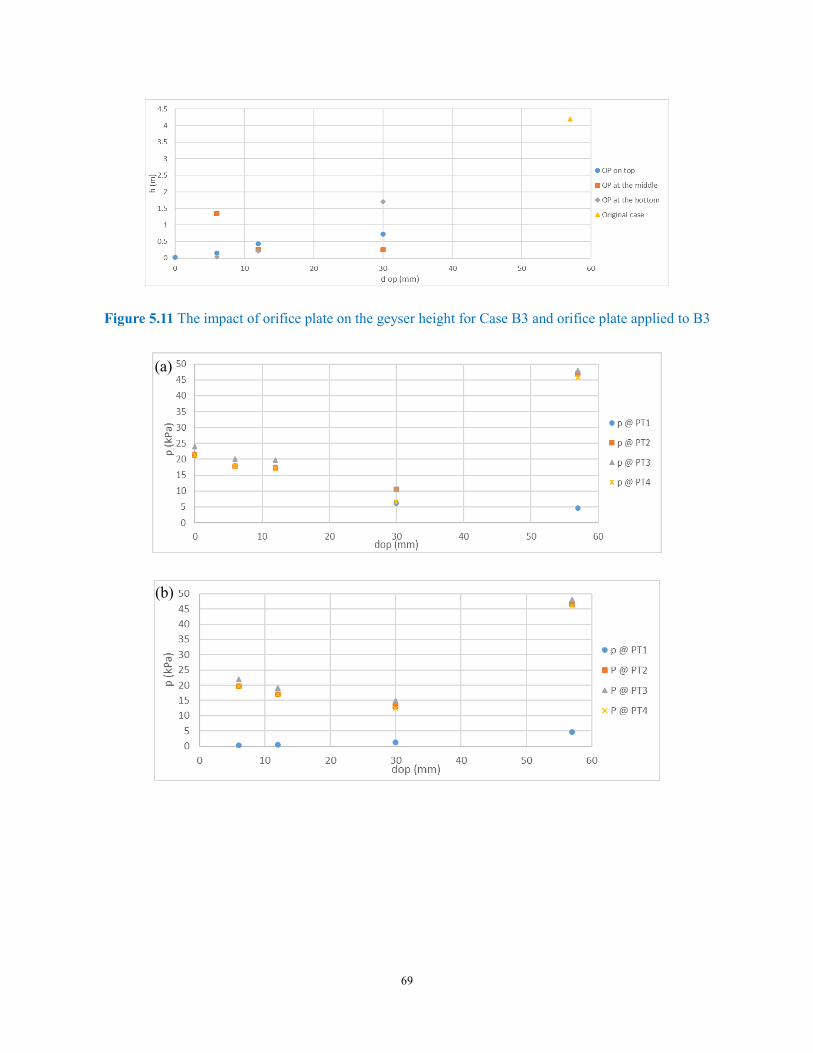
69
Figure 5.11 The impact of orifice plate on the geyser height for Case B3 and orifice plate applied to B3
(a)
(b)
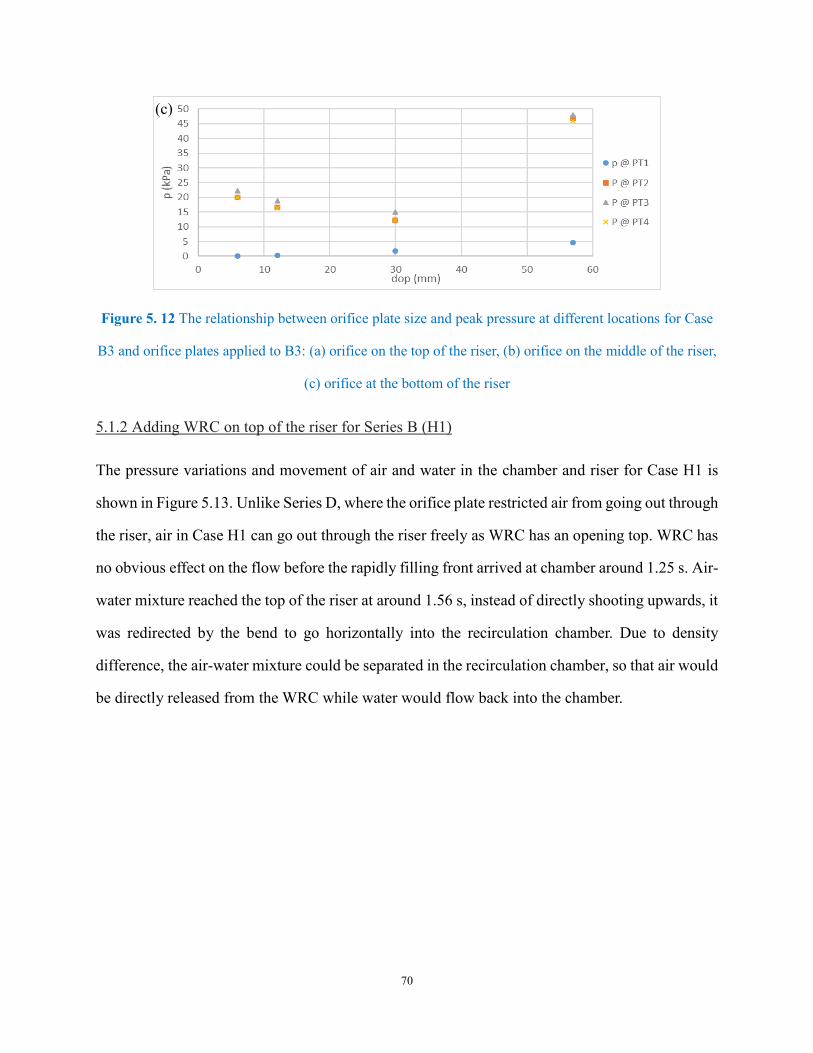
70
Figure 5. 12 The relationship between orifice plate size and peak pressure at different locations for Case
B3 and orifice plates applied to B3: (a) orifice on the top of the riser, (b) orifice on the middle of the riser,
(c) orifice at the bottom of the riser
5.1.2 Adding WRC on top of the riser for Series B (H1)
The pressure variations and movement of air and water in the chamber and riser for Case H1 is
shown in Figure 5.13. Unlike Series D, where the orifice plate restricted air from going out through
the riser, air in Case H1 can go out through the riser freely as WRC has an opening top. WRC has
no obvious effect on the flow before the rapidly filling front arrived at chamber around 1.25 s. Air-
water mixture reached the top of the riser at around 1.56 s, instead of directly shooting upwards, it
was redirected by the bend to go horizontally into the recirculation chamber. Due to density
difference, the air-water mixture could be separated in the recirculation chamber, so that air would
be directly released from the WRC while water would flow back into the chamber.
(c)
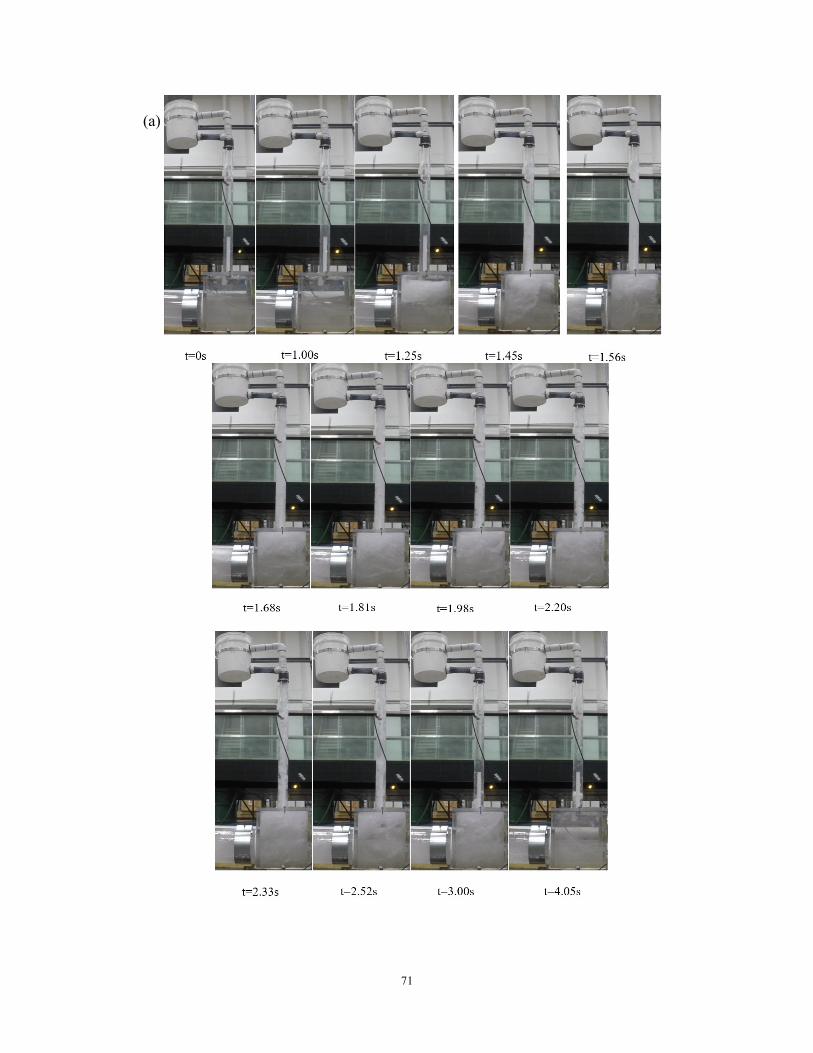
71
(a)
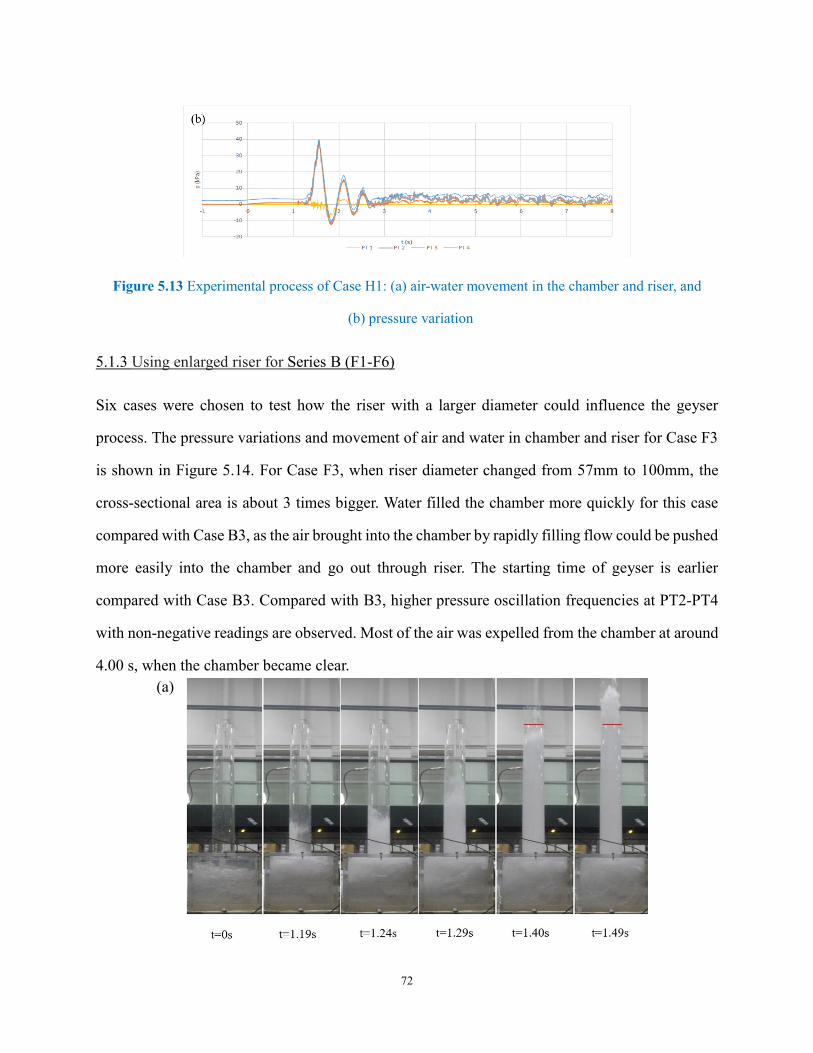
72
Figure 5.13 Experimental process of Case H1: (a) air-water movement in the chamber and riser, and
(b) pressure variation
5.1.3 Using enlarged riser for Series B (F1-F6)
Six cases were chosen to test how the riser with a larger diameter could influence the geyser
process. The pressure variations and movement of air and water in chamber and riser for Case F3
is shown in Figure 5.14. For Case F3, when riser diameter changed from 57mm to 100mm, the
cross-sectional area is about 3 times bigger. Water filled the chamber more quickly for this case
compared with Case B3, as the air brought into the chamber by rapidly filling flow could be pushed
more easily into the chamber and go out through riser. The starting time of geyser is earlier
compared with Case B3. Compared with B3, higher pressure oscillation frequencies at PT2-PT4
with non-negative readings are observed. Most of the air was expelled from the chamber at around
4.00 s, when the chamber became clear.
(a)
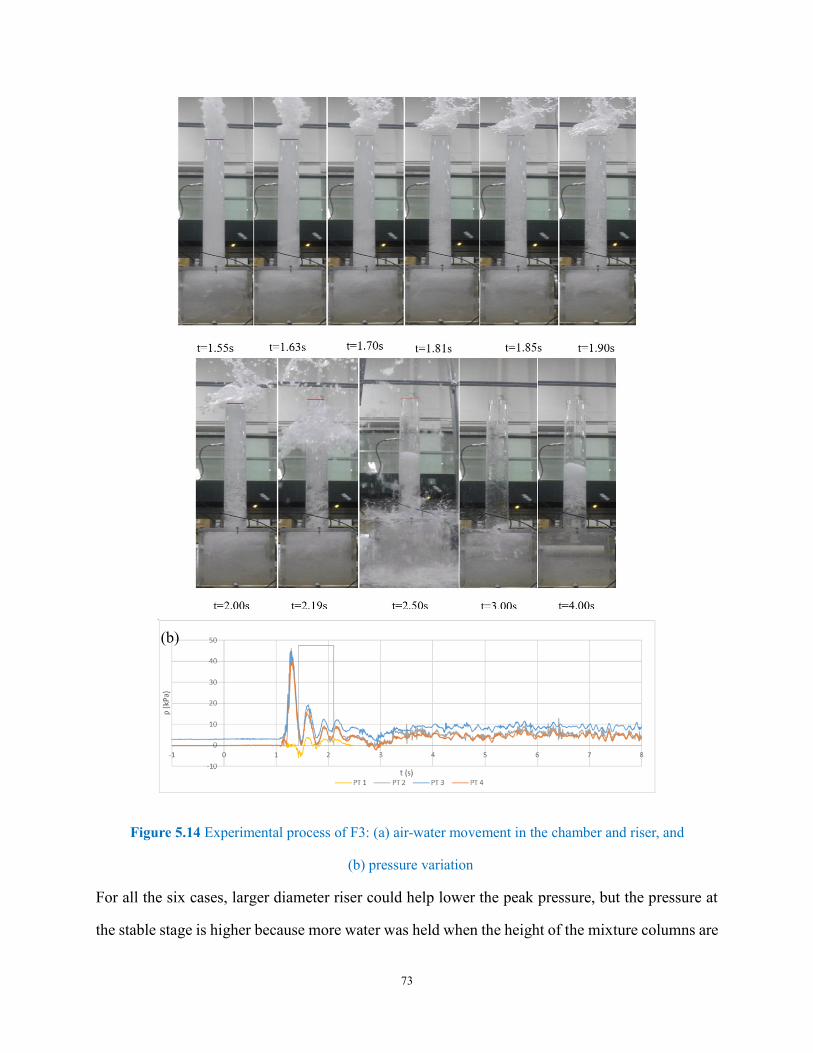
73
Figure 5.14 Experimental process of F3: (a) air-water movement in the chamber and riser, and
(b) pressure variation
For all the six cases, larger diameter riser could help lower the peak pressure, but the pressure at
the stable stage is higher because more water was held when the height of the mixture columns are
(b)
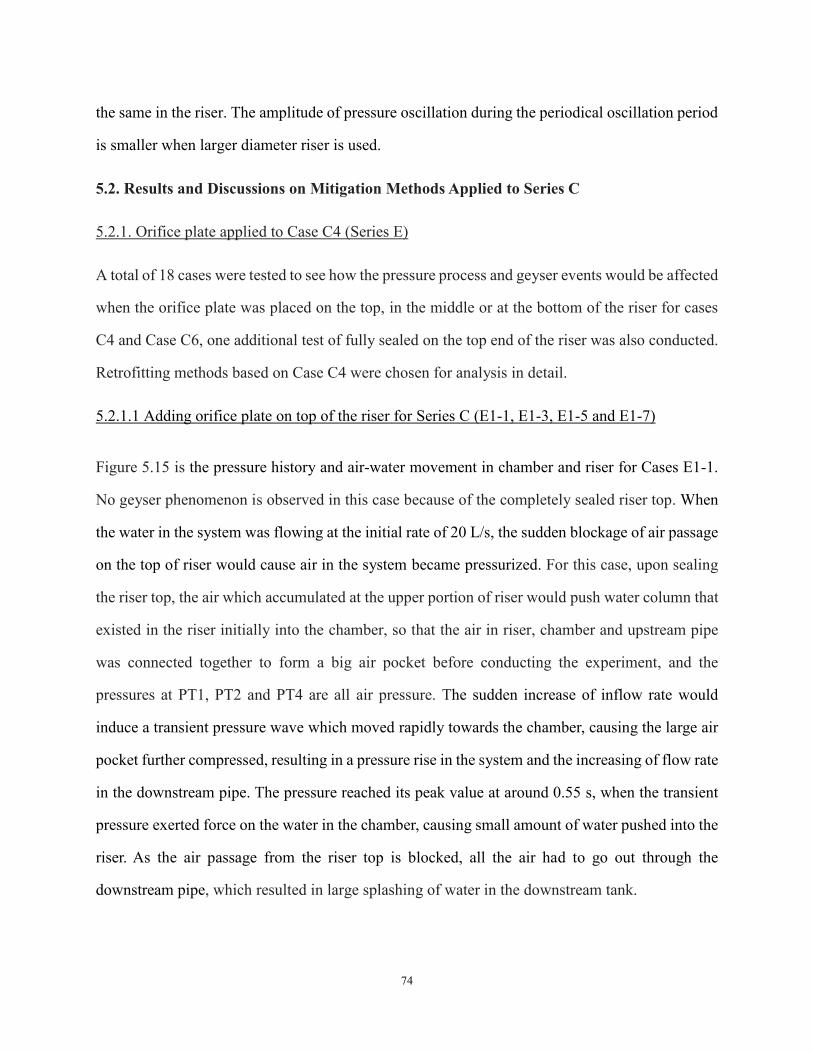
74
the same in the riser. The amplitude of pressure oscillation during the periodical oscillation period
is smaller when larger diameter riser is used.
5.2. Results and Discussions on Mitigation Methods Applied to Series C
5.2.1. Orifice plate applied to Case C4 (Series E)
A total of 18 cases were tested to see how the pressure process and geyser events would be affected
when the orifice plate was placed on the top, in the middle or at the bottom of the riser for cases
C4 and Case C6, one additional test of fully sealed on the top end of the riser was also conducted.
Retrofitting methods based on Case C4 were chosen for analysis in detail.
5.2.1.1 Adding orifice plate on top of the riser for Series C (E1-1, E1-3, E1-5 and E1-7)
Figure 5.15 is the pressure history and air-water movement in chamber and riser for Cases E1-1.
No geyser phenomenon is observed in this case because of the completely sealed riser top. When
the water in the system was flowing at the initial rate of 20 L/s, the sudden blockage of air passage
on the top of riser would cause air in the system became pressurized. For this case, upon sealing
the riser top, the air which accumulated at the upper portion of riser would push water column that
existed in the riser initially into the chamber, so that the air in riser, chamber and upstream pipe
was connected together to form a big air pocket before conducting the experiment, and the
pressures at PT1, PT2 and PT4 are all air pressure. The sudden increase of inflow rate would
induce a transient pressure wave which moved rapidly towards the chamber, causing the large air
pocket further compressed, resulting in a pressure rise in the system and the increasing of flow rate
in the downstream pipe. The pressure reached its peak value at around 0.55 s, when the transient
pressure exerted force on the water in the chamber, causing small amount of water pushed into the
riser. As the air passage from the riser top is blocked, all the air had to go out through the
downstream pipe, which resulted in large splashing of water in the downstream tank.
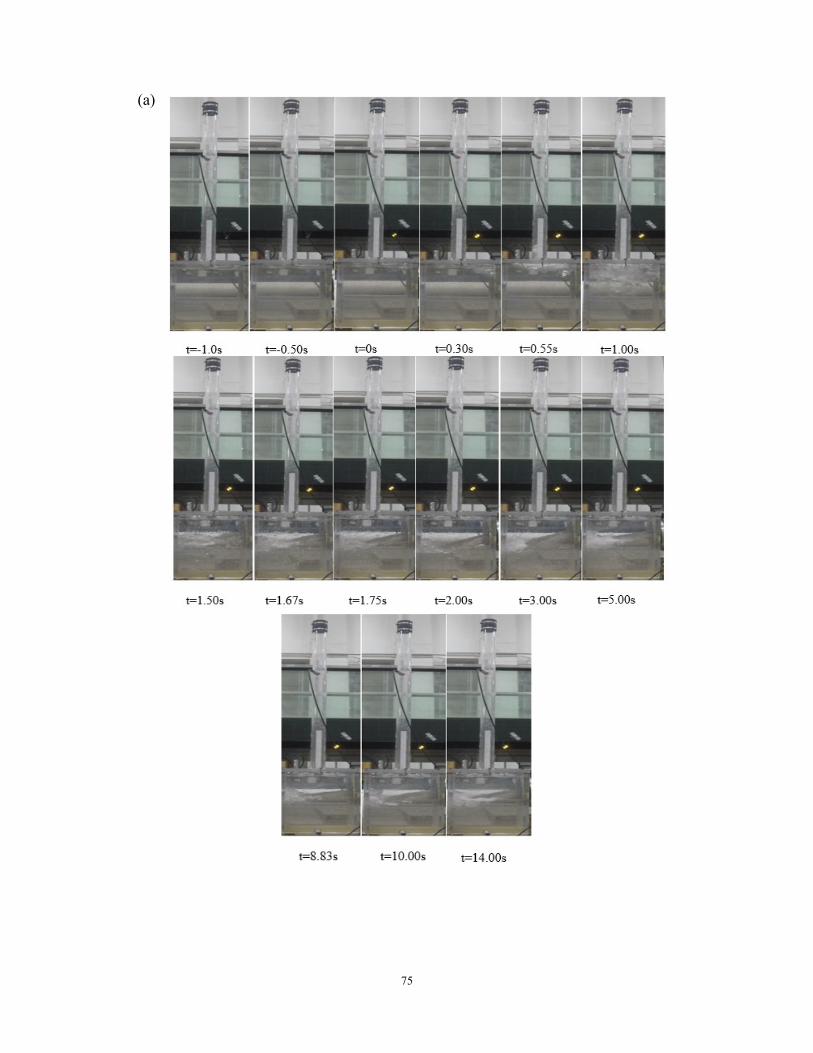
75
(a)
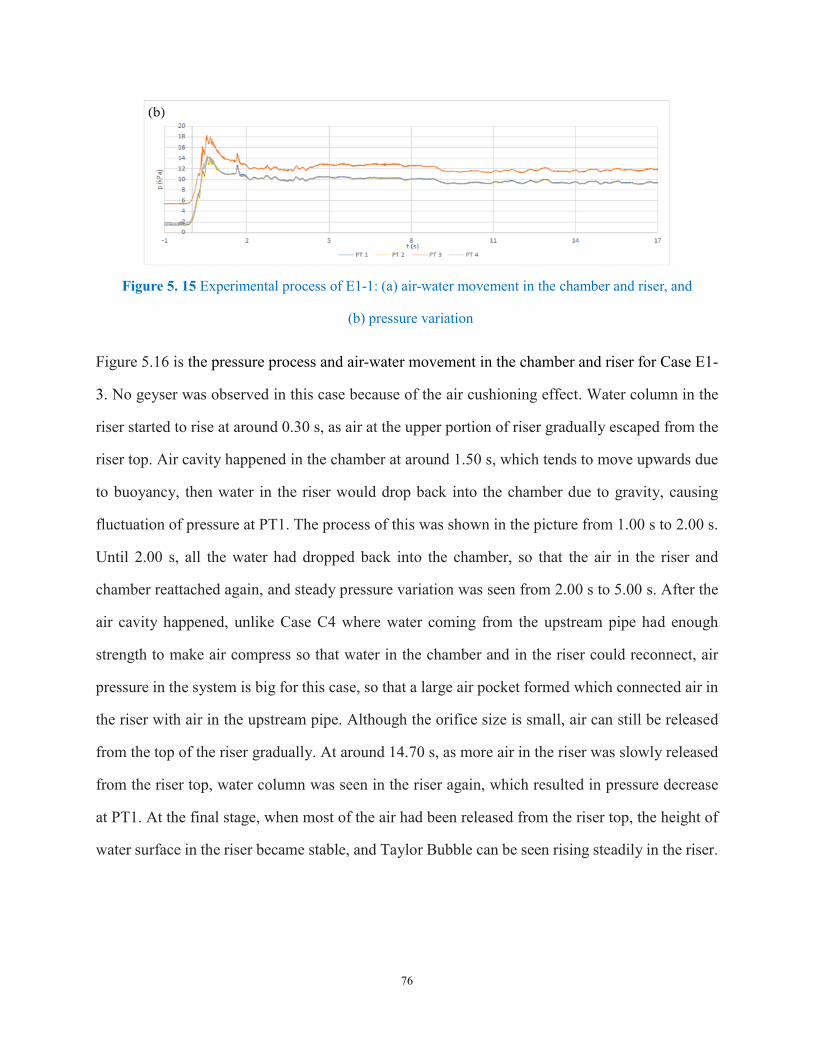
76
Figure 5. 15 Experimental process of E1-1: (a) air-water movement in the chamber and riser, and
(b) pressure variation
Figure 5.16 is the pressure process and air-water movement in the chamber and riser for Case E1-
3. No geyser was observed in this case because of the air cushioning effect. Water column in the
riser started to rise at around 0.30 s, as air at the upper portion of riser gradually escaped from the
riser top. Air cavity happened in the chamber at around 1.50 s, which tends to move upwards due
to buoyancy, then water in the riser would drop back into the chamber due to gravity, causing
fluctuation of pressure at PT1. The process of this was shown in the picture from 1.00 s to 2.00 s.
Until 2.00 s, all the water had dropped back into the chamber, so that the air in the riser and
chamber reattached again, and steady pressure variation was seen from 2.00 s to 5.00 s. After the
air cavity happened, unlike Case C4 where water coming from the upstream pipe had enough
strength to make air compress so that water in the chamber and in the riser could reconnect, air
pressure in the system is big for this case, so that a large air pocket formed which connected air in
the riser with air in the upstream pipe. Although the orifice size is small, air can still be released
from the top of the riser gradually. At around 14.70 s, as more air in the riser was slowly released
from the riser top, water column was seen in the riser again, which resulted in pressure decrease
at PT1. At the final stage, when most of the air had been released from the riser top, the height of
water surface in the riser became stable, and Taylor Bubble can be seen rising steadily in the riser.
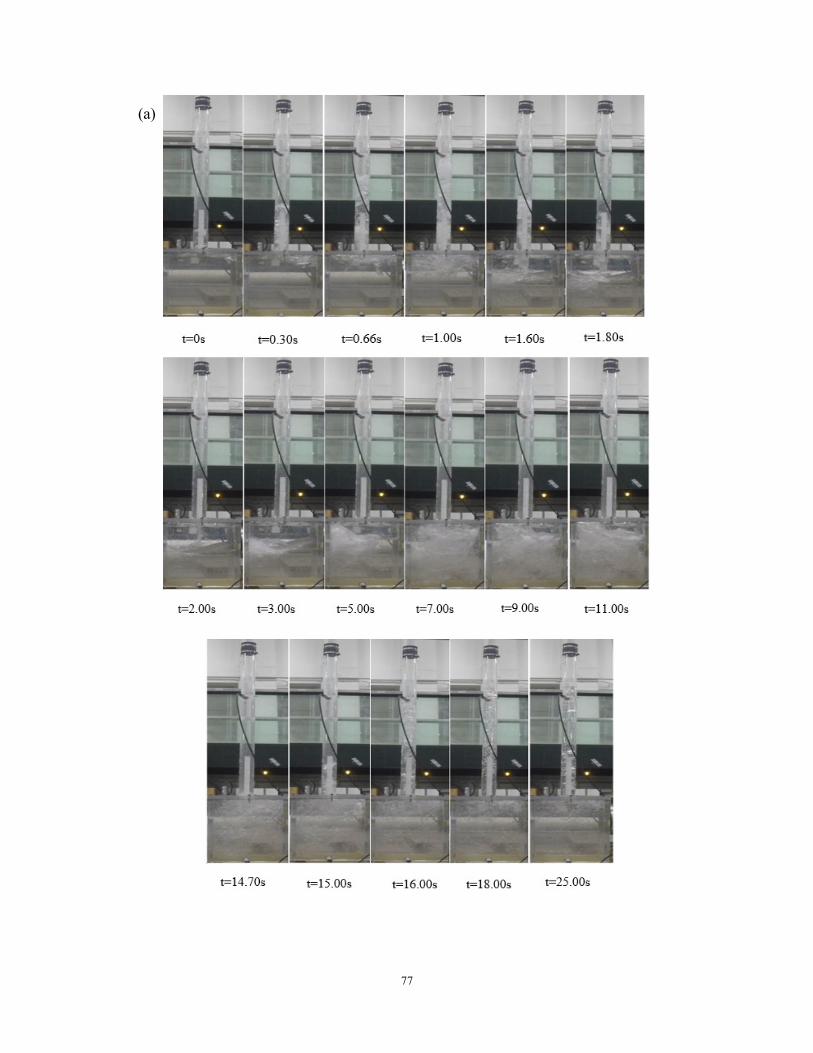
77
(a)
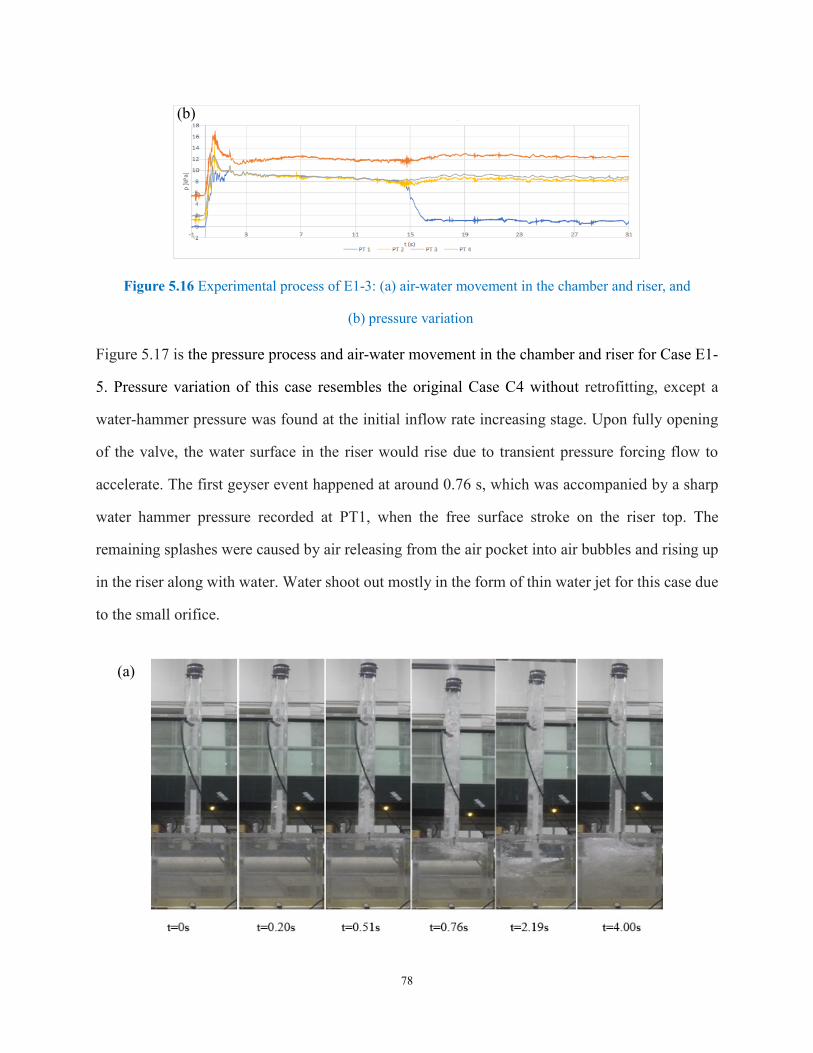
78
Figure 5.16 Experimental process of E1-3: (a) air-water movement in the chamber and riser, and
(b) pressure variation
Figure 5.17 is the pressure process and air-water movement in the chamber and riser for Case E1-
5. Pressure variation of this case resembles the original Case C4 without retrofitting, except a
water-hammer pressure was found at the initial inflow rate increasing stage. Upon fully opening
of the valve, the water surface in the riser would rise due to transient pressure forcing flow to
accelerate. The first geyser event happened at around 0.76 s, which was accompanied by a sharp
water hammer pressure recorded at PT1, when the free surface stroke on the riser top. The
remaining splashes were caused by air releasing from the air pocket into air bubbles and rising up
in the riser along with water. Water shoot out mostly in the form of thin water jet for this case due
to the small orifice.
(a)
(b)
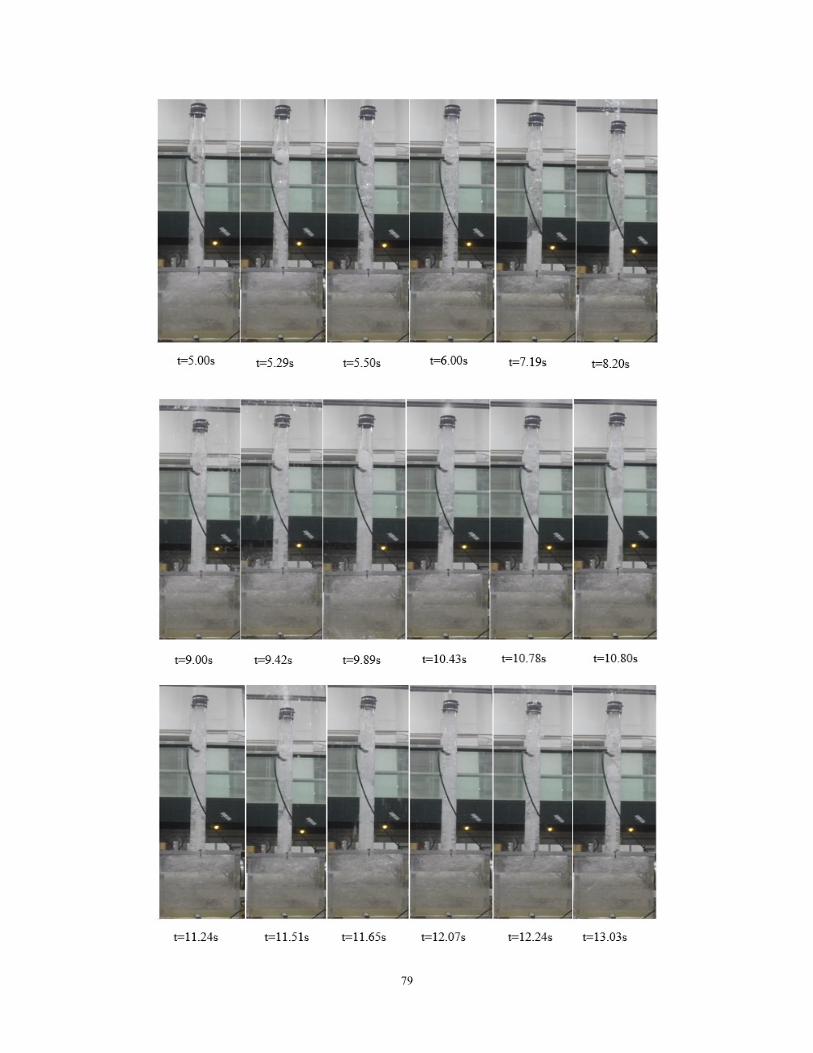
79

80
Figure 5.17 Experimental process of Case E1-5: (a) air-water movement in the chamber and riser, and
(b) pressure variation
Figure 5.18 is the pressure process and air-water movement in the chamber and riser for Case E1-
(b)
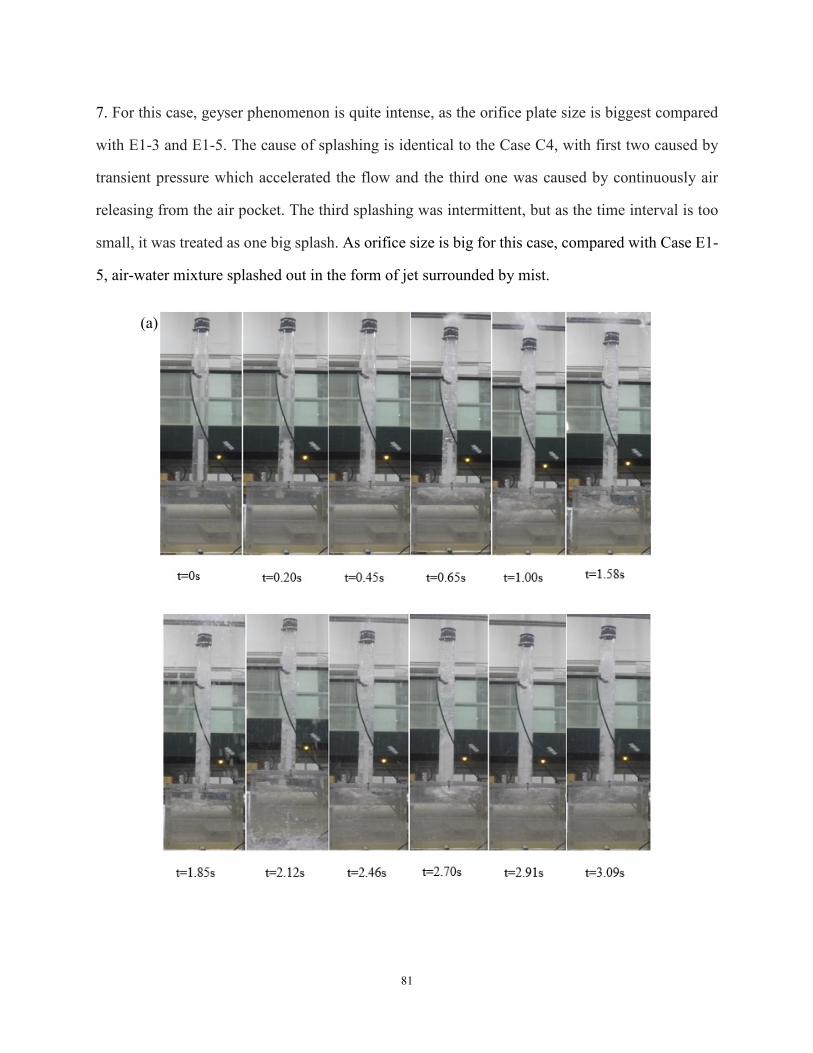
81
7. For this case, geyser phenomenon is quite intense, as the orifice plate size is biggest compared
with E1-3 and E1-5. The cause of splashing is identical to the Case C4, with first two caused by
transient pressure which accelerated the flow and the third one was caused by continuously air
releasing from the air pocket. The third splashing was intermittent, but as the time interval is too
small, it was treated as one big splash. As orifice size is big for this case, compared with Case E1-
5, air-water mixture splashed out in the form of jet surrounded by mist.
(a)
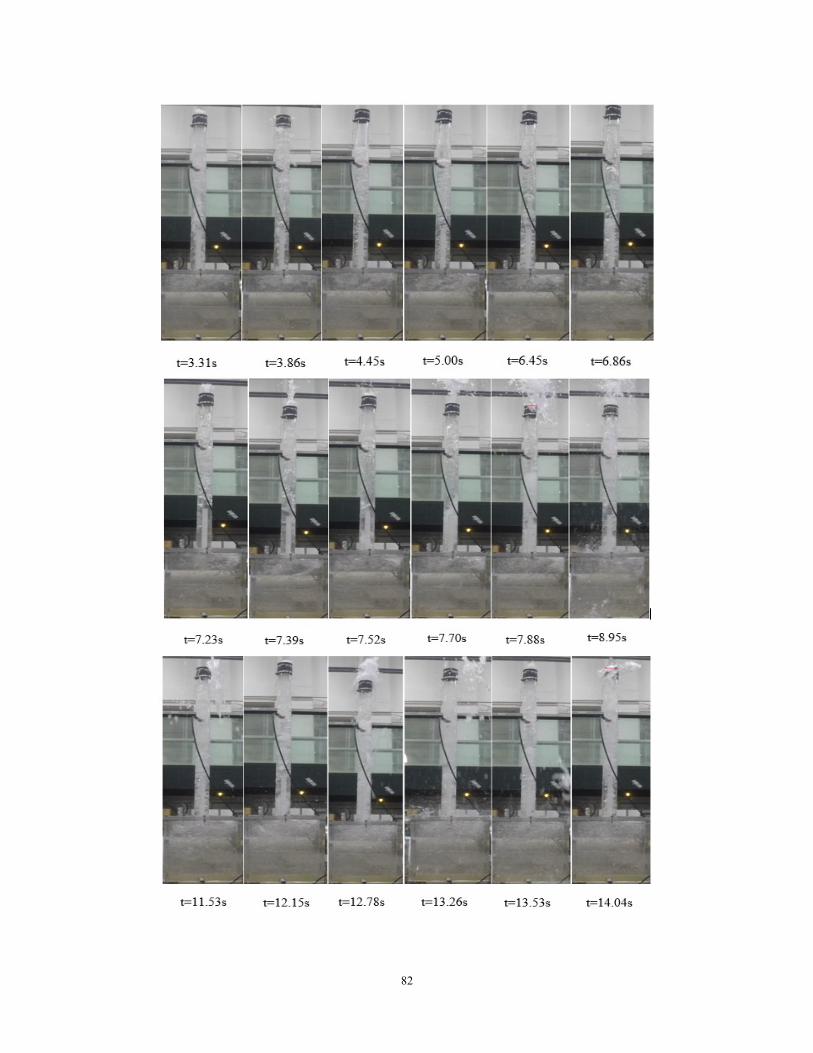
82
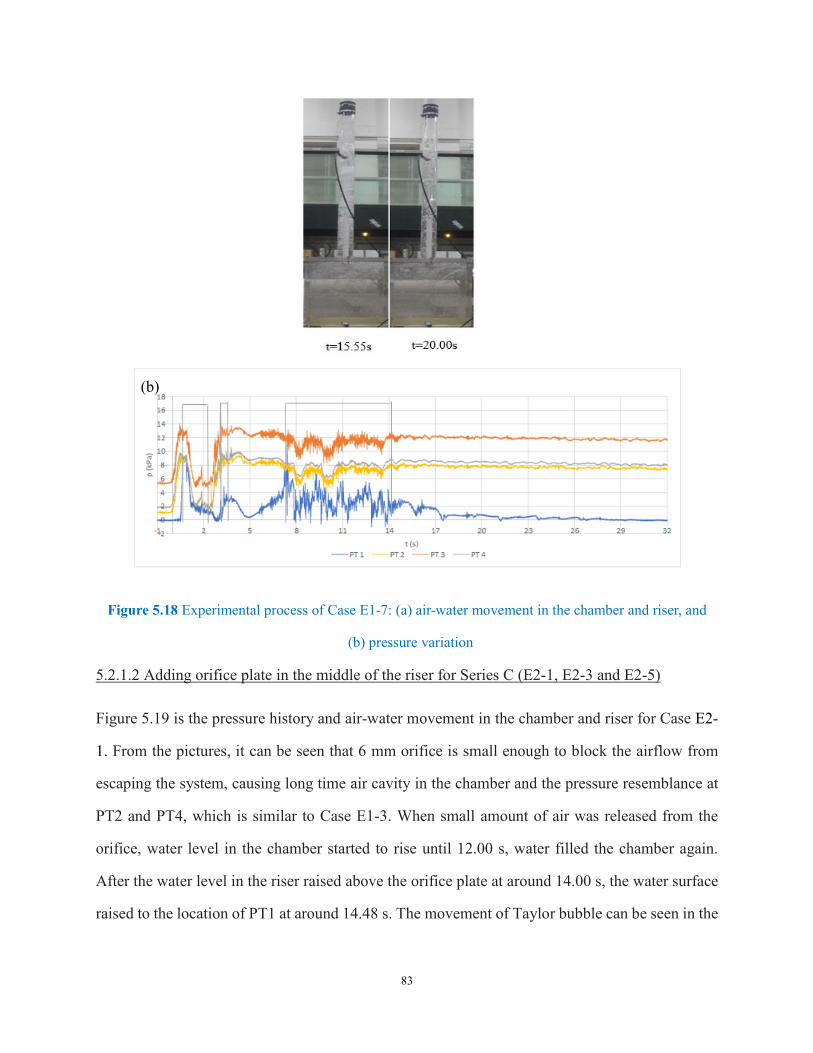
83
Figure 5.18 Experimental process of Case E1-7: (a) air-water movement in the chamber and riser, and
(b) pressure variation
5.2.1.2 Adding orifice plate in the middle of the riser for Series C (E2-1, E2-3 and E2-5)
Figure 5.19 is the pressure history and air-water movement in the chamber and riser for Case E2-
1. From the pictures, it can be seen that 6 mm orifice is small enough to block the airflow from
escaping the system, causing long time air cavity in the chamber and the pressure resemblance at
PT2 and PT4, which is similar to Case E1-3. When small amount of air was released from the
orifice, water level in the chamber started to rise until 12.00 s, water filled the chamber again.
After the water level in the riser raised above the orifice plate at around 14.00 s, the water surface
raised to the location of PT1 at around 14.48 s. The movement of Taylor bubble can be seen in the
(b)
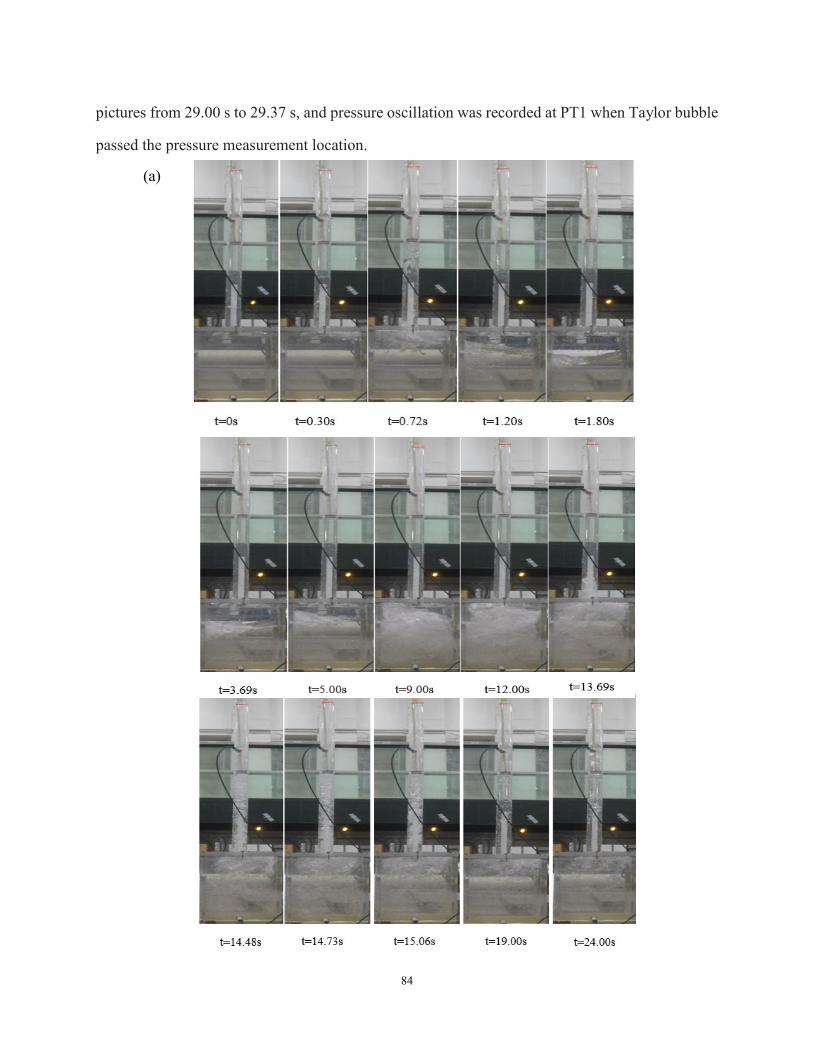
84
pictures from 29.00 s to 29.37 s, and pressure oscillation was recorded at PT1 when Taylor bubble
passed the pressure measurement location.
(a)
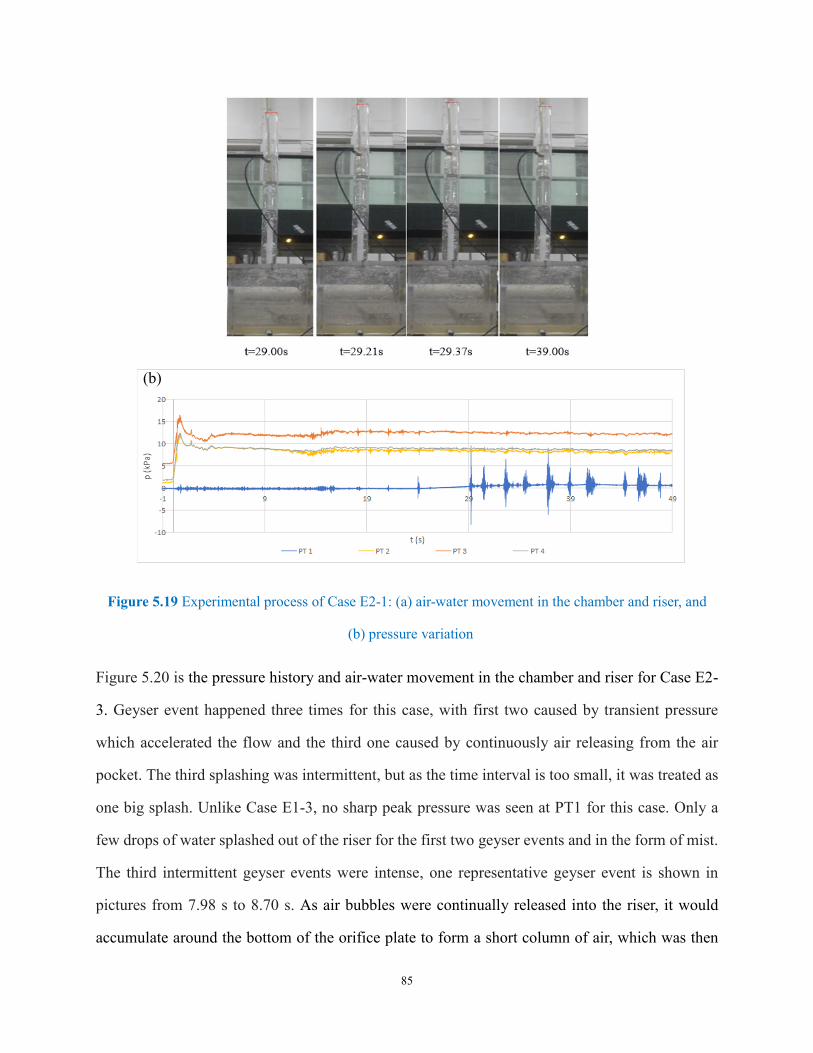
85
Figure 5.19 Experimental process of Case E2-1: (a) air-water movement in the chamber and riser, and
(b) pressure variation
Figure 5.20 is the pressure history and air-water movement in the chamber and riser for Case E2-
3. Geyser event happened three times for this case, with first two caused by transient pressure
which accelerated the flow and the third one caused by continuously air releasing from the air
pocket. The third splashing was intermittent, but as the time interval is too small, it was treated as
one big splash. Unlike Case E1-3, no sharp peak pressure was seen at PT1 for this case. Only a
few drops of water splashed out of the riser for the first two geyser events and in the form of mist.
The third intermittent geyser events were intense, one representative geyser event is shown in
pictures from 7.98 s to 8.70 s. As air bubbles were continually released into the riser, it would
accumulate around the bottom of the orifice plate to form a short column of air, which was then
(b)

86
pushed out by the water below to form geyser.
(a)
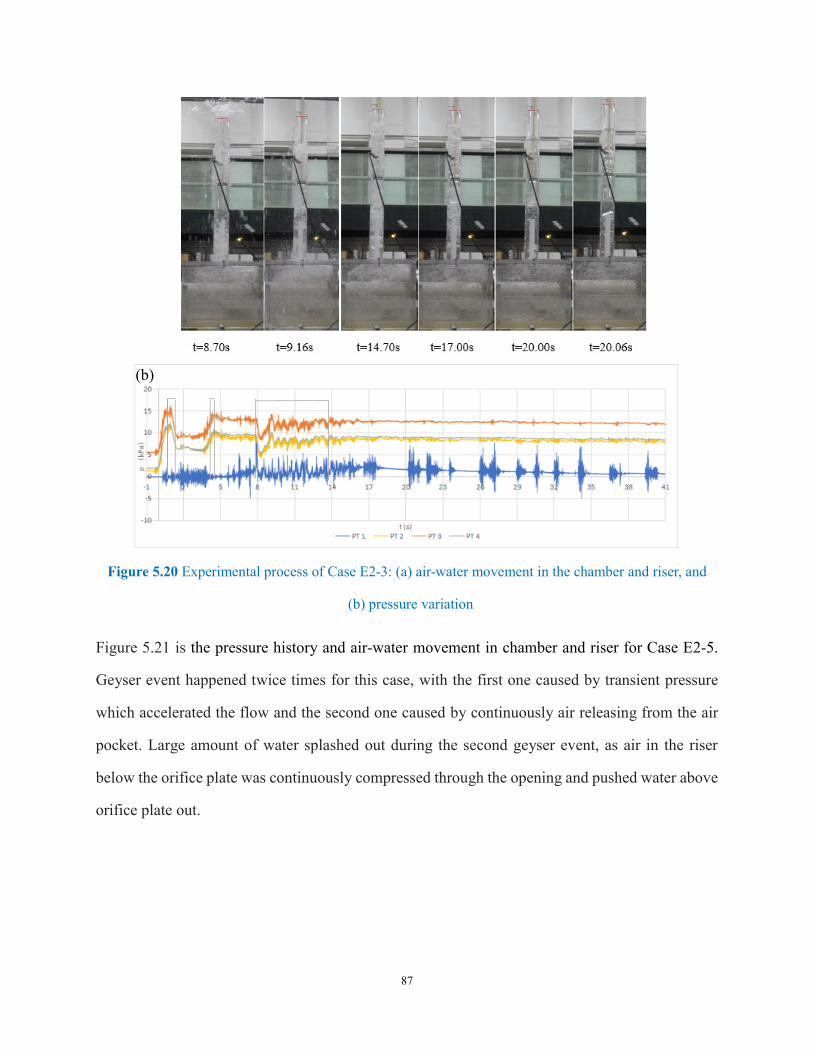
87
Figure 5.20 Experimental process of Case E2-3: (a) air-water movement in the chamber and riser, and
(b) pressure variation
Figure 5.21 is the pressure history and air-water movement in chamber and riser for Case E2-5.
Geyser event happened twice times for this case, with the first one caused by transient pressure
which accelerated the flow and the second one caused by continuously air releasing from the air
pocket. Large amount of water splashed out during the second geyser event, as air in the riser
below the orifice plate was continuously compressed through the opening and pushed water above
orifice plate out.
(b)
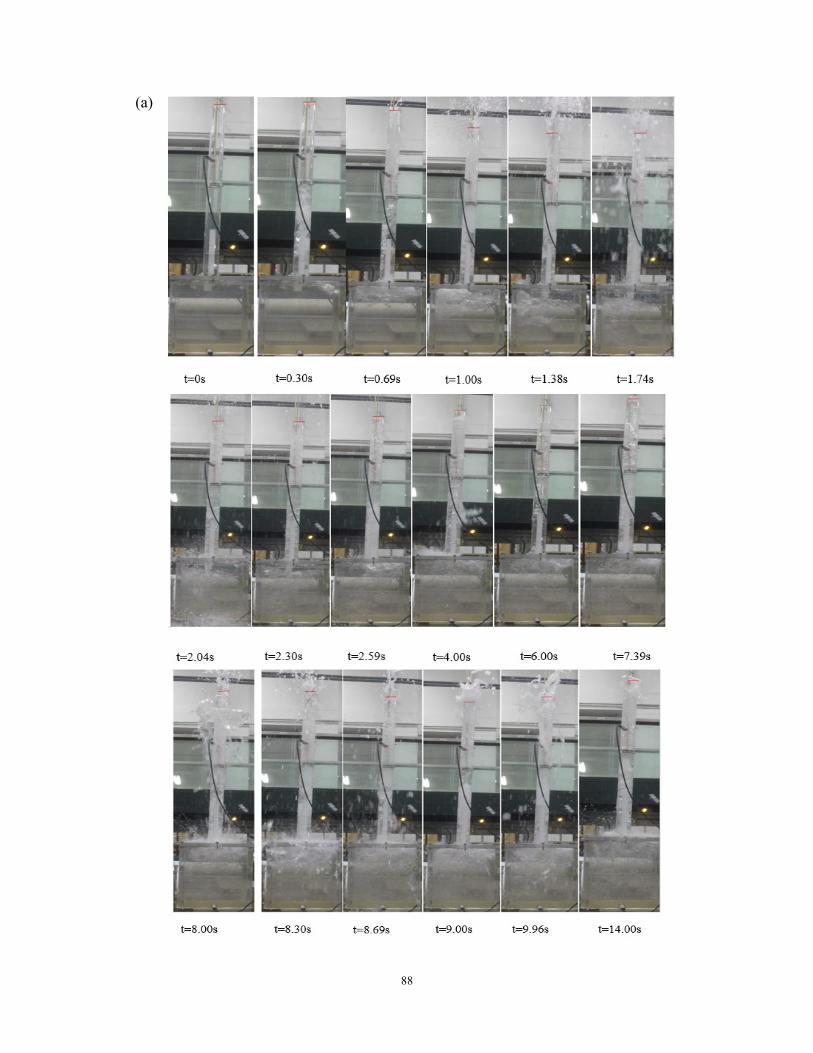
88
(a)
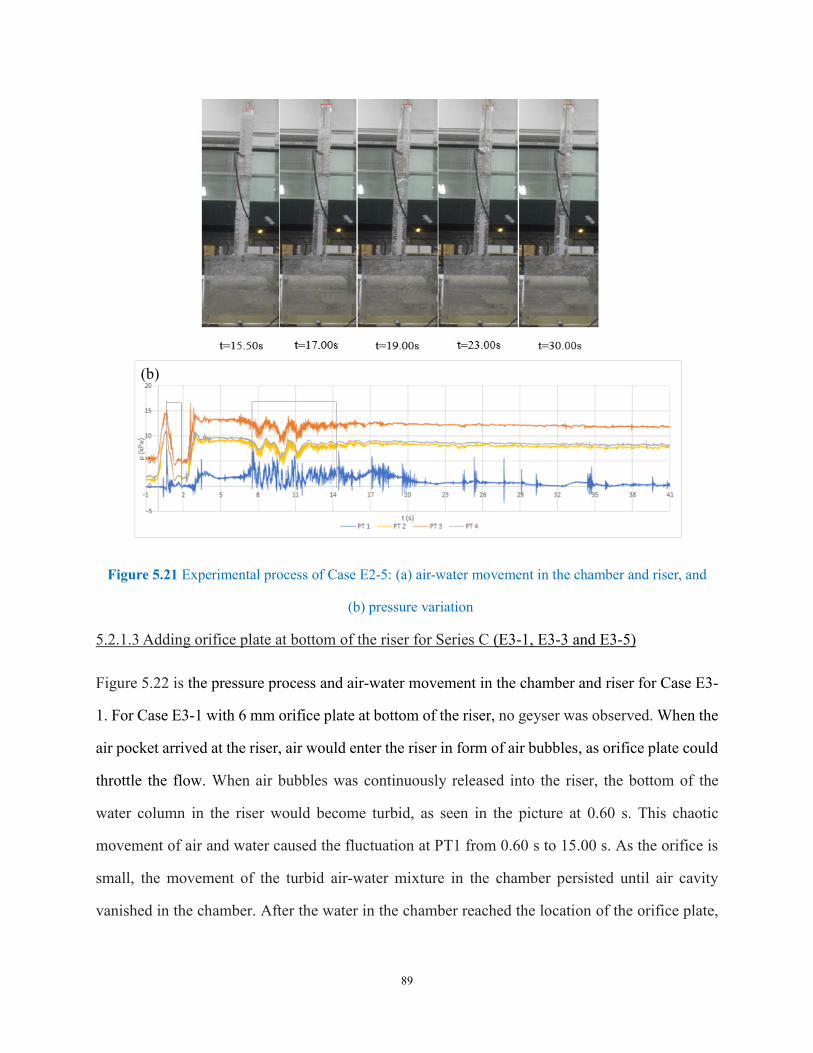
89
Figure 5.21 Experimental process of Case E2-5: (a) air-water movement in the chamber and riser, and
(b) pressure variation
5.2.1.3 Adding orifice plate at bottom of the riser for Series C (E3-1, E3-3 and E3-5)
Figure 5.22 is the pressure process and air-water movement in the chamber and riser for Case E3-
1. For Case E3-1 with 6 mm orifice plate at bottom of the riser, no geyser was observed. When the
air pocket arrived at the riser, air would enter the riser in form of air bubbles, as orifice plate could
throttle the flow. When air bubbles was continuously released into the riser, the bottom of the
water column in the riser would become turbid, as seen in the picture at 0.60 s. This chaotic
movement of air and water caused the fluctuation at PT1 from 0.60 s to 15.00 s. As the orifice is
small, the movement of the turbid air-water mixture in the chamber persisted until air cavity
vanished in the chamber. After the water in the chamber reached the location of the orifice plate,
(b)

90
water column in the riser became clear as no more air could be released into the riser. The sudden
fluctuation of pressure at PT1 was caused by bypassing of the Taylor bubble.
(a)
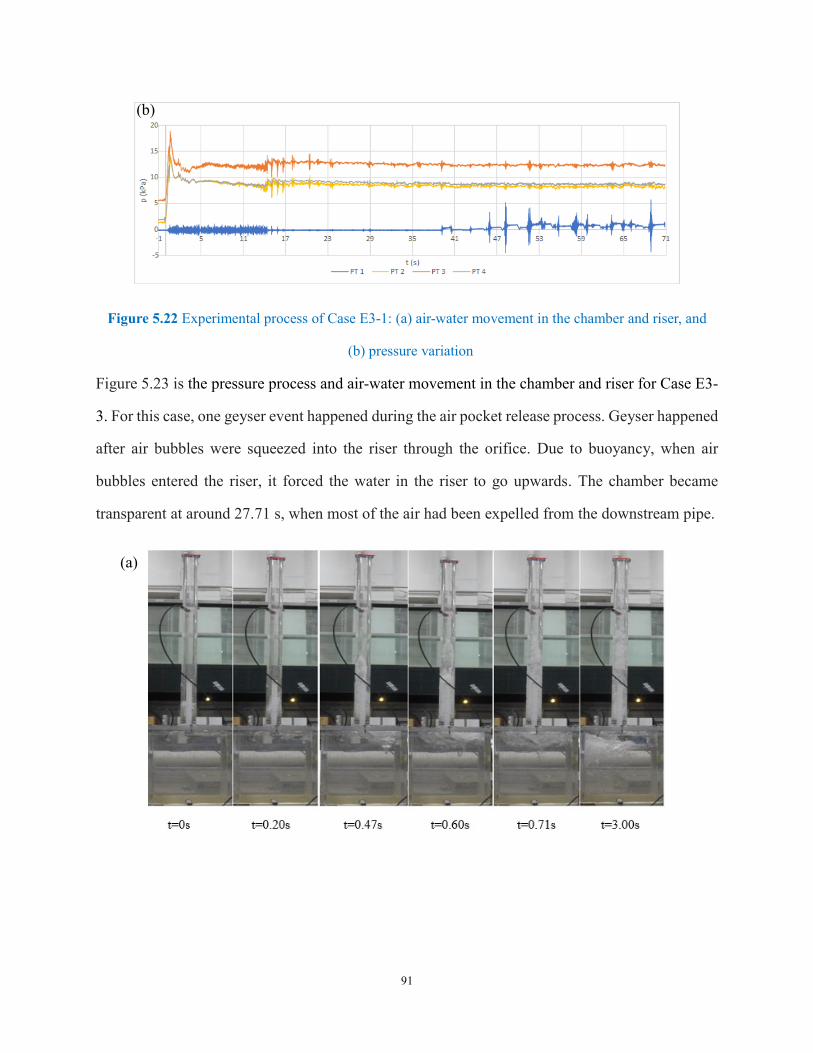
91
Figure 5.22 Experimental process of Case E3-1: (a) air-water movement in the chamber and riser, and
(b) pressure variation
Figure 5.23 is the pressure process and air-water movement in the chamber and riser for Case E3-
3. For this case, one geyser event happened during the air pocket release process. Geyser happened
after air bubbles were squeezed into the riser through the orifice. Due to buoyancy, when air
bubbles entered the riser, it forced the water in the riser to go upwards. The chamber became
transparent at around 27.71 s, when most of the air had been expelled from the downstream pipe.
(a)
(b)
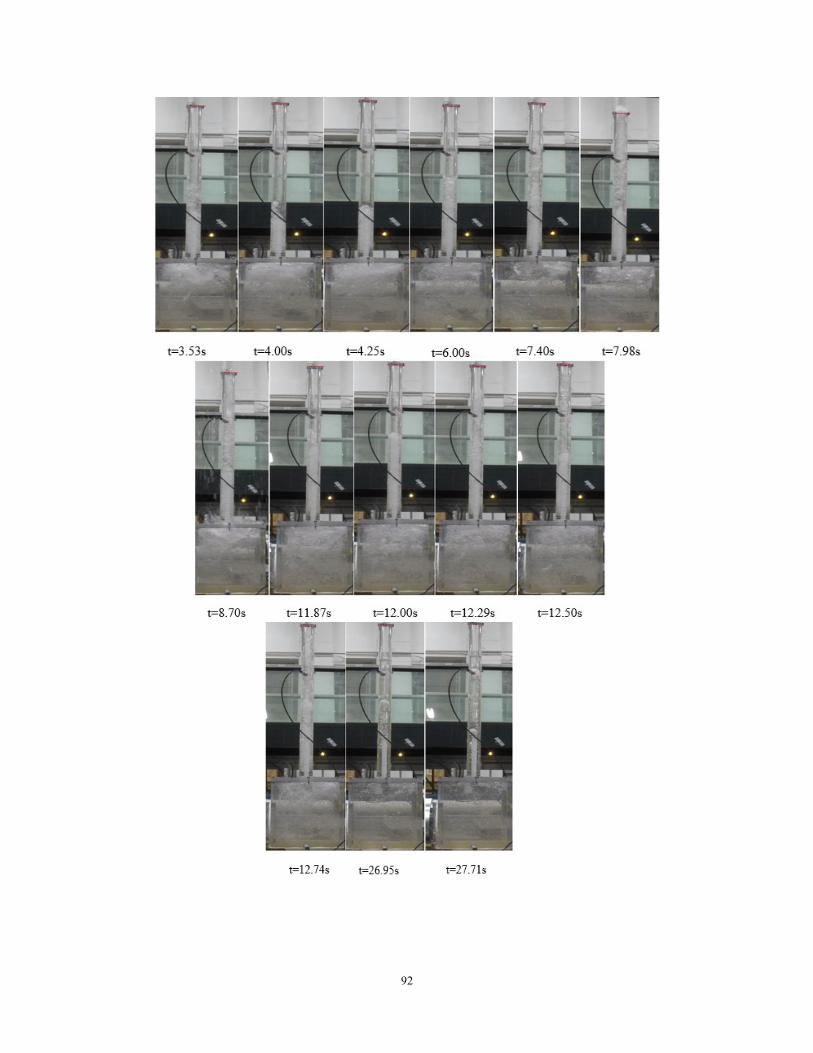
92
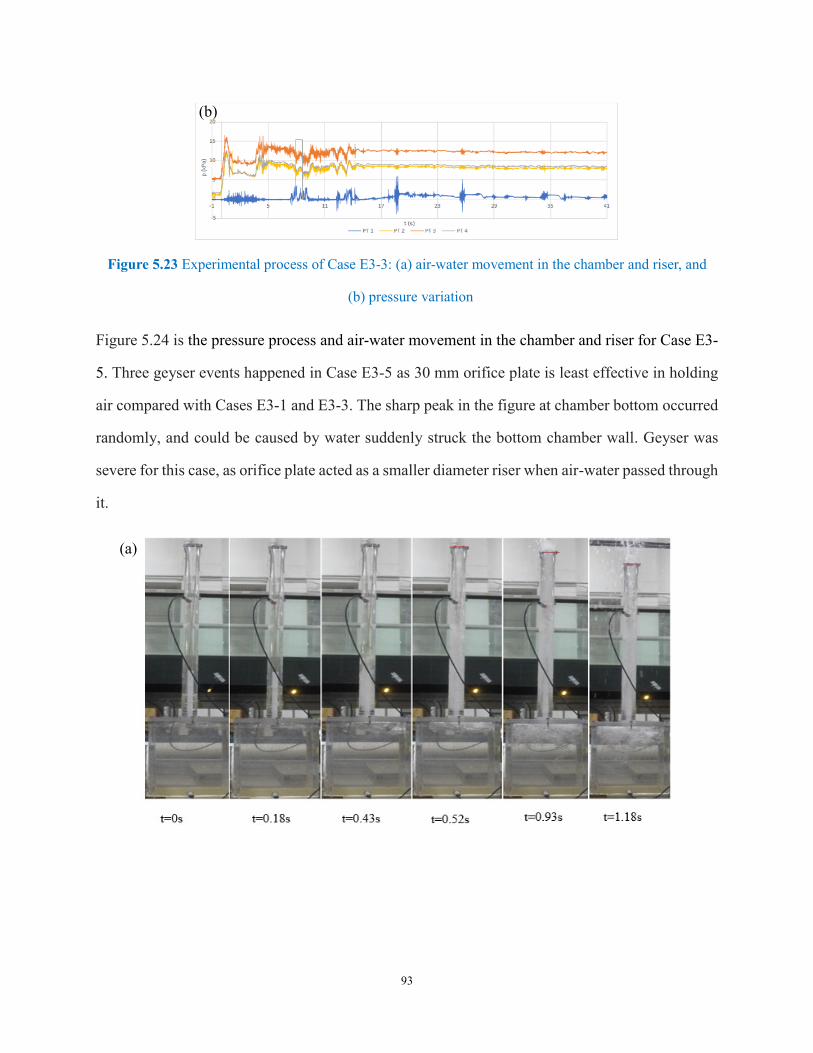
93
Figure 5.23 Experimental process of Case E3-3: (a) air-water movement in the chamber and riser, and
(b) pressure variation
Figure 5.24 is the pressure process and air-water movement in the chamber and riser for Case E3-
5. Three geyser events happened in Case E3-5 as 30 mm orifice plate is least effective in holding
air compared with Cases E3-1 and E3-3. The sharp peak in the figure at chamber bottom occurred
randomly, and could be caused by water suddenly struck the bottom chamber wall. Geyser was
severe for this case, as orifice plate acted as a smaller diameter riser when air-water passed through
it.
(a)
(b)
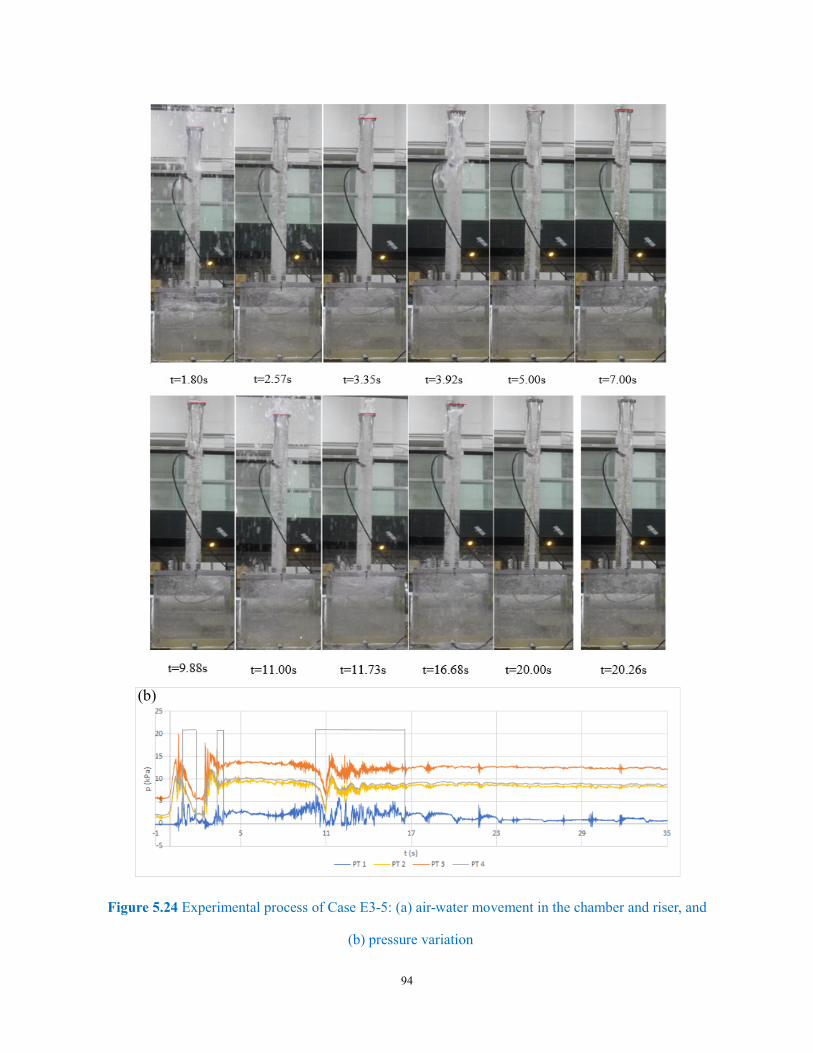
94
Figure 5.24 Experimental process of Case E3-5: (a) air-water movement in the chamber and riser, and
(b) pressure variation
(b)
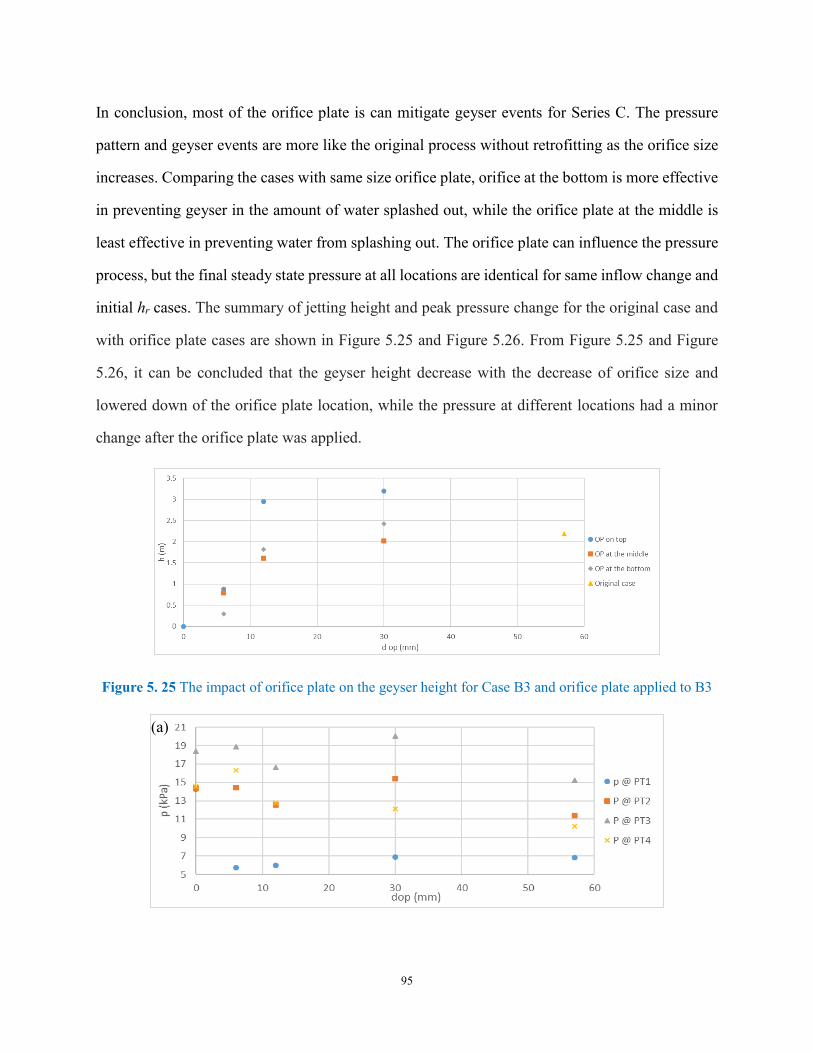
95
In conclusion, most of the orifice plate is can mitigate geyser events for Series C. The pressure
pattern and geyser events are more like the original process without retrofitting as the orifice size
increases. Comparing the cases with same size orifice plate, orifice at the bottom is more effective
in preventing geyser in the amount of water splashed out, while the orifice plate at the middle is
least effective in preventing water from splashing out. The orifice plate can influence the pressure
process, but the final steady state pressure at all locations are identical for same inflow change and
initial hr cases. The summary of jetting height and peak pressure change for the original case and
with orifice plate cases are shown in Figure 5.25 and Figure 5.26. From Figure 5.25 and Figure
5.26, it can be concluded that the geyser height decrease with the decrease of orifice size and
lowered down of the orifice plate location, while the pressure at different locations had a minor
change after the orifice plate was applied.
Figure 5. 25 The impact of orifice plate on the geyser height for Case B3 and orifice plate applied to B3
(a)
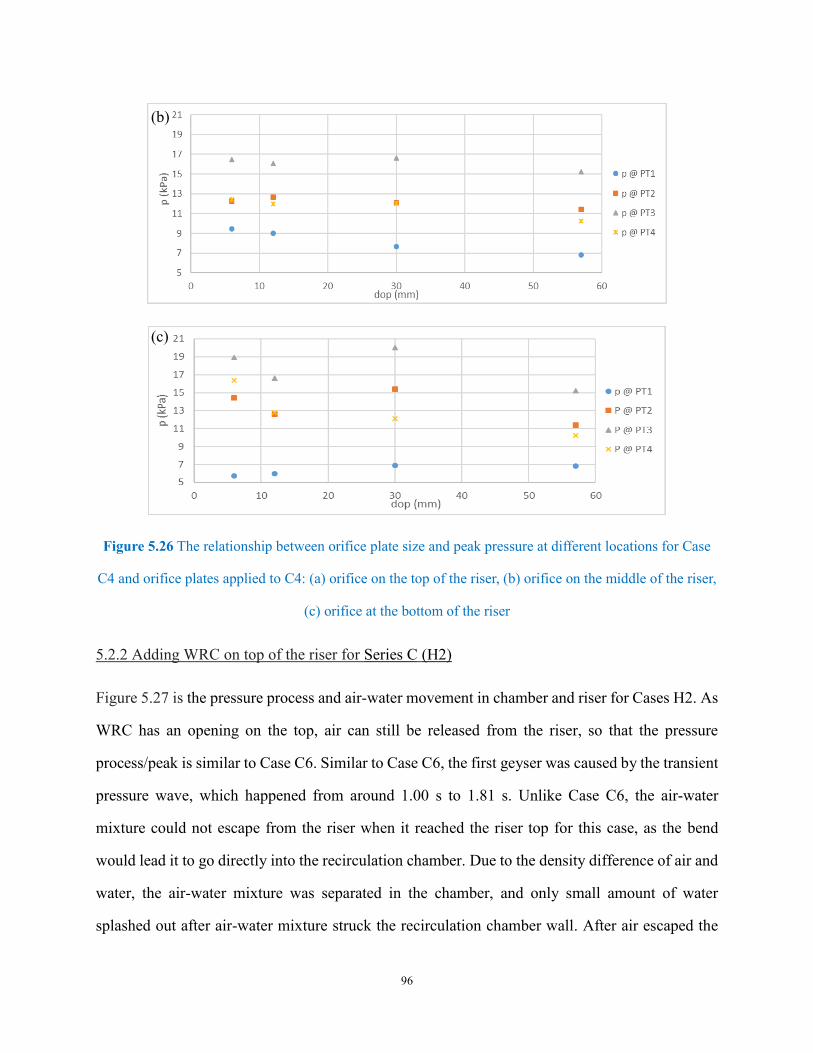
96
Figure 5.26 The relationship between orifice plate size and peak pressure at different locations for Case
C4 and orifice plates applied to C4: (a) orifice on the top of the riser, (b) orifice on the middle of the riser,
(c) orifice at the bottom of the riser
5.2.2 Adding WRC on top of the riser for Series C (H2)
Figure 5.27 is the pressure process and air-water movement in chamber and riser for Cases H2. As
WRC has an opening on the top, air can still be released from the riser, so that the pressure
process/peak is similar to Case C6. Similar to Case C6, the first geyser was caused by the transient
pressure wave, which happened from around 1.00 s to 1.81 s. Unlike Case C6, the air-water
mixture could not escape from the riser when it reached the riser top for this case, as the bend
would lead it to go directly into the recirculation chamber. Due to the density difference of air and
water, the air-water mixture was separated in the chamber, and only small amount of water
splashed out after air-water mixture struck the recirculation chamber wall. After air escaped the
(b)
(c)
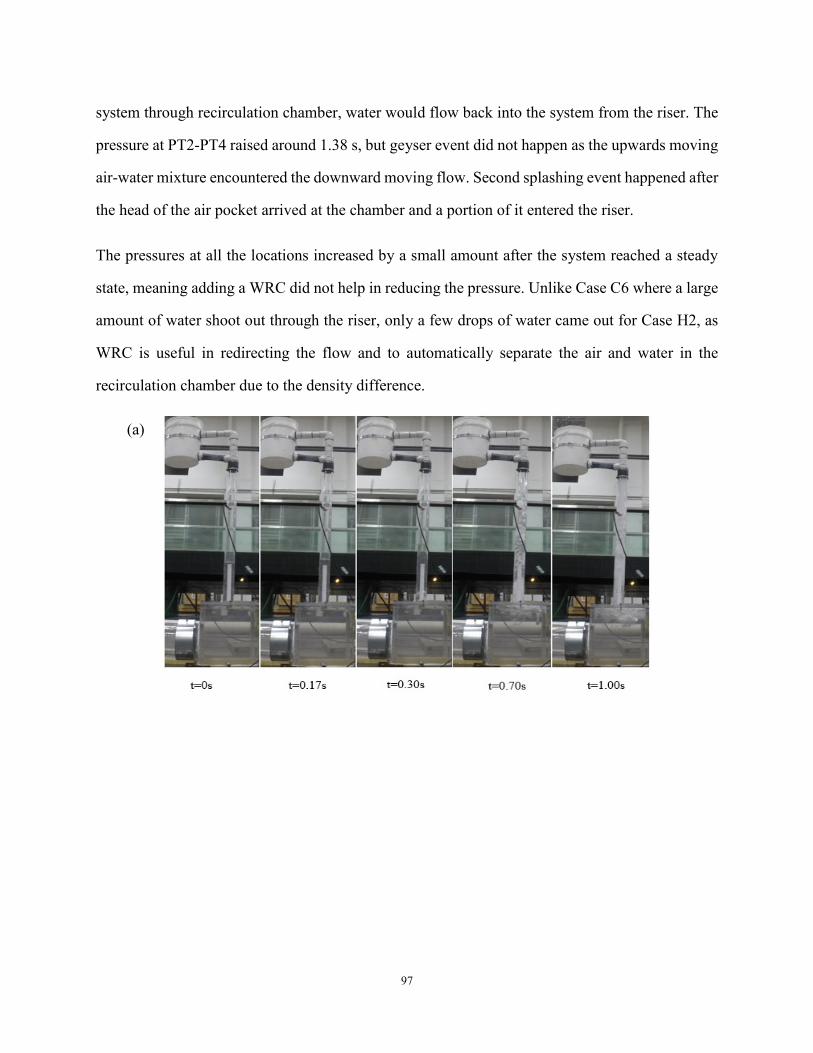
97
system through recirculation chamber, water would flow back into the system from the riser. The
pressure at PT2-PT4 raised around 1.38 s, but geyser event did not happen as the upwards moving
air-water mixture encountered the downward moving flow. Second splashing event happened after
the head of the air pocket arrived at the chamber and a portion of it entered the riser.
The pressures at all the locations increased by a small amount after the system reached a steady
state, meaning adding a WRC did not help in reducing the pressure. Unlike Case C6 where a large
amount of water shoot out through the riser, only a few drops of water came out for Case H2, as
WRC is useful in redirecting the flow and to automatically separate the air and water in the
recirculation chamber due to the density difference.
(a)
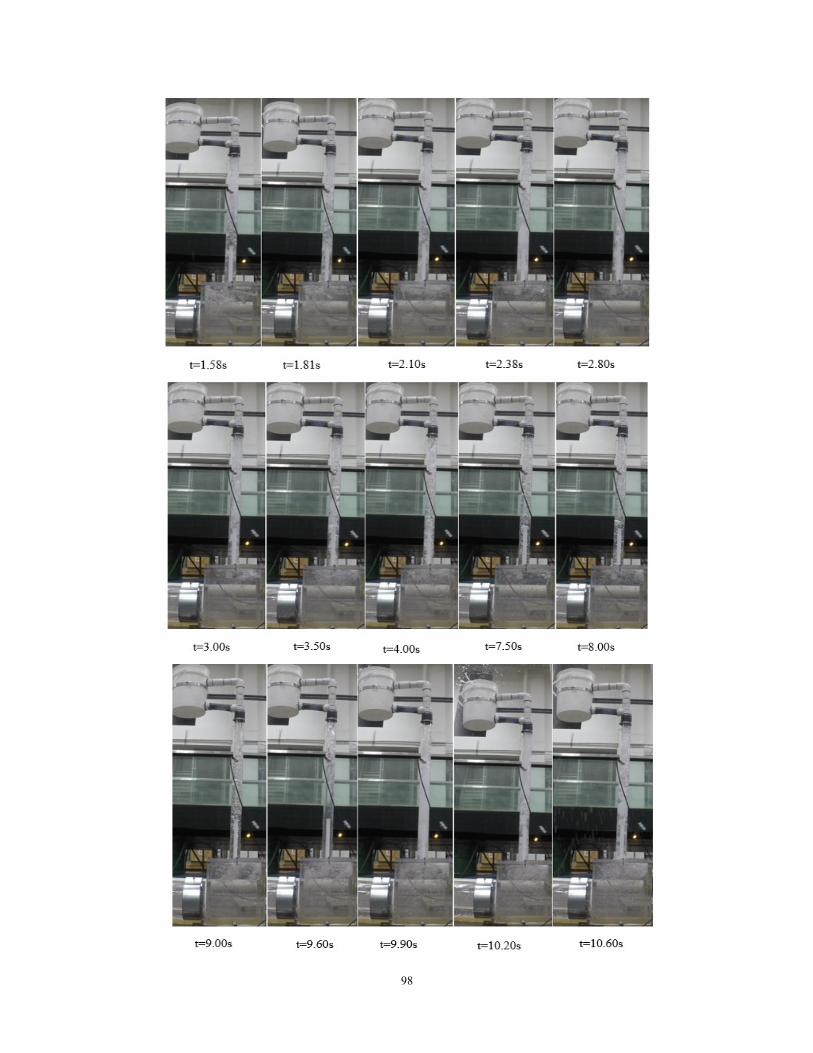
98
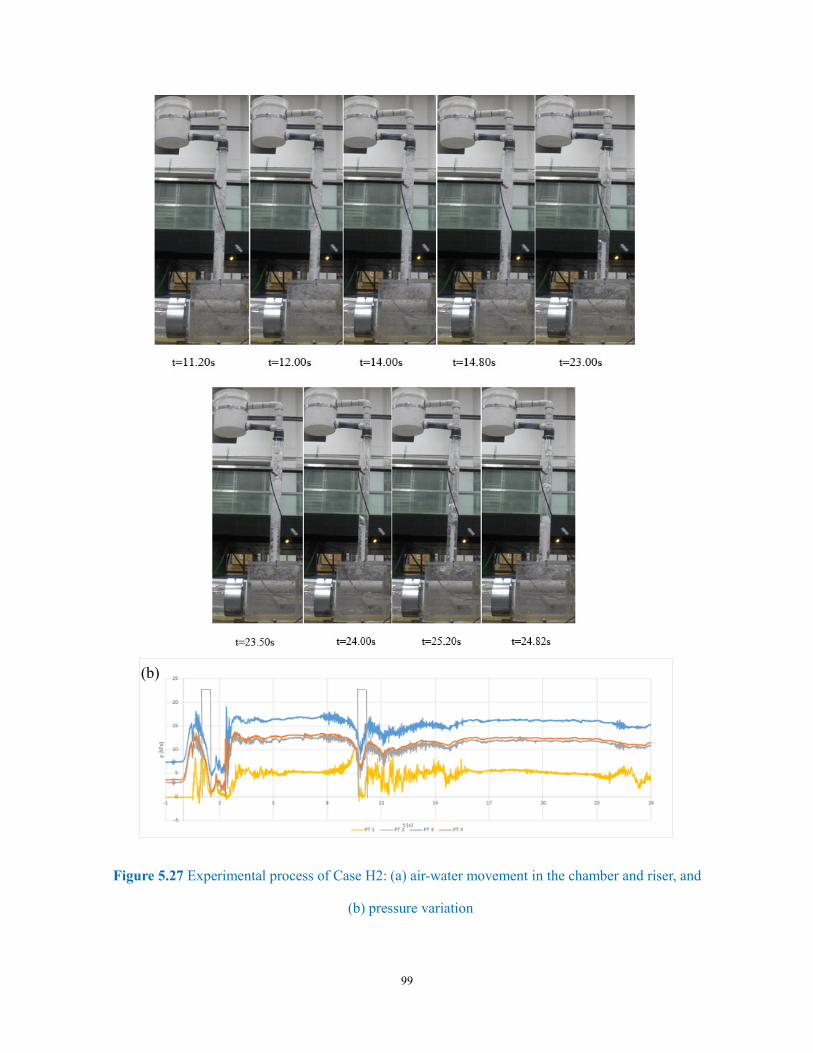
99
Figure 5.27 Experimental process of Case H2: (a) air-water movement in the chamber and riser, and
(b) pressure variation
(b)
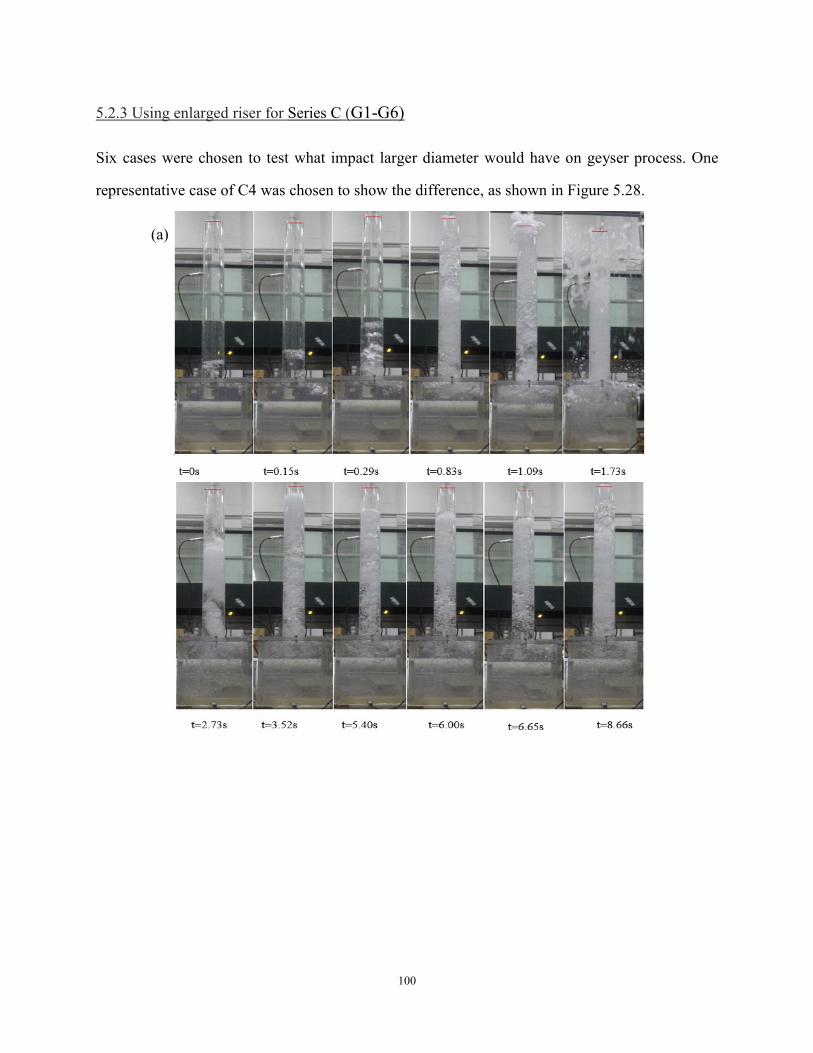
100
5.2.3 Using enlarged riser for Series C (G1-G6)
Six cases were chosen to test what impact larger diameter would have on geyser process. One
representative case of C4 was chosen to show the difference, as shown in Figure 5.28.
(a)
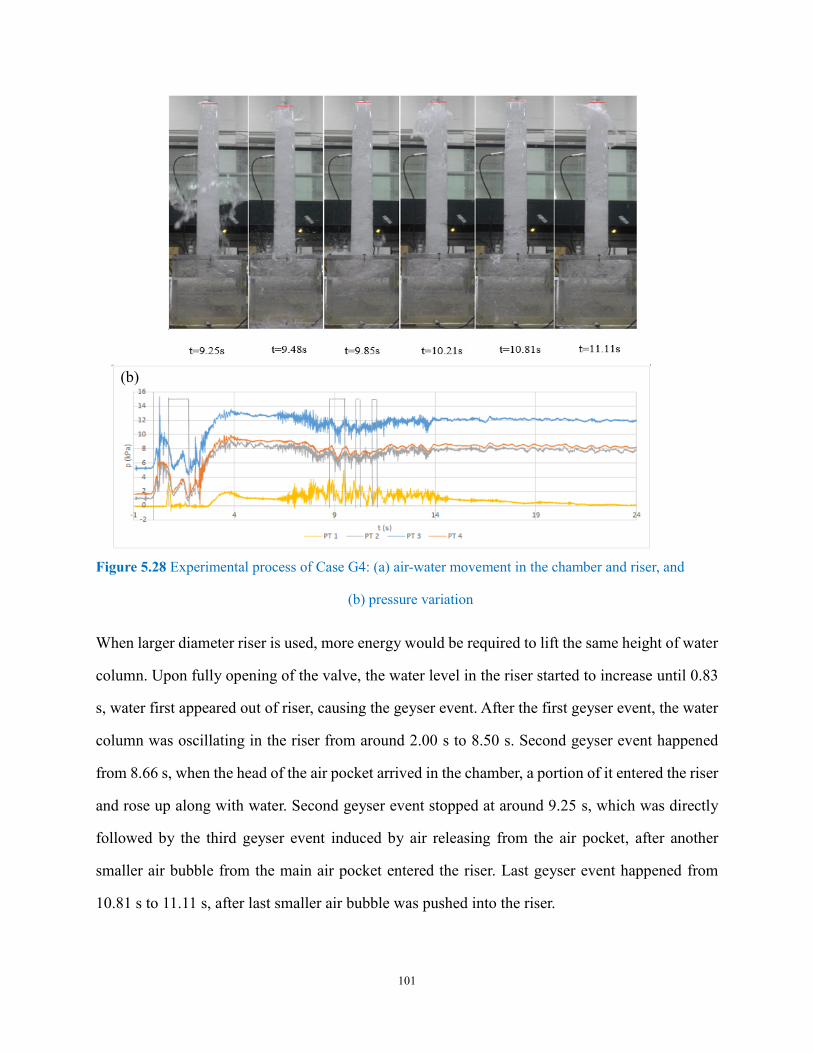
101
Figure 5.28 Experimental process of Case G4: (a) air-water movement in the chamber and riser, and
(b) pressure variation
When larger diameter riser is used, more energy would be required to lift the same height of water
column. Upon fully opening of the valve, the water level in the riser started to increase until 0.83
s, water first appeared out of riser, causing the geyser event. After the first geyser event, the water
column was oscillating in the riser from around 2.00 s to 8.50 s. Second geyser event happened
from 8.66 s, when the head of the air pocket arrived in the chamber, a portion of it entered the riser
and rose up along with water. Second geyser event stopped at around 9.25 s, which was directly
followed by the third geyser event induced by air releasing from the air pocket, after another
smaller air bubble from the main air pocket entered the riser. Last geyser event happened from
10.81 s to 11.11 s, after last smaller air bubble was pushed into the riser.
(b)
102
Compare Cases C4 with G4, the duration of geyser event is shorter for Case G4. The peak pressures
of the two cases were similar, with a reading of 15.20 kPa and 15.39 kPa respectively. Due to
gravity, more energy would be required to lift up the same height of water column in a larger
diameter riser. As air-water mixture in the original and enlarged riser possessed same energy when
it entered the riser, the existing velocity at the riser top for larger riser was smaller than that of the
original riser, which resulted in lower geyser height and reduced amount of water splashed out for
Case G4. The bubbles at the final steady stage would rise in the riser in the form of the oblate
bubble, instead of Taylor bubble, as gas viscosity is smaller for the bigger riser (Kajero et al. 2012).
5.3 Summary
5.3.1 Summary on retrofitting for Series B
The peak pressures and geyser heights for Case B3 and different retrofitting methods applied to
B3 are summarized. When an orifice plate is used on top of the riser, it can be seen that the peak
pressure decreased at PT2, PT3 and PT4, while increased at PT1, as the riser is pressurized,
compared with Case B3. Comparing Case B3 with Cases D1-1 to D1-4, Case D1-4 is the most
effective way in reducing peak pressures at PT2-PT4. For the geyser heights produced when
different orifice plates were used, Case D1-4 produced 0.70 m geyser while Cases D1-1, D1-2 and
D1-3 all produced less than 0.15 m geysers, which are all significantly lower than the original Case
B3 case of 4.20 m. It can be seen that the peak pressures at all the pressure measurement locations
increase when the size of orifice plate decrease. For Case D1-1, the peak pressure recorded in the
riser is about 5 times larger compared with Case B3. When orifice plate is used at the middle of
the riser, one geyser event happens when the orifice plate size is 6 mm. This happens when water
enters the riser and squeezes out from the small opening during air compression process. When
orifice plate is at the bottom of the riser, the peak pressure is similar to orifice plate at the middle,
but maximum geyser height is reduced, except for 30mm case, where the orifice plate acts as
smaller diameter riser. Case H1 produces a geyser that is approximately 1.3 m and Case F3
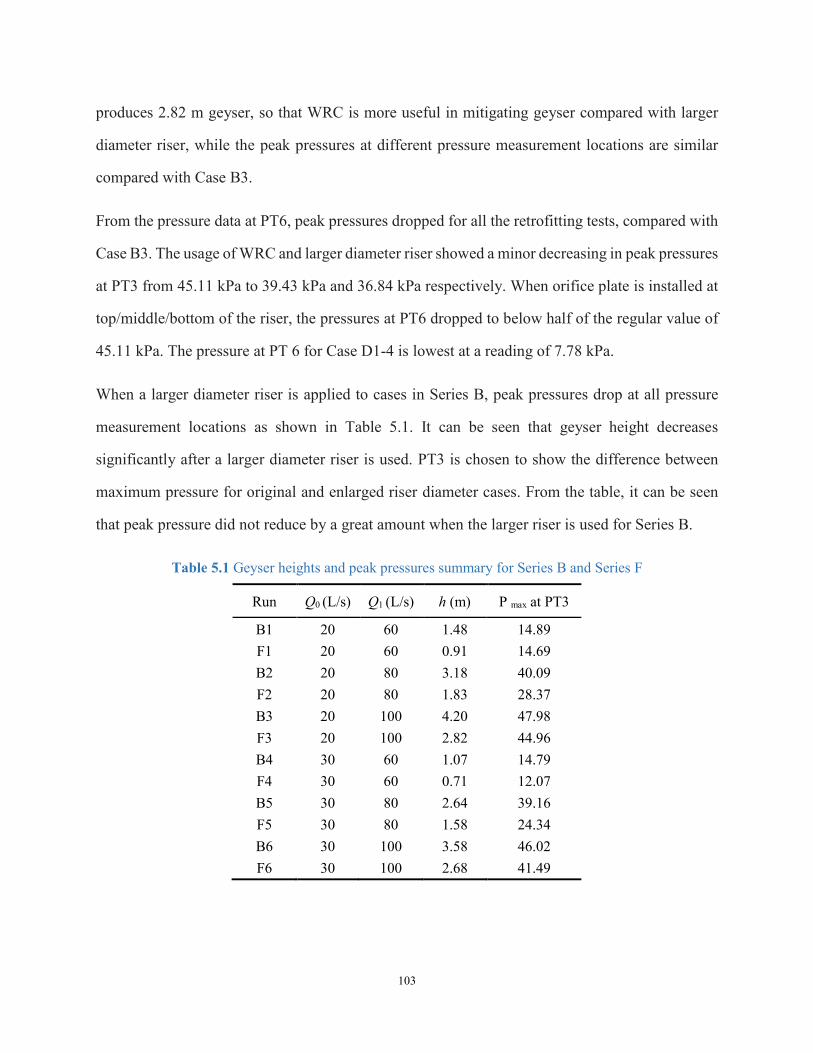
103
produces 2.82 m geyser, so that WRC is more useful in mitigating geyser compared with larger
diameter riser, while the peak pressures at different pressure measurement locations are similar
compared with Case B3.
From the pressure data at PT6, peak pressures dropped for all the retrofitting tests, compared with
Case B3. The usage of WRC and larger diameter riser showed a minor decreasing in peak pressures
at PT3 from 45.11 kPa to 39.43 kPa and 36.84 kPa respectively. When orifice plate is installed at
top/middle/bottom of the riser, the pressures at PT6 dropped to below half of the regular value of
45.11 kPa. The pressure at PT 6 for Case D1-4 is lowest at a reading of 7.78 kPa.
When a larger diameter riser is applied to cases in Series B, peak pressures drop at all pressure
measurement locations as shown in Table 5.1. It can be seen that geyser height decreases
significantly after a larger diameter riser is used. PT3 is chosen to show the difference between
maximum pressure for original and enlarged riser diameter cases. From the table, it can be seen
that peak pressure did not reduce by a great amount when the larger riser is used for Series B.
Table 5.1 Geyser heights and peak pressures summary for Series B and Series F
Run Q0 (L/s) Q1 (L/s) h (m) P max at PT3
B1 20 60 1.48 14.89
F1 20 60 0.91 14.69
B2 20 80 3.18 40.09
F2 20 80 1.83 28.37
B3 20 100 4.20 47.98
F3 20 100 2.82 44.96
B4 30 60 1.07 14.79
F4 30 60 0.71 12.07
B5 30 80 2.64 39.16
F5 30 80 1.58 24.34
B6 30 100 3.58 46.02
F6 30 100 2.68 41.49
104
In summary, using smaller size orifice plate (6mm) at the bottom of the riser is the best for Series
B in reducing peak pressure along the pipe and lowering maximum geyser height. However, more
air would be pushed into the downstream pipe and downstream tank as the orifice plate size
decreases, so the 6 mm OP case would push more of air into the downstream, compared with 12
mm and 30 mm OP cases.
5.3.2 Summary on retrofitting for series C
The peak pressures and geyser heights for Case C4 and different retrofitting methods applied to
C4 are summarized. When orifice plate is used on top of the riser, orifice plate with different orifice
size would not help lowering peak pressure, especially for Case E1-5, where the water hammer
pressure at PT1 is about 7 times higher than the original Case C4. For all orifice sizes, Case E1-7
has lowest peak pressure overall. The peak pressures at PT1 are similar for all the cases, except
for Case E1-5, in which the water hammer effect causes a pressure increase and larger amplitude
of pressure oscillation. When orifice plate is used at the middle of the riser, the peak pressures at
the same locations for all orifice sizes are similar, except that maximum pressure at PT1 for Case
E2-5 is smaller, because less air in the chamber is compressed before air-water mixture came out
through the riser. When orifice plate is used at bottom of the riser, although the peak pressure for
Case E3-1 is slightly higher than Cases E3-3 and E3-5, it produce much lower geyser of only 0.3
m.
6mm orifice plate produce the lowest geyser for all orifice plate locations in Table 5.3, and as peak
pressures at same locations are similar among the cases, 6 mm orifice plate is the best retrofitting
choice for Series C. As for the location of orifice plate, it should be used at the bottom for lower
height of geyser.
The peak pressures and geyser heights for Case C6 and different retrofitting methods applied to
C6 are summarized. This case is chosen as representative for Series C to study the peak pressure
105
in the downstream pipe, so that pressure at PT6 is measured. When orifice plate is used on top of
the riser, unlike D1 cases, where a gradual increase of pressure in the riser is seen as the orifice
size decreases, the pressure at PT1 for Case E1-6 is higher than Case E1-4 for this category, which
is due to resonance phenomenon that happens for Case E1-6. The variations in pressures are small
for different orifice sizes, so are the geyser heights. Water shot out from the riser for all the orifice
plate cases except for the fully sealed case, where no air or water can escape from the riser. Case
E1-4 produce a geyser height of 2.7 m in the form of mist. For orifice plate used at middle and
bottom of the riser, 6 mm OP is the best choice in terms of lowering geyser height and peak
pressure.
For use of a larger diameter riser, the height of geysers and peak pressures at different locations
both show a decreasing trend, but geyser still happen, and as a larger volume of water would be
splashed out from the riser for same height of water with a larger cross-sectional area, larger
diameter riser is not as effective in preventing geyser as orifice plate. When the larger diameter
riser is used to conduct the experiment (Case G6), both the geyser height and the duration of the
geyser is reduced.
The pressure peak is similar for Case C6 and Case H2, but as the geyser height is reduced from
2.60 m to 2.12 m, it do help in reducing the geyser height. The problem is that as the WRC is
directly attached to the top of the riser, it increased the distance water can travel from riser length
of 1.22 m to around 1.60 m.
Seen from the pressure at PT6, the value is similar for all the cases, with or without retrofitting
method, except for Case E3-6. Case E3-6 is worth noticing, as the geyser event is intense and the
maximum geyser height is 2.90 m. The reason for that is the orifice acting as a smaller diameter
riser rather than a blockage to prevent air from entering the riser.
In summary, from experiment point of view, using a small size orifice plate (6mm) at bottom of
the riser is the best retrofitting method for Series C, although a large amount of air was pushed

106
into the downstream. For use of WRC, although adding it on the top of the riser helped alleviate
geyser height, it did not help reduce the pressure in the system. When larger diameter riser is used,
peak pressures drop at all pressure measurement locations, but the peak pressures at different
pressure measurement locations are similar, as shown in Table 5.2.
Table 5.2 Geyser heights and peak pressures summary for Series C and Series G
Run Q0 (L/s) Q1 (L/s) hr (m) h (m) P max at PT3
C4 20 40 0.1 2.19 15.19
C5 20 40 0.2 2.49 17.84
C6 20 40 0.3 2.64 18.86
C1 15 40 0.1 3.23 18.56
C9 25 40 0.3 2.21 16.49
C12 30 40 0.3 1.90 13.08
G1 20 40 0.1 1.68 15.39
G2 20 40 0.2 1.75 16.09
G3 20 40 0.3 1.80 17.10
G4 15 40 0.1 1.88 17.15
G5 25 40 0.3 1.52 14.08
G6 30 40 0.3 1.31 12.40
When a larger diameter riser is used, the geyser phenomenon is alleviated in terms of height. All
the maximum geyser data are summarized in Figure 5.29. It can be seen that when the maximum
geyser height is the same, the peak pressure is smaller when riser diameter is larger. As all the
geyser height decreased for all cases with a larger diameter, peak pressure would decrease more.
Figure 5.29 Peak pressures vs. maximum geyser heights with original and larger size riser
107
6. Conclusions
6.1 Summary of the Present Study
This thesis reports an experimental investigation of two important aspects related to geyser events
in stormwater drainage systems: geyser mechanism and retrofitting methods. A physical model,
which consists of an inclined upstream pipe at a slope of 1%, a chamber with a vertical riser and a
horizontal downstream pipe, with a scale of around 1:20, was built in the T. Blench Hydraulic
Laboratory at the University of Alberta. In the experiment, four pressure transducers were used to
record the pressure data in the upstream pipe crown, chamber bottom, chamber top and riser, one
additional transducer is used to measure the pressure in upstream pipe bottom for some of the cases,
and the sixth one is used to measure the pressure in downstream pipe for selected cases. Four
cameras were used, with two tracking the water movement in the upstream pipe, one focused on
air/water interaction in chamber and riser and another one recording the height of geyser. Bulbs
were used along the pipe and connected to the data acquisition board, so that the pressure
measurement could be synchronized with the video recording.
Eight series of experiments have been conducted, with three series focused geyser mechanism and
five on geyser mitigation. Two geyser formation mechanisms have been studied, which are the
propagation of rapidly filling front and the air releasing from the air pocket. The rapid filling
regime is divided into two categories, downstream initially open channel flow or downstream
initially full pipe flow. Three geyser mitigation methods have been tested, which are orifice plate
on top, in the middle or at the bottom of the riser, water recirculation chamber on top of the riser
and enlarged diameter riser.
Based on the physical experiments, several conclusions can be summarized as follow:
Geyser events are not likely to happen when a filling front is advancing from upstream to
downstream while downstream is open channel flow with a lower water level. As the inflow
108
rate suddenly increases, the downstream pipe is large enough for all the air to pass quickly.
Water column can be seen in the riser after surge front strikes the chamber wall and reflects
back to fill the chamber.
Geyser events can be triggered by a rapidly filling front while the downstream pipe is full. As
the downstream pipe is full, when the inflow rate is suddenly increased, it would take some
time for the downstream pipe to adapt to the new flow rate, so that water could fill the
chamber rapidly and shoot out vertically through the riser.
Geyser can also be triggered by the movement of an entrapped air pocket in the upstream
pipe. As the air pocket is formed when a tailgate is lowered down to partially block the
outflow at the downstream pipe outlet, the capacity of outflow in the system is limited. When
inflow rate increased to the desired value, the thin layer of air that existed on top portion of
the upstream pipe between chamber and head of the air pocket would be pushed into the riser,
followed by main air pocket advancing towards the chamber, entering the riser and cause
geyser. This type of geyser formation is commonly seen in the field, and the geyser events
would go on intermittently as air pocket was separated into smaller discrete air bubbles.
Installation of the orifice plate is effective to decrease the geyser strength for Series B. In
series B, only two geyser event were captured in the form of mist. As for the peak pressure
produced by same size orifice but different location of orifice plate at PT1, orifice plate on
top of the riser would produce higher pressure as the entire riser is pressurized. As for the
orifice plate with different orifice size installed at middle/bottom of the riser, a smaller peak
pressure at PT1 and larger peak pressures at PT2-PT4 are seen for smaller opening orifice
plate.
Using orifice plate is effective in mitigating geyser for Series C. When orifice plate is used
on top of the riser, the height of geyser is higher than the original case for 6mm and 12mm
orifice plate, but in a form of thin water jet or mist, so that the amount of water shooting out
is greatly reduced. An orifice plate with a 12 mm orifice size (1/5 riser diameter) is dangerous
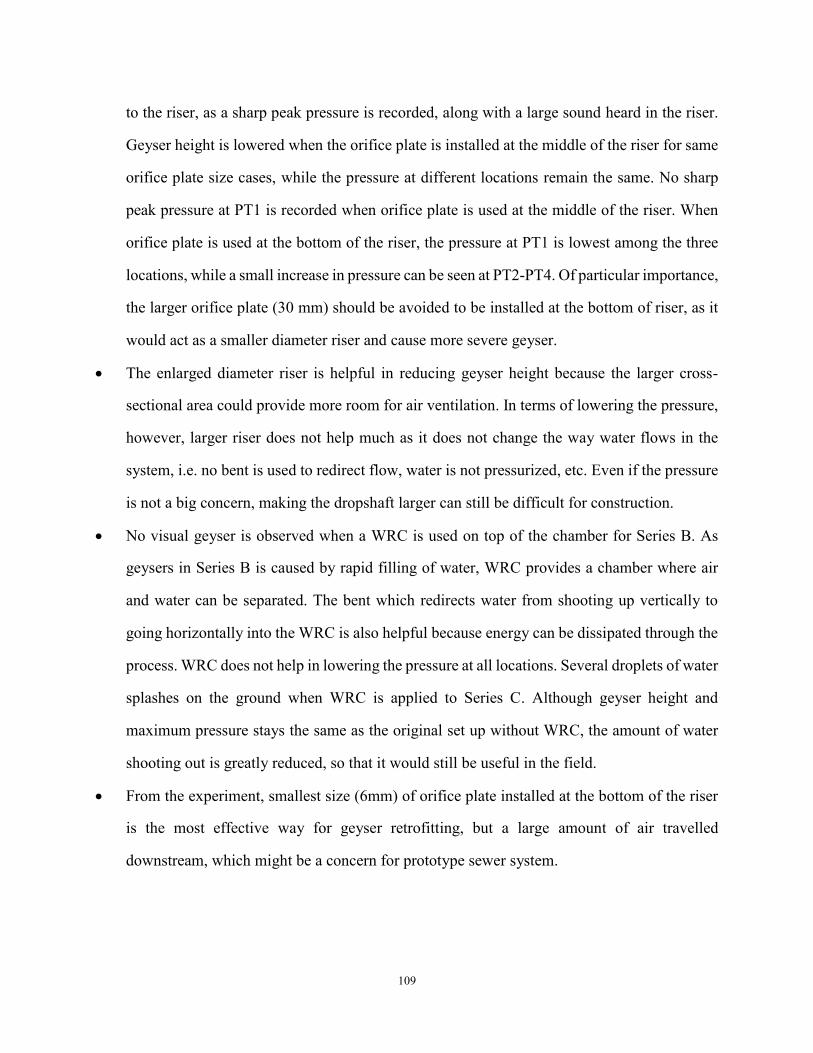
109
to the riser, as a sharp peak pressure is recorded, along with a large sound heard in the riser.
Geyser height is lowered when the orifice plate is installed at the middle of the riser for same
orifice plate size cases, while the pressure at different locations remain the same. No sharp
peak pressure at PT1 is recorded when orifice plate is used at the middle of the riser. When
orifice plate is used at the bottom of the riser, the pressure at PT1 is lowest among the three
locations, while a small increase in pressure can be seen at PT2-PT4. Of particular importance,
the larger orifice plate (30 mm) should be avoided to be installed at the bottom of riser, as it
would act as a smaller diameter riser and cause more severe geyser.
The enlarged diameter riser is helpful in reducing geyser height because the larger cross-
sectional area could provide more room for air ventilation. In terms of lowering the pressure,
however, larger riser does not help much as it does not change the way water flows in the
system, i.e. no bent is used to redirect flow, water is not pressurized, etc. Even if the pressure
is not a big concern, making the dropshaft larger can still be difficult for construction.
No visual geyser is observed when a WRC is used on top of the chamber for Series B. As
geysers in Series B is caused by rapid filling of water, WRC provides a chamber where air
and water can be separated. The bent which redirects water from shooting up vertically to
going horizontally into the WRC is also helpful because energy can be dissipated through the
process. WRC does not help in lowering the pressure at all locations. Several droplets of water
splashes on the ground when WRC is applied to Series C. Although geyser height and
maximum pressure stays the same as the original set up without WRC, the amount of water
shooting out is greatly reduced, so that it would still be useful in the field.
From the experiment, smallest size (6mm) of orifice plate installed at the bottom of the riser
is the most effective way for geyser retrofitting, but a large amount of air travelled
downstream, which might be a concern for prototype sewer system.
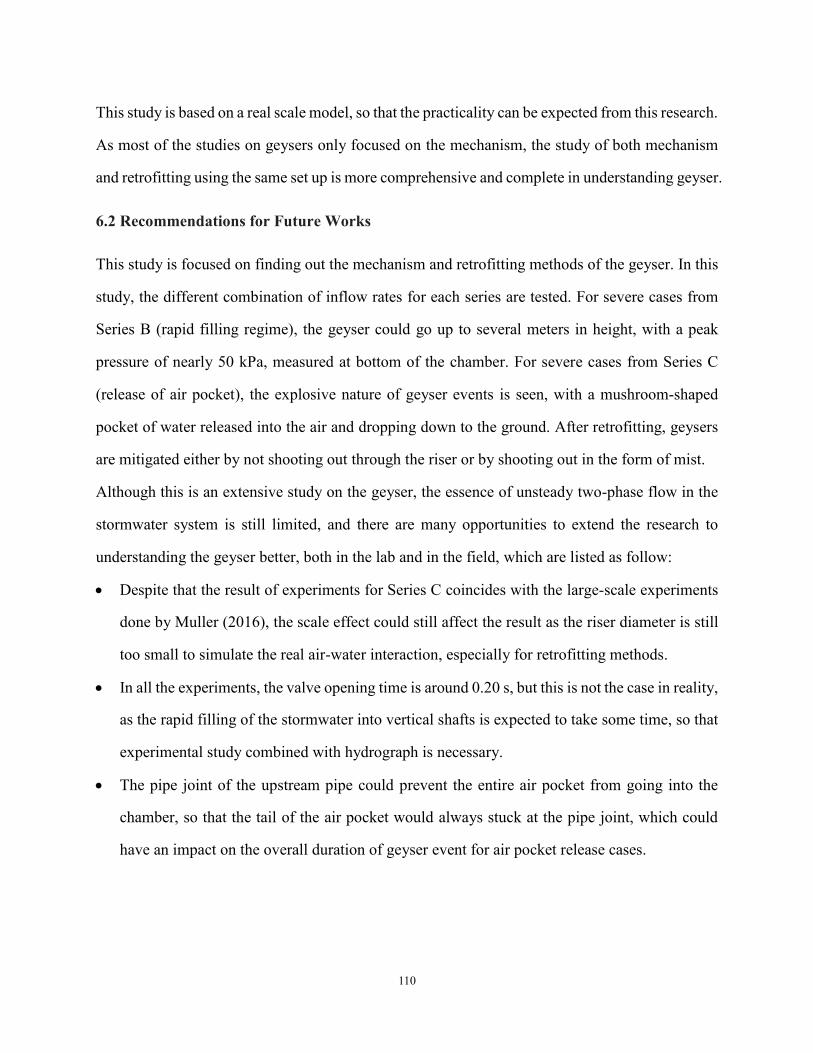
110
This study is based on a real scale model, so that the practicality can be expected from this research.
As most of the studies on geysers only focused on the mechanism, the study of both mechanism
and retrofitting using the same set up is more comprehensive and complete in understanding geyser.
6.2 Recommendations for Future Works
This study is focused on finding out the mechanism and retrofitting methods of the geyser. In this
study, the different combination of inflow rates for each series are tested. For severe cases from
Series B (rapid filling regime), the geyser could go up to several meters in height, with a peak
pressure of nearly 50 kPa, measured at bottom of the chamber. For severe cases from Series C
(release of air pocket), the explosive nature of geyser events is seen, with a mushroom-shaped
pocket of water released into the air and dropping down to the ground. After retrofitting, geysers
are mitigated either by not shooting out through the riser or by shooting out in the form of mist.
Although this is an extensive study on the geyser, the essence of unsteady two-phase flow in the
stormwater system is still limited, and there are many opportunities to extend the research to
understanding the geyser better, both in the lab and in the field, which are listed as follow:
Despite that the result of experiments for Series C coincides with the large-scale experiments
done by Muller (2016), the scale effect could still affect the result as the riser diameter is still
too small to simulate the real air-water interaction, especially for retrofitting methods.
In all the experiments, the valve opening time is around 0.20 s, but this is not the case in reality,
as the rapid filling of the stormwater into vertical shafts is expected to take some time, so that
experimental study combined with hydrograph is necessary.
The pipe joint of the upstream pipe could prevent the entire air pocket from going into the
chamber, so that the tail of the air pocket would always stuck at the pipe joint, which could
have an impact on the overall duration of geyser event for air pocket release cases.
111
References
Abdulmouti, H. (2014) Bubbly Two-Phase Flow: Part I- Characteristics, Structures, Behaviors and
Flow Patterns. American Journal of Fluid Dynamics, Vol. 4, No. 4.
Benjamin, T. B. (1968). Gravity Currents and Related Phenomena. Journal of Fluid Mechanics,
Vol. 31, No. 02.
CBC NEWS (2014) “UCLA Flood Geyser” http://www.cbc.ca/news/world/ucla-flood-geyser-
1.2722234
Chan, S. N., Cong J. and Lee J. H. W. (2018) 3D Numerical Modeling of Geyser Formation by
Release of Entrapped Air from Horizontal Pipe into Vertical Shaft. Journal of Hydraulic
Engineering, Vol. 144, No. 3
Chanson, H. (1996). Air Bubble Entrainment in Free-Surface Turbulent Shear Flows. Academic
Press. London, U. K.
Chosie C. D., Hatcher T. M. and Vasconcelos. J. G. (2014). Experimental and Numerical
Investigation on the Motion of Discrete Air Pockets in Pressurized Water Flows. Journal of
Hydraulic Engineering, Vol. 140, No. 8
Climate Central (2017). “Warmer Air Means More Evaporation and Precipitation”
http://www.climatecentral.org/gallery/graphics/warmer-air-means-more-evaporation-and-
precipitation
Cong J., Chan S. N. and Lee J. H. W. (2017). Geyser Formation by Release of Entrapped Air from
Horizontal Pipe into Vertical Shaft. Journal of Hydraulic Engineering, Vol.143, No. 9.
Davies, R.M. and Taylor, G.I. (1950). The Mechanics of Large Bubbles Rising Through Extended
Liquids and Through Liquids in Tubes. Proceedings of the Royal Society of London. Series A.
Mathematical and Physical Sciences, Vol. 200, No. 1062.
112
Guo, Q. and Song, C.S.S. (1991). Dropshaft Hydrodynamics under Transient Conditions. Journal
of Hydraulic Engineering, Vol. 117, No. 8.
Hatcher T. M. And Vasconcelos, J. G. (2017) Peak Pressure Surges and Pressure Damping
Following Sudden Air Pocket Compression. Journal of Hydraulic Engineering, Vol. 143, No. 4.
Huang, B. (2017). Study on Geysers in Urban Drainage Systems. Ph.D. Thesis.
Huang, B., Wu, S. and Zhu, D. (2017). Alleviating Geysers through Standpipes in Sewer Systems.
World Environmental and Water Resources Congress, Sacramento, CA, 2017
Kajero, O. T., Azzopardi, B. and Abdulkareem, L. A. (2012) Experimental Investigation of the
Effect of Liquid Viscosity on Slug Flow in Small Diameter Bubble Column. The European
Physical Journal Conferences, Vol. 25, No. 01037.
Li, L., and Zhu, D. (2018). “Modulation of the Transient Pressure by Air Pocket in a Horizontal
Pipe with an End Orifice.” Water Science and Technology, accepted.
Li, J., and Mccorquodale, J. A. (1999). Modelling Mixed Flow in Storm Sewers. Journal of
Hydraulic Engineering, Vol. 125, No. 11.
Muller, K. and Vasconcelos, J.G. (2016) Large-Scale Testing of Storm Water Geysers Caused by
the Sudden Release of Air Pockets—Preliminary Research Findings. World Environmental and
Water Resources Congress, West Palm Beach, FL, 2016.
Muller, K., Wang, J. and Vasconcelos, J.G. (2017) Water Displacement in Shafts and Geysering
Created by Uncontrolled Air Pocket Releases. Journal of Hydraulic Engineering, Vol. 143, No. 10.
Meniconi, S., Brunone, B. and Ferrante, M. (2012) Water-Hammer Pressure Waves Interaction at
Cross-Section Changes in Series in Viscoelastic Pipes. Journal of Fluids and Structures, Vol. 33.
Morgado, A. O., Miranda, J. M., Araujo, J. D. P., and Campos J. B. L. M. (2016). Review on
Vertical Gas-Liquid Slug flow. International Journal of Multiphase Flow, Vol 85.
113
Perron, A., Kiss, L. I. and Poncsak, S. (2006). An Experimental Investigation of the Motion of
Single Bubbles under a Slightly Inclined Surface. International Journal of Multiphase Flow, Vol.32,
No. 5.
Ramezani, L., Karney, B., and Malekpour, A. (2016). Encouraging Effective Air Management in
Water Pipelines: A Critical Review. Journal of Water Resources Planning and Management, Vol.
142, No. 12.
Vasconcelos, J. G. and Hatcher, T. M. (2017). Peak Pressure Surges and Pressure Damping
Following Sudden Air Pocket Compression. Journal of Hydraulic Engineering, Vol. 143, No.4.
Vasconcelos, J. G. and Wright, S. J. (2006). Mechanisms for Air Pocket Entrapment in Stormwater
Storage Tunnels. World Environmental and Water Resources Congress, Omaha, NE, 2006.
Vasconcelos, J. G. and Wright, S. J. (2017). Anticipating Transient Problems during the Rapid
Filling of Deep Stormwater Storage Tunnel Systems. Journal of Hydraulic Engineering, Vol. 143,
No. 3.
Vasconcelos, J.G. and Wright, S.J. (2011). Geysering Generated by Large Air Pockets Released
Through Water-Filled Ventilation Shafts. Journal of Hydraulic Engineering, Vol. 137, No. 5.
Wright, S. J., Lewis, J. W., and Vasconcelos, J. G. (2011). Geysering in Rapidly Filling Storm-
Water Tunnels. Journal of Hydraulic Engineering, Vol.137, No. 1.
Wright, S. J., Vasconcelos, J. G., Creech, C. T., and Lewis, J. W. (2008). Flow Regime Transition
Mechanisms in Rapidly Filling Stormwater Storage Tunnels. Environmental Fluid Mechanics, Vol.
8, No. 5.
Wright, S. J., Vasconcelos, J. G., Lewis, J. W. and Creech, C. T. (2009) Flow Regime Transition
and Air Entrapment in Combined Sewer Storage Tunnels. Journal of Water Management Modeling,
R235-15
114
YouTube (2011). “Montreal Canada Street's Manhole Erupts during a Strom - Like a Geyser
https://www.youtube.com/watch?v=OYuplf0WmmM
Zhou, F., Hicks, F. E. and Steffler, P. M. (2002 a). Effects of Trapped Air on Flow Transients in
Rapidly Filling Sewers. Annual Conference of the Canadian Society for Civil Engineering,
Montréal, Québec, 2002.
Zhou, F., Hicks, F. E. and Steffler, P. M. (2002 b). Transient Flow in A Rapidly Filling Horizontal
Pipe Containing Trapped Air. Journal of Hydraulic Engineering, Vol. 128, No. 6.
Zhou, F., Hicks, F. E. and Steffler, P. M. (2004). Analysis of Effects of Air Pocket on Hydraulic
Failure of Urban Drainage Infrastructure. Canadian Journal of Civil Engineering, Vol. 31, No. 1.
Zhou, L., Liu, D. and Kayney, B. (2013) Investigation of Hydraulic Transients of Two Entrapped
Air Pockets in a Water Pipeline. Journal of Hydraulic Engineering, Vol. 139, No. 9.
Related Documents