Experimental study of trace element partitioning between enstatite and melt in enstatite chondrites at low oxygen fugacities and 5 GPa Camille Cartier a,b,c,⇑ , Tahar Hammouda a,b,c , Re ´gis Doucelance a,b,c , Maud Boyet a,b,c , Jean-Luc Devidal a,b,c , Bertrand Moine b,c,d a Clermont Universite ´, Universite ´ Blaise Pascal, Laboratoire Magmas et Volcans, BP 10448, F-63000 Clermont-Ferrand, France b CNRS, UMR 6524, LMV, F-63038 Clermont-Ferrand, France c IRD, R 163, LMV, F-63038 Clermont-Ferrand, France d De ´partement de Ge ´ ologie, Universite ´ Jean Monnet, 23 rue du Dr. P. Michelon, 42023 Saint-Etienne, Cedex 02, France Received 27 March 2013; accepted in revised form 6 January 2014; Available online 19 January 2014 Abstract In order to investigate the influence of very reducing conditions, we report enstatite-melt trace element partition coefficients (D) obtained on enstatite chondrite material at 5 GPa and under oxygen fugacities (fO 2 ) ranging between 0.8 and 8.2 log units below the iron–wustite (IW) buffer. Experiments were conducted in a multianvil apparatus between 1580 and 1850 °C, using doped (Sc, V, REE, HFSE, U, Th) starting materials. We used a two-site lattice strain model and a Monte-Carlo-type approach to model experimentally determined partition coefficient data. The model can fit our partitioning data, i.e. trace elements repartition in enstatite, which provides evidence for the attainment of equilibrium in our experiments. The precision on the lattice strain model parameters obtained from modelling does not enable determination of the influence of intensive parameters on crystal chemical partitioning, within our range of conditions (fO 2 , P, T, composition). We document the effect of variable oxygen fugacity on the partitioning of multivalent elements. Cr and V, which are trivalent in the pyroxene at around IW 1 are reduced to 2+ state with increasingly reducing conditions, thus affecting their partition coefficients. In our range of redox conditions Ti is always present as a mixture between 4+ and 3+ states. However the Ti 3+ -Ti 4+ ratio increases strongly with increasingly reducing conditions. Moreover in highly reducing conditions, Nb and Ta, that usually are pentavalent in magmatic systems, appear to be reduced to lower valence species, which may be Nb 2+ and Ta 3+ . We pro- pose a new proxy for fO 2 based on D(Cr)/D(V). Our new data extend the redox range covered by previous studies and allows this proxy to be used in the whole range of redox conditions of the solar system objects. We selected trace-element literature data of six chondrules on the criterion of their equilibrium. Applying the proxy to opx-matrix systems, we estimated that three type I chondrules have equilibrated at IW 7 ± 1, one type I chondrule at IW 4 ± 1, and two type II chondrules at IW + 3 ± 1. This first accurate estimation of enstatite-melt fO 2 for type I chondrules is very close to CAI values. Ó 2014 Published by Elsevier Ltd. 1. INTRODUCTION Mineral-melt partition coefficients (D) are used to model partial melting and crystallization processes. A substantial trace element D database is available in the literature, which mainly concerns conditions matching those of the modern http://dx.doi.org/10.1016/j.gca.2014.01.002 0016-7037/Ó 2014 Published by Elsevier Ltd. ⇑ Corresponding author at: Clermont Universite ´, Universite ´ Blaise Pascal, Laboratoire Magmas et Volcans, BP 10448, F-63000 Clermont-Ferrand, France. Tel.: +33 473346891. E-mail address: [email protected] (C. Cartier). www.elsevier.com/locate/gca Available online at www.sciencedirect.com ScienceDirect Geochimica et Cosmochimica Acta 130 (2014) 167–187

Welcome message from author
This document is posted to help you gain knowledge. Please leave a comment to let me know what you think about it! Share it to your friends and learn new things together.
Transcript
Available online at www.sciencedirect.com
www.elsevier.com/locate/gca
ScienceDirect
Geochimica et Cosmochimica Acta 130 (2014) 167–187
Experimental study of trace element partitioning betweenenstatite and melt in enstatite chondrites at low oxygen
fugacities and 5 GPa
Camille Cartier a,b,c,⇑, Tahar Hammouda a,b,c, Regis Doucelance a,b,c,Maud Boyet a,b,c, Jean-Luc Devidal a,b,c, Bertrand Moine b,c,d
a Clermont Universite, Universite Blaise Pascal, Laboratoire Magmas et Volcans, BP 10448, F-63000 Clermont-Ferrand, Franceb CNRS, UMR 6524, LMV, F-63038 Clermont-Ferrand, France
c IRD, R 163, LMV, F-63038 Clermont-Ferrand, Franced Departement de Geologie, Universite Jean Monnet, 23 rue du Dr. P. Michelon, 42023 Saint-Etienne, Cedex 02, France
Received 27 March 2013; accepted in revised form 6 January 2014; Available online 19 January 2014
Abstract
In order to investigate the influence of very reducing conditions, we report enstatite-melt trace element partition coefficients(D) obtained on enstatite chondrite material at 5 GPa and under oxygen fugacities (fO2) ranging between 0.8 and 8.2 log unitsbelow the iron–wustite (IW) buffer. Experiments were conducted in a multianvil apparatus between 1580 and 1850 �C, usingdoped (Sc, V, REE, HFSE, U, Th) starting materials. We used a two-site lattice strain model and a Monte-Carlo-typeapproach to model experimentally determined partition coefficient data. The model can fit our partitioning data, i.e. traceelements repartition in enstatite, which provides evidence for the attainment of equilibrium in our experiments. The precisionon the lattice strain model parameters obtained from modelling does not enable determination of the influence of intensiveparameters on crystal chemical partitioning, within our range of conditions (fO2, P, T, composition). We document the effectof variable oxygen fugacity on the partitioning of multivalent elements. Cr and V, which are trivalent in the pyroxene ataround IW � 1 are reduced to 2+ state with increasingly reducing conditions, thus affecting their partition coefficients. Inour range of redox conditions Ti is always present as a mixture between 4+ and 3+ states. However the Ti3+-Ti4+ ratioincreases strongly with increasingly reducing conditions. Moreover in highly reducing conditions, Nb and Ta, that usuallyare pentavalent in magmatic systems, appear to be reduced to lower valence species, which may be Nb2+ and Ta3+. We pro-pose a new proxy for fO2 based on D(Cr)/D(V). Our new data extend the redox range covered by previous studies and allowsthis proxy to be used in the whole range of redox conditions of the solar system objects. We selected trace-element literaturedata of six chondrules on the criterion of their equilibrium. Applying the proxy to opx-matrix systems, we estimated that threetype I chondrules have equilibrated at IW � 7 ± 1, one type I chondrule at IW � 4 ± 1, and two type II chondrules atIW + 3 ± 1. This first accurate estimation of enstatite-melt fO2 for type I chondrules is very close to CAI values.� 2014 Published by Elsevier Ltd.
http://dx.doi.org/10.1016/j.gca.2014.01.002
0016-7037/� 2014 Published by Elsevier Ltd.
⇑ Corresponding author at: Clermont Universite, UniversiteBlaise Pascal, Laboratoire Magmas et Volcans, BP 10448,F-63000 Clermont-Ferrand, France. Tel.: +33 473346891.
E-mail address: [email protected] (C. Cartier).
1. INTRODUCTION
Mineral-melt partition coefficients (D) are used to modelpartial melting and crystallization processes. A substantialtrace element D database is available in the literature, whichmainly concerns conditions matching those of the modern
168 C. Cartier et al. / Geochimica et Cosmochimica Acta 130 (2014) 167–187
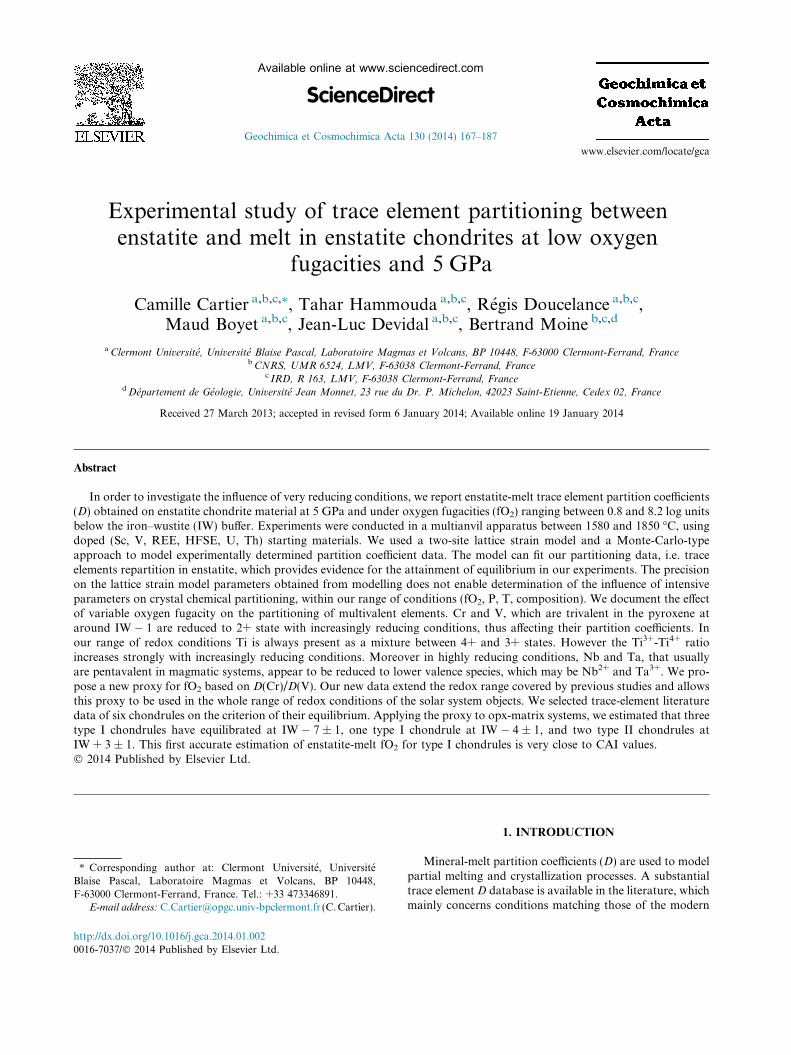
terrestrial mantle. The behavior of trace elements is lessknown for more reduced conditions, relevant to someplanetesimals, which are significantly more reduced thanthe present day terrestrial mantle (e.g. acapulcoites, lodra-nites, enstatite chondrites, Fig. 1). Since the different groupsof chondrites are formed under different redox conditions,it is crucial to understand if the nature of the material in-volved in Earth’s accretion is a critical parameter to modelthe partitioning of trace elements caused by early meltingevents. A very early differentiation (<30 Ma after the firstsolids formed in the solar system) of the silicate Earth hasbeen invoked to explain the small variations of the142Nd/144Nd ratios measured between terrestrial samplesand chondrites (Boyet and Carlson, 2005). The terrestrialmantle at this stage should have been more reduced than to-day since accretion models usually consider initially re-duced material and progressive oxidation due to coreseparation, and late veneer arrival (Wade and Wood,2005; Albarede, 2009).
There are lines of evidence that suggest that enstatitechondrites (EC), which are the most reduced undifferenti-ated extraterrestrial material, may have played a major rolein Earth’s accretion (Javoy et al., 2010). Firstly, EC (to-gether with CI carbonaceous chondrites) are the only mete-orite group that falls on the oxygen isotope terrestrialfractionation line (Clayton, 1993), suggesting a genetic linkbetween the parent bodies. This chemical similarity betweenthe Earth and EC is also observed for other isotopes: nitro-gen (Javoy et al., 1984), molybdenum and ruthenium (Dau-phas et al., 2004), osmium (Meisel et al., 1996), radiogenic53Cr and non-radiogenic 54Cr (Trinquier et al., 2007) andtitanium (Trinquier et al., 2009). In addition, the presenceof a large Fe(Ni) metallic core suggests accretion of primi-tive material containing a large proportion of metal, i.e. ahigh Fe-FeO ratio corresponding to reduced material, pos-sibly with enstatite chondrite characteristics. Secondly, the
-10 -4 -2 0-8ΔIW
Depleted ShergottitesMartian Mantle S
MARS
M
EARTH
C
-6
Lunar Mantle
AubriteParent Body
Eucrites A
LowerMantle
EL6EH4
AcapulcoitesLodranites
CO3H
Incr
easi
ng p
aren
t bod
y si
ze
Fig. 1. Intrinsinc oxygen fugacity of various objects of the Solar system, rLunar and Martian values after Wadhwa (2001). Terrestrial fO2 values arLodranites and Acapulcoıtes fO2s were calculated using Williams (1971) mdata from Papike et al. (1995). CO3 (carbonaceous), H (ordinary) and EEH4 enstatite chondrite point is from McCoy et al. (1999). Thick dashed liestimate, which is below IW � 10.
segregation of the core has to occur under reducing condi-tions. This step may have occurred either at high pressure inan already large Earth, or simultaneously in several smallbodies before they accreted. In this paper we do not wantto impose the view that the Earth’s starting material is anenstatite chondrite. Recent results obtained on Si isotopesrefute or at least question this assumption (Fitoussi andBourdon, 2012; Savage and Moynier, 2013). However thestudy of these objects and their conditions of evolution re-quires accurate knowledge of the influence of redox condi-tions in the history of the Solar system. The early Solarsystem experienced an extremely wide range of redox condi-tions (Grossman et al., 2008), with CAIs (calcium alumin-ium rich inclusions) and EC representing the mostreduced witnesses. Enstatite chondrites could have under-gone oxygen fugacities well below IW � 3 (Larimer and Bu-seck, 1974; Brett and Sato, 1984) and fassaite in CAIscorresponds to an intrinsic fO2 of IW � 6.8 (Grossmanet al., 2008). Our aim is to study mineral-melt partitioningat a wide range of oxygen fugacities down to IW � 8.
Here we report first experimental determination ofpyroxene-melt partition coefficients of Sc, V, Cr, Mn andY, rare earth elements (REE), high field strength elements(HFSE), U and Th at very reducing conditions. Experimentswere performed at 5 GPa and for a large range of redox con-ditions, from around 1 down to 8 log units below the iron–wustite (IW) buffer. Our newly obtained D values will beused to provide new estimates of the redox conditions pre-vailing during opx-melt equilibration in chondrules.
2. METHODS
2.1. Starting material
Starting material consists of natural equilibrated ECHvittis (EL6, see the composition given by Rubin, 1983,
2 4 6 8
Enriched hergottites
Nakhlites
OON
ACHONDRITES
10
HONDRITES
ngrites
MORB Andesites Lamprophyres
elative to iron–wustite (IW) equilibrium. Aubrite, Eucrite, Angrite,e taken from Carmichael (1991) and Frost and McCammon (2008).ethod on Lodranites data from Zipfel et al. (1995) and AcapulcoıtesL6 (enstatite) chondrite fO2 values are from Brett and Sato (1984).ne connects enstatite chondrite values to Larimer and Buseck (1974)
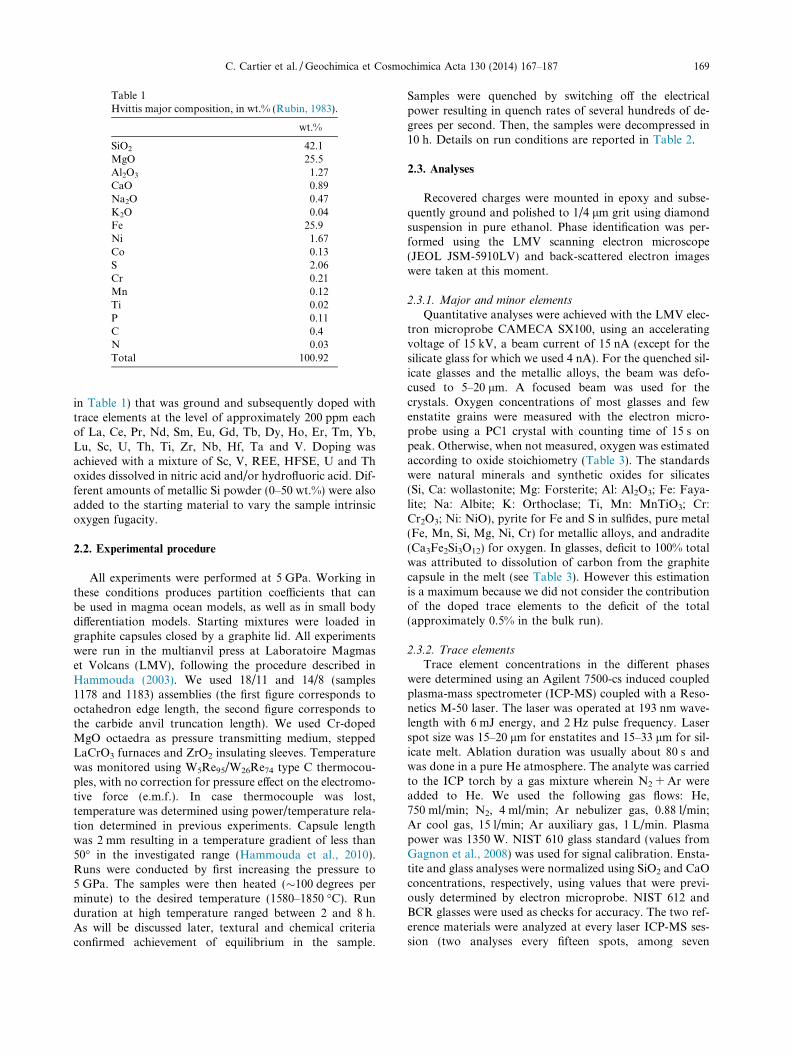
Table 1Hvittis major composition, in wt.% (Rubin, 1983).
wt.%
SiO2 42.1MgO 25.5Al2O3 1.27CaO 0.89Na2O 0.47K2O 0.04Fe 25.9Ni 1.67Co 0.13S 2.06Cr 0.21Mn 0.12Ti 0.02P 0.11C 0.4N 0.03Total 100.92
C. Cartier et al. / Geochimica et Cosmochimica Acta 130 (2014) 167–187 169
in Table 1) that was ground and subsequently doped withtrace elements at the level of approximately 200 ppm eachof La, Ce, Pr, Nd, Sm, Eu, Gd, Tb, Dy, Ho, Er, Tm, Yb,Lu, Sc, U, Th, Ti, Zr, Nb, Hf, Ta and V. Doping wasachieved with a mixture of Sc, V, REE, HFSE, U and Thoxides dissolved in nitric acid and/or hydrofluoric acid. Dif-ferent amounts of metallic Si powder (0–50 wt.%) were alsoadded to the starting material to vary the sample intrinsicoxygen fugacity.
2.2. Experimental procedure
All experiments were performed at 5 GPa. Working inthese conditions produces partition coefficients that canbe used in magma ocean models, as well as in small bodydifferentiation models. Starting mixtures were loaded ingraphite capsules closed by a graphite lid. All experimentswere run in the multianvil press at Laboratoire Magmaset Volcans (LMV), following the procedure described inHammouda (2003). We used 18/11 and 14/8 (samples1178 and 1183) assemblies (the first figure corresponds tooctahedron edge length, the second figure corresponds tothe carbide anvil truncation length). We used Cr-dopedMgO octaedra as pressure transmitting medium, steppedLaCrO3 furnaces and ZrO2 insulating sleeves. Temperaturewas monitored using W5Re95/W26Re74 type C thermocou-ples, with no correction for pressure effect on the electromo-tive force (e.m.f.). In case thermocouple was lost,temperature was determined using power/temperature rela-tion determined in previous experiments. Capsule lengthwas 2 mm resulting in a temperature gradient of less than50� in the investigated range (Hammouda et al., 2010).Runs were conducted by first increasing the pressure to5 GPa. The samples were then heated (�100 degrees perminute) to the desired temperature (1580–1850 �C). Runduration at high temperature ranged between 2 and 8 h.As will be discussed later, textural and chemical criteriaconfirmed achievement of equilibrium in the sample.
Samples were quenched by switching off the electricalpower resulting in quench rates of several hundreds of de-grees per second. Then, the samples were decompressed in10 h. Details on run conditions are reported in Table 2.
2.3. Analyses
Recovered charges were mounted in epoxy and subse-quently ground and polished to 1/4 lm grit using diamondsuspension in pure ethanol. Phase identification was per-formed using the LMV scanning electron microscope(JEOL JSM-5910LV) and back-scattered electron imageswere taken at this moment.
2.3.1. Major and minor elements
Quantitative analyses were achieved with the LMV elec-tron microprobe CAMECA SX100, using an acceleratingvoltage of 15 kV, a beam current of 15 nA (except for thesilicate glass for which we used 4 nA). For the quenched sil-icate glasses and the metallic alloys, the beam was defo-cused to 5–20 lm. A focused beam was used for thecrystals. Oxygen concentrations of most glasses and fewenstatite grains were measured with the electron micro-probe using a PC1 crystal with counting time of 15 s onpeak. Otherwise, when not measured, oxygen was estimatedaccording to oxide stoichiometry (Table 3). The standardswere natural minerals and synthetic oxides for silicates(Si, Ca: wollastonite; Mg: Forsterite; Al: Al2O3; Fe: Faya-lite; Na: Albite; K: Orthoclase; Ti, Mn: MnTiO3; Cr:Cr2O3; Ni: NiO), pyrite for Fe and S in sulfides, pure metal(Fe, Mn, Si, Mg, Ni, Cr) for metallic alloys, and andradite(Ca3Fe2Si3O12) for oxygen. In glasses, deficit to 100% totalwas attributed to dissolution of carbon from the graphitecapsule in the melt (see Table 3). However this estimationis a maximum because we did not consider the contributionof the doped trace elements to the deficit of the total(approximately 0.5% in the bulk run).
2.3.2. Trace elements
Trace element concentrations in the different phaseswere determined using an Agilent 7500-cs induced coupledplasma-mass spectrometer (ICP-MS) coupled with a Reso-netics M-50 laser. The laser was operated at 193 nm wave-length with 6 mJ energy, and 2 Hz pulse frequency. Laserspot size was 15–20 lm for enstatites and 15–33 lm for sil-icate melt. Ablation duration was usually about 80 s andwas done in a pure He atmosphere. The analyte was carriedto the ICP torch by a gas mixture wherein N2 + Ar wereadded to He. We used the following gas flows: He,750 ml/min; N2, 4 ml/min; Ar nebulizer gas, 0.88 l/min;Ar cool gas, 15 l/min; Ar auxiliary gas, 1 L/min. Plasmapower was 1350 W. NIST 610 glass standard (values fromGagnon et al., 2008) was used for signal calibration. Ensta-tite and glass analyses were normalized using SiO2 and CaOconcentrations, respectively, using values that were previ-ously determined by electron microprobe. NIST 612 andBCR glasses were used as checks for accuracy. The two ref-erence materials were analyzed at every laser ICP-MS ses-sion (two analyses every fifteen spots, among seven
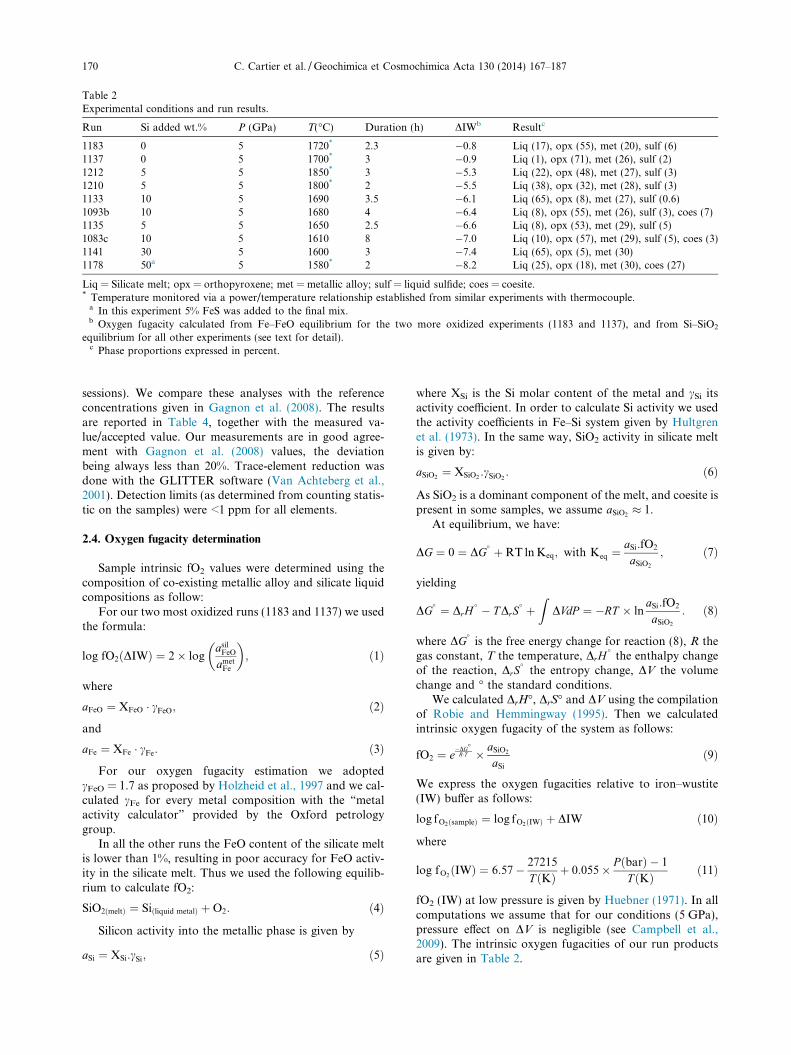
Table 2Experimental conditions and run results.
Run Si added wt.% P (GPa) T(�C) Duration (h) DIWb Resultc
1183 0 5 1720* 2.3 �0.8 Liq (17), opx (55), met (20), sulf (6)1137 0 5 1700* 3 �0.9 Liq (1), opx (71), met (26), sulf (2)1212 5 5 1850* 3 �5.3 Liq (22), opx (48), met (27), sulf (3)1210 5 5 1800* 2 �5.5 Liq (38), opx (32), met (28), sulf (3)1133 10 5 1690 3.5 �6.1 Liq (65), opx (8), met (27), sulf (0.6)1093b 10 5 1680 4 �6.4 Liq (8), opx (55), met (26), sulf (3), coes (7)1135 5 5 1650 2.5 �6.6 Liq (8), opx (53), met (29), sulf (5)1083c 10 5 1610 8 �7.0 Liq (10), opx (57), met (29), sulf (5), coes (3)1141 30 5 1600 3 �7.4 Liq (65), opx (5), met (30)1178 50a 5 1580* 2 �8.2 Liq (25), opx (18), met (30), coes (27)
Liq = Silicate melt; opx = orthopyroxene; met = metallic alloy; sulf = liquid sulfide; coes = coesite.* Temperature monitored via a power/temperature relationship established from similar experiments with thermocouple.
a In this experiment 5% FeS was added to the final mix.b Oxygen fugacity calculated from Fe–FeO equilibrium for the two more oxidized experiments (1183 and 1137), and from Si–SiO2
equilibrium for all other experiments (see text for detail).c Phase proportions expressed in percent.
170 C. Cartier et al. / Geochimica et Cosmochimica Acta 130 (2014) 167–187
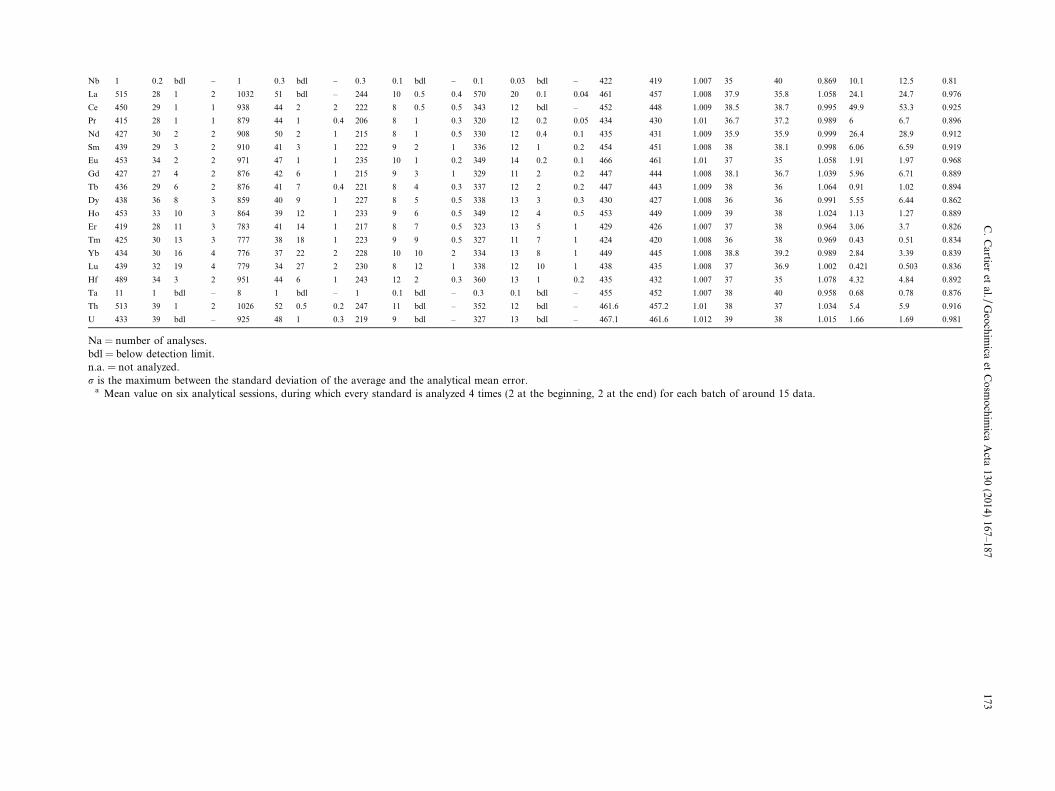
sessions). We compare these analyses with the referenceconcentrations given in Gagnon et al. (2008). The resultsare reported in Table 4, together with the measured va-lue/accepted value. Our measurements are in good agree-ment with Gagnon et al. (2008) values, the deviationbeing always less than 20%. Trace-element reduction wasdone with the GLITTER software (Van Achteberg et al.,2001). Detection limits (as determined from counting statis-tic on the samples) were <1 ppm for all elements.
2.4. Oxygen fugacity determination
Sample intrinsic fO2 values were determined using thecomposition of co-existing metallic alloy and silicate liquidcompositions as follow:
For our two most oxidized runs (1183 and 1137) we usedthe formula:
log fO2ðDIWÞ ¼ 2� logasil
FeO
ametFe
� �; ð1Þ
where
aFeO ¼ XFeO � cFeO; ð2Þ
and
aFe ¼ XFe � cFe: ð3Þ
For our oxygen fugacity estimation we adoptedcFeO = 1.7 as proposed by Holzheid et al., 1997 and we cal-culated cFe for every metal composition with the “metalactivity calculator” provided by the Oxford petrologygroup.
In all the other runs the FeO content of the silicate meltis lower than 1%, resulting in poor accuracy for FeO activ-ity in the silicate melt. Thus we used the following equilib-rium to calculate fO2:
SiO2ðmeltÞ ¼ Siðliquid metalÞ þO2: ð4Þ
Silicon activity into the metallic phase is given by
aSi ¼ XSi:cSi; ð5Þ
where XSi is the Si molar content of the metal and cSi itsactivity coefficient. In order to calculate Si activity we usedthe activity coefficients in Fe–Si system given by Hultgrenet al. (1973). In the same way, SiO2 activity in silicate meltis given by:
aSiO2¼ XSiO2
:cSiO2: ð6Þ
As SiO2 is a dominant component of the melt, and coesite ispresent in some samples, we assume aSiO2
� 1.At equilibrium, we have:
DG ¼ 0 ¼ DG� þRT ln Keq; with Keq ¼
aSi:fO2
aSiO2
; ð7Þ
yielding
DG� ¼ DrH
� � T DrS� þ
ZDVdP ¼ �RT � ln
aSi:fO2
aSiO2
: ð8Þ
where DG�
is the free energy change for reaction (8), R thegas constant, T the temperature, DrH
�the enthalpy change
of the reaction, DrS�
the entropy change, DV the volumechange and � the standard conditions.
We calculated DrH�, DrS� and DV using the compilationof Robie and Hemmingway (1995). Then we calculatedintrinsic oxygen fugacity of the system as follows:
fO2 ¼ e�DG
�R�T � aSiO2
aSi
ð9Þ
We express the oxygen fugacities relative to iron–wustite(IW) buffer as follows:
log fO2ðsampleÞ ¼ log fO2ðIWÞ þ DIW ð10Þ
where
log fO2ðIWÞ ¼ 6:57� 27215
T ðKÞ þ 0:055� P ðbarÞ � 1
T ðKÞ ð11Þ
fO2 (IW) at low pressure is given by Huebner (1971). In allcomputations we assume that for our conditions (5 GPa),pressure effect on DV is negligible (see Campbell et al.,2009). The intrinsic oxygen fugacities of our run productsare given in Table 2.
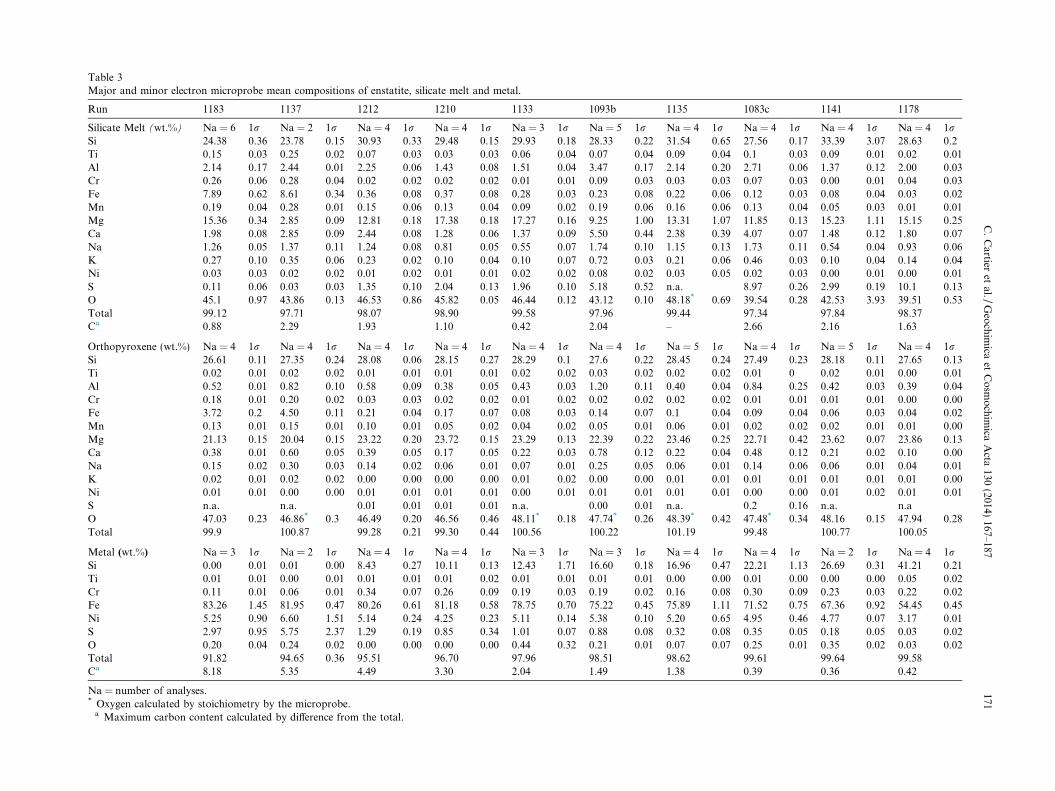
Table 3Major and minor electron microprobe mean compositions of enstatite, silicate melt and metal.
Run 1183 1137 1212 1210 1133 1093b 1135 1083c 1141 1178
Silicate Melt (wt.%) Na = 6 1r Na = 2 1r Na = 4 1r Na = 4 1r Na = 3 1r Na = 5 1r Na = 4 1r Na = 4 1r Na = 4 1r Na = 4 1rSi 24.38 0.36 23.78 0.15 30.93 0.33 29.48 0.15 29.93 0.18 28.33 0.22 31.54 0.65 27.56 0.17 33.39 3.07 28.63 0.2Ti 0.15 0.03 0.25 0.02 0.07 0.03 0.03 0.03 0.06 0.04 0.07 0.04 0.09 0.04 0.1 0.03 0.09 0.01 0.02 0.01Al 2.14 0.17 2.44 0.01 2.25 0.06 1.43 0.08 1.51 0.04 3.47 0.17 2.14 0.20 2.71 0.06 1.37 0.12 2.00 0.03Cr 0.26 0.06 0.28 0.04 0.02 0.02 0.02 0.02 0.01 0.01 0.09 0.03 0.03 0.03 0.07 0.03 0.00 0.01 0.04 0.03Fe 7.89 0.62 8.61 0.34 0.36 0.08 0.37 0.08 0.28 0.03 0.23 0.08 0.22 0.06 0.12 0.03 0.08 0.04 0.03 0.02Mn 0.19 0.04 0.28 0.01 0.15 0.06 0.13 0.04 0.09 0.02 0.19 0.06 0.16 0.06 0.13 0.04 0.05 0.03 0.01 0.01Mg 15.36 0.34 2.85 0.09 12.81 0.18 17.38 0.18 17.27 0.16 9.25 1.00 13.31 1.07 11.85 0.13 15.23 1.11 15.15 0.25Ca 1.98 0.08 2.85 0.09 2.44 0.08 1.28 0.06 1.37 0.09 5.50 0.44 2.38 0.39 4.07 0.07 1.48 0.12 1.80 0.07Na 1.26 0.05 1.37 0.11 1.24 0.08 0.81 0.05 0.55 0.07 1.74 0.10 1.15 0.13 1.73 0.11 0.54 0.04 0.93 0.06K 0.27 0.10 0.35 0.06 0.23 0.02 0.10 0.04 0.10 0.07 0.72 0.03 0.21 0.06 0.46 0.03 0.10 0.04 0.14 0.04Ni 0.03 0.03 0.02 0.02 0.01 0.02 0.01 0.01 0.02 0.02 0.08 0.02 0.03 0.05 0.02 0.03 0.00 0.01 0.00 0.01S 0.11 0.06 0.03 0.03 1.35 0.10 2.04 0.13 1.96 0.10 5.18 0.52 n.a. 8.97 0.26 2.99 0.19 10.1 0.13O 45.1 0.97 43.86 0.13 46.53 0.86 45.82 0.05 46.44 0.12 43.12 0.10 48.18* 0.69 39.54 0.28 42.53 3.93 39.51 0.53Total 99.12 97.71 98.07 98.90 99.58 97.96 99.44 97.34 97.84 98.37Ca 0.88 2.29 1.93 1.10 0.42 2.04 – 2.66 2.16 1.63
Orthopyroxene (wt.%) Na = 4 1r Na = 4 1r Na = 4 1r Na = 4 1r Na = 4 1r Na = 4 1r Na = 5 1r Na = 4 1r Na = 5 1r Na = 4 1rSi 26.61 0.11 27.35 0.24 28.08 0.06 28.15 0.27 28.29 0.1 27.6 0.22 28.45 0.24 27.49 0.23 28.18 0.11 27.65 0.13Ti 0.02 0.01 0.02 0.02 0.01 0.01 0.01 0.01 0.02 0.02 0.03 0.02 0.02 0.02 0.01 0 0.02 0.01 0.00 0.01Al 0.52 0.01 0.82 0.10 0.58 0.09 0.38 0.05 0.43 0.03 1.20 0.11 0.40 0.04 0.84 0.25 0.42 0.03 0.39 0.04Cr 0.18 0.01 0.20 0.02 0.03 0.03 0.02 0.02 0.01 0.02 0.02 0.02 0.02 0.02 0.01 0.01 0.01 0.01 0.00 0.00Fe 3.72 0.2 4.50 0.11 0.21 0.04 0.17 0.07 0.08 0.03 0.14 0.07 0.1 0.04 0.09 0.04 0.06 0.03 0.04 0.02Mn 0.13 0.01 0.15 0.01 0.10 0.01 0.05 0.02 0.04 0.02 0.05 0.01 0.06 0.01 0.02 0.02 0.02 0.01 0.01 0.00Mg 21.13 0.15 20.04 0.15 23.22 0.20 23.72 0.15 23.29 0.13 22.39 0.22 23.46 0.25 22.71 0.42 23.62 0.07 23.86 0.13Ca 0.38 0.01 0.60 0.05 0.39 0.05 0.17 0.05 0.22 0.03 0.78 0.12 0.22 0.04 0.48 0.12 0.21 0.02 0.10 0.00Na 0.15 0.02 0.30 0.03 0.14 0.02 0.06 0.01 0.07 0.01 0.25 0.05 0.06 0.01 0.14 0.06 0.06 0.01 0.04 0.01K 0.02 0.01 0.02 0.02 0.00 0.00 0.00 0.00 0.01 0.02 0.00 0.00 0.01 0.01 0.01 0.01 0.01 0.01 0.01 0.00Ni 0.01 0.01 0.00 0.00 0.01 0.01 0.01 0.01 0.00 0.01 0.01 0.01 0.01 0.01 0.00 0.00 0.01 0.02 0.01 0.01S n.a. n.a. 0.01 0.01 0.01 0.01 n.a. 0.00 0.01 n.a. 0.2 0.16 n.a. n.aO 47.03 0.23 46.86* 0.3 46.49 0.20 46.56 0.46 48.11* 0.18 47.74* 0.26 48.39* 0.42 47.48* 0.34 48.16 0.15 47.94 0.28Total 99.9 100.87 99.28 0.21 99.30 0.44 100.56 100.22 101.19 99.48 100.77 100.05
Metal (wt.%) Na = 3 1r Na = 2 1r Na = 4 1r Na = 4 1r Na = 3 1r Na = 3 1r Na = 4 1r Na = 4 1r Na = 2 1r Na = 4 1rSi 0.00 0.01 0.01 0.00 8.43 0.27 10.11 0.13 12.43 1.71 16.60 0.18 16.96 0.47 22.21 1.13 26.69 0.31 41.21 0.21Ti 0.01 0.01 0.00 0.01 0.01 0.01 0.01 0.02 0.01 0.01 0.01 0.01 0.00 0.00 0.01 0.00 0.00 0.00 0.05 0.02Cr 0.11 0.01 0.06 0.01 0.34 0.07 0.26 0.09 0.19 0.03 0.19 0.02 0.16 0.08 0.30 0.09 0.23 0.03 0.22 0.02Fe 83.26 1.45 81.95 0.47 80.26 0.61 81.18 0.58 78.75 0.70 75.22 0.45 75.89 1.11 71.52 0.75 67.36 0.92 54.45 0.45Ni 5.25 0.90 6.60 1.51 5.14 0.24 4.25 0.23 5.11 0.14 5.38 0.10 5.20 0.65 4.95 0.46 4.77 0.07 3.17 0.01S 2.97 0.95 5.75 2.37 1.29 0.19 0.85 0.34 1.01 0.07 0.88 0.08 0.32 0.08 0.35 0.05 0.18 0.05 0.03 0.02O 0.20 0.04 0.24 0.02 0.00 0.00 0.00 0.00 0.44 0.32 0.21 0.01 0.07 0.07 0.25 0.01 0.35 0.02 0.03 0.02Total 91.82 94.65 0.36 95.51 96.70 97.96 98.51 98.62 99.61 99.64 99.58Ca 8.18 5.35 4.49 3.30 2.04 1.49 1.38 0.39 0.36 0.42
Na = number of analyses.* Oxygen calculated by stoichiometry by the microprobe.
a Maximum carbon content calculated by difference from the total.
C.
Cartier
etal./
Geo
chim
icaet
Co
smo
chim
icaA
cta130
(2014)167–187
171
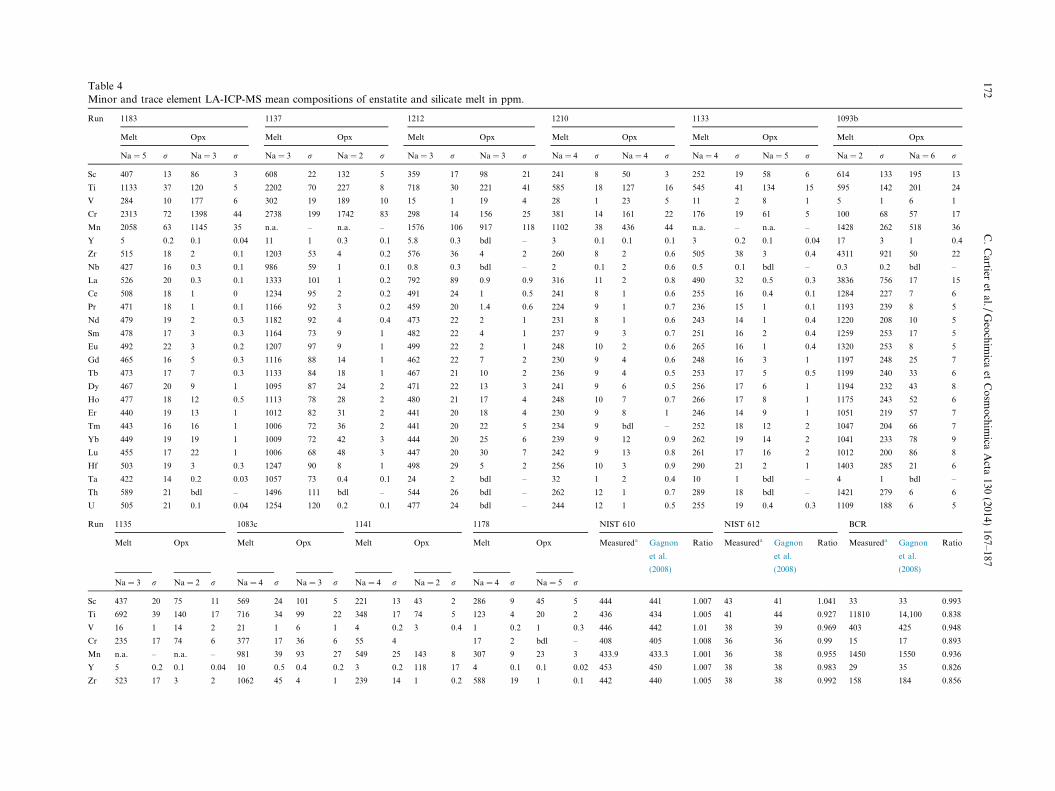
Table 4Minor and trace element LA-ICP-MS mean compositions of enstatite and silicate melt in ppm.
Run 1183 1137 1212 1210 1133 1093b
Melt Opx Melt Opx Melt Opx Melt Opx Melt Opx Melt Opx
Na = 5 r Na = 3 r Na = 3 r Na = 2 r Na = 3 r Na = 3 r Na = 4 r Na = 4 r Na = 4 r Na = 5 r Na = 2 r Na = 6 r
Sc 407 13 86 3 608 22 132 5 359 17 98 21 241 8 50 3 252 19 58 6 614 133 195 13
Ti 1133 37 120 5 2202 70 227 8 718 30 221 41 585 18 127 16 545 41 134 15 595 142 201 24
V 284 10 177 6 302 19 189 10 15 1 19 4 28 1 23 5 11 2 8 1 5 1 6 1
Cr 2313 72 1398 44 2738 199 1742 83 298 14 156 25 381 14 161 22 176 19 61 5 100 68 57 17
Mn 2058 63 1145 35 n.a. – n.a. – 1576 106 917 118 1102 38 436 44 n.a. – n.a. – 1428 262 518 36
Y 5 0.2 0.1 0.04 11 1 0.3 0.1 5.8 0.3 bdl – 3 0.1 0.1 0.1 3 0.2 0.1 0.04 17 3 1 0.4
Zr 515 18 2 0.1 1203 53 4 0.2 576 36 4 2 260 8 2 0.6 505 38 3 0.4 4311 921 50 22
Nb 427 16 0.3 0.1 986 59 1 0.1 0.8 0.3 bdl – 2 0.1 2 0.6 0.5 0.1 bdl – 0.3 0.2 bdl –
La 526 20 0.3 0.1 1333 101 1 0.2 792 89 0.9 0.9 316 11 2 0.8 490 32 0.5 0.3 3836 756 17 15
Ce 508 18 1 0 1234 95 2 0.2 491 24 1 0.5 241 8 1 0.6 255 16 0.4 0.1 1284 227 7 6
Pr 471 18 1 0.1 1166 92 3 0.2 459 20 1.4 0.6 224 9 1 0.7 236 15 1 0.1 1193 239 8 5
Nd 479 19 2 0.3 1182 92 4 0.4 473 22 2 1 231 8 1 0.6 243 14 1 0.4 1220 208 10 5
Sm 478 17 3 0.3 1164 73 9 1 482 22 4 1 237 9 3 0.7 251 16 2 0.4 1259 253 17 5
Eu 492 22 3 0.2 1207 97 9 1 499 22 2 1 248 10 2 0.6 265 16 1 0.4 1320 253 8 5
Gd 465 16 5 0.3 1116 88 14 1 462 22 7 2 230 9 4 0.6 248 16 3 1 1197 248 25 7
Tb 473 17 7 0.3 1133 84 18 1 467 21 10 2 236 9 4 0.5 253 17 5 0.5 1199 240 33 6
Dy 467 20 9 1 1095 87 24 2 471 22 13 3 241 9 6 0.5 256 17 6 1 1194 232 43 8
Ho 477 18 12 0.5 1113 78 28 2 480 21 17 4 248 10 7 0.7 266 17 8 1 1175 243 52 6
Er 440 19 13 1 1012 82 31 2 441 20 18 4 230 9 8 1 246 14 9 1 1051 219 57 7
Tm 443 16 16 1 1006 72 36 2 441 20 22 5 234 9 bdl – 252 18 12 2 1047 204 66 7
Yb 449 19 19 1 1009 72 42 3 444 20 25 6 239 9 12 0.9 262 19 14 2 1041 233 78 9
Lu 455 17 22 1 1006 68 48 3 447 20 30 7 242 9 13 0.8 261 17 16 2 1012 200 86 8
Hf 503 19 3 0.3 1247 90 8 1 498 29 5 2 256 10 3 0.9 290 21 2 1 1403 285 21 6
Ta 422 14 0.2 0.03 1057 73 0.4 0.1 24 2 bdl – 32 1 2 0.4 10 1 bdl – 4 1 bdl –
Th 589 21 bdl – 1496 111 bdl – 544 26 bdl – 262 12 1 0.7 289 18 bdl – 1421 279 6 6
U 505 21 0.1 0.04 1254 120 0.2 0.1 477 24 bdl – 244 12 1 0.5 255 19 0.4 0.3 1109 188 6 5
Run 1135 1083c 1141 1178 NIST 610 NIST 612 BCR
Melt Opx Melt Opx Melt Opx Melt Opx Measureda Gagnon
et al.
(2008)
Ratio Measureda Gagnon
et al.
(2008)
Ratio Measureda Gagnon
et al.
(2008)
Ratio
Na = 3 r Na = 2 r Na = 4 r Na = 3 r Na = 4 r Na = 2 r Na = 4 r Na = 5 r
Sc 437 20 75 11 569 24 101 5 221 13 43 2 286 9 45 5 444 441 1.007 43 41 1.041 33 33 0.993
Ti 692 39 140 17 716 34 99 22 348 17 74 5 123 4 20 2 436 434 1.005 41 44 0.927 11810 14,100 0.838
V 16 1 14 2 21 1 6 1 4 0.2 3 0.4 1 0.2 1 0.3 446 442 1.01 38 39 0.969 403 425 0.948
Cr 235 17 74 6 377 17 36 6 55 4 17 2 bdl – 408 405 1.008 36 36 0.99 15 17 0.893
Mn n.a. – n.a. – 981 39 93 27 549 25 143 8 307 9 23 3 433.9 433.3 1.001 36 38 0.955 1450 1550 0.936
Y 5 0.2 0.1 0.04 10 0.5 0.4 0.2 3 0.2 118 17 4 0.1 0.1 0.02 453 450 1.007 38 38 0.983 29 35 0.826
Zr 523 17 3 2 1062 45 4 1 239 14 1 0.2 588 19 1 0.1 442 440 1.005 38 38 0.992 158 184 0.856
172C
.C
artieret
al./G
eoch
imica
etC
osm
och
imica
Acta
130(2014)
167–187
Nb 1 0.2 bdl – 1 0.3 bdl – 0.3 0.1 bdl – 0.1 0.03 bdl – 422 419 1.007 35 40 0.869 10.1 12.5 0.81
La 515 28 1 2 1032 51 bdl – 244 10 0.5 0.4 570 20 0.1 0.04 461 457 1.008 37.9 35.8 1.058 24.1 24.7 0.976
Ce 450 29 1 1 938 44 2 2 222 8 0.5 0.5 343 12 bdl – 452 448 1.009 38.5 38.7 0.995 49.9 53.3 0.925
Pr 415 28 1 1 879 44 1 0.4 206 8 1 0.3 320 12 0.2 0.05 434 430 1.01 36.7 37.2 0.989 6 6.7 0.896
Nd 427 30 2 2 908 50 2 1 215 8 1 0.5 330 12 0.4 0.1 435 431 1.009 35.9 35.9 0.999 26.4 28.9 0.912
Sm 439 29 3 2 910 41 3 1 222 9 2 1 336 12 1 0.2 454 451 1.008 38 38.1 0.998 6.06 6.59 0.919
Eu 453 34 2 2 971 47 1 1 235 10 1 0.2 349 14 0.2 0.1 466 461 1.01 37 35 1.058 1.91 1.97 0.968
Gd 427 27 4 2 876 42 6 1 215 9 3 1 329 11 2 0.2 447 444 1.008 38.1 36.7 1.039 5.96 6.71 0.889
Tb 436 29 6 2 876 41 7 0.4 221 8 4 0.3 337 12 2 0.2 447 443 1.009 38 36 1.064 0.91 1.02 0.894
Dy 438 36 8 3 859 40 9 1 227 8 5 0.5 338 13 3 0.3 430 427 1.008 36 36 0.991 5.55 6.44 0.862
Ho 453 33 10 3 864 39 12 1 233 9 6 0.5 349 12 4 0.5 453 449 1.009 39 38 1.024 1.13 1.27 0.889
Er 419 28 11 3 783 41 14 1 217 8 7 0.5 323 13 5 1 429 426 1.007 37 38 0.964 3.06 3.7 0.826
Tm 425 30 13 3 777 38 18 1 223 9 9 0.5 327 11 7 1 424 420 1.008 36 38 0.969 0.43 0.51 0.834
Yb 434 30 16 4 776 37 22 2 228 10 10 2 334 13 8 1 449 445 1.008 38.8 39.2 0.989 2.84 3.39 0.839
Lu 439 32 19 4 779 34 27 2 230 8 12 1 338 12 10 1 438 435 1.008 37 36.9 1.002 0.421 0.503 0.836
Hf 489 34 3 2 951 44 6 1 243 12 2 0.3 360 13 1 0.2 435 432 1.007 37 35 1.078 4.32 4.84 0.892
Ta 11 1 bdl – 8 1 bdl – 1 0.1 bdl – 0.3 0.1 bdl – 455 452 1.007 38 40 0.958 0.68 0.78 0.876
Th 513 39 1 2 1026 52 0.5 0.2 247 11 bdl – 352 12 bdl – 461.6 457.2 1.01 38 37 1.034 5.4 5.9 0.916
U 433 39 bdl – 925 48 1 0.3 219 9 bdl – 327 13 bdl – 467.1 461.6 1.012 39 38 1.015 1.66 1.69 0.981
Na = number of analyses.bdl = below detection limit.n.a. = not analyzed.r is the maximum between the standard deviation of the average and the analytical mean error.
a Mean value on six analytical sessions, during which every standard is analyzed 4 times (2 at the beginning, 2 at the end) for each batch of around 15 data.
C.
Cartier
etal./
Geo
chim
icaet
Co
smo
chim
icaA
cta130
(2014)167–187
173
wt%
in s
ilicat
e liq
uid
0.001
0.01
0.1
1
wt%
in p
yrox
ene
FeCrMn
0.001
0.01
0.1
1
10
-10 -8 -6 -4 -2 0
wt%
in m
etal
ΔIW
FeSiSC
0.01
0.1
1
10
100
wt%
in s
ilicat
e liq
uid
Fe
S
20
30
40
O
Si
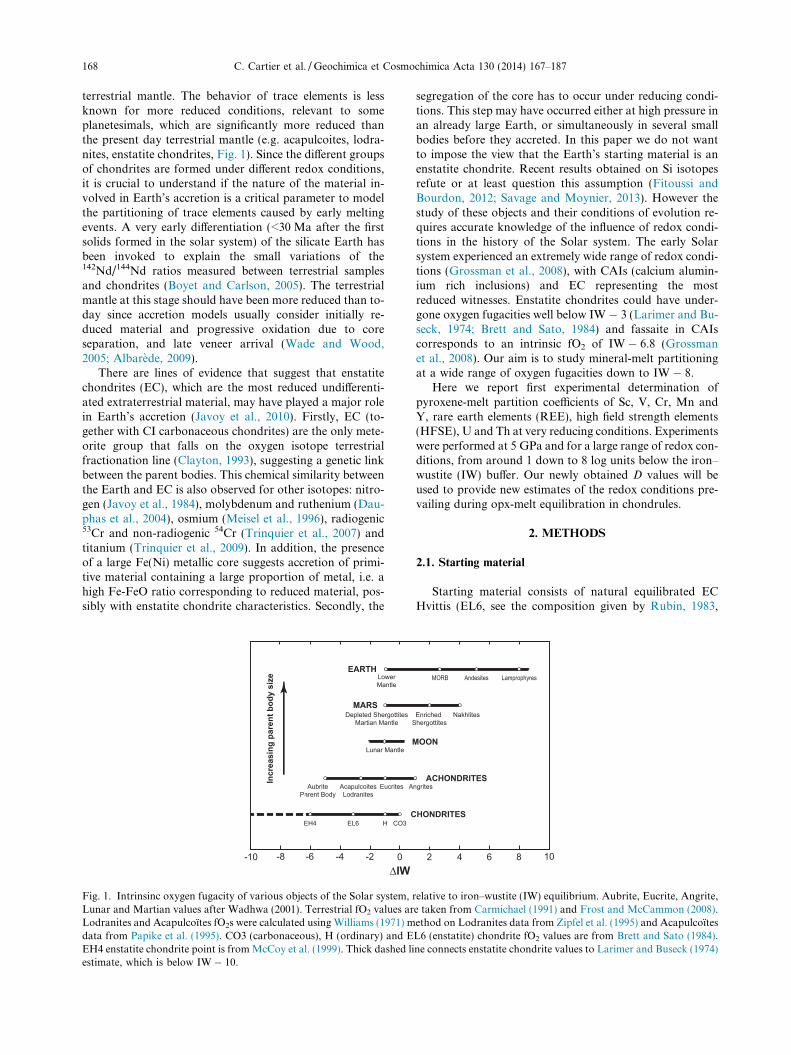
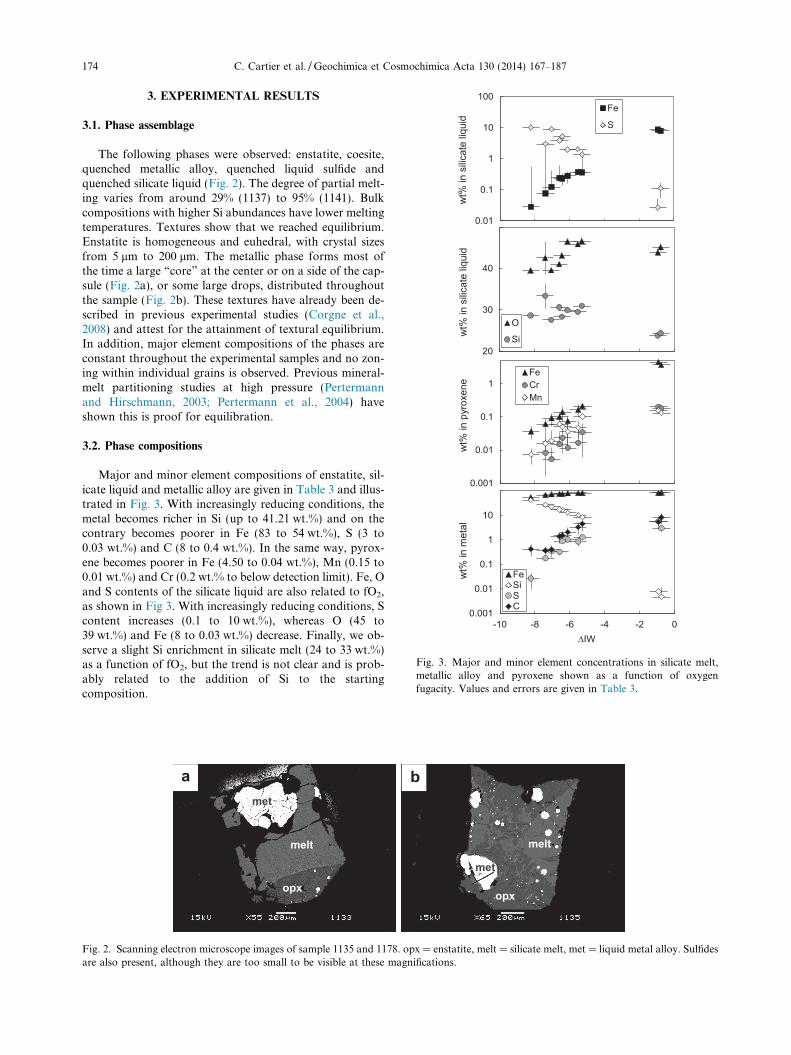
Fig. 3. Major and minor element concentrations in silicate melt,metallic alloy and pyroxene shown as a function of oxygenfugacity. Values and errors are given in Table 3.
174 C. Cartier et al. / Geochimica et Cosmochimica Acta 130 (2014) 167–187
3. EXPERIMENTAL RESULTS
3.1. Phase assemblage
The following phases were observed: enstatite, coesite,quenched metallic alloy, quenched liquid sulfide andquenched silicate liquid (Fig. 2). The degree of partial melt-ing varies from around 29% (1137) to 95% (1141). Bulkcompositions with higher Si abundances have lower meltingtemperatures. Textures show that we reached equilibrium.Enstatite is homogeneous and euhedral, with crystal sizesfrom 5 lm to 200 lm. The metallic phase forms most ofthe time a large “core” at the center or on a side of the cap-sule (Fig. 2a), or some large drops, distributed throughoutthe sample (Fig. 2b). These textures have already been de-scribed in previous experimental studies (Corgne et al.,2008) and attest for the attainment of textural equilibrium.In addition, major element compositions of the phases areconstant throughout the experimental samples and no zon-ing within individual grains is observed. Previous mineral-melt partitioning studies at high pressure (Pertermannand Hirschmann, 2003; Pertermann et al., 2004) haveshown this is proof for equilibration.
3.2. Phase compositions
Major and minor element compositions of enstatite, sil-icate liquid and metallic alloy are given in Table 3 and illus-trated in Fig. 3. With increasingly reducing conditions, themetal becomes richer in Si (up to 41.21 wt.%) and on thecontrary becomes poorer in Fe (83 to 54 wt.%), S (3 to0.03 wt.%) and C (8 to 0.4 wt.%). In the same way, pyrox-ene becomes poorer in Fe (4.50 to 0.04 wt.%), Mn (0.15 to0.01 wt.%) and Cr (0.2 wt.% to below detection limit). Fe, Oand S contents of the silicate liquid are also related to fO2,as shown in Fig 3. With increasingly reducing conditions, Scontent increases (0.1 to 10 wt.%), whereas O (45 to39 wt.%) and Fe (8 to 0.03 wt.%) decrease. Finally, we ob-serve a slight Si enrichment in silicate melt (24 to 33 wt.%)as a function of fO2, but the trend is not clear and is prob-ably related to the addition of Si to the startingcomposition.
a b
opxopx
met
met
melt melt
Fig. 2. Scanning electron microscope images of sample 1135 and 1178. opx = enstatite, melt = silicate melt, met = liquid metal alloy. Sulfidesare also present, although they are too small to be visible at these magnifications.
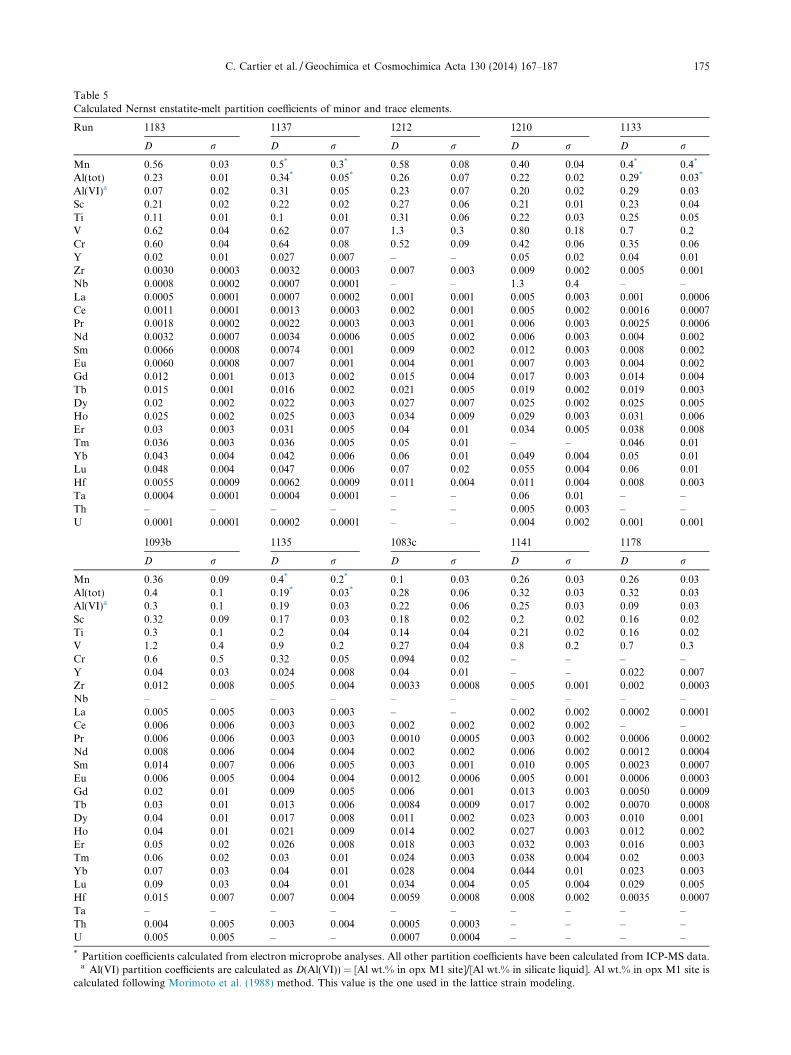
Table 5Calculated Nernst enstatite-melt partition coefficients of minor and trace elements.
Run 1183 1137 1212 1210 1133
D r D r D r D r D r
Mn 0.56 0.03 0.5* 0.3* 0.58 0.08 0.40 0.04 0.4* 0.4*
Al(tot) 0.23 0.01 0.34* 0.05* 0.26 0.07 0.22 0.02 0.29* 0.03*
Al(VI)a 0.07 0.02 0.31 0.05 0.23 0.07 0.20 0.02 0.29 0.03Sc 0.21 0.02 0.22 0.02 0.27 0.06 0.21 0.01 0.23 0.04Ti 0.11 0.01 0.1 0.01 0.31 0.06 0.22 0.03 0.25 0.05V 0.62 0.04 0.62 0.07 1.3 0.3 0.80 0.18 0.7 0.2Cr 0.60 0.04 0.64 0.08 0.52 0.09 0.42 0.06 0.35 0.06Y 0.02 0.01 0.027 0.007 – – 0.05 0.02 0.04 0.01Zr 0.0030 0.0003 0.0032 0.0003 0.007 0.003 0.009 0.002 0.005 0.001Nb 0.0008 0.0002 0.0007 0.0001 – – 1.3 0.4 – –La 0.0005 0.0001 0.0007 0.0002 0.001 0.001 0.005 0.003 0.001 0.0006Ce 0.0011 0.0001 0.0013 0.0003 0.002 0.001 0.005 0.002 0.0016 0.0007Pr 0.0018 0.0002 0.0022 0.0003 0.003 0.001 0.006 0.003 0.0025 0.0006Nd 0.0032 0.0007 0.0034 0.0006 0.005 0.002 0.006 0.003 0.004 0.002Sm 0.0066 0.0008 0.0074 0.001 0.009 0.002 0.012 0.003 0.008 0.002Eu 0.0060 0.0008 0.007 0.001 0.004 0.001 0.007 0.003 0.004 0.002Gd 0.012 0.001 0.013 0.002 0.015 0.004 0.017 0.003 0.014 0.004Tb 0.015 0.001 0.016 0.002 0.021 0.005 0.019 0.002 0.019 0.003Dy 0.02 0.002 0.022 0.003 0.027 0.007 0.025 0.002 0.025 0.005Ho 0.025 0.002 0.025 0.003 0.034 0.009 0.029 0.003 0.031 0.006Er 0.03 0.003 0.031 0.005 0.04 0.01 0.034 0.005 0.038 0.008Tm 0.036 0.003 0.036 0.005 0.05 0.01 – – 0.046 0.01Yb 0.043 0.004 0.042 0.006 0.06 0.01 0.049 0.004 0.05 0.01Lu 0.048 0.004 0.047 0.006 0.07 0.02 0.055 0.004 0.06 0.01Hf 0.0055 0.0009 0.0062 0.0009 0.011 0.004 0.011 0.004 0.008 0.003Ta 0.0004 0.0001 0.0004 0.0001 – – 0.06 0.01 – –Th – – – – – – 0.005 0.003 – –U 0.0001 0.0001 0.0002 0.0001 – – 0.004 0.002 0.001 0.001
1093b 1135 1083c 1141 1178
D r D r D r D r D r
Mn 0.36 0.09 0.4* 0.2* 0.1 0.03 0.26 0.03 0.26 0.03Al(tot) 0.4 0.1 0.19* 0.03* 0.28 0.06 0.32 0.03 0.32 0.03Al(VI)a 0.3 0.1 0.19 0.03 0.22 0.06 0.25 0.03 0.09 0.03Sc 0.32 0.09 0.17 0.03 0.18 0.02 0.2 0.02 0.16 0.02Ti 0.3 0.1 0.2 0.04 0.14 0.04 0.21 0.02 0.16 0.02V 1.2 0.4 0.9 0.2 0.27 0.04 0.8 0.2 0.7 0.3Cr 0.6 0.5 0.32 0.05 0.094 0.02 – – – –Y 0.04 0.03 0.024 0.008 0.04 0.01 – – 0.022 0.007Zr 0.012 0.008 0.005 0.004 0.0033 0.0008 0.005 0.001 0.002 0.0003Nb – – – – – – – – – –La 0.005 0.005 0.003 0.003 – – 0.002 0.002 0.0002 0.0001Ce 0.006 0.006 0.003 0.003 0.002 0.002 0.002 0.002 – –Pr 0.006 0.006 0.003 0.003 0.0010 0.0005 0.003 0.002 0.0006 0.0002Nd 0.008 0.006 0.004 0.004 0.002 0.002 0.006 0.002 0.0012 0.0004Sm 0.014 0.007 0.006 0.005 0.003 0.001 0.010 0.005 0.0023 0.0007Eu 0.006 0.005 0.004 0.004 0.0012 0.0006 0.005 0.001 0.0006 0.0003Gd 0.02 0.01 0.009 0.005 0.006 0.001 0.013 0.003 0.0050 0.0009Tb 0.03 0.01 0.013 0.006 0.0084 0.0009 0.017 0.002 0.0070 0.0008Dy 0.04 0.01 0.017 0.008 0.011 0.002 0.023 0.003 0.010 0.001Ho 0.04 0.01 0.021 0.009 0.014 0.002 0.027 0.003 0.012 0.002Er 0.05 0.02 0.026 0.008 0.018 0.003 0.032 0.003 0.016 0.003Tm 0.06 0.02 0.03 0.01 0.024 0.003 0.038 0.004 0.02 0.003Yb 0.07 0.03 0.04 0.01 0.028 0.004 0.044 0.01 0.023 0.003Lu 0.09 0.03 0.04 0.01 0.034 0.004 0.05 0.004 0.029 0.005Hf 0.015 0.007 0.007 0.004 0.0059 0.0008 0.008 0.002 0.0035 0.0007Ta – – – – – – – – – –Th 0.004 0.005 0.003 0.004 0.0005 0.0003 – – – –U 0.005 0.005 – – 0.0007 0.0004 – – – –
* Partition coefficients calculated from electron microprobe analyses. All other partition coefficients have been calculated from ICP-MS data.a Al(VI) partition coefficients are calculated as D(Al(VI)) = [Al wt.% in opx M1 site]/[Al wt.% in silicate liquid]. Al wt.% in opx M1 site is
calculated following Morimoto et al. (1988) method. This value is the one used in the lattice strain modeling.
C. Cartier et al. / Geochimica et Cosmochimica Acta 130 (2014) 167–187 175
176 C. Cartier et al. / Geochimica et Cosmochimica Acta 130 (2014) 167–187
Trace and minor element concentrations in enstatite andmelt are given in Table 4, together with NIST610, NIST612and BCR standard analyses. Trace element Nernst
partition coefficients (D ¼ wt:%element in the crystalwt:%element in the silicate melt
) are given
in Table 5. The partition coefficients have been calculatedfrom ICP-MS analyses, except D(Mn) and D(Al), whichhave been calculated using electron microprobe analyseswhen ICP-MS data was not available (see Table 5footnote). The similarity between the D values calculatedfrom the two different analytical methods, when both areavailable, shows that the choice of the method is notcritical (see Supplementary data 1). Al3+ is distributedbetween the M1 site and the tetrahedral site of the pyrox-ene. Consequently we have calculated Al3+ content in M1site with the method given by Morimoto et al. (1988).Al3+ partition coefficients for the M1 site are also givenin Table 5. The latter value will be used for partition coef-ficient modeling (see below). The relative errors on thereported concentrations are given at the 1r level. It is themaximum error between the analytical error and the stan-dard deviation on the average of phase compositions. Thereported errors on D values were calculated as
r¼ffiffiffiffiffiffiffiffiffiffiffiffiffiffiffiffiffiffiffiffiffiffiffiffiffiffiffiffiffiffiffiffiffiffiffiffiffiffiffiffiffiffiffiffiffiffiffiffiffiffiffiffiffiffiffiffiffiffiffiffiffiffiffiffiffiffiffiffiffiffiffiffiffiffiffiffiffiffiffiffiffiffiffiffiffiffiffiffiffiffiffiffiffiffiffiffiffiffiffiffi�
error on the wt:%wt:%element in the crystal
� �2
þ�
error on the wt:%wt:%element in the silicate melt
�2�r�D.
All studied trace elements are incompatible in ourexperiments, except V in runs 1212 and 1093b, and Nb inrun 1210. Otherwise, Sc, Ti, V, and Mn have 0.1 < D < 1;Cr has 0.05 < D < 1; heavy REE (Gd to Lu) have0.005 < D < 0.1; light REE (La to Sm) have0.0002 < D < 0.02 and HFSE (except Ti), U and Th have0.0001 < D < 0.015.
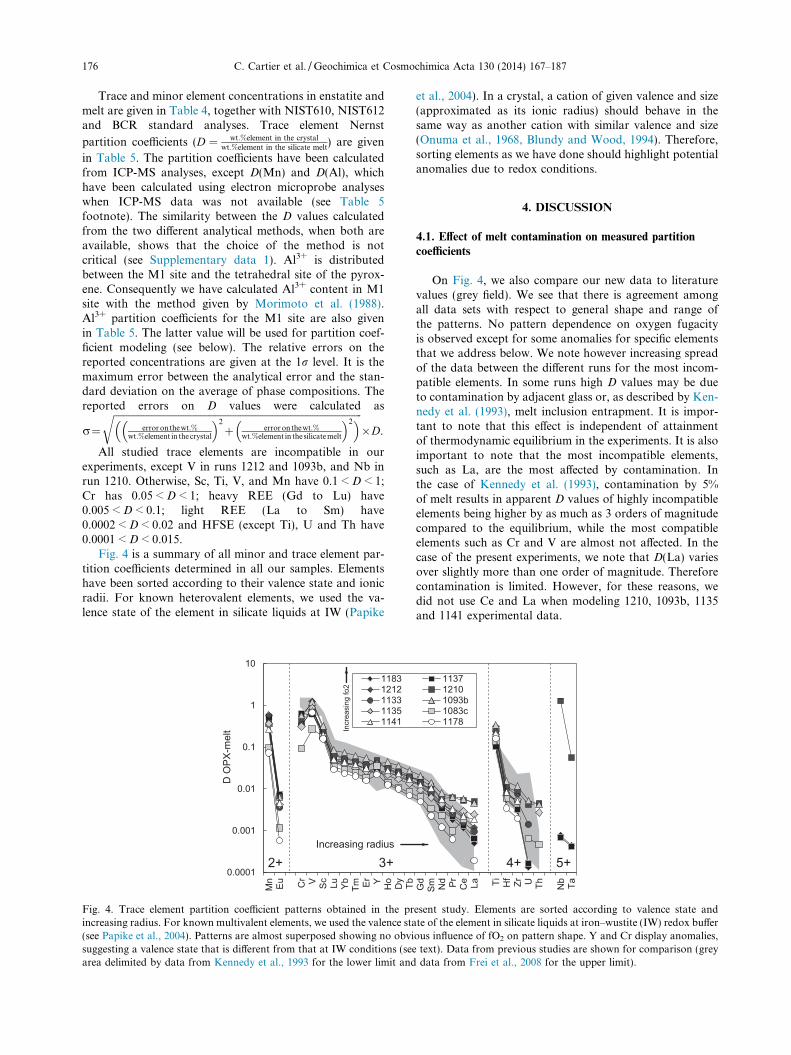
Fig. 4 is a summary of all minor and trace element par-tition coefficients determined in all our samples. Elementshave been sorted according to their valence state and ionicradii. For known heterovalent elements, we used the va-lence state of the element in silicate liquids at IW (Papike
Incr
easi
ng fo
2
0.0001
0.001
0.01
0.1
1
10
Mn Eu Cr V Sc Lu Yb Tm Er Y Ho Dy
D O
PX-m
elt
11831212113311351141
3+2+Increasing radius
Fig. 4. Trace element partition coefficient patterns obtained in the princreasing radius. For known multivalent elements, we used the valence sta(see Papike et al., 2004). Patterns are almost superposed showing no obvisuggesting a valence state that is different from that at IW conditions (seearea delimited by data from Kennedy et al., 1993 for the lower limit and
et al., 2004). In a crystal, a cation of given valence and size(approximated as its ionic radius) should behave in thesame way as another cation with similar valence and size(Onuma et al., 1968, Blundy and Wood, 1994). Therefore,sorting elements as we have done should highlight potentialanomalies due to redox conditions.
4. DISCUSSION
4.1. Effect of melt contamination on measured partition
coefficients
On Fig. 4, we also compare our new data to literaturevalues (grey field). We see that there is agreement amongall data sets with respect to general shape and range ofthe patterns. No pattern dependence on oxygen fugacityis observed except for some anomalies for specific elementsthat we address below. We note however increasing spreadof the data between the different runs for the most incom-patible elements. In some runs high D values may be dueto contamination by adjacent glass or, as described by Ken-nedy et al. (1993), melt inclusion entrapment. It is impor-tant to note that this effect is independent of attainmentof thermodynamic equilibrium in the experiments. It is alsoimportant to note that the most incompatible elements,such as La, are the most affected by contamination. Inthe case of Kennedy et al. (1993), contamination by 5%of melt results in apparent D values of highly incompatibleelements being higher by as much as 3 orders of magnitudecompared to the equilibrium, while the most compatibleelements such as Cr and V are almost not affected. In thecase of the present experiments, we note that D(La) variesover slightly more than one order of magnitude. Thereforecontamination is limited. However, for these reasons, wedid not use Ce and La when modeling 1210, 1093b, 1135and 1141 experimental data.
Tb Gd
Sm Nd Pr Ce La Ti Hf Zr U Th Nb Ta
113712101093b1083c1178
4+ 5+
esent study. Elements are sorted according to valence state andte of the element in silicate liquids at iron–wustite (IW) redox buffer
ous influence of fO2 on pattern shape. Y and Cr display anomalies,text). Data from previous studies are shown for comparison (greydata from Frei et al., 2008 for the upper limit).
C. Cartier et al. / Geochimica et Cosmochimica Acta 130 (2014) 167–187 177
4.2. Partition coefficient modeling
In order to test the validity of our experimental partitioncoefficients and highlight variations of multivalent cationDs with fO2, we performed modeling using a lattice-strainapproach (Brice, 1975; Blundy and Wood, 1994; Woodand Blundy, 1997). In this approach, partition coefficientsare described as a function of the strain caused by theexceeding or missing volume generated by the substitutionof a dopant cation in the crystal lattice. Within this model,measured partition coefficients are determined by threemodel parameters following
Di ¼ D0 exp�4pEN A
12r0ðri � r0Þ2 þ 1
3ðri � r0Þ3
h iRT
ð12Þ
where Di is the measured partition coefficient of the elementi, ri the ionic radius of the element i, D0 the strain-free par-tition coefficient of an isovalent ion with radius r0 (i.e. theideal, strain-free radius for a particular crystallographicsite), and E the apparent Young modulus of the crystallo-graphic site.
Enstatite (Mg2Si2O6) is an orthopyroxene with two tet-rahedral and two octahedral sites M1 and M2, the latterhaving slightly different sizes (Ghose et al., 1986). In thecase of trace element incorporation in octahedral sites, Freiet al. (2008) proposed a two-site model:
DOpx�melti ¼DM1
0 exp�4pEM1N A
12rM1
0 ðri� rM10 Þ
2þ 13ðri� rM1
0 Þ3
h iRT
þDM20 exp
�4pEM2N A12rM2
0 ðri� rM20 Þ
2þ 13ðri� rM2
0 Þ3
h iRT
ð13Þ
where DM10 and DM2
0 are the strain-free partition coefficients,rM1
0 and rM20 the ideal strain-free radii and EM1 and EM2 the
0
1
2
3
4
5
6
7
8
9
10
0 0.1 0.2 0.3 0
Bulk
Mod
ulus
, ln
K (G
Pa)
Z/d3 (Å)
Hazen & Finger relationship (binary oxydes)
y = 9.93
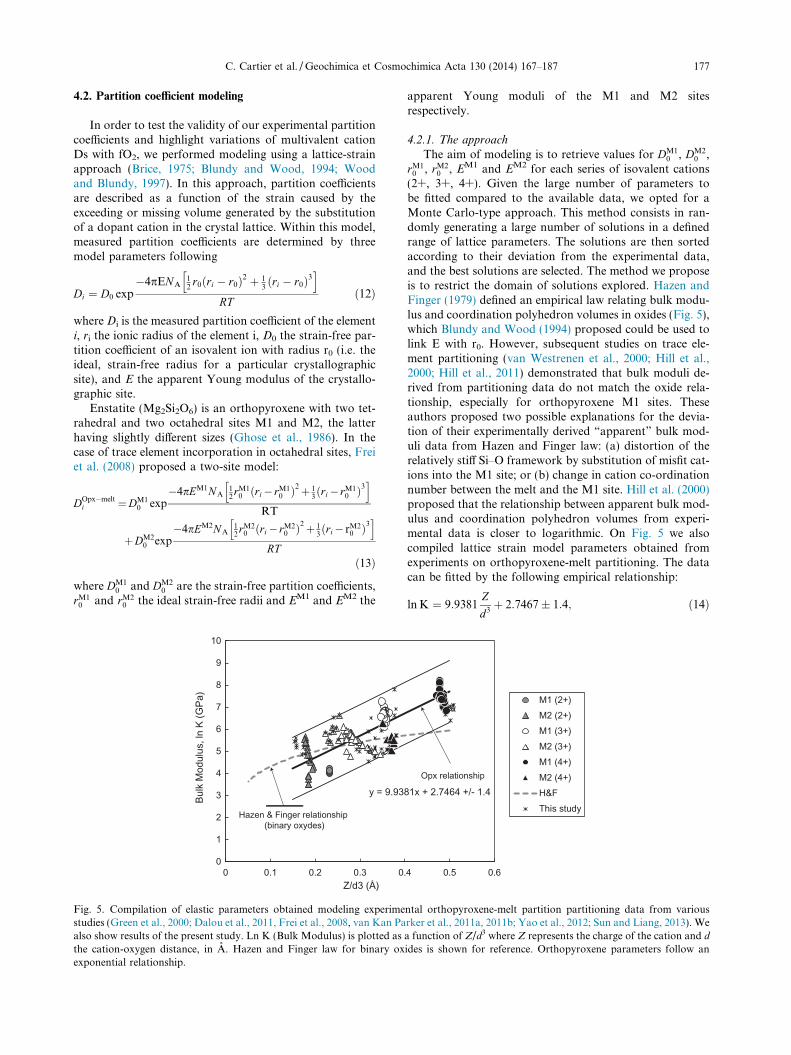
Fig. 5. Compilation of elastic parameters obtained modeling experimestudies (Green et al., 2000; Dalou et al., 2011, Frei et al., 2008, van Kan Paalso show results of the present study. Ln K (Bulk Modulus) is plotted asthe cation-oxygen distance, in A. Hazen and Finger law for binary oxexponential relationship.
apparent Young moduli of the M1 and M2 sitesrespectively.
4.2.1. The approach
The aim of modeling is to retrieve values for DM10 , DM2
0 ,rM1
0 , rM20 , EM1 and EM2 for each series of isovalent cations
(2+, 3+, 4+). Given the large number of parameters tobe fitted compared to the available data, we opted for aMonte Carlo-type approach. This method consists in ran-domly generating a large number of solutions in a definedrange of lattice parameters. The solutions are then sortedaccording to their deviation from the experimental data,and the best solutions are selected. The method we proposeis to restrict the domain of solutions explored. Hazen andFinger (1979) defined an empirical law relating bulk modu-lus and coordination polyhedron volumes in oxides (Fig. 5),which Blundy and Wood (1994) proposed could be used tolink E with r0. However, subsequent studies on trace ele-ment partitioning (van Westrenen et al., 2000; Hill et al.,2000; Hill et al., 2011) demonstrated that bulk moduli de-rived from partitioning data do not match the oxide rela-tionship, especially for orthopyroxene M1 sites. Theseauthors proposed two possible explanations for the devia-tion of their experimentally derived “apparent” bulk mod-uli data from Hazen and Finger law: (a) distortion of therelatively stiff Si–O framework by substitution of misfit cat-ions into the M1 site; or (b) change in cation co-ordinationnumber between the melt and the M1 site. Hill et al. (2000)proposed that the relationship between apparent bulk mod-ulus and coordination polyhedron volumes from experi-mental data is closer to logarithmic. On Fig. 5 we alsocompiled lattice strain model parameters obtained fromexperiments on orthopyroxene-melt partitioning. The datacan be fitted by the following empirical relationship:
ln K ¼ 9:9381Z
d3þ 2:7467� 1:4; ð14Þ
.4 0.5 0.6
M1 (2+)M2 (2+)M1 (3+)M2 (3+)M1 (4+)M2 (4+)H&FThis study
Opx relationship
81x + 2.7464 +/- 1.4
ntal orthopyroxene-melt partition partitioning data from variousrker et al., 2011a, 2011b; Yao et al., 2012; Sun and Liang, 2013). Wea function of Z/d3 where Z represents the charge of the cation and d
ides is shown for reference. Orthopyroxene parameters follow an
178 C. Cartier et al. / Geochimica et Cosmochimica Acta 130 (2014) 167–187
where d is the cation–anion distance equivalent to r0 plusthe radius of the oxygen anion (1.38 A: Shannon, 1976),and Z the cation charge. The apparent Young’s modulus,used in the lattice strain equation, and the bulk modulusare related by E = 3 K(1–2r). Most minerals approximatePoisson solids and in this case, with r � 0.25 andE � 1.5 K (Blundy and Wood, 2003). We opted to con-strain the solutions explored in our Monte Carlo approachusing Eq. (14), allowing for a ± 1.4 accuracy on ln(K). Be-cause trivalent cations form the largest isovalent group rep-resented in our database, the simulation run is performed asfollows:
(1) Find the best-fit for trivalent elements. We set the rM10
(3+) range to 0.55–0.75 A, based on visual observa-tions of the datapoints. For the other variables wehave set boundary values beyond which the solutionswould be unacceptable. For example, rM2
0 (3+) has tobe larger than rM1
0 (3+). Finally we restricted the D0
range as follow: 0.2 <DM10 (3+)<1 and “lowest D value
for 3+ cations” < DM20 (3+) < DM1
0 (3+), based onvisual inspection of our experimental data.
(2) Search of the best-fit for the divalent and tetravalentelements. All parameters for divalent and tetravalentare explored randomly in the following range that isdefined by trivalent best fit:
� Radii ranges: rM10 (3+)-0.01 A <rM1
0 (2+)<0.72 ; rM20
(3+) � 0.01 A <rM20 (2+) < 1 ; 0.5 A < rM1
0 (4+) < rM20
(3+) + 0.01 ; 0.8 < rM20 (4+) < 0.95. These ranges are
based on literature experimental data that showsr0(2+) > r0(3+) > r0(4+) (see van Westrenen et al.,2000, for explanation), together with visual observa-tion of our experimental data.
� D0 ranges: 1 < DM10 (2+) < 100; DM2
0 (3+) < DM20
(2+) < 100 ; 0.01 < DM10 (4+) < 0.1 ; 0.0001 < DM2
0
(4+) < 0.01. These ranges are based on visual observa-tion of our experimental data.
4.2.2. Case of the transition metals
With the lattice strain model, it is assumed that elementdistributions are only controlled by their size and charge.However this assumption is not valid for the first row tran-sition metals. These elements have partially filled d sub-shells. As a consequence, their incorporation in crystal lat-tices may be strongly influenced by their local environment.One of the models describing these effects is the crystal fieldtheory (CFT). Burns (1970) demonstrated that in orthopy-roxene, partition coefficients of transition elements are con-trolled either by crystal field energy (Ni2+), site distortion(Fe2+ and Cr2+), cation size (Mn2+), or combined crystalfield energy and cation size (Cr3+, V3+, Ti3+). Accordinglywe have not used Ni2+, Fe2+, Cr2+, Cr3+, V3+, Ti3+ in thefitting procedure with the lattice strain model. On the con-trary we assumed that Mn2+ is only controlled by its radiusand can be used to fit the curves. Sc3+ and Ti4+ have zero3d electrons. Therefore, they do not have crystal field stabil-ization energy and should be well described by the latticestrain model.
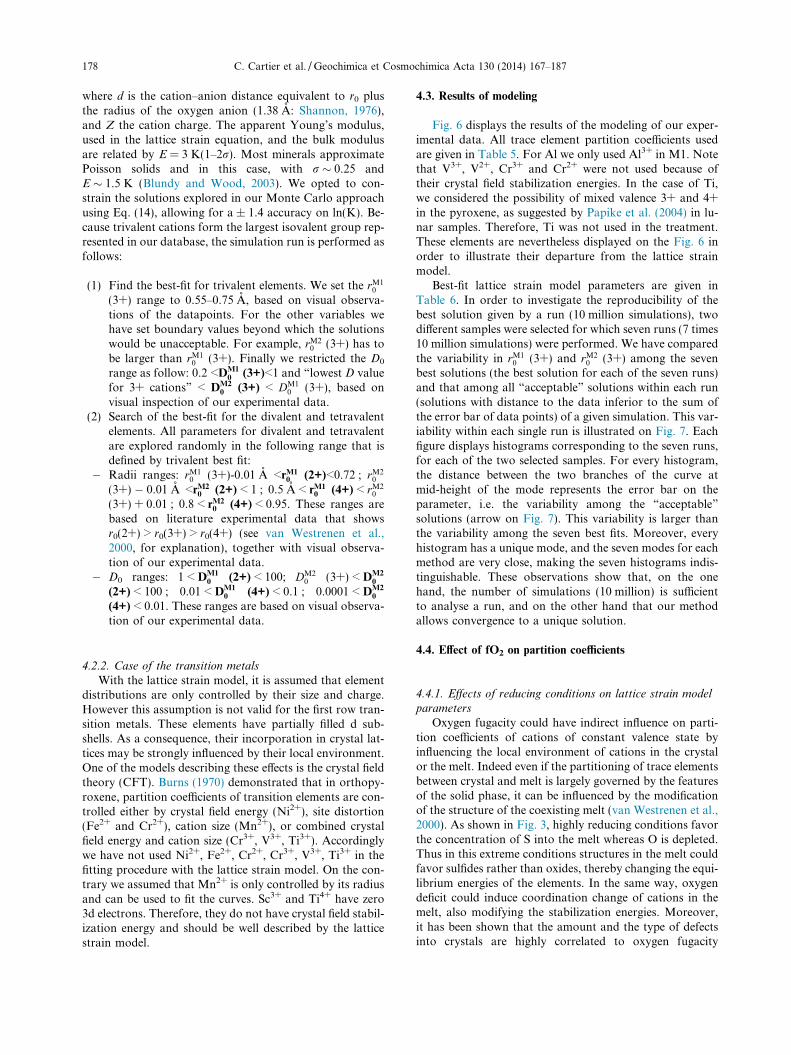
4.3. Results of modeling
Fig. 6 displays the results of the modeling of our exper-imental data. All trace element partition coefficients usedare given in Table 5. For Al we only used Al3+ in M1. Notethat V3+, V2+, Cr3+ and Cr2+ were not used because oftheir crystal field stabilization energies. In the case of Ti,we considered the possibility of mixed valence 3+ and 4+in the pyroxene, as suggested by Papike et al. (2004) in lu-nar samples. Therefore, Ti was not used in the treatment.These elements are nevertheless displayed on the Fig. 6 inorder to illustrate their departure from the lattice strainmodel.
Best-fit lattice strain model parameters are given inTable 6. In order to investigate the reproducibility of thebest solution given by a run (10 million simulations), twodifferent samples were selected for which seven runs (7 times10 million simulations) were performed. We have comparedthe variability in rM1
0 (3+) and rM20 (3+) among the seven
best solutions (the best solution for each of the seven runs)and that among all “acceptable” solutions within each run(solutions with distance to the data inferior to the sum ofthe error bar of data points) of a given simulation. This var-iability within each single run is illustrated on Fig. 7. Eachfigure displays histograms corresponding to the seven runs,for each of the two selected samples. For every histogram,the distance between the two branches of the curve atmid-height of the mode represents the error bar on theparameter, i.e. the variability among the “acceptable”
solutions (arrow on Fig. 7). This variability is larger thanthe variability among the seven best fits. Moreover, everyhistogram has a unique mode, and the seven modes for eachmethod are very close, making the seven histograms indis-tinguishable. These observations show that, on the onehand, the number of simulations (10 million) is sufficientto analyse a run, and on the other hand that our methodallows convergence to a unique solution.
4.4. Effect of fO2 on partition coefficients
4.4.1. Effects of reducing conditions on lattice strain model
parameters
Oxygen fugacity could have indirect influence on parti-tion coefficients of cations of constant valence state byinfluencing the local environment of cations in the crystalor the melt. Indeed even if the partitioning of trace elementsbetween crystal and melt is largely governed by the featuresof the solid phase, it can be influenced by the modificationof the structure of the coexisting melt (van Westrenen et al.,2000). As shown in Fig. 3, highly reducing conditions favorthe concentration of S into the melt whereas O is depleted.Thus in this extreme conditions structures in the melt couldfavor sulfides rather than oxides, thereby changing the equi-librium energies of the elements. In the same way, oxygendeficit could induce coordination change of cations in themelt, also modifying the stabilization energies. Moreover,it has been shown that the amount and the type of defectsinto crystals are highly correlated to oxygen fugacity
0.6 0.7 0.8 0.9 1 1.1
10-4
10-3
10-2
10-1
100
101
Mg
Ca
Mn
Eu
Al
Sc
La
CePr
NdSm
GdTb
YbLu
Y
ZrHf
U
NbTa
V VCr Cr
Ti Ti
Ionic radius (A)
D O
PX-M
elt
0.6 0.7 0.8 0.9 1 1.1
Mg
Ca
Eu
Mn
Sc
Y
LaCe
PrNd
SmGd
Tb
Lu
Al
Zr
Hf
U
TiTi
V V CrCr
NbTa
Ionic radius (A)
0.6 0.7 0.8 0.9 1 1.1
Mg
Ca
Mn
Eu
Al Sc
LaCe
PrNd
SmGd
TbHo
Lu
HfZr
TiTi
V V
Cr Cr
Ionic radius (A)
D O
PX-M
elt
Mg
CaMn
Eu
Al Sc
SmGd
Dy
Lu
Hf
ThUZr
V VCr Cr
Ti Ti
Nb
Ta
LaCe
Y
0.6 0.7 0.8 0.9 1 1.1
Mg
Ca
Eu
MnSc
LaCe
PrNd
SmGd
Tb
LuY
Al
Hf
U
Zr
TiTi
V V
CrCr
Ionic radius (A)
D O
PX-M
elt
0.6 0.7 0.8 0.9 1 1.1
Mg
Ca
Eu
MnAl Sc
Y
NdSm
GdTb
Lu
ZrHf
ThU
TiTi
V VCrCr
LaCe
Ionic radius (A)
0.6 0.7 0.8 0.9 1 1.1
Mg
Ca
Eu
MnSc
Y
NdSmGd
Dy
Lu
Al
ZrHf
Th
TiTi
V V
CrCr
LaCe
Ionic radius (A)
D O
PX-M
elt
Mg
Ca
Eu
Mn
Al Sc
CePr
NdSm
GdTbHo
Lu
ZrHf
ThU
TiTiV V
CrCr
Y
0.5 0.6 0.7 0.8 0.9 1 1.1
Mg
CaMn
Eu
AlSc
LaCePr
NdSm
TbHo
TmLu
ZrHf
TiTi
V V
Ionic radius (A)
D O
PX-M
elt
0.6 0.7 0.8 0.9 1 1.1 1.2
Mg
Ca
Eu
MnAl
Sc
Y
La
PrNd
SmGd
TbHo
Lu
ZrHf
TiTi
V V
Ionic radius (A)
10-4
10-3
10-2
10-1
100
10-4
10-3
10-2
10-1
100
10-4
10-3
10-2
10-1
100
10-4
10-3
10-2
10-1
100
1183IW-0.8
1137IW-0.9
1212IW-5.3
1210IW-5.5
1133IW-6.1
1093bIW-6.4
1135IW-6.6
1083cIW-7.1
1141IW-7.4
1178IW-8.2
Fig. 6. Results of Monte Carlo simulation of lattice strain modeling. For each sample the three curves represent divalent, trivalent, andtetravalent cations. All cations are VI-fold coordinated, ionic radii are from Shannon (1976). Closed circles represent experimental data usedfor fitting, whereas open symbols represent elements that have been not used because potential mixed valence state or crystal field stabilizationenergies (V, Cr, Ti,Y, see text). Note that pentavalent cations were not modeled, because of lack of data.
C. Cartier et al. / Geochimica et Cosmochimica Acta 130 (2014) 167–187 179
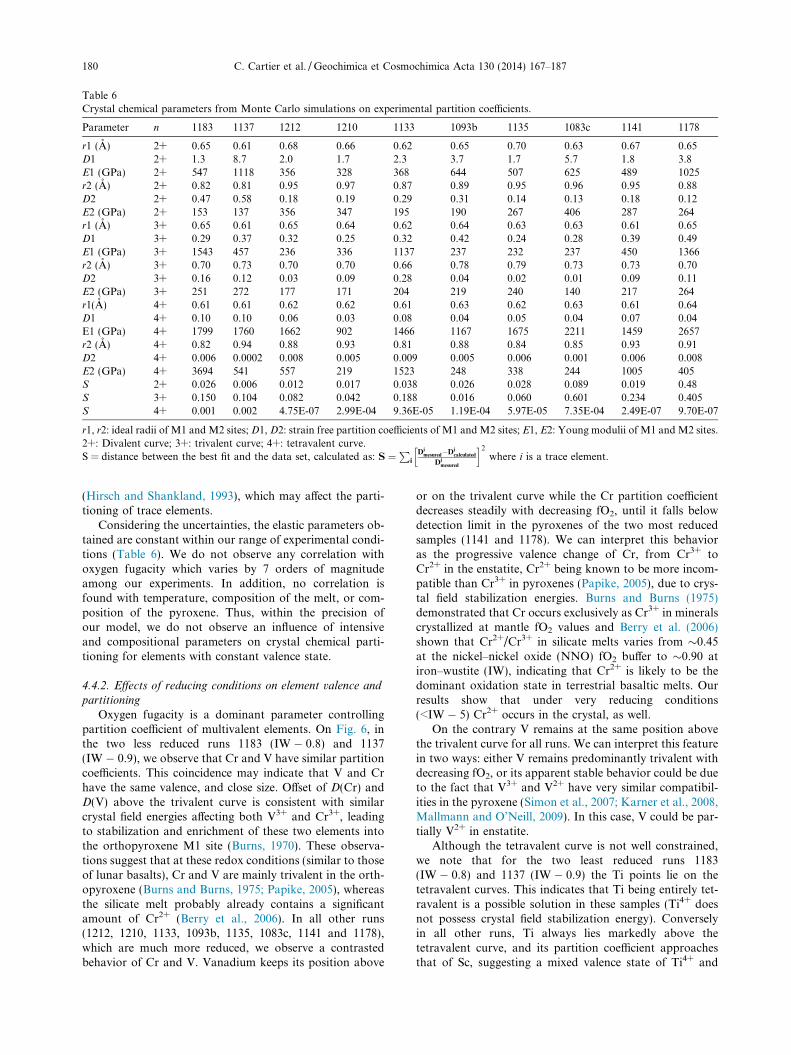
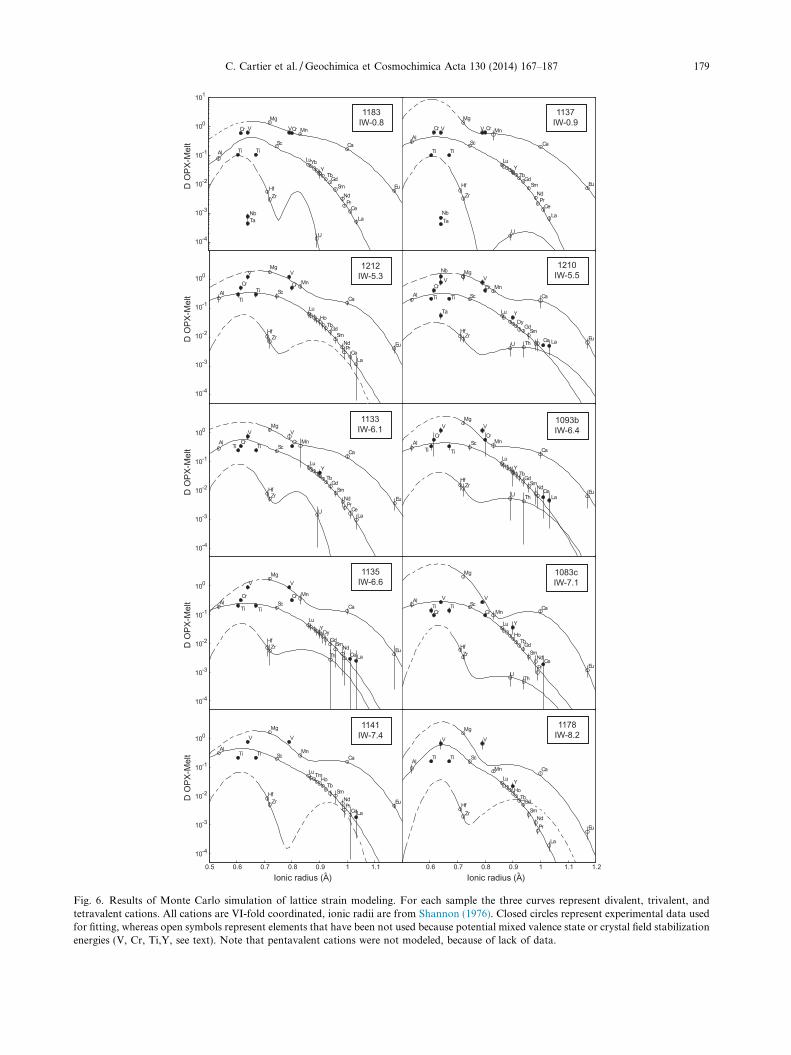
Table 6Crystal chemical parameters from Monte Carlo simulations on experimental partition coefficients.
Parameter n 1183 1137 1212 1210 1133 1093b 1135 1083c 1141 1178
r1 (A) 2+ 0.65 0.61 0.68 0.66 0.62 0.65 0.70 0.63 0.67 0.65D1 2+ 1.3 8.7 2.0 1.7 2.3 3.7 1.7 5.7 1.8 3.8E1 (GPa) 2+ 547 1118 356 328 368 644 507 625 489 1025r2 (A) 2+ 0.82 0.81 0.95 0.97 0.87 0.89 0.95 0.96 0.95 0.88D2 2+ 0.47 0.58 0.18 0.19 0.29 0.31 0.14 0.13 0.18 0.12E2 (GPa) 2+ 153 137 356 347 195 190 267 406 287 264r1 (A) 3+ 0.65 0.61 0.65 0.64 0.62 0.64 0.63 0.63 0.61 0.65D1 3+ 0.29 0.37 0.32 0.25 0.32 0.42 0.24 0.28 0.39 0.49E1 (GPa) 3+ 1543 457 236 336 1137 237 232 237 450 1366r2 (A) 3+ 0.70 0.73 0.70 0.70 0.66 0.78 0.79 0.73 0.73 0.70D2 3+ 0.16 0.12 0.03 0.09 0.28 0.04 0.02 0.01 0.09 0.11E2 (GPa) 3+ 251 272 177 171 204 219 240 140 217 264r1(A) 4+ 0.61 0.61 0.62 0.62 0.61 0.63 0.62 0.63 0.61 0.64D1 4+ 0.10 0.10 0.06 0.03 0.08 0.04 0.05 0.04 0.07 0.04E1 (GPa) 4+ 1799 1760 1662 902 1466 1167 1675 2211 1459 2657r2 (A) 4+ 0.82 0.94 0.88 0.93 0.81 0.88 0.84 0.85 0.93 0.91D2 4+ 0.006 0.0002 0.008 0.005 0.009 0.005 0.006 0.001 0.006 0.008E2 (GPa) 4+ 3694 541 557 219 1523 248 338 244 1005 405S 2+ 0.026 0.006 0.012 0.017 0.038 0.026 0.028 0.089 0.019 0.48S 3+ 0.150 0.104 0.082 0.042 0.188 0.016 0.060 0.601 0.234 0.405S 4+ 0.001 0.002 4.75E-07 2.99E-04 9.36E-05 1.19E-04 5.97E-05 7.35E-04 2.49E-07 9.70E-07
r1, r2: ideal radii of M1 and M2 sites; D1, D2: strain free partition coefficients of M1 and M2 sites; E1, E2: Young modulii of M1 and M2 sites.2+: Divalent curve; 3+: trivalent curve; 4+: tetravalent curve.S = distance between the best fit and the data set, calculated as: S ¼
Pi
Dimesured�Di
calculated
Dimesured
h i2
where i is a trace element.
180 C. Cartier et al. / Geochimica et Cosmochimica Acta 130 (2014) 167–187
(Hirsch and Shankland, 1993), which may affect the parti-tioning of trace elements.
Considering the uncertainties, the elastic parameters ob-tained are constant within our range of experimental condi-tions (Table 6). We do not observe any correlation withoxygen fugacity which varies by 7 orders of magnitudeamong our experiments. In addition, no correlation isfound with temperature, composition of the melt, or com-position of the pyroxene. Thus, within the precision ofour model, we do not observe an influence of intensiveand compositional parameters on crystal chemical parti-tioning for elements with constant valence state.
4.4.2. Effects of reducing conditions on element valence and
partitioning
Oxygen fugacity is a dominant parameter controllingpartition coefficient of multivalent elements. On Fig. 6, inthe two less reduced runs 1183 (IW � 0.8) and 1137(IW � 0.9), we observe that Cr and V have similar partitioncoefficients. This coincidence may indicate that V and Crhave the same valence, and close size. Offset of D(Cr) andD(V) above the trivalent curve is consistent with similarcrystal field energies affecting both V3+ and Cr3+, leadingto stabilization and enrichment of these two elements intothe orthopyroxene M1 site (Burns, 1970). These observa-tions suggest that at these redox conditions (similar to thoseof lunar basalts), Cr and V are mainly trivalent in the orth-opyroxene (Burns and Burns, 1975; Papike, 2005), whereasthe silicate melt probably already contains a significantamount of Cr2+ (Berry et al., 2006). In all other runs(1212, 1210, 1133, 1093b, 1135, 1083c, 1141 and 1178),which are much more reduced, we observe a contrastedbehavior of Cr and V. Vanadium keeps its position above
or on the trivalent curve while the Cr partition coefficientdecreases steadily with decreasing fO2, until it falls belowdetection limit in the pyroxenes of the two most reducedsamples (1141 and 1178). We can interpret this behavioras the progressive valence change of Cr, from Cr3+ toCr2+ in the enstatite, Cr2+ being known to be more incom-patible than Cr3+ in pyroxenes (Papike, 2005), due to crys-tal field stabilization energies. Burns and Burns (1975)demonstrated that Cr occurs exclusively as Cr3+ in mineralscrystallized at mantle fO2 values and Berry et al. (2006)shown that Cr2+/Cr3+ in silicate melts varies from �0.45at the nickel–nickel oxide (NNO) fO2 buffer to �0.90 atiron–wustite (IW), indicating that Cr2+ is likely to be thedominant oxidation state in terrestrial basaltic melts. Ourresults show that under very reducing conditions(<IW � 5) Cr2+ occurs in the crystal, as well.
On the contrary V remains at the same position abovethe trivalent curve for all runs. We can interpret this featurein two ways: either V remains predominantly trivalent withdecreasing fO2, or its apparent stable behavior could be dueto the fact that V3+ and V2+ have very similar compatibil-ities in the pyroxene (Simon et al., 2007; Karner et al., 2008,Mallmann and O’Neill, 2009). In this case, V could be par-tially V2+ in enstatite.
Although the tetravalent curve is not well constrained,we note that for the two least reduced runs 1183(IW � 0.8) and 1137 (IW � 0.9) the Ti points lie on thetetravalent curves. This indicates that Ti being entirely tet-ravalent is a possible solution in these samples (Ti4+ doesnot possess crystal field stabilization energy). Converselyin all other runs, Ti always lies markedly above thetetravalent curve, and its partition coefficient approachesthat of Sc, suggesting a mixed valence state of Ti4+ and
0.6r1(3+) A
Freq
uenc
y (%
)
0.65 0.7 0.6r1(3+) A
0.65 0.7
100
50
0
0.6 0.8r2(3+) A
0.6 0.8r2(3+) A
Freq
uenc
y (%
)
100
50
0
0.27A 0.23A
0.14A 0.14A
Fig. 7. Histograms of “acceptable” solutions (solutions withdistance to the data lower than the sum of the analytical errorbar of data points) for the seven runs of the reproducibility testperformed on samples 1178 and 1137. Each figure consists of thesuperimposition of the seven histograms corresponding to theseven runs (10 million simulations each) of the test, for each of thetwo samples. Note that the seven histograms are indistinguishable.For every histogram, the distance between the two branches of thecurve at mid-height of the mode represents the error bar on thefitted parameter, i.e. the variability among the “acceptable”
solutions. Only results on strain-free radii are shown. The greylines correspond to each best fist of the seven runs.
C. Cartier et al. / Geochimica et Cosmochimica Acta 130 (2014) 167–187 181
Ti3+ in pyroxenes. Mixed 3+ and 4+ Ti valence states havebeen reported by Longhi (1992) and van Kan Parker et al.(2011a). We conclude that between IW � 1 and IW � 8 Tichanges from 4+ to 3+ state in the pyroxene.
Nb and Ta were above the detection limit in three runsonly. This is due to the presence of metallic alloy capturingthese elements under reducing conditions (Cartier et al.,2013; Wade and Wood, 2001; Corgne et al., 2008). In ter-restrial magmatic conditions these elements are both penta-valent. In the two least reduced runs 1183 (IW � 0.8) and1137 (IW � 0.9), the position of D(Nb) and D(Ta) underthe tetravalent curve is consistent with them being Nb5+
and Ta5+. However in run 1210, Nb is compatible in thepyroxene, its partition coefficient being equivalent to thatof Mg. Moreover, in the same experiment D(Ta) is alsohigh, and lies above the tetravalent cation curve. We sug-gest that in run 1210 Nb and Ta could be present in a re-duced form. This surprising result is neverthelessconsistent with Cartier et al. (2013) who propose that belowIW � 4 Nb2+ and Ta3+ could be present in the silicate melt.
Finally we note a recurrent anomaly for Y (Fig. 4). Thisanomaly is positive for sample 1178 (IW � 8.2), 1083c(IW � 7.1), 1133 (IW � 6.1) and 1210 (IW � 5.5) andslightly negative for 1093b (IW � 5.9) and 1183(IW � 1.3). Moreover, in most cases, Y is offset from thetrivalent curve (Fig. 6). It is possible that this anomaly is re-lated to a change in Y valence state. Given our very reduc-ing conditions this could be related to presence of divalentY. Y2+ has already been described in a crystal by Bill et al.(1986). This anomaly could also be due to the different elec-tron orbital configuration of Y compared to the REE, assuggested by Hammouda et al. (2010). Unfortunately ourdata do not allow a definitive conclusion on this element.
5. D(CR)/D(V) AS A BROAD FO2 PROXY
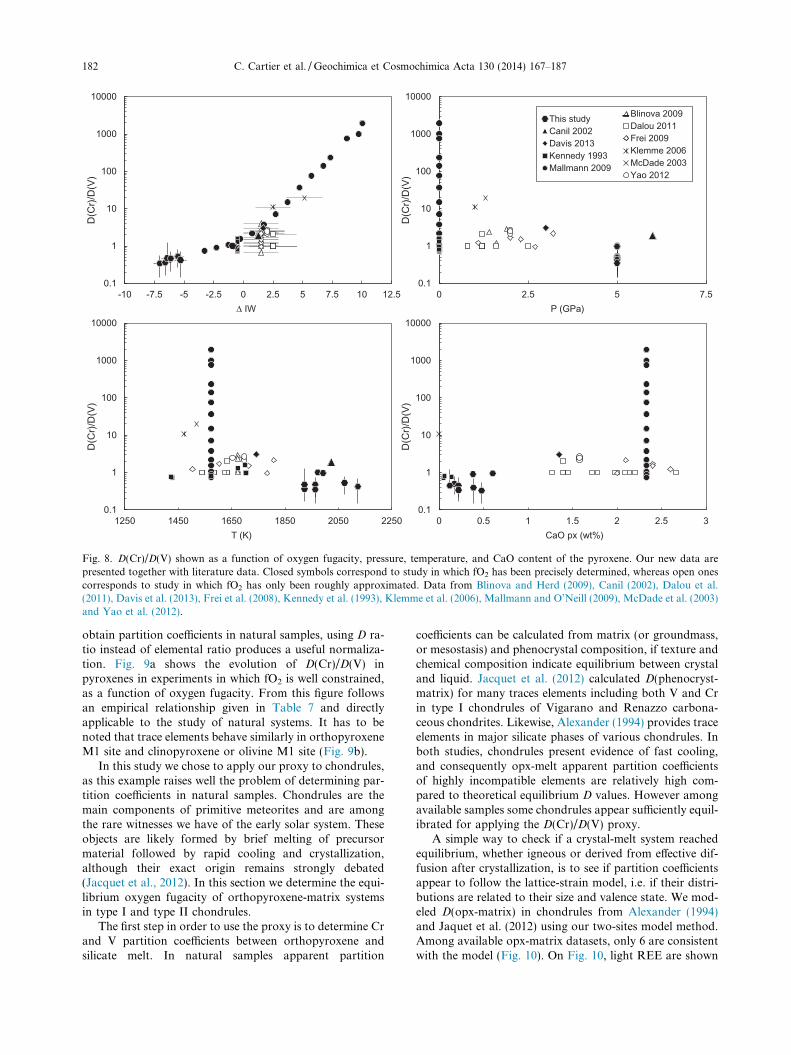
As we have shown, Cr and V partitioning strongly dependon oxygen fugacity. Using the behavior of these elements astracers of redox conditions during magmatic processes hasbeen widely promoted in the literature (Canil, 1997, 1999,2002; Canil et al., 2006, Mallmann and O’Neill, 2009, 2013,Karner et al. 2008). In these studies, the partitioning of Crand V was determined as a function of fO2 but never downto the very reducing conditions employed in our study. In thissection we propose to apply the ratio D(Cr)/D(V), whereD(Cr) and D(V) are the partition coefficients of Cr or V be-tween orthopyroxene and silicate melt, over a much more ex-tended range of oxygen fugacities as a fO2 proxy.
In orthopyroxene Cr and V are both incorporated in theoctahedral M1 site. Cr can be Cr3+ or Cr2+, and its parti-tion coefficient decreases with increasingly reducing condi-tions. On the contrary, V can be V5+, V4+, V3+ and V2+
and its partition coefficient increases with increasinglyreducing conditions and levels off between V3+ and V2+.This contrasting behavior allows D(Cr)/D(V) to be usedas an accurate proxy of oxygen fugacity prevailing duringpyroxene crystallization. Indeed this ratio varies over 5 or-ders of magnitude among the redox conditions of the wholesolar system, whereas D(V) and D(Cr) taken separately var-ies by 3 and 2 orders of magnitude, respectively. We havetested various parameters to determine which has a domi-nant influence on D(Cr)/D(V). The result is illustrated onFig. 8 where D(Cr)/D(V) is plotted as a function of fO2,pressure, temperature, and pyroxene CaO content. Thenew data from the present study are presented together withliterature data. Closed symbols correspond to studies inwhich fO2 has been accurately determined, whereas openones correspond to studies in which fO2 has only beenroughly estimated. It is clear that D(Cr)/D(V) is controlledby fO2, while other parameters, although having a signifi-cant impact on D values, have negligible effect on the ratioD(Cr)/D(V). Thus D(Cr)/D(V) appears to be a very power-ful fO2 proxy: it covers the whole range of fO2 for objects inthe solar system (IW � 8 to IW + 12) and it can be usedregardless of the P, T, and composition of the system con-sidered. Moreover, and unlike the V/Sc proxy (Li and Lee,2004), this tool can be used either in pure silicate systems,or in metal–silicate systems because it is insensitive to metalinfluence. This broadens the field of application to all mag-matic processes. Indeed, even it is sometimes difficult to
0.1
1
10
100
1000
10000
-10 -7.5 -5 -2.5 0 2.5 5 7.5 10 12.5
D(C
r)/D
(V)
Δ IW
0.1
1
10
100
1000
10000
0 2.5 5 7.5
D(C
r)/D
(V)
P (GPa)
0.1
1
10
100
1000
10000
1250 1450 1650 1850 2050 2250
D(C
r)/D
(V)
T (K)
0.1
1
10
100
1000
10000
0 0.5 1 1.5 2 2.5 3
D(C
r)/D
(V)
CaO px (wt%)
This studyCanil 2002Davis 2013Kennedy 1993Mallmann 2009
Blinova 2009Dalou 2011Frei 2009Klemme 2006McDade 2003Yao 2012
Fig. 8. D(Cr)/D(V) shown as a function of oxygen fugacity, pressure, temperature, and CaO content of the pyroxene. Our new data arepresented together with literature data. Closed symbols correspond to study in which fO2 has been precisely determined, whereas open onescorresponds to study in which fO2 has only been roughly approximated. Data from Blinova and Herd (2009), Canil (2002), Dalou et al.(2011), Davis et al. (2013), Frei et al. (2008), Kennedy et al. (1993), Klemme et al. (2006), Mallmann and O’Neill (2009), McDade et al. (2003)and Yao et al. (2012).
182 C. Cartier et al. / Geochimica et Cosmochimica Acta 130 (2014) 167–187
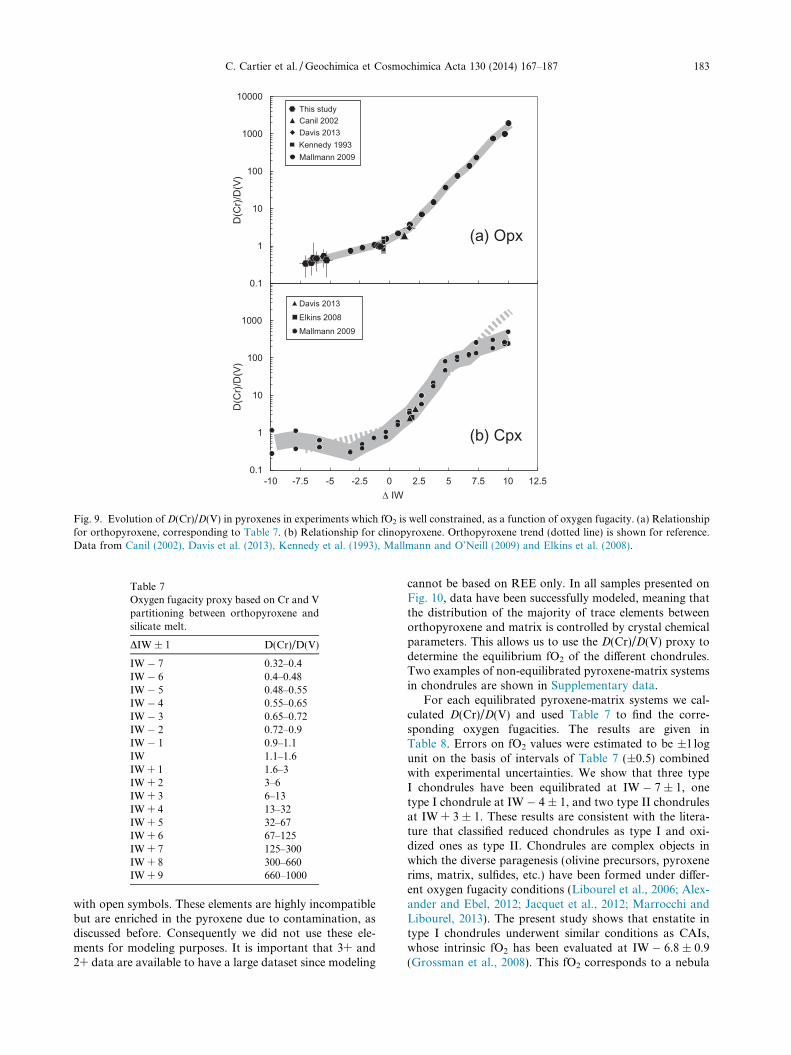
obtain partition coefficients in natural samples, using D ra-tio instead of elemental ratio produces a useful normaliza-tion. Fig. 9a shows the evolution of D(Cr)/D(V) inpyroxenes in experiments in which fO2 is well constrained,as a function of oxygen fugacity. From this figure followsan empirical relationship given in Table 7 and directlyapplicable to the study of natural systems. It has to benoted that trace elements behave similarly in orthopyroxeneM1 site and clinopyroxene or olivine M1 site (Fig. 9b).
In this study we chose to apply our proxy to chondrules,as this example raises well the problem of determining par-tition coefficients in natural samples. Chondrules are themain components of primitive meteorites and are amongthe rare witnesses we have of the early solar system. Theseobjects are likely formed by brief melting of precursormaterial followed by rapid cooling and crystallization,although their exact origin remains strongly debated(Jacquet et al., 2012). In this section we determine the equi-librium oxygen fugacity of orthopyroxene-matrix systemsin type I and type II chondrules.
The first step in order to use the proxy is to determine Crand V partition coefficients between orthopyroxene andsilicate melt. In natural samples apparent partition
coefficients can be calculated from matrix (or groundmass,or mesostasis) and phenocrystal composition, if texture andchemical composition indicate equilibrium between crystaland liquid. Jacquet et al. (2012) calculated D(phenocryst-matrix) for many traces elements including both V and Crin type I chondrules of Vigarano and Renazzo carbona-ceous chondrites. Likewise, Alexander (1994) provides traceelements in major silicate phases of various chondrules. Inboth studies, chondrules present evidence of fast cooling,and consequently opx-melt apparent partition coefficientsof highly incompatible elements are relatively high com-pared to theoretical equilibrium D values. However amongavailable samples some chondrules appear sufficiently equil-ibrated for applying the D(Cr)/D(V) proxy.
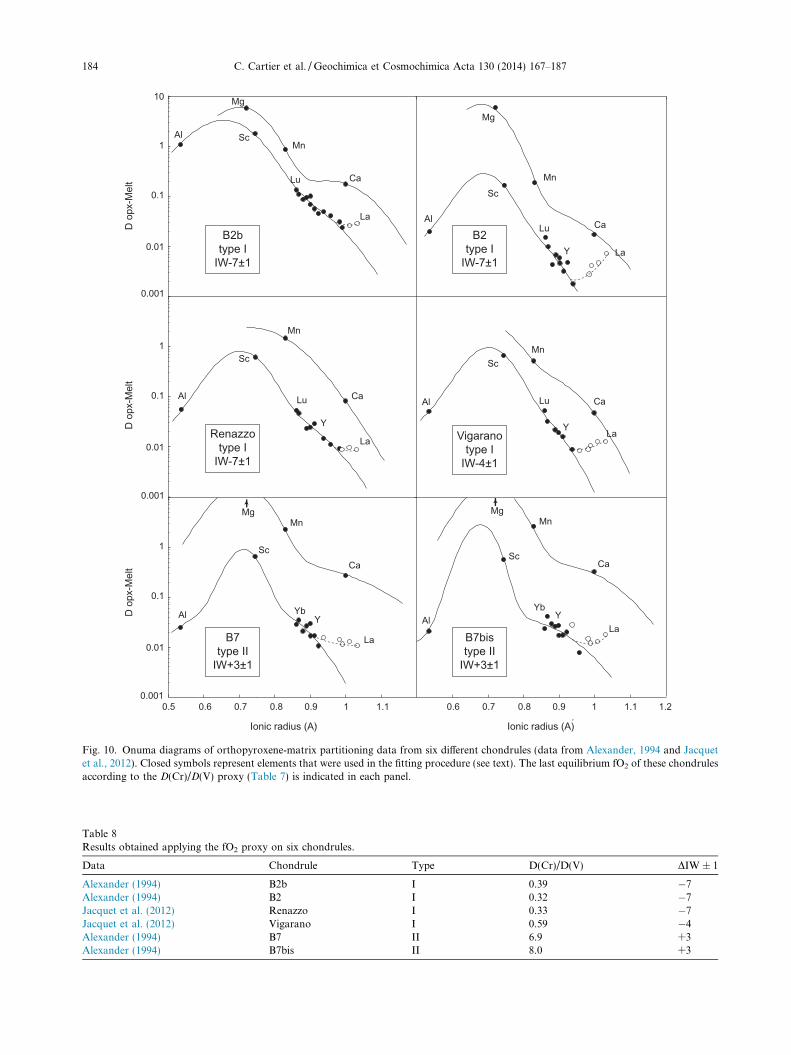
A simple way to check if a crystal-melt system reachedequilibrium, whether igneous or derived from effective dif-fusion after crystallization, is to see if partition coefficientsappear to follow the lattice-strain model, i.e. if their distri-butions are related to their size and valence state. We mod-eled D(opx-matrix) in chondrules from Alexander (1994)and Jaquet et al. (2012) using our two-sites model method.Among available opx-matrix datasets, only 6 are consistentwith the model (Fig. 10). On Fig. 10, light REE are shown
0.1
1
10
100
1000
-10 -7.5 -5 -2.5 0 2.5 5 7.5 10 12.5
D(C
r)/D
(V)
Δ IW
(a) Opx
(b) Cpx
Davis 2013Elkins 2008Mallmann 2009
This study
Mallmann 2009Kennedy 1993
Canil 2002Davis 2013
0.1
1
10
100
1000
10000
D(C
r)/D
(V)
Fig. 9. Evolution of D(Cr)/D(V) in pyroxenes in experiments which fO2 is well constrained, as a function of oxygen fugacity. (a) Relationshipfor orthopyroxene, corresponding to Table 7. (b) Relationship for clinopyroxene. Orthopyroxene trend (dotted line) is shown for reference.Data from Canil (2002), Davis et al. (2013), Kennedy et al. (1993), Mallmann and O’Neill (2009) and Elkins et al. (2008).
Table 7Oxygen fugacity proxy based on Cr and Vpartitioning between orthopyroxene andsilicate melt.
DIW ± 1 D(Cr)/D(V)
IW � 7 0.32–0.4IW � 6 0.4–0.48IW � 5 0.48–0.55IW � 4 0.55–0.65IW � 3 0.65–0.72IW � 2 0.72–0.9IW � 1 0.9–1.1IW 1.1–1.6IW + 1 1.6–3IW + 2 3–6IW + 3 6–13IW + 4 13–32IW + 5 32–67IW + 6 67–125IW + 7 125–300IW + 8 300–660IW + 9 660–1000
C. Cartier et al. / Geochimica et Cosmochimica Acta 130 (2014) 167–187 183
with open symbols. These elements are highly incompatiblebut are enriched in the pyroxene due to contamination, asdiscussed before. Consequently we did not use these ele-ments for modeling purposes. It is important that 3+ and2+ data are available to have a large dataset since modeling
cannot be based on REE only. In all samples presented onFig. 10, data have been successfully modeled, meaning thatthe distribution of the majority of trace elements betweenorthopyroxene and matrix is controlled by crystal chemicalparameters. This allows us to use the D(Cr)/D(V) proxy todetermine the equilibrium fO2 of the different chondrules.Two examples of non-equilibrated pyroxene-matrix systemsin chondrules are shown in Supplementary data.
For each equilibrated pyroxene-matrix systems we cal-culated D(Cr)/D(V) and used Table 7 to find the corre-sponding oxygen fugacities. The results are given inTable 8. Errors on fO2 values were estimated to be ±1logunit on the basis of intervals of Table 7 (±0.5) combinedwith experimental uncertainties. We show that three typeI chondrules have been equilibrated at IW � 7 ± 1, onetype I chondrule at IW � 4 ± 1, and two type II chondrulesat IW + 3 ± 1. These results are consistent with the litera-ture that classified reduced chondrules as type I and oxi-dized ones as type II. Chondrules are complex objects inwhich the diverse paragenesis (olivine precursors, pyroxenerims, matrix, sulfides, etc.) have been formed under differ-ent oxygen fugacity conditions (Libourel et al., 2006; Alex-ander and Ebel, 2012; Jacquet et al., 2012; Marrocchi andLibourel, 2013). The present study shows that enstatite intype I chondrules underwent similar conditions as CAIs,whose intrinsic fO2 has been evaluated at IW � 6.8 ± 0.9(Grossman et al., 2008). This fO2 corresponds to a nebula
10
1
0.1
0.01
1
0.1
0.01
1
0.1
0.01
0.001
0.001
0.001
Al
Sc
MgMn
Ca
YbY
La
YbY
La
MgMn
CaSc
Y
Lu
La
Al
ScMn
Ca
Y
Lu
La
Al
Sc
Mg
Mn
Ca
Lu
La
Ca
Mn
Mg
ScAl
Al
D o
px-M
elt
D o
px-M
elt
D o
px-M
elt
0.5 0.6 0.7 0.8 0.9 1 1.1 0.6 0.7 0.8 0.9 1 1.1 1.2
B2btype I
IW-7±1
B2type I
IW-7±1
Vigaranotype I
IW-4±1
B7type II
IW+3±1
B7bistype II
IW+3±1
Ionic radius (A) Ionic radius (A)
Al
Sc
Mn
Lu
Y
La
Ca
Renazzotype I
IW-7±1
Fig. 10. Onuma diagrams of orthopyroxene-matrix partitioning data from six different chondrules (data from Alexander, 1994 and Jacquetet al., 2012). Closed symbols represent elements that were used in the fitting procedure (see text). The last equilibrium fO2 of these chondrulesaccording to the D(Cr)/D(V) proxy (Table 7) is indicated in each panel.
Table 8Results obtained applying the fO2 proxy on six chondrules.
Data Chondrule Type D(Cr)/D(V) DIW ± 1
Alexander (1994) B2b I 0.39 �7Alexander (1994) B2 I 0.32 �7Jacquet et al. (2012) Renazzo I 0.33 �7Jacquet et al. (2012) Vigarano I 0.59 �4Alexander (1994) B7 II 6.9 +3Alexander (1994) B7bis II 8.0 +3
184 C. Cartier et al. / Geochimica et Cosmochimica Acta 130 (2014) 167–187
C. Cartier et al. / Geochimica et Cosmochimica Acta 130 (2014) 167–187 185
of solar composition (�IW � 7, Grossman et al., 2008).Our results strengthen the dichotomy between the two typesof chondrules and the conditions they experienced.
6. CONCLUSIONS AND IMPLICATIONS
We obtained the first enstatite–silicate liquid partitioncoefficient data under very reducing conditions. We devel-oped a new method based on the crystal lattice strain modeland mineralogical assumptions to fit our data. The modelcan fit our partitioning data well, strongly suggesting ofattainment of equilibrium within our experiments. The pre-cision of the lattice strain model parameters obtained doesnot allow assessing the influence of composition, P, and Ton opx-melt partitioning within our range of conditions.
Oxygen fugacity has strong influence on multivalentelement partitioning. Transition metals Ti, Cr and Vspeciation was already known to be highly dependent onredox conditions (Canil, 1999; Wadhwa, 2001; Shearerand Papike, 2005; Mallmann and O’Neill, 2009). At aroundIW � 1.5 and 5 GPa, we confirmed that Cr and V aremostly trivalent in the orthopyroxene, and Ti is present asmixture between 3+ and 4+ states. We demonstrated thatunder more reducing conditions (<IW � 4), Cr and V areincreasingly reduced to the divalent state in the crystaland the Ti3+ fraction increases. Moreover at highly reduc-ing conditions Nb and Ta, that usually are pentavalent inmagmatic systems, appear to be reduced to other species,perhaps in the form of Nb2+ and Ta3+.
We developed a new fO2 proxy based on the opx-meltD(Cr)/D(V). We showed that this tool is not dependenton P, T and composition, while varying over five ordersof magnitude as a function of fO2. Our new data extendthe redox range covered by previous studies and allowsthe proxy to be used in the complete range of redox condi-tions of the solar system. We selected six chondrules fromthe literature on the criterion of their equilibrium. Applyingthe redox proxy to these samples, we estimated three type Ichondrules to have equilibrated at IW � 7 ± 1, one type Ichondrule at IW � 4 ± 1, and two type II chondrules atIW + 3 ± 1. Our approach could help understanding theirformation, and their relationship with other primitive ob-jects, such as CAIs.
ACKNOWLEDGEMENTS
The authors want to thank J. Bedard for providing us hispyroxene data compilation. The authors also thank D. Andraultfor helpful discussion about crystal field theory, J.M. Henot forassistance on the SEM and J.L. Fruquiere for technical help.Comments by two anonymous reviewers and particularly by AEWim van Westrenen helped improving this manuscript and aregratefully acknowledged. This research received funding from theEuropean Research Council under the European Community’sSeventh Framework Program (FP7/2007-2013 Grant Agreement209035) and from the French PNP program (INSU-CNRS). Themultianvil apparatus of Laboratoire Magmas et Volcans isfinancially supported by the Centre National de la RechercheScientifique (Instrument National de l’INSU).
APPENDIX A. SUPPLEMENTARY DATA
Supplementary data associated with this article can befound, in the online version, at http://dx.doi.org/10.1016/j.gca.2014.01.002.
REFERENCES
Albarede F. (2009) Volatile accretion history of the terrestrialplanets and dynamic implications. Nature 461, 1227–1233.
Alexander C. M. (1994) Trace-element distributions withinordinary chondrite chondrules – implications for chondruleformation conditions and precursors. Geochim. Cosmochim.
Acta 58, 3451–3467.Alexander C. M. O. and Ebel D. S. (2012) Questions, questions:
Can the contradictions between the petrologic, isotopic, ther-modynamic, and astrophysical constraints on chondrule for-mation be resolved? Meteorit. Planet. Sci. 47, 1157–1175.
Berry A. J., O’Neill H. St. C., Scott D. R., Foran G. J. and ShelleyJ. M. G. (2006) The effect of composition on Cr2+/Cr3+ insilicate melts. Am. Mineral. 91, 1901–1908.
Bill H., Magne G., Balestra C. and Lovy D. (1986) A trigonallycharge-compensated Y2+ ion in CaF2: a Jahn–Teller system. J.
Physics C: Solid State 19, 19–23.Blinova A. and Herd C. D. K. (2009) Experimental study of
polybaric REE partitioning between olivine, pyroxene and meltof the Yamato 980459 composition: Insights into the petrogen-esis of depleted shergottites. Geochim. Cosmochim. Acta 73,3471–3492.
Blundy J. and Wood B. (1994) Prediction of crystal-melt partition-coefficients from elastic-moduli. Nature 372, 452–454.
Blundy J. and Wood B. (2003) Partitioning of trace elementsbetween crystals and melts. Earth Planet. Sci. Lett. 210, 383–397.
Boyet M. and Carlson R. W. (2005) Nd-142 evidence for early(>4.53 Ga) global differentiation of the silicate Earth. Science
309, 576–581.Brett R. and Sato M. (1984) Intrinsic oxygen fugacity on seven
chondrites, a pallasite, and a tektite and the redox state ofmeteorite parent bodies. Geochim. Cosmochim. Acta 48, 111–120.
Brice J. C. (1975) Some thermodynamic aspects of the growth ofstrained crystals. J. Cryst. Growth 28, 249–253.
Burns R. G. (1970) Site preferences of transition metal ions insilicate crystal structures. Chem. Geol. 5, 275–283.
Burns V. and Burns R. G. (1975) Mineralogy of chromium.Geochim. Cosmochim. Acta 39, 903–910.
Campbell A. J., Danielson L., Righter K., Seagle C. T., Wang Y.and Prakapenka V. B. (2009) High pressure effects on the iron–iron oxide and nickel–nickel oxide oxygen fugacity buffers.Earth Planet. Sci. Lett. 286, 556–564.
Canil D. (1997) Vanadium partitioning and the oxidation state ofarchean komatites magmas. Nature 389, 842–845.
Canil D. (1999) Vanadium partitioning between orthopyroxene,spinel and silicate melt and the redox states of mantle sourceregions for primary magmas. Geochim. Cosmochim. Acta 63,557–572.
Canil D. (2002) Vanadium in peridotites, mantle redox and tectonicenvironments: Archean to present. Earth Planet. Sci. Lett. 195.
Canil D., Johnston S. T. and Mihalynuk M. (2006) Mantle redox inCordilleran ophiolites as a record of oxygen fugacity duringpartial melting and the lifetime of mantle lithosphere. Earth
Planet. Sci. Lett. 248, 106–117.
186 C. Cartier et al. / Geochimica et Cosmochimica Acta 130 (2014) 167–187
Carmichael I. S. E. (1991) Mineralogy and the redox states of basicand silicic magmas: a reflection of their source regions. Contrib.
Mineral Petrol. 106, 129–141.Cartier, C., Hammouda, T., Bouhifd, M.A., Boyet M. and Devidal
J.L. (2013) Nb/Ta decoupling under low fo2. GoldschmidtConference Abstract.
Clayton R. N. (1993) Oxygen isotopes in meteorites. Annu. Rev.
Earth Planet. Sci. 21, 115–149.Corgne A., Keshav S., Wood B., McDonough W. and Fei Y.
(2008) Metal–silicate partitioning and constraints on corecomposition and oxygen fugacity during Earth accretion.Geochim. Cosmochim. Acta 72, 574–589.
Dalou C., Koga K. T., Shimizu N., Boulon J. and Devidal J. L.(2011) Experimental determination of F and Cl partitioningbetween lherzolite and basaltic melt. Contrib. Mineral Petrol.
163, 591–609.Dauphas N., Davis A. M., Marty B. and Reisberg L. (2004) The
cosmic molybdenum–ruthenium isotope correlation. Earth
Planet. Sci. Lett. 226, 465–475.Davis F., Humayun M., Hirschmann M. M. and Cooper R. S.
(2013) Experimentally determined mineral/melt partitioning offirst-row transition elements (FRTE) during partial melting ofperidotite at 3 GPa. Geochim. Cosmochim. Acta 104, 232–260.
Elkins L. J., Gaetani G. A. and Sims K. W. W. (2008) Partitioningof U and Th during garnet pyroxenite partial melting:Constraints on the source of alkaline ocean island basalts.Earth Planet. Sci. Lett. 265, 270–286.
Fitoussi C. and Bourdon B. (2012) Silicon isotope evidence againstan enstatite chondrite earth. Science 335, 1477–1480.
Frei D., Liebscher A., Franz G., Wunder B., Klemme S. andBlundy J. (2008) Trace element partitioning between orthopy-roxene and anhydrous silicate melt on the lherzolite solidusfrom 1.1 to 3.2 GPa and 1,230 to 1,535�C in the model systemNa2O–CaO–MgO–Al2O3–SiO2. Contrib. Mineral Petrol. 157,473–490.
Frost D. J. and McCammon C. A. (2008) The redox state of earth’smantle. Annu. Rev. Earth Planet. Sci. 36, 389–420.
Gagnon J. E., Fryer B. J., Samson I. M. and William-Jones A. E.(2008) Quantitative analysis of silicate certified referencematerials by LA-ICPMS with and without an internal standard.J. Anal. Atom. Spectrom. 23, 1529–1537.
Ghose S., Schomaker V. and McMullan R. K. (1986) Enstatite,Mg2Si206: A neutron diffraction refinement of the crystalstructure and a rigid-body analysis of the thermal vibration.Z. Kristallogr. 176, 159–175.
Green T., Blundy J., Adam J. and Yaxley G. (2000) SIMSdetermination of trace element partition coefficients betweengarnet, clinopyroxene and hydrous basaltic liquids at 2–7.5 GPa and 1080–1200�C. Lithos 53, 165–187.
Grossman L., Beckett J. R., Fedkin A. V., Simon S. B. and CieslaF. J. (2008) Redox conditions in the solar nebula: observa-tional, experimental, and theoretical constraints. Rev. Mineral.
Geochem. 68, 93–140.Hammouda T. (2003) High-pressure melting of carbonated eclogite
and experimental constraints on carbon recycling and storage inthe mantle. Earth Planet. Sci. Lett. 214, 357–368.
Hammouda T., Chantel J. and Devidal J. L. (2010) Apatitesolubility in carbonatitic liquids and trace element partitionningbetween apatite and carbonatite at high pressure. Geochim.
Cosmochim. Acta 74, 7220–7235.Hazen R. M. and Finger L. W. (1979) Bulk modulus–volume
relationship for cation–anion polyhedra. J. Geophys. Res. 84,6723–6728.
Hill E., Wood B. J. and Blundy J. D. (2000) The effect of Ca-Tschermaks component on trace element partitioning betweenclinopyroxene and silicate melt. Lithos 53, 203–215.
Hill E., Blundy J. D. and Wood B. J. (2011) Clinopyroxene–melttrace element partitioning and the development of a predictivemodel for HFSE and Sc. Contrib. to Mineral. Petrol. 161, 423–438.
Hirsch L. M. and Shankland T. J. (1993) Quantitative olivine-defect chemical model: insights on electrical conduction,diffusion, and the role of Fe content. Geophys. J. Int. 114, 21–35.
Holzheid A., Palme H. and Chakraborty S. (1997) The activities ofNiO, CoO and FeO in silicate melts. Chem. Geol. 139, 21–38.
Huebner, J.S. (1971) Buffering techniques for hydrostatic systemsat elevated pressures. In: Research techniques for high pressure
and high temperature (ed. G. C. Ulmer), pp. 123–177.Hultgren, R., Desai, P.D., Hawkins, D.T., Gleiser, M., Kelley, K.
K. and Wagman, D.D.W. (1973) Selected Values of theThermodynamic Properties of the Elements.
Jacquet E., Alard O. and Gounelle M. (2012) Chondrule traceelement geochemistry at the mineral scale. Meteorit. Planet. Sci.
47, 1695–1714.Javoy M., Pineau F. and Demaiffe D. (1984) Nitrogen and carbon
isotopic composition in the diamonds of Mbuji Mayi (Zaire).Earth Planet. Sci. Lett. 68, 399–412.
Javoy M., Kaminski E., Guyot F., Andrault D., Sanloup C.,Moreira M., Labrosse S., Jambon A., Agrinier P., Davaille A.and Jaupart C. (2010) The chemical composition of the Earth:enstatite chondrite models. Earth Planet. Sci. Lett. 293, 259–268.
Karner J. M., Papike J. J., Sutton S. R., Shearer C. K., Burger P.,Kay G. M. C. and Le L. (2008) Valence state partitioning of Vbetween pyroxene-melt: effects of pyroxene and melt composi-tion, and direct determination of V valence states by XANES.Application to Martian basalt QUE 94201 composition.Meteorit. Planet. Sci. 43, 1275–1285.
Kennedy A. K., Lofgren G. E. and Wasserburg G. J. (1993) Anexperimental study of trace element partitioning betweenolivine, orthopyroxene and melt in chondrules: equilibriumvalues and kinetic effects. Earth Planet. Sci. Lett. 115, 177–195.
Klemme S., Gunther D., Hametner K., Prowatke S. and Zack T.(2006) The partitioning of trace elements between ilmenite,ulvospinel, armalcolite and silicate melts with implications forthe early differentiation of the Moon. Chem. Geol. 234, 251–263.
Larimer J. W. and Buseck P. R. (1974) Equilibration temperaturesin enstatite chondrites. Geochim. Cosmochim. Acta 38, 471–477.
Li Z. X. and Lee C. T. (2004) The constancy of upper mantle fO2
through time inferred from V/Sc ratios in basalts. Earth Planet.
Sci. Lett. 228, 483–493.Libourel G., Krot A. and Tissandier L. (2006) Role of gas-melt
interaction during chondrule formation. Earth Planet. Sci. Lett.
251, 232–240.Longhi J. (1992) Experimental petrology and petrogenesis of mare
volcanics. Geochim. Cosmochim. Acta 56, 2235–2251.Mallmann G. and O’Neill H. S. C. (2009) The crystal/melt
partitioning of V during mantle melting as a function ofoxygen fugacity compared with some other elements (Al, P, Ca,Sc, Ti, Cr, Fe, Ga, Y, Zr and Nb). J. Petrol. 50, 1765–1794.
Mallmann G. and O’Neill H. S. C. (2013) Calibration of anempirical thermometer and oxybarometer based on the parti-tioning of Sc, Y and V between olivine and silicate melt. J.
Petrol., 1–17.Marrocchi Y. and Libourel G. (2013) Sulfur and sulfides in
chondrules. Geochim. Cosmochim. Acta 119, 117–136.McCoy T. J., Dickinson T. L. and Lofgren G. (1999) Partial
melting of the Indarch (EH4) meteorite: a textural, chemicaland phase relations view of melting and melt migration.Meteorit. Planet. Sci. 34, 735–746.
C. Cartier et al. / Geochimica et Cosmochimica Acta 130 (2014) 167–187 187
McDade P., Blundy J. D. and Wood B. J. (2003) Trace elementpartitioning between mantle wedge peridotite and hydrousMgO-rich melt. Am. Mineral. 88, 1825–1831.
Meisel T., Walker R. and Morgan J. (1996) The osmium isotopiccomposition of the Earth’s primitive upper mantle. Nature 383,515–520.
Morimoto N., Fabries J., Ferguson A., Ginzburg I. V., Ross M.,Seifert F. A., Zussman U., Aoki K. and Gottardi G. (1988)Nomenclature of pyroxenes. Am. Mineral. 73, 1123–1133.
Onuma N., Higuchi H., Wakita H. and Nagasawa H. (1968) Traceelement partition between 2 pyroxenes and host lava. Earth
Planet. Sci. Lett. 5, 47.Papike J. J. (2005) Comparative planetary mineralogy: valence
state partitioning of Cr, Fe, Ti, and V among crystallographicsites in olivine, pyroxene, and spinel from planetary basalts.Am. Mineral. 90, 277–290.
Papike J. J., Karner J. M. and Shearer C. K. (2004) Comparativeplanetary mineralogy: V /(Cr + Al) systematics in chromite asan indicator of relative oxygen fugacity. Am. Mineral. 89, 1557–1560.
Papike J. J., Spilde M. N., Fowler G. W., Layne G. D. and ShearerC. K. (1995) The Lodran primitive achondrite: Petrogeneticinsights from electron and ion microprobe analysis of olivineand orthopyroxene. Geochim. Cosmochim. Acta. 59, 3061–3070.
Pertermann M. and Hirschmann M. M. (2003) Anhydrous partialmelting experiments on MORB-like eclogite: Phase relations,phase compositions and mineral-melt partitioning of majorelements at 2–3 GPa. J. Petrol. 44, 2173–2201.
Pertermann M., Hirschmann M. M., Hametner K., Gunther D.and Schmidt M. W. (2004) Experimental determination of traceelement partitioning between garnet and silica-rich liquidduring anhydrous partial melting of MORB-like eclogite.Geochem. Geophy. Geosyst. 5.
Robie R.A. and Hemmingway B.S. (1995), ThermodynamicProperties of Minerals and Related Substances at 298.15 Kand 1 Bar Pressure and at Higher Temperatures. U.S. Geolog-ical Survey Bulletin 2131.
Rubin A. E. (1983) Impact melt-rocks clasts in the hvittis enstatitechondrite breccia: implications for a genetic relationshipbetween EL chondrites and aubrites. J. Geophys. Res. 88,B293–B300.
Savage P. S. and Moynier F. (2013) Silicon isotopic variation inenstatite meteorites: clues to their origin and Earth-formingmaterial. Earth Planet. Sci. Lett. 361, 487–496.
Shannon R. D. (1976) Revised effective ionic radii and systematicstudies of interatomie distances in halides and chaleogenides.Acta Crystallogr., Sect. A 32, 751–767.
Shearer C. K. and Papike J. J. (2005) Early crustal buildingprocesses on the moon: models for the petrogenesis of themagnesian suite. Geochim. Cosmochim. Acta 69, 3445–3461.
Simon S. B., Sutton S. R. and Grossman L. (2007) Valence oftitanium and vanadium in pyroxene in refractory inclusioninteriors and rims. Geochim. Cosmochim. Acta 71, 3098–3118.
Sun C. and Liang Y. (2013) Distribution of REE and HFSEbetween low-Ca pyroxene and lunar picritic melts aroundmultiple saturation points. Geochim. Cosmochim. Acta 119,340–358.
Trinquier A., Birck J. L. and Allegre C. J. (2007) Widespread Cr-54heterogeneity in the inner solar system. Astrophys. J. 655, 1179–1185.
Trinquier A., Elliott T., Ulfeck D., Coath C., Krot A. N. andBizzaro M. (2009) Origin of nucleosynthetic isotope heteroge-neity in the solar protoplanetary disk. Science 324, 374–376.
van Achteberg E., Ryan C. G., Jackson S. and Griffin W. L. (2001)Data reduction software for LA-ICP-MS. Laser-Ablation-
ICPMS in the earth sciences, principles and applications short
course series 29, 239–243.van Kan Parker M., Mason P. R. D. and van Westrenen W.
(2011a) Experimental study of trace element partitioningbetween lunar orthopyroxene and anhydrous silicate melt:effects of lithium and iron. Chem. Geol. 285, 1–14.
van Kan Parker M., Mason P. R. D. and van Westrenen W.(2011b) Trace element partitioning between ilmenite, armalco-lite and anhydrous silicate melt: Implications for the formationof lunar high-Ti mare basalts. Geochim. Cosmochim. Acta 75,4179–4193.
van Westrenen W., Allan N. L., Blundy J. D., Purton J. A. andWood B. J. (2000) Atomistic simulation of trace elementincorporation into garnets – comparison with experimentalgarnet-melt partitioning data. Geochim. Cosmochim. Acta 64,1629–1639.
Wade J. and Wood B. J. (2001) The Earth’s “missing” niobiummay be in the core. Nature 409, 75–78.
Wade J. and Wood B. J. (2005) Core formation and the oxidationstate of the Earth. Earth Planet. Sci. Lett. 236, 78–95.
Wadhwa M. (2001) Redox state of Mars’s upper mantle and crustfrom Eu anomalies in shergottite pyroxene. Science 291, 1527–1530.
Williams (1971) Equilibrium temperatures, pressures, and oxygenfugacities of the equilibrated chondrites. Geochim. Cosmochim.
Acta 35, 407–411.Wood B. J. and Blundy J. D. (1997) A predictive model for rare
earth element partitioning between clinopyroxene and anhy-drous silicate melt. Contrib. Mineral Petrol. 129, 166–181.
Yao L., Sun C. and Liang Y. (2012) A parameterized model forREE distribution between low-Ca pyroxene and basaltic meltswith applications to REE partitioning in low-Ca pyroxenealong a mantle adiabat and during pyroxenite-derived melt andperidotite interaction. Contrib. Mineral. Petrol. 164, 261–280.
Zipfel J., Palme H., Kennedy A. K. and Hutcheon I. D. (1995)Chemical composition and origin of the Acapulo Meteorite.Geochim. Cosmochim. Acta 59, 3607–3627.
Associate editor: Wim van Westrenen
Related Documents