Contact: Email: [email protected] Press office: 020 7783 8300 Public enquiries: 0370 000 2288 Experimental statistics: Children and family social work workforce in England, year ending 30 September 2017 SFR 09/2018, 15 February 2018 There were 28,500 FTE children and family social workers at 30 September 2017 (30,670 headcount), an increase of around 3% on last year Source: Children and family social worker workforce collection 2016-17. The full-time equivalent (FTE) number of children and family social workers at 30 September 2017 was 28,500, an increase of 3% from 27,700 at 30 September 2016. The number of children and family social workers at 30 September 2017 was 30,670 (headcount), an increase of 2% from 29,930 (headcount) at 30 September 2016. These increases continue a long- term trend, but may be driven partly by improved data quality (see section 1). Agency workers are recorded separately from children and family social workers employed directly by the local authority. The number of agency workers working as children and family social workers at 30 September 2017 was 5,340 (FTE), this is similar to the number at 30 September 2016, which was 5,330. During the year ending 30 September 2017, headcount turnover rate was 15% Source: Children and family social worker workforce collection 2016-17. The number of children and family social workers at 30 September 2017 was 30,670 (headcount). The number of children and family social workers leaving in the year ending 30 September 2016 was 4,500 (headcount). The turnover rate (defined as number of leavers divided by the number of workers in place at 30 September 2017) was 15% (headcount). 28,500 5,820 5,340 = 4,000 FTE Children's social workers (FTE) Vacancies (FTE) Agency Social Workers (FTE) 30,670 social workers 4,500 leavers 15% turnover rate

Experimental statistics: Children and family social work ... · Contact: Email: [email protected] Press office: 020 7783 8300 Public enquiries: 0370 000 2288 About this
Feb 12, 2020
Welcome message from author
This document is posted to help you gain knowledge. Please leave a comment to let me know what you think about it! Share it to your friends and learn new things together.
Transcript

Contact: Email: [email protected] Press office: 020 7783 8300 Public enquiries: 0370 000 2288
Experimental statistics: Children and family social
work workforce in England, year ending 30 September
2017
SFR 09/2018, 15 February 2018
There were 28,500 FTE children and family social workers at 30 September 2017 (30,670 headcount), an increase of around 3% on last year
Source: Children and family social worker workforce collection 2016-17.
The full-time equivalent (FTE) number of
children and family social workers at 30
September 2017 was 28,500, an increase
of 3% from 27,700 at 30 September 2016.
The number of children and family social
workers at 30 September 2017 was
30,670 (headcount), an increase of 2%
from 29,930 (headcount) at 30 September
2016. These increases continue a long-
term trend, but may be driven partly by
improved data quality (see section 1).
Agency workers are recorded separately
from children and family social workers
employed directly by the local authority.
The number of agency workers working as
children and family social workers at 30
September 2017 was 5,340 (FTE), this is
similar to the number at 30 September
2016, which was 5,330.
During the year ending 30 September 2017, headcount turnover rate was 15%
Source: Children and family social worker workforce collection 2016-17.
The number of children and family social
workers at 30 September 2017 was 30,670
(headcount). The number of children and
family social workers leaving in the year
ending 30 September 2016 was 4,500
(headcount).
The turnover rate (defined as number of
leavers divided by the number of workers in
place at 30 September 2017) was 15%
(headcount).
28,500
5,820
5,340
= 4,000 FTE
Children's social workers (FTE)
Vacancies (FTE)
Agency Social Workers (FTE)
30,670
social
workers
4,500
leavers
15%
turnover
rate

Contact: Email: [email protected] Press office: 020 7783 8300 Public enquiries: 0370 000 2288
Contents
1. Number of children and family social workers (tables 1a, 2, 3a, 3b, 3c, 3d, 6, 7a, 7b, 7c, 7d) ................................................................................................................. 3
Number of social workers in place as at 30 September 2017 ............................................. 3
Age and gender of children and family social workers ........................................................ 4
Time in service at local authority ......................................................................................... 5
Social worker role ................................................................................................................ 5
Ethnic Origin ........................................................................................................................ 6
Qualification level ................................................................................................................ 6
Number of cases ................................................................................................................. 6
2. Agency workers (tables 1d, 2, 6) ......................................................................... 7
3. Vacancies (table 1d, 2) ........................................................................................ 8
4. Absence (table 1d, 2) .......................................................................................... 8
5. Starters and Leavers (table 1b,1c,2,4,5a,5b,6,8a,8b,9a,9b,9c,9d) ....................... 9
Starters during 2016-17 ....................................................................................................... 9
Age, gender and origin of starters ....................................................................................... 9
Age, time in service and destination of leavers ................................................................. 10
6. Information collected on a voluntary basis from individual level returns ............. 11
7. Accompanying tables ........................................................................................ 11
8. Further information is available .......................................................................... 12
9. Experimental Statistics ...................................................................................... 12
10. Technical information ........................................................................................ 12
11. Get in touch ....................................................................................................... 13
Media enquiries ................................................................................................................. 13
Other enquiries/feedback .................................................................................................. 13

Contact: Email: [email protected] Press office: 020 7783 8300 Public enquiries: 0370 000 2288
About this release
This experimental statistical first release provides national and local level information on the children and family social work workforce in English local authorities for the year ending 30 September 2017. This is the fifth year that statistics have been published based on data collected from local authorities on the children and family social work workforce. This year is the first publication based on the individual social worker level collection, previous years have been based on an aggregate data return.
Experimental statistics
Experimental statistics are defined in the Code of Practice for Official Statistics as “new official statistics undergoing evaluation. They are published in order to involve users and stakeholders in their development and as a means to build in quality at an early stage.” For more information on experimental statistics, please visit the ONS website here.
Users should read and understand all footnotes and caveats presented in this release and the accompanying tables to fully understand the practical applications and limitations of the data. In particular, comparisons with previous year’s published statistics should be done with caution as changes from year to year may not reflect actual changes in figures, but may simply indicate improvements in data quality. Known data quality issues and explanations are listed in the technical document.
In this publication
The following documents are included in the SFR:
• National and local authority tables (Excel .xls)
• Underlying data (open format .csv and metadata .txt)
The accompanying technical document provides information on the data sources, their coverage and quality and explains the methodology used in producing the data.
Feedback
We are currently assessing the range of the tables produced from this collection, along with changing how our releases look.
We would welcome feedback on any aspect of this publication and its supplementary documents at [email protected]
1. Number of children and family social workers (tables 1a, 2, 3a, 3b, 3c, 3d, 6, 7a, 7b, 7c,
7d)
Definition of a children and family social worker
A social worker that is registered with the Health and Care Professional Council (HCPC), working in a local authority in a children’s services department or (if working in an authority where the services are joined up) a social worker that works exclusively on children and families work. This includes social workers regardless of their position in the organisation, except the Director of Children’s Services. For the purpose of this publication the following job roles are included: senior manager (for example area director); middle manager (for example service manager); first line manager (for example team manager); senior practitioner (working in a local authority in a children’s services department as a team leader or supervising social worker); case holder (a social worker that manages cases; the definition of case can be found below); and qualified without cases (for example assessed and supported year in employment (ASYE), independent reviewing officer (IRO), youth custody worker, family support).
For the purposes of this publication, agency workers working as children and family social workers are counted and reported separately to children and family social workers employed by local authorities.
Number of social workers in place as at 30 September 2017
The full-time equivalent (FTE) number of children and family social workers at 30 September 2017 was
28,500, an increase of 3% from 27,700 at 30 September 2016. The number of children and family social

4
Contact email: [email protected] Press office: 020 7783 8300 Public enquiries: 0370 000 2288
workers at 30 September 2017 was 30,670 (headcount), an increase of 2% from 29,930 (headcount) at 30
September 2016.
The increase follows the general trend from previous years although, it may be that the increases are
explained by more accurate data collection over the different years, rather than genuine increase in social
workers (see note below).
Note on year-on-year changes
Year on year comparisons should be treated with caution as the data collection method has changed between 2016 and 2017. Last year the majority of data returns were done at an aggregate level, this year all local authorities have completed an individual social worker level data return. As such part of the increase in the number of children and family social workers may be due to improved data quality and better interpretation of the guidance. This is supported by fact that the net increase based on the recorded number of starters and leavers does not fully account for the increase from last year. During the quality assurance of the data we have contacted a number of local authorities and many have confirmed that the method for counting social workers is more robust this year compared to last year. The data quality is further improved as we are collecting individual level data.
Figure 1: Number of children and family social workers at 30 September 2017
England, 2014-2017
Source: Children and family social worker workforce collection 2014-15 to 2016-17.
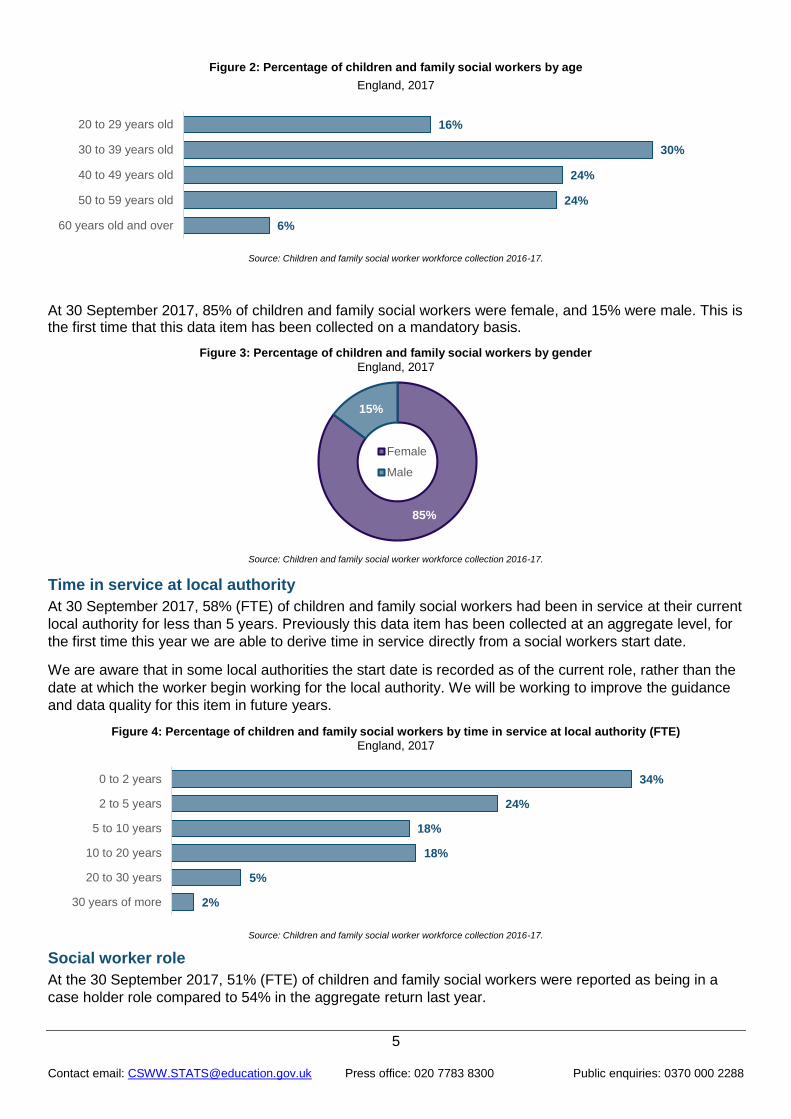
Age and gender of children and family social workers
At 30 September 2017, 55% (FTE) of children and family social workers were between 30 and 49 years of
age, broadly similar to the 54% (FTE) reported at 30 September 2016. The overall age distribution of
children and family social workers remains similar to the previous year.
26,50027,700
28,500
28,570 29,93030,670
0
5,000
10,000
15,000
20,000
25,000
30,000
35,000
2015 2016 2017
Num
be
r o
f ch
ildre
n a
nd
fa
mily
so
cia
l w
ork
ers
FTE Headcount
5
Contact email: [email protected] Press office: 020 7783 8300 Public enquiries: 0370 000 2288
Figure 2: Percentage of children and family social workers by age
England, 2017
Source: Children and family social worker workforce collection 2016-17.
At 30 September 2017, 85% of children and family social workers were female, and 15% were male. This is the first time that this data item has been collected on a mandatory basis.
Figure 3: Percentage of children and family social workers by gender
England, 2017
Source: Children and family social worker workforce collection 2016-17.
Time in service at local authority
At 30 September 2017, 58% (FTE) of children and family social workers had been in service at their current
local authority for less than 5 years. Previously this data item has been collected at an aggregate level, for
the first time this year we are able to derive time in service directly from a social workers start date.
We are aware that in some local authorities the start date is recorded as of the current role, rather than the
date at which the worker begin working for the local authority. We will be working to improve the guidance
and data quality for this item in future years.
Figure 4: Percentage of children and family social workers by time in service at local authority (FTE)
England, 2017
Source: Children and family social worker workforce collection 2016-17.
Social worker role
At the 30 September 2017, 51% (FTE) of children and family social workers were reported as being in a
case holder role compared to 54% in the aggregate return last year.
16%
30%
24%
24%
6%
20 to 29 years old
30 to 39 years old
40 to 49 years old
50 to 59 years old
60 years old and over
85%
15%
Female
Male
34%
24%
18%
18%
5%
2%
0 to 2 years
2 to 5 years
5 to 10 years
10 to 20 years
20 to 30 years
30 years of more

6
Contact email: [email protected] Press office: 020 7783 8300 Public enquiries: 0370 000 2288
The proportion of workers in each role varies across local authorities. Some local authorities had difficulty
mapping the roles used locally to those identified in the data collection. In future years we aim to replace
this data item with one that more closely matches the role definitions used by local authorities.
Figure 5: Percentage of children and family social workers by role (FTE)
England, 2017
Source: Children and family social worker workforce collection 2016-17.
Ethnic Origin
The ethnicity of social workers was collected on a mandatory basis for the first time this year. Of child and
family social workers in post at 30 September 2017 66% (80% of those for whom ethnicity data were
available) were of a white ethnic origin. The next largest ethnic group were Black or Black British, which
made up 9% of the workforce (or 11% of those with data available).
For 18% of social workers, this data was not available, or had been refused to be disclosed.
Figure 6: Percentage of children and family social workers by group of ethnic origin (Headcount)
England, 2017
Source: Children and family social worker workforce collection 2016-17.
Qualification level
For the first time this year we have collected the qualification level for children and family social workers. Of
those in post at 30 September, 91% had the qualification level populated.
Of those 46% were recorded as having an undergraduate degree which qualified them to work as a social
worker, and 27% a postgraduate degree. Local authorities reported difficulty in providing this data item, with
many authorities recording all individuals against one category so results should be viewed with caution.
Number of cases and average caseload
The number of cases held by children and family social workers (including agency workers) at 30
September 2017 was 317,690, with 17,840 social workers and agency workers holding these cases.
2%
5%
13%
14%
15%
51%
Senior manager
Middle Manager
First Line Manager
Senior Practitioner
Qualified withoutcases
Case Holder

7
Contact email: [email protected] Press office: 020 7783 8300 Public enquiries: 0370 000 2288
This figure is significantly smaller than the number of children in need at 31 March. This could be due to a
number of factors including differing count dates, differing interpretations of the guidance around what
constitutes a case, or, as this is a new data item, data quality. As a result caution should be used
interpreting this figure.
The average caseload per children and family social worker was 17.8 cases (based on FTE counts).
Average caseload varied between local authorities, between 10.2 for Kingston upon Thames and
Richmond upon Thames, to 26.4 for Staffordshire. Some of this variation may be down to differing local
practices in case management, with some local authorities raising this as an issue during the collection.
The data items have been collected at an individual social worker level for the first time this year and allow
us to calculate a specific caseload measure but they are not comparable to data from previous years. Local
authorities have reported difficulties with linking the number of cases and the social worker holding those
cases so care should be taken interpreting the figures.
2. Agency workers (tables 1d, 2, 6)
Calculating the agency worker rate
𝑁𝑢𝑚𝑏𝑒𝑟 𝑜𝑓 𝑎𝑔𝑒𝑛𝑐𝑦 𝑠𝑡𝑎𝑓𝑓 𝑤𝑜𝑟𝑘𝑖𝑛𝑔 𝑎𝑠 𝑠𝑜𝑐𝑖𝑎𝑙 𝑤𝑜𝑟𝑘𝑒𝑟𝑠 𝑎𝑡 30 𝑆𝑒𝑝𝑡𝑒𝑚𝑏𝑒𝑟
(𝑁𝑢𝑚𝑏𝑒𝑟 𝑜𝑓 𝑎𝑔𝑒𝑛𝑐𝑦 𝑠𝑡𝑎𝑓𝑓 𝑤𝑜𝑟𝑘𝑖𝑛𝑔 𝑎𝑠 𝑠𝑜𝑐𝑖𝑎𝑙 𝑤𝑜𝑟𝑘𝑒𝑟𝑠 𝑎𝑡 30 𝑆𝑒𝑝𝑡𝑒𝑚𝑏𝑒𝑟
+𝑁𝑢𝑚𝑏𝑒𝑟 𝑜𝑓 𝑐ℎ𝑖𝑙𝑑𝑟𝑒𝑛 𝑎𝑛𝑑 𝑓𝑎𝑚𝑖𝑙𝑦 𝑠𝑜𝑐𝑖𝑎𝑙 𝑤𝑜𝑟𝑘𝑒𝑟𝑠
)
Agency workers are identified and recorded separately from children and family social workers employed
directly by the local authority within the data collection. The number of agency workers working as children
and family social workers at 30 September 2017 was 5,340 (FTE), this remains consistent with the number
reported at 30 September 2016, 5,330 (FTE).
The agency worker rate at 30 September 2017 was 16% (FTE), remaining stable from 30 September 2016
when it was also 16%.
At 30 September 2017, 4,000 (FTE) of the 5,340 (FTE) agency workers working as children and family
social workers at 30 September 2016 were covering vacancies – this equates to 75% (FTE) of all agency
workers covering vacancies. This data item is collected on an aggregate level and is mandatory within the
collection.
The percentage of agency workers covering vacancies varies between local authorities. Some local
authorities report that none of their agency workers are covering vacancies whilst for other authorities all of
their agency workers were covering vacancies.
Agency workers not covering vacancies could be used to manage seasonal peaks, or deal with acute
backlogs, as an alternative to employing permanent social workers. For this reason, high agency worker
rates do not necessarily imply recruitment and retention issues.
Figure 7: Number of agency workers (FTE) working as children and family social workers at 30 September
England, 2014-15 to 2016-17
Sources: Children and family social worker workforce collection 2014-15, to 2016-17.
3,850 3,870 4,000
1,0101,460 1,340
0
1,000
2,000
3,000
4,000
5,000
6,000
2015 2016 2017
Not covering vacancies
Covering vacancies

8
Contact email: [email protected] Press office: 020 7783 8300 Public enquiries: 0370 000 2288
3. Vacancies (table 1d, 2)
Calculating the vacancy rate
For the purpose of this collection vacancies are defined as any vacancy within a local authorities organisational structure (as FTEs), including vacancies that are not being actively recruited for, and those covered by agency workers.
𝑁𝑢𝑚𝑏𝑒𝑟 𝑜𝑓 𝑣𝑎𝑐𝑎𝑛𝑐𝑖𝑒𝑠 𝑎𝑡 30 𝑆𝑒𝑝𝑡𝑒𝑚𝑏𝑒𝑟
(𝑁𝑢𝑚𝑏𝑒𝑟 𝑜𝑓 𝑠𝑜𝑐𝑖𝑎𝑙 𝑤𝑜𝑟𝑘𝑒𝑟𝑠 𝑎𝑡 30 𝑆𝑒𝑝𝑡𝑒𝑚𝑏𝑒𝑟 + 𝑁𝑢𝑚𝑏𝑒𝑟 𝑜𝑓 𝑣𝑎𝑐𝑎𝑛𝑐𝑖𝑒𝑠 𝑎𝑡 30 𝑆𝑒𝑝𝑡𝑒𝑚𝑏𝑒𝑟)
The number of children and family social worker vacancies at 30 September 2017 was 5,820 (FTE), an increase of 5% from 5,540 (FTE) at 30 September 2016.
The vacancy rate at 30 September 2017 was 17% (FTE), remaining at 17% from 30 September 2016. There are large variations between the regions from 8% in Yorkshire & Humber to 27% (FTE) in Outer London and 24% (FTE) in Inner London.
Figure 8: Vacancy rate by local authority (FTE)
England, 2017
Sources: Children and family social worker workforce collection 2016-17.
4. Absence (table 1d, 2)
Calculating the absence rate
𝑁𝑢𝑚𝑏𝑒𝑟 𝑜𝑓 𝑑𝑎𝑦𝑠 𝑚𝑖𝑠𝑠𝑒𝑑 𝑑𝑢𝑒 𝑡𝑜 𝑠𝑖𝑐𝑘𝑛𝑒𝑠𝑠 𝑎𝑏𝑠𝑒𝑛𝑐𝑒 𝑑𝑢𝑟𝑖𝑛𝑔 𝑦𝑒𝑎𝑟
(𝑁𝑢𝑚𝑏𝑒𝑟 𝑜𝑓 𝑐ℎ𝑖𝑙𝑑𝑟𝑒𝑛 𝑎𝑛𝑑 𝑓𝑎𝑚𝑖𝑙𝑦 𝑠𝑜𝑐𝑖𝑎𝑙 𝑤𝑜𝑟𝑘𝑒𝑟𝑠 𝑎𝑡 30 𝑆𝑒𝑝𝑡𝑒𝑚𝑏𝑒𝑟 (𝐹𝑇𝐸) ∗ 253)
9
Contact email: [email protected] Press office: 020 7783 8300 Public enquiries: 0370 000 2288
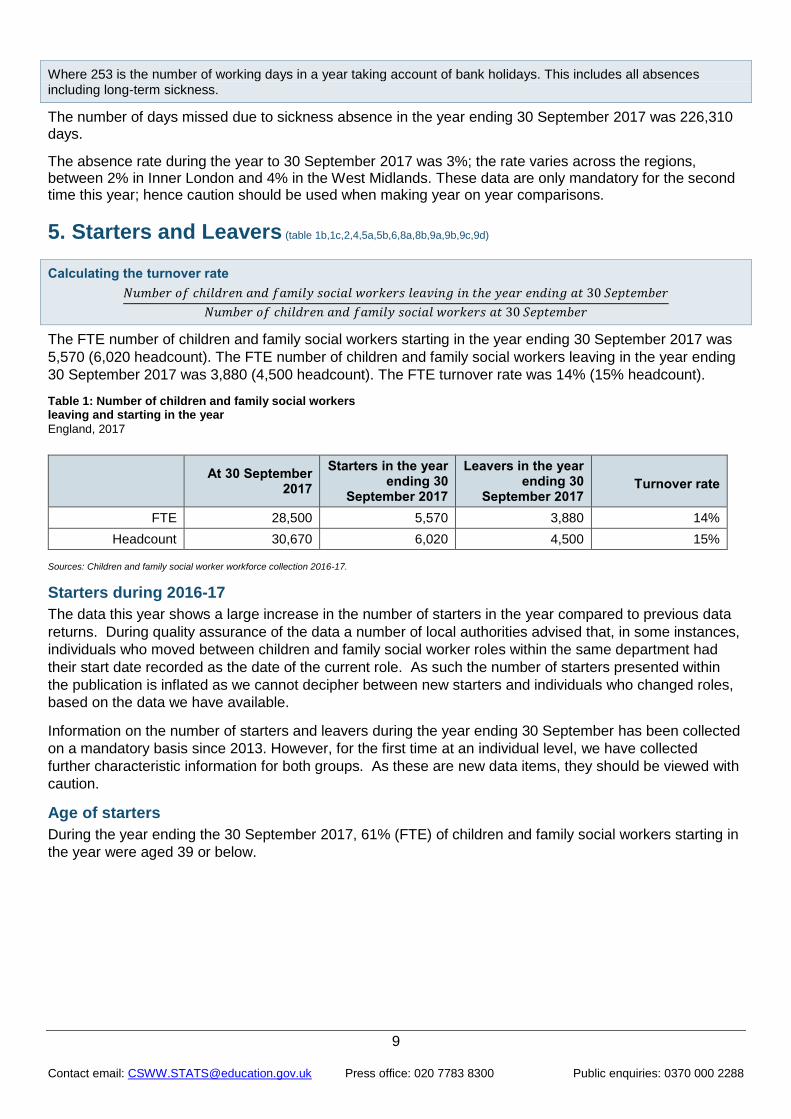
Where 253 is the number of working days in a year taking account of bank holidays. This includes all absences including long-term sickness.
The number of days missed due to sickness absence in the year ending 30 September 2017 was 226,310
days.
The absence rate during the year to 30 September 2017 was 3%; the rate varies across the regions, between 2% in Inner London and 4% in the West Midlands. These data are only mandatory for the second time this year; hence caution should be used when making year on year comparisons.
5. Starters and Leavers (table 1b,1c,2,4,5a,5b,6,8a,8b,9a,9b,9c,9d)
Calculating the turnover rate
𝑁𝑢𝑚𝑏𝑒𝑟 𝑜𝑓 𝑐ℎ𝑖𝑙𝑑𝑟𝑒𝑛 𝑎𝑛𝑑 𝑓𝑎𝑚𝑖𝑙𝑦 𝑠𝑜𝑐𝑖𝑎𝑙 𝑤𝑜𝑟𝑘𝑒𝑟𝑠 𝑙𝑒𝑎𝑣𝑖𝑛𝑔 𝑖𝑛 𝑡ℎ𝑒 𝑦𝑒𝑎𝑟 𝑒𝑛𝑑𝑖𝑛𝑔 𝑎𝑡 30 𝑆𝑒𝑝𝑡𝑒𝑚𝑏𝑒𝑟
𝑁𝑢𝑚𝑏𝑒𝑟 𝑜𝑓 𝑐ℎ𝑖𝑙𝑑𝑟𝑒𝑛 𝑎𝑛𝑑 𝑓𝑎𝑚𝑖𝑙𝑦 𝑠𝑜𝑐𝑖𝑎𝑙 𝑤𝑜𝑟𝑘𝑒𝑟𝑠 𝑎𝑡 30 𝑆𝑒𝑝𝑡𝑒𝑚𝑏𝑒𝑟
The FTE number of children and family social workers starting in the year ending 30 September 2017 was
5,570 (6,020 headcount). The FTE number of children and family social workers leaving in the year ending
30 September 2017 was 3,880 (4,500 headcount). The FTE turnover rate was 14% (15% headcount).
Table 1: Number of children and family social workers leaving and starting in the year
England, 2017
At 30 September 2017
Starters in the year ending 30
September 2017
Leavers in the year ending 30
September 2017
Turnover rate
FTE 28,500 5,570 3,880 14%
Headcount 30,670 6,020 4,500 15%
Sources: Children and family social worker workforce collection 2016-17.
Starters during 2016-17
The data this year shows a large increase in the number of starters in the year compared to previous data
returns. During quality assurance of the data a number of local authorities advised that, in some instances,
individuals who moved between children and family social worker roles within the same department had
their start date recorded as the date of the current role. As such the number of starters presented within
the publication is inflated as we cannot decipher between new starters and individuals who changed roles,
based on the data we have available.
Information on the number of starters and leavers during the year ending 30 September has been collected
on a mandatory basis since 2013. However, for the first time at an individual level, we have collected
further characteristic information for both groups. As these are new data items, they should be viewed with
caution.
Age of starters
During the year ending the 30 September 2017, 61% (FTE) of children and family social workers starting in
the year were aged 39 or below.

10
Contact email: [email protected] Press office: 020 7783 8300 Public enquiries: 0370 000 2288
Figure 9: Percentage of starters in the year by age (FTE)
England, 2017
Sources: Children and family social worker workforce collection 2016-17.
Age, and time in service of leavers
During the year ending the 30 September 2017, 56% (FTE) of children and family social workers leaving in
the year were aged between 30 and 49.
Figure 10: Percentage of leavers in the year by age (FTE)
England, 2017
Sources: Children and family social worker workforce collection 2016-17.
During the year ending the 30 September 2017, 63% (FTE) of children and family social workers leaving in
the year had been in service for less than 5 years, compared to 60% in 2016.
Figure 11: Percentage of leavers in the year by time in service at local authority (FTE)
England, 2017
Sources: Children and family social worker workforce collection 2016-17.
28%
33%
23%
14%
2%
20 to 29 years old
30 to 39 years old
40 to 49 years old
50 to 59 years old
60 years old and over
14%
33%
23%
20%
10%
20 to 29 years old
30 to 39 years old
40 to 49 years old
50 to old and above
60 years old and over
33%
30%
17%
14%
4%
2%
0%
5%
10%
15%
20%
25%
30%
35%
0 to 2 years 2 to 5 years 5 to 10 years 10 to 20 years 20 to 30 years 30 years or more
Pe
rce
nta
ge
of
lea
ve
rs b
y t
ime
in
se
rvic
e

11
Contact email: [email protected] Press office: 020 7783 8300 Public enquiries: 0370 000 2288
6. Information collected on a voluntary basis from individual level returns
Warning about response rates for voluntary variables
The following section covers the new voluntary data items from the individual return, the response rate varied for each data item. The figures should be considered in conjunction with their response rates. Particular care should be taken when looking at variables that had very low response rates.
The figures in this section are not provided in the accompanying tables and are not provided below national level due the response rates.
For the first time in 2016-17, individual social worker level data was collected on a mandatory basis. As part of the individual return, there were new voluntary data items collected which are summarised below:
Frontline graduate
o 48% populated in children and family social workers at 30 September
Qualifying institution
o 34% populated for children and family social workers at 30 September
Reason for leaving
o 84% for leavers within the year
Absent on 30 September
o 60% for children and family social workers at 30 September
o ‘Reason for absence at 30 September’ was populated for all records marked as absent on 30 September. However this remains unpublished due to the partial return of data on the ‘absent on 30 September’ item.
Length of current post/assignment (agency workers only)
o 48% populated for agency workers
The completion and data quality of these data items varies by local authority.
7. Accompanying tables
The following tables are available in excel format on the department’s statistics website for Children and family social work workforce.
National level
Table 1a National summary of key statistics of children and family social workers
Table 1b National summary of key statistics of children and family social workers starting in the year
Table 1c National summary of key statistics of children and family social workers leaving in the year
Table 1d National summary of key workforce statistics and rates for children and family social workers Regional and local authority level
Table 2 Key statistics of children and family social workers by region and local authority, based on full-time equivalents (FTEs)
Table 3a Number of children and family social workers by age, gender, region and local authority, based on full-time equivalents (FTEs)
Table 3b Number of children and family social workers by time in service at local authority, region and local authority, based on full-time equivalents (FTEs)
12
Contact email: [email protected] Press office: 020 7783 8300 Public enquiries: 0370 000 2288
Table 3c Number of children and family social workers by role, region and local authority, based on full-time equivalents (FTEs)
Table 3d Number of cases held by children and family social workers, agency social workers, all social workers combined, and average caseload, by local authority, based on full-time equivalents (FTEs)
Table 4 Number of children and family social workers starting in the year by age, gender, region and local authority based on full-time equivalents (FTEs)
Table 5a Number of children and family social workers leaving in the year by age, gender, region and local authority based on full-time equivalents (FTEs)
Table 5b Number of children and family social workers leaving in the year by time in service at local authority, region and local authority, based on full-time equivalents (FTEs)
Table 6 Key statistics of children and family social workers by region and local authority, based on headcount
Table 7a Number of children and family social workers by age, gender, region and local authority based on headcount
Table 7b Number of children and family social workers by time in service at local authority, region and local authority, based on headcount
Table 7c Number of children and family social workers by role, region and local authority based on headcount
Table 7d Number of children and family social workers by ethnicity, region and local authority, based on headcount
Table 8 Number of children and family social workers starting in the year by age, gender, region and local authority based on headcount
Table 9a Number of children and family social workers leaving in the year by age, gender, region and local authority based on headcount
Table 9b Number of children and family social workers leaving in the year by time in service at local authority, region and local authority, based on headcount
8. Further information is available
Previous releases: Children’s social care workforce.
Rest of the UK: Information on the children and family social work workforce of devolved
administrations can be found at the following links:
Scotland
Wales
Northern Ireland
Children in Need: Statistical First Release Characteristics of children in need
Children Looked After: Statistical First Release Children Looked After in England
9. Experimental Statistics
The Department has designated these as experimental statistics, which are defined as new official statistics
undergoing evaluation. They are published in order to involve users and stakeholders in their development
and as a means to build in quality at an early stage.
The Department has a set of statistical policies in line with the Code of Practice for Official Statistics.
10. Technical information
A technical document accompanies this SFR. This provides further information on the data sources, their
coverage and quality and explains the methodology used in producing the data, including how it is validated
and processed.

13
Contact email: [email protected] Press office: 020 7783 8300 Public enquiries: 0370 000 2288
11. Get in touch
Media enquiries
Press Office News Desk, Department for Education, Sanctuary Buildings, Great Smith Street, London
SW1P 3BT. Tel: 020 7783 8300
Other enquiries/feedback
Children and early years statistics team, Department for Education, 2 St Paul’s Place, Sheffield, S1 2FJ.

© Crown copyright 2018
This publication (not including logos) is licensed under the terms of the
Open Government Licence v3.0 except where otherwise stated. Where
we have identified any third party copyright information you will need to
obtain permission from the copyright holders concerned.
To view this licence:
visit www.nationalarchives.gov.uk/doc/open-government-licence/version/3
email [email protected]
write to Information Policy Team, The National Archives, Kew, London, TW9 4DU
About this publication:
Enquiries: Children and early years statistics team, Department for Education, 2 St Paul’s
Place, Sheffield, S1 2FJ. Email: [email protected]
Reference: SFR 09/2018
Follow us on Twitter: @educationgovuk
Like us on Facebook: facebook.com/educationgovuk
Related Documents