Earth and Planetary Science Letters 388 (2014) 273–282 Contents lists available at ScienceDirect Earth and Planetary Science Letters www.elsevier.com/locate/epsl Experimental quantification of permeability of partially molten mantle rock Kevin J. Miller a,∗ , Wen-lu Zhu a , Laurent G.J. Montési a , Glenn A. Gaetani b a Department of Geology, University of Maryland, 314 Regents Dr., College Park, MD 20742, USA b Department of Geology and Geophysics, Woods Hole Oceanographic Institution, MA 02543, USA article info abstract Article history: Received 20 May 2013 Received in revised form 23 November 2013 Accepted 1 December 2013 Available online xxxx Editor: Y. Ricard Keywords: mid-ocean ridge partial melt synchrotron X-ray microtomography permeability melt fraction upper mantle Melt percolation in mantle rocks is currently poorly constrained, especially at low melt fractions. At mid-ocean ridges, for example, geochemical and geophysical observations produce divergent estimates of how much melt is present in the mantle and how quickly it moves. Accurate estimates of permeability and grain-scale melt distribution in mantle rock are necessary to reconcile these observations. We present three-dimensional (3-D), 700 nm-resolution images of olivine–basalt aggregates, containing nominal melt fractions (φ n ) between 0.02 and 0.20. Samples were prepared from a powdered mixture of San Carlos olivine and high-alumina basalt and hot-pressed in a solid-medium piston–cylinder apparatus at 1350 ◦ C and 1.5 GPa. Images were obtained using synchrotron X-ray microtomography (SXμT) from the Advance Photon Source at Argonne National Laboratory. Stokes flow simulations, conducted using the digital melt volume as the numerical domain, determine that the permeabilities of experimental charges range from 2 × 10 −16 to 5 × 10 −13 m 2 for φ n = 0.02 to 0.20, respectively. The simulation results are well represented by the power-law relation between permeability (k) and melt fraction (φ), k = φ n d 2 /C , where n = 2.6 ± 0.2, and assuming a grain size of 35 μm in the experiments, C = 58 +36 −22 . These results place important new constraints on rates of melt migration and melt extraction within partially molten regions of the mantle. © 2013 Elsevier B.V. All rights reserved. 1. Introduction At mid-ocean ridges, the divergence of lithospheric plates causes an upwelling of hot mantle. The pressure relief during ascent carries peridotite across its solidus and induces partial melt- ing. The melt, which is less dense than the surrounding mantle, separates from the solid and percolates towards the surface via porous and possibly channelized flow (e.g. Kelemen et al., 1997). The melt extraction rate is governed by the permeability of the mantle, which is highly influenced by the amount of melt present as well as the topology and connectivity of the melt network. Despite its importance for understanding melt transport in the mantle, the permeability of partially molten mantle rock is poorly constrained. The aim of this study is to provide better permeability estimates through the quantification of grain-scale melt distribu- tion. At textural equilibrium, the relationship between permeability and the grain-scale melt distribution in a partially molten rock takes the form of a power law (Cheadle, 1989; Connolly et al., * Corresponding author. 2009; McKenzie, 1984; Ricard et al., 2001; von Bargen and Waff, 1986; Wark and Watson, 1998), k = φ n d 2 C (1) where d is grain size, n is the power law exponent, and C is a ge- ometric factor influenced by the dihedral angle. For an isotropic system with uniform grain size and shape, n = 2(McKenzie, 2000; von Bargen and Waff, 1986). For more complex systems, where the effects of crystal anisotropy and grain-scale heterogeneity are no longer negligible, higher vales of n should be used. For ex- ample, a value of n = 3 represents well porous flow through a non-uniform network of packed tetrakaidekahedral grains (Zhu and Hirth, 2003). These model results have been corroborated by per- meability experiments conducted on analogue systems composed of quartzite + H 2 O and calcite + H 2 O where grain size distribu- tion is non-uniform, grain shapes are anisotropic, and n ∼ 3(Wark and Watson, 1998). Mineralogy plays an important role, through its influence on surface free energy, in determining the minimum-energy configu- ration of the system. Therefore, experiments conducted on partial melts with chemistry similar to the mantle must be considered. 0012-821X/$ – see front matter © 2013 Elsevier B.V. All rights reserved. http://dx.doi.org/10.1016/j.epsl.2013.12.003

Welcome message from author
This document is posted to help you gain knowledge. Please leave a comment to let me know what you think about it! Share it to your friends and learn new things together.
Transcript

Earth and Planetary Science Letters 388 (2014) 273–282
Contents lists available at ScienceDirect
Earth and Planetary Science Letters
www.elsevier.com/locate/epsl
Experimental quantification of permeability of partially moltenmantle rock
Kevin J. Miller a,∗, Wen-lu Zhu a, Laurent G.J. Montési a, Glenn A. Gaetani b
a Department of Geology, University of Maryland, 314 Regents Dr., College Park, MD 20742, USAb Department of Geology and Geophysics, Woods Hole Oceanographic Institution, MA 02543, USA
a r t i c l e i n f o a b s t r a c t
Article history:Received 20 May 2013Received in revised form 23 November 2013Accepted 1 December 2013Available online xxxxEditor: Y. Ricard
Keywords:mid-ocean ridgepartial meltsynchrotron X-ray microtomographypermeabilitymelt fractionupper mantle
Melt percolation in mantle rocks is currently poorly constrained, especially at low melt fractions. Atmid-ocean ridges, for example, geochemical and geophysical observations produce divergent estimates ofhow much melt is present in the mantle and how quickly it moves. Accurate estimates of permeabilityand grain-scale melt distribution in mantle rock are necessary to reconcile these observations. We presentthree-dimensional (3-D), 700 nm-resolution images of olivine–basalt aggregates, containing nominal meltfractions (φn) between 0.02 and 0.20. Samples were prepared from a powdered mixture of San Carlosolivine and high-alumina basalt and hot-pressed in a solid-medium piston–cylinder apparatus at 1350 ◦Cand 1.5 GPa. Images were obtained using synchrotron X-ray microtomography (SXμT) from the AdvancePhoton Source at Argonne National Laboratory. Stokes flow simulations, conducted using the digital meltvolume as the numerical domain, determine that the permeabilities of experimental charges range from2 × 10−16 to 5 × 10⁻¹³ m2 for φn = 0.02 to 0.20, respectively. The simulation results are well representedby the power-law relation between permeability (k) and melt fraction (φ), k = φnd2/C , where n = 2.6 ±0.2, and assuming a grain size of 35 μm in the experiments, C = 58+36
−22. These results place importantnew constraints on rates of melt migration and melt extraction within partially molten regions of themantle.
© 2013 Elsevier B.V. All rights reserved.
1. Introduction
At mid-ocean ridges, the divergence of lithospheric platescauses an upwelling of hot mantle. The pressure relief duringascent carries peridotite across its solidus and induces partial melt-ing. The melt, which is less dense than the surrounding mantle,separates from the solid and percolates towards the surface viaporous and possibly channelized flow (e.g. Kelemen et al., 1997).The melt extraction rate is governed by the permeability of themantle, which is highly influenced by the amount of melt presentas well as the topology and connectivity of the melt network.Despite its importance for understanding melt transport in themantle, the permeability of partially molten mantle rock is poorlyconstrained. The aim of this study is to provide better permeabilityestimates through the quantification of grain-scale melt distribu-tion.
At textural equilibrium, the relationship between permeabilityand the grain-scale melt distribution in a partially molten rocktakes the form of a power law (Cheadle, 1989; Connolly et al.,
* Corresponding author.
0012-821X/$ – see front matter © 2013 Elsevier B.V. All rights reserved.http://dx.doi.org/10.1016/j.epsl.2013.12.003
2009; McKenzie, 1984; Ricard et al., 2001; von Bargen and Waff,1986; Wark and Watson, 1998),
k = φnd2
C(1)
where d is grain size, n is the power law exponent, and C is a ge-ometric factor influenced by the dihedral angle. For an isotropicsystem with uniform grain size and shape, n = 2 (McKenzie, 2000;von Bargen and Waff, 1986). For more complex systems, wherethe effects of crystal anisotropy and grain-scale heterogeneity areno longer negligible, higher vales of n should be used. For ex-ample, a value of n = 3 represents well porous flow through anon-uniform network of packed tetrakaidekahedral grains (Zhu andHirth, 2003). These model results have been corroborated by per-meability experiments conducted on analogue systems composedof quartzite + H2O and calcite + H2O where grain size distribu-tion is non-uniform, grain shapes are anisotropic, and n ∼ 3 (Warkand Watson, 1998).
Mineralogy plays an important role, through its influence onsurface free energy, in determining the minimum-energy configu-ration of the system. Therefore, experiments conducted on partialmelts with chemistry similar to the mantle must be considered.
274 K.J. Miller et al. / Earth and Planetary Science Letters 388 (2014) 273–282
Some permeability experiments (Connolly et al., 2009; Renneret al., 2003) have been conducted for olivine partial melts. Theyfind that the permeability of partially molten olivine basalt at highmelt fractions (φ > 0.02) is consistent with a power law wheren ∼ 3. However, permeametry of partially molten aggregates inthese experiments is technically challenging. Consequently, the re-sults of such studies are subject to considerable uncertainty.
Grain-scale melt distribution is typically studied by examin-ing backscattered electron images from two-dimensional (2-D)cross-sections of isostatically pressed samples (e.g. Cmíral et al.,1998; Faul and Fitz Gerald, 1999). By assuming a model aboutthe three-dimensional (3-D) connectivity of the melt network, itis possible to infer and estimate sample permeability using the2-D data. However, those estimates are innately ambiguous, sincepermeability is an intrinsic property of the 3-D microstructure(Zhu et al., 2011). Therefore, a fully 3-D approach must be em-ployed in order to accurately determine sample permeability. Twomethods may be employed for characterizing microstructures inthree dimensions: serial cross-sectioning (Garapic et al., 2013;Wark et al., 2003) and synchrotron X-ray microtomography (SXμT)(Watson and Roberts, 2011; Zhu et al., 2011). This study focuseson the latter.
Constraints on mantle permeability come from both geochem-ical and geophysical observations. Analyses of uranium-series iso-topes in mid-ocean ridge basalts (MORB) (Lundstrom et al., 1995;McKenzie, 2000, 1985; Sims et al., 2002; Stracke et al., 2006),have shown a measureable degree of secular disequilibrium be-tween 238U and its shorter-lived daughter nuclides 230Th and236Ra. Preservation of secular disequilibrium at the surface impliesa low melt fraction retained by the mantle, φ < 0.01, with a rela-tively fast upwelling velocity at ∼1 m yr−1 (Kelemen et al., 1997).By contrast, geophysical observations imply higher melt fraction.For example, seismic and magnetotelluric data (Evans et al., 1999;The MELT Seismic Team, 1998) from the East Pacific Rise 17◦S giveevidence that the melt fraction in the mantle is 0.01 to 0.02, im-plying that melt extraction is inefficient at lower melt fractions.In a more recent study, Key et al. (2013) reported a melt fractionclose to 0.10 under the East Pacific Rise 9◦N using magnetotelluricinversions. Accurate estimates of permeability of partially moltenrocks are needed to reconcile the apparent contradiction in meltfraction.
In this study, we utilize high-resolution SXμT to digitally cap-ture the 3-D melt distributions of olivine–basalt aggregates iso-statically pressed in a piston–cylinder apparatus at 1350 ◦C and1.5 GPa. Nominal melt fractions (φn) of samples ranged from 0.2to 0.20 (Zhu et al., 2011). To demonstrate textural equilibriumof these experimental charges, we also conducted time series ex-periments at nominal melt fraction of 0.05 (refer to the OnlineSupplement). For each sample, we selected several representa-tive subvolumes and characterized their permeability, grain sizedistribution, and melt interconnectivity. The permeability of eachsubvolume was calculated by numerically solving the Stokes fluidquestions for the velocity and pressure fields within the digitalmelt microstructure. Permeability was plotted as a function of themeasured melt fraction (φm) in the corresponding subvolume andan empirical relation between permeability and melt fraction wasobtained. Our results provide new experimental constraints on thepermeability and melt distribution of partially molten rocks.
2. Experimental methods
2.1. Sample preparation
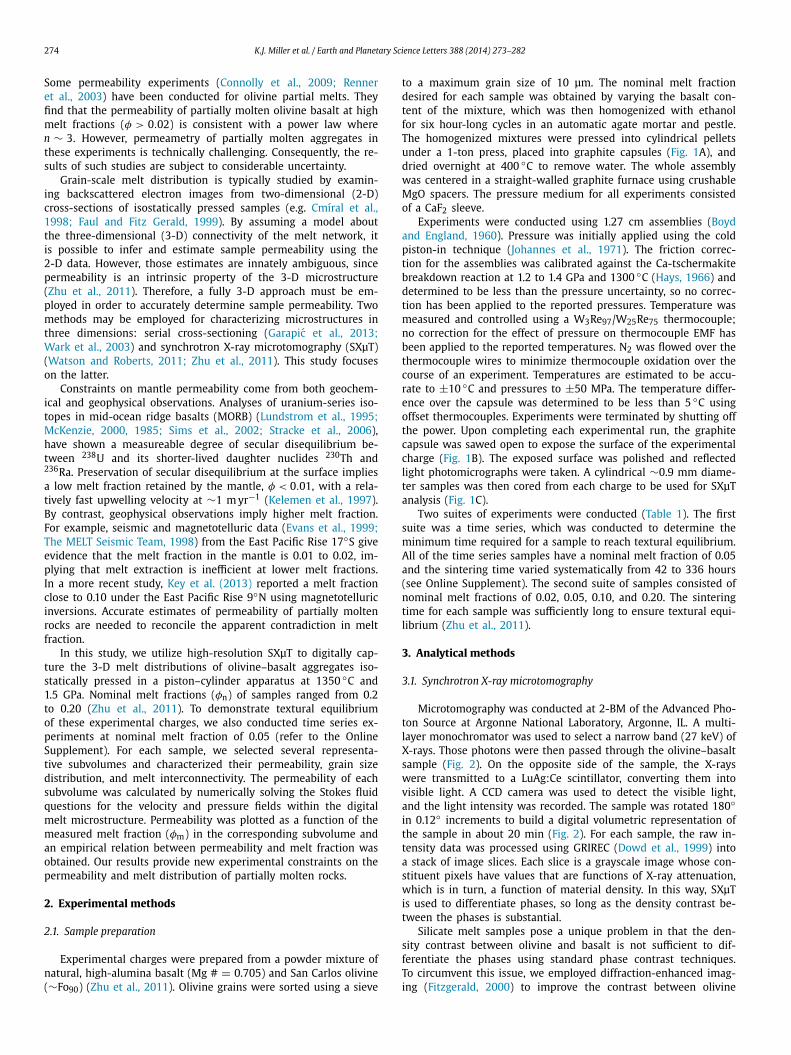
Experimental charges were prepared from a powder mixture ofnatural, high-alumina basalt (Mg # = 0.705) and San Carlos olivine(∼Fo90) (Zhu et al., 2011). Olivine grains were sorted using a sieve
to a maximum grain size of 10 μm. The nominal melt fractiondesired for each sample was obtained by varying the basalt con-tent of the mixture, which was then homogenized with ethanolfor six hour-long cycles in an automatic agate mortar and pestle.The homogenized mixtures were pressed into cylindrical pelletsunder a 1-ton press, placed into graphite capsules (Fig. 1A), anddried overnight at 400 ◦C to remove water. The whole assemblywas centered in a straight-walled graphite furnace using crushableMgO spacers. The pressure medium for all experiments consistedof a CaF2 sleeve.
Experiments were conducted using 1.27 cm assemblies (Boydand England, 1960). Pressure was initially applied using the coldpiston-in technique (Johannes et al., 1971). The friction correc-tion for the assemblies was calibrated against the Ca-tschermakitebreakdown reaction at 1.2 to 1.4 GPa and 1300 ◦C (Hays, 1966) anddetermined to be less than the pressure uncertainty, so no correc-tion has been applied to the reported pressures. Temperature wasmeasured and controlled using a W3Re97/W25Re75 thermocouple;no correction for the effect of pressure on thermocouple EMF hasbeen applied to the reported temperatures. N2 was flowed over thethermocouple wires to minimize thermocouple oxidation over thecourse of an experiment. Temperatures are estimated to be accu-rate to ±10 ◦C and pressures to ±50 MPa. The temperature differ-ence over the capsule was determined to be less than 5 ◦C usingoffset thermocouples. Experiments were terminated by shutting offthe power. Upon completing each experimental run, the graphitecapsule was sawed open to expose the surface of the experimentalcharge (Fig. 1B). The exposed surface was polished and reflectedlight photomicrographs were taken. A cylindrical ∼0.9 mm diame-ter samples was then cored from each charge to be used for SXμTanalysis (Fig. 1C).
Two suites of experiments were conducted (Table 1). The firstsuite was a time series, which was conducted to determine theminimum time required for a sample to reach textural equilibrium.All of the time series samples have a nominal melt fraction of 0.05and the sintering time varied systematically from 42 to 336 hours(see Online Supplement). The second suite of samples consisted ofnominal melt fractions of 0.02, 0.05, 0.10, and 0.20. The sinteringtime for each sample was sufficiently long to ensure textural equi-librium (Zhu et al., 2011).
3. Analytical methods
3.1. Synchrotron X-ray microtomography
Microtomography was conducted at 2-BM of the Advanced Pho-ton Source at Argonne National Laboratory, Argonne, IL. A multi-layer monochromator was used to select a narrow band (27 keV) ofX-rays. Those photons were then passed through the olivine–basaltsample (Fig. 2). On the opposite side of the sample, the X-rayswere transmitted to a LuAg:Ce scintillator, converting them intovisible light. A CCD camera was used to detect the visible light,and the light intensity was recorded. The sample was rotated 180◦in 0.12◦ increments to build a digital volumetric representation ofthe sample in about 20 min (Fig. 2). For each sample, the raw in-tensity data was processed using GRIREC (Dowd et al., 1999) intoa stack of image slices. Each slice is a grayscale image whose con-stituent pixels have values that are functions of X-ray attenuation,which is in turn, a function of material density. In this way, SXμTis used to differentiate phases, so long as the density contrast be-tween the phases is substantial.
Silicate melt samples pose a unique problem in that the den-sity contrast between olivine and basalt is not sufficient to dif-ferentiate the phases using standard phase contrast techniques.To circumvent this issue, we employed diffraction-enhanced imag-ing (Fitzgerald, 2000) to improve the contrast between olivine

K.J. Miller et al. / Earth and Planetary Science Letters 388 (2014) 273–282 275
Fig. 1. Schematic diagram of experimental setup before and after sintering. (A) Starting materials before sintering. The graphite capsule (gray), which is packed with thepowdered olivine/basalt mixture (pink), is placed in an alumina sleeve with a graphite wafer as a lid. (B) Sample assembly after sintering. One side of the sample assembly iscut and the surface of the sintered aggregate is polished. The hole in the sample assembly illustrates where the sample (C) is taken for X-ray imaging. Hash marks representthe polished surface. (For interpretation of the references to color in this figure legend, the reader is referred to the web version of this article.)
Table 1Summary of experiments.
Sample ID Nominal meltfraction, φn
Sintering time[h]
Measured meltfractiona, φm
Grain sizeb, d[μm]
Permeabilityc, k[m2]
scoba-5 0.20 265 0.18 ± 0.02 40(−17/+28) 2.3(−0.4/+0.4) × 10−13
scoba-6 0.10 240 0.079 ± 0.009 37(−14/+22) 1.9(−0.5/+0.6) × 10−14
scoba-9 0.02 336 0.015 ± 0.003 42(−20/+39) 4.1(−0.7/+0.8) × 10−16
scoba-12d 0.05 168 0.048 ± 0.004 32(−12/+18) 5.2(−1.1/+1.3) × 10−15
scoba-13d 0.05 42 N/A N/A N/Ascoba-14d 0.05 84 N/A N/A N/Ascoba-15d,e 0.05 336 0.0570 29.6 7.7 × 10⁻¹⁵
a φm are arithmetic average measured melt fractions and 1σ standard deviations computed over range of subvolumes per sample.b d are geometric average equivalent diameters with 1σ standard deviations computed for EDD of the aggregated subvolumes.c k are geometric average permeabilities with 1σ geometric standard deviations computed over range of subvolumes per sample.d Time series experiments: no physical properties calculated on samples that have not yet achieved textural equilibrium.e The values for scoba-15 were calculated from only one 350 × 350 × 350 μm3 subvolume.
Fig. 2. Schematic diagram of the imaging process. A monochromatic X-ray (green) istransmitted through the sample onto a scintillator (dashed-green), where it is con-verted to visible light (red), and recorded by a CCD camera. During a microtomog-raphy experiment, the sample is rotated 180◦ to create a series of cross-sectionaldata used to construct the 3-D digital image. (For interpretation of the references tocolor in this figure legend, the reader is referred to the web version of this article.)
and basalt (Zhu et al., 2011). Diffraction-enhanced imaging utilizesthe interference pattern, which occurs in the near-field Fresneldiffraction regime, to highlight the olivine–basalt interfaces andproduce high-resolution 3-D microstructure of olivine–basalt sys-tems.
3.2. Subvolume selection
In order to increase efficiency of computation, we selected onlya few cubic subvolumes per sample for analysis. The size of thosesubvolumes ranged from 140×140×140 μm3 (i.e. 100×100×100pixel3) to 350 × 350 × 350 μm3 (i.e. the 500 × 500 × 500 pixel3)(Fig. 3). We determined through a series of permeability analyseson progressively larger subvolumes that a 350 × 350 × 350 μm3
subvolume is sufficiently representative of the sample microstruc-ture. Refer to Online Supplement for details.
Fig. 3. Subvolumes sampling. (A) Tomography slice from the middle of scoba-12(φn = 0.05). Subvolumes of various sizes, shown as colored boxes, are defined from(B) the larger 3-D reconstructed image. The permeability of each subvolume wascalculated in order to quantify the variation in microstructure within each sampleand to determine the minimum size for a representative volume (see Fig. S3).
Several 350 × 350 × 350 μm3 subvolumes from each samplewere analyzed. Although each subvolume is susceptible to localheterogeneities in the melt microstructure, taken together, thesesubvolumes adequately represent the melt microstructure of theentire sample. Analyses of sample permeability, grain size, and in-terconnectivity were conducted using a combination of Avizo® andMatlab® software.

276 K.J. Miller et al. / Earth and Planetary Science Letters 388 (2014) 273–282
Fig. 4. Volume renderings of the melt distribution for olivine–basalt containingnominal melt fractions of (A) 0.02, (B) 0.05, (C) 0.10, and (D) 0.20. The dimen-sions of each subvolume are 140 × 140 × 140 μm3. Gray represents the melt phase,empty spaces are olivine grains, and red highlights the intersection of melt and thebounding box. (For interpretation of the references to color in this figure legend, thereader is referred to the web version of this article.)
3.3. Noise reduction and segmentation techniques
To reduce noise and suppress artifacts that remain from theimaging process, we employed a non-local means filter (Buadeset al., 2005) and an anisotropic diffusion filter (Weickert et al.,1998) (Fig. S1). Once we reduced the noise to an acceptablelevel, we implemented a series of algorithms to segment thegrayscale data. Segmentation is a procedure by which we trans-form grayscale data into a binary label file required for our quanti-tative analyses of the microstructure (Fig. S2). Two techniques wereused for segmenting the grayscale data: a marker-based watershedtransformation and a top-hat threshold.
The watershed transformation (Beucher, 1992) is based onthe idea of redefining grayscale pixel value as topographic relief.First, interphase boundaries are highlighted by thresholding thegrayscale gradient of the denoised image. Then a global thresh-old is employed to make an initial try at segmenting the denoiseddata. The image is then inundated starting from the initial seg-mentation. The regions defined by the thresholded gradient actas impermeable barriers to the rising virtual fluid, preventing themerging of distinctly different phases. The result, after the wa-tershed transformation, is a high-quality, segmented binary imagewhere phase boundaries are defined exactly at grayscale inflec-tions.
The watershed transform is suitable for accurately segmentinglarger features in the data; however, it tends to miss very thin meltconduits. To capture these finer details, a top-hat filter (Vincent,1993) is applied and then a global threshold is utilized to selectthose details. The kernel width is selected based on the size ofthose features. An opening filter is then applied to the inverse ofthe image in order to smooth out the boundaries of the image.Some user-controlled refinements of the binary image were typi-cally needed. The size of the features that top-hat segmenting isable to recognize is limited by the kernel size. Avizo limits thekernel width to twenty pixels, so a watershed transform is still
needed if there are features in the 2-D slice that are larger thanthe kernel size. Examples of the final 3-D binary images for fourcharges of different nominal melt fractions are show in Fig. 4.
3.4. Quantification of network topology
We performed a series of systematic analyses on subvolumes ofthe 3-D binary image of our olivine–basalt samples. We quantifythe melt fraction, grain size distribution, network interconnectivity,and permeability for each subvolume (Table S1).
The melt fraction (φm) of each subvolume is measured by cal-culating fraction of voxels, the three-dimensional image unit, as-signed to the melt phase in the segmented image. The measuredmelt fraction of a subvolume may vary from the nominal melt frac-tion (φn) because of sample heterogeneity and possible melt-rockinteractions. Uncertainty on the measured melt fraction was esti-mated by contracting (low bound) and dilating (upper bound) thebinary melt image by one pixel (Fusseis et al., 2012). For this rea-son, error bars are asymmetric.
Grain size distribution was quantified using Avizo’s Separate Ob-jects module. The module takes the binary label image as input andperforms a series of high-level algorithms, including a watershedtransform, distance transform, and logical operations, to separateindividual grains by a 1-pixel boundary. We report the grain sizedistribution for every subvolume as the distribution of equivalentdiameters. Separation of individual grains is difficult when meltfraction is low, since the only thing that separates grains are meltchannels. Therefore large uncertainties in the equivalent diameterdistributions are expected for the scoba-9 (φn = 0.02) sample.
Quantification of the melt network connectivity was accom-plished using Avizo’s skeletonization module. Skeletonization is theprocess by which the general melt microstructure is simplified toan interconnected skeleton network. The skeleton is used to assessthe topology of the melt network. First, a distance map is calcu-lated. Second, a thinning algorithm is applied to the binary imagethat removes pixel-by-pixel the outer layers of melt channels un-til only a string of pixels remain. The algorithm is calibrated so asto preserve small features of the melt microstructure. Finally, themean thicknesses of the melt conduits are retrieved from the dis-tance map. A Matlab® script, called ScobaCleaner.m, was written toautomatically remove spurious features from the skeletonized meltnetwork (see supplementary material and Zhu et al., 2011).
3.5. Quantification of permeability
Permeability calculations were performed using Avizo’s XLabHydro module. Two different computational modules were used:the Absolute Permeability Experiment Simulation (APES), whichcomputes a scalar estimate of the permeability, and the AbsolutePermeability Tensor Calculation (APTC), which computes the 3 × 3permeability tensor for the subvolume. Both APES and APTC im-plement the finite volume method (Harlow and Welch, 1965) tosolve the Stokes Equations for the velocity and pressure fields. TheStokes Equations are given by{∇ · u = 0
μ∇2u − ∇p = 0(2)
where p is the pressure [Pa], μ is the viscosity [Pa s] of the simu-lated fluid, and u is the velocity [m s−1].
For APES, flow in the digital melt domain is driven by a pres-sure differential (�P ) imposed across the subvolume (Fig. 5).A 1-pixel-wide impermeable layer is added to the sides of thesample domain parallel to the flow in order to prevent loss of fluidthrough the adjacent faces. Accommodation zones are added to theinflow and outflow faces of the subvolume to ensure that there is aself-consistent pressure field over the faces. The APES module then

K.J. Miller et al. / Earth and Planetary Science Letters 388 (2014) 273–282 277
Fig. 5. (A) Schematic diagram of a virtual permeability experiment conducted using APES module along the z-axis of a 140 × 140 × 140 μm3 subvolume from scoba-12(φn = 0.05). P is pressure, L is the length of the subvolume, light blue highlights the accommodation zones, and black denotes streamlines. Hash marks indicate impermeableboundaries. (B) The flow field of a virtual fluid is displayed as streamlines and color-coded according to the relative fluid velocity.
solves for the velocity field in the melt domain (Fig. 5). Each APESfluid flow simulation was conducted along the z-direction, parallelto the cylindrical sample axis. During post-processing, the volu-metric flux Q [m3 s−1] across the sample end faces is computed,and an application of Darcy’s Law yields the permeability k [m2]
k = −Qμ
�P
L
A(3)
where A is the cross-sectional area [m2] and L [m] is the lengthof the computational domain.
Contrary to the APES, APTC simulates fluid flow by solving amodified, non-dimentional, volume-averaged form of the StokesEquations (Gray, 1975){∇ · D = 0
∇2D − ∇d = I(4)
where D is a tensorial representation of the spatial deviation of thevelocity, d is a vectorial representation of the spatial deviation ofthe pressure, and I is the 3 × 3 identity matrix. Rather than invok-ing Darcy’s Law, the non-dimensional effective permeability tensorK is computed by volume-averaging D over the whole computa-tional domain V .
K = 1
V
∫V
D dV (5)
Equation systems (2) and (4) do not lend themselves immedi-ately to solving through implicit methods, since matrices of thisform are singular. Therefore, an artificial compressibility coefficient(Chorin, 1967) is incorporated in the discretized forms of Eq. (2)and (4).
Differing from the APES module, which imposes a pressure gra-dient to induce fluid flow, the APTC module supplies mass to thesystem via a volumetric source term in the discretized formula-tion of Eq. (4). Accommodation zones are defined on all six facesof the subvolume to impose periodic boundary conditions betweenparallel faces. One major drawback of the APTC module is compu-tational cost of the calculation. Moreover, significant permeabilityanisotropy is not expected in our isostatically pressed samples. TheAPES module, in contrast, is a relatively quick computation capa-ble of calculating the scalar permeability for a given subvolume,provided the permeability is not significantly anisotropic. For ourstudy, APES is the preferred module for calculating sample per-meability. APTC is only used to verify the absence of significantpermeability anisotropy.
4. Results
The analyses mentioned above were performed on all 350 ×350 × 350 μm3 subvolumes for nominal melt fractions rangingfrom 0.02 to 0.20. Refer to Table S1 of the online supplement for acomplete list of results. From now on, subvolumes will be referredto using the notation “scoba-a-b-c”, where the placeholders a, b,and c refer to the sample number, subvolume dimension in pixels,and the subvolume identification number, respectively (Table S1).
4.1. Grain size results
Results from our time series experiments (Online Supplement)indicate that the olivine–basalt samples with φn of 0.02, 0.05, 0.10,and 0.20 have equilibrium textures.
The olivine–basalt aggregates with φn from 0.05 to 0.2 exhibitlognormal Equivalent Diameter Distributions (EDD). However, thescoba-9 sample (φn = 0.02) has an EDD that differs significantlyfrom the others, which likely results from a failure of the SeparateObjects module to accurately segment individual grains at smallmelt fractions. For melt fractions as low as 0.02, many of the meltchannels are below the resolution of SXμT (Zhu et al., 2011). Whenthis is the case, two or more adjacent grains may be misrepre-sented as a single large grain. This may explain why the meanEDD reported for scoba-9 is much larger than the others, and itmay also explain why the EDD exhibits a long tail for equivalentdiameters larger than 80 μm. These larger grains cannot be rem-nants of the pre-sintered samples, since the maximum grain sizeof the pre-sintered experimental charge is 10 μm.
The mean equivalent diameters for scoba-9 (φn = 0.02), scoba-12 (φn = 0.05), scoba-6 (φn = 0.10), and scoba-5 (φn = 0.20)
are 42+38−20 μm, 34+18
−12 μm, 38+21−13 μm, and 41+24
−15 μm, respectively(Fig. 6). Errors are asymmetric because equivalent diameter distri-butions are characteristically lognormal.
4.2. Connectivity of melt network
Results from connectivity analyses are conveyed as Coordina-tion Number Distributions (CND) in Fig. 7. The skeletonizationanalysis replaces melt-filled triple junctions with tubules whosewidths vary along their axes. The intersections between melttubules are designated “nodes.” Connectivity is defined as thenumber of melt tubules connected to each node. The connectiv-ity of an ideal melt network is predicted to be 4 (von Bargen andWaff, 1986), but it varies in natural systems like our samples (Zhuet al., 2011). We determine the CND of one 350 × 350 × 350 μm3
subvolume from each sample.

278 K.J. Miller et al. / Earth and Planetary Science Letters 388 (2014) 273–282
Fig. 6. Equivalent diameter distributions from 350 × 350 × 350 μm3 subvolumes of (A) scoba-9-500-4, (φn = 0.02), (B) scoba-12-500-1 (φn = 0.05), (C) scoba-6-500-4(φn = 0.10), and (D) scoba-5-500-1 (φn = 0.20). The geometric mean, geometric standard deviation (σ ), and number of grains contained within each sample are reported.Histograms are calculated with 30 bins. Dashed lines represent the best-fit lognormal distributions to the equivalent diameter data.
Fig. 7. Coordination number distribution of melt fraction series experiments. Relative frequency of coordination numbers of 350 × 350 × 350 μm3 subvolumes of (A) scoba-9-500-4 (φn = 0.02), (B) scoba-12-500-1 (φn = 0.05), (C) scoba-6-500-4 (φn = 0.10), and (D) scoba-5-500-1 (φn = 0.20). Total counts of each coordination number arereported above each bar. The network skeleton of a representative 105 × 105 × 105 μm3 is included as an insert for each sample. The nodes in the skeleton are color-codedaccording to their coordination number, e.g. 1 – black, 3 – red, 4 – green, 5 – blue, 6 – magenta, and > 6 – yellow. The radius of the melt tubules in the skeleton visual-ized in the inserts are proportional to melt conduit thickness in the original, pre-skeletonized melt microstructure. (For interpretation of the references to color in this figurelegend, the reader is referred to the web version of this article.)
To describe the CND in a physical context, nodes with a coordi-nation number of 1 represent dead-end melt channels. Nodes witha coordination number of 2 are removed from the skeleton, sincetwo connected melt conduits effectively act as one single conduit.Nodes with a coordination number of 3 are mostly associated withregions where melt pooling or grain boundary wetting is occur-ring. A node with a coordination number of 4 indicates a four-grain
junction. Nodes with a coordination number of 5 or higher are ei-ther representative of physical junctions in which more than fourgrains are present, or artifacts from the ScobaCleaner.m algorithmwhen the connections from short tubules get merged (Table S2).
The CNDs of scoba-5 (φn = 0.20), scoba-6 (φn = 0.10), scoba-12(φn = 0.05), and scoba-9 (φn = 0.02) indicate that the frequency ofcoordination number 4 nodes decreases as melt fraction increases
K.J. Miller et al. / Earth and Planetary Science Letters 388 (2014) 273–282 279
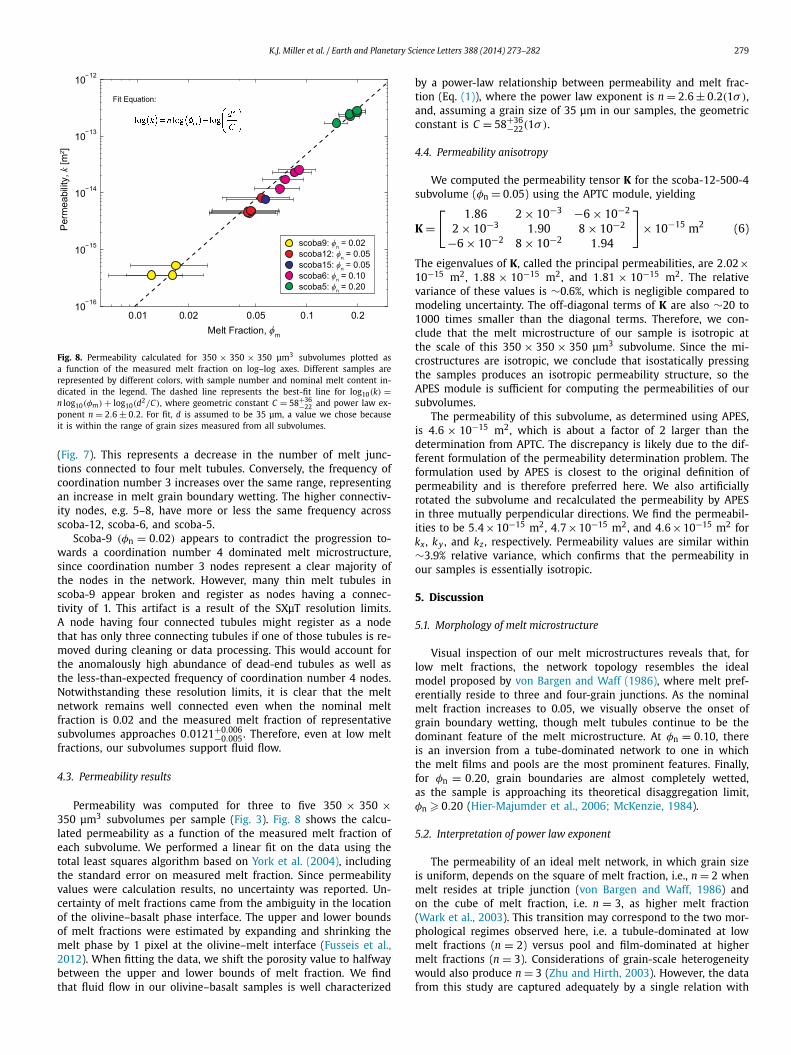
Fig. 8. Permeability calculated for 350 × 350 × 350 μm3 subvolumes plotted asa function of the measured melt fraction on log–log axes. Different samples arerepresented by different colors, with sample number and nominal melt content in-dicated in the legend. The dashed line represents the best-fit line for log10(k) =n log10(φm) + log10(d2/C), where geometric constant C = 58+36
−22 and power law ex-ponent n = 2.6 ± 0.2. For fit, d is assumed to be 35 μm, a value we chose becauseit is within the range of grain sizes measured from all subvolumes.
(Fig. 7). This represents a decrease in the number of melt junc-tions connected to four melt tubules. Conversely, the frequency ofcoordination number 3 increases over the same range, representingan increase in melt grain boundary wetting. The higher connectiv-ity nodes, e.g. 5–8, have more or less the same frequency acrossscoba-12, scoba-6, and scoba-5.
Scoba-9 (φn = 0.02) appears to contradict the progression to-wards a coordination number 4 dominated melt microstructure,since coordination number 3 nodes represent a clear majority ofthe nodes in the network. However, many thin melt tubules inscoba-9 appear broken and register as nodes having a connec-tivity of 1. This artifact is a result of the SXμT resolution limits.A node having four connected tubules might register as a nodethat has only three connecting tubules if one of those tubules is re-moved during cleaning or data processing. This would account forthe anomalously high abundance of dead-end tubules as well asthe less-than-expected frequency of coordination number 4 nodes.Notwithstanding these resolution limits, it is clear that the meltnetwork remains well connected even when the nominal meltfraction is 0.02 and the measured melt fraction of representativesubvolumes approaches 0.0121+0.006
−0.005. Therefore, even at low meltfractions, our subvolumes support fluid flow.
4.3. Permeability results
Permeability was computed for three to five 350 × 350 ×350 μm3 subvolumes per sample (Fig. 3). Fig. 8 shows the calcu-lated permeability as a function of the measured melt fraction ofeach subvolume. We performed a linear fit on the data using thetotal least squares algorithm based on York et al. (2004), includingthe standard error on measured melt fraction. Since permeabilityvalues were calculation results, no uncertainty was reported. Un-certainty of melt fractions came from the ambiguity in the locationof the olivine–basalt phase interface. The upper and lower boundsof melt fractions were estimated by expanding and shrinking themelt phase by 1 pixel at the olivine–melt interface (Fusseis et al.,2012). When fitting the data, we shift the porosity value to halfwaybetween the upper and lower bounds of melt fraction. We findthat fluid flow in our olivine–basalt samples is well characterized
by a power-law relationship between permeability and melt frac-tion (Eq. (1)), where the power law exponent is n = 2.6 ± 0.2(1σ),and, assuming a grain size of 35 μm in our samples, the geometricconstant is C = 58+36
−22(1σ).
4.4. Permeability anisotropy
We computed the permeability tensor K for the scoba-12-500-4subvolume (φn = 0.05) using the APTC module, yielding
K =[ 1.86 2 × 10⁻³ −6 × 10⁻²
2 × 10⁻³ 1.90 8 × 10⁻²
−6 × 10⁻² 8 × 10⁻² 1.94
]× 10−15 m2 (6)
The eigenvalues of K, called the principal permeabilities, are 2.02×10⁻¹⁵ m2, 1.88 × 10⁻¹⁵ m2, and 1.81 × 10⁻¹⁵ m2. The relativevariance of these values is ∼0.6%, which is negligible compared tomodeling uncertainty. The off-diagonal terms of K are also ∼20 to1000 times smaller than the diagonal terms. Therefore, we con-clude that the melt microstructure of our sample is isotropic atthe scale of this 350 × 350 × 350 μm3 subvolume. Since the mi-crostructures are isotropic, we conclude that isostatically pressingthe samples produces an isotropic permeability structure, so theAPES module is sufficient for computing the permeabilities of oursubvolumes.
The permeability of this subvolume, as determined using APES,is 4.6 × 10⁻¹⁵ m2, which is about a factor of 2 larger than thedetermination from APTC. The discrepancy is likely due to the dif-ferent formulation of the permeability determination problem. Theformulation used by APES is closest to the original definition ofpermeability and is therefore preferred here. We also artificiallyrotated the subvolume and recalculated the permeability by APESin three mutually perpendicular directions. We find the permeabil-ities to be 5.4 × 10⁻¹⁵ m2, 4.7 × 10⁻¹⁵ m2, and 4.6 × 10⁻¹⁵ m2 forkx , ky , and kz , respectively. Permeability values are similar within∼3.9% relative variance, which confirms that the permeability inour samples is essentially isotropic.
5. Discussion
5.1. Morphology of melt microstructure
Visual inspection of our melt microstructures reveals that, forlow melt fractions, the network topology resembles the idealmodel proposed by von Bargen and Waff (1986), where melt pref-erentially reside to three and four-grain junctions. As the nominalmelt fraction increases to 0.05, we visually observe the onset ofgrain boundary wetting, though melt tubules continue to be thedominant feature of the melt microstructure. At φn = 0.10, thereis an inversion from a tube-dominated network to one in whichthe melt films and pools are the most prominent features. Finally,for φn = 0.20, grain boundaries are almost completely wetted,as the sample is approaching its theoretical disaggregation limit,φn � 0.20 (Hier-Majumder et al., 2006; McKenzie, 1984).
5.2. Interpretation of power law exponent
The permeability of an ideal melt network, in which grain sizeis uniform, depends on the square of melt fraction, i.e., n = 2 whenmelt resides at triple junction (von Bargen and Waff, 1986) andon the cube of melt fraction, i.e. n = 3, as higher melt fraction(Wark et al., 2003). This transition may correspond to the two mor-phological regimes observed here, i.e. a tubule-dominated at lowmelt fractions (n = 2) versus pool and film-dominated at highermelt fractions (n = 3). Considerations of grain-scale heterogeneitywould also produce n = 3 (Zhu and Hirth, 2003). However, the datafrom this study are captured adequately by a single relation with

280 K.J. Miller et al. / Earth and Planetary Science Letters 388 (2014) 273–282
n = 2.6 ± 0.2 and C = 58+36−22. More complex relations are not jus-
tified by the data, considering the uncertainty of our porosity andpermeability estimates.
The experimental results of Renner et al. (2003) and Connollyet al. (2009) are compatible with n = 3, which, considering thatthese experiments infer permeability indirectly from the com-paction rate of olivine–basalts aggregate, present an encouragingagreement with our study. Therefore, microstructure readjustmentduring quenching appears to be minor in our experiments and ourpermeability–porosity relation can probably be used to describeolivine–basalt aggregates at mantle conditions. For extrapolationto higher temperatures and pressures, we may need to consider anincreased importance of melt film grain faces, as the dihedral angleappears to decrease as temperature and pressure increase (Yoshinoet al., 2009). However, melt films observed at high melt fractionin our sample do not have a marked effect on our permeability–porosity relation. Future work would need to address their con-tribution to permeability at low melt fraction, high pressure, andhigh temperature.
Given the various melt geometries present in our datasets, avalue of n = 2.6, between 2 and 3, is not surprising. Consider amixture of subvolumes consisting of end member melt distribu-tions, one end member is entirely made up of melt tubules alongtriple junctions (n = 2) while the other contains only wet grainboundaries and melt pools (n = 3). The overall permeability of thesystem is the mixing of the individual subvolume permeabilitiesand, in the absence of a large-scale order between these subvol-umes, will converge to the geometric mean permeability as thenumber of subvolumes increases (Madden, 1976). If the perme-ability of each subvolume V i is given by the empirical relationki = Ciφ
ni , the geometric mixing leads to an equation for the totalpermeability kT
kT = (C1 · · · CN)1N φ
n1+···+nNN (7)
where N is the total number of subvolumes. Eq. (7) is, in its ownright, a power law, the same as Eq. (1). In our case, the end mem-ber distributions have n = 2 and n = 3, so Eq. (7) leads to a newpower law exponent of 2.5, which is consistent with the value ofn = 2.6±0.2 obtained by our fit. A value of n between 2 and 3 canbe thought of as representing a mixing of melt geometries.
5.3. 1-D mantle model
Given the new empirical relation between permeability andthe melt fraction, we make a simple model of melt transport inthe mantle. If 230Th disequilibrium observed is produced at 60 to75 km depths, melt transport must have occurred at a velocity wof order of 1 m yr−1 (3 × 10⁻⁸ m s−1). Darcy’s law implies
φw = k0
μφn�ρg (8)
where k0 = d2/C is the permeability coefficient, φ is the poros-ity, �ρ is the density contrast between melt and solid mantle,μ = 10 Pa s is the melt viscosity (Ryan and Blevins, 1987) andg ∼ 10 m s−1 is the acceleration of gravity.
Assuming a grain size of 3 mm (Toramaru and Fujii, 1986),we estimate k0 ∼ 1.55 × 10⁻⁷ m2. If ρs = 3300 kg m−3, ρf =2700 kg m−3 (Stolper et al., 1981), �ρ = 600 kg m−3. From Eq. (8),the porosity needed to sustain a melt velocity w is given by
φ = (w/β)1
n−1 (9)
where β = k0�ρg/μ = 9.3 × 10⁻⁵ m s−1. Therefore, preserving230Th disequilibrium produced at depth requires a porosity of atleast 0.0068. This number is comparable with estimates from seis-mic studies (The MELT Seismic Team, 1998), although at the low
end of the observational constraints. Higher porosity results infaster melt velocity, which is more easily reconciled with 230Thexcess in mid-ocean ridge basalts.
An alternative estimate of mantle porosity can be obtained froma mass balance between melt produced by decompression of amantle column at velocity W (Ribe, 1985; Spiegelman and Elliott,1993):
ρfφw = ρs F W (10)
where F is degree of melting, which increases with height abovethe level where melt starts. By combining Eqs. (8) and (10), themean melt fraction retained by our model mantle is estimated at.
φ =(
ρs
ρf
F W
β
) 1n
(11)
Remarkably, the permeability in this model does not depend onporosity but only on geodynamical parameters
k = ρs
ρf
μF W
�ρg(12)
Assuming F = 0.20 at the top of the melting column (Asimowet al., 1995) W = 5 cm yr−1 (1.7 × 10⁻⁹ m s−1) (Spiegelman andElliott, 1993), we obtain a melt fraction φ = 0.0085, and accordingto Eq. (8), a melt velocity of 5.0 × 10⁻⁸ m s−1 (∼1.6 m yr−1).
If this velocity is valid for the entire melting column, the transittime through the melting column zM would be
tU = zM
w=
(ρs
ρfF M W
) 1−nn
β−1/nzM (13)
where F M is the degree of melting in the column. However, thedegree of melting increases upward in the column. Assuming a lin-ear increase of F from 0 to F M through a column of height zM , weobtain
tT = ntU (14)
For F M = 0.2 and zM = 75 km, tT ∼ 136 kyrs. This value is inthe high end of what is permissible to preserve 230Th excesses,especially considering that chromatographic effect will reduce thevelocity of isotopes (Spiegelman and Elliott, 1993). However, thetransit time depends on grain size to the power −2/n through theβ coefficient. Increasing the grain size to 1 cm reduces the melttransit time to 54 kyrs, although a melt fraction of 0.0034 whichis harder to reconcile with geophysical estimates of melt contentunderneath mid-ocean ridges.
A larger melt fraction would be compatible with 230Th con-straints but could not be sustained by melting of an upwellingmantle column. However, these calculations assume a very sim-ple system, i.e. 1-D melt percolation through a uniform network insteady state. They do not give any consideration heterogeneities inthe melt distribution larger than the grain-scale. It may be pos-sible to reconcile uranium-series disequilibrium and geophysicalobservations if the mantle is heterogeneous, with high porositychannels.
5.4. Implications for mantle heterogeneities
High melt fraction dunite conduits have been observed in ophi-olites and appear necessary to explain chemical disequilibriumbetween mid-ocean ridge basalts and the mantle residuum (Dick,1977; Johnson and Dick, 1992; Kelemen et al., 1992; Quick, 1982;Spiegelman and Kelemen, 2003). Dunite conduits form as a buoy-ant melt, which is saturated in olivine but under-saturated in or-thopyroxene (Ortoleva et al., 1987), reacts with pyroxene-bearing

K.J. Miller et al. / Earth and Planetary Science Letters 388 (2014) 273–282 281
peridotite, simultaneously dissolving the orthopyroxene and pre-cipitating olivine (Kelemen et al., 1997, 1995a, 1995b). The disso-lution of pyroxene is an incongruent melting reaction, i.e. moremelt is produced by volume than is removed from the system bythe precipitation of olivine (Kelemen et al., 1995b), and increasesboth melt fraction and permeability. Naturally, the rate of dissolu-tion is enhanced in regions where permeability is increased, which,in turn continues to enhance permeability. Thus, a positive feed-back, known as the reactive infiltration instability (RII), is estab-lished between the opx dissolution and permeability enhancement.Numerical models (Aharonov et al., 1995; Kelemen et al., 1997;Spiegelman et al., 2001; Spiegelman and Kelemen, 2003) haveshown that the RII is capable of producing banded dunite struc-tures similar to those found in nature.
Our results have direct implications for melt transport withinthese conduits. At the grain-scale, permeability is largely controlledby the local melt distribution, which is determined by local varia-tions in the free surface energy of the system. Free surface energyis an intrinsic property of the system composition, i.e. the mineralphases present and the composition of the melt. Since the com-positions of our samples are similar to those of partially moltendunite, it stands to reason that melt transport within these duniteconduits adheres to the power-law relationship between perme-ability and melt fraction that we constrain here. Due to the RII,the melt fraction within dunite conduits is four times the over-all mantle melt content (Spiegelman et al., 2001). Therefore, thepermeability of these conduits is about 37 times larger than for ahomogeneous mantle. Neglecting melt production by RII, the chan-nels would occupy 25% of the mantle, so that channelization wouldincrease the velocity by approximately a factor of 10, making iteasier to preserve 230Th disequilibrium while verifying the massbalance considerations described in the previous section.
The permeability of dunite conduits may further increase ifthe difference in surface energy between olivine and opx is suffi-cient to preferentially partition melt to olivine-rich areas (Watson,1999), increasing melt content in dunite conduit beyond the prod-uct of incongruent melting. Lithological melt partitioning has beenproposed to occur in mantle systems where olivine and opx arepresent. However, experimental evidence for melt partitioning insystems with mineralogies similar to the mantle is lacking. Al-though more research is needed to establish the extent to whichthe RII and lithological partitioning modify the permeability struc-ture of the mantle, dunite conduits are good candidates for en-hancing overall melt transport within the partially molten regionof the mantle beneath mid-ocean ridges.
6. Conclusion
This study is the first to use a 3-D imaging technique on syn-thetic partially molten peridotites to estimate sample permeability.Visual inspection of the digital microstructures shows that for meltfractions as low as 0.02, interconnected melt channels residingalong grain edges are the dominant features of the melt network.For melt fractions greater than 0.05, considerable melt pooling andgrain boundary wetting are observed in addition to melt channels.Measured connectivity distributions confirm the increased contri-bution of grain boundary wetting as melt content increases.
The permeability of our samples was computed numericallyfor sufficiently large representative subvolumes and ranged from4 × 10−16 to 2 × 10⁻¹³ m2 for melt fractions ranging from 0.02to 0.20. The relationship between permeability and local melt frac-tion is adequately represented by a power law k = d2φn/C , with dthe grain size (approximately 35 μm in our samples), the exponentn = 2.6 ± 0.2, and the geometric constant C = 58+36
−22. A first-ordercalculation, based on mass balance in a 1-D melting column, showthat our empirical relation implies a melt fractions of order 1% un-
der mid-ocean ridges with upwelling velocities of order 1 m yr−1,leading to transit times through the melting column that are con-sistent with those constrained by uranium-series analyses. Com-bined with numerical computation, SXμT has proven to be a usefultool for characterizing the microstructure of partially molten peri-dotites and computing their material properties. The results of thisstudy place important new constraints on melt transport beneathmid-ocean ridges, where partial melting occurs.
Acknowledgements
We thank the beamline scientists who work at 2-BM of theAdvanced Photon Source Xianghui Xiao and Francesco De Carlofor their assistance in conducting the tomography experiments.We thank the personnel at the Visual Software Group, specifi-cally Jean-Luc Garnier, for their technical assistance. We also thankSaswata Heir-Majumder, Harrison Lisabeth, Audrey Ougier-Simonin,and Véronique Le Roux for their insightful discussions. This pa-per was improved by the thorough and constructive commentsand suggestions from editor Yanick Ricard and reviewers TakashiYoshino, Jörg Renner, and Marc Spiegelman. Marc Spiegelman sug-gested the analysis of Section 5.2. This work is supported by theNational Science Foundation under the grants NSF-EAR1250338,NSF-EAR 0753505, and NSF-OCE 1060878.
Appendix A. Supplementary material
Supplementary material related to this article can be found on-line at http://dx.doi.org/10.1016/j.epsl.2013.12.003.
References
Aharonov, E., Whitehead, J.A., Kelemen, P.B., Spiegelman, M., 1995. Channeling in-stability of upwelling melt in the mantle. J. Geophys. Res. 100, 20433–20450.http://dx.doi.org/10.1029/95JB01307.
Asimow, P., Hirschmann, M., Ghiorso, M., O’Hara, M., Stolper, E., 1995. The ef-fect of pressure-induced solid–solid phase transitions on decompression melt-ing of the mantle. Geochim. Cosmochim. Acta 59, 4489–4506. http://dx.doi.org/10.1016/0016-7037(95)00252-U.
Beucher, S., 1992. The watershed transformation applied to image segmentation.Scanning Microsc. 6, 299–314.
Boyd, F.R., England, J.L., 1960. Apparatus for phase-equilibrium measurements atpressures up to 50 kilobars and temperatures up to 1750 ◦C. J. Geophys. Res. 65,741–748. http://dx.doi.org/10.1029/JZ065i002p00741.
Buades, A., Coll, B., Morel, J., 2005. A non-local algorithm for image denois-ing. Proc. IEEE Comput. Soc. Conf. Comput. Vis. Pattern Recognit. 2, 60–65.http://dx.doi.org/10.1109/CVPR.2005.38.
Cheadle, M.J., 1989. Properties of texturally equilibrated two-phase aggregates. PhDThesis. University of Cambridge.
Chorin, A.J., 1967. A numerical method for solving incompressible vis-cous flow problems. J. Comput. Phys. 2, 12–26. http://dx.doi.org/10.1016/0021-9991(67)90037-X.
Cmíral, M., Fitz, J.D., Faul, U.H., Green, D.H., 1998. A close look at dihedral anglesand melt geometry in olivine–basalt aggregates: a TEM study. Contrib. Mineral.Petrol. 130, 336–345.
Connolly, J.A.D., Schmidt, M.W., Solferino, G., Bagdassarov, N., 2009. Permeabilityof asthenospheric mantle and melt extraction rates at mid-ocean ridges. Na-ture 462, 209–212. http://dx.doi.org/10.1038/nature08517.
Dick, H.J.B., 1977. Evidence of partial melting in the Josephine peridotite. In: Dick,H.J.B. (Ed.), Magma Genesis. Department of Geology and Mineral Industries Bul-letin 96, Portland, OR, pp. 63–78.
Dowd, B.A., Campbell, G.H., Siddons, D.P., Marr, R.B., Nagarkar, V.V., Tipnis,S.V., Axe, L., 1999. Developments in synchrotron X-ray computed microto-mography at the National Synchrotron Light Source. Proc. SPIE, 224–236.http://dx.doi.org/10.1117/12.363725.
Evans, R., Tarits, P., Chave, A., White, A., Heinson, G., Filloux, J., Toh, H., Seama,N., Utada, H., Booker, J., Unsworth, M., 1999. Asymmetric electrical structurein the mantle beneath the east pacific rise at 17◦S. Science 286, 752–756.http://dx.doi.org/10.1126/science.286.5440.752.
Faul, U., Fitz Gerald, J., 1999. Grain misorientations in partially molten olivine aggre-gates: an electron backscatter diffraction study. Phys. Chem. Miner. 26, 187–197.http://dx.doi.org/10.1007/s002690050176/.
Fitzgerald, R., 2000. Phase-sensitive X-ray imaging. Phys. Today 53, 23–26. http://dx.doi.org/10.1063/1.1292471.

282 K.J. Miller et al. / Earth and Planetary Science Letters 388 (2014) 273–282
Fusseis, F., Schrank, C., Liu, J., Karrech, Llana-Fúnez, S., Xiao, X., Regenauer-Lieb, K.,2012. Pore formation during dehydration of a polycrystalline gypsum sampleobserved and quantified in a time-series synchrotron X-ray micro-tomographyexperiment. Solid Earth 3, 71–86. http://dx.doi.org/10.1016/j.epsl.2013.03.052.
Garapic, G., Faul, U.H., Brisson, E., 2013. High-resolution imaging of the meltdistribution in partially molten upper mantle rocks: evidence for wettedtwo-grain boundaries. Geochem. Geophys. Geosyst. 14, 1–11. http://dx.doi.org/10.1002/ggge.20066.
Gray, W.G., 1975. A derivation of the equations for multi-phase transport. Chem.Eng. Sci. 30, 229–233. http://dx.doi.org/10.1016/0009-2509(75)80010-8.
Harlow, F.H., Welch, J.E., 1965. Numerical calculation of time-dependent viscousincompressible flow of fluid with free surface. Phys. Fluids 8, 2182–2189.http://dx.doi.org/10.1063/1.1761178.
Hays, J.F., 1966. Lime-alumina-silica. Carnegie Inst. Washingt. Yearbook 65, 234–239.Hier-Majumder, S., Ricard, Y., Bercovici, D., 2006. Role of grain boundaries in magma
migration and storage. Earth Planet. Sci. Lett. 248, 735–749. http://dx.doi.org/10.1016/j.epsl.2006.06.015.
Johannes, W., Bell, P., Mao, H., Boettcher, A., Chopman, D., Hays, J., Newton, R.,Seifert, F., 1971. An interlaboratory comparison of piston–cylinder pressure cali-bration using the albite-breakdown reaction. Contrib. Mineral. Petrol. 32, 24–38.http://dx.doi.org/10.1007/BF00372231.
Johnson, K., Dick, H.J.B., 1992. Open system melting and temporal and spatial varia-tion of peridotite and basalt at the Atlantis II fracture zone. J. Geophys. Res. 97,9219–9241. http://dx.doi.org/10.1029/94JB02544.
Kelemen, P.B., Dick, H.J.B., Quick, J.E., 1992. Formation of harzburgite by pervasivemelt/rock reaction in the upper mantle. Nature 358, 635–641. http://dx.doi.org/10.1038/358635a0.
Kelemen, P.B., Shimizu, N., Salters, V.J.M., 1995a. Extraction of mid-ocean-ridgebasalt from the upwelling mantle by focused flow of melt in dunite channels.Nature 375, 747–753. http://dx.doi.org/10.1038/375747a0.
Kelemen, P.B., Whitehead, J.A., Aharonov, E., Jordahl, K.A., 1995b. Experiments onflow focusing in soluble porous media, with applications to melt extraction fromthe mantle. J. Geophys. Res. 100, 475–496. http://dx.doi.org/10.1029/94JB02544.
Kelemen, P.B., Hirth, G., Shimizu, N., Spiegelman, M., Dick, H.J., 1997. A review ofmelt migration processes in the adiabatically upwelling mantle beneath oceanicspreading ridges. Philos. Trans. R. Soc., Math. Phys. Eng. Sci. 355, 283–318.http://dx.doi.org/10.1098/rsta.1997.0010.
Key, K., Constable, S., Liu, L., Pommier, A., 2013. Electrical image of passive man-tle upwelling beneath the northern East Pacific Rise. Nature 495, 499–502.http://dx.doi.org/10.1038/nature11932.
Lundstrom, C.C., Gill, J., Williams, Q., Perfit, M.R., 1995. Mantle melting andbasalt extraction by equilibrium porous flow. Science 270, 1958–1961.http://dx.doi.org/10.1126/science.270.5244.1958.
Madden, T., 1976. Random networks and mixing laws. Geophysics 41, 1104–1125.http://dx.doi.org/10.1190/1.2035907.
McKenzie, D., 1984. The generation and compaction of partially molten rock. J.Petrol. 25, 713–765. http://dx.doi.org/10.1093/petrology/25.3.713.
McKenzie, D., 1985. 230Th–238U disequilibrium and the melting process beneathridge axes. Earth Planet. Sci. Lett. 72, 149–157. http://dx.doi.org/10.1016/0012-821X(85)90001-9.
McKenzie, D., 2000. Constraints on melt generation and transport from U-series activity ratios. Chem. Geol. 162, 81–94. http://dx.doi.org/10.1016/S0009-2541(99)00126-6.
Ortoleva, P., Chadam, J., Merino, E., Sen, A., 1987. Geochemical self-organization II:the reactive-infiltration instability. Am. J. Sci. 287, 1008–1040. http://dx.doi.org/10.2475/ajs.287.10.1008.
Quick, J.E., 1982. The origin and significance of large, tabular dunite bodies in theTrinity Peridotite, Northern California. Contrib. Mineral. Petrol. 78, 413–422.http://dx.doi.org/10.1007/BF00375203.
Renner, J., Viskupic, K., Hirth, G., Evans, B., 2003. Melt extraction from par-tially molten peridotites. Geochem. Geophys. Geosyst. 4, 8606. http://dx.doi.org/10.1029/2002GC000369.
Ribe, N., 1985. The generation and composition of partial melts in theEarth’s mantle. Earth Planet. Sci. Lett. 73, 361–376. http://dx.doi.org/10.1016/0012-821X(85)90084-6.
Ricard, Y., Bercovici, D., Schubert, G., 2001. A two-phase model for compactionand damage: 2. Applications to compaction, deformation, and the role of in-
terfacial surface tension. J. Geophys. Res. 106, 8907–8924. http://dx.doi.org/10.1029/2000JB900431.
Ryan, M.P., Blevins, J.Y.K., 1987. The viscosity of synthetic and natural silicate meltsand glasses at high temperatures and 1 bar (105 Pascals) pressure and athigher pressures. U.S. Geol. Surv., vol. 1764. US Government Printing Office.http://dx.doi.org/10.1029/88EO01059.
Sims, K.W.W., Goldstein, S.J., Blichert-toft, J., Perfit, M.R., Kelemen, P., Fornari, D.J.,Michael, P., Murrell, M.T., Hart, S.R., DePalo, D.J., Layne, G., Ball, L., Jull, M.,Bender, J., 2002. Chemical and isotopic constraints on the generation and trans-port of magma beneath the East Pacific Rise. Geochim. Cosmochim. Acta 66,3481–3504. http://dx.doi.org/10.1016/S0016-7037(02)00909-2.
Spiegelman, M., Elliott, T., 1993. Consequences of melt transport for uranium se-ries disequilibrium in young lavas. Earth Planet. Sci. Lett. 118, 1–20. http://dx.doi.org/10.1016/0012-821X(93)90155-3.
Spiegelman, M., Kelemen, P.B., 2003. Extreme chemical variability as a consequenceof channelized melt transport. Geochem. Geophys. Geosyst. 4, 1055–1072.http://dx.doi.org/10.1029/2002GC000336.
Spiegelman, M., Kelemen, P.B., Aharonov, E., 2001. Causes and consequences offlow organization during melt transport: The reaction infiltration instabil-ity in compactible media. J. Geophys. Res. 106, 2061–2077. http://dx.doi.org/10.1029/2000JB900240.
Stolper, E., Walker, D., Hager, B.H., Hays, J.F., 1981. Melt segregation from partiallymolten source regions: The importance of melt density and source region size.J. Geophys. Res. 86, 6261–6271. http://dx.doi.org/10.1029/JB086iB07p06261.
Stracke, A., Bourdon, B., McKenzie, D., 2006. Melt extraction in the Earth’s man-tle: Constraints from U–Th–Pa–Ra studies in oceanic basalts. Earth Planet. Sci.Lett. 244, 97–112. http://dx.doi.org/10.1016/j.epsl.2006.01.057.
The MELT Seismic Team, 1998. Imaging the deep seismic structure beneath a mid-ocean ridge: the MELT experiment. Science 280, 1215–1218. http://dx.doi.org/10.1126/science.280.5367.1215.
Toramaru, A., Fujii, N., 1986. Connectivity of melt phase in a partiallymolten peridotite. J. Geophys. Res. 91, 9239–9252. http://dx.doi.org/10.1029/JB091iB09p09239.
Vincent, L., 1993. Morphological grayscale reconstruction in image analysis: Ap-plications and efficient algorithms. IEEE Trans. Image Process. 2, 176–201.http://dx.doi.org/10.1109/83.217222.
Von Bargen, N., Waff, H.S., 1986. Permeabilities, interfacial areas and curva-tures of partially molten systems: Results of numerical computations of equi-librium microstructures. J. Geophys. Res. 91, 9261–9276. http://dx.doi.org/10.1029/JB091iB09p09261.
Wark, D.A., Watson, E.B., 1998. Grain-scale permeabilities of texturally equilibrate,monomineralic rocks. Earth Planet. Sci. Lett. 164, 591–605. http://dx.doi.org/10.1016/S0012-821X(98)00252-0.
Wark, D.A., Williams, C.A., Watson, E.B., Price, J.D., 2003. Reassessment of poreshapes in microstructurally equilibrated rocks, with implications for perme-ability of the upper mantle. J. Geophys. Res. 108, 2050–2065. http://dx.doi.org/10.1029/2001JB001575.
Watson, E.B., 1999. Lithologic partitioning of fluids and melts. Am. Mineral. 84,1693–1710.
Watson, H.C., Roberts, J.J., 2011. Connectivity of core forming melts: Experimen-tal constraints from electrical conductivity and X-ray tomography. Phys. EarthPlanet. Inter. 186, 172–182. http://dx.doi.org/10.1016/j.pepi.2011.03.009.
Weickert, J., Romeny, B.M.T.H., Viergever, M.A., 1998. Efficient and reliable schemesfor nonlinear diffusion filtering. IEEE Trans. Image Process. 7, 398–410.http://dx.doi.org/10.1109/83.661190.
York, D., Evensen, N.M., Martínez, M.L., De Basabe Delgado, J., 2004. Unified equa-tions for the slope, intercept, and standard errors of the best straight line. Am.J. Phys. 72, 367–375.
Yoshino, T., Yamazaki, D., Mibe, K., 2009. Well-wetted olivine grain boundaries inpartially molten peridotite in the asthenosphere. Earth Planet. Sci. Lett. 283,167–173. http://dx.doi.org/10.1119/1.1632486.
Zhu, W., Hirth, G., 2003. A network model for permeability in partiallymolten rocks. Earth Planet. Sci. Lett. 212, 407–416. http://dx.doi.org/10.1016/S0012-821X(03)00264-4.
Zhu, W., Gaetani, G.A., Fusseis, F., Montési, L.G.J., De Carlo, F., 2011. Microtomog-raphy of partially molten rocks: three-dimensional melt distribution in mantleperidotite. Science 332, 88–91. http://dx.doi.org/10.1126/science.1202221.
Related Documents