. Experimental & Numerical study on sheet metal lateral bending with fixed and pinned ends NORAZLIANIE BINTI SAZALI This FINAL Year Project Report is submitted to Faculty of Mechanical Engineering Universiti Malaysia Pahang in Partial fulfilment of Bachelor of Mechanical Engineering with Manufacturing Engineering Faculty of Mechanical Engineering UNIVERSITI MALAYSIA PAHANG JUNE 2012

Welcome message from author
This document is posted to help you gain knowledge. Please leave a comment to let me know what you think about it! Share it to your friends and learn new things together.
Transcript

.
Experimental & Numerical study on sheet metal lateral bending with fixed and pinned
ends
NORAZLIANIE BINTI SAZALI
This FINAL Year Project Report is submitted to Faculty of Mechanical Engineering
Universiti Malaysia Pahang in Partial fulfilment of Bachelor of Mechanical Engineering
with Manufacturing Engineering
Faculty of Mechanical Engineering
UNIVERSITI MALAYSIA PAHANG
JUNE 2012

vi
ABSTRACT
The main objective of this project is to expose student with many aspect of engineering
work, design, fabrication and testing a product. The task follows a common product
development activity, where student need to apply all their engineering knowledge and
skill to complete this project. In random, student must know some basic knowledge
which is buckling definition, software and machine to be used also the finite element
method. In the other hand, student must master in conceptual design and complete loose
part for an assembly drawing. Not only that, student must know how to solve problem
in fabrication work and can develop similar model on Finite Element software. From an
engineering standpoint, the finite element method is a method for solving engineering
problems such as stress analysis, heat transfer, fluid flow and electromagnetic by
computer simulation. The flow of the experiment is to be done from beginning until the
testing is conducted to the specimen to determine the output of the buckling test when
the combination of the joint are fixed and pinned. These projects explain how the design
looks like, how the test rig fabricates also failure and error during the test is going on.
From this project, we can prove that the experimental result is same with the simulation
result.

vii
ABSTRAK
Objektif utama projek ini adalah untuk mendedahkan pelajar dengan banyak aspek
kejuruteraan, reka bentuk, fabrikasi dan menguji sesuatu produk. Tugas ini merangkumi
pembangunan aktiviti, di mana pelajar perlu mengaplikasi semua pengetahuan
kejuruteraan dan kemahiran mereka untuk menyiapkan projek ini. Secara rawaknya,
pelajar mesti tahu beberapa pengetahuan asas seperti maksud kelengkungan,
perisian,mesin yang digunakan dan juga kaedah Finite Element. Sebaliknya, pelajar
mesti menguasai dalam konsep reka bentuk dan melengkapkan bahagian yang longgar
untuk lukisan pemasangan. Bukan itu sahaja, pelajar perlu tahu bagaimana untuk
menyelesaikan masalah dalam kerja fabrikasi dan boleh membangunkan model yang
sama di perisian Finite Element. Dari sudut pandangan kejuruteraan, kaedah Finite
Element adalah satu kaedah untuk menyelesaikan masalah kejuruteraan seperti analisis
tegangan, pemindahan haba, aliran bendalir dan elektromagnetik oleh simulasi
komputer. Langkah kerja eksperimen dilakukan dari awal sehingga ujian dijalankan ke
atas sampel untuk menentukan hasil ujian lengkungan apabila gabungan penyambung
adalah tetap dan dipin. Projek ini akan menerangkan bagaimana reka bentuk itu akan
kelihatan, bagaimana bahan eksperimen itu bertindak balas, juga kegagalan dan
kesilapan semasa eksperimen dijalankan. Daripada projek ini, kita boleh membuktikan
bahawa hasil eksperimen adalah sama dengan hasil simulasi.

viii
TABLE OF CONTENTS
TITLE PAGE i
SUPERVISOR DECLARATION ii
STUDENT DECLARATION iii
DEDICATION iv
ACKNOWLEDGEMENT v
ABSTRACT vi
ABSTRAK vii
TABLE OF CONTENTS viii
LIST OF TABLES xi
LIST OF FIGURES xii
LIST OF SYMBOLS xv
LIST OF ABBREVIATIONS xvi
CHAPTER 1 INTRODUCTION page
1.0 Introduction 1
1.1 Buckling Test 2
1.1.1 Applying the Buckling Theory 3
1.1.2 Euler Formula 4
1.2 Designs for manufacture and assembly (DFMA) 5
1.2.1 Traditional design paradigm 7
1.2.2 Objective of DFMA 9
1.3 Finite Element Method (FEM) 9
1.4 Project Background 11
1.5 Problem Statement 11
1.6 Scope of the Project 11
CHAPTER 2 LITERATURE REVIEW
2.0 Introduction 13
2.1 Buckling History 15
2.2
.
Classification Of Design For Manufacturing Analysis 17
ix
2.3 Analysis On Finite Element 19
CHAPTER 3 METHODOLOGY
3.0 Introduction 21
3.1 Material Preparation 23
3.1.1 Hollow Iron or Steel 23
3.1.2 L Shaped Iron Steel 26
3.1.3 Sheet Metal 27
3.1.4 Aluminium 28
3.2 Equipment Preparation 30
3.2.1 Disc Cutter 30
3.2.2 Band saw 33
3.3 Sample Preparation 34
3.3.1 Preparation of sheet metal process 34
(a)Sheet metal processing
(b)Sheet metal forming processes
(c)Finishing process
35
35
36
3.3.2 Preparation of welding process 36
3.3.3 Preparation of grinding process 40
3.3.4 Preparation of Milling Process 41
CHAPTER 4 DESIGN AND FABRICATION
4.0 Introduction 44
4.1 Material Designs 45
4.2 Part Fabrication 46
4.2.1 Upper hub 47
4.2.2 Load holder 48
4.2.3 Base and Top 49
4.2.4 Shaft 51
4.2.5 Pillar 52
4.2.6 Wall 53
4.2.7 Stand 54
4.3 Part Assembly 54
4.3.1 Base and top 55
4.3.2 Shaft and load holder 56
4.3.3 Combination of base and top, with L-shape and
wall
57
4.3.4 Combination of Top with Shaft and load holder 58

x
4.3.5 Complete Design 59
4.3.6 Holder Design for Pinned Case 60
4.4 Machines Involved 60
4.4.1 CNC Milling Machine 61
4.4.2 Milling machine 62
4.4.3 Speed Computation 64
4.4.4 Shearing Machine 66
4.4.5 Welding Machine 70
4.4.6 Turning Machine 71
4.4.7 Disc Cutter Machine 75
CHAPTER 5 COMPARISON BETWEEN FINETE ELEMENT
METHODS (ABAQUS SOFWARE) WITH STRAIN
GAUGE (DASY LAB SOFWARE)
5.0 Introduction 76
5.1 Analysis On Experimental Result With Strain Gauge
(DASY Lab)
77
5.1.1 Specimen preparation 77
5.1.2 Test procedure 80
5.2 Analysis On Simulation Result With Finite Element (
ABAQUS Software)
88
5.3 Analysis On Strain And Stress 89
CHAPTER 6 RESULT AND DISCUSSIONS
6.0 Introduction 93
6.1 Experimental Result By Using Strain Gauge ( DASY
lab Software )
93
6.1.1 Strain reading 94
6.1.2 Displacement reading 95
6.1.3 Graph 95
6.2 Simulation Result By Using Finite Element ( ABAQUS 98
xi
LIST OF TABLE
Table page
3.1 Dimensions and properties of rectangular hollow bar
sections.
25
3.2 Welding process 37
3.3 Allied process 37
4.1 Quantity and measurement for each part 46
6.1 Strain reading 95
6.2 Displacement reading 96
Software)
6.3 Comparison Between Experimental Result And
Simulation Results
106
CHAPTER 7 CONCLUSION AND RECOMMENDATIONS
7.0 Introduction 114
7.1 Conclusion 115
7.2 Recommendations 115
REFERENCES 117
APPENDICES
A1 Sample of entry form undergraduate student category 120
A2 Sample of entry form undergraduate student category (Section B) 121
A3 Sample of CITREx 2012 Tentative Program 122
A4 Sample of KRITERIA PEMARKAHAN 123
A5 Sample of KRITERIA PEMARKAHAN (Continue) 124
A6 Sample of terms of reference 125
A7 Sample of Certificate Of Award 126
xii
LIST OF FIGURES
Figure page
1.1 Stout and slender rod under compressive force 3
1.2 Example on buckling tests 5
1.3 Traditional Manufacturing Process 8
2.1 Geometry, loads and finite element meshes 14
3.1 Process flow of Final Year Project 22
3.2 Example on hollow iron/steel 24
3.3 Example on hollow iron/steel after been welding 24
3.4 Example on welding process on hollow iron/steel 25
3.5 Example of L shaped iron steel 26
3.6 Example on sheet metal 28
3.7 Example of aluminium 29
3.8 Examples of cutting disk (Model HITACHI SS 14SF) 30
3.9 Example of using cutting disk (Model HITACHI SS 14SF) 32
3.10 MVS-C shear cutting machine 34
3.11 Shearing Operations: Punching, Blanking and Perforating 35
3.12 Common Die-Bending Operations 36
3.13 Welding area and machine 38
3.14 After welding process 39
3.15 Welding rod 39
3.16 Grinding machine process 41
3.17 Example of aluminium milling process 42
3.18 Example of milling machine 43
3.19 Milling machine model (VMM 3917 PARTNER) 43
4.1 Condition on the test rig which is combination of fixed and
pinned condition.
45
4.2 Upper hub part 47
4.3 Load Holder part 48
4.4 Base part 49
4.5 Top part 49
4.6 Combination of base parts 50
4.7 Combination of top parts 50
4.8 Shaft part 51
4.9 Pillar part 52
4.10 Wall part 53
4.11 Stand part 54
4.12 Combination on base parts 55
4.13 Combination on top parts 55
4.14 Combination of shaft and load holder 56
4.15 Combination of base with L-shape 57
4.16 Combination of base, L-shape and wall 57
4.17 Combination of top with shaft and load holder 58
4.18 Complete design for buckling test 59
4.19 Holder design for pinned case 60
4.20 CNC milling machine 62
4.21 Illustration on milling machine 63
4.22 Milling machine 66

xiii
4.23 Sheared edge 68
4.24 Shearing machine 69
4.25 Welding machine 71
4.26 Turning machine 72
4.27 roughing or rough turning step 73
4.28 Parting aluminium step 73
4.29 Finish turning step 74
4.30 Disc cutter machine 75
5.1 Strain gauge test using DASY Lab software 77
5.2 Strain gauge have been glue to the Specimen test 78
5.3 How Strain Gauge connect with Data Logger 79
5.4 The connection of Data Logger 79
5.5 The connection of Data Logger to the laptop and test rig 80
5.6 10N loads applied on test rig 81
5.7 20N loads applied on test rig 82
5.8 30N loads applied on test rig 83
5.9 40N loads applied on test rig 84
5.10 50N loads applied on test rig 85
5.11 60N loads applied on test rig 86
5.12 70N loads applied on test rig 87
5.13 80N loads applied on test rig 88
5.14 The example of continuum model 90
5.15 80N loads applied on test rig 91
5.16 Strain gauge that attached to aluminium plat 93
6.1 Graph Load (N) versus Strain 97
6.2 Graph Load (N) versus Displacement (mm) 98
6.3 10N loads applied on test rig in ABAQUS software 99
6.4 20N loads applied on test rig in ABAQUS software 100
6.5 30N loads applied on test rig in ABAQUS software 101
6.6 40N loads applied on test rig in ABAQUS software 102
6.7 50N loads applied on test rig in ABAQUS software 103
6.8 60N loads applied on test rig in ABAQUS software 104
6.9 70N loads applied on test rig in ABAQUS software 105
6.10 80N loads applied on test rig in ABAQUS software 106
6.11 Comparisons between experimental result and simulation
result for 10 N loads
107
6.12 Comparisons between experimental result and simulation
result for 20 N loads
108
6.13 Comparisons between experimental result and simulation
result for 30 N loads
109
6.14 Comparisons between experimental result and simulation
result for 40 N loads
110
6.15 Comparisons between experimental result and simulation
result for 50 N loads
111
6.16 Comparisons between experimental result and simulation
result for 60 N loads
112
6.17 Comparisons between experimental result and simulation
result for 70 N loads
113
6.18 Comparisons between experimental result and simulation 114

xiv
result for 80 N loads 7.1 The equilibrium path bifurcates into two symmetric
secondary paths
115

xv
LIST OF SYMBOLS
Natural frequency
Total strain, Bandwidth parameter
a Strain amplitude
f True fracture ductility
f Fatigue ductility coefficient
True stress, local stress
Stress range
a Local stress amplitude
m Local mean stress
max Local maximum stress
f True tracture strength
Sf Fatigue strength
fS Fatigue strength coefficient

xvi
LIST OF ABBREVIATIONS
AA Aluminum alloy
A-A ASTM air to air typical fighter loading
Al Aluminium
ASTM American Society for Testing and Materials
CAD Computer-aided drafting
CAE Computer-aided engineering
DOF Degree-of-freedom
DTP Discretized turning point
FE Finite element
FFT Fast Fourier transform
FRF Frequency response function
IC Internal combustion
LG Linear generator
MBD Multibody dynamics
PDF Probability density function
PSD Power spectral density
SAE Society of Automotive Engineers

CHAPTER 1
INTRODUCTION
1.0 INTRODUCTION
When a structure (subjected usually to compression) undergoes visibly large
displacements transverse to the load then it is said to buckle. Buckling may be
demonstrated by pressing the opposite edges of a flat sheet of cardboard towards one
another. For small loads the process is elastic since buckling displacements disappear when
the load is removed. Local buckling of plates or shells is indicated by the growth of bulges,
waves or ripples, and is commonly encountered in the component plates of thin structural
members. Buckling proceeds in manner which may be either:
i. stable - in which case displacements increase in a controlled fashion as
loads are increased, the structure's ability to sustain loads is
maintained, or
ii. unstable - In which case deformations increase instantaneously, the load
carrying capacity nose- dives and the structure collapses
catastrophically.
Neutral equilibrium is also a theoretical possibility during buckling. This is
characterized by deformation increase without change in load. Buckling and bending are
similar in that they both involve bending moments. In bending these moments are
substantially independent of the resulting deflections, whereas in buckling the moments and
deflections are mutually inter-dependent so moments, deflections and stresses are not

2
proportional to loads. If buckling deflections become too large then the structure fails. This
is a geometric consideration, completely divorced from any material strength consideration.
If a component or part thereof is prone to buckling then its design must satisfy both
strength and buckling safety constraints, which is why we now examine the subject of
buckling.
All relevant buckling problems can be demonstrated with any possible test stand.
Buckling, as opposed to simple strength problems such as drawing, pressure, bending and
shearing, is primarily a stability problem. Buckling plays an important role in almost every
field of technology. The strength of a column may therefore be increased by distributing the
material so as to increase the moment of inertia. This can be done without increasing the
weight of the column by distributing the material as far from the principal axis of the cross
section as possible, while keeping the material thick enough to prevent local buckling. This
bears out the well-known fact that a tubular section is much more efficient than a solid
section for column service.
1.1 BUCKLING TEST
Another bit of information that may be gleaned from buckling test is the effect of
displacement on critical load. For a given size column, doubling the unsupported
displacement quarters the allowable load. The restraint offered by the end connections of a
column also affects the critical load. If the connections are perfectly rigid, the critical load
will be four times that for a similar column where there is no resistance to rotation (hinged
at the ends). Examples of this are:
i. Columns and supports in construction and steel engineering
ii. Stop rods for valve actuation and connecting rods in motor construction
iii. Piston rods for hydraulic cylinders and
iv. Lifting spindles in lifting gear

3
1.1.1 Applying the Buckling Theory
If a rod is subjected to longitudinal forces, as implied in the sketch, it can fail in two
ways. On the one hand, it can be plasticized and flattened if its admissible compressive
strain is exceeded .On the other hand, it is possible that it will suddenly shift to one side
and buckle before attaining the admissible compressive strain. This effect is called
buckling. The shape of the rod is the factor determines which of the two cases of failure
will occur. A rod with articulated mounting at both ends according to Euler case is slowly
subjected to an axial force. Above a certain load it will buckle laterally. In this case the
buckling (deformation) of the rod specimen will be measured in the middle of the rod and
recorded in a table along with the accompanying force. Force/deformation graphs will be
developed using these measured values. The results of the test should be compared with the
buckling theory values. A slender, thin rod is more likely to buckle than a thick, stout rod.
Figure 1.1 shows a slender, thin rod is more likely to buckle than a thick, stout rod under
compressive force.
Figure 1.1: Stout and slender rod under compressive force

4
1.1.2 Euler Formula
Buckling occurs suddenly and without warning when a certain limit load is attained.
It is therefore an extremely dangerous type of failure, which must be avoided by all means.
As soon as a rod begins to buckle, it will become deformed to the point of total destruction.
This is typical unstable behaviour. Since structural columns are commonly of intermediate
length, and it is impossible to obtain an ideal column, the Euler formula on its own has little
practical application for ordinary design. Issues that cause deviation from the pure Euler
strut behaviour include imperfections in geometry in combination with plasticity/non-linear
stress strain behaviour of the column's material. Consequently, a number of empirical
column formulae have been developed to agree with test data, all of which embody the
slenderness ratio. For design, appropriate safety factors are introduced into these formulae.
Buckling is a stability problem. The critical limit load above which buckling can occur is
dependent on both the slenderness of the rod, which is influence of length and diameter,
and the material used. In order to define slenderness the slenderness ratio l will be
introduced here. In this case l k is the characteristic length of the rod. It takes both the
actual length of the rod and the mounting conditions into consideration.

5
Figure 1.2: Example on buckling tests
Figure 1.2 shows the example on buckling test. For clamping, the ends of the odds
cause rigidity. The buckling length decisive for slenderness is shorter than the actual length
of the rod. Altogether, a differentiation is made between four types of mountings, each
having a different buckling length. The influence of diameter in the slenderness ratio is
expressed by the inertia radius i. It is calculated using the minimum geometrical moment of
inertia ly and the cross-sectional area, A.
1.2 DESIGNS FOR MANUFACTURE AND ASSEMBLY (DFMA)
Design for manufacture or 'Manufacturability' concerns the cost and difficulty of
making the product. At a simple level manufacturability, design for manufacture (DFM) at
a part level, involves detail such as ensuring that where a pin is to be assembled into a hole

6
that is only slightly larger in diameter, then it is much easier if the end of the pin or the
entry to the hole (or both) are chamfered or finished with a radius. This applies whether the
assembly is carried out manually or automatically. This is a fine tuning process carried out
once the product form has been decided. Indeed automatic assembly would be very difficult
and expensive if neither component of a close fitting pair was chamfered. At a more
complex level, product DFM tackles the more fundamental problem of deciding on the
product structure and form. Design for assembly (DFA) is an important part of this. Some
'manufacturability' software is available, relating both to manufacture and to assembly. This
section starts with some simple but important principles of manufacturability.
DFMA is an abbreviation for "Design for Manufacturing and Assembly" or
"Design for Manufacturability and Assembly. It a system comprised of various principles
that, when used properly, will improve the ability for a design to be easily manufactured
and assembled. It is most beneficial to consider these principles during the design phase of
new product development. This system can be divided into three major sections. The first is
the raw material. Choosing the right material is the foundation of a good design. Second are
the machines and processes used to work the raw material .The right process is essential for
creating finished parts that will meet your design requirements. Third is the assembly of the
product. It is during the assembly of the finished product that provides the greatest
opportunity to apply DFMA principles. The proper use of DFMA principles will allow one
to design a high quality product.
Choosing the best raw material for the design is the first step in using DFMA to
design a world class product. There are many factors that need to be considered when
choosing the best material for a design. First the material must have the correct mechanical
and chemical properties to meet the design criteria. Second when possible one should
choose a standard material that is readily available. Using special materials may increase
purchase price and lengthen deliveries. Third use nearly net parts whenever possible. The
raw material's profile should be as close to finished parts as possible to reduce processing.

7
Choosing the appropriate machine and processes can drastically reduce the time and
further increase the quality of the parts. When determining the best machine for the job,
there are many things to consider. First and foremost is the material for being processed.
Some materials may require coolant and others may require special fixturing or tooling.
Second is to apply as liberal tolerances as the design will allow. It typically takes longer
and is more costly to hold tighter tolerances. Third are the machines capabilities. Pick a
machine and process that can provide desired finish, hold tolerances required, and be
repeatable. Next is the tooling. You will need to pick tooling with the best combination of
finish, performance, life and cost. Another consideration is fixturing. Proper fixturing is
necessary for quality while fixturing that is user friendly can reduce the amount of labour
time in the manufacturing process.
Assemblies are the area with the most potential in applying DFMA principles. First,
reduce the parts count in an assembly. It can be reduce parts by eliminating or combining
multiple parts. Second by making parts symmetrical when the design allows. Having
asymmetrical parts require more attention in the positioning of the parts at assembly. Third
is simplicity of design. Typically the simpler the design the less opportunity for mistakes.
Next is self fixturing. The usage of the part itself is to help position or align itself with a
mating part. Whenever possible try to avoid using parts in the design that are easily tangled.
Tangled parts take time to untangle that may be spent doing productive work. It will also
have to think about accessibility. If a part is hard to get to it may take more time to position
and assemble it. Last but surely not least is poka yoke or mistake proofing. The goal of
poka yoke is to make it impossible to make a mistake.
1.2.1 Traditional design paradigm
In order to survive and develop in the market, the enterprises have to present their
new product to the public rapidly and continuously. Meanwhile, they must keep their
products with the low price and high quality. So, developing the new product to satisfy the
costumes requirements and make them appear in the market as soon as possible becomes
the key to share more part of the cake of the market. The tradition manufacturing method

8
follows the developing cycle shown as figure that follow the conceptual sketches of the
parts completed on the CAD workstation, the design engineers create the detail drawing
and assembly engineer create the assembly plan. The workshop makes the prototype and
gives the feedback, which accords to the sample test, to the design engineers and assembly
engineers who will redesign the product, the assembly and the manufacturing process. The
same cycle repeats again and again until arriving at competitive design. This kind of
process makes the design and manufacturing been performed independently. The design
engineer and the manufacturing engineer works individually and what results is that the
final products have many disadvantages such as poor characteristics in manufacturing,
assembly, maintenance; long developing period; high cost; and unguaranteed quality.
Figure 1.3 below shows the traditional manufacturing process.
Figure 1.3: Traditional Manufacturing Process
9
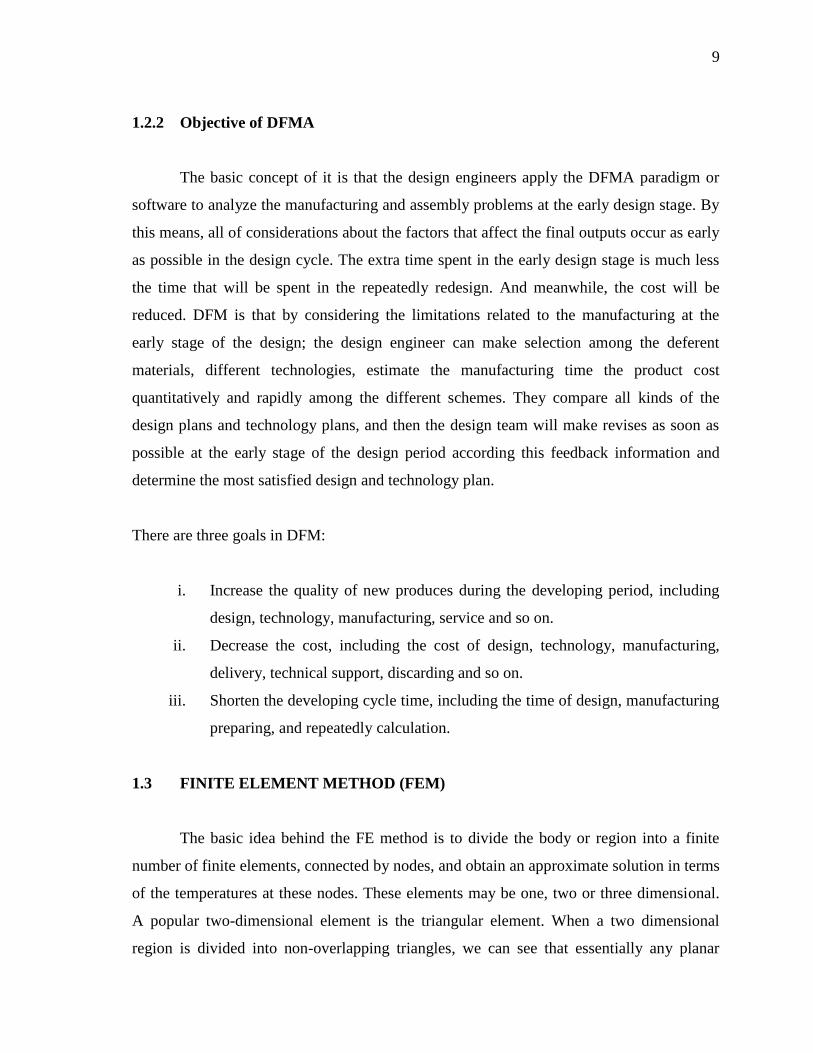
1.2.2 Objective of DFMA
The basic concept of it is that the design engineers apply the DFMA paradigm or
software to analyze the manufacturing and assembly problems at the early design stage. By
this means, all of considerations about the factors that affect the final outputs occur as early
as possible in the design cycle. The extra time spent in the early design stage is much less
the time that will be spent in the repeatedly redesign. And meanwhile, the cost will be
reduced. DFM is that by considering the limitations related to the manufacturing at the
early stage of the design; the design engineer can make selection among the deferent
materials, different technologies, estimate the manufacturing time the product cost
quantitatively and rapidly among the different schemes. They compare all kinds of the
design plans and technology plans, and then the design team will make revises as soon as
possible at the early stage of the design period according this feedback information and
determine the most satisfied design and technology plan.
There are three goals in DFM:
i. Increase the quality of new produces during the developing period, including
design, technology, manufacturing, service and so on.
ii. Decrease the cost, including the cost of design, technology, manufacturing,
delivery, technical support, discarding and so on.
iii. Shorten the developing cycle time, including the time of design, manufacturing
preparing, and repeatedly calculation.
1.3 FINITE ELEMENT METHOD (FEM)
The basic idea behind the FE method is to divide the body or region into a finite
number of finite elements, connected by nodes, and obtain an approximate solution in terms
of the temperatures at these nodes. These elements may be one, two or three dimensional.
A popular two-dimensional element is the triangular element. When a two dimensional
region is divided into non-overlapping triangles, we can see that essentially any planar

10
geometry can be easily represented by a union (in the language of mathematical sets) of
these elements. Instead of determining the temperature at every point in the plate, let us
consider determining the temperature at only a finite number of points, the vertices (or
nodes) of the triangles. The finite element method provides a systematic methodology
whereby the temperatures at the nodes (nodal temperatures) can be determined.
Interpolation can then be used to obtain the temperature throughout the problem domain.
For linear problems, we will need to solve a system of linear equations with the
number of unknowns (nodal temperatures) equal to the number of nodes. To obtain a
reasonably accurate solution, thousands of nodes are usually needed, so computers are
essential in solving these equations. Generally, the accuracy of the solution improves as the
number of elements (nodes) increases, but the computer time, and hence the cost, also
increases. The computer program determines the temperature at each node and the heat
flow through each element. The results are usually presented as computer visualizations,
such as contour plots, although selected results are often printed. This information is then
used in the engineering design process. Although we have just presented the concept in the
context of heat transfer, the same basic concept is applicable in other areas. In stress
analysis, the field variables are the displacements, in chemical systems the variables are
material concentrations, and in electromagnetic, the potential field.
The preponderance of finite element analyses in engineering design is today still
linear FEM. In heat conduction, linearity requires that the conductance be independent of
temperature. In 6 stress analyses, linear FEM is only applicable if the material behaviour is
linear elastic and the displacements are small. Additional discussions of the assumptions
underlying linear analysis are given later.

11
1.4 PROJECT BACKGROUND
The main idea of this project is to expose student with many aspect of engineering
work; design, fabrication and testing a product. The task follows a common product
development activity, where student need to apply all their engineering knowledge and skill
to complete this project. In random, student must know some basic knowledge which is
Buckling definition, software and machine to be used also the finite element method. In the
other hand, student must master in conceptual design and complete loose part for an
assembly drawing. Not only that, student must know how to solve problem in fabrication
work and can develop similar model on FEM software.
1.5 PROBLEM STATEMENT
In recent years, study of the buckling test has become significant. All these study
are aimed to design and fabricate of a lateral bending(buckling) test equipment .The first
problem statement is to study how the bending(buckling) test equipment looks like when
then combination of the joint are fixed and pinned .SSeeccoonnddllyy,, ffoorr current teaching practices
which is prefer hands-on or practical. It is easy and fast to understand the related
engineering problem. For example, Finite Element course need better teaching technique to
make student easily understand their application in solving engineering problem. Thirdly,
for simple engineering problem that can be investigated (by experimental) in laboratory.
For example, buckling test is a simple engineering problem. Lastly, for teaching purpose, a
buckling problem can be tested in laboratory and finite element software can be used to
develop similar model.
1.6 SCOPE OF THE PROJECT
The scope of this project is to expose student with many aspect of engineering
work; design, fabrication and testing a product. The task follows a common product
development activity, where student need to apply all their engineering knowledge and skill
to complete this project.

12
In random, student must know some basic knowledge which is Buckling definition,
software and machine to be used also the finite element method. In the other hand, student
must master in conceptual design and complete loose part for an assembly drawing. Not
only that, student must know how to solve problem in fabrication work and can develop
similar model on Finite Element software. There are three objectives of this project. First,
to fabricate the laboratory test equipment for sheet metal lateral bending (buckling)
condition where the ends joint are fixed and pinned. Secondly, to establish the buckling
tests under fixed-pinned setting. Thirdly, to compare between the experiment results and
the stimulation results by using Finite Element software.
Related Documents