Environmental Microbiology (2006) 8(8), 1448–1459 doi:10.1111/j.1462-2920.2006.01039.x © 2006 The Authors Journal compilation © 2006 Society for Applied Microbiology and Blackwell Publishing Ltd Blackwell Publishing LtdOxford, UKEMIEnvironmental Microbiology 1462-2912© 2006 The Authors; Journal compilation © 2006 Society for Applied Microbiology and Blackwell Publishing Ltd ? 20068814481459Original ArticleBio- logical drivers of bacterial community structureA. D. Kent et al. Received 29 September, 2005; accepted 23 February, 2006. *For correspondence. E-mail [email protected]; Tel. (+1) 217 333 4216; Fax (+1) 217 244 3219. Experimental manipulations of microbial food web interactions in a humic lake: shifting biological drivers of bacterial community structure Angela D. Kent, 1,2 * Stuart E. Jones, 1 George H. Lauster, 1 James M. Graham, 1 Ryan J. Newton 2,3 and Katherine D. McMahon 2,3 1 Center for Limnology, University of Wisconsin-Madison, Madison, WI 53706, USA. 2 Department of Civil and Environmental Engineering, University of Wisconsin-Madison, Madison, WI 53706, USA. 3 Microbiology Doctoral Training Program, University of Wisconsin-Madison, Madison, WI 53706, USA. Summary A previous multiyear study observed correlations between bacterioplankton community composition (BCC) and abundance and the dynamics of phy- toplankton populations and bacterivorous grazers in a humic lake. These observations generated hypoth- eses about the importance of trophic interactions (both top-down and bottom-up) for structuring bacte- rial communities in this lake, which were tested using two multifactorial food web manipulation experiments that separately manipulated the intensity of grazing and the composition of the phytoplankton community. Our results, combined with field observations, sug- gest that a hierarchy of drivers structures bacterial communities in this lake. While other studies have noted links between aggregate measures of phy- toplankton and bacterioplankton communities, we demonstrate here correlations between succession of phytoplankton assemblages and BCC as assessed by automated ribosomal intergenic spacer analysis (ARISA). We used a novel approach linking commu- nity ARISA data to phylogenetic assignments from sequence analysis of 16S rRNA gene clone libraries to examine the responses of specific bacterial phylo- types to the experimental manipulations. The syn- chronous dynamics of these populations suggests that primary producers may mediate BCC and diver- sity through labile organic matter production, which evolves in quality and quantity during phytoplankton succession. Superimposed on this resource-medi- ated control of BCC are brief periods of intense bac- terivory that impact bacterial abundance and composition. Introduction Aquatic bacteria interact with multiple ecological factors that have the potential to influence the bacterial commu- nity species composition. Bacterioplankton community composition (BCC) determines the suite of biogeochemi- cal functions available in pelagic ecosystems; BCC also influences the availability of bacteria as a food source for the microbial food web (Pernthaler et al ., 1996; 2004). Through their role in nutrient recycling and organic matter decomposition, bacteria have the potential to impact higher trophic levels (Azam et al ., 1983). In turn, both food web interactions and resource availability are known to influence aquatic bacterial abundance, size distribution and activity (Pernthaler et al ., 1996; Fisher et al ., 2000; Jürgens and Jeppesen, 2000; Jürgens and Sala, 2000; Langenheder and Jürgens, 2001). Because individual bacterial populations differ in their response to shifts in resource availability, this factor will necessarily influence BCC (van Hannen et al ., 1999a; Fisher et al ., 2000; Crump et al ., 2003). Thus, there is a need to understand the key drivers structuring bacterial communities in order to improve our understanding of freshwater food webs and ecosystem function. Grazing by bacterivorous protists is a significant factor impacting bacterial mortality in aquatic ecosystems (Jür- gens and Sala, 2000; Langenheder and Jürgens, 2001). Nanoflagellate grazers appear to selectively prey on the most active bacteria, or those in a specific size range (Pernthaler et al ., 1996). Some taxa can adapt to grazing pressure by forming filaments or aggregates that exceed the upper size limit for ingestion (Hahn and Höfle, 2001). Such morphological shifts may represent either popula- tion-specific phenotypic plasticity or selection for popula- tions already possessing a grazing-resistant morphology (Pernthaler et al ., 1996; Hahn and Höfle, 2001). Dissolved organic matter (DOM) source and composi- tion can also affect BCC. Organic carbon fixed photosyn- thetically within the lake (autochthonous DOM) is an important resource for pelagic bacterial populations (Cole,

Welcome message from author
This document is posted to help you gain knowledge. Please leave a comment to let me know what you think about it! Share it to your friends and learn new things together.
Transcript

Environmental Microbiology (2006)
8
(8), 1448–1459 doi:10.1111/j.1462-2920.2006.01039.x
© 2006 The AuthorsJournal compilation © 2006 Society for Applied Microbiology and Blackwell Publishing Ltd
Blackwell Publishing LtdOxford, UKEMIEnvironmental Microbiology 1462-2912© 2006 The Authors; Journal compilation © 2006 Society for Applied Microbiology and Blackwell Publishing Ltd
? 2006
8
814481459
Original Article
Bio-
logical drivers of bacterial community structureA. D. Kent
et al.
Received 29 September, 2005; accepted 23 February, 2006. *Forcorrespondence. E-mail [email protected]; Tel. (
+
1) 217 333 4216;Fax (
+
1) 217 244 3219.
Experimental manipulations of microbial food web interactions in a humic lake: shifting biological drivers of bacterial community structure
Angela D. Kent,
1,2
* Stuart E. Jones,
1
George H. Lauster,
1
James M. Graham,
1
Ryan J. Newton
2,3
and Katherine D. McMahon
2,3
1
Center for Limnology, University of Wisconsin-Madison, Madison, WI 53706, USA.
2
Department of Civil and Environmental Engineering, University of Wisconsin-Madison, Madison, WI 53706, USA.
3
Microbiology Doctoral Training Program, University of Wisconsin-Madison, Madison, WI 53706, USA.
Summary
A previous multiyear study observed correlationsbetween bacterioplankton community composition(BCC) and abundance and the dynamics of phy-toplankton populations and bacterivorous grazers ina humic lake. These observations generated hypoth-eses about the importance of trophic interactions(both top-down and bottom-up) for structuring bacte-rial communities in this lake, which were tested usingtwo multifactorial food web manipulation experimentsthat separately manipulated the intensity of grazingand the composition of the phytoplankton community.Our results, combined with field observations, sug-gest that a hierarchy of drivers structures bacterialcommunities in this lake. While other studies havenoted links between aggregate measures of phy-toplankton and bacterioplankton communities, wedemonstrate here correlations between succession ofphytoplankton assemblages and BCC as assessed byautomated ribosomal intergenic spacer analysis(ARISA). We used a novel approach linking commu-nity ARISA data to phylogenetic assignments fromsequence analysis of 16S rRNA gene clone librariesto examine the responses of specific bacterial phylo-types to the experimental manipulations. The syn-chronous dynamics of these populations suggeststhat primary producers may mediate BCC and diver-sity through labile organic matter production, whichevolves in quality and quantity during phytoplankton
succession. Superimposed on this resource-medi-ated control of BCC are brief periods of intense bac-terivory that impact bacterial abundance andcomposition.
Introduction
Aquatic bacteria interact with multiple ecological factorsthat have the potential to influence the bacterial commu-nity species composition. Bacterioplankton communitycomposition (BCC) determines the suite of biogeochemi-cal functions available in pelagic ecosystems; BCC alsoinfluences the availability of bacteria as a food source forthe microbial food web (Pernthaler
et al
., 1996; 2004).Through their role in nutrient recycling and organic matterdecomposition, bacteria have the potential to impacthigher trophic levels (Azam
et al
., 1983). In turn, both foodweb interactions and resource availability are known toinfluence aquatic bacterial abundance, size distributionand activity (Pernthaler
et al
., 1996; Fisher
et al
., 2000;Jürgens and Jeppesen, 2000; Jürgens and Sala, 2000;Langenheder and Jürgens, 2001). Because individualbacterial populations differ in their response to shifts inresource availability, this factor will necessarily influenceBCC (van Hannen
et al
., 1999a; Fisher
et al
., 2000;Crump
et al
., 2003). Thus, there is a need to understandthe key drivers structuring bacterial communities in orderto improve our understanding of freshwater food webs andecosystem function.
Grazing by bacterivorous protists is a significant factorimpacting bacterial mortality in aquatic ecosystems (Jür-gens and Sala, 2000; Langenheder and Jürgens, 2001).Nanoflagellate grazers appear to selectively prey on themost active bacteria, or those in a specific size range(Pernthaler
et al
., 1996). Some taxa can adapt to grazingpressure by forming filaments or aggregates that exceedthe upper size limit for ingestion (Hahn and Höfle, 2001).Such morphological shifts may represent either popula-tion-specific phenotypic plasticity or selection for popula-tions already possessing a grazing-resistant morphology(Pernthaler
et al
., 1996; Hahn and Höfle, 2001).Dissolved organic matter (DOM) source and composi-
tion can also affect BCC. Organic carbon fixed photosyn-thetically within the lake (autochthonous DOM) is animportant resource for pelagic bacterial populations (Cole,

Biological drivers of bacterial community structure
1449
© 2006 The AuthorsJournal compilation © 2006 Society for Applied Microbiology and Blackwell Publishing Ltd,
Environmental Microbiology
,
8
, 1448–1459
1982), and previous studies have noted strong correla-tions between aggregate measures (biomass, abundanceand production) of bacterioplankton and phytoplanktoncommunities (Azam
et al
., 1983; White
et al
., 1991; Pin-hassi and Hagström, 2000). Terrestrially derived (alloch-thonous) organic carbon from the surrounding landscapeis also an important component of available DOM. Crumpand colleagues (2003) demonstrated that seasonal varia-tion in DOM source (allochthonous vs. autochthonous)influenced BCC. The different DOM sources likely repre-sented organic substrates of varying composition andlability; concurrent seasonal changes in BCC may reflectbacterial populations best suited to utilize particularsubstrates.
As phytoplankton communities undergo seasonal suc-cession, labile DOM concentration and quality alsochange (Kirchman
et al
., 1991). While measures of phy-toplankton abundance or productivity have been corre-lated to whole-community measures for the bacterialcommunity in both natural and experimental systems(Cole, 1982; White
et al
., 1991), few studies have exam-ined correlation between phytoplankton and bacteri-oplankton populations at the species level in freshwaterecosystems. However, van Hannen demonstrated thatorganic matter derived from different phytoplanktonspecies is utilized by distinct bacterial groups in anexperimental system (van Hannen
et al
., 1999a). Thisphenomenon was also recently observed in marine sys-tems (Pinhassi
et al
., 2004).We recently examined a number of chemical, physical
and biological factors potentially impacting BCC in CrystalBog Lake. On an annual time scale, physical factors suchas water temperature or mixing events appear to beimportant in determining BCC (Yannarell
et al
., 2003). Themicrobial community was most variable during the sum-mer months (June–August), where physical changes wereless well correlated with changes in BCC. Seasonal pat-terns in BCC were most strongly correlated to changes inthe grazer and phytoplankton community over three con-secutive years (Kent
et al
., 2004). Our observations gen-erated hypotheses relating seasonal changes in BCC tothe dynamics of other planktonic populations. Specifically,we propose that summer bacterial community dynamicsin this lake are determined by a hierarchy of food webinteractions: resource quality and availability (bottom-upfactors mediated by phytoplankton succession) are con-sistently acting to structure BCC, while the impact of top-down interactions (bacterivory) is superimposed uponthese drivers in early summer. In the current study, twomultifactorial experiments were conducted to test thesehypotheses. The early summer experiment was carriedout during the annual peak in abundance of heterotrophicand mixotrophic grazing populations. The late summerexperiment took place while the phytoplankton community
experienced an intense bloom of a single dinoflagellatespecies.
Results
Planktonic population dynamics
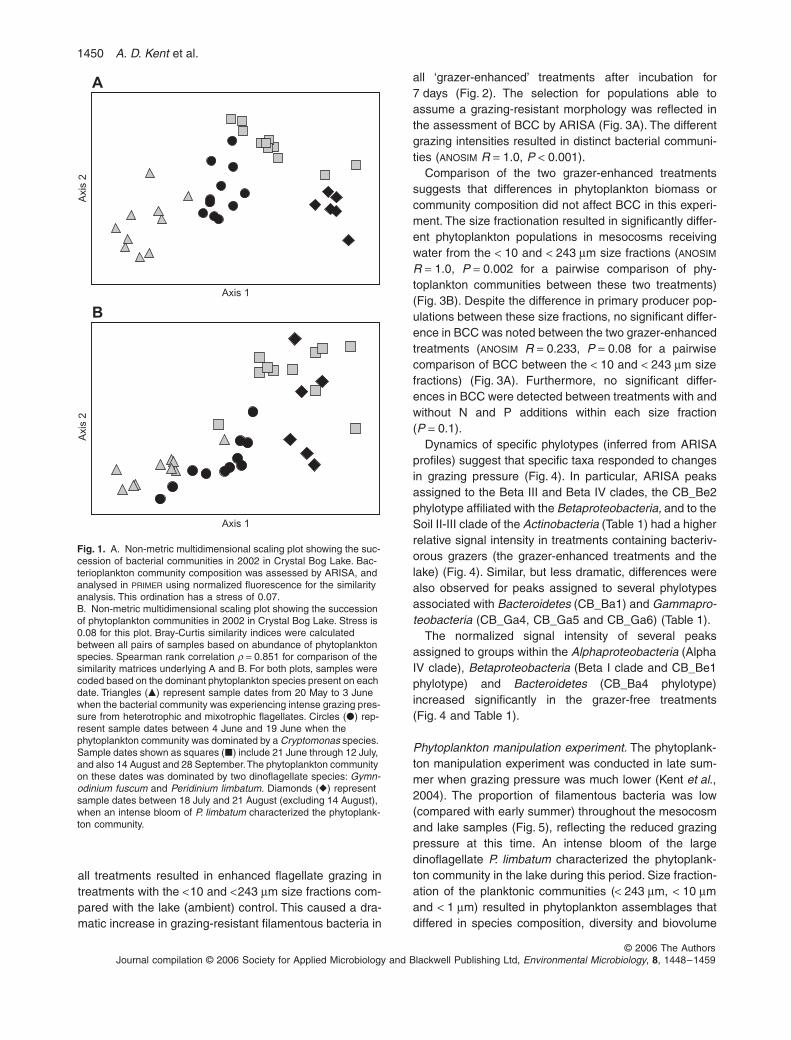
Bacterioplankton community composition and phytoplank-ton community composition (PCC) in this humic lake arequite variable over the summer months. Non-metric mul-tidimensional scaling (MDS) ordinations based on stan-dardized automated ribosomal intergenic spacer analysis(ARISA) profiles (Fig. 1A) or phytoplankton abundance(Fig. 1B) illustrate bacterial and phytoplankton communitysuccession, respectively, in 2002. The sample dates formtemporally distinct clusters in Fig. 1A. Sample dates inboth Fig. 1A and B are coded by the dominant species inthe phytoplankton assemblage present on each date inorder to visualize the correlation between BCC (Fig. 1A)and phytoplankton succession (Fig. 1B). The pattern ofsample dates in each plot was compared using the Spear-man rank correlation (
ρ
) between the similarity matrixelements used to generate these plots. The rank correla-tion (
ρ
) of 0.851 between the bacterial and algal similaritymatrices indicates good agreement between the patternsin each ordination (Fig. 1). Sample dates affiliated with theearly summer cluster (triangles) correspond to the peakin mixotrophic flagellates and heterotrophic nanoflagel-lates (HNF) (Kent
et al
., 2004). Total bacterioplanktonabundance was low, while the abundance and proportionof grazing-resistant filaments also peaked during this time(Kent
et al
., 2004). The grazer manipulation experimentwas conducted during this period.
Peridinium limbatum
dominated the phytoplankton community on the sampledates shown as diamonds (Fig. 1 and Kent
et al
., 2004).The intense bloom of this dinoflagellate accounted formore than 80% of the primary producer biomass in thelake on these days. The phytoplankton manipulationexperiment took place during this period. Bacterioplank-ton community composition was significantly different ineach of these groups of sample dates in Fig. 1A [analysisof similarity (
ANOSIM
)
R
=
0.881,
P
<
0.001].
Microbial food web manipulations
Grazer manipulation experiment.
The grazer manipula-tion experiment was conducted to examine the impor-tance of flagellate grazing for determining early summerBCC. The
<
1
µ
m size fraction was virtually free of flagel-late grazers (0.08
±
0.03
×
10
3
HNF per millilitre, mix-otrophic flagellates were completely removed) while allother treatments initially had ambient levels of flagellates(5.2
±
0.2
×
10
3
HNF per millilitre, 1.8
±
0.4
×
10
3
mixotro-phs per millilitre). Large-bodied cladoceran removal from
1450
A. D. Kent
et al.
© 2006 The AuthorsJournal compilation © 2006 Society for Applied Microbiology and Blackwell Publishing Ltd,
Environmental Microbiology
,
8
, 1448–1459
all treatments resulted in enhanced flagellate grazing intreatments with the
<
10 and
<
243
µ
m size fractions com-pared with the lake (ambient) control. This caused a dra-matic increase in grazing-resistant filamentous bacteria in
all ‘grazer-enhanced’ treatments after incubation for7 days (Fig. 2). The selection for populations able toassume a grazing-resistant morphology was reflected inthe assessment of BCC by ARISA (Fig. 3A). The differentgrazing intensities resulted in distinct bacterial communi-ties (
ANOSIM
R
=
1.0,
P
<
0.001).Comparison of the two grazer-enhanced treatments
suggests that differences in phytoplankton biomass orcommunity composition did not affect BCC in this experi-ment. The size fractionation resulted in significantly differ-ent phytoplankton populations in mesocosms receivingwater from the
<
10 and
<
243
µ
m size fractions (
ANOSIM
R
=
1.0,
P
=
0.002 for a pairwise comparison of phy-toplankton communities between these two treatments)(Fig. 3B). Despite the difference in primary producer pop-ulations between these size fractions, no significant differ-ence in BCC was noted between the two grazer-enhancedtreatments (
ANOSIM
R
=
0.233,
P
=
0.08 for a pairwisecomparison of BCC between the
<
10 and
<
243
µ
m sizefractions) (Fig. 3A). Furthermore, no significant differ-ences in BCC were detected between treatments with andwithout N and P additions within each size fraction(
P
=
0.1).Dynamics of specific phylotypes (inferred from ARISA
profiles) suggest that specific taxa responded to changesin grazing pressure (Fig. 4). In particular, ARISA peaksassigned to the Beta III and Beta IV clades, the CB_Be2phylotype affiliated with the
Betaproteobacteria,
and to theSoil II-III clade of the
Actinobacteria
(Table 1) had a higherrelative signal intensity in treatments containing bacteriv-orous grazers (the grazer-enhanced treatments and thelake) (Fig. 4). Similar, but less dramatic, differences werealso observed for peaks assigned to several phylotypesassociated with
Bacteroidetes
(CB_Ba1) and
Gammapro-teobacteria
(CB_Ga4, CB_Ga5 and CB_Ga6) (Table 1).The normalized signal intensity of several peaks
assigned to groups within the
Alphaproteobacteria
(AlphaIV clade),
Betaproteobacteria
(Beta I clade and CB_Be1phylotype) and
Bacteroidetes
(CB_Ba4 phylotype)increased significantly in the grazer-free treatments(Fig. 4 and Table 1).
Phytoplankton manipulation experiment.
The phytoplank-ton manipulation experiment was conducted in late sum-mer when grazing pressure was much lower (Kent
et al
.,2004). The proportion of filamentous bacteria was low(compared with early summer) throughout the mesocosmand lake samples (Fig. 5), reflecting the reduced grazingpressure at this time. An intense bloom of the largedinoflagellate
P. limbatum
characterized the phytoplank-ton community in the lake during this period. Size fraction-ation of the planktonic communities (
<
243
µ
m,
<
10
µ
mand
<
1
µ
m) resulted in phytoplankton assemblages thatdiffered in species composition, diversity and biovolume
Fig. 1.
A. Non-metric multidimensional scaling plot showing the suc-cession of bacterial communities in 2002 in Crystal Bog Lake. Bac-terioplankton community composition was assessed by ARISA, and analysed in
PRIMER
using normalized fluorescence for the similarity analysis. This ordination has a stress of 0.07.B. Non-metric multidimensional scaling plot showing the succession of phytoplankton communities in 2002 in Crystal Bog Lake. Stress is 0.08 for this plot. Bray-Curtis similarity indices were calculated between all pairs of samples based on abundance of phytoplankton species. Spearman rank correlation
ρ
=
0.851 for comparison of the similarity matrices underlying A and B. For both plots, samples were coded based on the dominant phytoplankton species present on each date. Triangles (
�
) represent sample dates from 20 May to 3 June when the bacterial community was experiencing intense grazing pres-sure from heterotrophic and mixotrophic flagellates. Circles (
�
) rep-resent sample dates between 4 June and 19 June when the phytoplankton community was dominated by a
Cryptomonas
species. Sample dates shown as squares (
�
) include 21 June through 12 July, and also 14 August and 28 September. The phytoplankton community on these dates was dominated by two dinoflagellate species:
Gymn-odinium fuscum
and
Peridinium limbatum.
Diamonds (
�
) represent sample dates between 18 July and 21 August (excluding 14 August), when an intense bloom of
P. limbatum
characterized the phytoplank-ton community.
Axis 1
B
Axi
s 2
Axi
s 2
Axis 1
A

Biological drivers of bacterial community structure
1451
© 2006 The AuthorsJournal compilation © 2006 Society for Applied Microbiology and Blackwell Publishing Ltd,
Environmental Microbiology
,
8
, 1448–1459
(Table 2). The phytoplankton community in the treatmentsreceiving 243
µ
m of filtered water did not differ signifi-cantly from the phytoplankton communities in the lakeinitially (pairwise
R
=
0,
P
=
0.39). After incubation for
7 days, however, the lake community had higher densitiesof Cryptomonas, Mallomonas and all dinoflagellate spe-cies, particularly P. limbatum. Both the reference commu-nities in the lake and the < 243 µm mesocosm hadsignificantly higher algal biovolume than the other treat-ments, and also higher phytoplankton diversity (Table 2).
Distinct bacterial assemblages formed following incuba-tion with different phytoplankton communities (Fig. 6A).The relationship between patterns in BCC and PCC thatwas observed in the lake (Fig. 1) is also apparent in themanipulated communities (ρ = 0.827) (Fig. 6B).
Automated ribosomal intergenic spacer analysis peaksassigned to specific clades showed differential responsesto the manipulated phytoplankton communities (Fig. 7 andTable 1). Peaks assigned to the Alpha IV clade of theAlphaproteobacteria and to Bacteroidetes phylotypeCB_Ba3 had significantly higher normalized fluorescencein the <1 µm fraction where phytoplankton abundanceand diversity was reduced. Peaks assigned to the Betap-roteobacteria Beta II clade, Actinobacteria acI-B cladeand Gammaproteobacteria CB_Ga1 phylotype showedsignificantly higher normalized signal strength in the treat-ments with higher phytoplankton biovolume, along withpeaks assigned to Firmicutes phylotype CB_Fi1, Deltap-roteobacteria phylotype CB_De1 and Bacteroidetes cladeCFI.
Discussion
Humic lakes as model systems for examining microbial food web interactions
The importance of top-down versus bottom-up factors onBCC, abundance and morphology was examined in Crys-tal Bog lake, a humic lake in northern Wisconsin. Thislake, and other humic systems in northern temperateregions generally lack planktivorous fishes. This simplifiedfood web readily lends itself to examination of trophicinteractions among planktonic populations without the
treatment
grazer free grazer-enhanced ambient
0
10
20
30
40
50
<1 mm
Per
cen
t fi
lam
ents
<1 mm+NP <10 mm <10 mm+NP <243 mm <243 mm+NP lake(reference)
Fig. 2. Per cent of bacterial population with fil-amentous morphology 7 days after the density of flagellate grazers was manipulated, during the first mesocosm experiment.
Table 1. Automated ribosomal intergenic spacer analysis (ARISA)fragment lengths from Crystal Bog Lake assigned to specific phylo-types (Newton et al., 2006).
Phylotypes ARISA fragment length (bp)
Actinobacteriaacl-B (AY792223)a 545, 556, 581, 594, 600, 611Soil II_III (AY792232) 615, 633, 675
AlphaproteobacteriaAlpha I (AY792286) 891, 950Alpha IV (AY792290) 898
BetaproteobacteriaBeta I (AY792257) 958Beta II (AY792239) 797Beta III (AY792259) 1066Beta IV (AY792265) 741, 828CB_Be1 (AY792253) 619, 646 648, 873CB_Be2 (AY792246) 565, 755, 767
BacteriodetesCB_Ba1 (AY792303) 495, 626CB_Ba2 (DQ093402) 821CFI (AY792297) 749, 780, 806, 817
FirmicutesCB_Fi1 (AY792314) 586
GammaproteobacteriaCB_Ga1 (AY792266) 492, 510, 516, 664, 732, 752, 824CB_Ga3 (AY792278) 689CB_Ga4 (AY792280) 715CB_Ga5 (AY792281) 771CB_Ga6 (AY792282) 763
DeltaproteobacteriaCB_De1 (AY792293) 684
Automated ribosomal intergenic spacer analysis fragment lengthsand phylogenetic assignments were derived from analysis of clonelibraries derived from partial rrn operons (near full-length 16S rRNAplus the intergenic transcribed spacer) amplified from aquatic bacte-rial communities. Only peaks which could be unambiguouslyassigned to a single clade have been included. Clade definitions aredescribed elsewhere (Glockner et al., 2000; Zwart et al., 2002;Warnecke et al., 2004; Newton et al., 2006).a. GenBank accession number for a representative sequenceassigned to this clade as defined in Newton and colleagues, 2006).

1452 A. D. Kent et al.
© 2006 The AuthorsJournal compilation © 2006 Society for Applied Microbiology and Blackwell Publishing Ltd, Environmental Microbiology, 8, 1448–1459
complication of higher trophic level influence. Crystal Boglake experiences a succession of dinoflagellate bloomseach summer, culminating in a particularly intense annualP. limbatum bloom in August, as do many other humiclakes in this region (Graham et al., 2004; Kent et al.,2004). This succession likely affects the concentration and
Fig. 3. Non-metric multidimensional scaling plot of BCC (A) and PCC (B) 7 days after manipulation of flagellate grazing pressure. Each point in the plot represents the community composition determined by ARISA profiles generated from individual lake or mesocosm treat-ments (A) or microscopic counts (B) in the grazer manipulation exper-iment. Similarity in community composition was determined using Bray-Curtis similarity index in PRIMER. Distance between points rep-resents dissimilarity in community composition; samples that have similar communities plot close together. The samples are labelled with the grazer manipulation treatment in A (� – grazer-free samples; � – grazer-enhanced samples; � – lake samples); within the grazer-enhanced treatments, communities in the < 10 µm size fraction are indicated in black (�) and those from the < 243 µm size fraction are indicated in white (�). Phytoplankton communities from correspond-ing samples are coded similarly in B. Samples with and without N and P additions are included for each size fraction. The stress for each ordination is 0.01, indicating that the two-dimensional represen-tation of this multidimensional ordination is not unduly distorted. Anal-ysis of similarity (ANOSIM) between treatment groups indicates that bacterial communities (A) had much greater similarity to each other within treatments compared with between treatments (R = 1.0, P < 0.001).
Axis 1
B
Axi
s 2
AA
xis
2
Axis 1
ambient
grazer-enhanced grazer-free
Tab
le 2
.P
hyto
plan
kton
com
mun
ity c
ompo
sitio
n in
mes
ocos
ms
follo
win
g si
ze fr
actio
natio
n (in
itial
) an
d in
cuba
tion
for
7 da
ys (
final
) du
ring
the
phyt
opla
nkto
n m
anip
ulat
ion
expe
rimen
t.
Phy
topl
ankt
onpo
pula
tion
Phy
topl
ankt
on a
bund
ance
(ce
lls l−1
) in
eac
h si
ze f
ract
ion
< 1
µm<
10 µ
m<
243
µmLa
ke
initi
alfin
alin
itial
final
initi
alfin
alin
itial
final
Cry
ptom
onas
2.0
± 2.
0 ×
102
1.4
± 0.
4 ×
103
1.7
± 0.
1 ×
105
1.1
± 0.
4 ×
105
2.5
± 0.
2 ×
105
1.3
± 0.
4 ×
105
1.9
± 0.
7 ×
105
5.9
± 1.
9 ×
105
Din
obry
onn.
d.4.
9 ±
0.0
× 10
45.
3 ±
2.0
× 10
31.
3 ±
0.2
× 10
43.
9 ±
0.6
× 10
41.
3 ±
0.3
× 10
44.
8 ±
2.3
× 10
41.
1 ±
0.2
× 10
4
G. f
uscu
mn.
d.n.
d.2.
9 ±
1.0
× 10
32.
2 ±
0.5
× 10
39.
4 ±
2.4
× 10
32.
0 ±
0.4
× 10
37.
7 ±
2.5
× 10
33.
3 ±
0.1
× 10
4
P. c
inct
um2.
0 ±
2.0
× 10
2n.
d.2.
6 ±
0.8
× 10
31.
5 ±
0.5
× 10
38.
6 ±
1.0
× 10
35.
1 ±
1.6
× 10
36.
9 ±
2.3
× 10
31.
5 ±
1.3
× 10
4
P. li
mba
tum
n.d.
1.7
± 1.
7 ×
102
3.2
± 0.
6 ×
103
1.7
± 0.
6 ×
103
9.0
± 1.
7 ×
103
7.9
± 1.
4 ×
103
9.8
± 1.
4 ×
102
1.1
± 1.
0 ×
104
Mal
lom
onas
n.d.
n.d.
1.7
± 0.
2 ×
104
1.7
± 1.
7 ×
102
4.5
± 0.
5 ×
104
2.0
± 2.
0 ×
102
2.8
± 1.
1 ×
104
2.8
± 1.
4 ×
104
Tota
l bio
volu
me
(µm
3 l−1)
1.8
± 1.
7 ×
107
6.2
± 4.
8 ×
107
1.7
± 0.
2 ×
109
9.7
± 2.
1 ×
109
4.4
± 0.
6 ×
109
3.1
± 0.
5 ×
109
4.3
± 0.
5 ×
109
7.3
± 3.
6 ×
109
Pop
ulat
ions
wer
e av
erag
ed f
or s
ix r
eplic
ate
mes
ocos
ms
from
eac
h si
ze f
ract
ion,
and
thr
ee r
eplic
ates
for
the
lake
sam
ples
. Ran
ge in
dica
tes
stan
dard
err
or.
n.d.
, no
t de
tect
ed.

Biological drivers of bacterial community structure 1453
© 2006 The AuthorsJournal compilation © 2006 Society for Applied Microbiology and Blackwell Publishing Ltd, Environmental Microbiology, 8, 1448–1459
biochemical composition of labile DOM available to bac-terioplankton populations (van Hannen et al., 1999a; Pin-hassi et al., 2004). Though this lake is consistently highin dissolved organic carbon (average 10 mg l−1), a largefraction of this is presumed to be comprised of recalcitranthigh-molecular-weight humic compounds (Sachse et al.,2001; Burkert et al., 2003). Other researchers have dem-onstrated in both mesocosm and field studies that organicmatter of differing quality will select for different bacteri-oplankton populations (van Hannen et al., 1999a; Arrietaand Herndl, 2002; Burkert et al., 2003; Crump et al., 2003;Pinhassi et al., 2004). The intense bloom of a single phy-toplankton species each August may limit the diversity ofreadily available DOM, and enrich for the bacterioplanktonpopulations that specialize in using this resource. Thesynchronous dynamics of bacterial and phytoplankton
populations (Fig. 1) are consistent with the hypothesis thatresource quality or availability may be an important factorin determining BCC in this lake.
Part of the observed phytoplankton community succes-sion in Crystal Bog lake includes annual blooms of mix-otrophic flagellates each year in early summer (Grahamet al., 2004; Kent et al., 2004). This bloom coincides withthe peak in HNF grazers each year, and bacterial com-munities are subjected to intense grazing pressure for thebloom duration. Previous studies in model systems haveshown that bacterivory can influence not only bacterialabundance, but also the genotypic and phenotypic com-position of the community (Pernthaler et al., 1997; 2001;2004; Jürgens et al., 1999; van Hannen et al., 1999b;Hahn and Höfle, 2001; Langenheder and Jürgens, 2001).Dramatic shifts in bacterial abundance, bacterial commu-
Fig. 4. Mean normalized fluorescence of ARISA peaks assigned to the indicated clades is shown for each treatment following 7 days’ incubation with different grazing pressures (treatment groups are described in Table 3). Letters indicate significant differences between mean values following pairwise comparisons with Bonferroni corrections (α = 0.05/3).
0
0.01
0.02
0.03
0.04
0.05
0.06
0.07
0.08
Beta I Alpha IV CB_Ba4 CB_Be1 Beta III CB_Be2 Beta IV CB_Ga5 CB_Ga4 CB_Ga6 CB_Ba1 Soil II_III
rela
tive
AR
ISA
sig
nal s
treng
th
bacterial population
grazer freegrazer enhancedambient
a
b
c
a ba
a
b aba
b b a
b
b
a
b ba
b ab
ab c a a
b
a
b ba
b ba
b b
0
10
20
30
40
50
treatment
<1 mm
Per
cen
t fi
lam
ents
<1 mm+NP <10 mm <10 mm+NP <243 mm <243 mm+NP lake(reference)
Fig. 5. Per cent of bacterial population with fil-amentous morphology 7 days after the PCC was manipulated, during the second meso-cosm experiment. This figure uses the same scale as Fig. 2 in order to illustrate the differ-ence in relative abundance of filamentous bac-teria between the two experiments.

1454 A. D. Kent et al.
© 2006 The AuthorsJournal compilation © 2006 Society for Applied Microbiology and Blackwell Publishing Ltd, Environmental Microbiology, 8, 1448–1459
nity richness and composition (assessed by ARISA), aswell as an increase in the proportion of grazing resistantfilaments are observed annually in Crystal Bog lake, con-current with this increase in nanoflagellate grazers (Kentet al., 2004; Newton et al., 2006).
In order to test our hypotheses about the importance ofboth top-down and resource-mediated controls for BCC,the food web structure was manipulated at different pointsduring microbial community succession. The temporalseparation of intense grazing pressure (early summer)
and the potentially limited resource diversity representedby low phytoplankton diversity (late summer) allowed usto separately examine the importance of each factor forstructuring bacterial communities in this lake.
Effect of food web interactions on BCC
Top-down factors. Studies examining the influence offlagellate grazers on the phenotypic composition of bac-terial communities have reported conflicting results on thecorrelation between the formation of filamentous bacterialmorphology and the presence of bacterivorous protists(Jürgens et al., 1999; Jürgens and Sala, 2000; Langen-heder and Jürgens, 2001; Pernthaler et al., 2004; Wuet al., 2004). In the current study, enhanced bacterivoryincreased the proportion of filamentous bacteria, regard-less of resource-related factors that were also manipu-lated (Fig. 2). In addition, flagellate removal resulted infewer filamentous bacteria at the conclusion of the exper-iment. The strong differences in BCC related to changesin grazing pressure lead us to conclude that bacterivoryis the most important factor structuring the bacterial com-munities in early summer in this lake.
Resource-mediated factors. The phytoplankton manipu-lation experiment was conducted to test the hypothesisthat the annual late summer P. limbatum bloom impactsBCC. This intense bloom presumably provides the bacte-rial community with abundant autochthonous DOMresources (van Hannen et al., 1999a; Arrieta and Herndl,2002; Pinhassi et al., 2004). However, the limited phy-toplankton community diversity during this time (Grahamet al., 2004) may influence DOM resource diversity andlead to enrichment of bacterial populations best suited totake advantage of particular substrates. Analytical meth-ods for DOM characterization were not available for thisstudy; however, because labile autochthonous DOM maybe metabolized by bacterioplankton very soon after it isreleased by phytoplankton (Kritzberg et al., 2004), suchmeasures likely would not have allowed us to accuratelycalculate the flux of autochothonous carbon between thesetwo compartments of the food web. Instead, we proposethat PCC provides a useful proxy for evaluating diversityand abundance of labile organic carbon resources avail-able to aquatic bacteria. By reducing or eliminating P.limbatum abundance through size fractionation, the com-munity composition of primary producers available in eachexperimental treatment was altered (Fig. 6). The strongrelationship between BCC and PCC in the mesocosmexperiment mirrors the synchronous dynamics of thesetwo food web compartments that were observed in thelake over the ice-free season in 2002 (Fig. 1), and supportsour hypothesis regarding the relationship between BCCand the primary producer community.
Fig. 6. Comparison of mesocosm BCC (A) with PCC (B) yields sim-ilar MDS plots at the conclusion of the phytoplankton manipulation experiment. The symbols correspond to the different size fractions: (� – <1 µm; �– < 10 µm; �− < 243 µm; �– lake). Samples with (grey) and without (white) N and P additions are included for each size fraction. Phytoplankton communities from corresponding sam-ples are coded similarly in B. The stress for the BCC ordination is 0.09, the phytoplankton community ordination has a stress of 0.05. Analysis of similarity (ANOSIM) between treatment groups indicates that bacterial communities (A) had much greater similarity to each other within treatments compared with between treatments (R = 0.711, P < 0.001). Phytoplankton community composition differ-ences among treatments are described in Table 2. Phytoplankton community composition also differed significantly between treatment groups (ANOSIM R = 0.733, P < 0.001). Spearman rank correlation ρ = 0.827 for comparison of the similarity matrices underlying the ordinations shown in A and B.
Axis 1
B
Axi
s 2
AA
xis
2
Axis 1

Biological drivers of bacterial community structure 1455
© 2006 The AuthorsJournal compilation © 2006 Society for Applied Microbiology and Blackwell Publishing Ltd, Environmental Microbiology, 8, 1448–1459
Population-level response to food web dynamics
Changes in ARISA peak intensity have been found to bewell correlated with the dynamics of the populations rep-resented by specific peaks (Brown et al., 2005), thus weare able to make general comparative observationsregarding the response of bacterial populations to exper-imental manipulations based on ARISA profiles. Intensityof ARISA peaks assigned to several Betaproteobacteriaclades increased in the grazer-enhanced treatments, orwas greatly reduced in the grazer-free treatments, sug-gesting that grazing pressure may select for these taxa.The response to increased grazing was most dramatic forthe Beta III clade of Betaproteobacteria. A dramaticincrease in the relative signal intensity associated with thisclade was also observed in the lake during this time (New-ton et al., 2006), leading us to speculate that the grazing-resistant (filamentous) populations observed in this lakemight be Betaproteobacteria. Previous studies have dem-onstrated that cells affiliated with the Betaproteobacteriaform a significant portion of the filamentous bacteria insome freshwater ecosystems (Langenheder and Jürgens,2001), though several other phylogenetic groups are alsoable to assume a grazing-resistant morphology (Jürgenset al., 1999; Hahn and Höfle, 2001; Boenigk et al., 2004;Pernthaler et al., 2004). Additional experiments usingwhole-cell detection methods such as fluorescent in situhybridization are required to conclusively determine thephylogenetic affiliation of the filamentous populations inthis lake.
Phytoplankton community manipulation also resulted indifferential responses from specific bacterial populations.Because availability of autochthonous DOM is related toprimary producer abundance (Kirchman et al., 1991;Crump et al., 2003), we presume that labile substrate wasmore limiting in mesocosms with smaller phytoplanktonpopulations. The bacterial populations represented by theARISA peaks that increase in normalized signal strengthin these treatments may represent populations that aremore successful in resource-limited situations, or ‘K-strat-egists’. Automated ribosomal intergenic spacer analysispeaks showing the opposite trend may represent bacterialpopulations enriched by the substrate provided by thePeridinium bloom. As this experiment was carried outduring the period when the peak in total primary producerbiovolume for the ice-free season was observed, a moregeneral interpretation would be that these populationsmay represent ‘r-strategists’ responding to the temporaryabundance of autochthonous DOM resources. Theenrichment of Beta II Betaproteobacteria from humic lakebacterial communities following organic carbon additionhas also been observed in other studies (Burkert et al.,2003). Further investigation into the ecophysiology of indi-vidual freshwater taxa is required to thoroughly test thesehypotheses.
Conclusion
Previous multiyear observations of planktonic populationdynamics in this humic lake generated hypotheses about
Fig. 7. Mean normalized fluorescence of ARISA peaks assigned to the indicated clades is shown for each treatment group described in Table 3 7 days after manipulation of the phytoplankton community diversity and biomass. Letters indicate significant differences between mean values following pairwise comparisons with Bonferroni corrections (α = 0.05/3).
depleted phytoplanktonreduced phytoplanktonambient phytoplankton
rela
tive
AR
ISA
sig
nal s
tren
gth
bacterial population
0
0.05
0.1
0.15
0.2
0.25
0.3
0.35
0.4
0.45
Alpha IV CB_Ba2 acl-B Beta II CB_Ga1 CB_Fi1 CB_De1 CFI
a
b b ab b
a
b
b
a
b
c
a
b
a
a
b b
a ab
a ab

1456 A. D. Kent et al.
© 2006 The AuthorsJournal compilation © 2006 Society for Applied Microbiology and Blackwell Publishing Ltd, Environmental Microbiology, 8, 1448–1459
the interactions among these populations and the impactsuch interactions have on BCC (Kent et al., 2004). Thepresent study demonstrated that the ‘top-down’ interac-tions between the heterotrophic and mixotrophic flagel-lates and the bacterial populations are important forstructuring BCC in this lake in the early summer. Intensebacterivory may temporarily eclipse the effects ofresource-mediated controls on BCC, a hypothesis sup-ported by the synchronous dynamics of bacterioplanktonand phytoplankton populations throughout the rest of theice-free season (Fig. 1). We propose that these trophicinteractions represent a hierarchy of factors impactingBCC. As microbial communities underpin ecosystemfunction in aquatic environments, it is critical to under-stand the factors that influence these communities.
Experimental procedures
Study sites and sample collection
Crystal Bog Lake is a shallow humic lake located in northernWisconsin, USA (89°36′22.5′′W, 46°00′26.8′′N). This lakehas a surface area of 0.5 ha, a maximum depth of 2.5 m, andis surrounded by an extensive Sphagnum mat. Sample col-lection procedures were described previously (Kent et al.,2004). Physical and chemical limnological characteristics ofthe lake water during the study period are available on theNorth Temperate Lakes Long-term Ecological Research web-site: http://lter.limnology.wisc.edu
Mesocosm experiments
Lake water for the 7-day grazer manipulation experiment wascollected on May 24, 2002 during a peak in flagellate popu-lations (Kent et al., 2004). The phytoplankton manipulationexperiment began on August 9, 2002 during the peak of anintense dinoflagellate bloom (Kent et al., 2004). For eachexperiment, manipulated planktonic communities wereassembled in 10-l low-density polyethylene, square carboys(I-Chem). Water 150 l for these mesocosms was passedthrough a 243-µm mesh. This filtration served to remove onlythe largest of the macrozooplankton (mostly the largestDaphnia), which have been shown to have disproportionatelylarge impacts on microbial food webs in such containerexperiments (Jürgens and Jeppesen, 2000). The complexityof the microbial food web following this filtration step wassimilar to that in the lake, especially during the phytoplanktonmanipulation experiment, during which no large zooplanktonpopulations were present (Kent et al., 2004). From this water,
40 l was filtered through a 10-µm mesh to remove remainingzooplankton and large phytoplankton populations. Another40-l aliquot was filtered through a 1-µm in-line filter capsule(Whatman Polycap) to remove flagellate and smaller phy-toplankton populations. Population manipulations are sum-marized in Table 3. Filtered water (6.2 l) from each sizefraction (< 243 µm, <10 µm and <1 µm) was dispensed to sixreplicate mesocosms. In order to eliminate the effects ofnutrient limitation in these experiments, three replicates foreach size fraction received inorganic N and P additions. Forthe grazer manipulation experiment, the final concentrationsof soluble reactive P (SRP) and NH4
+ were 5.8 ± 0.1 µg l−1
SRP and 375 ± 24 µg l−1 NH4+ (approximately twice the ambi-
ent N and P concentration). For the phytoplankton manipula-tion experiment, the final nutrient concentrations were6.1 ± 2.3 µg l−1 SRP and 267 ± 55 µg l−1 NH4
+ (a 3.6- and 1.6-fold increase over the ambient N and P concentration respec-tively). The mesocosms were attached to a floating frame andincubated in situ. Aliquots of 1.5 l were removed from eachmesocosm on day 3 and day 7 after mixing the containercontents. Previous studies suggested that BCC changes ona time scale of a few days in this system (Fisher et al., 2000;Kent et al., 2004). Water from each aliquot was passedthrough a 70-µm mesh to recover zooplankton populationswhich were subsequently preserved in 80% ethanol. Bacte-rial, flagellate and phytoplankton samples were preserved foranalysis as described previously (Kent et al., 2004).
Planktonic community composition
Abundance of bacteria, phytoplankton, zooplankton and HNF.To determine bacterial abundance, cells were stained with 4′,6′-diamidino-2-phenylindole (DAPI) and counted on black0.2-µm PCTE filters using epifluorescence microscopy (Por-ter and Feig, 1980), as described previously (Kent et al.,2004). In addition to total abundance, filamentous bacteriawere counted. Filamentous bacteria are defined here aselongated single cells > 5 µm in length; colonies of cellsarranged end-to-end were not observed in these samples.Bacteria thus classified are presumed to be less accessibleto flagellate grazing (Pernthaler et al., 1996).
Phytoplankton biovolume and abundance and zooplanktonpopulations were identified and enumerated as describedpreviously (Kent et al., 2004). Heterotrophic nanoflagellateswere visualized with DAPI and enumerated as describedpreviously (Kent et al., 2004).
Bacterioplankton community analysis
Bacterioplankton community composition and diversity wasassessed using ARISA (Fisher and Triplett, 1999), as
Table 3. Planktonic population manipulations in two mesocosm experiments.
Size fraction Grazer-manipulation experiment Phytoplankton removal experiment
< 1 µm grazer-free depleted phytoplankton levels< 10 µm grazer-enhanced reduced phytoplankton levels< 243 µm grazer-enhanced ambient (high) phytoplankton levelsLake (control) ambient grazer levels ambient (high) phytoplankton levels

Biological drivers of bacterial community structure 1457
© 2006 The AuthorsJournal compilation © 2006 Society for Applied Microbiology and Blackwell Publishing Ltd, Environmental Microbiology, 8, 1448–1459
described previously (Kent et al., 2004; Yannarell and Triplett,2005). To include the maximum number of peaks whileexcluding background fluorescence, a threshold of 100 fluo-rescence units was used. The signal strength (i.e. peak area)of each peak was normalized to account for run-to-run vari-ations in signal detection by dividing the area of individualpeaks by the total fluorescence (area) detected in each pro-file, expressing each peak as a proportion of the observedcommunity (Rees et al., 2004; Yannarell and Triplett, 2005).
Bacterioplankton population analysis
Clone libraries and clone ARISA. To evaluate the impact ofthe food web manipulations on individual taxa, the normal-ized fluorescence of individual ARISA fragments wascompared between treatments. Taxonomic assignments forindividual ARISA peaks were determined using polymerasechain reaction-based clone libraries containing the 16S andintergenic transcribed spacer (ITS) region of rrn operonsamplified from Crystal Bog bacterioplankton communities(Brown et al., 2005; Jacob et al., 2005; Newton et al., 2006).Details of phylogenetic assignments for microbial communi-ties in this lake are described elsewhere (Newton et al.,2006).
Data analysis
Comparisons of community composition. For each ARISAdataset, the Bray-Curtis similarity coefficient (S17 = 1 − D14 ofLegendre and Legendre, 1998) was calculated to assess thedegree of similarity between ARISA profiles obtained fromdifferent samples. A similarity matrix containing these com-parisons was generated for all possible pairs of samples ineach experiment. This matrix was used to generate non-MDSplots. This ordination results in a visual representation of BCCsimilarity between treatments (Yannarell et al., 2003; Reeset al., 2004).
Analysis of similarity, as described by Clarke and Green(Clarke and Green, 1988; Clarke, 1993), was used previouslyto distinguish bacterial communities in lake (Yannarell et al.,2003; Yannarell and Triplett, 2004) and sediment (Rees et al.,2004) samples and to determine the annual differences inBCC within a lake (Kent et al., 2004). In the current study,bacterial and phytoplankton communities were classified bytreatment or grouped by sample date, and ANOSIM was usedto test the hypothesis that communities from the same groupwere more similar to each other than to communities in dif-ferent groups. ANOSIM generates a test statistic, R, with avalue between −1 and 1. The magnitude of R indicates thedegree of separation between groups of samples, with ascore of 1 indicating complete separation and 0 indicating noseparation. Monte-Carlo randomization of group labels wasused to generate the null distribution of R in order to test thehypothesis that within-group similarities were higher thanwould be expected from random grouping of samples.
To determine the relationship between BCC and PCC, anon-parametric form of the Mantel test (Legendre and Leg-endre, 1998) was used. Matrices containing the similaritycoefficients for pairwise comparisons of phytoplankton or
BCC between each sample were compared using the Spear-man rank correlation coefficient (ρ). The production of thesimilarity matrices, calculation of Spearman’s ρ, and the ANO-
SIM described above were all performed using the softwarepackage PRIMER 5 for Windows v. 5.2.7 (PRIMER-E, 2001;routines SIMILARITY, RELATE and ANOSIM).
Population-level response to manipulations
The significance of changes in normalized ARISA peak fluo-rescence for each clade was tested by ANOVA between treat-ment groups defined in Table 3. Only ARISA peaks that couldbe assigned to a single clade (Table 1) were considered forthe analysis of populations responding to the experimentalmanipulation. The Bonferroni correction for multiple testingwas applied for significance tests between each treatmentgroup.
Acknowledgements
The authors wish to thank Anthony Yannarell and Eric Triplettfor helpful discussions and comments on this manuscript.The authors are also grateful to James Thoyre for waterchemistry analyses, Kira Novakofski, Lindsay Roberts, Jen-nifer Epstein and Ashley Shade for assistance with enumer-ation of bacteria and nanoflagellates, and to the staff of UW-Madison Trout Lake Research Station for logistical support.This research was supported in part by National ScienceFoundation Grant MCB-9977903 to Eric Triplett and by fund-ing supplied by the UW-Madison Graduate School to K.D.M.
References
Arrieta, J., and Herndl, G. (2002) Changes in bacterial β-glucosidase diversity during a coastal phytoplanktonbloom. Limnol Oceanogr 47: 594–599.
Azam, F., Fenchel, T., Field, J.G., Gray, J.S., Meyerreil, L.A.,and Thingstad, F. (1983) The ecological role of water-column microbes in the sea. Mar Ecol Prog Ser 10: 257–263.
Boenigk, J., Stadler, P., Wiedlroither, A., and Hahn, M.W.(2004) Strain-specific differences in the grazing sensitivi-ties of closely related ultramicrobacteria affiliated with thePolynucleobacter cluster. Appl Environ Microbiol 70: 5787–5793.
Brown, M.V., Schwalbach, M.S., Hewson, I., and Fuhrman,J.A. (2005) Coupling 16S-ITS rDNA clone libraries andautomated ribosomal intergenic spacer analysis to showmarine microbial diversity: development and application toa time series. Environ Microbiol 7: 1466–1479.
Burkert, U., Warnecke, F., Babenzien, D., Zwirnmann, E.,and Pernthaler, J. (2003) Members of a readily enrichedbeta-proteobacterial clade are common in surface watersof a humic lake. Appl Environ Microbiol 69: 6550–6559.
Clarke, K.R. (1993) Non-parametric multivariate analyses ofchanges in community structure. Aust J Ecol 18: 117–143.
Clarke, K.R., and Green, R.H. (1988) Statistical design andanalysis for a ‘biological effects’ study. Mar Ecol Prog Ser46: 213–226.

1458 A. D. Kent et al.
© 2006 The AuthorsJournal compilation © 2006 Society for Applied Microbiology and Blackwell Publishing Ltd, Environmental Microbiology, 8, 1448–1459
Cole, J.J. (1982) Interactions between bacteria and algae inaquatic ecosystems. Ann Rev Ecol Syst 13: 291–314.
Crump, B.C., Kling, G.W., Bahr, M., and Hobbie, J.E. (2003)Bacterioplankton community shifts in an arctic lake corre-late with seasonal changes in organic matter source. ApplEnviron Microbiol 69: 2253–2268.
Fisher, M.M., and Triplett, E.W. (1999) Automated approachfor ribosomal intergenic spacer analysis of microbial diver-sity and its application to freshwater bacterial communities.Appl Environ Microbiol 65: 4630–4636.
Fisher, M.M., Klug, J.L., Lauster, G., Newton, M., and Triplett,E.W. (2000) Effects of resources and trophic interactionson freshwater bacterioplankton diversity. Microb Ecol 40:125–138.
Glockner, F.O., Zaichikov, E., Belkova, N., Denissova, L.,Pernthaler, J., Pernthaler, A., and Amann, R. (2000) Com-parative 16S rRNA analysis of lake bacterioplanktonreveals globally distributed phylogenetic clusters includingan abundant group of actinobacteria. Appl Environ Micro-biol 66: 5053–5065.
Graham, J.M., Kent, A.D., Lauster, G.H., Yannarell, A.C.,Graham, L.E., Kratz, T.K., and Triplett, E.W. (2004) Sea-sonal dynamics of phytoplankton and protoplankton com-munities in a northern temperate humic lake: diversity in adinoflagellate dominated system. Microb Ecol 48: 528–540.
Hahn, M.W., and Höfle, M.G. (2001) Grazing of protozoa andits effect on populations of aquatic bacteria. FEMS Micro-biol Ecol 35: 113–121.
van Hannen, E.J., Mooij, W., van Agterveld, M.P., Gons, H.J.,and Laanbroek, H.J. (1999a) Detritus-dependent develop-ment of the microbial community in an experimental sys-tem: qualitative analysis by denaturing gradient gelelectrophoresis. Appl Environ Microbiol 65: 2478–2484.
van Hannen, E.J., Veninga, M., Bloem, J., Gons, H.J., andLaanbroek, H.J. (1999b) Genetic changes in the bacterialcommunity structure associated with protistan grazers.Arch Hydrobiol 145: 25–38.
Jacob, C., Kent, A.D., Benson, B.J., Newton, R.J., andMcMahon, K.D. (2005) Biological databases for linkinglarge microbial and environmental datasets. In Proceed-ings of the 9th World Multiconference on Systematics,Cybernetics and Informatics, Orlando, FL, USA.
Jürgens, K., and Jeppesen, E. (2000) The impact of meta-zooplankton on the structure of the microbial food web ina shallow, hypertrophic lake. J Plankton Res 22: 1047–1070.
Jürgens, K., and Sala, M.M. (2000) Predation-mediated shiftsin size distribution of microbial biomass and activity duringdetritus decomposition. Oikos 91: 29–40.
Jürgens, K., Pernthaler, J., Schalla, S., and Amann, R. (1999)Morphological and compositional changes in a planktonicbacterial community in response to enhanced protozoangrazing. Appl Environ Microbiol 65: 1241–1250.
Kent, A.D., Jones, S.E., Yannarell, A.C., Lauster, G.H., Gra-ham, J.H., Kratz, T.K., and Triplett, E.W. (2004) Annualpatterns in bacterioplankton community variability in ahumic lake. Microb Ecol 48: 550–560.
Kirchman, D.L., Suzuki, Y., Garside, C., and Ducklow, H.W.(1991) High turnover rates of dissolved organic carbonduring a spring phytoplankton bloom. Nature 352: 612–614.
Kritzberg, E.S., Cole, J.J., Pace, M.L., Granéli, W., and Bade,D.L. (2004) Autochthonous versus allochthonous carbonsources of bacteria: results from whole-lake 13C additionexperiments. Limnol Oceanogr 49: 588–596.
Langenheder, S., and Jürgens, K. (2001) Regulation of bac-terial biomass and community structure by metazoan andprotozoan predation. Limnol Oceanogr 46: 121–134.
Legendre, P., and Legendre, L. (1998) Numerical Ecology,2nd edn. Amsterdam, the Netherlands: Elsevier Science,BV.
Newton, R.J., Kent, A.D., Triplett, E.W., and McMahon, K.D.(2006) Microbial community dynamics in a humic lake:differential persistence of common freshwater phylotypes.Environ Microbiol 8: 956–970.
Pernthaler, J., Sattler, B., Simek, K., Schwarzenbacher, A.,and Psenner, R. (1996) Top-down effects on the size-biomass distribution of a freshwater bacterioplankton com-munity. Aquat Microb Ecol 10: 255–263.
Pernthaler, J., Posch, T., Simek, K., Vrba, J., Amann, R., andPsenner, R. (1997) Contrasting bacterial strategies tocoexist with a flagellate predator in an experimental micro-bial assemblage. Appl Environ Microbiol 63: 596–601.
Pernthaler, J., Posch, T., Simek, K., Vrba, J., Pernthaler, A.,Glockner, F.O., et al. (2001) Predator-specific enrichmentof actinobacteria from a cosmopolitan freshwater clade inmixed continuous culture. Appl Environ Microbiol 67:2145–2155.
Pernthaler, J., Zollner, E., Warnecke, F., and Jurgens, K.(2004) Bloom of filamentous bacteria in a mesotrophiclake: identity and potential controlling mechanism. ApplEnviron Microbiol 70: 6272–6281.
Pinhassi, J., and Hagström, A. (2000) Seasonal successionin marine bacterioplankton. Aquat Microb Ecol 21: 245–256.
Pinhassi, J., Sala, M.M., Havskum, H., Peters, F., Guadayol,O., Malits, A., and Marrase, C. (2004) Changes in bacte-rioplankton composition under different phytoplankton reg-imens. Appl Environ Microbiol 70: 6753–6766.
Porter, K., and Feig, Y. (1980) The use of DAPI for identifyingand counting aquatic microflora. Limnol Oceanogr 25:943–948.
Rees, G.N., Baldwin, D.S., Watson, G.O., Perryman, S., andNielsen, D.L. (2004) Ordination and significance testing ofmicrobial community composition derived from terminalrestriction fragment length polymorphisms: application ofmultivariate statistics. Anton Leeuw Int J G 86: 339–347.
Sachse, A., Babenzien, D., Ginzel, G., Gelbrecht, J., andSteinberg, C.E.W. (2001) Characterization of dissolvedorganic carbon (DOC) in a dystrophic lake and an adjacentfen. Biogeochemistry 54: 279–296.
Warnecke, F., Amann, R., and Pernthaler, J. (2004) Actino-bacterial 16S rRNA genes from freshwater habitats clusterin four distinct lineages. Environ Microbiol 6: 242–253.
White, P.A., Kalff, J., Rasmussen, J.B., and Gasol, J.M.(1991) The effect of temperature and algal biomass onbacterial production and specific growth rate in freshwaterand marine habitats. Microb Ecol 21: 99–115.
Wu, Q.L., Boenigk, J., and Hahn, M.W. (2004) Successfulpredation of filamentous bacteria by a nanoflagellate chal-lenges current models of flagellate bacterivory. Appl Envi-ron Microbiol 70: 332–339.

Biological drivers of bacterial community structure 1459
© 2006 The AuthorsJournal compilation © 2006 Society for Applied Microbiology and Blackwell Publishing Ltd, Environmental Microbiology, 8, 1448–1459
Yannarell, A.C., and Triplett, E.W. (2004) Within- andbetween-lake variability in the composition of bacteri-oplankton communities: investigations at multiple spatialscales. Appl Environ Microbiol 70: 214–223.
Yannarell, A.C., and Triplett, E.W. (2005) Geographic andenvironmental sources of variation in lake bacterial com-munity composition. Appl Environ Microbiol 71: 227–239.
Yannarell, A.C., Kent, A.D., Lauster, G.H., Kratz, T.K., andTriplett, E.W. (2003) Temporal patterns in bacterial com-munities in three temperate lakes of different trophic status.Microb Ecol 46: 391–405.
Zwart, G., Crump, B.C., Agterveld, M.P.K.V., Hagen, F., andHan, S.K. (2002) Typical freshwater bacteria: an analysisof available 16S rRNA gene sequences from plankton oflakes and rivers. Aquat Microb Ecol 28: 141–155.
Related Documents